Page 1
o.v-o
MC D
ABNO .
N 0F'EFECTIELECTRO
0.1
....
f...
wSW
BNM
_
em
w.mS
I.
PIN
O,
t!
.
tlQlV-II'..|I.
s.
[m1
TIM
u‘.
O;
02’.
v...,;. «v.
..
..Z
.;
t
Ir
.‘
.r
.o.
..
.I.
...
...
.
yI
.A.
it...
'
..
.1
.
v.
.3a...
.
Ia
nI!
‘
..
.n
aI:
a
..
.
ol
v-
I,I
p
a.1
.
Va
.y
.
....
:0-‘f.
I
.4
..
'.
.I
..
I
t.l
no
l
..
.
..o
..
.ou
I.
I.
II
I-
I"
..Q...
...
;oV.
.1..I».’I
-.
Pu
yr
Page 2
LIBRARY
Migug State
Univ sity
amoma BY V
HUAB & SONS'Bunxamnm mr . .-
nnnnnn
Page 3
ABSTRACT
ELECTRONIC DETECTION OF ABNORMAL MILK
By
Manley C. Pratt
Milk conductivity was measured using an in-line
electrodeless conductivity cell. Overall correlation
analysis revealed a positive correlation (p < 0.01) between
conductivity and somatic cell numbers (r = 0.25). Milk
conductivity was also significantly correlated (p < 0.01)
with milk constituents including sodium (r = 0.60), potassium
(r = -O.28) and lactose (r = —0.56). These constituents
were markedly influenced by lactation variables. Milk
sodium concentration (mg/100 ml) increased linearly (p <0.01)
from 43.3 for two year olds to 62.5 for cows older than six
years. In contrast, milk potassium (mg/100 ml) and lactose
(%) decreased linearly (p < 0.01) from 146.2 and 5.0 for
two year old cows to 136.0 and 4.6 for cows greater than
six years, respectively. Milk yield markedly influenced
sodium, potassium and lactose concentration. Sodium concen-
tration (mg/100 ml) decreased with increasing milk production
from 81.2 for yields less than 10 lbs to 51.8 for yields
greater than 30 lbs. Conversely, milk lactose and potassium
concentration increased linearly (p < 0.01) with increased
Page 4
Manley C. Pratt
milk yield. It is concluded that changes in milk consti-
tuents due to physiological factors influenced milk con-
ductivity more markedly than those associated with inflam-
mation. As a result, the relationship of conductivity to
milk somatic cells is too low to be useful in detection of
abnormal milk.
Page 5
ELECTRONIC DETECTION OF ABNORMAL MILK
By
Manley C. Pratt
A THESIS
Submitted to
Michigan State University
in partial fulfillment of the requirements
for the degree of
MASTER OF SCIENCE
Department of Dairy Science
1972
Page 6
ACKNOWLEDGMENTS
The author wishes to thank Dr. C. A. Lassiter of the
Dairy Science Department for providing financial assistance
through a Graduate Research Assistantship during the course
of his studies. To Drs. H. A. Tucker, H. D. Hafs and
W. G. Bickert, he wishes to express his gratitude for their
advice and assistance. Most sincere appreciation is
extended to his advisor Dr. E. M. Convey for his patience,
guidance and encouragement throughout the course of his
studies, and in the preparation of this thesis.
Special thanks is extended to Mrs. Cheryl Smith for
her assistance in the preparation of this manuscript.
Finally, the interest, understanding and encouragement
of his wife Novelette is deeply appreciated.
ii
Page 7
TABLE OF CONTENTS
Page
LIST OF TABLES . . . . . . . . . . . . . . . . . . . . v
LIST OF FIGURES . .-. . . . . . . . . . . . . . . . . vi
LIST OF APPENDICES . . . . . . . . . . . . . . . . . . vii
INTRODUCTION . . . . . . . . . . . . . . . . . . . . . 1
REVIEW OF LITERATURE . . . . . . . . . . . . . . . . . 3
I. Electrical Conductivity of Milk 3
11. Normal Composition of Milk . . 7
1. Mineral Constituents . . . . . . . . . 8
a. Sodium . . . . . . . . . . . . . . . 9
b. Potassium . . . . . . . . . . . . . . 10
2. Lactose . . . . 11
III. Udder Inflammation and Its Influence on Milk
Composition . . . . . . . . . . . . . . . . 12
1. General . . . . . . 12
2. Effect of Udder Inflammation on: . . . . 14
3. Sodium and Potassium Content . . . . 14
b. Lactose . . . . . . . . . . . 15
c. Milk Somatic Cells . . . . . 16
IV. Other Factors Affecting Milk Composition . . 18
1. Age and Lactation Number . . . . . . . . l8
2. Stage of Lactation . . . . . . . . . . . 19
MATERIALS AND METHODS . . . . . . . . . . . . . . . . 21
l. Conductivity Cell . . . . . . . . . . . . 21
2. Methodology . . . . . . . . 23
a. Sodium and Potassium Analysis . . . . 23
b. Lactose Analysis . . . . . 24
c. Direct Microscopic Somatic Cell
Count Procedure . . . . . . . . . . 26
3. Experimental Procedure . . . . . . . . . 27
iii
Page 8
RESULTS . .
NH
00
TABLE OF CONTENTS (Cont'd)
General . . . . . . . . . . . . .
Influence of Individual Lactation
Variables on Milk Constituents and
Conductivity
a. Age . . . . . .
b. Lactation Number
c. Stage of Lactation
d. Milk Yield
GENERAL DISCUSSION . . . . .
SUMMARY AND CONCLUSION
BIBLIOGRAPHY
APPENDICES
o . q
iv
Page
29
29
34
34
34
37
37
41
47
49
57
Page 9
Table
LIST OF TABLES
Working Solutions for Standard Sodium and
Potassium Curves . . . . . . . . . . .
Correlations between Lactation Variables and
Milk Constituents or Conductivity
Correlations between Milk Constituents and
Conductivity . . . . . . . . . .
Mean Sodium, Potassium, Lactose and Conduc-
tivity Values of Normal and Abnormal Milk
Milk Sodium, Potassium, Lactose and Somatic
Cell Concentration and Electrical Conduc-
tivity--Effect of Age
Milk Sodium, Potassium, Lactose and Somatic
Cell Concentrations, and Electrical Conduc-
tivity--Effect of Lactation Number . .
Milk Sodium, Potassium, Lactose and Somatic
Cell Concentration and Electrical Conduc—
tivity--Effect of Stage of Lactation
Milk Sodium, Potassium, Lactose and Somatic
Cell Concentration and Electrical Conduc-
tivity-~Effect of Milk Yield .
Page
25
30
31
33
35
36
38
39
Page 10
LIST OF FIGURES
Figure Page
1. An In-line Electrodeless Conductivity Cell . . . . 22
vi
Page 11
LIST OF APPENDICES
Appendix Page
1. Tungstic Acid Reagent used for Precipita-
tion of Protein and Fat in Lactose
Analysis . . . . . . . . . . . . . . . . . 57
2. A. Newman's Stain for Milk Smears . . . . . 58
B. Staining Procedure . . . . . . . . . . . 58
vii
Page 12
INTRODUCTION
Inflammation of the mammary gland is commonly referred
to as mastitis, a term derived from the Greek work ”mastos"
meaning breast and the suffix "itis" meaning inflammation of.
Despite five decades of active research, mastitis con-
tinues to be a major problem to the dairy industry. Esti-
mated annual losses due to mastitis range up to five million
dollars in the United States (National Mastitis Council
Inc., 1965).
Mastitis has been difficult to eradicate for many
reasons, foremost among these are the numerous causative
agents as well as a variety of predisposing factors. Pre-
requisite to the control of any disease is the availability
of accurate, dependable and economical methods of detection.
There are a number of tests for mastitis referred to as
screening tests. Most of these are based either directly
or indirectly on the somatic cell content of milk. Somatic
cells increase in milk during udder inflammation and con-
stitute one part of the animal's natural defense mechanism
for combatting diseases. Other changes in milk that occur
concurrently with udder inflammation are increased albumin,
globulin, sodium, chloride and decreased lactose, potassium,
magnesium, calcium and phosphates. Increase in sodium and
Page 13
2
chloride results from the tendency of the mammary gland to
maintain isotonicity with the blood regardless of the state
of lactose synthesis. When lactose synthesis is impaired as
is common in mastitis, the osmotic deficiency is compensated
by increases in sodium and chloride (Webb and Johnson,
1965).
At least two basic laboratory tests for inflammation
have been developed utilizing increased milk chloride. One
test is based upon determination of chloride content by
titration of milk, while the second method is based on the
chloride to lactose ratio. This latter method is known as
the ”Kuestler Test," which provides a chloride-lactose
number that can be compared to normal values. Several
investigators have attempted to measure the change in milk
electrolyte concentration by electrical conductivity. This
would provide a quick and convenient method for the early
detection of udder inflammation. However, such problems as
electrode polarization, temperature variation and accumula—
tion of milk on electrodes have obscured the results of
such attempts.
The purpose of this study was to investigate the
possibility of developing a screening test for mastitis
based on electrical conductivity of milk using an electrode-
less conductivity cell.
Page 14
REVIEW OF LITERATURE
I. Electrical Conductivity of Milk
Electrical conductivity is a physical property of milk.
A solution containing electrolytes (i.e., acids, bases and
salts) exhibits electrical resistance, which is measured in
terms of a specific resistance defined as the resistance in
ohms offered by one cubic centimeter of a substance to the
passage of electricity, the current being perpendicular to
two parallel faces. The reciprocal of the specific resis-
tance is the specific conductance or conductivity expressed
as ohms"1 cm.1 or mhos/cm. In a solution containing only
electrolytes, conductivity is a function of ionic concen—
tration. However, in heterogenous solutions such as milk
the dispersed fat and colloidal substances decrease con-
ductivity by obstructing migration of ions.
Cows with normal udders will secrete milk with nearly
identical conductivities usually ranging from 45 to 48 x 10.4
mho, while cows with inflamed udders secrete milk with
higher conductivities (Webb and Johnson, 1965). The fore-
going observation together with results of individual in-
vestigations have led a number of investigators to advocate
the use of electrical conductivity as a potential screening
Page 15
4
test for mastitis. Foremost among these are Davis gt a1.
(1943), Malcolm gt 31. (1942), McCulloch (1940), Krenn
(1932) and Shulz (1956). Malcolm gt El' (1942) noted the
electrical conductivity of milk varies with stage of lacta-
tion, therefore, factors such as calving date and daily
milk yield should be considered in using electrical con-
ductivity for diagnostic purposes. Davis (1947) suggested
the difference in conductivity between the four quarter
samples of individual cows could be used successfully as an
indicator of inflammation. But Jones (1949) evaluated the
same method and failed to find good agreement between con-
ductivity and direct somatic cell counts, the usual indi-
cator of udder inflammation. However, his milk samples were
stored at room temperature for 24 to 28 hours before
analysis, which according to Verma (1950) can significantly
influence ionic equilibrium, and hence, electrical conduc-
tivity. Other investigators (Little 35 31., 1968; and
Postle and Blobel, 1965) have failed to recommend electrical
conductivity as a screening test for mastitis, mainly
because of its low correlation with direct microscopic
cell counts. Little 3: 31. (1968) found a correlation of
0.40 between the conductivity of quarter milk samples and
direct microscopic cell count, while Postle and Blobel
(1965) obtained a correlation coefficient of 0.24 between
conductivity of bulk milk samples and direct microscopic
cell count. Both groups of investigators recognized
Page 16
5
electrical conductivity as a quick, objective and repeatable
test for mastitis, but Little et a1. (1968) contended that
although there is an increase in chloride content and
therefore increased conductivity during the inflammatory
reaction, there would appear to be no base—line upon which
to judge such changes.
Costle and Shelburn (1919) attribute 50 to 80% of the
conductivity of milk to its chloride ion content. Similarly,
Montefredine (1942) reported that only the chloride content
of milk was correlated with its electrical conductivity.
Other workers (Jackson and Rothera, 1914) demonstrated a
reciprocal relationship between electric conductivity and
percentage milk lactose, but only within stage of lactation.
Pickerton and Peters (1958) observed an inverse relationship
between conductivity and milk lactose, however, Barry and
Rowland (1953) suggests this relationship results from the
inverse relationship between lactose and chloride content.
Pickerton and Peters (1958) also found electrical conduc-
tivity at 37°C to range between 5.04 and 5.63 millimhos
per centimeter (m. mhos/cm) for normal milk, and 5.95 to
6.86 m. mhos/cm for milk from inflamed quarters. Shulz
and Sydow (1957) reported wide variations for conductivity
of milk free of chloride ions, but did not report the cause
of such variations.
Most of the early work on milk conductivity has been
summarized in reviews by Gerber (1926), and Shulz (1956).
Early investigators were mainly interested in developing a
Page 17
6
rapid test for adulterated milk, but also noted the poten-
tials for diagnosis of udder inflammation. The electrode
type of conductivity device has been used for most studies
on milk conductivity. This has been a primary limiting
factor in the use of electrical conductivity as a screening
test. The electrodes become contaminated with colloidal
materials during one measurement, resulting in reduced
accuracy of succeeding measurements. Prentice (1962)
described a method for cleaning the electrodes, but this is
far too complex a procedure for in-line measurements.
In recent years the dairy industry has been subjected
to increased demands in terms of efficiency of production.
This increased efficiency dictates the necessity to develop
a simple, efficient and economical method for early detection
and treatment of mastitis. With the advent of more sophis-
ticated electronic devices the electrodeless conductivity
cell has become available, and this has created renewed
interest in the use of electrical conductivity as a means
of achieving the above mentioned goals. An electrodeless
cell for measuring conductivity of fluids was described by
Fielden (1952), Gupta and Hills (1965) and Sperry (1965).
It was also used by McPhillips and Snow (1958) to follow
the acid production of steptococcus lactis in milk, and more
recently by Gerrish and Bickert (1970) in an automatic
milking machine detacher.
Page 18
7
11. Normal Composition of Milk
Milk is a characteristic secreation of the mammary
gland of all mammals. Because of its function namely,
nourishment of the young it is a complex that must supply
nutrients, minerals and vitamins in the proper form, kind
and amount (Henderson, 1971). Interest in the composition
of milk stems largely from its use as human food, since
the nutritive value of milk depends on its composition.
Jenness and Patton (1959) stated that prior to 1850, the
composition of milk was known only to the extent that it
contained fat, sugar, proteins and minerals. However,
numerous studies during the past century have revealed
the presence of a wide array of constituents within each
of these classes.
Milk from all mammalian species contains the same con-
stituents but in varying amounts (Henderson, 1971). An
average gross composition of normal cow's milk would be
as follows: water, 87%; fat, 3.9%; lactose, 4.9%; proteins,
3.5% and ash or minerals, 0.7% (Watt and Merrill, 1963).
Milk fat, lactose and some of the proteins (i.e., caseins,
B-lactoglobulin and o-lactalbumin) are characteristic of
milk and synthesized only in the mammary gland (Jenness
and Patton, 1959).
Armstrong (1959) observed that although there is a
voluminous literature on the normal composition of milk,
Page 19
8
one is handicapped in attempting to analyse and integrate
the data due to a number of limiting factors namely:
(1) A paucity of detailed information especially
regarding mineral constituents.
(2) Testing methods: some information is from
laboratory research, presumably conducted under
controlled conditions, whereas other information
represents data gathered from herd testing
association records.
(3) Variations in preservation of samples prior to
analysis.
(4) Variation in analytical procedures.
In some cases the quantity of data appears to be suf-
ficient to establish meaningful averages for gross composi-
tion; whereas, in other cases, the data are lacking in
quantity and uniformity (Armstrong, 1959).
1. Mineral Constituents
The mineral constituents of milk are those constituents
which contain only inorganic elements in their ions (Allen,
1931). Schalm gt at. (1971) reported that calcium, phos-
phorus, potassium, sodium, sulfur, chlorine and magnesium
are the major mineral constituents in milk. Together with
the minor mineral constituents these minerals account for
0.6 to 0.8% of milk by weight (Henderson, 1971). The
secretory cells of the mammary gland cannot produce minerals,
therefore, all the minerals in milk are supplied by the
blood.
Although the minerals in milk are derived from the
blood, it is not known whether they are absorbed in proportion
Page 20
9
to their concentration in blood, or if mechanisms exist for
selective uptake. There is some evidence (Azimov et 31.,
1962; Knutsson, 1964a, 1964b, and Mackenzie and Lascelles,
1965b) that mammary epithelial cells can discharge minerals
into either blood or milk, suggesting the presence of an
active transport mechanism. No attempt will be made to
elaborate on all the mineral constitutents of milk in this
review. It is the author's intention to mention only those
constituents that are directly concerned with this study
namely, sodium and potassium.
a. Sodium
Sodium is one of the major mineral constituents of
milk. Together with lactose, potassium and chloride, it
maintains the osmotic equilibrium of milk (Rook and Wheelock,
1967). Jenness and Patton (1959) reported the sodium con-
centration of milk to be lower than that of the blood.
This difference in sodium concentration between blood and
milk was reported to be greatest at the beginning of lacta—
tion, but the difference narrows as the lactation period
advances (Barry and Rowland, 1953). Barthe and Dufilho
(1927) reported that the sodium concentration of milk of
healthy cows was never greater than 50 mg per 100 ml. But
in a later report they (Barthe and Dufilho, 1928) suggested
that the sodium content of cow's milk increased as the
lactation period advanced, indicating that higher values
might be realized. Comparing milk of 20 cows from the
Page 21
10
Shorthorn and Guernsey breeds Jones and Davies (1935) found
sodium concentration to range from 39.2 to 139.2 mg per
100 ml depending on stage of lactation. Macy gt gt.
(1953) reported a mean value of 58 mg per 100 ml for the
sodium concentration of normal cow's milk, while Jenness
and Patton (1959) reported a mean concentration of 50 mg
per 100 ml.
b. Potassium
Potassium is a physiologically important ion in the
soluble phase of normal milk. Like sodium, it is a major
mineral constituent which is involved in osmotic equilibrium
in milk (Rook and Wheelock, 1967). But unlike sodium its
concentration in milk is much higher than that in blood
(Barry and Rowland, 1953). Studies by Rook and Wood (1959)
indicated that healthy cows had the ability to produce milk
with a constant potassium concentration throughout the first
four to five months of lactation including the period of
transition from colostrum to normal milk when changes in
other constituents were large. However, significant varia-
tions between areas in the United States (Ward, 1963) and
areas within California (Nickerson, 1960) have been reported.
Barry and Rowland (1953) indicated that the potassium con-
centration of milk decreased to approach the concentration
of blood as lactation period advanced. This is especially
true during the last two months of lactation. In a study
of the mineral elements characteristic of the soluble phase
Page 22
11
of cow's milk, Barry and Rowland (1953) found that a nega—
tive linear relationship existed between potassium and
sodium and potassium and chloride, while a positive linear
relationship was found to exist between potassium and lactose.
Macy gt gt. (1953) reported a mean concentration of 141 mg
per 100 ml for the potassium content of normal cow's milk.
2. Lactose
The characteristic carbohydrate of normal milk is the
disaccharide, lactose, which is synthesized only in the
mammary gland. Lactose exists in two stereoisomeric forms,
i.e., alpha and beta. Each form is composed of one molecule
of D-glucose and one molecule of D—galactose. In cow's
milk as in all aqueous solutions both forms are present
with the equilibrium mixture consisting of 1 part alpha to
1.65 parts beta (Ling gt gt., 1961).
First records of lactose isolation date back to
Bartolettus (1633), who isolated it from whey. However,
it was Scheele (1780) who proved that lactose is a true
sugar, and listed it as a constituent of milk. Rook and
Wheelock (1967) reported that lactose accounted for a major
part of the osmotic pressure of milk, and increased lactose
concentration caused an influx of water and a decrease in
sodium and chloride concentration in milk. The secretion
of lactose is not constant throughout lactation. Unlike
milk fat and protein which tend to increase as lactation
Page 23
12
advances, lactose production decreases steadily throughout
lactation (Schalm gt gt., 1971). The lactose content of
normal cow's milk ranges from 4.4 to 5.2% accounting for
about 52% of the solids-not-fat content of milk (Nickerson,
1965).
III. Udder Inflammation and Its Influence
on Milk Composition
1. General
Inflammation is the final phase of a proposed three-
phase concept (i.e., invasion, infection and inflammation)
of udder infection (Murphy, 1947). Little gt gt. (1968)
reported that the effect of udder inflammation on the
composition of milk was dependent upon severity of the
inflammatory response. On the basis of severity, inflam-
mation may be classified as clinical inflammation character-
ized grossly by swelling, heat, redness, pain and impaired
function, or as subclinical which is the existence of
inflammation in the absence of overt clinical signs (Schalm
gt gt., 1971). Herd surveys, pathologic changes seen in
infected glands and results of transmission experiments
leave little doubt that bacterial infection is the primary
cause of udder inflammation. Predisposing factors such as
teat patency, age, chilling, feeding and hygiene are con-
sidered secondary factors because they contribute to udder
inflammation primarily by decreasing resistance to bacterial
Page 24
l3
infection or by causing development of clinical inflammation
in quarters harboring infectious organisms (Plastridge,
1958).
Udder inflammation may be caused by more than twenty
different types of pathogenic bacteria, plus rickettsia,
yeasts, fungi and viruses. However, of these microorganisms,
four gram-positive bacteria (i.e., streptococcus agalactiae,
streptococcus dysgalatiae, streptococcus uberis and staphy-
lococcus aureus) account for 97% of all udder infections
(Roberts, 1967). Plastridge (1958) observed that these
organisms usually caused chronic inflammation, with changes
in milk composition and loss of milk yield, with or without
appearance of clinical symptoms. Actually it is not the
bacteria per se, but rather their toxins that cause an
inflammatory response. The purpose of the inflammatory
response is to destroy or neutralize the irritant, repair
tissue and return the gland to its normal function (Schalm
gt gt., 1971).
Rook (1961) reported that inflammation of the mammary
gland modified milk composition by altering the permea-
bility of the udder tissue and by impairing the ability
of the secretory tissue to synthesize milk constituents.
Characteristic alteration in milk composition associated
with these changes are decreased lactose and potassium
content, with compensatory increase in sodium and chloride
(Barry and Rowland, 1953; MwuflrPetersen, 1938, McDowall,
Page 25
14
1945 and Wheelock gt gt., 1966). Also an increase in globu-
lin content, and to a lesser extent, increased serum albumin
and proteoses, and decreased casein content have been
reported (Rowland, 1938). Rook (1961) also observed that,
although changes in composition are generally more marked
when an inflamed quarter showed clinical symptoms of
disease (i.e., mastitis), attempts to relate their extent
to the degree and incidence of infection have not been
successful. This he claimed might be due to the numerous
organisms capable of attacking udder tissue, and because
the presence of pathogenic bacteria in milk is not neces-
sarily associated with extensive damage to udder tissue.
Laing and Malcolm (1956) and Van Rensburg (1947) have also
demonstrated that mammary gland inflammation could occur in
the absence of pathogenic bacteria in the milk or udder
tissue.
2. Effect of Udder Inflammation on:
a. Sodium and Potassium Content
Bitman gt gt. (1963) suggested that variations in
sodium and potassium content in milk indicated inflammatory
edema. McDowall (1945) observed an increased sodium chloride
content in milk from inflamed quarters. More recently
Barry and Rowland (1953) and Wheelock gt gt. (1966) reported
increased sodium and decreased potassium in milk from
inflamed udders. Barry and Rowland (1953) indicated that
the changes in these constituents in the inflamed udder
Page 26
15
were similar to changes observed during late lactation.
They hypothesized that the increased sodium and decreased
potassium are due to the mixing of milk secreted by the
mammary epithelial cells, with a diluent in which the
concentrations of these ions are approximately the same as
in blood serum. The observations of Davis (1933) and
Preskett and Folley (1933) in which they considered milk
of low solids-not~fat to be made up of a true milk fraction,
and a diluting fraction somewhat similar to a transudate
of lymph serum origin, lends credence to this hypothesis.
Rook (1967) reported changes in the sodium and potassium
concentration in milk from inflamed quarters almost invari—
ably occurred in association with reduction in milk volume.
He suggested that although sodium is present in increased
concentration, it is usually secreted in reduced amounts,
except for short periods after development of bacterial
infection (Wheelock, Rook, Neave and Dodd, 1966), in the
period following extended milking interval (Wheelock, Rook,
Dodd and Griffin, 1966) and after administration of oxy—
tocin (Wheelock gt gt., 1965d).
b- 92.2.32...
Numerous investigators (Barry and Rowland, 1953;
Munch-Petersen, 1938; McDowall, 1945; and Wheelock gt gt.,
1966) reported that there was a decreased lactose content
in milk from inflamed udders. Wheelock gt gt. (1966)
observed that the reduction in lactose concentration was
Page 27
16
closely related to the severity of the clinical symptoms
of inflammation. Since osmotic equilibrium between milk
and blood was maintained, Rook (1961) and Rook and Wheelock
(1967) suggested that the observed decrease in lactose
content in milk from inflamed udder quarters was compen-
satory to the increased sodium and chloride content of
such milk. This increase in sodium and chloride might be
due to decreased lactose synthesis by the injured epithe-
lial cells which would therefore require more sodium and
chloride to maintain osmotic equilibrium. The changes in
milk lactose concentration following udder inflammation
were similar to changes observed in late lactation (Barry
and Rowland, 1953), and also when milk was allowed to
accumulate in the mammary gland (Wheelock gt gt., 1965b
and Wheelock gt gt., 1966).
Some investigators (Wheelock gt gt., 1965b and
Wheelock gt gt., 1966) suggested that the reduction in
lactose concentration occurred as a result of resorption
into the blood and excretion in the urine, while Rook and
Wheelock (1967) claimed that it might occur both from
impairment of lactose synthesis and partial resorption.
c. Milk Somatic Cells
Inflammation is characterized by the accumulation of
neutrophilic leucocytes and humoral substances in the area
of injury. In udder inflammation these substances pass
into the milk (Schalm gt gt., 1971). A number of
Page 28
17
investigators (Anderson, 1946; Little, 1940; McLeod and
Anderson, 1952; McEwen and Cooper, 1947; Murphy, 1943 and
Murphy and Stuart, 1953), observed that milk from normal
quarters rarely contained more than 500,000 leucocytes per
ml, while the milk from inflamed quarters usually had
leucocytes in excess of this number.
Hughes (1954) showed that a high somatic cell count in
milk was associated with inflamed quarters. McFarlane
gt gt. (1949) and Chu (1949) concluded that high cell
counts were an indication of mastitis. Furthermore, it
has been demonstrated by many workers such as Branum and
Newbould (1961), Jensen (1957), Leidl and Schalm (1961),
Leidl gt gt. (1961) and Schalm (1959), that the California
Mastitis Test and the Milk Quality Test for udder inflamma-
tion are indirect measures of the concentration of leuco-
cytes in milk.
Blackburn and Macadam (1954) and Blackburn gt gt.
(1955) reported that there are two major types of cells in
milk; polymorphs, which provide an indication of the
extent of acute lobular inflammation, and epithelial cells
which reflect the extent of post inflammatory involution.
Waite and Blackburn (1957) suggested that for animals with
subclinical inflammation throughout the major part of their
lactation, there was an association between total cell
counts in milk and changes in milk composition. They con-
sidered that milk with a total cell count of less than
100,000 per ml, did not indicate subclinical mastitis.
Page 29
18
With cell count increasing to 500,000 per ml, they observed
a progressive reduction in solids-not-fat and lactose.
Macadam (1958) concluded that the proportion of granulo-
cytes usually exceeded 70% of the total cells in milk from
acutely inflamed quarters, whereas it was usually less than
40% during mammary involution. Likewise, Blackburn gt gt.
(1955) indicated that milk samples with a low total cell
count generally contained less than 45% granulocytes. They
suggested that differential cell count is a valuable cri—
terion to confirm conclusions drawn from results of total
cell counts, especially where doubts arise owing to the
presence of bacteria in milk.
IV. Other Factors Affecting Milk Composition
1. Age and Lactation Number
Under commercial conditions a progressive decrease in
the concentration of lactose and potassium, and an increase
in sodium with increasing lactation number have been
reported (Rensburg, 1947; Waite gt gt., 1956; Politiek,
1956; Vanschoubrock, 1963; and Vanschoubrock gt gt., 1964).
Rook and Campling (1965) reported that the major consti-
tuents of milk secreted during the period from the fifth to
the twenty-second week of lactation decreased with lactation
number. Decreased solids—not-fat due mainly to reduction
in lactose concentration up to the fifth lactation have
been reported (Bailey, 1952a; Waite gt gt., 1956; and
Wilcox gt gt., 1959).
Page 30
19
Rook and Wheelock (1967) indicated that the extent to
which these observed changes in milk composition are
directly attributable to age is uncertain. They suggested
that bacterial infection of the udder, the incidence of
which tends to increase with age might be expected to con-
tribute to these changes. Results from studies of Rook
and Campling (1965) in which the effects of udder infection
were almost completely excluded showed that changes in
lactose content for three animals from the first to the
third lactation were -0.09, i 0.00 and -0.08%. However,
O'Donvan gt gt. (1960) observed an average decrease of 0.1%
in solids-not-fat due mainly to decreased lactose concen-
tration, between consecutive infection free lactations.
This latter observation would seem to suggest that there
might be a specific effect related to age.
2. Stage of Lactation
The composition of cow's milk changes considerably
with the progress of lactation. The greatest changes are
reported to occur at the beginning, and at the end of the
lactation period (Jenness and Patten, 1959). Some of the
first recorded studies of milk composition (Richmond, 1899
and Crowther and Ruston, 1911) established that the lactose
content, although exceptionally low in colostrum, is at a
maximum early in lactation, and tends to decrease as the
lactation period progresses (Rook and Wheelock, 1967).
Rook and Campling (1965) reported that lactose content
Page 31
20
reached a maximum in forty-five days, decreased slowly
until about 165 days after calving, after which the decline
was more rapid. They also reported that the lactose content
of milk from cows in their first lactation decreased much
more slowly with advancing lactation than that of milk from
older cows.
Converse changes in the concentration of sodium were
reported by Richmond (1899). More recently, numerous
investigators (Azarme, 1938; Bonnier gt gt., 1946; Waite
gt gt., 1956 and Voigtlander, 1963) have confirmed the
general trends, and have demonstrated that changes in
potassium content generally follow those of lactose (Rook
and Campling, 1965).
Page 32
MATERIALS AND METHODS
1. Conductivity Cell
The electrodeless conductivity cell used to measure
the electrical conductivity of milk samples was a modifi-
cation of the Gupta and Hills device (1965) as modified by
Gerrish and Bickert (1970). It was used in conjunction
with: (l) 3 Signal Conditioner Model 300-D (Daytronic
Co., Dayton, Ohio) including an amplifier indicator with a
Type 71 differential transformer input module, modified
for use with the electrodeless conductivity cell and (2) a
Speedomax-G two pen Recorder (Leeds and Northrup, North
Wales, Pennsylvania).
The electrodeless conductivity cell (Figure 1) con-
sists of two transformers. The first transformer comprises
a thirty-four turn primary winding (labeled input), and a
single secondary turn of milk in a nonconducting tube.
This single turn of milk acts also as a one-turn primary
winding for a second transformer, which has a thirty-four
turn secondary winding (output). Both primary and secondary
windings are wound around a toroidal core of laminated
magnetic material such as might be found in current trans-
formers.
21
Page 33
22
MILK
IL
SUPERMALLOY
TOROIDS
‘)"dI
ACINPUT
OUTPUT
SIGNAL
Figure 1. An In-line Electrodeless Conductivity Cell.
Page 34
23
Supermalloy, an alloy with high magnetic permeability
at low magnetizing force, was used as the core material
for the second transformer.
When the flow rate of milk entering the milk loop is
greater than that which can pass through a 2.25 millimeter
orifice at the bottom of the milk loop, the milk loop fills
and excess milk is diverted through a by-pass tube. An
alternating input voltage will cause a small alternating
current to flow in the continuous loop of milk. If this
current is sufficient to provide a magnetizing current for
the second transformer core, an output signal will be
obtained. This output signal was amplified and transferred
to the recorder so that a measurement in terms of peak
height was obtainable. The electrical conductivity of each
milk sample was determined by measuring peak height and
converting to conductivity using a standard chart. This
chart was prepared by first determining the cell constant,
using a standard 0.05M sodium chloride solution, and then
drawing a calibration curve using a resistance substitution
box.
2. Methodology
a. Sodium and Potassium Analysis
Within 60 minutes of collecting daily milk samples,
duplicate 2 ml aliquots of each milk sample were placed in
16 ml polypropylene centrifuge tubes (Sorvall, Newtown,
Conn.). Eight ml of 20% Trichloroacetic acid (Mallinckrodt
Page 35
24
Chemical Works, St. Louis) was added to the contents of
each tube, mixed, allowed to stand for 10 minutes, after
which it was centrifuged at 6000 x g for 5 minutes.
Following centrifugation duplicate 1 ml aliquots of
the trichloroacetic acid supernatant were transferred into
15 ml Pyrex Brand tubes (Scientific Prod., Evanston, 111.)
containing 10 ml of deionized water and fitted with crew
caps. A water blank consisting of 10 ml of deionized water
was prepared daily. All samples were stored at 5C until
analysed by atomic flame emission spectrophotometry, using
a Jarrel-Ash Model 82-516 Spectrophotometer (Fisher Scientific
Co., Fairlawn, N.J.) equipped with Hecto total consumption
burner. The concentration of each substance was determined
by comparing the unknown measurement with standard quanti-
ties of sodium and potassium. Working solutions for
standard curves of 40, 30, 20, 15, 10 and 5 mg/liter for
sodium and 40, 30, 20 and 10 mg/liter for potassium were
made up from stock solutions (500 mg/liter) of sodium and
potassium as per Table l.
b. Lactose Analysis
Lactose analysis was carried out by modification of
the chloramine-T method of Hinton and Macara (1927).
Duplicate 2 ml quantities of each milk sample were added
to 50 ml polypropylene centrifuge tubes and the protein
and fat precipitated by the addition of 8 ml tungstic acid
Page 36
25
Table 1. Working Solutions for Standard Sodium and Potassium
Curves
Working Stock Deionized
Solution Solution 10% T.C.A. Water
(mg/litre) (ml) (ml) (ml)
40 8.0 6.82 85.18
30 6.0 6.82 87.18
20 4.0 6.82 89.18
15 3.0 6.82 90.18
10 2.0 6.82 91.18
5 1.0 6.82 92.18
Page 37
26
reagent (Appendix 1). Following precipitation, duplicate
10 m1 samples of the supernatant were pipetted into 125 ml
erylenmeyer flasks. To each flask 5 ml of potassium iodide
and 20 ml of N-chloro-p-toluenesulfanamide (Chloramine—T);
(Matheson, Coleman and Bell Inc., Norwood, Cincinnati) were
added, after which each flask was stoppered with parafilm
(American Can Co., Neenah, Wisconsin) and stored in the
dark for 1.5 hr at room temperature. A water blank con-
sisting of 10 m1 of double distilled water was carried
through the analysis as control. At the end of the specified
period 5 m1 of 1N hydrochloric acid was added to each flask
and the unreacted chloramine—T measured by titration of the
liberated iodide with 0.04N sodium thiosulfate using 1%
soluble starch as an indicator. The difference between
the chloramine-T in the blank solution and that remaining
in the sample analysed is equivalent to the lactose content
in the sample.
c. Direct Microsc0pic Somatic Cell Count Procedure
The technique of Direct Microscopic Somatic Cell Count
is recommended for estimation of the number of nucleated
somatic cells in milk samples. It is a modification of
the technique described by Prescott and Breed (1910).
Within 30 minutes of obtaining milk samples duplicate
smears were prepared for each milk sample by transferring
0.01 ml of milk to a precleaned microscope slide using a
10-lambda pipette. Between samples the pipette was washed
Page 38
27
in detergent, and rinsed in distilled water and acetone.
The 0.01 ml of milk was spread over a circular area of one
square centimeter, air-dried for 24 hr, and stained in
Newman's Stain (Appendix 2A) according to the procedure
outlined in Appendix 2B. Cover slips were mounted with the
aid of Permount (Fisher Scientific Co., Fairlawn, N.J.) and
then cleaned with Xylene (Merck and Co. Inc., Rahway, N.J.).
Microscopic counting of nucleated somatic cells was carried
out on a Leitz Ortholux compound microscope (E. Leitz
Inc., New York, N.Y.) using an oil-immersion objective of
54X magnification and 10X eyepiece. The unit area of the
milk film counted was a strip, the width of which was
defined by the distance between two parallel lines on a
special eyepiece reticle and the length being the diameter
of the milk film.~ Estimation of the cellular concentration
in a milk sample was based on the counts of two mutually
perpendicular strips on each of duplicate milk films.
3. Experimental Procedure
The study reported here involved electrical con-
ductivity measurements and collection of 295 milk samples
over a six month period. Samples were obtained from 94
Holstein cows of various ages and stages of lactation.
Prior to the start of the experiment the electrodeless
conductivity cell (Figure I) together with accompanying
electronics and Recorder were installed in a double eight
Herringbone milking parlor at the Michigan State University
Page 39
28
dairy barn. The conductivity cell was attached to a single
milking machine, and conductivity measurements were obtained
for quarter composite samples. Thereafter, milk in the con-
ductivity cell was collected via an orifice at the bottom
of the milk loop. The milk in the by-pass tube was allowed
to run out, and only milk coming from the milk loop was
collected. This method of sampling ensured that only milk
from which a conductivity measurement had been taken was
included in the sample.
Samples were collected in 150 ml glass bottles during
the first minute of milking. These samples were transported
to the laboratory soon after collection and were analysed
for lactose, sodium, potassium and total somatic cells.
Page 40
RESULTS
1. General
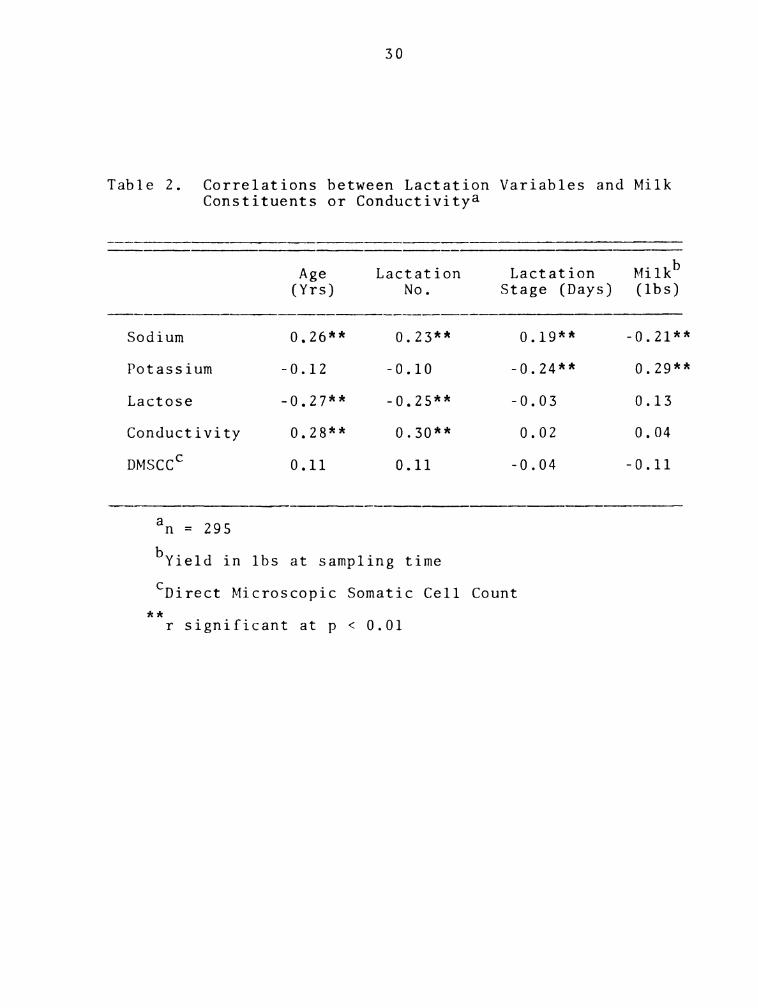
Overall correlation analysis for 295 milk samples
revealed that milk conductivity was positively correlated
(p < 0.01) with age and lactation number (Table 2).
Similarly, sodium concentration was correlated (p < 0.01)
with age, lactation number and milk yield. In contrast,
correlation between lactose and age and lactose and lactation
number were negative (p < 0.01). Potassium was negatively
correlated (p < 0.01) with stage of lactation, but posi-
tively correlated (p < 0.01) with milk yield. The relation-
ships between direct microscopic somatic cell count and
individual lactation variables were low and did not approach
significance (p > 0.05).
Further correlations between individual parameters
measured are shown in Table 3. The correlations between
conductivity and sodium (r = 0.60) and conductivity and
direct microscopic somatic cell count (r = 0.25) were
positive and highly significant (p < 0.01). Conversely,
highly significant (p < 0.01) negative correlations were
found to exist between conductivity and potassium and
lactose respectively. When samples were classified as
normal (cell concentration < 5 x 10⁵) or abnormal (cell
29
Page 41
30
Table 2. Correlations between Lactation Variables and Milk
Constituents or Conductivitya
Age Lactation Lactation Milkb
(Yrs) No. Stage (Days) (lbs)
Sodium 0.26** 0.23** 0.19** -0.21**
Potassium -0.12 -0.10 -0.24** 0.29**
Lactose -0.27** -0.25** -0.03 0.13
Conductivity 0.28** 0.30** 0.02 0.04
DMSCCC 0.11 0.11 -0.04 -0.11
an = 295
ineld in lbs at sampling time
CDirect Microscopic Somatic Cell Count
*ic
r significant at p < 0.01
Page 42
31
Table 3. Correlations between Milk Constituents and
Conductivitya
Potassium Lactose Conduc- DMSCCbt1v1ty
Sodium -0.24** -0.63** 0.60** 0.33**
Potassium 1.00 0.37** -0.28** -0.11
Lactose 1.00 -0.56** -0.27**
Conductivity 1.00 0.25**
an = 295
bDirect Microscopic Somatic Cell Count
**
r significant at p < 0.01
Page 43
32
concentration > 5 x 10⁵) the correlation between conductivity
and direct microscopic cell count for 53 abnormal samples
was 0.24 which was significant at the 10% level.
Compared to direct microscopic somatic cell count,
conductivity measurements were less variable, and more
reproducible. For a total of 284 samples the mean somatic
cell count x104 was 44.1 i 6.8 and individual counts ranged
from 0.9 to 1436 x 104. The mean conductivity value was
6.5 i 0.1 millimhos per centimeter (m.mhos/cm), with indi-
vidual values ranging from 4.6 to 9.8 m.mhos/cm. There
was however, considerable variation between conductivity
measurements and somatic cell counts for many samples. Con-
ductivity values as high as 9.1 m.mhos/cm were found where
somatic cell counts were less than 10 x 104 cells/ml,
whereas for cell counts 50 x 104 cells/ml and greater, 12
samples or 22.6% of the samples had conductivity values
below 6.0 m.mhos/cm. Comparison of means (i standard
errors) for several milk constituents and conductivity of
samples classified as normal or abnormal based on somatic
cell counts are shown in Table 4. Mean conductivity for
samples having somatic cell concentration of > 50 x 104
cells/ml was significantly higher (p < 0.01) than the mean
value for samples with < 50 x 104 cells/ml. The mean
sodium concentration of high cell milk was 74.1 mg/100 ml
which was larger (p < 0.01) than the comparable mean for
low cell milk (53.7 mg/100 ml). In contrast, mean potassium
Page 44
33
Table 4. Mean Sodium, Potassium, Lactose and Conductivity
Values of Normal3 and Abnormal Milk
Somatic Cells SOdlum Pota551um Lactose ngggg;
per m1 (mg/100 ml) (6) (m.mhos/cm)
5c
<5 x 10 53.7i1.3 l44.6:l.5 4.8:0.0 6.4:0.l
5d
>5 x 10 74.1:4.0 131.7:3.9 4.5:0.l 7.0:0.2
aNormal Milk = < 5 x 10⁵ somatic cells/m1
bAbnormal Milk > 5 x 10⁵ somatic cells/ml
Cn = 231
dn 53
Page 45
34
(131.7 mg/100 ml) and lactose 4.5% concentration of high
cell milk was less (p < 0.01) than comparable values for low
cell milk (144.6 and 4.8 respectively).
2. Influence of Individual Lactation Variables on Milk
Constituents and Conductivity
a. ggg
The effect of age on milk constituents and conductivity
is shown in Table 5. Mean sodium concentration increased
linearly (p < 0.01) with increase in age from 43.3 mg/100 ml
in milk from two year olds to 62.5 mg/100 ml in milk from
cows greater than age six. Similarly, mean milk conductivity
values increased linearly (p < 0.01) with age in cows two
to six years. On the other hand mean milk lactose and
potassium concentration decreased linearly (p < 0.01) with
increase in age. The effect of age on somatic cell concen-
tration was not significant (p > 0.05).
b. Lactation Number
Mean sodium concentration increased linearly (p < 0.01)
with increasing numbers of lactations (Table 6). Milk sodium
concentration increased from 43.1 mg/100 ml for milk samples
from cows in their first lactation to 66.7 mg/100 ml for
milk samples from cows in their fifth lactation. Like
sodium, mean conductivity increased linearly (p < 0.01)
from 6.0 m.mhos/cm during the first lactation to 7.4 m.mhos/
cm during the fifth lactation. Conversely, mean lactose
concentration decreased linearly (p < 0.01) as number of
Page 46
I
35
Table 5. Milk Sodium, Potassium, Lactose and Somatic Cell
Concentration and Electrical Conductivity--Effect
of Age
Age No. of Sodium Potassium Lactose Conduc- DMSCC1
(Yrs) Samples (%) tivity (x104/ml)
(mg/100 ml) (m.mhos/cm)
2 30 43.33 146.2a 5.0 6.23 433
3 60 46.18 144.8a 4.9 6.08 258
4 56 59.1b 144.93 4.78 6.4 383
s 48 63.1b 137.93 4.68 6.7b 46a
6 53 64.8b 141.43 4.68 6.8b 943
>6 48 62.5b 135.6a 4.6a 6.8b 383
Overall Vari- 252 488 0.37 0.07 161
ance
1Direct Microscopic Somatic Cell Count
a,b
not different (p > 0.05).
Values in a column having the same superscript are
Page 47
Table 6.
36
Milk Sodium, Potassium, Lactose and Somatic Cell
Concentrations, and Electrical Conductivity--
Effect of Lactation Number
Lacta- No. of
tion Samples
No.
Sodium Potassium
(mg/100 ml)
Lactose
(%)
Conduc-
tivity
(m.mhos/cm)
DMS c1
(x10 /ml)
1 72
2 59
3 57
4 48
5 28
>5 31
Overall Vari-
ance
43.1
55.73
65.0b
65.9b
66.7b
55.38
228
145.
146.
134.
140.
143.
137.
475
7a,b
93
2b
2a,b
4a,b
3a,b
180
1Direct Microscopic Somatic Cell Count
3 b
’ Values in a column having the same superscript are
not different (p > 0.05).
Page 48
37
lactations increased. Lactose concentration decreased from
5.0% for samples from cows in their first lactation to 4.5%
for milk from cows in their fifth lactation. Milk potassium
and somatic cell concentrations were not significantly
(p > 0.05) influenced by lactation numbers.
c. Stage of Lactation
The effect of stage of lactation on milk constituents
and conductivity is shown in Table 7. Mean sodium concen-
tration increased linearly (p < 0.01) with advancing lacta-
tion. Mean milk potassium concentration on the other hand
decreased linearly (p < 0.01) with advance in stage of
lactation. Milk conductivity, lactose and direct somatic
cell count were not significantly (p > 0.05) influenced by
stage of lactation.
d. Milk Yield
Mean milk sodium concentration decreased linearly
(p < 0.01) with increase in milk yield. Sodium concentra-
tion decreased from 81.2 mg/100 ml for yields up to 10 lbs
to 51.8 mg/100 ml for yields greater than 30 lbs (Table 8).
In contrast, mean lactose and potassium concentration
increased linearly (p < 0.01) with increase in milk yield.
Lactose concentration increased from 4.2% for yields up to
10 lbs to 4.7% for yields greater than 30 lbs, while
potassium concentration increased from 105.7 mg/100 ml for
the former group to 149.4 mg/100 ml for the latter. Neither
Page 49
38
Table 7. Milk Sodium, Potassium, Lactose and Somatic Cell
Concentration and Electrical Conductivity--Effect
of Stage of Lactation
Stage No. of Sodium Potassium Lactose Conduc- DMSCC1
of Samples (%) tivity (x104/ml)
Lacta- (mg/100 ml) (m.mhos/cm)
tion
(08%)
100 68 52.8a 144.2 4.7 6.58 523
200 86 55.18 151.1 4.83 6 63 583
300 96 55.93 136.88 4.8a 6.33 216
>300 45 69.8 130.73 4.6 6.8 433
Overall Vari- 302 425 0.45 0.09 174
ance
1Direct Microscopic Somatic Cell Count
3Values in a column having the same superscript are not
different (p > 0.05).
Page 50
39
ance
Table 8. Milk Sodium, Potassium, Lactose and Somatic Cell
Concentration and Electrical Conductivity-—Effect
of Milk Yield
Milk No. Sodium Potassium Lactose Conduc~ DMSCC1
Yield Samples (%) tivity (x104/m1)
(lbs) (mg/100 ml) (m.mhos/cm)
1-10 12 81.2 105.7 4.2 7.1 643
11-20 114 59.23 137.33 4.7a 6.5a 468
21-30 129 54.5a 146.63 4.88 6.5a 328
>50 35 51.88 149.43 4.7a 6.68 443
Overall Vari- 307 391 0.49 0.08 181
different (p > 0.05).
1Direct Microscopic Somatic Cell Count
a . . .Values 1n 3 column haV1ng the same superscript are not
Page 51
40
milk conductivity nor direct somatic cell counts were
significantly (p > 0.05) influenced by milk yield.
Page 52
GENERAL DISCUSSION
In spite of its poor reproducibility, the direct micro—
scopic somatic cell count is usually used as a standard to
which other indirect screening tests for abnormal milk are
compared (Stryndaka and Thornton, 1937; Postle and Blobel,
1965). Davis and MacDonald (1953) and Whittlestone and
Palmer-Jones (1944) demonstrated a positive correlation
between cell counts and electrical conductivity of milk.
Davis gt gt., 1943; Malcolm gt gt., 1942 and McCulloch
(1940) recommended using electrical conductivity as a
diagnostic tool for mastitis. In contrast, Postle and
Blobel (1965) and Little gt gt. (1968) rejected electrical
conductivity as a screening test for abnormal milk because
of the low correlations they observed between milk conduc-
tivity and direct somatic cell counts of quarter and bulk
milk samples. Results of the present study showed a sig-
nificant positive correlation (r = 0.25) between direct
microscopic somatic cell count and electrical conductivity
for composite quarter milk samples, collected within the
first minute of milking. This correlation compares favorably
with that (r = 0.24) reported by Postle and Blobel (1965).
The correlation between conductivity and direct microsc0pic
41
Page 53
42
somatic cell count was not increased when only samples
judged to be abnormal by direct cell count (i.e., greater
than 500,000 cells/ml) were included in the correlation
(r = 0.24). Postle and Blobel (1965) explained the low
correlation observed in their study in relation to the
relatively high coefficient of variability associated with
the technique for estimation of somatic cells in milk. The
low correlation obtained in this study emphasizes the
inadequacy of somatic cell counts as an indicator of abnormal
milk. Since the milk samples studied were quarter compo-
sites, dilution of abnormal milk with normal milk could
account for the low correlation. Perhaps individual quarter
measurements would yield a higher correlation. The high
correlations between conductivity and milk constituents
other than somatic cell indicates conductivity is impor-
tantly related to changes in milk that might be considered
physiological and which are at least not highly correlated
with changes in somatic cells. On the basis of other
correlations obtained in this study, it would also appear
that lactation variables exert greater influence on milk
composition than inflammation.
Little gt gt. (1968) reported a wide range of conduc-
tivity measurements for any given level of direct somatic
cell count. They found conductivity values for 501 fore-
milk samples to range from 4 to 10 millimhos (m.mhos).
Horrall (1933) also observed a wide range of conductivities
Page 54
43
for any given level of cell counts. None of these investi-
gators attempted to explain the cause of the variation.
In contrast Pickerton and Peters (1958) reported definite
ranges of conductivity values for normal and abnormal
quarter milk samples. The range of conductivity values
reported herein are well within the range reported by Little
gt gt. (1968). Similarly, the wide range of conductivities
observed for any given level of cell counts confirms the
observations of Little gt_gt, (1968) and Horrall (1933),
and appears to be due to normal lactation variation among
animals. Malcolm gt_gt, (1942) discussed the value of cell
count and electrical conductivity as a criteria of bovine
mastitis and indicated that better results are obtained with
foremilk samples than with bulk samples. They suggested that
samples having conductivity readings higher than 4.9 m.mhos
or somatic cells greater than 5 x 10⁵ to be abnormal. If
these values were applied to the results of the present
study, only four samples or 1.4% would be diagnosed as
normal on the basis of conductivity; whereas 109 or 36% of
the samples would be normal based on somatic cell counts.
The significant positive correlation observed in this study
between milk sodium and conductivity seemed feasible, since
milk conductivity is known to be a direct function of milk
electrolyte concentration. Results reported herein are in
good agreement with those of Pickerton and Peters (1958),
who reported an inverse relationship between milk lactose
Page 55
44
and conductivity. Barry and Rowland (1953) suggested that
the inverse relationship between lactose and conductivity
results from the inverse relationship between milk chloride
and lactose.
Jenness and Patton (1959) reported that sodium concen—
tration of cow's milk is lower than that of blood, while
milk potassium concentration was higher than that of blood.
These differences in ionic composition of milk and blood
were greatest at the beginning of lactation, but later the
ionic composition of milk was more like that of blood
(Barry and Rowland, 1953). These investigators also indi-
cated that milk lactose decreased as lactation advanced,
and that milk samples from cows with mastitis showed changes
in lactose and ionic composition similar to those observed
for advanced lactation. Results of the present investigation
support those of Rook and Wheelock (1967), who suggested
that within animal effects such as cow age, lactation
number, and udder inflammation all decreased milk lactose
and potassium concentration, but increased sodium concen-
tration. These relationships seemed to be consistent,
since milk cell count is reported by numerous investigators
(Schalm, 1959; Hughes, 1954 and McFarlane gt gt., 1949) to
be an index of udder inflammation, and both sodium and
somatic cell counts are known to increase with udder inflam-
mation, while lactose is known to decrease. The results
reported here appear to be consistent with the reports of
Page 56
45
Rook and Campling (1965), who observed that changes in milk
potassium usually parallel those of milk lactose.
The nonsignificant correlations observed for direct
microscopic somatic cell count with age, lactation number,
stage of lactation and milk yield may be as a result of
dilution of samples, since the samples analysed in this
study were composite quarter samples. Also, the low correla-
tions may be due to the fact that the majority of the
animals sampled were around their mid-lactation stage. The
positive relationship between lactose and potassium and the
negative relationships between lactose and sodium and
potassium and sodium concentration of milk reported herein
agree with the results of Barry and Rowland (1953). In
general, the changes in milk constituents and conductivity
with age, lactation number, stage of lactation and milk
yield reported here are in good agreement with results of
Rook and Wheelock (1967), Waite gt gt. (1956) and Barry and
Rowland (1953). These changes in milk constituents and
conductivity appear to be associated with aging effects on
the secretory tissues of the udder, which may cause in-
creased permeability of the mammary tissues. This, according
to Legates (1960) may reflect udder deterioration, either
as a result of increasing incidence of mastitis or as slight
physical damage with age. Van Rensberg (1947) explained
changes in milk composition with age on the basis of physio-
logical wear and tear. With increased permeability of the
Page 57
46
mammary tissues regardless of cause, there is thought to be
a partial resorption of milk lactose and an assumed mixing
of milk within the udder with a transudate of blood serum,
resulting in increased milk sodium and decreased milk
lactose and potassium (Davis, 1933; Preskett and Folley,
1933 and Barry and Rowland, 1953).
Although a number of significant correlations were
observed in this study, they are not high enough to use as
a prediction tool. In addition, the results would seem to
indicate that electrical conductivity as a screening test
for mastitis could prove useful, if the investigation is
extended to individual quarter sampling. This would elimin~
ate dilution of samples which appeared to be a major con-
tributing factor to the poor correlation found between
direct microscopic cell count and electrical conductivity
for the composite quarter samples studied.
Page 58
SUMMARY AND CONCLUSION
Since bovine mastitis continues to be a major problem
to the dairy industry, there is a need for a more effective
and efficient method of detection. In this study, an attempt
was made to develop an in-line electronic screening test
for abnormal milk, based on electrical conductivity. The
principle involved is that milk secreted by normal udders
have almost identical conductivities, but with udder inflam-
mation there is an influx of sodium and chloride ions into
the mammary gland. Because electrical conductivity is a
function of milk electrolyte concentration there is usually
an increase in milk conductivity with udder inflammation.
Electrical conductivity measurements were obtained for a
total of 295 quarter composite milk samples over a six
month period, using an electrodeless conductivity cell.
These samples were further analysed for sodium, potassium,
lactose and somatic cell content.
Milk conductivity increased linearly (6.2 to 6.8 m.mhos/
cm) in cows two to six years old, and from the first to the
fifth lactation (6.0 to 7.4 m.mhos/cm). In contrast, milk
conductivity decreased linearly with increase in milk yield
from 7.1 m.mhos/cm for yields up to 10 lbs to 6.6 m.mhos/cm
47
Page 59
48
for yields greater than 30 lbs. Changes in milk conductivity
appeared to be associated with changes in milk sodium as
sodium concentration was shown to increase linearly with
increase in age and lactation number; while it decreased
linearly with increase in milk yield. Overall correlation
analysis revealed a significant and positive correlation
between milk conductivity and direct somatic cell count
(r = 0.25). Milk conductivity was also significantly
correlated with milk constituents including sodium (r =
0.60), potassium (r = -0.28) and lactose (r = -0.56). These
constituents were markedly influenced by lactation variables
namely age, lactation number, stage of lactation and milk
yield.
Direct relationships were found to exist between lactose
and potassium, whereas inverse relationships were found
between lactose and sodium and potassium and sodium concen—
tration of milk. No significant relationships were found
between direct somatic cell count and age, lactation number,
stage of lactation or milk yield. Conductivity measurements
showed less variation than direct somatic cell count and
appeared to be more reproducible. It would appear that
changes in milk constituents due to physiological factors
exerted greater influence on milk conductivity than those
associated with inflammation. Although a number of sig-
nificant correlations were obtained there were not high
enough to be used for prediction purposes.
Page 61
BIBLIOGRAPHY
Allen, L. A. 1931. The Mineral Constituents and Citric
Acid of Milk. J. Dairy Res. 3:1.
Anderson, E. O. 1946. Relationship of Bovine Mastitis to
Quality of Dairy Products. p. 431. In: Bovine
Mastitis, lst ed. Little and Plastridge. McGraw-Hill
Book Co., New York.
Armstrong, T. V. 1959. Variations in the Gross Composition
of Milk as Related to the Breed of the Cow: A Review
and Critical Evaluation of Literature of the United
States and Canada. J. Dairy Sci. 42:1.
Azarme, E. 1938. Variations in the Protein Content of Milk
During Lactation. J. Dairy Res. 9:121.
Azimov, J. G., F. A. Orlov and P. O. Belugina. 1962. Milk
Secretion and Re-absorption from the Udder. Nature
193:985.
Bailey, G. L. 1952a. Studies on Variations in the Solids-
not-Fat Content of Milk. 1. Variations in Lactation
Yield, Milk Fat Percentage and Solids-not-Fat Percentage
that are Due to Age of the Cow. J. Dairy Res. 19:89.
Barry, J. M. and S. J. Rowland. 1953. Variations in the
Ionic and Lactose Concentrations of Milk. Biochem. J.
54:575.
Barthe, M. L. and M. E. Dufilho. (1927) cited by Jones,
T. S. G. and W. L. Davies. 1935. Biochem. J. 29:978.
Barthe, M. L. and M. E. Dufilho. 1928. Dosage du Chlore
et du Sodium dans les Laits de Quelques Femelles de
Mammiferes. Le Lait 8:97.
Bitman, J., H. C. Cecil, D. R. Gilliam and J. Wrenn. 1963.
Chemical Composition of the Mammary Gland during
Experimental Mastitis. J. Dairy Sci. 46:933.
49
Page 62
50
Blackburn, P. S., Constance M. Laing and J. F. Malcolm.
1955. A Comparison of the Diagnostic Value of the
Total and Differential Cell Counts of Bovine Milk.
J. Dairy Res. 22:37.
Blackburn, P. S. and I. Macadam. 1954. The Cells in Bovine
Milk. J. Dairy Res. 21:31.
Barnum, D. A. and F. H. S. Newbould. 1961. The Use of the
California Mastitis Test for the Detection of Bovine
Mastitis. Can. Vet. J. 2:83.
Bonnier, G., A. Hansson and F. Jarl. 1946. Studies in the
Variations of the Calorie Content of Milk. Acta Agric.
Suec. 2:159.
Chu, S. J. 1949. Bovine Mastitis: A Comparison of the
Value of Diagnostic Methods. J. Comp. Pathol. Therap.
59:81.
Costle, J. H. and E. T. Shelborn. 1919. Electrical Con-
ductivity of Milk. Analyst 44:158.
Crowther, C. and A. G. Ruston. (1911) cited by Rook, J. A.
F. and R. C. Campling. 1965. J. Dairy Res. 32:45.
Current Concepts of Bovine Mastitis. 1965. National
Mastitis Council Inc., Washington, D.C.
Davies, W. L. 1933. The Composition of the "Isotonic
Diluent" in Samples of Milk Low in Solids-not-Fat.
J. Dairy Res. 4:273.
Davis, J. G. 1947. The Rapid Abnormality Indicator.
Dairy Industries 12:35.
Davis, J. G., V. E. Jones and S. J. Ward. 1943. Rapid
Electrical Methods for the Measurement of Souring
and Mastitis in Milk. J. Appl. Bact. 6:43.
Davis, J. G. and F. J. MacDonald. 1953. p. 547. Richmond's
Dairy Chemistry. Charles Griffin and Co., London.
Fielden, J. E. 1955. Measurement of Conductivity of Liquids.
U.S. Patent No. 2:709 and 785.
Gerber, V. 1927. Ueber die Bedeutung der speziefischen
elektrischen Leitfaehigkeit der Milch und ein neues
praktisches Verfahren zu deren Bestimmung. Z. Untersuch.
Lebensm. 54:257.
Page 63
51
Gerrish, J. B. and W. G. Bickert. 1970. A Control Circuit
and Transducer for an Automatic Milking Machine Detacher.
ASAE Paper No. 70-317.
Gupta, S. R. and G. J. Hills. 1965. A Precision Electrode-
less Conductance Cell for Use at Audio-Frequencies.
Sci. Inst. 33:313.
Henderson, J. L. 1971. The Fluid-Milk Industry. 3rd Ed.
p. 18. The Avi. Pub. Co., Westport, Conn.
Hinton, C. L. and T. Macara. 1927. The Determination of Aldose
Sugars by Means of Chloramine-T, with Special Reference
to the Analysis of Milk Products. Analyst 52:668.
Horall, B. E. 1933. A Paper Test for the Detection of
Mastitis. Indiana Agric. Exp. Sta. Bull. 377.
Hughes, D. L. 1954. Some Reflections on the Mastitis
Problem. Vet. Record 66:235.
Jackson, L. C. and C. H. Rothera. 1914. Milk, Its Sugar,
Conductivity and Depression of Freezing Point. Biochem.
J. 8:1.
Jenness, R. and S. Patton. 1959. Principles of Dairy
Chemistry. p. 1. John Wiley and Sons, Inc., New York.
Jensen, P. T. 1957. Investigations into the Whiteside Test
and the C.M.T.--Test for the Detection of Pathological
Secretions in Herd Milk Samples. Nord. Vet. Med. 9:590.
Jones, G. E. 1949. A Statistical Examination of Conductivity
Values for Aseptically Drawn Milk Samples. Proceeding
of the Society of Applied Bacteriology 1:29.
Jones, T. S. G. and W. L. Davies. 1935. The Relation of
Sodium to Chlorine in the Milk of Shorthorn and Guernsey
Cows. Biochem. J. 29:978.
Knutsson, P. G. 1964a. Exchange of Sodium Potassium Chloride
and Phosphate Ions Across the Mammary Epithelium in
the Goat. Uppsala Lantbruks - H6gskolans Annaler 30:377.
Knutsson, P. G. 1964b. Resorption of Sodium and Chloride
Ions from the Udder Milk after Injection of Sodium
Chloride Solutions through the Teat in the Goat. Uppsala
Lantbruks - H6gskolans Annaler 30:507.
Krenn, J. 1932. Die elektrische Leitfahigkeit der Milch,
ihr wesen und ihre Anwendung. Angewandte Chemie. 45:171.
Laing, C. M. and J. F. Malcolm. 1956. The Incidence of
Bovine Mastitis with Special Reference to the Non-
specific Condition. Vet. Record 68:447.
Page 64
52
Legates, J. E. 1960. Genetic and Environmental Factors
Affecting the Solids-not-Fat Composition of Milk.
J. Dairy Sci. 43:1527.
Leidl, W. and O. W. Schalm. 1961. Die Anwendung des
Schalm-Mastitis-Testes (SMT) bei Sammelmilch zur
Bestimmung minderwertiger Milch, hedingt durch hohen
Zellgehalt. Tieraztl. Umschau. 16:219.
Leidl, W., O. W. Schalm, A. Kireger, und H. Lagemann. 1961.
Vergleich des Schalm-Mastitis-Testes mit dem Zellgehalt,
der Katalase-Thybromol-Probe und dem Chloregehalt in
der Milch. Tieraztl. Wochenschrift. 19:382.
Ling, E. R., S. K. Ken and J. W. G. Porter. 1961. Milk:
the Mammary Gland and Its Secretion. Vol. II: p. 200.
Academic Press, New York and London.
Little, R. B. 1940. The Control of the Chronic Form of
Streptococcic Mastitis. J. Am. Vet. Med. Assoc. 97:212.
Little, T. W. A., C. N. Herbert and D. Forbes. 1968.
Electrical Conductivity and the Leucocyte Count of
Bovine Milk. Vet. Record 82:431.
Macadam, I. 1958. The Pathology and Bacteriology of Bovine
Mastitis in Relation to Cell Counts. J. Comp. Pathol.
Therap. 68:106.
Macy, I. G., H. J. Kelly and R. E. Sloan. 1953. The
Composition of Milks. National Res. Council Pub. No.
254.
Malcolm. J. F., C. W. King and M. M. Campbell. 1942. The
Value of the Cell Content and Electrical Conductivity
of Milk as Criteria of Bovine Mastitis. J. Appl.
Bacteriology 5:30.
McCulloch, E. C. 1940. The Early Detection of Bovine
Mastitis by an Electrometric Method. J. of Milk Tech.
3:314.
McDowall, F. H. 1945. Studies on the Detection of Mastitis
in New Zealand Dairy Herds. V. Composition of Milk
from Quarters Reacting to the Bromothymol Blue Test
for Mastitis. N.Z. J. Sci. Technol. A. 27:258.
McEwen, A. D. and M. B. Cooper. 1947. Bovine Mastitis.
Vet. Record 59:655.
McFarlane, D., P. S. Blackburn, J. F. Malcolm and A. L.
Wilson. 1949. A Comparison of Ante-Mortem and Post-
Mortem Findings in Bovine Mastitis. Vet. Record 61:807.
Page 65
53
McKenzie, D. D. S. and A. K. Lacelles. 1965b. The Movement
of Solutes Across the Epithelium of the Ducts and
Cisterns in the Mammary Gland of the Ewe. Aust. J.
Biol. Sci. 18:1035.
McLeod, P. and E. 0. Anderson. 1952. A Study of Cell
Counts of Milk from Healthy Cows. Storrs (Conn.)
Agr. Expt. Sta. Bull. 290.
McPhillips, J. and N. Snow. 1958. Studies on Milk with a
New Type of Conductivity Cell. Australian J. Dairy
Tech. 13:192.
Montefredine, A. (1942) cited by Prentice, J. H. 1962.
J. Dairy Res. 29:131.
Munch-Petersen, E. 1938. Rev. Ser. Commonw. Bureau of
Animal Health No. 1.
Murphy, J. M. 1947. The Genesis of Bovine Udder Infection
and Mastitis. II. The Occurrence of Streptococcal
Infection in a Cow Population During a Seven-Year
Period and Its Relationship to Age. Am. J. Vet. Res.
8:29.
Murphy, J. M. 1943. The General Effect of Staphylococcal
Infection on the Biochemical Composition of Strict
Foremilk. Cornell Vet. 33:52.
Murphy, H. M. and O. M. Stuart. 1953. The Effect of
Introducing Small Numbers of Streptococcus agalactiae
(Cornell Strain 48) Directly into the Bovine Teat
Cavity. Cornell Vet. 43:290.
Nickerson, T. A. 1960. Chemical Composition of Milk.
J. Dairy Sci. 43:598.
O'Donovan, J., F. H. Dodd and F. K. Neave. 1960. The Effect
of Udder Infections on the Lactation Yield of Milk
Solids. J. Dairy Res. 27:115.
Pickerton, F. and I. I. Peters. 1958. Conductivity Percent,
Lactose and Freezing Point of Milk. J. Dairy Sci.
41:392.
Plastridge, W. N. 1958. Bovine Mastitis. A Review.
J. Dairy Sci. 41:1141.
Politiek, R. D. 1957. Agri. Coll. Wageningen: Dissertation.
Postle, D. S. and H. Blobel. 1965. Studies on Bulk Milk
Screening for Mastitis. Am. J. Vet. Res. 26:90.
Page 66
54
Prentice, J. 1962. The Conductivity of Milk-~The Effect
of the Volume and Degree of Dispersion of the Fat.
J. Dairy Res. 29:131.
Prescott, S. C. and R. S. Breed. 1910. The Determination
of the Number of Body Cells in Milk by a Direct Method.
J. Infect. Diseases 7:632.
Preskett, G. L. and S. J. Folley. 1933. Some Observations
on Cow's Milk Poor in Non-Fatty Solids. J. Dairy Res.
4:279.
Rensburg, S. W. J. Van. 1947. The Secretion of Abnormal
Milk by Quarters Free from Known Pathogen.Onderspoort.
J. Vet. Res. 22:91.
Richmond, H. D. 1899. Richmond's Dairy Chemistry. p. 8.
Charles Griffin and Co., London.
Roberts, S. J. 1967. Prevention and Control of Clinical
Infections. Mastitis Proceedings National Mastitis
Council Inc., Washington, D.C.
Rook, J. A. F. 1961. Variations in the Chemical Composition
of the Milk of the Cow-~Part 1. Dairy Sci. Abstracts
23:251.
Rook, J. A. F. and R. C. Campling. 1965. Effect of Stage
and Number of Lactation on the Yield and Composition
of Cow's Milk. J. Dairy Res. 32:45.
Rook, J. A. F. and J. V. Wheelock. 1967. The Secretion of
Water and of Water Soluble Constituents of Milk.
J. Dairy Res. 34:273.
Rook, J. A. F. and M. Wood. 1959. Potassium and Lactose
in Milk in Relation to the Physiology of Milk Secretion.
Nature 184:647.
Rowland, S. J. 1938. The Protein Distribution in Normal
and Abnormal Milk. J. Dairy Res. 9:47.
Schalm, O. W. 1959. A Syllabus on the Mammary Glands in
Health and Disease. University of Calif. Student Book
Store. Davis, California.
Schalm, O. W., E. J. Carroll and N. C. Jain. 1971. In:
Bovine Mastitis. p. 72. Lea and Febiger, Philadelphia.
Shulz, M. E. 1956. Die Messung der elektrischen Leitfahig-
keit als Hilfsmittel des chemikers bei der Milchanalyse.
Kieler Milchwirtschafiliche Forschungsberichte. 8:641.
Page 67
55
Schulz, M. E. and G. Sydow. 1957. The Electrical Conduc-
tivity (Chloridefree) of Milk and Dairy Products.
Milchwissenschaft 12:174.
Sperry, E. A. 1968. Method of an Apparatus for Measuring
the Electrical Conductivity of a Solution. U.S.
Patent No. 3,396,331.
Strynadaka, N. J. and H. R. Thornton. 1937. The Accuracy
of Direct Microscopic (Breed) Count of Bacteria and
Leucocytes in Milk. J. Dairy Sci. 20:685.
Vanschoubrock, F. X. E. J. 1963. Determination and Varia-
tion of Protein, Fat and Lactose in Cow's Milk, and
Selection on these Factors. Neth. Milk and Dairy J.
17:12.
Vanschoubrock, F., A. Willems and Ph. Lampo. 1964. The
Effect of Age on Milk Yield and Milk Composition in
the Cow. Neth. Milk and Dairy J. 18:79.
Verma, I. S. 1950. A Study of the State of Solution of
the Naturally Occurring Salts in Milk. Ph.D. Thesis,
University of Wisconsin.
Voightlander, K. H. 1963. Untersuchungen fiber den Mineral-
stoffgehalt der Milch von Kfihen des Deutschen schuarz-
buten Rindes. Arch. Tierzucht. 6:184.
Waite, R. and P. S. Blackburn. 1957. The Chemical Compo-
sition and Cell Count of Milk. J. Dairy Res. 24:238.
Waite, R., J. C. D. White and A. Robertson. 1956. Varia-
tions in the Chemical Composition of Milk with Particular
Reference to the Solids—not-Fat. l. The Effect of
State of Lactation and Age of Cow. J. Dairy Res. 23:65.
Ward, G. M. 1963. Potassium Content of Dried Milk. J.
Dairy Sci. 46:574.
Watt, B. K. and A. L. Merrill. 1963. U.S. Dept.
Agriculture Handbook No. 8:189.
Webb, B. H. and A. H. Johnson. 1965. Fundamentals of
Dairy Chemistry. AVI Publishing Company Inc., Westport,
Connecticut. p. 1-35.
Wilcox, C. J., K. O. Pfau, R. E. Mather and J. W. Bartlett.
1959. Genetic and Environmental Influence upon Solids—
not-Fat Content of Cow's Milk. J. Dairy Sci. 42:1132.
Page 68
56
Wheelock, J. V., J. A. F. Rook and F. H. Dodd. 1965b. The
Effect of Incomplete Milking or of an Extended Milking
Interval on the Yield and Composition of Cow's Milk.
J. Dairy Research 32:237.
Wheelock, J. V., J. A. F. Rook and F. H. Dodd. 1965d. The
Effect of Intravenous Injections of Oxytocin During
Milking and the Removal of Residual Milk on the Compo-
sition of Cow's Milk. J. Dairy Research 32:255.
Wheelock, J. V., J. A. F. Rook, F. H. Dodd and T. K. Griffin.
1966. The Effect of Varying the Interval Between
Milkings on Milk Secretion. J. Dairy Research 33:161.
Wheelock, J. V., J. A. F. Rook, F. K. Neave and F. H. Dodd.
1966. The Effect of Bacterial Infections of the Udder
on the Yield and Composition of Cow's Milk. J. Dairy
Research 33:199.
Whittlestone, W. G. and Palmer-Jones (1944). Unpublished,
cited by Whittlestone, W. G. and H. D. Langden. 1965.
Proc. N.Z. Animal Production 25:137.
Page 70
APPENDIX I
TUNGSTIC ACID REAGENT USED FOR PRECIPITATION
OF PROTEIN AND FAT IN LACTOSE ANALYSIS
Dissolve 7 g of sodium tungstate (Mallinckrodt Chemical
Works, St. Louis, M0.) in 870 m1 double glass distilled
water.
Add 1 ml orthophosphoric acid (88%) (Mallinckrodt
Chemical Works, St. Louis, Mo.) and 70 m1 of IN sulfuric
acid.
57
Page 71
APPENDIX 2
NEWMAN'S STAIN FOR MILK SMEARS
1. Dissolve 2 g of Methylene blue (Sigma Chemical Co.,
St. Louis, Mo.) in 60 ml (95%) warm alcohol.
Add 40 ml of Xylene (Merck and Co. Inc., Rahway,
N.J.) and 6 ml of glacial Acetic acid (Mallinckrodt
Chemical Works, St. Louis, Mo.).
Filter through Whatman No. 1 filter paper.
Store in tightly stoppered bottle--at room
temperature.
STAINING PROCEDURE
lo
2.
Immerse slides in Newman's stain for 5 minutes.
Remove wash and rinse in separate containers of
tap water.
Place slides on level surface to air-dry.
58
Page 72
”71111111111111fillilfliiiilflljlflitilifS