17
Chapter 3 Electrocatalytic Oxidation of Glucose on Copper Oxide Modified Copper Electrode
Chapter 3
Electrocatalytic Oxidation of Glucose on Copper
Oxide Modified Copper Electrode
3. Electrocatalytic Oxidation of Glucose on Copper
Oxide Modified Copper Electrode
In order to combat the drawbacks of enzymatic glucose biosensors, it
was thought to develop a non-enzymatic sensor, which adopts the direct
electrocatalytic oxidation of glucose. Several materials such as platinum, gold,
copper, silver, bismuth and mercury which can catalyse the oxidation of
glucose in their native form or in modified forms were reported. Out of all
these materials, copper and copper oxide based materials are shown to
facilitate the inherent tendency for the oxidation of glucose. Further added
advantage is its low cost, but its toxic nature excludes its use as an invasive
sensor. This chapter describes the development, characterization and
application of copper oxide modified copper electrode for the detection of
glucose. The copper electrode has been anodized in sodium potassium tartrate
through potentiostatic and potentiodynamic techniques. The developed
electrode was characterized for its morphology, surface composition and
tested for its potential to use as an amperometric glucose sensor. Its
application was extended to test the glucose concentration in blood serum also.
3.1. Experimental
3.1.1. Development of CuO Modified Copper (CuO/Cu) Electrode
Copper sheet of 0.5 mm thickness was sheared into small strips and
selectively masked with Teflon tape to expose an area of 0.06825 cm2 which
was measured using high resolution video measuring system (ARCS, KIM
series, Taiwan). These electrodes were polished with a series of emery papers,
washed with double distilled water, rinsed with acetone and dried in nitrogen
atmosphere. The strip was anodized by CV at a scan rate of 50 mV s-1 between
-1 and +1 V in sodium potassium tartrate solutions of different concentrations
50
(1, 0.5 and 0.25 M). Then it was repeatedly washed with water and used for
electrochemical and morphological studies.
3.1.2. Electrochemical Characterization of CuO/Cu Electrodes
Electrochemical impedance spectra of the bare copper and CuO
modified copper electrodes were carried out in 0.1 M NaOH solution at their
open circuit potentials, in the frequency range of 0.01 Hz to 100 KHz with
potential amplitude of 10 mV. The impedance spectra were plotted in the form
of complex plane diagrams.
3.1.3. Electrochemical Detection of Glucose using CuO/Cu Electrode
The CV and LSV of the bare and modified copper electrodes were
carried out in 0.1M NaOH solution in the potential window of 0 to 0.80 V at a
scan rate of 50 mV s-1. In order to study the mechanism of oxidation of
glucose, the scan rate was varied between 1-5000 mV s-1. To find the optimum
potential and concentration of NaOH for the best response, the amperometry
was carried out using the modified electrode at various potentials in a stirred
solution of 0.01 M to 1 M NaOH. 10 µL of glucose solution was injected at
regular intervals so that the resultant concentration varied from 2 µM to 20
mM. Trials produced identical results with and without nitrogen purging.
Hence, the experiments were carried out without nitrogen purging. The
interference of ascorbic acid and uric acid was studied by injecting 10 µL of
the respective solutions into the test solution. All the experiments were
conducted at room temperature and were repeated at least three times to check
the reproducibility.
3.2. Results and Discussion
3.2.1. Electrochemical Formation of CuO on Cu Electrode (CuO/Cu)
Cyclic voltammogram of copper electrode in sodium potassium tartrate
solution is shown in Figure 3.1. Two anodic peaks a and b appeared at 0.10
and 0.70 V, respectively. The peak a is sharp and well defined corresponding
to a single electron transfer for the conversion of metallic copper to cuprous
51

ions. The second peak observed at 0.70 V corresponds to the conversion of
cuprous to cupric ion. The current intensity of these peaks was relatively high
indicating facile oxidation of copper in tartrate medium. On reversing the
scan, two cathodic peaks were observed, one at -0.15 V and the other at about
-0.30 V; the first one corresponding to the conversion of Cu(II) to Cu(I). The
second peak was composite in nature which may be due to the involvement of
more than one electron transfer such as Cu(II) to Cu and Cu(I) to Cu. The
cathodic peak current was comparatively less than that of the anodic showing
the stability of the oxide formed and its reduction is less facilitated in the
cathodic scan.
Figure 3.1. Cyclic voltammogram obtained for copper electrode in 0.5 M sodium
potassium tartrate at a scan rate of 100 mV s-1
In order to correlate the anodic and cathodic peaks, the direction of
potential was reversed immediately after peak a was observed in the anodic
direction and only one peak at c was observed which corresponds to the
reduction of the products formed during the oxidation at a. Hence the other
two peaks (b and d) must be due to the redox reaction of Cu(II) and Cu(I).
Since the peak d is composite in nature, it may be due to two competing or
52
parallel processes such as the reduction of Cu(II) to Cu(I) and also the
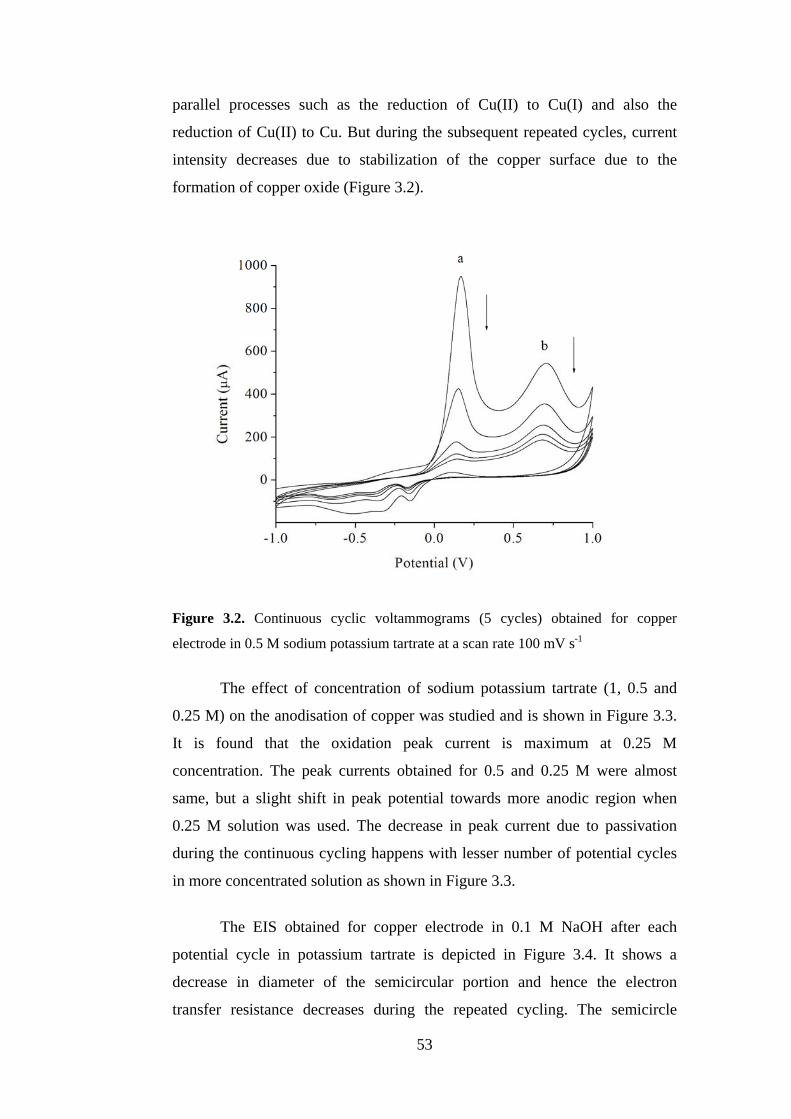
reduction of Cu(II) to Cu. But during the subsequent repeated cycles, current
intensity decreases due to stabilization of the copper surface due to the
formation of copper oxide (Figure 3.2).
Figure 3.2. Continuous cyclic voltammograms (5 cycles) obtained for copper
electrode in 0.5 M sodium potassium tartrate at a scan rate 100 mV s-1
The effect of concentration of sodium potassium tartrate (1, 0.5 and
0.25 M) on the anodisation of copper was studied and is shown in Figure 3.3.
It is found that the oxidation peak current is maximum at 0.25 M
concentration. The peak currents obtained for 0.5 and 0.25 M were almost
same, but a slight shift in peak potential towards more anodic region when
0.25 M solution was used. The decrease in peak current due to passivation
during the continuous cycling happens with lesser number of potential cycles
in more concentrated solution as shown in Figure 3.3.
The EIS obtained for copper electrode in 0.1 M NaOH after each
potential cycle in potassium tartrate is depicted in Figure 3.4. It shows a
decrease in diameter of the semicircular portion and hence the electron
transfer resistance decreases during the repeated cycling. The semicircle
53

portion observed at higher frequency range corresponds to the electron-
transfer-limited process and a linear segment at lower frequencies represents
the diffusion limited process.
Figure 3.3 Continuous cyclic voltammograms (5 cycles) obtained for copper
electrode in the presence of 1, 0.5 and 0.1 M sodium potassium tartrate at a scan rate
of 100 mV s-1
The diameter of the semicircle in the Nyquist plot equals the electron-
transfer resistance, Ret, which is related to the electron-transfer kinetics of the
redox probe at the electrode surface. From the figure, it is obvious that the
bare copper exhibits maximum electron transfer resistance (curve a) and it
decreases continuously in every potential cycle in sodium potassium tartrate
(curves b-f).
3.2.2. Surface Characterisation
Scanning electron micrographs of the bare and the modified electrode
are presented in Figure 3.5. It is clear that the electrode surface turns rough
after modification and micro-growth formed on the surface are visible. The
54

effective surface area of the electrode increases tremendously due to this
micro-growth on the surface.
Figure 3.4. EIS in 0.1 M NaOH at open circuit potentials in the frequency range of 1
Hz-100 KHz with amplitude 10 mV. Curve a for bare copper and b-f for modification
by successive potential cycling in 0.5 M sodium potassium tartrate. Inset shows the
equivalent circuit
Figure 3.5. Scanning electron micrographs of bare copper electrode (A) and modified
copper electrode (B); modification was carried out by CV in 0.5 M sodium potassium
tartrate at a scan rate of 100 mVs-1 for five cycles
The EDAX spectrum obtained for the modified electrode is shown in
Figure 3.6. The elemental composition of the surface species was obtained as
Cu (79.89) and O (20.11), that is the ratio of Cu:O is 3.9726:1 which is very
close to the theoretical ratio 3.9718:1 for CuO.
55

Figure 3.6. EDAX spectrum of the CuO modified electrode
3.2.3. Electrocatalytic Oxidation of Glucose
Trials conducted on electrocatalytic oxidation of glucose on the
modified electrode in different electrolytes such as NaOH solution, acetate and
phosphate buffer. It was found that the modified electrode was not stable in
acetate and phosphate buffer solutions. Hence, NaOH solution was chosen as
the electrolyte for the oxidation of glucose. Most of the previous reports on
direct oxidation of glucose, which involve copper or copper oxide, indicate
use of NaOH as the electrolyte [155, 156, 188, 189, 276, 277]. Figure 3.7
shows the CV obtained for a CuO/Cu electrode (prepared by five cycles of CV
in 1 M sodium potassium tartrate), in 0.1 M NaOH at a scan rate of 100 mVs-1
in the absence (a) and presence of 6 mM glucose (b). In the absence of
glucose, no characteristic peak was observed except a small plateau at 0.60 V
and in the presence of glucose a distinct peak appears at 0.60 V, which is 200
mV less positive potential than that the reported (0.80 V) at bare copper and
modified copper electrodes by Torto et al. [155]. This observed result
establishes that modification process has a definite role on the oxidation of
glucose.
56
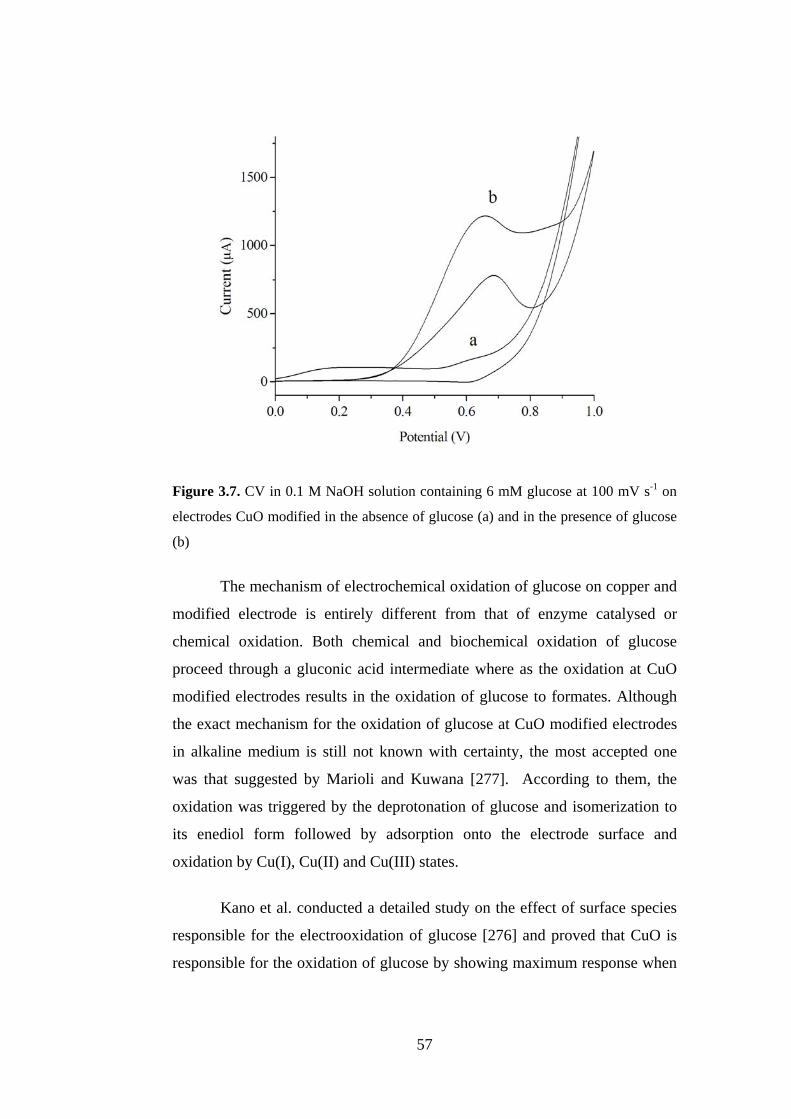
Figure 3.7. CV in 0.1 M NaOH solution containing 6 mM glucose at 100 mV s-1 on
electrodes CuO modified in the absence of glucose (a) and in the presence of glucose
(b)
The mechanism of electrochemical oxidation of glucose on copper and
modified electrode is entirely different from that of enzyme catalysed or
chemical oxidation. Both chemical and biochemical oxidation of glucose
proceed through a gluconic acid intermediate where as the oxidation at CuO
modified electrodes results in the oxidation of glucose to formates. Although
the exact mechanism for the oxidation of glucose at CuO modified electrodes
in alkaline medium is still not known with certainty, the most accepted one
was that suggested by Marioli and Kuwana [277]. According to them, the
oxidation was triggered by the deprotonation of glucose and isomerization to
its enediol form followed by adsorption onto the electrode surface and
oxidation by Cu(I), Cu(II) and Cu(III) states.
Kano et al. conducted a detailed study on the effect of surface species
responsible for the electrooxidation of glucose [276] and proved that CuO is
responsible for the oxidation of glucose by showing maximum response when
57

compared to Cu2O and Cu(OH)2. According to the mechanism proposed by
them the oxidation of glucose results in formates along with 12 electrons.
Though the presence of CuO is essential for oxidation of glucose, the
oxidation involves the catalysis of higher oxidation species such as CuO+ or
CuO(OH) [276]. This was supported by the fact that these species will be
formed in alkaline medium which favour the oxidation of glucose. Again, the
possible activation of these species by the electric field also cannot be
neglected [276]. According to them, alkoxide formation between the alcoholic
oxygen and the (soluble) Cu(III) ion [379] seems to be essential for the
electron transfer from carbohydrates to Cu(III) to generate radical
intermediates and CuO [273]. The radicals would be oxidized immediately to
yield formate while Cu(II) (or CuO) can be oxidized to regenerate the
catalytically active Cu(III) species. Hence, a net two-electron transfer is
accomplished in each step of catalytic cycle. The oxidation of glucose occurs
in the potential range of 0.40 to 0.8 V where the oxidation wave for
Cu(II)/Cu(III) was reported [155, 156, 188, 189, 276, 277]. Here, the Cu(III)
species was proposed to act as an electron transfer mediator [188, 380].
Three electrodes (A, B and C) were modified under three different
concentrations of tartrate solutions and were tested for sensing glucose by
taking 6 mM glucose in 0.1 M NaOH solution at 100 mV s-1 (Figure 3.8). The
peak potentials for the oxidation of glucose were shifted to more anodic value
for electrodes modified at lower concentrations (curves b and c). Therefore,
the amperometry and other studies were carried out using the electrode
anodised from 1 M solution of sodium potassium tartrate.
LSVs carried out with increasing concentration of glucose in 0.1 M
NaOH at 100 mVs-1 are presented in Figure 3.9. In the absence of glucose
(curve a) no characteristic peak was obtained, but a small shoulder can be seen
around 0.60 V which may be due to the redox wave of Cu(II)/Cu(III). But, in
the presence of glucose a distinct peak at 0.55 V was obtained (curve b).
58
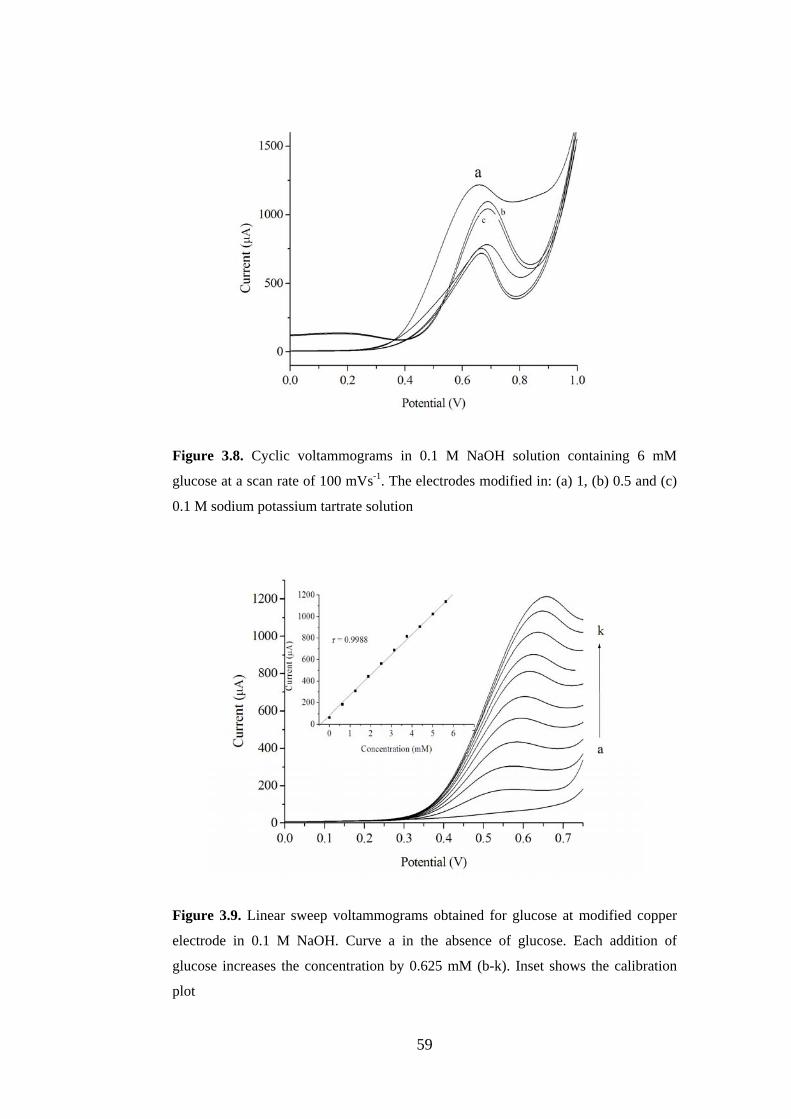
Figure 3.8. Cyclic voltammograms in 0.1 M NaOH solution containing 6 mM
glucose at a scan rate of 100 mVs-1. The electrodes modified in: (a) 1, (b) 0.5 and (c)
0.1 M sodium potassium tartrate solution
Figure 3.9. Linear sweep voltammograms obtained for glucose at modified copper
electrode in 0.1 M NaOH. Curve a in the absence of glucose. Each addition of
glucose increases the concentration by 0.625 mM (b-k). Inset shows the calibration
plot
59

Further additions of glucose resulted in increase of current response with a
very small shift in peak potential. Each addition corresponds to an increment
of 0.6 mM and a linear response was observed with linear regression equation
Ip (µA) = 82.4090 + 187.8836 C (mM) with an r = 0.9988.
3.2.4. Effect of Experimental Parameters on Amperometric Response
The optimum concentration of NaOH solution for the amperometric
detection of glucose at the modified electrodes was determined using different
concentrations ranging from 0.001 to 1 M and achieved the best response in
0.1 M solution (Figure 3.10). The optimum potential for the oxidation of
glucose in alkaline media was established to be 0.7 V which was also found
true by amperometry studies at different applied potentials (Figure 3.11).
Hence all amperometric analyses were carried out using 0.1 M NaOH at 0.70
V.
Figure 3.10. Effect of NaOH concentration on peak current of glucose oxidation
The effect of scan rate on the oxidation current of glucose at the CuO
electrode was examined by CV in 0.1 M NaOH solution containing 10 mM
glucose. The peak current increases linearly with the square root of scan rate
60

and this indicates that the oxidation of glucose is diffusion controlled, which is
in agreement with earlier report [189].
3.2.5. Amperometric Detection of Glucose
Amperometric responses obtained by the successive additions of
glucose into 0.1 M NaOH solution at 0.70 V are shown Figure 3.12. Time
required to obtain a stable response was less than one second, signifying a
faster response than that of the reported sensors [188, 381-383]. The sensor
exhibits excellent linearity in the range of 2µM to 20 mM with the regression
equation Ip (µA.) = 53.8886 + 42.8954 C (mM) with a correlation coefficient
r = 0.9979. The sensitivity was found to be 761.9 µA mM-1 cm-2 with a
detection limit 0.1 µM.
Figure 3.11. Amperometric response of the modified electrode to glucose in a stirred
solution of 0.1 M NaOH at various applied potentials. Each addition of glucose
increased the concentration by 0.6 mM
61

Figure 3.12. Amperometric response of the modified electrode to glucose in a stirring
solution of 0.1 M NaOH. Each addition of glucose increased the concentration by
0.60 mM. Inset shows the calibration curve. Applied potential was 0.70 V
The very high sensitivity of the proposed sensor may be attributed to
the synergistic effect of two significant factors, (i) the unusual electrocatalytic
activity of the Cu(II)/Cu(III) redox couple making the electrode highly
sensitive and (ii) the fact that the rough surface with high electroactive surface
area specifically catalyses the oxidation of glucose. Further, from the good
linearity of current response it is evident that no electrode fouling occurred
due to the presence of oxidised product on the surface even after successive
addition of glucose in increased concentrations.
3.2.6. Effect of Interfering Species
Ascorbic acid, uric acid, dopamine and acetaminophen in biological
sample get easily oxidized at positive potential, and consequently these
biomolecules interfere with the detection of glucose. The physiological level
of glucose is much higher than that of the interfering species. Therefore, the
interference of these electroactive molecules was tested by adding 0.1 mM
interfering agents with 3 mM glucose solution successively into a constantly
62
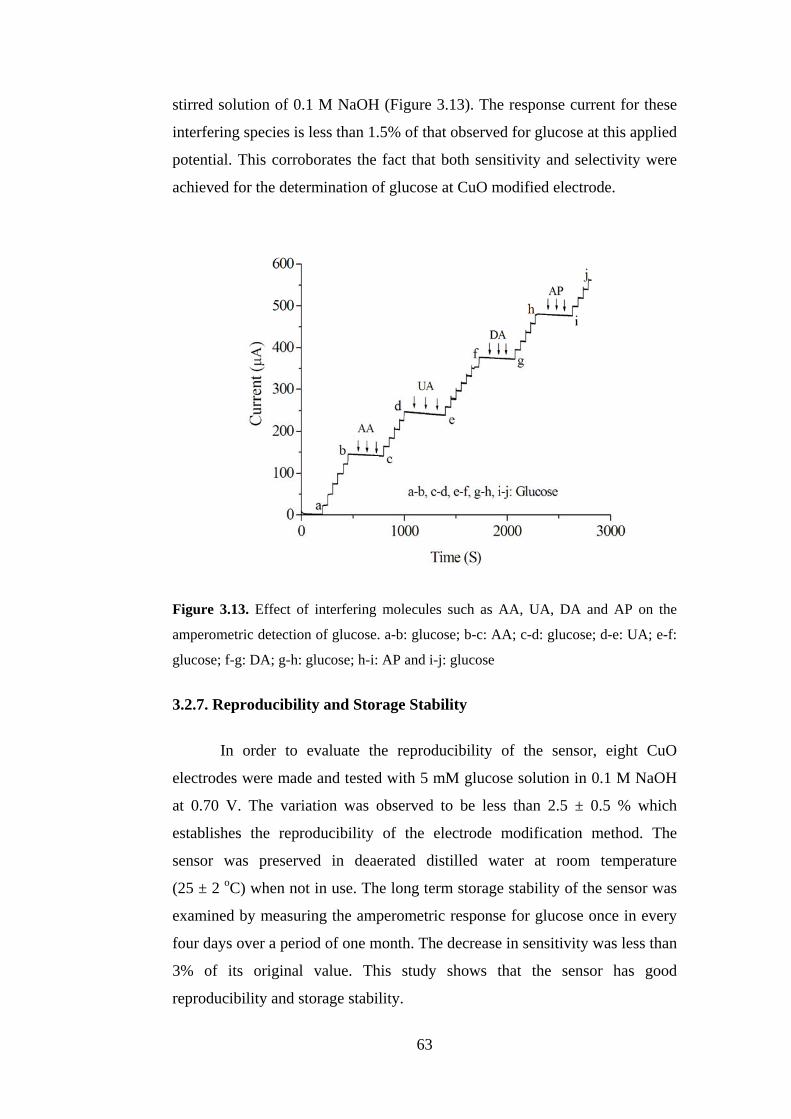
stirred solution of 0.1 M NaOH (Figure 3.13). The response current for these
interfering species is less than 1.5% of that observed for glucose at this applied
potential. This corroborates the fact that both sensitivity and selectivity were
achieved for the determination of glucose at CuO modified electrode.
Figure 3.13. Effect of interfering molecules such as AA, UA, DA and AP on the
amperometric detection of glucose. a-b: glucose; b-c: AA; c-d: glucose; d-e: UA; e-f:
glucose; f-g: DA; g-h: glucose; h-i: AP and i-j: glucose
3.2.7. Reproducibility and Storage Stability
In order to evaluate the reproducibility of the sensor, eight CuO
electrodes were made and tested with 5 mM glucose solution in 0.1 M NaOH
at 0.70 V. The variation was observed to be less than 2.5 ± 0.5 % which
establishes the reproducibility of the electrode modification method. The
sensor was preserved in deaerated distilled water at room temperature
(25 ± 2 oC) when not in use. The long term storage stability of the sensor was
examined by measuring the amperometric response for glucose once in every
four days over a period of one month. The decrease in sensitivity was less than
3% of its original value. This study shows that the sensor has good
reproducibility and storage stability.
63
3.2.8. Practical Applications
Blood serum samples were collected from a nearby clinical laboratory,
tested with the sensor developed and the results were compared with that
obtained by photometric method. The variation was small, within 2 ± 0.2%.
Since the development of the sensor involves a single process step and low
cost chemicals, this process is expected to be economically viable.
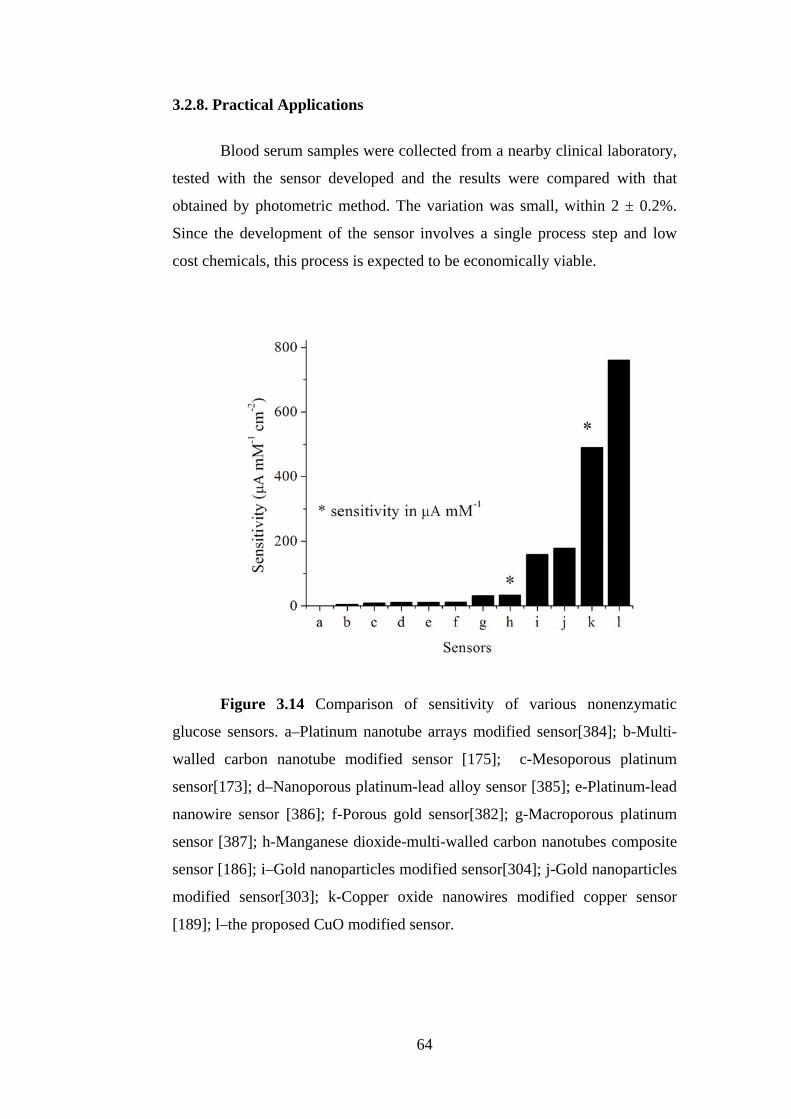
Figure 3.14 Comparison of sensitivity of various nonenzymatic
glucose sensors. a–Platinum nanotube arrays modified sensor[384]; b-Multi-
walled carbon nanotube modified sensor [175]; c-Mesoporous platinum
sensor[173]; d–Nanoporous platinum-lead alloy sensor [385]; e-Platinum-lead
nanowire sensor [386]; f-Porous gold sensor[382]; g-Macroporous platinum
sensor [387]; h-Manganese dioxide-multi-walled carbon nanotubes composite
sensor [186]; i–Gold nanoparticles modified sensor[304]; j-Gold nanoparticles
modified sensor[303]; k-Copper oxide nanowires modified copper sensor
[189]; l–the proposed CuO modified sensor.
64
65
Further, it is worth mentioning that the observed sensitivity in this
study was remarkably higher than that of similar non-enzymatic sensors
already reported (Figure 3.14).
3.3. Conclusion
Development of a non-enzymatic sensor for the determination of
glucose by a single step modification of copper in sodium potassium tartrate
solution is described in this chapter. SEM images showed that the modified
surface was rough. The electrocatalytic activity of the modified electrode was
evaluated using LSV and amperometry by injecting glucose solution into the
test solution. The response of the sensor towards glucose solution as well as
glucose in blood serum was good. The sensor has shown very good sensitivity,
selectivity, linearity, wide detection range, reproducibility and fast detection.


![The Mechanism of the Oxidation of Glucose by Bromine[1]](https://static.documents.pub/doc/80x56/56d6bf1e1a28ab301694ef8a/the-mechanism-of-the-oxidation-of-glucose-by-bromine1.jpg)

