Page 1
fcOl Admin. BWB.
NBSHUH MMKm«*• ^»
r""I l\l 1
1
Electrochemical
Analysis Section
Summary of Activities
July 1968 to June 1969
503
4c
z
<***T°F c
o,
\
\I/)
%eA u of*
U.S. DEPARTMENT OF COMMERCENational Bureau of Standards
Page 2
NATIONAL BUREAU OF STANDARDS
National Bureau of Standards ' was established by an act of Congress March 3, 1901 . Today,
in addition to serving as the Nation's central measurement laboratory, the Bureau is a principal
focal point in the Federal Government for assuring maximum application of the physical and
engineering sciences to the advancement of technology in industry and commerce. To this end
the Bureau conducts research and provides central national services in four broad program
areas. These are: (1) basic measurements and standards, (2) materials measurements and
standards, (3) technological measurements and standards, and (4) transfer of technology.
The Bureau comprises the Institute for Basic Standards, the Institute for Materials Research, the
Institute for Applied Technology, the Center for Radiation Research, the Center for Computer
Sciences and Technology, and the Office for Information Programs.
THE INSTITUTE FOR BASIC STANDARDS provides the central basis within the United
States of a complete and consistent system of physical measurement; coordinates that system with
measurement systems of other nations; and furnishes essential services leading to accurate and
uniform physical measurements throughout the Nation's scientific community, industry, and com-
merce. The Institute consists of an Office of Measurement Services and the following technical
divisions:
Applied Mathematics—Electricity—Metrology—Mechanics—Heat—Atomic and Molec-
ular Physics—Radio Physics -—Radio Engineering -—Time and Frequency -—Astro-
physics'-'—Cryogenics.-
THE INSTITUTE FOR MATERIALS RESEARCH conducts materials research leading to im-
proved methods of measurement standards, and data on the properties of well-characterized
materials needed by industry, commerce, educational institutions, and Government; develops,
produces, and distributes standard reference materials; relates the physical and chemical prop-
erties of materials to their behavior and their interaction with their environments; and provides
advisory and research services to other Government agencies. The Institute consists of an Office
of Standard Reference Materials and the following divisions:
Analytical Chemistry—Polymers—Metallurgy—Inorganic Materials—Physical Chemistry.
THE INSTITUTE FOR APPLIED TECHNOLOGY provides technical services to promote
the use of available technology and to facilitate technological innovation in industry and Gov-
ernment; cooperates with public and private organizations in the development of technological
standards, and test methodologies; and provides advisory and research services for Federal, state,
and local government agencies. The Institute consists of the following technical divisions and
offices:
Engineering Standards—Weights and Measures— Invention and Innovation — Vehicle
Systems Research—Product Evaluation—Building Research—Instrument Shops—Meas-
urement Engineering—Electronic Technology—Technical Analysis.
THE CENTER FOR RADIATION RESEARCH engages in research, measurement, and ap-
plication of radiation to the solution of Bureau mission problems and the problems of other agen-
cies and institutions. The Center consists of the following divisions:
Reactor Radiation—Linac Radiation—Nuclear Radiation—Applied Radiation.
THE CENTER FOR COMPUTER SCIENCES AND TECHNOLOGY conducts research and
provides technical services designed to aid Government agencies in the selection, acquisition,
and effective use of automatic data processing equipment; and serves as the principal focus
for the development of Federal standards for automatic data processing equipment, techniques,
and computer languages. The Center consists of the following offices and divisions:
Information Processing Standards—Computer Information— Computer Services— Sys-
tems Development—Information Processing Technology.
THE OFFICE FOR INFORMATION PROGRAMS promotes optimum dissemination and
accessibility of scientific information generated within NBS and other agencies of the Federal
government; promotes the development of the National Standard Reference Data System and a
system of information analysis centers dealing with the broader aspects of the National Measure-
ment System, and provides appropriate services to ensure that the NBS staff has optimum ac-
cessibility to the scientific information of the world. The Office consists of the following
organizational units:
Office of Standard Reference Data—Clearinghouse for Federal Scientific and Technical
Information :'—Office of Technical Information and Publications—Library—Office of
Public Information—Office of International Relations.
1 Headquarters and Laboratories at Gaithersburg, Maryland, unless otherwise noted: mailing address Washington, D.C 20234.
- Located at Boulder. Colorado 80302.3 Located at 5285 Port Royal Road. Springfield. Virginia 22151.
Page 3
UNITED STATES DEPARTMENT OF COMMERCEMaurice H. Stans, Secretary
NATIONAL BUREAU OF STANDARDS • A. V. Astin, Director
NBS TECHNICAL NOTE 503ISSUED AUGUST 1969
Nat. Bur. Stand. (U.S.), Tech. Note 503, 99 pages (Aug. 1969)
NBTNA
Electrochemical Analysis Section
Summary of Activities
July 1968 to June 1969
Edited by Roger G. Bates
Electrochemical Analysis Section
Analytical Chemistry Division
Institute for Materials Research
National Bureau of Standards
Washington, D.C. 20234
NBS Technical Notes are designed to supplement the
Bureau's regular publications program. They provide a
means for making available scientific data that are of
transient or limited interest. Technical Notes may be
listed or referred to in the open literature.
For sale by the Superintendent of Documents, U.S. Government Printing Office
Washington, D.C, 20402 - Price $1
Page 4
FOREWORD
The Analytical Chemistry Division was established as
a separate division at the National Bureau of Standards on
September 1, 1963, and became part of the Institute for
Materials Research in the February 1, 1964, reorganization.
It consists at present of nine sections and about 100 tech-
nical personnel encompassing some 57 different analytical
competences from activation analysis and atomic absorption
to vacuum fusion and x-ray spectroscopy. These competences,
and in turn the sections which they comprise, are charged
with research at the forefront of analysis as well as aware-
ness of the practical sample, be it standard reference
material or service analysis. In addition, it is their
responsibility to inform others of their efforts.
Formal publication in scientific periodicals is a highly
important output of our laboratories. In addition, however,
it has been our experience that informal, annual summaries
of progress describing efforts of the past year can be very
valuable in disseminating information about our programs.
A word is perhaps in order about the philosophy of these
yearly progress reports. In any research program a large
amount of information is obtained and techniques developed
which never find their way into the literature. This
includes the "negative results" which are so disappointing
and unspectacular but which can often save others consider-
able work. Of importance also are the numerous small items
which are often explored in a few days and which are not
important enough to warrant publication--yet can be of great
interest and use to specialists in a given area. Finally
there are the experimental techniques and procedures, the
designs and modifications of equipment, etc., which often
must be covered in only a line or two of a journal article.
11
Page 5
Thus our progress reports endeavor to present this
information which we have struggled to obtain and which we
feel might be of some help to others. Certain areas which
it appears will not be treated fully in regular publications
are considered in some detail here. Other results which are
being written up for publication in the journal literature
are covered in a much more abbreviated form.
At the National Bureau of Standards publications such
as these fit logically into the category of a Technical Note
In 1969 we plan to issue these summaries for all of our sec-
tions. The following is the fifth annual report on progress
of the Electrochemical Analysis Section.
W. Wayne Meinke, Chief
Analytical Chemistry Division
111
Page 6
PREFACE
This is the fifth annual progress report of the
Electrochemical Analysis Section of the Analytical Chemistry
Division. It covers the fiscal year 1969, which began on
July 1, 1968, and ended on June J>0, 1969
.
The Section concerns itself particularly with ionic
processes occurring in solution, with areas of analytical
measurement where ionic equilibria play a part, and with
the explanation of solution behavior in terms of the
interactions of ionic solutes with solvent molecules. The
special interests of the members of the Section lie for the
most part in solution electrochemistry, electrochemical
thermodynamics, and ionic transport phenomena. In the
context of modern analytical chemistry, their competences
bear most directly on potentiometry, electrometric titra-
tions, and conductometric analysis. In line with a uniform
policy of the Division, the Section's programs have both
research and sample aspects. During the fiscal year just
ending, about 40 percent of the total effort of the Section
was devoted to research and about 60 percent to the develop-
ment of standard reference materials.
The permanent staff of the Section remained at four
during the year. In addition, the Section enjoyed the
valuable services of Dr. Marinus Alfenaar of the University
of Utrecht from July until late September, when his tempo-
rary appointment was concluded. In October Dr. Harry P.
Thun of the University of Ghent arrived to spend a year in
the Section as a guest worker. Furthermore, the Section
was augmented during the summer months of 1968 by the
return of Edgar S. Etz and James T. Clark, Jr., and by the
presence of Robert S. Carter, a student at Landon School.
iv
Page 7
Both Mr. Etz and Mr. Clark are graduate students at Clarkson
College of Technology, where they are working under the
direction of Professor Donald Rosenthal. Professor Rosenthal
remains a consultant to the Section.
With a permanent staff of only four, it has obviously
been impossible to conduct a broad program in the electro-
chemistry of solutions. For this reason, the activity of
the past year has been limited to emf studies and conductance
measurements. Unlike the formal publications that appear in
the scientific journals, this report summarizes the total
program of the Section, incomplete studies as well as fin-
ished work, and stresses its relationship to the missions
of the Division and Institute.
In order to specify adequately the procedures, it has
been necessary occasionally to identify commercial materials
and equipment in this report. In no case does such identi-
fication imply recommendation or endorsement by the National
Bureau of Standards, nor does it imply that the material or
equipment identified is necessarily the best available for
the purpose.
The assistance of Mrs. Rosemary Maddock, Mrs. Marguerite
Raudenbush, and Robert J. Boreni in the preparation of this
report is gratefully acknowledged.
Roger G. Bates, Chief
Electrochemical Analysis Section
Washington, D.C.
June 30, 1969
v
Page 8
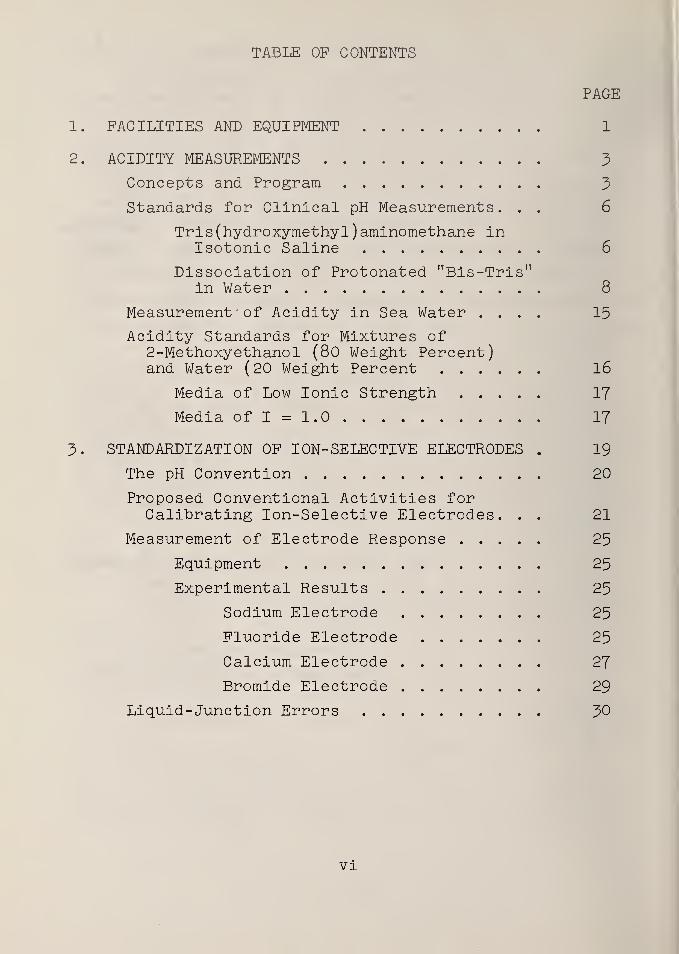
TABLE OF CONTENTS
1. FACILITIES AND EQUIPMENT
2. ACIDITY MEASUREMENTS
Concepts and Program
Standards for Clinical pH Measurements. .
Tri s ( hydroxymethy 1 ) aminomethane inIsotonic Saline
Dissociation of Protonated ,rBis-Tris"in Water
Measurement of Acidity in Sea Water . . .
Acidity Standards for Mixtures of2-Methoxyethanol (80 Weight Percent)and Water (20 Weight Percent
Media of Low Ionic Strength ....Media of I = 1.0
3. STANDARDIZATION OF ION-SELECTIVE ELECTRODES
The pH Convention
Proposed Conventional Activities forCalibrating Ion-Selective Electrodes. .
Measurement of Electrode Response ....Equipment
Experimental Results
Sodium Electrode
Fluoride Electrode
Calcium Electrode
Bromide Electrode
Liquid-Junction Errors
PAGE
1
6
8
15
16
17
17
19
20
21
25
25
25
25
25
27
29
30
vi
Page 9
PAGE
4. EQUILIBRIUM DATA FOR IONIC SYSTEMS 32
Dissociation of Phosphoric Acid inDeuterium Oxide 32
Measurement of the FirstDissociation Constant 32
Thermodynamic Quantities forthe Dissociation J>6
Deuterium Isotope Effects 37
First Dissociation Constant of PiperaziniumIon in 50 Weight Percent Methanol-WaterSolvent 4l
Dissociation of Protonated Tris (hydroxy
-
methyl)aminomethane in AqueousAlcoholic Solvents 43
Thermodynamics of Hydrochloric Acid inN-Methylpropionamide Solvents 46
Thermodynamics of Hydrochloric Acid inMixtures of 2-Methoxyethanol80 Weight Percent) and Water'20 Weight Percent) 49
Vapor Pressures of the Solvent .... 49
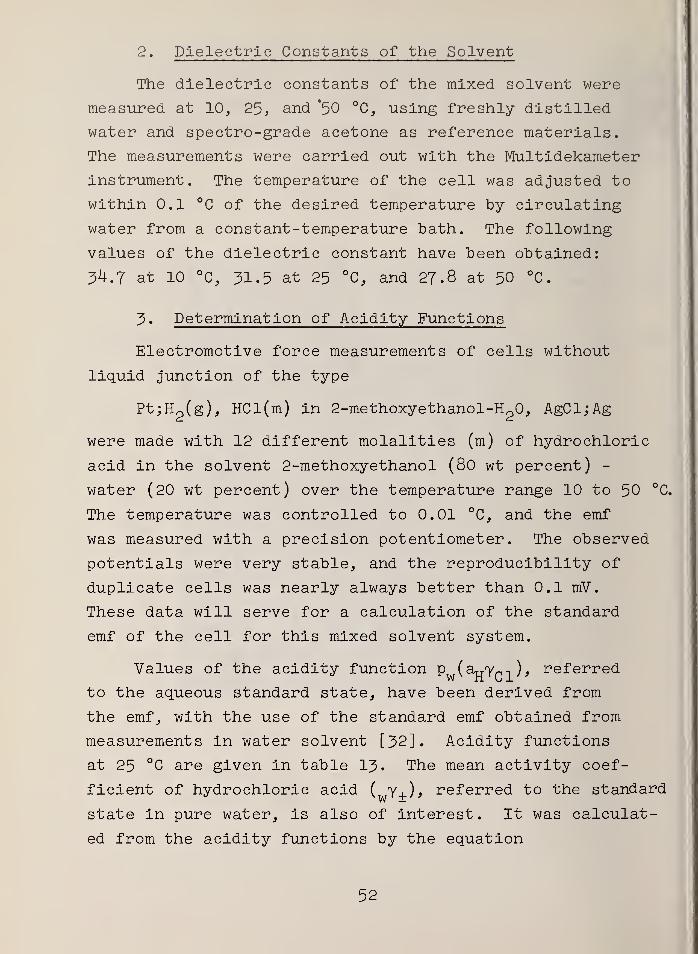
Dielectric Constants of the Solvent. . 52
Determination of Acidity Functions . . 52
5. OCEANOGRAPHIC CONDUCTANCE STANDARDS 55
Apparatus 55
Calibration of Cells 57
Conductance of Natural and SyntheticSea Water 62
6. PREPARATION AND PROPERTIES OF SOLVENTS ... 63
Dimethylformamide 63
2-Methoxyethanol 63
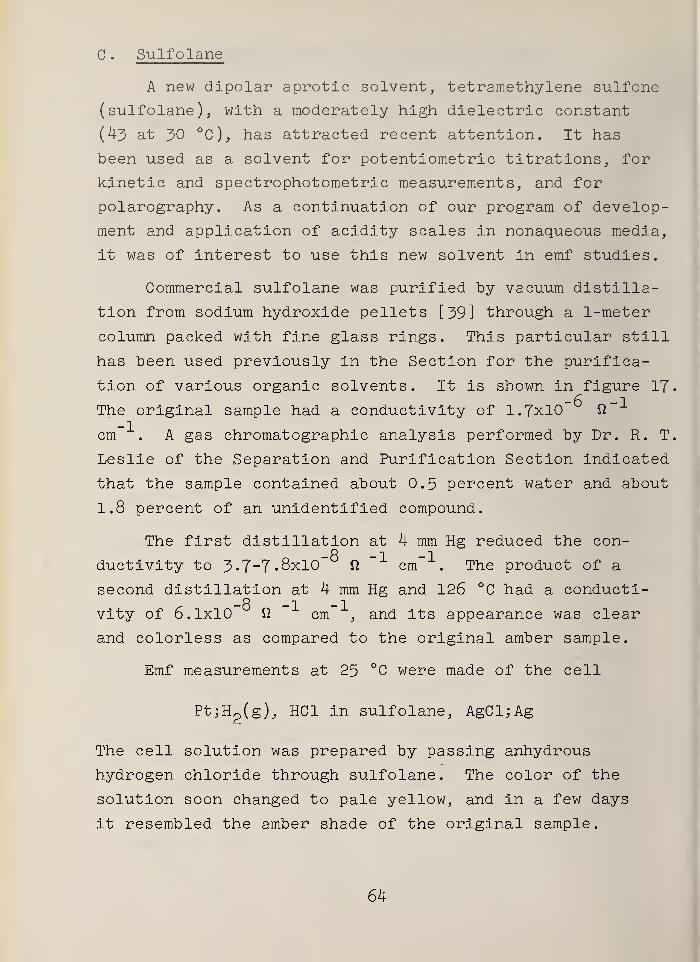
Sulfolane 64
Vll
Page 10
PAGE
7. STANDARD REFERENCE MATERIALS ACTIVITY .... 67
Summary f . 67
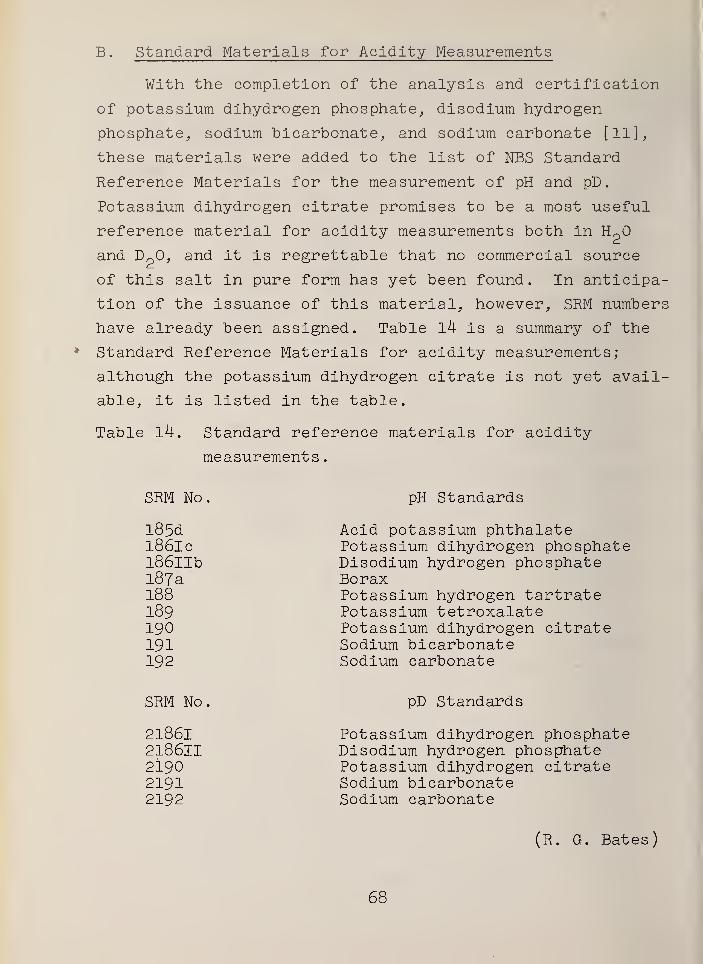
Standard Materials for AcidityMeasurements 68
Standard Materials for ConductivityMeasurements 69
Acidimetric Assay of Bilirubin 70
General Considerations 70
Conductance Measurements 71
Emf Titrations 71
A Standard for Ion-Selective Electrodes . . 75
8. FOREIGN-CURRENCY PROGRAMS 76
9. IMPACT OF SECTION'S ACTIVITIES 77
10. PERSONNEL 78
11. COMMITTEE MEMBERSHIPS 79
12. PUBLICATIONS AND MANUSCRIPTS, JULY 1968TO JUNE 1969 80
13. TALKS, JULY 1968 TO JUNE I969 82
14. LIST OF REFERENCES 85
viii
Page 11
LIST OP FIGURES
FIGURE NO. PAGE
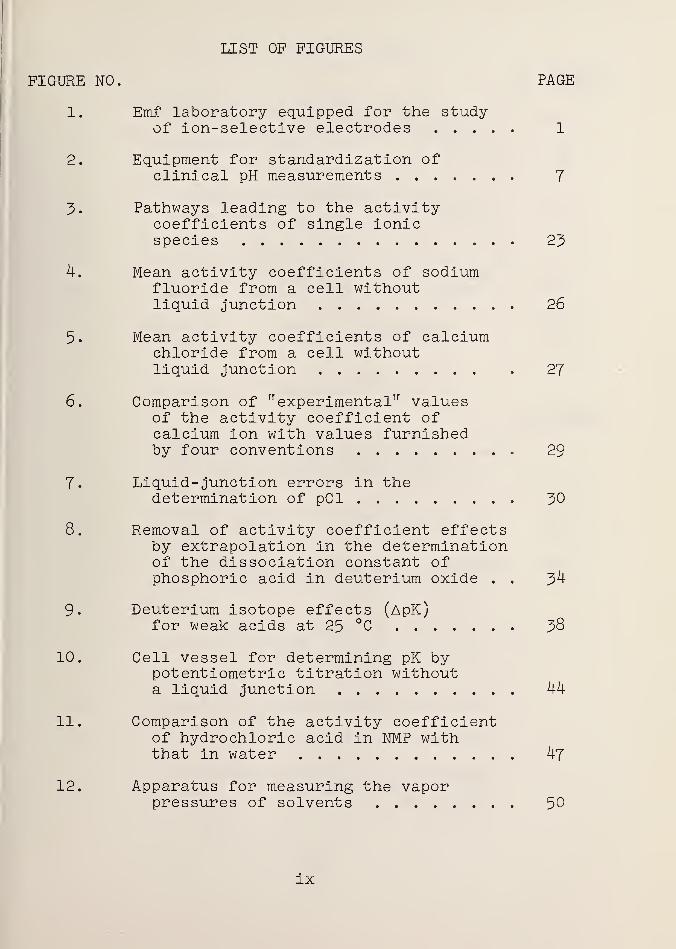
1. Emf laboratory equipped, for the studyof ion-selective electrodes 1
2. Equipment for standardization ofclinical pH measurements 7
3. Pathways leading to the activitycoefficients of single ionicspecies 23
4. Mean activity coefficients of sodiumfluoride from a cell withoutliquid junction 26
5. Mean activity coefficients of calciumchloride from a cell withoutliquid junction . 27
6. Comparison of "experimental" valuesof the activity coefficient ofcalcium ion with values furnishedby four conventions 29
7. Liquid- junction errors in thedetermination of pCl 30
8. Removal of activity coefficient effectsby extrapolation in the determinationof the dissociation constant ofphosphoric acid in deuterium oxide . . 34
9. Deuterium isotope effects (ApK)for weak acids at 25 °C 38
10. Cell vessel for determining pK bypotentiometric titration withouta liquid junction 44
11. Comparison of the activity coefficientof hydrochloric acid in NMP withthat in water 47
12. Apparatus for measuring the vaporpressures of solvents 50
IX
Page 12
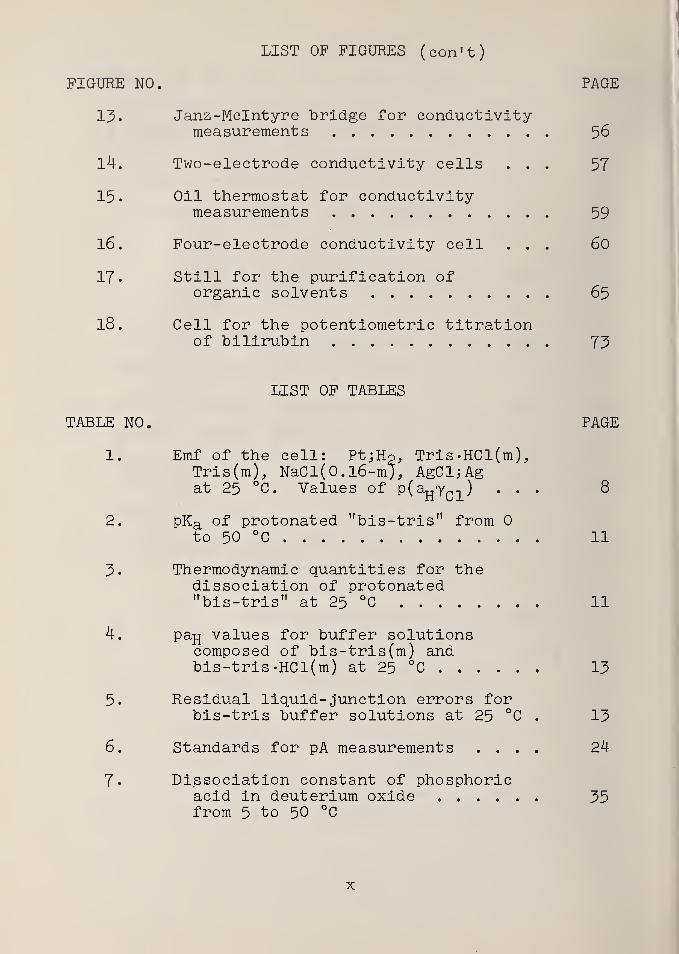
LIST OP FIGURES (con't)
FIGURE NO.
13.
14.
15.
16.
17.
18.
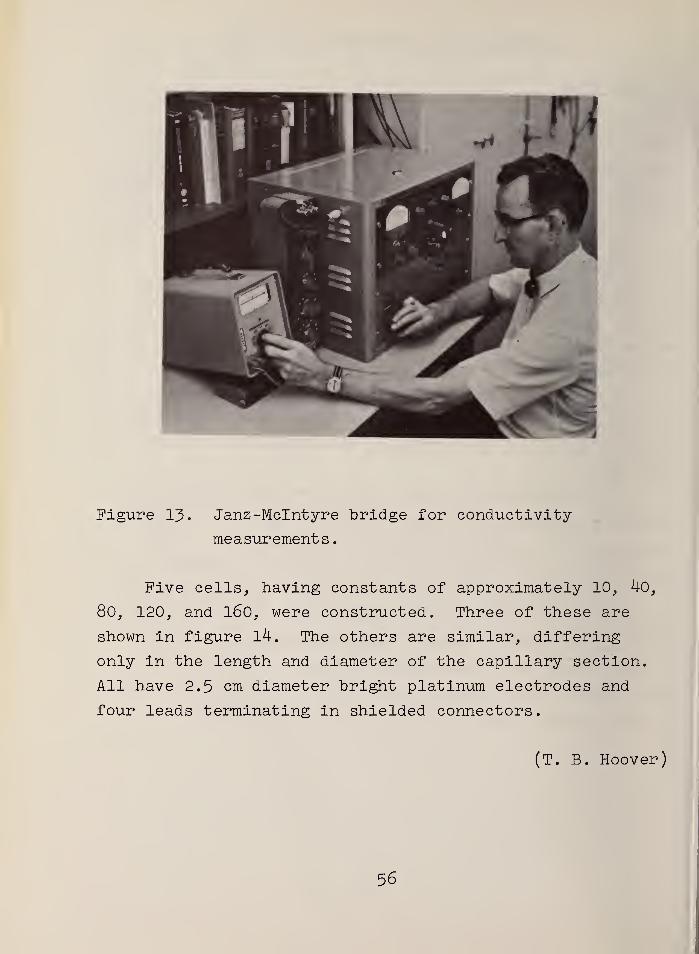
Janz-Mclntyre bridge for conductivitymeasurements
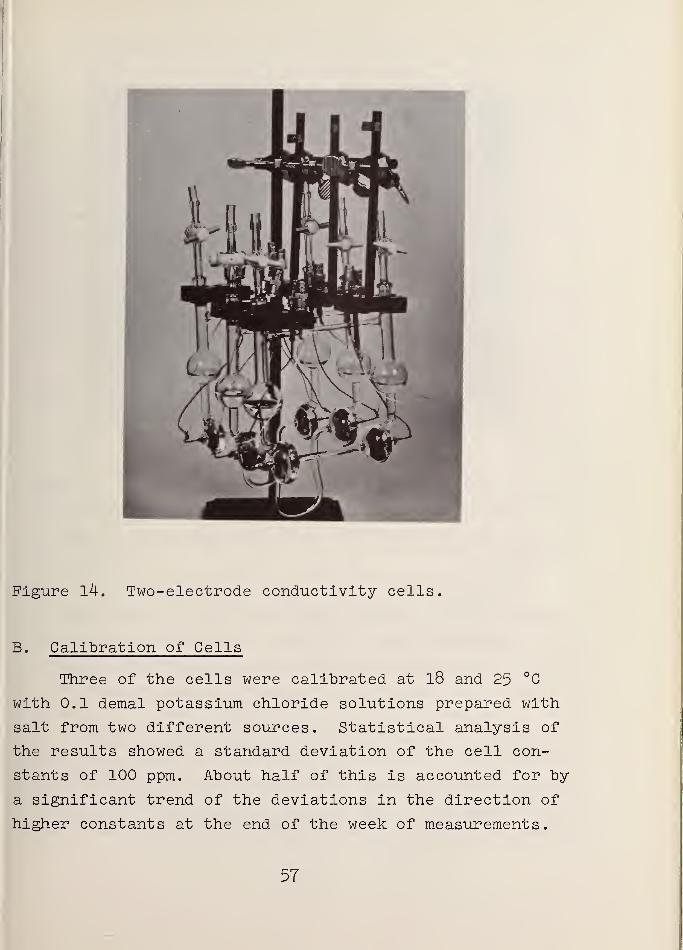
Two-electrode conductivity cells . .
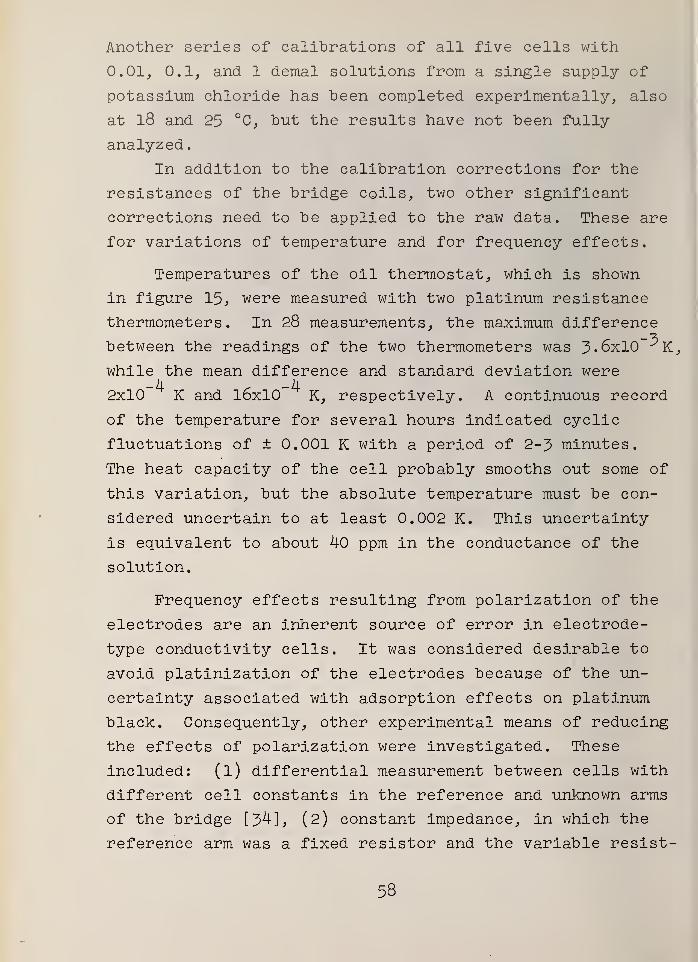
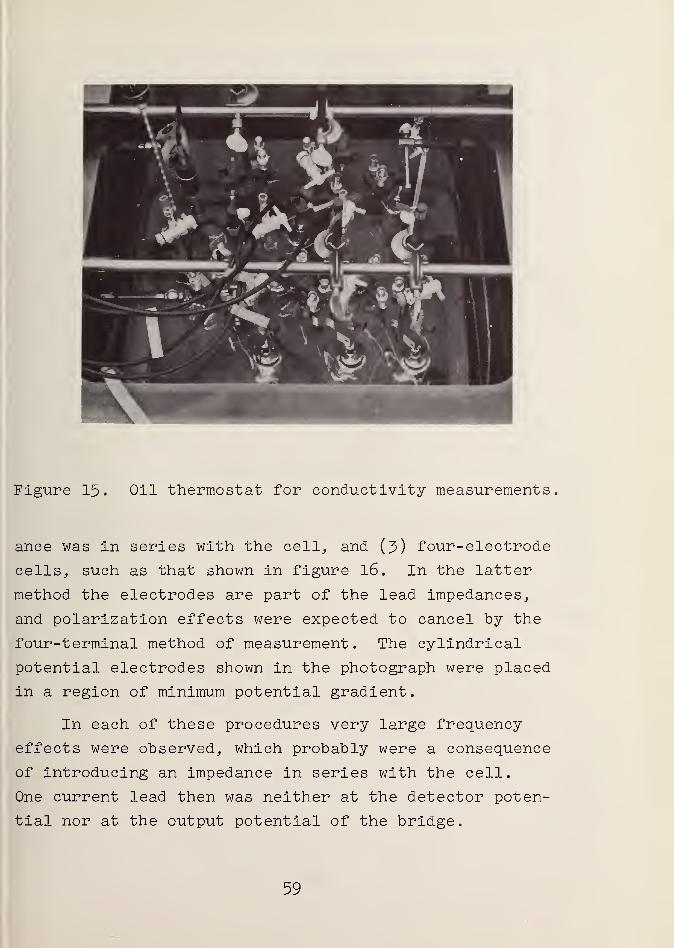
Oil thermostat for conductivitymeasurements
Four-electrode conductivity cell . .
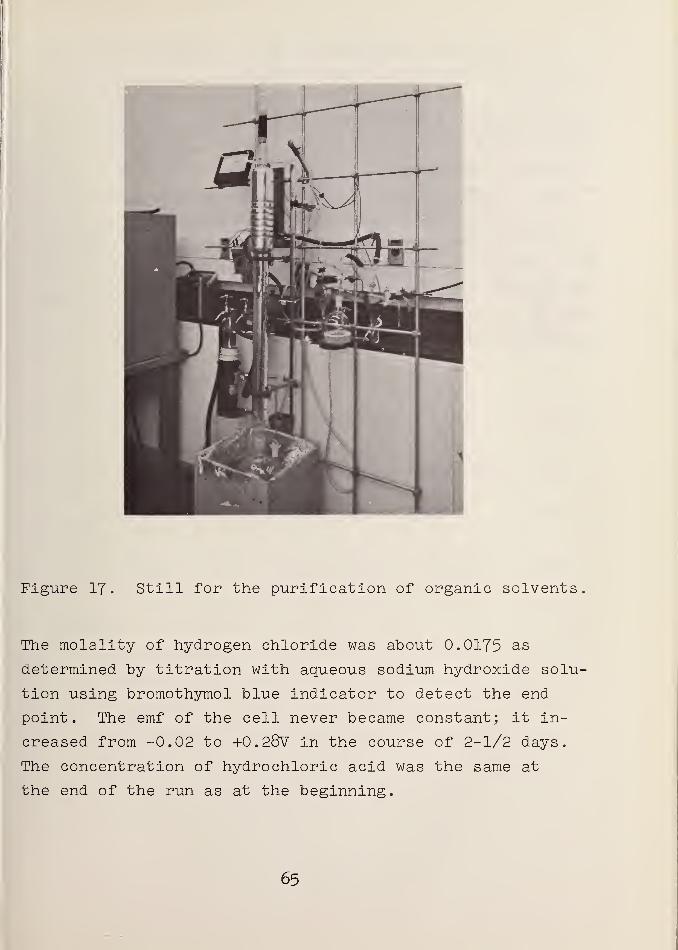
Still for the purification oforganic solvents
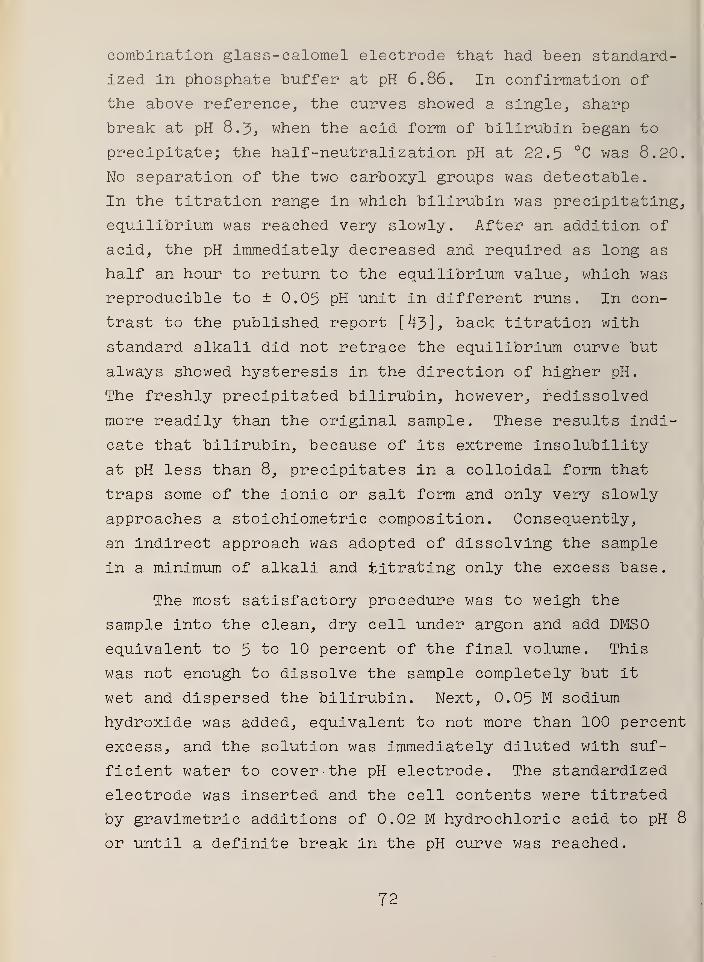
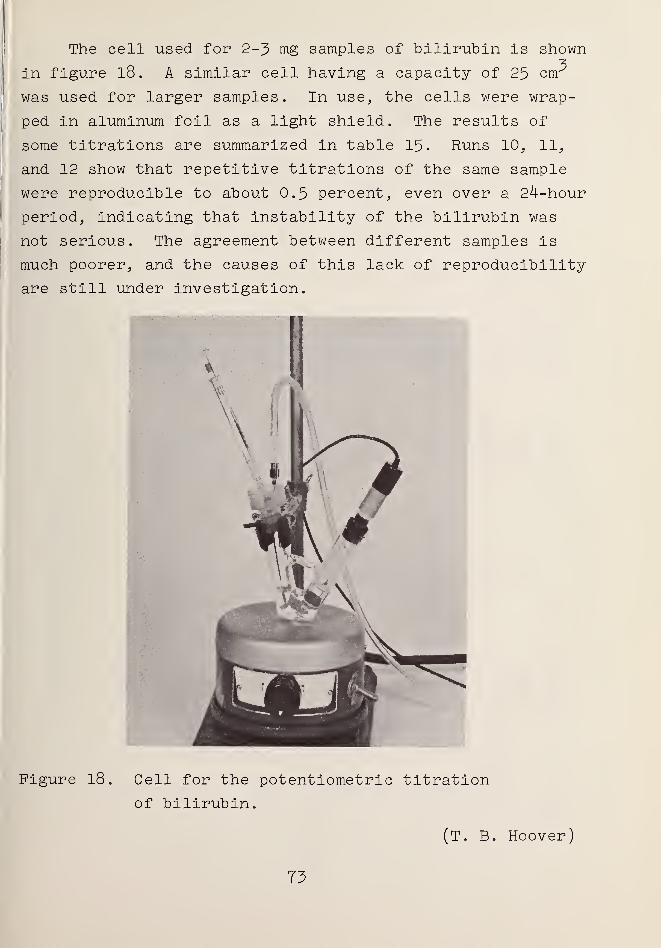
Cell for the potentiometric titrationof bilirubin
PAGE
56
57
59
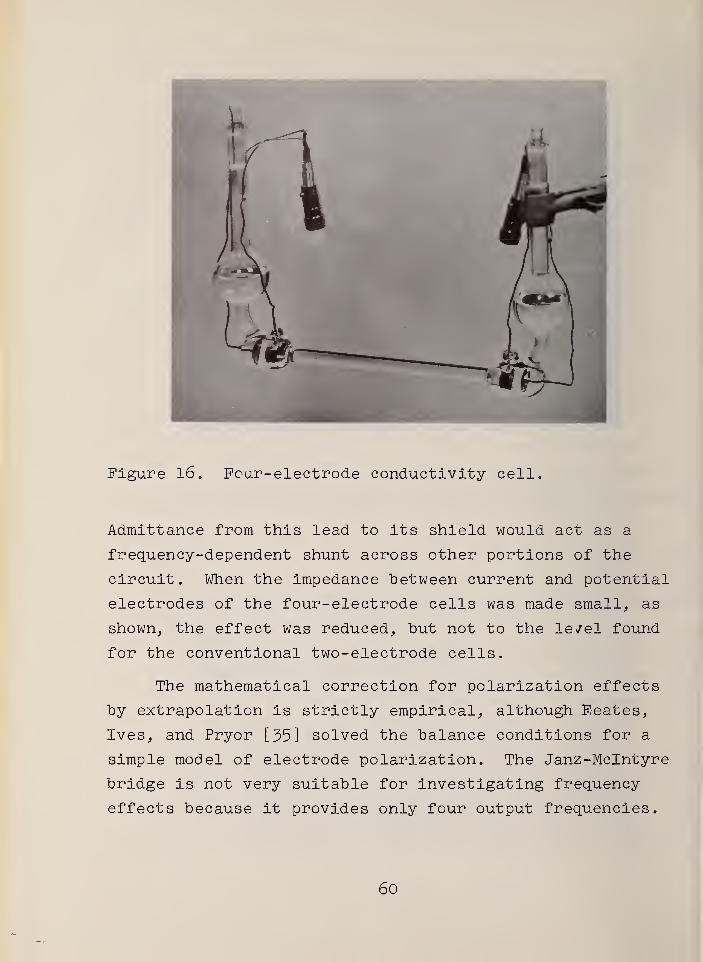
60
65
73
LIST OF TABLES
TABLE NO.
1. Emf of the cell: Pt;Ho, Tris-HCl(m),Tris(m), NaCl(0.l6-m), AgCljAgat 25 °C. Values of P(aHYcl ) . .
2. pKa of protonated Tfbis-tris" fromto 50 °C
3. Thermodynamic quantities for thedissociation of protonatedrrbis-tris u at 25 °C
4. pajj values for buffer solutionscomposed of bis-tris(m) andbis-tris-HCl(m) at 25 °C
5. Residual liquid- junction errors forbis-tris buffer solutions at 25 °C
6. Standards for pA measurements . . .
7. Dissociation constant of phosphoricacid in deuterium oxidefrom 5 to 50 °C
PAGE
8
11
11
13
13
24
35
x
Page 13
LIST OP TABLES (con't)
TABLE NO. PAGE
8. Thermodynamic constants for thedissociation of phosphoric acidin deuterium oxide and waterat 25 °C 36
9. Deuterium isotope effect on thethermodynamic constants for thedissociation of weak acids at 25 °C . 40
10. Values of p( K) for the dissociationof protonatied weak bases in 50 wt %methanol-water at 25 °C and relatedsolvent effects 42
11. pK values for tris«H+ in 50 wt %aqueous alcohols 45
12. Vapor pressures of a mixture of2-methoxyethanol (80 wt %) andwater (20 wt %) from 10 to 50 °C . . 51
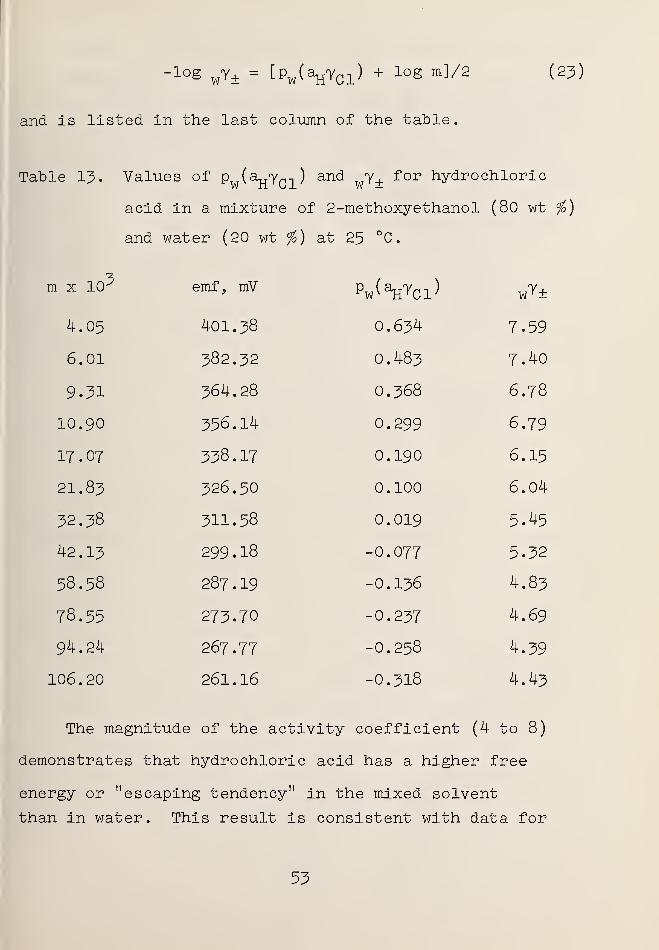
13. Values of Pw (ajjYQ]_) and WY± forhydrochloric acid in a mixtureof 2-methoxyethanol (80 wt %)and water (20 wt %) at 25 °C .... 53
14. Standard reference materials foracidity measurements 68
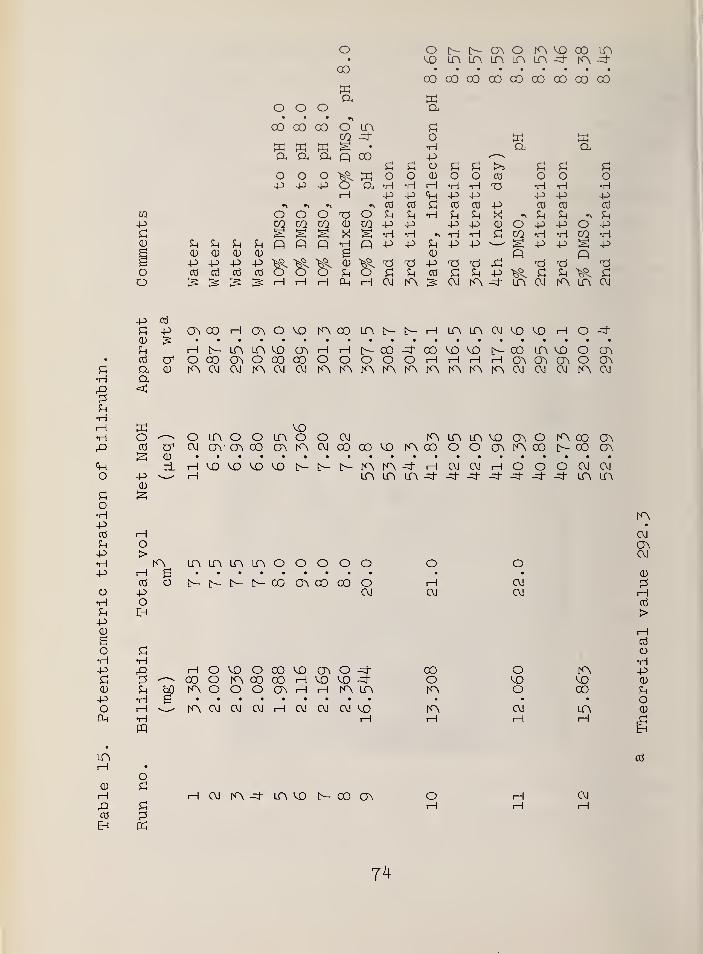
15. Potentiometric titration of bilirubin . 74
xl
Page 14
ELECTROCHEMICAL ANALYSIS SECTION: SUMMARY OF ACTIVITIES,
JULY 1968 TO JUNE 1969
Edited by Roger G. Bates
ABSTRACT
This survey of the activities of the Electrochemical
Analysis Section, Analytical Chemistry Division, covers
the period July 1968 to June 1969 . An attempt is made to
summarize a year's progress on the technical projects of
the Section, to indicate the composition and capabilities
of the unit as a whole, and to stress the Section's role
in the mission of the Institute. Brief summaries of several
lines of work under way are given. The concept of a broad
program on acidity measurements is outlined, and new efforts
to provide assistance in clinical acid-base measurements are
summarized. Progress toward reference standards for the
calibration of ion-selective electrodes is reported.
Equilibrium data for phosphoric acid in heavy water, for
piperazinium ion in 50 wt % methanol-water, and for hydro-
chloric acid in a solvent composed of 2-methoxyethanol
(80 wt %) and water (20 wt %) have been obtained. Consider-
able effort has been devoted to the development of new
standard reference materials, including standards for con-
ductivity measurements. Lists of publications, talks, and
committee assignments of staff members are given.
Key Words
Acidity, Analysis, Conductivity, Electrochemical analysis,
Electrochemistry of solutions, Ionic activity, Ion-selective
electrodes, pD measurements, pH measurements, Medium effects,
Solvent effects, Standard reference materials
xi:
Page 15
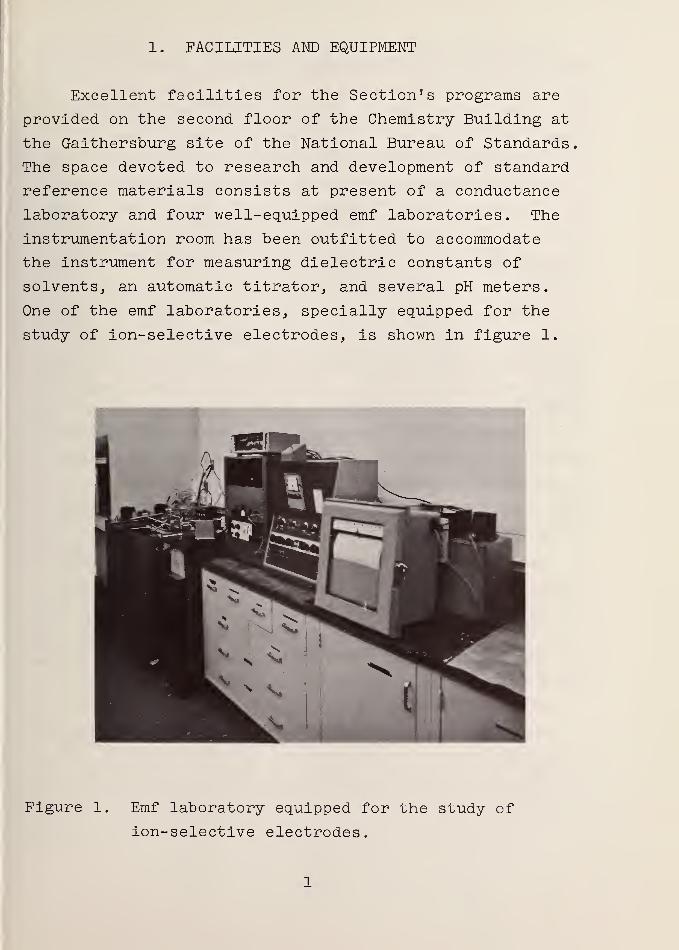
1. FACILITIES AND EQUIPMENT
Excellent facilities for the Section's programs are
provided on the second floor of the Chemistry Building at
the Gaithersburg site of the National Bureau of Standards
The space devoted to research and development of standard
reference materials consists at present of a conductance
laboratory and four well-equipped emf laboratories. The
instrumentation room has been outfitted to accommodate
the instrument for measuring dielectric constants of
solvents, an automatic titrator, and several pH meters.
One of the emf laboratories, specially equipped for the
study of ion-selective electrodes, is shown in figure 1.
Figure 1. Emf laboratory equipped for the study of
ion-selective electrodes.
Page 16
During the year, one of the four emf laboratories was
devoted to studies of acid-base behavior in nonaqueous and
mixed solvents. A second was devoted to work in deuterium
oxide with deuterium gas electrodes and to the study of
aqueous buffer systems of clinical interest. Investigations
of ion-selective electrodes were conducted in a third, while
a fourth, in use only during the summer months, was given
over to studies of acid-base processes in sea water. The
highly precise equipment for the measurement of conductivity
was used throughout the year in establishing conductivity
standards for oceanographic purposes.
This emf installation is sufficiently large to justify
an automatic data read-out center capable of recording
automatically and simultaneously the emf of all the cells
under study in each of the laboratories. A multichannel
digital voltmeter with an accuracy of 10 |j,V is needed. It
would be coupled to a print-out unit from which a record
of all the emf data could be obtained and, when desired,
a tape could also be produced for computer analysis.
Measurements of all cells at desired intervals could be
programmed in advance.
Because of staff limitations, it has not yet been
possible to initiate work on the accurate measurement of
pH at high temperatures and pressures or to supplement our
present capability with calorimetric studies of ionic
processes in solution. When these types of work are begun,
additional facilities and equipment will be needed.
(R. G. Bates)
Page 17
2. ACIDITY MEASUREMENTS
A. Concepts and Program
The measurement of acidity continues to be one of the
major concerns of the Section. The concepts and approaches
of our efforts in this area were set forth in the annual
progress reports for 1966 [1] and 1967 [2],
The NBS pH scale is fixed by a series of standard
reference solutions chosen to cover uniformly that region
of the scale in which the emf of the pH cell is a linear
function of the pH of the solution in which the electrodes
are immersed. Corrections are made, if necessary, for
imperfections in the response of the glass electrode. Un-
like the pH scale of the British Standards Institution [J>]
,
which recognizes only a single primary standard, the NBS
approach permits a series of primary reference solutions.
The search for new and better standards is going on contin-
ually. A new standard may be selected because it extends
the useful range of the standard scale or because it shows
a stability superior to those of existing standards in its
pH range
.
The pD scale in heavy water bears the same fundamental
relationship to the deuterium gas electrode that the pH
scale bears to the hydrogen gas electrode. Basically,
the phenomena which are regarded as a manifestation of
"acidity" in these two media can be attributed to two dis-
tinctly different entities, namely the deuterium ion and
the hydrogen ion. For this reason, the pD scale is not
related to the pH scale. The same methods can nonetheless
be utilized for establishing acidity standards in deuterium
oxide as have been used to set up pH standards in ordinary
water.
Page 18
During the past year, two new standards for the pH
scale and three standards which fix a practical pD scale in
deuterium oxide were described in published papers [4,5].
The new pH standard solutions contain potassium dihydrogen
citrate (0.05 molal) and a mixture of sodium bicarbonate
and sodium carbonate (each 0.025 molal). Solutions of the
same salts in the same molalities, prepared in deuterium
oxide, serve as pD standards, together with a mixture of
potassium dideuterium phosphate and disodium deuterium
phosphate (each 0.025 molal). Sodium bicarbonate and sodium
carbonate were added to the list of Standard Reference
Materials. The citrate, phosphate, and carbonate salts
serve equally well for preparing pD and pH standard solu-
tions; exchange of hydrogen for deuterium when the protium
salts are dissolved in heavy water alters the acidity so
slightly that it causes no concern. A source of pure potas-
sium dihydrogen citrate in quantity is still being sought.
The extension of the pH concept to media other than
pure water has received considerable attention in the
Section during the past few years. Solvent effects on
acidity are not only of great theoretical interest but have
an important bearing on the behavior of equilibrium systems
of analytical interest. Practical acidity scales in non-
aqueous and partly aqueous solvents would, for example,
greatly facilitate the study of metal complexation with a
variety of ligands that are themselves proton donors or
acceptors. As a guest worker in the Section, Dr. Harry P.
Thun is turning his attention to the establishment of a
useful acidity scale for a mixed solvent system with which
a range of dielectric constants can be achieved. For this
study, mixtures of 2-methoxyethanol (methylcellosolve) and
water were chosen. This work is aimed at setting up stan-
dard scales for the measurement of acidity at low ionic
4
Page 19
strengths in these mixed solvents and also in media of
ionic strength 1.0 (l molal with respect to sodium
perchlorate) . Complexation studies are often conducted
in media of a constant, rather high, ionic strength in
order to minimize changes in activity coefficients. It
is therefore useful to have available secondary acidity
standards in special solvent media of this sort.
With the increased attention being given to clinical
measurements, secondary standards for other media of
special significance to biomedicine are assuming impor-
tance in the Section's future plans. Of most immediate
concern is isotonic saline, or 0.16M sodium chloride.
Preliminary work in this medium has already begun. These
studies parallel closely the work in sea water which has
been conducted at a relatively low level during the past
two years
.
(R. G. Bates)
Page 20
B. Standards for Clinical pH Measurements
1 . Tris(hydroxymethyl)aminomethane in Isotonic Saline
Acidity measurements in biological media with glass
electrodes, standardized in the usual aqueous reference
buffer solutions, often involve a considerable error due
to the change in liquid- junction potential when the glass
electrode is transferred from the relatively dilute standard
buffer to a medium of higher ionic strength. This source of
error can be minimized or eliminated by developing a new set
of reference buffers in a medium of a composition close to
that of the biologic fluid. Furthermore, buffer solutions
of this sort are very useful for pH control in biomedical
research
.
A sodium chloride solution with a constant total ionic
strength of . 16 (isotonic saline) approximates closely the
colligative properties of blood plasma. Tris(hydroxymethyl)-
aminomethane (tris, THAM) has been selected tentatively as
the first pH standard in this new medium. Emf measurements
of the cell
PtjH2 (g),
Tris-HCl(m), Tris(m), NaCl (0.l6-m), AgCljAg
were made from to 50 °C . The concentration of free base
was kept equal to that of the hydrochloride, and enough
sodium chloride was added to make the total ionic strength
equal to 0.16. The molality of the base was varied from
0.005 to 0.05 rnol kg . The acidity function p(aHYp. )
was derived from the measured emf E of the cell, and
its variation with buffer composition was studied. The
following equation was used:
Page 21
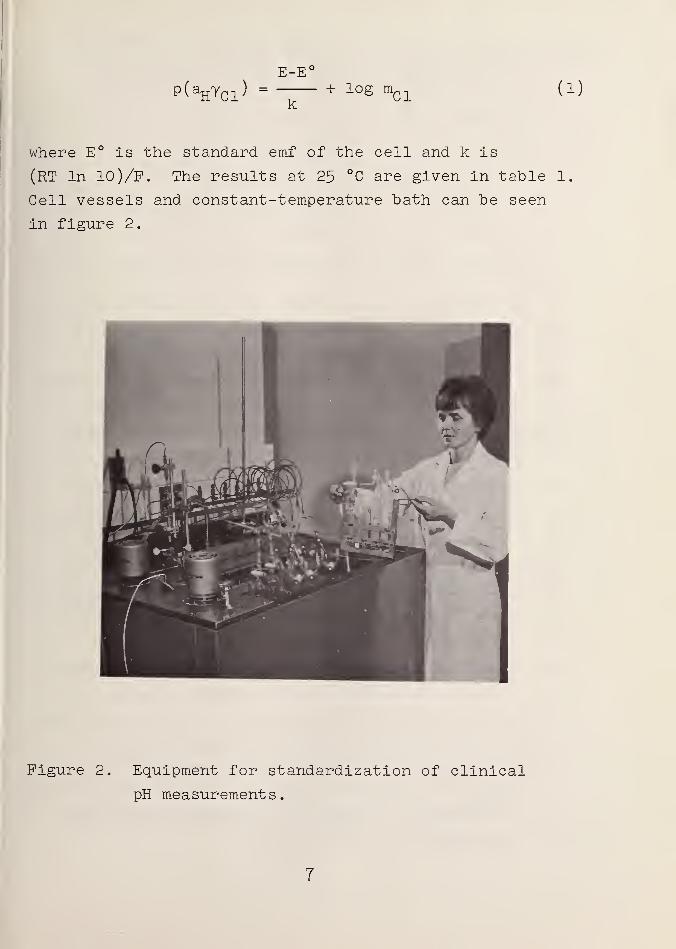
E-Ep(aHYcl ) = + log mcl (1)
where E° is the standard emf of the cell and k is
(RT In 10)/F. The results at 25 °C are given in table 1.
Cell vessels and constant-temperature bath can be seen
in figure 2.
Figure 2. Equipment for standardization of clinical
pH measurements.
7
Page 22
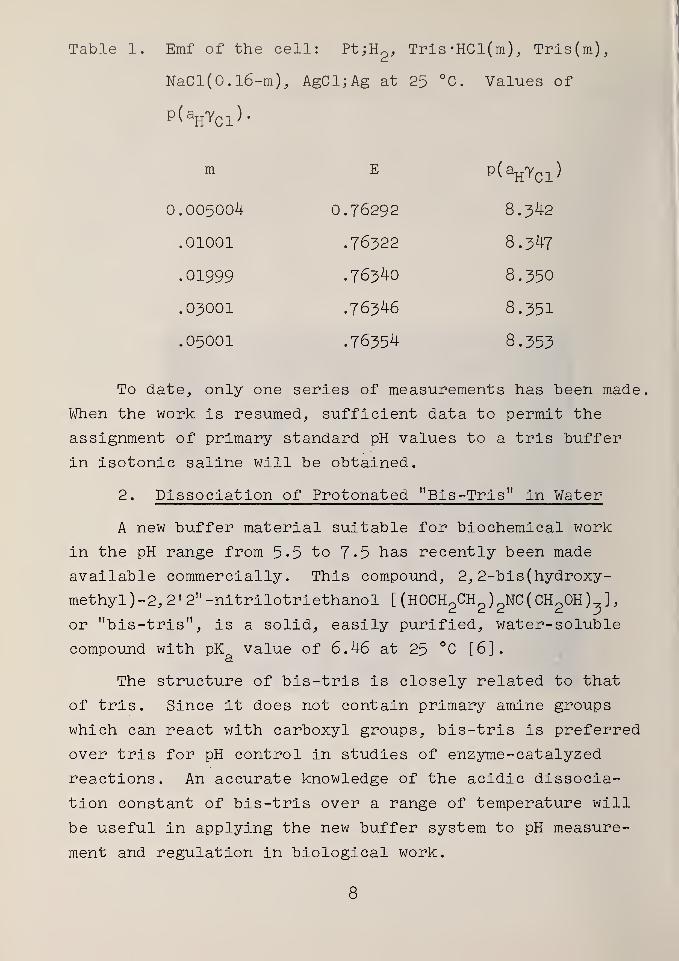
Table 1. Emf of the cell: Pt;H"2 , Tris-HCl(m), Tris(m),
NaCl(0.l6-m), AgCl;Ag at 25 °C. Values of
p(aHYcl ).
m E PCagYd
0.005004 0.76292 8.342
.01001 .76322 8.3^7
.01999 .763^0 8.350
.0^001 .76^46 8.351
.05001 .76354 8.353
To date, only one series of measurements has been made
When the work Is resumed, sufficient data to permit the
assignment of primary standard pH values to a tris buffer
in isotonic saline will be obtained.
2. Dissociation of Protonated "Bis-Tris" in Water
A new buffer material suitable for biochemical work
in the pH range from 5. 5 to 7-5 has recently been made
available commercially. This compound, 2, 2-bis (hydroxy
-
methyl ) -2, 2'
2" -nitrilotriethanol [ (H0CH2CH
2 ) 2NC ( CH
20H ), ]
,
or "bis-tris", is a solid, easily purified, water-soluble
compound with pK value of 6.46 at 25 °C [6].a
The structure of bis-tris is closely related to that
of tris. Since it does not contain primary amine groups
which can react with carboxyl groups, bis-tris is preferred
over tris for pH control in studies of enzyme-catalyzed
reactions. An accurate knowledge of the acidic dissocia-
tion constant of bis-tris over a range of temperature will
be useful in applying the new buffer system to pH measure-
ment and regulation in biological work.
8
Page 23
Bis-tris was purified by recrystallization from abso-
lute ethanol (assay 99*98 percent as determined by potentio-
metric titration). An attempt to prepare the bis-tris
hydrochloride by passing anhydrous hydrogen chloride gas
into a solution of bis-tris dissolved in methanol yielded
a product whose chloride content was only 99.80 percent of
the theoretical. For this reason, the solutions used for
the emf measurements of the cell
Pt;Hp(g), Bis-Tris-HCl(m), Bis-Tris(m), AgCljAg
was prepared from bis-tris and a standard solution of
hydrochloric acid. The molality (m) of the free base was
kept equal to that of the hydrochloride salt; m was varied
from 0.01 to 0.1 mol kg" . The temperatures at which the
measurements were made ranged from to 50 °C.
The emf of the cell is related to the dissociation
constant of protonated bis-tris by the equation
(E-E°)F m^ + 7BT+ YC1-pK = + log mri - + log -2±- + log J2± ±±- (2)
2.3026 RT L' ± mBT YBT
where E° is the standard emf of the cell. The "apparent"
dissociation constant pK' is defined as follows:* a
2AIpK
a= p^ci) T7 (5)
i+Bai1/cf
where A and B are the Debye-Huckel constants, I is the
total ionic strength, and a is the ion-size parameter.
For these measurements, the buffer ratio was unity,
and hydrolysis of the buffer substances was negligible.
Page 24
The true value of pK is equal to pK* at 1=0; it was obtain-a a
ed by extrapolating values of pK1 to zero ionic strength,a
using the method of least squares. Table 2 lists the ex-
perimental pK values together with the a values which gavea
the smallest standard deviation (a) for pK .
The method of least squares was also used to express
)K as aa
the equation
the pK as a function of absolute temperature according toa
pK = - + B + CT (4)a
<J>
Between and 50 °C, pK is given bya
pK = 12&7.855/T + 2.7905 - 0.00210396T (5)a
Standard changes of enthalpy, entropy, and heat capacity
in the dissociation of protonated bis-tris were derived
from the constants of equation 5, and the values at 25 °C
are summarized in table ~$
.
10
Page 25
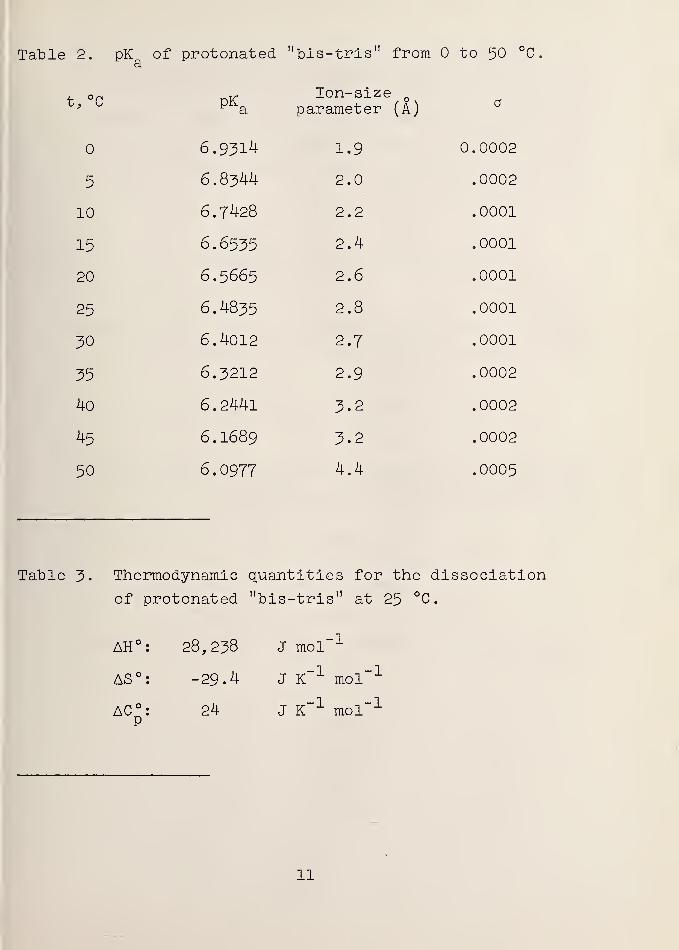
Table 2. pK of protonated "bis-tris" from to 50 °C
.
a
t, °c ^KaIon-size
parameter (A) a
6.9314 1.9 0.0002
5 6.8^44 2.0 .0002
10 6.7428 2.2 .0001
15 6.6535 2.4 .0001
20 6.5665 2.6 .0001
25 6.4835 2.8 .0001
30 6.4012 2.7 .0001
35 6.3212 2.9 .0002
40 6.2441 3.2 .0002
45 6.1689 3.2 .0002
50 6.0977 4.4 .0005
Table 3. Thermodynamic quantities for the dissociation
of protonated "bis-tris" at 25 °C.
AH°: 28,238 J mol-1
AS°: -29.4 J K"1 mol" 1
AC : 24 J K"1 mol
-1
11
Page 26
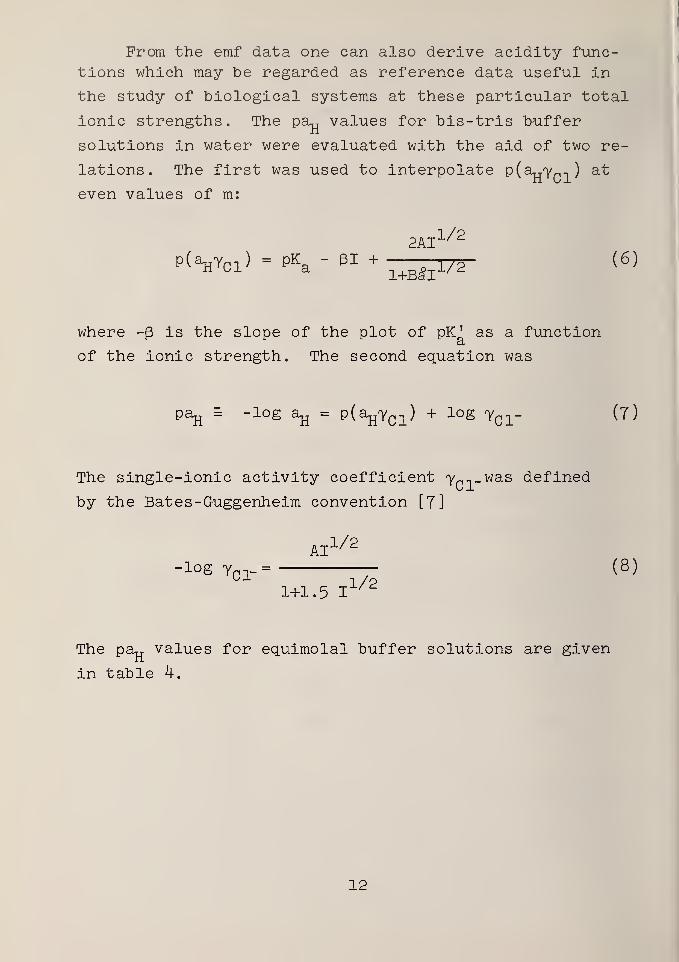
From the emf data one can also derive acidity func-
tions which may be regarded as reference data useful in
the study of biological systems at these particular total
ionic strengths. The pa^ values for bis-tris buffer
solutions in water were evaluated with the aid of two re-
lations. The first was used to interpolate p(aRyr,-, ) at
even values of m:
1/22AI x
p(¥ci' = pKa " BI +
1+Bill/2 (6)
where -B is the slope of the plot of pK ' as a functiona
of the ionic strength. The second equation was
pajj = -log ajj = p(aH7cl ) + log yc1
- (7)
The single-ionic activity coefficient y^-was defined
by the Bates-Guggenheim convention [7]
Ml/2
-los ^cr=
7JZ(8)
1+1.5 I
The pa^ values for equimolal buffer solutions are given
in table 4.
12
Page 27
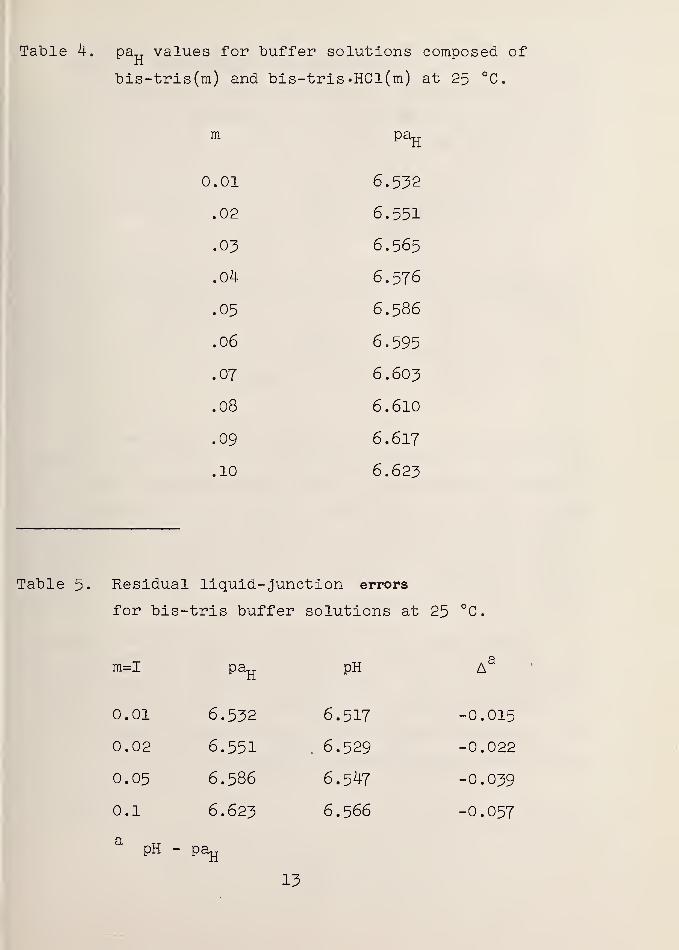
Table 4. pa„ values for buffer solutions composed of
bls-tris(m) and bis-trls .HCl(m) at 25 °C.
m paH
0.01 6.532
.02 6.551
.03 6.565
.04 6.576
.05 6.586
.06 6.595
.07 6.603
.08 6.610
.09 6.617
.10 6.623
Table 5. Residual liquid- junction errors
for bis-trls buffer solutions at 25 °C.
m=I paH
0.01 6.532
0.02 6.551
0.05 6.586
0.1 6.623
pH - pa^
pH A3
6.517 -0.015
6.529 -0.022
6.547 -0.039
6.566 -0.057
13
Page 28
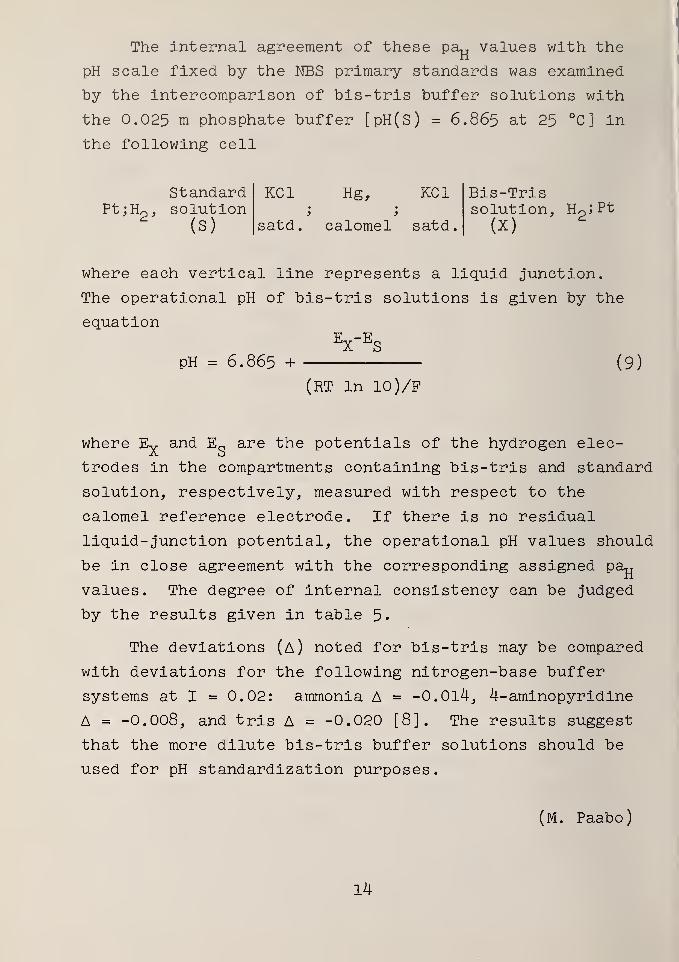
The internal agreement of these pa^ values with the
pH scale fixed "by the NBS primary standards was examined
by the intercomparison of bis-tris buffer solutions with
the 0.025 m phosphate buffer [pH(S) = 6.865 at 25 °C ] in
the following cell
StandardPt;H , solution
2(s)
KC1 Hg, KC1
satd. calomel satd.
Bis-Trissolution, H j Ft
(x)
where each vertical line represents a liquid junction.
The operational pH of bis-tris solutions is given by the
equation
pH = 6.865 + (9)
(RT In 10)/P
where E^ and E~ are the potentials of the hydrogen elec-
trodes in the compartments containing bis-tris and standard
solution, respectively, measured with respect to the
calomel reference electrode. If there is no residual
liquid- junction potential, the operational pH values should
be in close agreement with the corresponding assigned pa^
values. The degree of internal consistency can be judged
by the results given in table 5.
The deviations (a) noted for bis-tris may be compared
with deviations for the following nitrogen-base buffer
systems at I = 0.02: ammonia A = -0.014, 4-aminopyridine
A = -0.008, and tris A = -0.020 [8], The results suggest
that the more dilute bis-tris buffer solutions should be
used for pH standardization purposes.
(M. Paabo)
14
Page 29
C . Measurement of Acidity In Sea Water
This work has as its objective the development of
standards for pH measurements in media approximating sea
water in composition. These reference standards would be
used to adjust pH equipment for the accurate determination
of hydrogen ion concentration or activity in oceanographic
studies. Materials for the preparation of the standards
would be made available through the Standard Reference
Materials program.
During the reporting year, this project was active in
the Section only during the summer months which James T.
Clark, Jr., spent at NBS as a guest worker. During the
academic year, Mr. Clark continued the work as part of his
graduate program at Clarkson College of Technology.
Electromotive force data for the cell
PtjH2
, HC1 in SSW, AgCljAg
at several concentrations of synthetic sea water (SSW) have
now been obtained at 5* 15* 25* and 35 °C. The molality of
hydrochloric acid was varied over a sufficiently wide range
to allow the standard potentials for the cell to be obtain-
ed by the usual extrapolation procedure. The data are now
being analyzed with the aid of a computer.
Amine buffer systems have been chosen as secondary
standards for sea water, in order to avoid undesirable
interactions occurring with phosphates, borates, and other
organic buffer materials. The emf measurements which will
lead to a certification of the pH of a buffer solution
composed of tris(hydroxymethyl)aminomethane and its hydro-
chloride in SSW have been started.
(R. G. Bates)
15
Page 30
D. Acidity Standards for Mixtures of 2-Methoxyethanol
(80 Weight Percent) and Water (20 Weight Percent)
Nonaqueous solvents and mixtures of organic solvents
with water are becoming of increasing interest to com-
plexation chemists. Indeed, many promising organic ligands
cannot be investigated in aqueous solutions as they are
too insoluble in water. Of the many organic solvents avail-
able, few meet the chief requirements of stability with
time and acidity, ability to dissolve many organic and
inorganic compounds, sufficiently high dielectric constant,
and a high boiling point. In addition, ease of purifica-
tion is of the utmost importance. As the overwhelming
majority of stability data for complexes have been obtained
through emf measurements, mainly pH measurements, it be-
comes urgent to establish reliable standard buffer solutions
in suitable solvents.
After unsuccessful experiments with dimethylformamide
were concluded (see Section 6. A), attention was given to
2-methyoxyethanol, known commercially as methylcellosolve.
This liquid is an extremely good solvent with a high boil-
ing point (123.4 °C). It has low hygroscopicity and is
readily miscible with water. As it has a rather low die-
lectric constant (16.0 at 25 °C), it seemed preferable to
start the investigation with mixtures of the solvent with
water. The mixture containing 80 wt percent of the organic
solvent seemed particularly attractive as the dissociation
constants of a number of organic compounds had already been
determined in this mixture by Simon, Heilbronner, and their
co-workers [9,10].
16
Page 31
1. Media of Low Ionic Strength
Insofar as the ligands are acids or salts of organic
acids, most measurements intended for the determination
of stability constants are carried out in the region pH 2
to 6. Moreover, most complexation chemists work in media
of constant ionic strength, most frequently using sodium
perchlorate or lithium perchlorate as inert electrolytes.
Even in media of low ionic strength, therefore, the usual
NBS standard buffers cannot be used, as most of them con-
tain potassium ions which cause the precipitation of in-
soluble potassium perchlorate. Hence, two new buffer
solutions will be examined, namely O.O^M oxalic acid +
0.016M sodium oxalate, and 0.025M sodium dihydrogen
phosphate + 0.025M disodium hydrogen phosphate, both in an
80 wt percent 2-methoxyethanol - 20 wt percent water solvent.
For both buffers, the pH(S) will be determined in the same
way as for other NBS buffers, namely through emf measure-
ments in cells without liquid junction, together with the
Bates-Guggenheim convention (equation 8) for the activity
coefficient of the chloride ion.
2. Media of I = 1.0
Inasmuch as most stability constants are determined
in media of high ionic strength, very often I = 1.0, it
will be of importance to assign pH(s) values to buffers of
ionic strength I = 1.0. The same two buffer solutions
selected for low ionic strengths will be used, and the
ionic strengths will be adjusted to 1.0 by the addition of
suitable quantities of sodium perchlorate. The pH(s)
values can be obtained in three different ways:
a. through comparison with the primary NBS buffers
in cells with a liquid junction,
17
Page 32
b. through comparison with the buffers described in
the previous section, also in cells with a liquid junction,
and
c. through measurements in cells without liquid
junction after choice of a reasonable convention for the
activity of the chloride ion in 1M solutions of sodium
perchlorate. In essence, procedures a and b will lead
to secondary pH standards, while c will yield primary
standards. In work under way, these three approaches will
be examined in detail.
(H. P. Thun)
18
Page 33
5. STANDARDIZATION OF ION-SEIECTIVE ELECTRODES
Recent progress in the development of a variety of
commercial ion-selective electrodes has given the chemist
access to the reasonably selective determination, by
electrochemical methods, of an ever-expanding number of
individual ionic species. The application, seemingly
unlimited, that these electrodes may have in the fields
of chemistry and biology, in industry and in the clinical
laboratory emphasizes the pressing need for standardization
methods and standard reference materials for use with ion-
selective electrodes.
A proposed method of standardization, based on the same
concepts used in the standardization of pH (hydrogen ion
activity), was outlined in the last progress report [11]
and in a lecture presented at the Symposium on Ion-Selective
Electrodes held at NBS Gaithersburg, January J>0 and Jl,
1969, and soon to be published [12]. This procedure is
being recommended because of the wide acceptance of the
convention used to arrive at the practical activity of the
hydrogen ion in fixing NBS standard pH scale. The conven-
tion entailed in the definition of the NBS standard pH scale
is reasonable as well as consistent with the response of the
glass electrode and other practical electrochemical sensors.
It is the purpose of the present line of investigation
to demonstrate how the pH convention can be extended to a
variety of activity standards for ion-selective electrodes.
There are, however, several sources of error which influence
this measurement of ionic activity. These errors, which
include imperfect response of the electrodes, variation of
potential with time or other influences (stirring, etc.),
and errors due to liquid- junction potentials, are the
subject of study in the Section.
(B. R. Staples)
19
Page 34
A. The pH Convention
The convention on which a practical pH scale has been
based is discussed in detail in a host of previous publica-
tions. The proposed method of adapting the convention to
provide activity scales for ion-selective electrodes will
be described in the sections to follow.
For pH assignment, the emf of a cell without liquid
junction is measured and an acidity function p(aTjYf,
1) is
evaluated from it (see equation l):
P(aHYcl ) = -log(mH+YH+Ycl -) (10)
The activity of the hydrogen ion in a chloride-free
buffer solution is formally related to the acidity function
in the limit of rru-^O by
paH
= p(aHYcl
)° + log yc1_ (ll)
The paH is then calculated by introducing a convention [7]
f°r?C1-
:
_AI l/2log Yci-
=77i
(12)
1+1.5 i '
The operational pH value for an "unknown" solution X
is defined in terms of a reference standard pH(S), and the
values of the emf of a pH cell containing the standard (E„)
and the unknown (EY ) byEy-Eq
pH(X) = pH(S) + (13)(RT In 10)/P
In the NBS standardization procedure, the conventional pa„
values obtained as described above for selected buffer
solutions are identified with pH(s) in the operational
definition (equation 13).
(B. R. Staples)
20
Page 35
B. Proposed Conventional Activities for Calibrating
Ion-Selective Electrodes
The experimental arrangement by which "pA" measure-
ments with an electrode selective for the ion A are made
is entirely analogous to that for pH measurements. The
electrode is usually combined with a suitable reference
electrode such as a calomel electrode in a cell with liquid
junction:
Electrode (sel. for A), Soln. x| Bridge, Reference Electrode
where the liquid junction is indicated by a vertical line.
It is reasonable, therefore, to define operational pA
values in the same manner that operational pH values are
defined. If the ion A is a cation with n unit charges
(EY-E )nPPA(X) - PA(S) +
R/lnS
10(14)
and if A is an anion with n unit charges
(EY-E q )nFPA(X) = PA(S) -
X S(15)
RT In 10
The only difference between equations 14 and 15 is the
sign of the last term.
21
Page 36
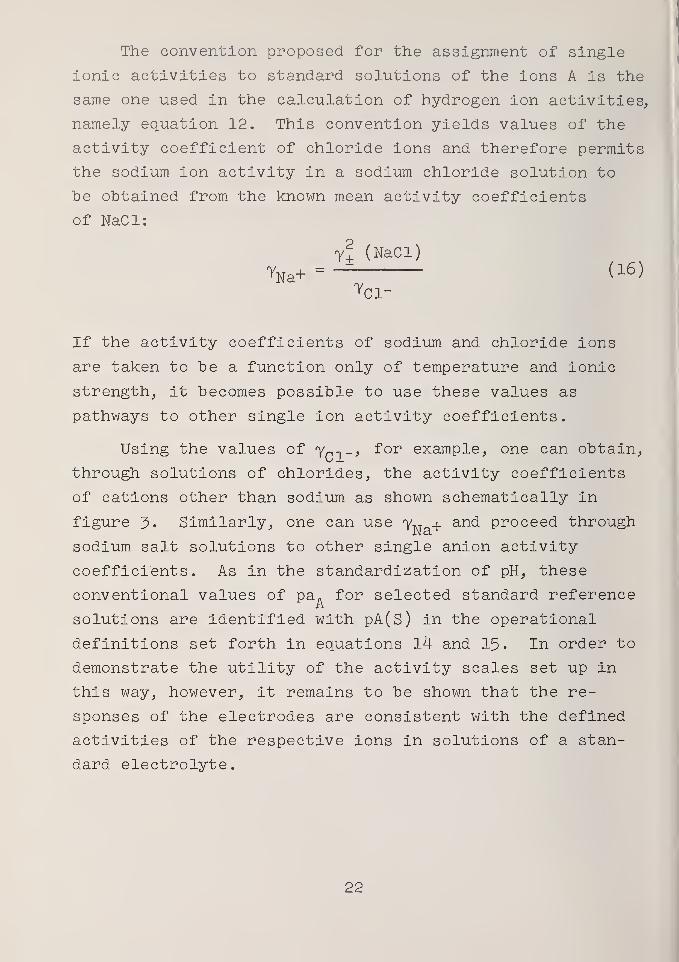
The convention proposed for the assignment of single
ionic activities to standard solutions of the ions A is the
same one used in the calculation of hydrogen ion activities,
namely equation 12. This convention yields values of the
activity coefficient of chloride ions and therefore permits
the sodium ion activity in a sodium chloride solution to
be obtained from the known mean activity coefficients
of NaCl:
Y+ (NaCl)
Wh--= ( l6 )NaYd-
If the activity coefficients of sodium and chloride ions
are taken to be a function only of temperature and ionic
strength, it becomes possible to use these values as
pathways to other single ion activity coefficients.
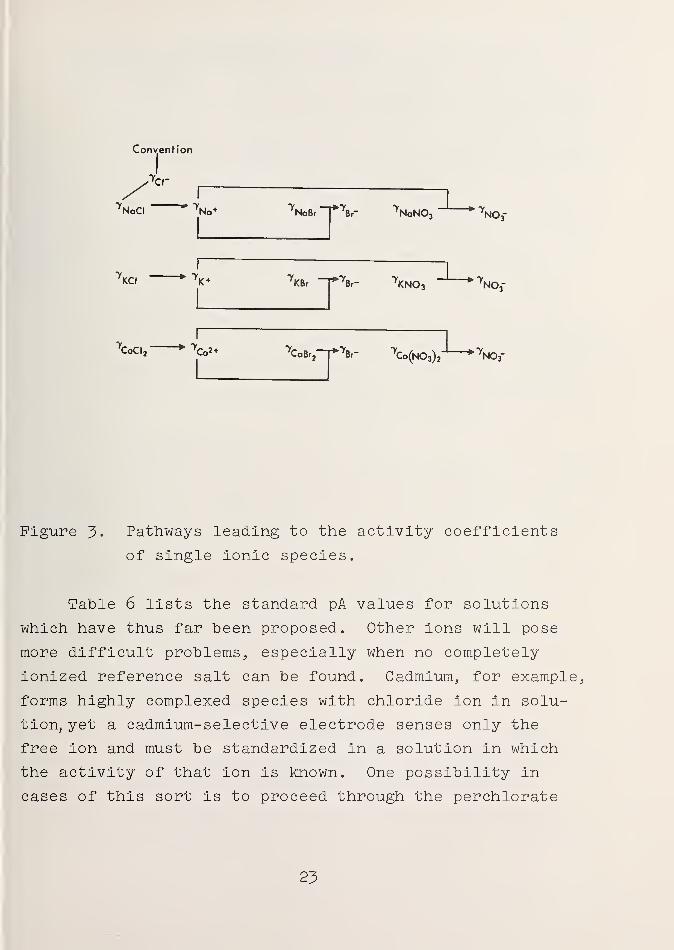
Using the values of y„,_, for example, one can obtain,
through solutions of chlorides, the activity coefficients
of cations other than sodium as shown schematically in
figure 5- Similarly, one can use Y-vra+ and proceed through
sodium salt solutions to other single anion activity
coefficients. As in the standardization of pH, these
conventional values of pa„ for selected standard reference
solutions are identified with pA(s) in the operational
definitions set forth in equations 14 and 15 . In order to
demonstrate the utility of the activity scales set up in
this way, however, it remains to be shown that the re-
sponses of the electrodes are consistent with the defined
activities of the respective ions in solutions of a stan-
dard electrolyte.
22
Page 37
Convention
*•>,NO,"
'KCI *\*'KBr
"7Br- ^KNCh
-*7NO,
'CoCI, rCa2 + V
CaBr2~T*"7Br-
7Ca(N03)2
"' * 7N03-
Figure j5. Pathways leading to the activity coefficients
of single ionic species.
Table 6 lists the standard pA values for solutions
which have thus far been proposed. Other ions will pose
more difficult problems, especially when no completely
ionized reference salt can be found. Cadmium, for example,
forms highly complexed species with chloride ion in solu-
tion, yet a cadmium-selective electrode senses only the
free ion and must be standardized in a solution in which
the activity of that ion is known. One possibility in
cases of this sort is to proceed through the perchlorate
23
Page 38
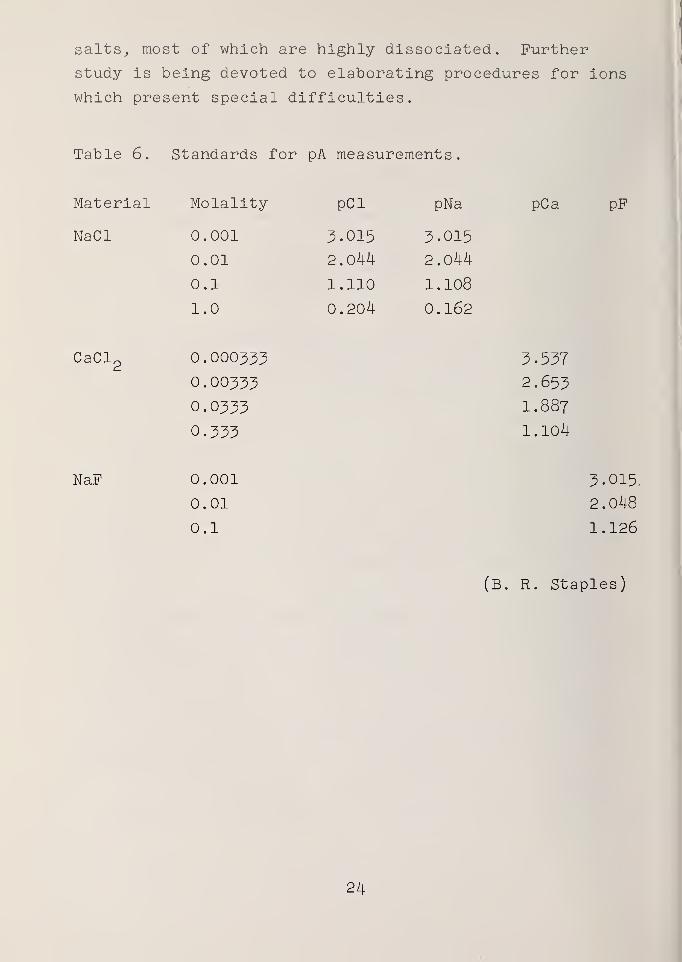
salts, most of which are highly dissociated. Further
study is being devoted to elaborating procedures for ions
which present special difficulties.
Table 6. Standards for pA measurements.
pPMateri al Molality pCl pNa pCa
NaCl 0.001 3.015 3.015
0.01 2.044 2.044
0.1 1.110 1.108
1.0 0.204 0.162
CaCl2
0.000333
0.00333
0.0333
3.537
2.653
I.887
0.333 1.104
NaF 0.001 3.015.
0.01 2.048
0.1 1.126
(B. R. Staples)
24
Page 39
C. Measurement of Electrode Response
1. Equipment
The apparatus for measuring the emf of cells containing
ion-selective electrodes was shown in figure 1 (Section l).
It consists of a vibrating-reed electrometer and a precision
potentiometer which opposes the emf from the electrometer.
The small difference in emf, usually 1 mV or less, is then
amplified and displayed on a strip-chart recorder. It is
hoped that a digital voltmeter with a degree of computer
control may be obtained in the future.
2. Experimental Results
To date, all of the ion-selective electrodes have shown
a nearly ideal response, i.e., a Nernstian slope when the
emf of the cell is plotted as a function of the single ion
activity.
a. Sodium Electrode
Measurements with the sodium glass electrode, Corning
NAS 11-18, were described previously [11]. The electrode
was found to respond ideally in sodium chloride solutions-4
of concentrations from 10 M to 1 M. Its response was
measured in a cell without liquid junction Na(gl); NaCl(m),
AgCl;Ag, where m is molality. The measurements in sodium
fluoride solutions, described below, depend for their in-
terpretation on the demonstrated Nernstian behavior of the
sodium glass electrode.
b. Fluoride Electrode
The potential of the fluoride electrode, Orion Model
94-09 (lanthanum fluoride type), was measured against each
of the sodium glass electrodes and a saturated calomel
electrode of the fiber type at temperatures of 10, 25, and
40 °C and in a concentration range from 10" M to 1.0 M.
25
Page 40
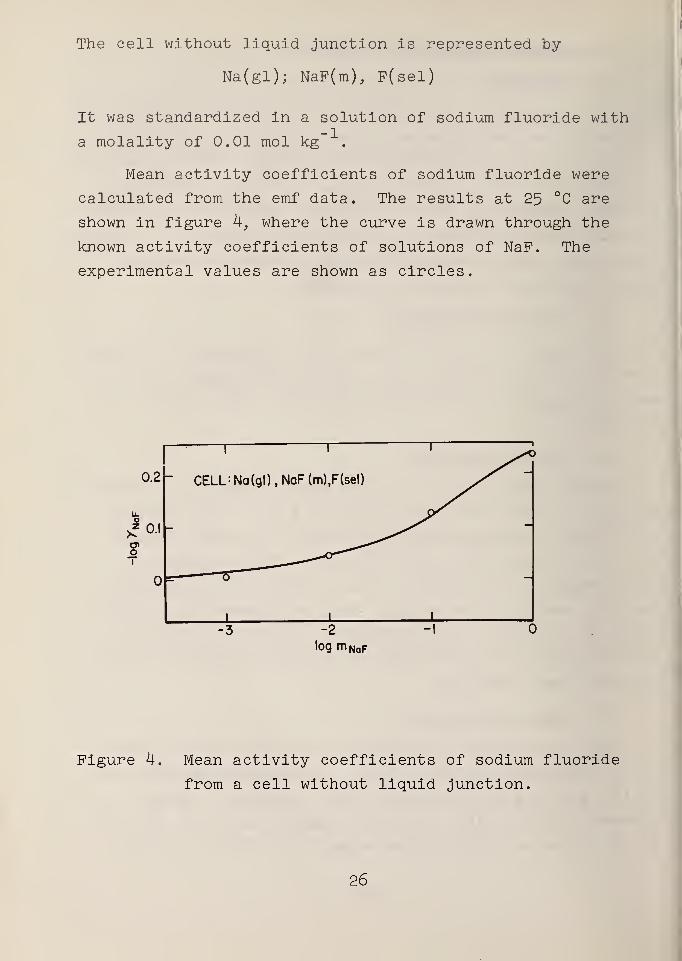
The cell without liquid junction is represented by
Na(gl); NaP(m), P(sel)
It was standardized in a solution of sodium fluoride with
a molality of 0.01 mol kg
Mean activity coefficients of sodium fluoride were
calculated from the emf data. The results at 25 °C are
shown in figure 4, where the curve is drawn through the
known activity coefficients of solutions of NaP. The
experimental values are shown as circles.
Figure 4. Mean activity coefficients of sodium fluoride
from a cell without liquid junction.
26
Page 41
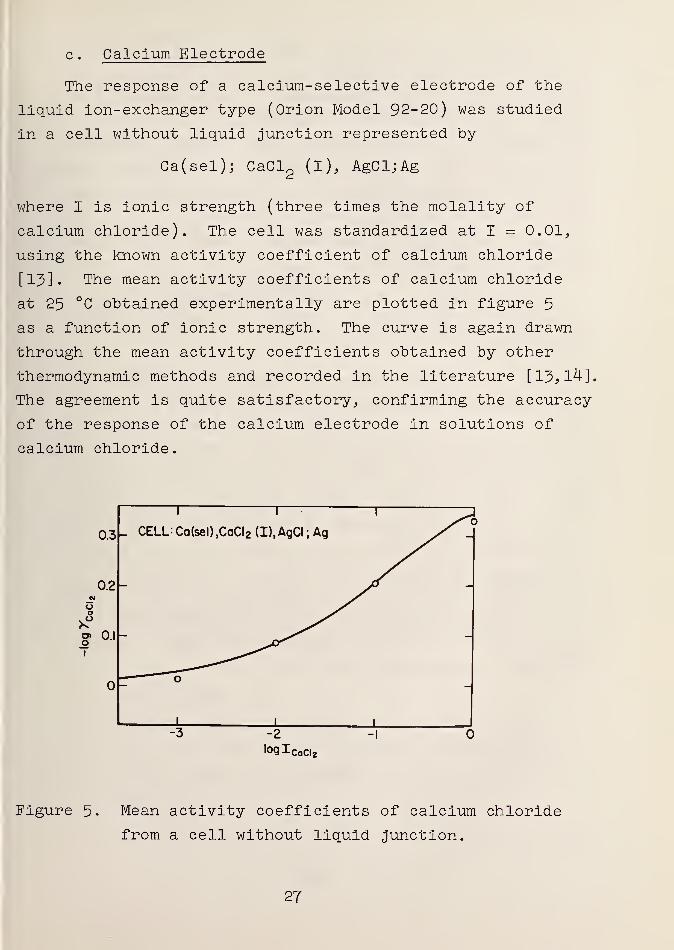
c . Calcium Electrode
The response of a calcium-selective electrode of the
liquid ion-exchanger type (Orion Model 92-20) was studied
in a cell without liquid junction represented by
Ca(sel); CaCl2
(i), AgCljAg
where I is ionic strength (three times the molality of
calcium chloride). The cell was standardized at I = 0.01,
using the known activity coefficient of calcium chloride
[15] • The mean activity coefficients of calcium chloride
at 25 °C obtained experimentally are plotted in figure 5
as a function of ionic strength. The curve is again drawn
through the mean activity coefficients obtained by other
thermodynamic methods and recorded in the literature [Y3, 14],
The agreement is quite satisfactory, confirming the accuracy
of the response of the calcium electrode in solutions of
calcium chloride.
Figure 5. Mean activity coefficients of calcium chloride
from a cell without liquid junction.
27
Page 42
In order to examine the response of the calcium-
selective electrode in mixtures of sodium chloride and
calcium chloride, emf measurements of this same cell with
aqueous salt mixtures of a total molality of 1.0 mol kg"
were made. Poor reproducibility was observed, especially
in solutions of high sodium content. In calcium chloride
solutions at 25 °C, however, the calcium-selective elec-
trode was found to be reproducible to 0.2 to 0.3 mV (0.01
pCa unit) and to reach equilibrium in about 1 min after
immersion in the solution.
The response of the Beckman calcium electrode,
No. 39608, was found to be Nernstian at 25 °C. Further
determinations are under way.
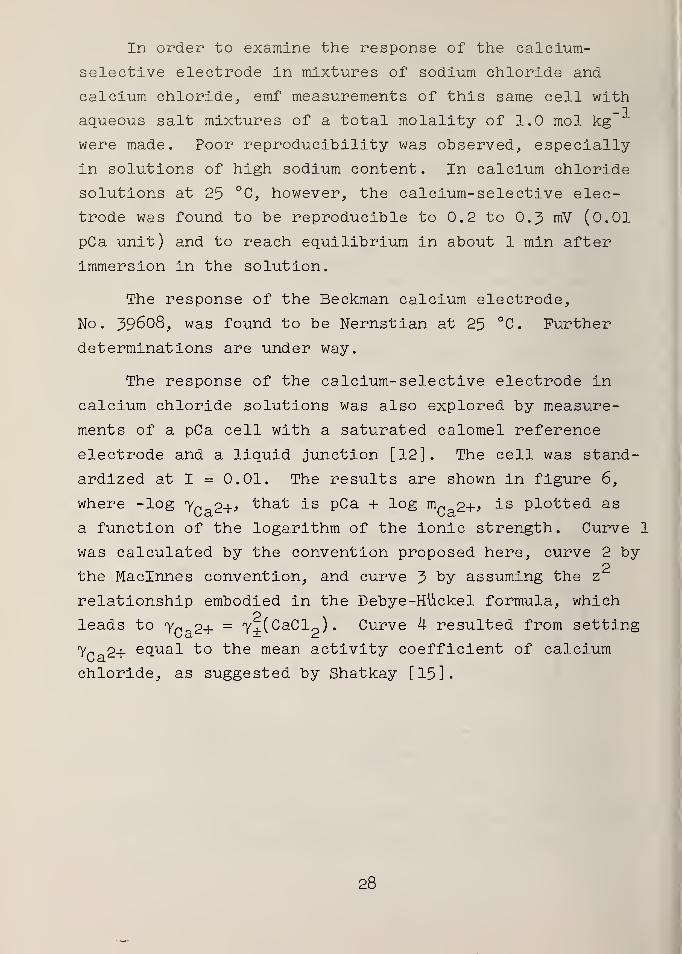
The response of the calcium-selective electrode in
calcium chloride solutions was also explored by measure-
ments of a pCa cell with a saturated calomel reference
electrode and a liquid junction [12]. The cell was stand-
ardized at I = 0.01. The results are shown in figure 6,
where -log yr p. , that is pCa + log mn 2+} i s plotted asa ua
a function of the logarithm of the ionic strength. Curve 1
was calculated by the convention proposed here, curve 2 by2
the Maclnnes convention, and curve 3 by assuming the z
relationship embodied in the Debye-Huckel formula, which
leads to y~ p+ = Y+(CaClp). Curve 4 resulted from setting
yn 2+ equal to the mean activity coefficient of calciuma
chloride, as suggested by Shatkay [15].
28
Page 43
0.8
+ 0.4 -CVJ
oO
8* o
-0.4
Figure 6. Comparison of "experimental" values of the
activity coefficient of calcium ion with
values furnished by four conventions.
d. Bromide Electrode
The Beckman bromide electrode, no. J59602, (solid
membrane type) has been found to respond nearly ideally at
25 °C. Further studies at temperatures of 10 and 40 °C
are now going on.
(B. R. Staples)
29
Page 44
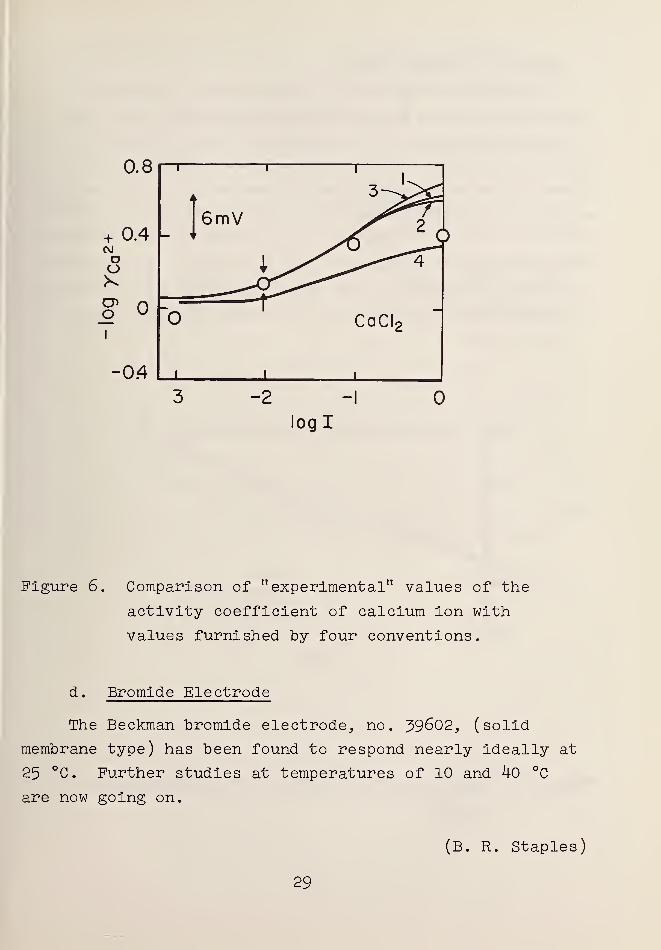
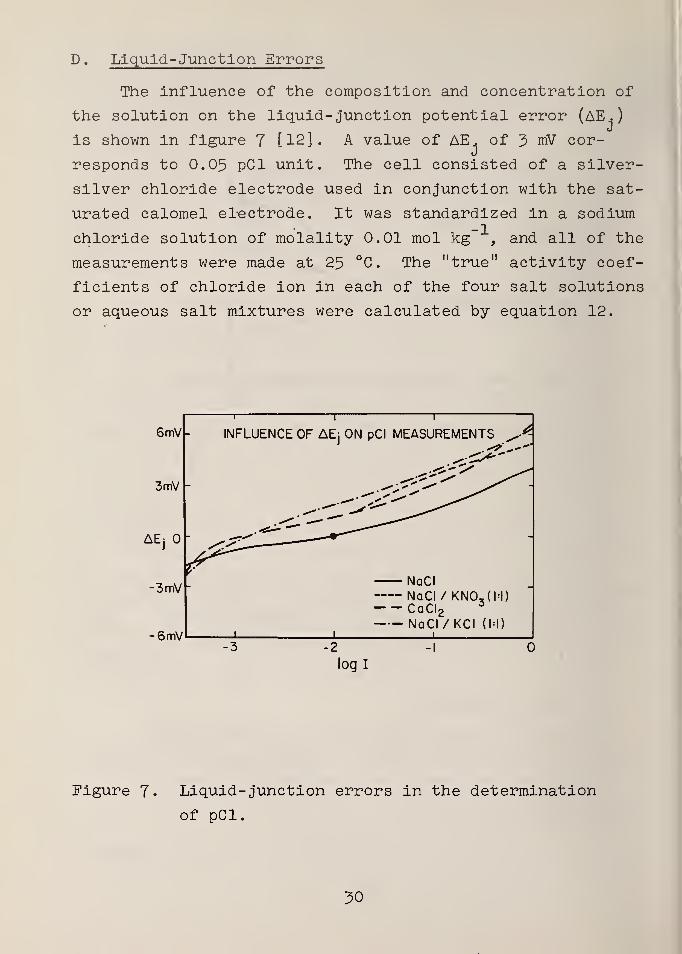
D . Liquid-Junction Errors
The influence of the composition and concentration of
the solution on the liquid- junction potential error (AE.
)
j
is shown in figure 7 [12] . A value of AE . of 3 mV cor-
responds to 0.05 pCl unit. The cell consisted of a silver-
silver chloride electrode used in conjunction with the sat-
urated calomel electrode. It was standardized in a sodium
chloride solution of molality 0.01 mol kg , and all of the
measurements were made at 25 °C. The "true" activity coef-
ficients of chloride ion in each of the four salt solutions
or aqueous salt mixtures were calculated by equation 12.
6mV
3mV
6mV
T 1 1
INFLUENCE OF AE; ON pCl MEASUREMENTS ^
NaCI
NaCI/KN0,(M)CaCI 2
3
NaCI/KCI (hi)
-2
log I
Figure J. Liquid- junction errors in the determination
of pCl.
30
Page 45
It is seen that the variation of the liquid- junction
potential error with ionic strength is about the same for
all four types of solutions, but for the solutions of
calcium chloride and the two mixtures it is 1 to 2 mV dif-
ferent from that for pure solutions of sodium chloride.
The corresponding error of 0.02 to 0.04 pCl unit could be
eliminated only by standardizing the cell in a solution
containing the same salt or salt mixture as is present in
the "unknown" solutions.
On the other hand, an error of about 4 mV (0.07 pCl
unit) is incurred when the cell is standardized in 0.01 m
sodium chloride and used for measurements in solutions of
the same salt at a molality of 1.0 mol kg" . These esti-
mates are consistent with calculated liquid- junction
potentials [16], To eliminate this concentration effect
on the liquid- junction potential, it would be necessary
to have a series of standard solutions of concentrations
spaced over the entire range in which the electrode gives
useful results. For example, if the electrode were stand-
ardized in 0.5 M sodium chloride, the error in 1.0 M sodium
chloride would be reduced to about 1 mV (0.017 pCl unit).
(M. Alfenaar)
51
Page 46
4. EQUILIBRIUM DATA FOR IONIC SYSTEMS
A . Dissociation of Phosphoric Acid in Deuterium Oxide
1 . Measurement of the First Dissociation Constant
As a continuation of the study of acid-base equilibria
in heavy water, it was of interest to determine the dis-
sociation constant of a moderately strong acid in order to
obtain more information on the relationship between the
d-isotope effect and acidic strength. The first dissocia-
tion constant of phosphoric acid ( pK-, = 2.148 in Hp at
25 °C) has been determined previously in heavy water only
at 25 °C [17,18]
.
In view of the difficulties in measuring pK for an
acid as strong as phosphoric, it seemed worthwhile to re-
determine the dissociation constant from 5 to 50 °C by
accurate emf measurements of the cell
Pt;D2 (g),
DCl(m), KD2P0
4(4m), AgCljAg
The buffer mixture had a composition ratio of 3 moles
KD2P0^ to 1 mole D P0^ to 1 mole KC1. The molality of
D^PO^ was varied from C.003 to 0.05.
An expression relating the dissociation constant K-,
to the emf E of the cell was obtained by combining the
Nernst equation for the emf with the mass law:
(E "E °)F Vpo, ^pcv^ci-
pK = + log m + log —2 + log I :
*(17)
2.3026 RT 0± D2 P0JJ
yD2P0
4
Since the last term of equation 17 is negligible in dilute
solutions (and varies linearly with ionic strength at higher
concentrations), the approximate pK value (pK' ) is given by
m-nL +pK* = P(a
inYri ) + log ^— (18)1 D 01 3m + m
J)+
32
Page 47
The acidity function p(cLyp,) is equivalent to the first
two terms on the right of equation 17- A small correction
for the ionization of phosphoric acid had to be made. This
was done by estimating the deuterium ion concentration from
the acidity function p(&n Y-,-)
):
2AI1/2
d1/2
-log mD+ = p(aDTci )-
°(19)
1+BaI 17 ^ dL/
d
o
where A and B are the Debye-Huckel constants for heavy water,
I is the ionic strength, a is the ion-size parameter, and
d is the density of heavy water.
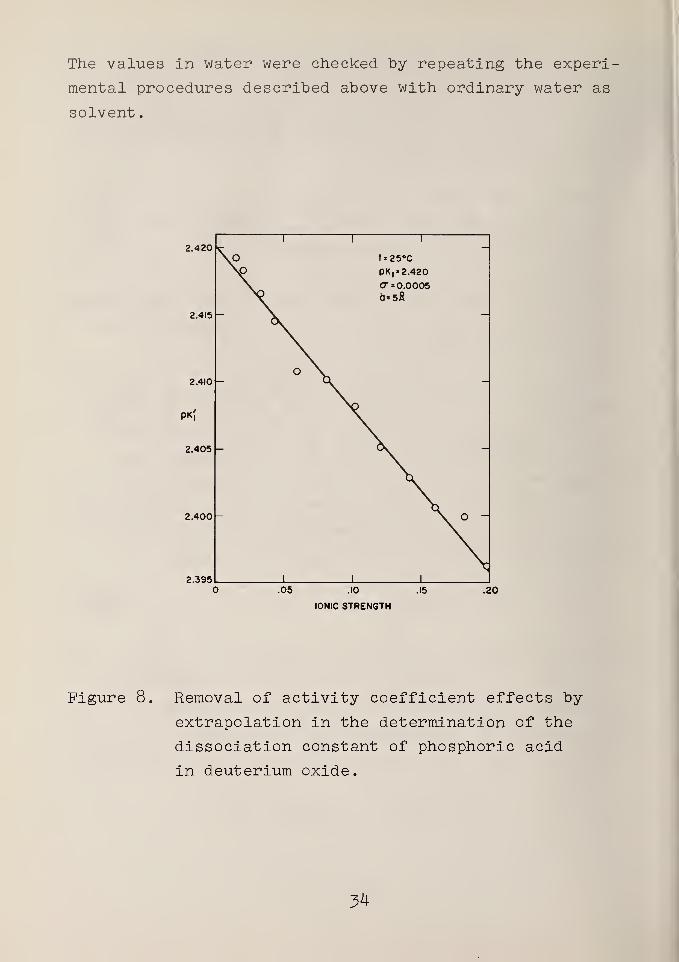
The value of pK, , that is, the limit of pK^ at 1=0,
was obtained by fitting the data, to an equation linear in
I by the method of least squares. The ion-size parameter
was varied between J5-5 and 7.0 A, and the average value
which gave the best fit at all temperatures was 5-0 A.
A plot of the data at 25 °C is shown in figure 8. The
pK-, values found at each temperature were also fitted by
the method least squares to the following equation
pK^ = A/T + b + CT (20)
where T is in kelvins. The values of the constants are
given in table 7> together with the calculated pK-, values
(molal scale) in heavy water and the corresponding pK-,
values obtained in ordinary water by Bates [19].
33
Page 48
The values in water were checked by repeating the experi-
mental procedures described above with ordinary water as
solvent
.
2.420
No
i i i
t=25°C
PV2.420CT = 0.00050*5fi
2.415
2.410o \
-
>K|
2.405 -
2.400 . O -
2.395 i 1 1
.05 .10
IONIC STRENGTH
.15 .20
Figure 8. Removal of activity coefficient effects by
extrapolation in the determination of the
dissociation constant of phosphoric acid
in deuterium oxide.
54
Page 49
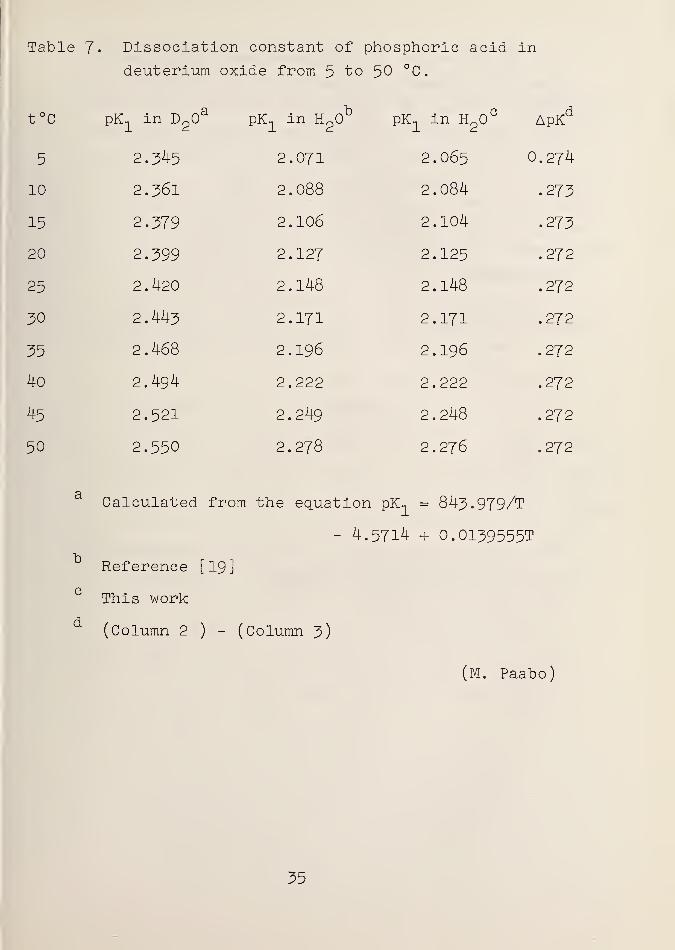
Table 7« Dissociation constant of phosphoric acid in
deuterium oxide from 5 to 50 °C.
t°c pK-, in DpO pK., in H^O pK1
in H2
CApKd
5 2.345 2.071 2.065 0.274
10 2.361 2.088 2.084 .273
15 2.379 2.106 2.104 .273
20 2.399 2.127 2.125 .272
25 2.420 2.148 2.148 .272
30 2.443 2.171 2.171 .272
35 2.468 2.196 2.196 .272
40 2.494 2.222 2.222 .272
45 2.521 2.249 2.248 .272
50 2.550 2.278 2.276 .272
a
b
c
d
Calculated from the equation pK-, = 843.979/T
- 4.5714 + O.OI39555T
Reference [19]
This work
(Column 2 )- (Column 3)
(M. Paabo)
35
Page 50
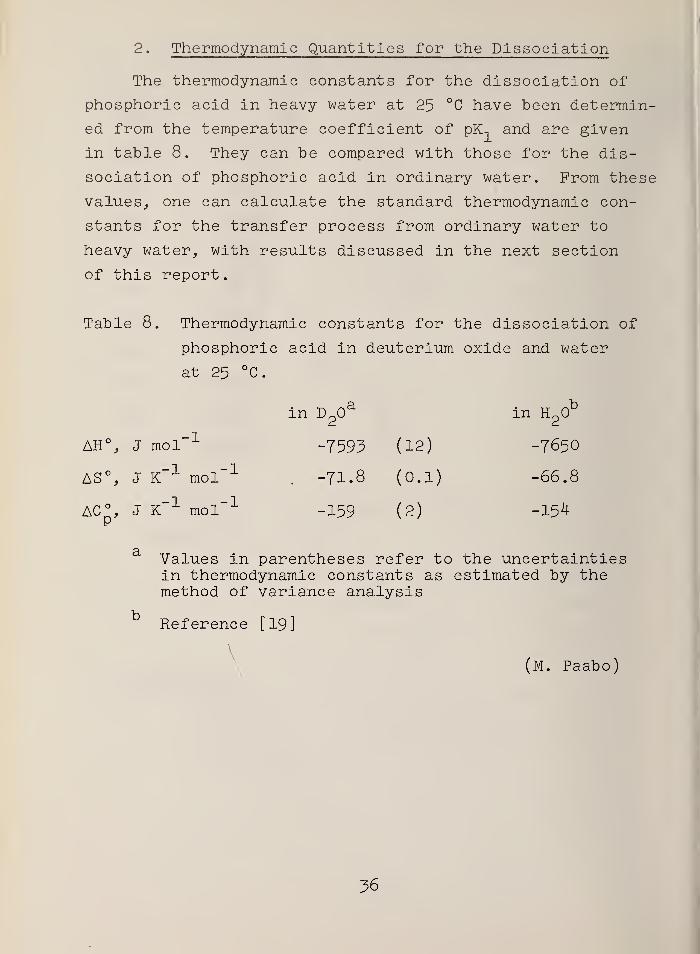
2. Thermodynamic Quantities for the Dissociation
The thermodynamic constants for the dissociation of
phosphoric acid in heavy water at 25 °C have been determin-
ed from the temperature coefficient of pK-, and are given
in table 8. They can be compared with those for the dis-
sociation of phosphoric acid in ordinary water. From these
values, one can calculate the standard thermodynamic con-
stants for the transfer process from ordinary water to
heavy water, with results discussed in the next section
of this report.
Table 8. Thermodynamic constants for the dissociation of
phosphoric acid in deuterium oxide and water
at 25 °C.
in D2
a in H2
b
AH , J mol"1
-7595 (12) -7650
AS°, J K"1mol"
1-71.8 (o.i) -66.8
AC°, J K"1 mol" 1
P-159 (2) -154
a
b
Values in parentheses refer to the uncertaintiesin thermodynamic constants as estimated by themethod of variance analysis
Reference [19]
(M. Paabo)
36
Page 51
3 . Deuterium Isotope Effects
Soon after the discovery of heavy water it was found
that weak acids are weaker in this solvent than in ordinary
water. It was soon apparent that the increase in pK over
that in ordinary water, known as the "deuterium isotope
effect", is not the same for all acids but varies in some
manner with the strength of the acid. The exact relation-
ship between ApK, that is, pK (in Dp0)- pK (in Hp0), and
the pK of the acid in water is not yet completely clear.
It has long been agreed that the isotope effect for mod-
erately strong acids is smaller than that for very weak
acids, and it has been suggested that the isotope effect
varies linearly with pK (in Hp0) [20].
Exact tests of the linear relationship are rendered
difficult by the scarcity of precise data for ionization
constants in deuterium oxide. This situation is slowly
being remedied by the appearance of new data, in large
part furnished by careful measurements made in this lab-
oratory. For this reason, Dr. R. A. Robinson, formerly
a member of the Section, was led to re-examine the data
on isotope effects during the past year. The results have
recently been published, together with data for the isotope
effect on two protonated amines, a substituted phenol, and
the mean of pK., and pKp for a polybasic carboxylic acid
(citric acid) [21]. The cation acids for which pK values
were reported are o-nitroanilinium and m-nitroanilinium
ions; very few acids of this charge type have been studied
in deuterium oxide.
37
Page 52
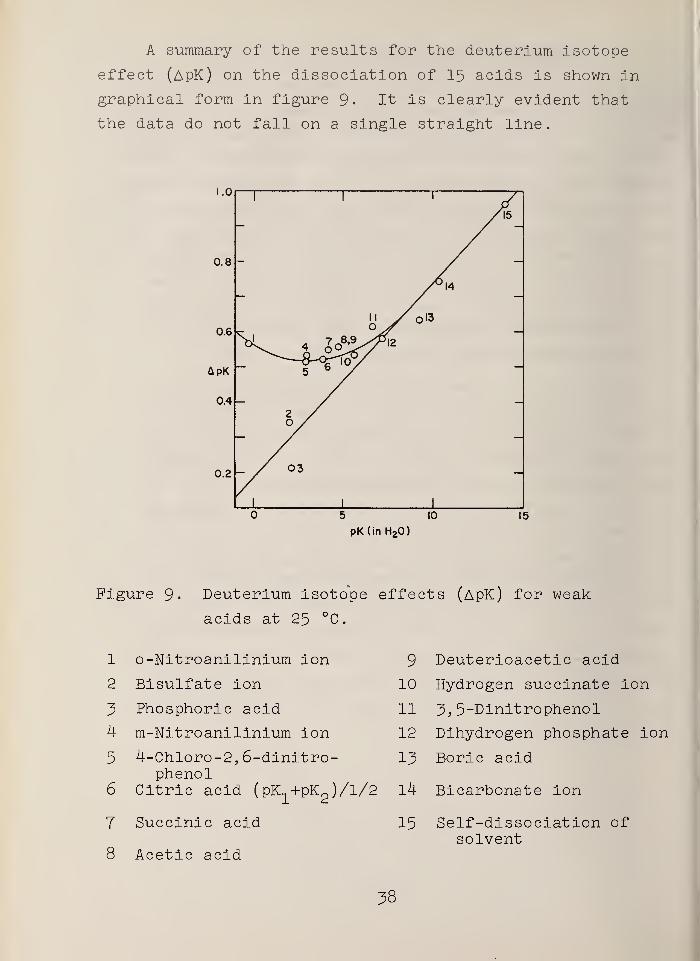
A summary of the results for the deuterium isotope
effect (ApK) on the dissociation of 15 acids is shown in
graphical form in figure 9- It is clearly evident that
the data do not fall on a single straight line.
5 10
pK(in H20)
15
Figure 9- Deuterium isotope effects (ApK) for weak
acids at 25 °C.
1 o-Nitroanilinium ion
2 Bisulfate ion
3 Phosphoric acid
4 m-Nitroanilinium ion
5 4-Chloro-2, 6-dinitro-phenol
6 Citric acid (pK +pKQ )/l/2 14 Bicarbonate ion
9 Deuterioacetic acid
10 Hydrogen succinate ion
11 ~5, 5-Dinitrophenol
12 Dihydrogen phosphate ion
13 Boric acid
'2
7 Succinic acid
8 Acetic acid
15 Self-dissociation ofsolvent
38
Page 53
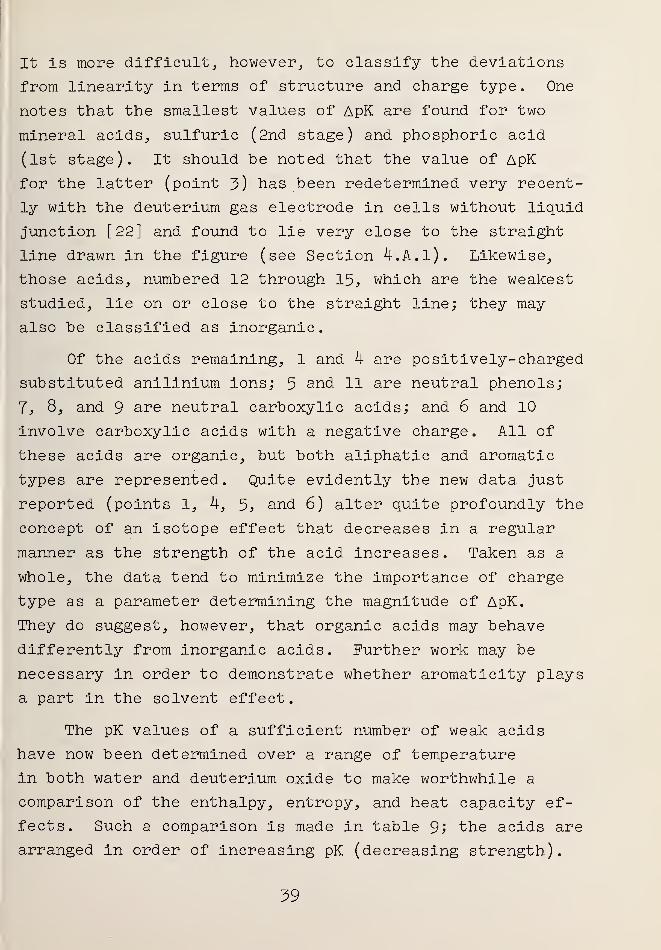
It is more difficult, however, to classify the deviations
from linearity in terms of structure and charge type. One
notes that the smallest values of ApK are found for two
mineral acids, sulfuric (2nd stage) and phosphoric acid
(1st stage). It should be noted that the value of ApK
for the latter (point 3) has been redetermined very recent-
ly with the deuterium gas electrode in cells without liquid
junction [22] and found to lie very close to the straight
line drawn in the figure (see Section 4.A.1). Likewise,
those acids, numbered 12 through 15, which are the weakest
studied, lie on or close to the straight line; they may
also be classified as inorganic.
Of the acids remaining, 1 and 4 are positively- charged
substituted anilinium ions; 5 and 11 are neutral phenols;
7, 8, and 9 are neutral carboxylic acids; and 6 and 10
involve carboxylic acids with a negative charge. All of
these acids are organic, but both aliphatic and aromatic
types are represented. Quite evidently the new data just
reported (points 1, 4, 5, and 6) alter quite profoundly the
concept of an isotope effect that decreases in a regular
manner as the strength of the acid increases. Taken as a
whole, the data tend to minimize the importance of charge
type as a parameter determining the magnitude of ApK.
They do suggest, however, that organic acids may behave
differently from inorganic acids. Further work may be
necessary in order to demonstrate whether aromaticity plays
a part in the solvent effect.
The pK values of a sufficient number of weak acids
have now been determined over a range of temperature
in both water and deuterium oxide to make worthwhile a
comparison of the enthalpy, entropy, and heat capacity ef-
fects. Such a comparison is made in table 9; the acids are
arranged in order of increasing pK (decreasing strength).
39
Page 54
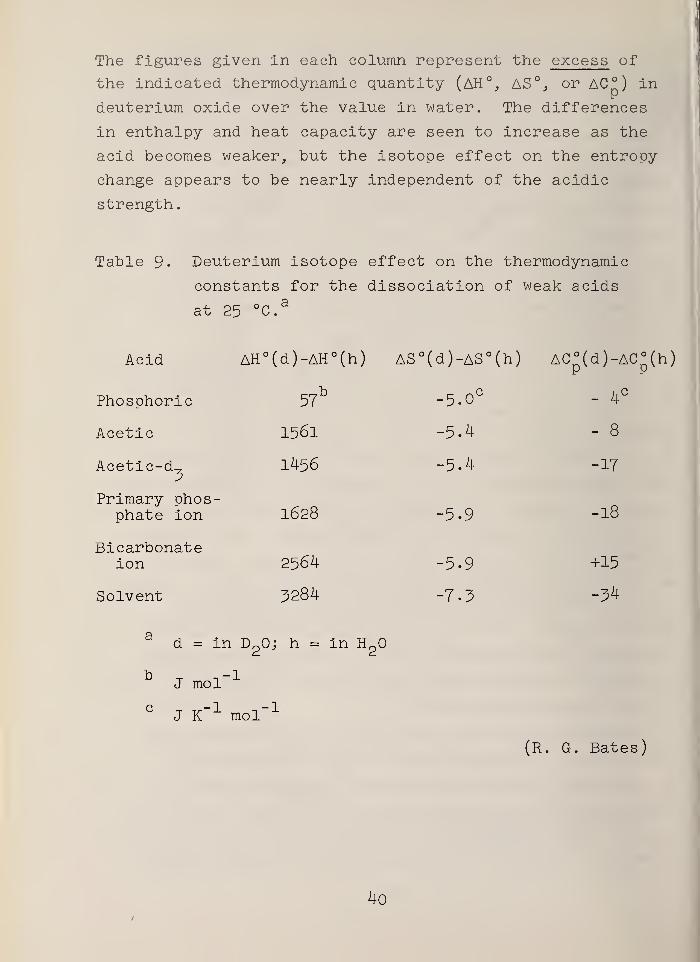
The figures given in each column represent the excess of
the indicated thermodynamic quantity (AH°, AS% or AC°) in
deuterium oxide over the value in water. The differences
in enthalpy and heat capacity are seen to increase as the
acid becomes weaker, but the isotope effect on the entropy
change appears to be nearly independent of the acidic
strength.
Table 9« Deuterium isotope effect on the thermodynamic
constants for the dissociation of weak acids
at 25 °Ca
Acid AH° (d)-AH°(h) AS°(d)-AS°(h) AC°(d)-AC°(h)
Phosphoric 57b -5.0 C
- 4C
Acetic 1561 -5.4 - 8
Acetic-d-23
1456 -5.4 -17
Primary phos-phate ion 1628 -5.9 -18
Bicarbonateion 2564 -5.9 +15
Solvent 3284 -7.3 -34
d = in D20; h = in H"
2
J mol
CJ K"
1 mol"1
(R. G. Bates)
4o
Page 55
B. First Dissociation Constant of Piperazinium Ion
in 50 Weight Percent Methanol-Water Solvent
As part of a study of the process by which cationic
weak acids dissociate,, the acidic ionization constants of
tris(hydroxymethyl)aminomethane [23], ammonia [24], and
4- aminopyridine [25] have been determined in the 50 weight
percent methanol-water solvent.
Work is now in progress on diprotonated piperazine
.
This acid has a double positive charge, and a positively
charged conjugate base is formed in the first dissociation
step.
PzH*4" + SH <=± PzH+ + SH^
where Pz is written for the neutral base piperazine and SH
represents the amphiprotic solvent. The two dissociation
constants of piperazinium ion in water were determined
recently in this laboratory [26] thus making it possible to
estimate the medium effect p( K) - p( K). The subscripts
s and w indicate the standard state to which the thermo-
dynamic quantity is referred: 50 percent methanol (s)
or water (w)
.
Emf measurements were made at seven temperatures from
10 to 40 °C for the cell
Pt,H2(g),Pz-2HCl(m),Pz.HCl(m) in 50 wt % MeOH-H
20, AgCljAg
The concentrations of the two hydrochlorides were kept
equal and the molality of each varied from 0.0025 to
0.05 mol kg . A slight correction was made for the ioniz-++ation of PzH? . The molality of hydrogen ion was estimated
with the aid of the acidity function p (a^Yp-,).
The method of calculating p( K-, ) followed closely that
outlined above in Section 4.A.I. In this instance, however,
the activity coefficient term was, as expected, far from
41
Page 56
negligible. For the calculation of p( K-,)' it was esti-S J-
mated by a Debye-Huckel equation having the same form as
the last term in equation 19 (the coefficient 2 in the
numerator being replaced by 4, as required by the charges
of the species participating in the dissociation process).
The value of p( K1 ), that is, the limit of p( K-, )
' at
zero ionic strength, was calculated by the method of least
squares for several values of the ion-size parameter (a)
at 25 °C. The smallest standard deviation for p( K-, ) was
obtained with a=2 A. The resulting medium effects for
piperazinium ion and other weak bases studied are given
in table 10.
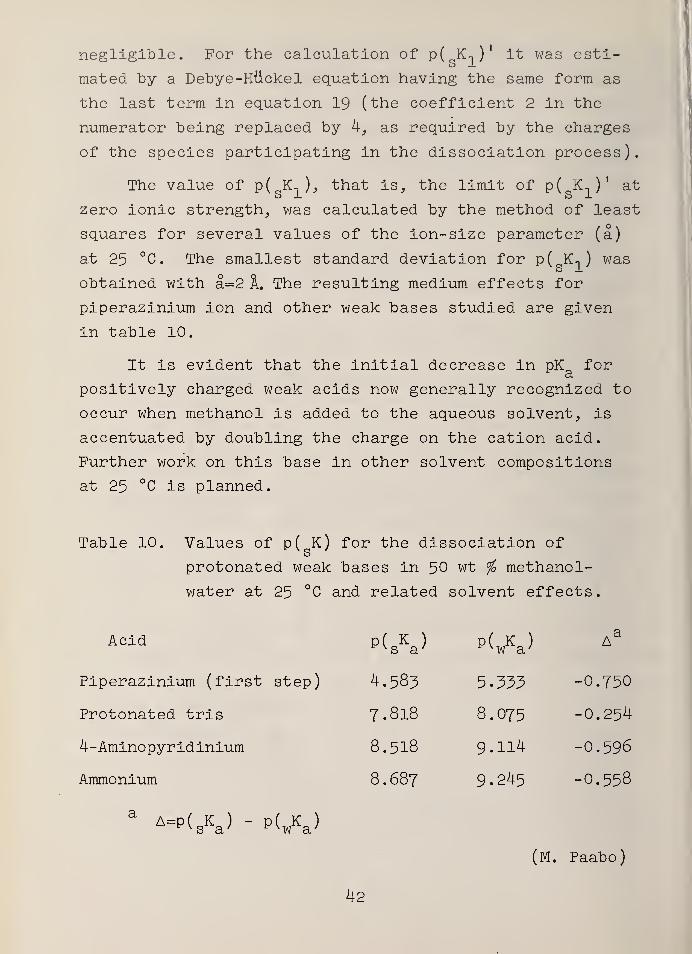
It is evident that the initial decrease in pK fora
positively charged weak acids now generally recognized to
occur when methanol is added to the aqueous solvent, is
accentuated by doubling the charge on the cation acid.
Further work on this base in other solvent compositions
at 25 °C is planned.
Table 10. Values of p( K) for the dissociation of
protonated weak bases in 50 wt % methanol-
water at 25 °C and related solvent effects.
Acid
Piperazinium (first step)
Protonated tris
4-Aminopyridinium
Ammonium
P(sKa) PW A3
4.583 5.333 -0.750
7.818 8.075 -0.254
8.518 9.114 -0.596
8.687 9.245 -0.558
aA=p(
sKa ) - p( wKa )
(M. Paabo)
42
Page 57
C. Dissociation of Protonated Tris(hydroxymethyl)-
aminomethane in Aqueous Alcohol Solvents
Acid-base behavior in mixed solvents of which water
is one component has been a subject of interest in the
Section for a number of years. These studies have the
aim of shedding light on ion-solvent interactions and
other medium effects. Investigations of this sort, it is
hoped, may eventually point the way to a single acidity
scale for different mixed solvent systems. The nature of
solvent effects on the equilibrium behavior of electro-
lytes in mixed solvents was discussed in earlier progress
reports [2,11] and in a lengthy review published during
the past year [27].
Schindler, Robinson, and Bates [28] determined
the dissociation constant of the protonated form of
tris(hydroxymethyl)aminomethane in methanol-water solvents
containing 30 , 50, 70, and 90 wt percent methanol by a
potentiometric titration method. This procedure is rela-
tively simple, utilizing glass electrodes in a cell without
liquid junction, yet capable of yielding results accurate
to better than 0.01 in pK.
We have now extended these measurements to demon-
strate the influence of the nature of the alcohol, study-
ing the pK of protonated tris in aqueous solvent mixtures
containing 50 wt percent ethanol, n-propanol, or tert -
butanol. All of the measurements were made at 25 °C.
^
Page 58
The cell
Glass electrode; HC1 (0.01m) + tris in 50 wt %
alcohol-water, AgCljAg
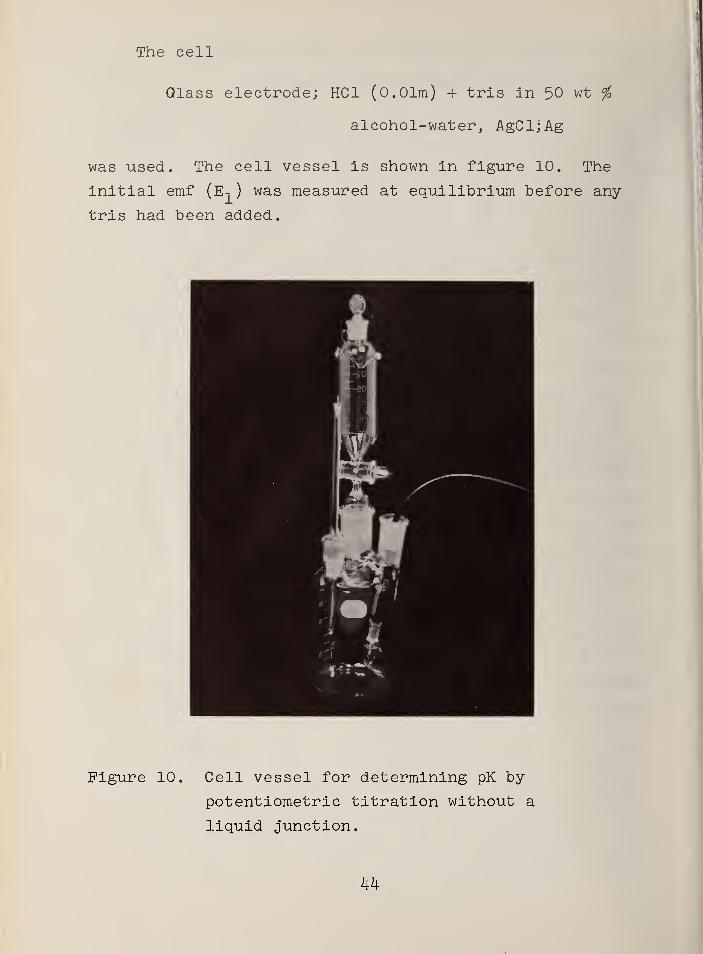
was used. The cell vessel is shown in figure 10. The
initial emf (E-, ) was measured at equilibrium before any
tris had been added.
Figure 10. Cell vessel for determining pK by
potentiometric titration without a
liquid junction.
44
Page 59
Successive additions of a solution 0.01 m in HC1 and 0.1 m
in tris (m=molal) in the alcohol-water solvent under study
led to emf values designated Ep. In this way, both E-, and
Ep were determined at a constant chloride molality and a
constant total ionic strength, while the buffer ratio
(tris/tris .HCl) was changed. A similar procedure, using
the hydrogen gas electrode instead of the glass electrode,
was developed in the Section many years ago [29].
The activity coefficient term in the expression for pK
is of such form as to be negligible in dilute solutions [28];
hence, a close approximation to the pK is obtained from the
equation(Ep-E-,) nv, +
pK = 2 1 + log -£2 (21)(RT In 10)/F 0.01mB
where rrLRH+ and rru are respectively the molalities of pro-
tonated tris and the free tris base in the solution for
which Ep was measured.
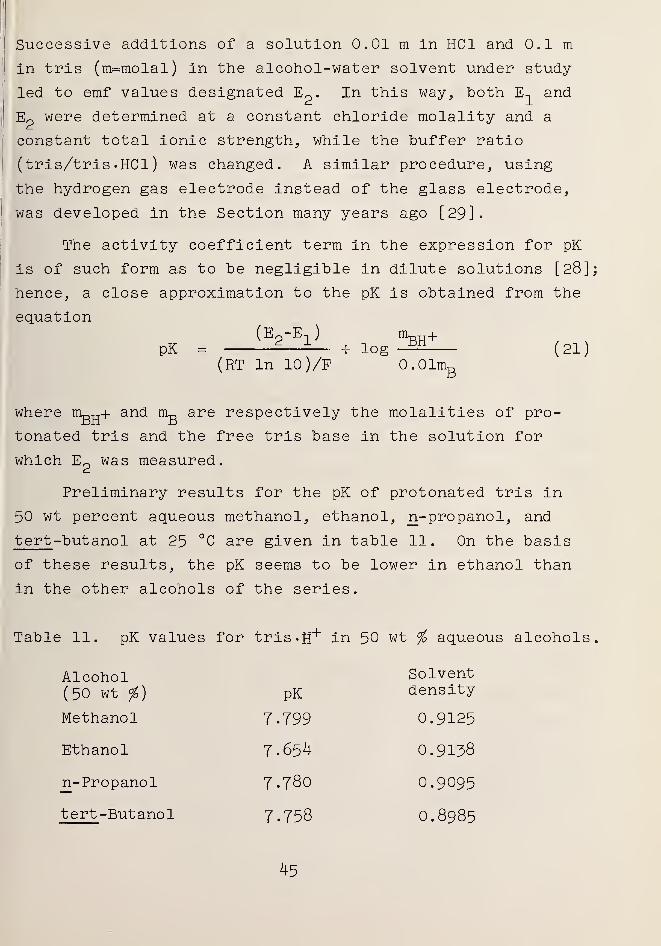
Preliminary results for the pK of protonated tris in
50 wt percent aqueous methanol, ethanol, n-propanol, and
tert-butanol at 25 °C are given in table 11. On the basis
of these results, the pK seems to be lower in ethanol than
in the other alcohols of the series.
Table 11. pK values for tris«H+ in 50 wt % aqueous alcohols.
Alcohol(50 wt %) PK
Solventdensity
Methanol 7.799 0.9125
Ethanol 7-654 0.9138
n-Propanol 7.780 O.9095
tert-Butanol 7.758 O.8985
45
Page 60
Further work is under way. In a qualitative manner,
the trend in pK suggests a possible influence of solvent
structure. The differences in pK are not large, and it
is possible that the comparison may have to be made at
equal mole fractions of alcohol, where the numbers of sol-
vent molecules are the same. The pK of tris«H in water
at 25 °C is 8.075 [30]
.
(B. R. Staples, R. S. Carter, Jr.)
D. Thermodynamics of Hydrochloric Acid in
N-Methylpropionamide Solvents
Electromotive force studies in N-methylpropionamide
(NMP) and in mixtures of NMP with cyclohexane or decalin
have been conducted in the Section by Edgar S. Etz as part
of his graduate program at Clarkson College of Technology.
The experimental work was described in the two preceding
annual reports [2,11]. Measurements have been made from
5 to 55 °C
Mr. Etz returned to the Section for the summer months
of 1968, devoting his time to a detailed computer analysis
of the data. His efforts resulted in l) values of the
standard emf of the hydrogen-silver chloride cell when the
solvent is NMP or a mixture of NMP with one of the two
hydrocarbons studied, 2) the activity coefficient 3 partial
molal heat content, and partial molal heat capacity of
hydrochloric acid in these nonaqueous solvents, and 3) the
changes in Gibbs energy, enthalpy, and entropy on the
transfer of one mole of HC1 from the standard state in
A7ater to the standard state in these three nonaqueous
solvent systems.
46
Page 61
Accurate thermodynamic data for electrolytes in
anhydrous systems have rarely been obtained, and conse-
quently these results are of considerable scientific
interest. Pure NMP has a very high dielectric constant
(175.6 at 25 °C). Interionic attractive forces might
therefore be expected to be small, and indeed the activity
coefficient of hydrochloric acid in this solvent exceeds
O.96 for all concentrations (C) less than 0.1 mole per
liter, as shown in figure 11.
Figure 11. Comparison of the activity coefficient of
hydrochloric acid in NMP with that in water
47
Page 62
Through the study of NMP-hydro carbon mixtures
"isodielectric" with water it was hoped to compare solvent
basicities. When electrostatic contributions are approxi-
mately equalized by this device, it is reasonable to expect
that the energy change in the transfer of hydrochloric acid
from water to a nonaqueous solvent will reflect primarily
the relative magnitudes of the solvation interactions in
the two solvents. The interaction between the proton and
solvent proton acceptors (bases) is likely to be important
here. Because of the large difference between the dielec-
tric constants of the pure solvents water and NMP, such a
comparison of transfer energies is not likely to be very
useful as a measure of relative basicities.
Thus far, it has not been possible to interpret the
results in terms of a difference in intrinsic basicity
of the two solvents water and NMP. This conclusion is
consistent with the growing recognition [31] that "in-
trinsic basicity" is not a meaningful concept in hydrogen-
bonded mixed solvent systems.
A portion of this work was presented by Professor
Donald Rosenthal in the Fisher Award Symposium held on
April 17 , 1969, as part of the National Meeting of the
American Chemical Society at Minneapolis, Minnesota.
(R. G. Bates)
48
Page 63
E. Thermodynamics of Hydrochloric Acid in Mixtures of
2-Methoxyethanol (80 Weight Percent) and Water
(20 Weight Percent)
In order to base standards for pH in 80 wt percent
2-methoxyethanol on emf measurements, it is first neces-
sary to determine the standard emf of the hydrogen- silver
chloride cell for this solvent system. The requisite
measurements, made over a range of temperatures, will yield
not only the standard emf "but also information on the
thermodynamic behavior of hydrochloric acid in this mixed
solvent
.
1. Vapor Pressures of the Solvent
In order to make the hydrogen pressure corrections to
the measured emf values, the vapor pressures of the solvent
at different temperatures have to be known. The apparatus
for the vapor pressure determination is shown in figure 12.
A flask containing the solvent is submerged in a water bath
with temperature control to ±0.01 °C . The flask is con-
nected with a U-tube mercury manometer and the pumping
system. To obtain a good vacuum, three pumps were used in
series; these were a mercury diffusion pump, an oil diffu-
sion pump, and a mechanical pump. Because 2-methoxyethanol
attacks the high vacuum grease, Teflon stopcocks had to be
used.
Before connecting the flask to the vacuum line, the
temperature of the solvent was lowered to -72 °C, so that
the evacuation of the system could not cause any change in
the composition of the liquid. To avoid condensation of
vapors in the manometer, the latter was placed in a control-
led air bath with a transparent plastic panel, so that the
manometer could be kept at 5^ °C throughout the measurements
49
Page 64
The rest of the apparatus, except for the flask, was wrap-
ped with heating tape and kept at a temperature well above
50 °C . Before starting the measurements, the pressure in
the apparatus was reduced below 1 |jm Hg. The manometer was
read with a cathetometer giving a precision of 0.05 mm Hg.
Figure 12. Apparatus for measuring the vapor pressure
of solvents.
50
Page 65
The measured, values of the vapor pressures of the
binary solvent mixture 2-methoxyethanol (80 wt percent) -
water (20 wt percent) In the temperature range 10 to 50 °C
are given in table 12. Least-squares treatment of the
results yielded the following equation:
2,419.46log p = 11.502 (22)
T
_2where p is the vapor pressure in Nm and T is the tempera-
ture in kelvins (l normal atmosphere = 1.01325xl0J Nm ).
Table 12. Vapor pressures of a mixture of 2-methoxyethanol
(80 wt fo) and water (20 wt %) from 10 to 50 °C
.
_2t, °C p, Nm p, mm Hg
10 907 6.8
15 1266 9.5
20 1733 13.0
25 2480 18.6
30 3333 25.0
35 4486 33.6
40 5993 44.9
45 7846 58.9
50 10159 76.2
51
Page 66
2. Dielectric Constants of the Solvent
The dielectric constants of the mixed solvent were
measured at 10, 25, and *50 °C, using freshly distilled
water and spectro-grade acetone as reference materials.
The measurements were carried out with the Multidekameter
instrument. The temperature of the cell was adjusted to
within 0.1 °C of the desired temperature by circulating
water from a constant-temperature bath. The following
values of the dielectric constant have been obtained:
34.7 at 10 °C, 31.5 at 25 °C, and 27.8 at 50 °C.
3. Determination of Acidity Functions
Electromotive force measurements of cells without
liquid junction of the type
Pt;H2 (g)j
HCl(m) in 2-methoxyethanol-H20, AgCljAg
were made with 12 different molalities (m) of hydrochloric
acid in the solvent 2-methoxyethanol (80 wt percent) -
water (20 wt percent) over the temperature range 10 to 50 °C.
The temperature was controlled to 0.01 °C, and the emf
was measured with a precision potentiometer. The observed
potentials were very stable, and the reproducibility of
duplicate cells was nearly always better than 0.1 mV.
These data will serve for a calculation of the standard
emf of the cell for this mixed solvent system.
Values of the acidity function Pw (arrYpi )> referred
to the aqueous standard state, have been derived from
the emf, with the use of the standard emf obtained from
measurements in water solvent [32]. Acidity functions
at 25 °C are given in table 13. The mean activity coef-
ficient of hydrochloric acid ( y+ ), referred to the standard
state in pure water, is also of interest. It was calculat-
ed from the acidity functions by the equation
52
Page 67
-logWY± = [Pw^hW + log m]/2 (23)
and is listed in the last column of the table.
Table 13 .Values of Pw ( aTj
r
Vni^ and w^+for hydrochloric
acid in a mixture of 2-methoxyethanol (80 wt %)
and water (20 wt %) at 25 °C.
m x 10-5 emf, mV pwl¥ci) w^±
4.05 401.38 0.634 7.59
6.01 382.32 0.483 7.40
9.31 364.28 0.368 6.78
10.90 356.14 0.299 6.79
17.07 338.17 0.190 6.15
21.83 326.50 0.100 6.04
32.38 311.58 0.019 5.45
42.13 299 . 18 -0.077 5.32
58.58 287 . 19 -0.136 4.83
78.55 273.70 -0.237 4.69
94.24 267.77 -0.258 4.39
106.20 261.16 -0.318 4.43
The magnitude of the activity coefficient (4 to 8)
demonstrates that hydrochloric acid has a higher free
energy or "escaping tendency" in the mixed solvent
than in water. This result is consistent with data for
53
Page 68
other mixed solvents such as dioxane-water [33]. It may
be attributed largely to the lowered dielectric constant
produced by the addition of 2-methoxyethanol to water, with
the consequent increase in the energy of charged species
in the medium. It is likely that a contrary influence,
obscured by this larger electrostatic effect, is exerted
by ion pairing, some of which is to be expected in a solvent
of dielectric constant near J>0
.
(H. P. Thun)
54
Page 69
5. OCEANOGRAPHIC CONDUCTANCE STANDARDS
A. Apparatus
The program of conductivity research has been direct-
ed toward the attainment of the highest accuracy in the
measurement of the conductance of aqueous salt solutions.
The direct objective is the certification of sodium chloride
solutions suitable for the calibration of oceanographic
salinometers . The needs for that project were outlined in
the annual progress report for 1968 [11].
Since last year the major modification of equipment
was the incorporation of the Janz-Mclntyre bridge in a
single cabinet, shown in figure 1^. At the same time, the
following changes were made to the bridge:
(1) The output from the impedance unbalance meter
was brought to an external d-c amplifier, permitting inter-
polation of the lowest decade of the resistance arm to
0.01 ohm.
(2) Shields of the cell leads were connected to the
reversing switch so that the shields of the low-potential
leads are in the guard circuit of the comparator, while
the shields of the high-potential leads are grounded.
(3) Provision was made for connecting a fixed 10,000-
ohm coil in parallel with the unknown in order to extend
the range of measurements to higher impedances. In this
configuration, the four-terminal method of measurement
does not strictly eliminate the effect of lead impedance,
but the small correction can be calculated readily.
55
Page 70
Figure lj5. Janz-Mclntyre bridge for conductivity
measurements.
Five cells, having constants of approximately 10, 40,
80, 120, and 160, were constructed. Three of these are
shown in figure 14. The others are similar, differing
only in the length and diameter of the capillary section.
All have 2.5 cm diameter bright platinum electrodes and
four leads terminating in shielded connectors.
(T. B. Hoover)
56
Page 71
Figure 14. Two-electrode conductivity cells.
B. Calibration of Cells
Three of the cells were calibrated at 18 and 25 °C
with 0.1 demal potassium chloride solutions prepared with
salt from two different sources. Statistical analysis of
the results showed a standard deviation of the cell con-
stants of 100 ppm. About half of this is accounted for by
a significant trend of the deviations in the direction of
higher constants at the end of the week of measurements.
57
Page 72
Another series of calibrations of all five cells with
0.01, 0.1, and 1 denial solutions from a single supply of
potassium chloride has been completed experimentally, also
at 18 and 25 °C, but the results have not been fully
analyzed
.
In addition to the calibration corrections for the
resistances of the bridge coils, two other significant
corrections need to be applied to the raw data. These are
for variations of temperature and for frequency effects.
Temperatures of the oil thermostat, which is shown
in figure 15, were measured with two platinum resistance
thermometers. In 28 measurements, the maximum difference
between the readings of the two thermometers was 3.6xl0~^K,
while the mean difference and standard deviation were-4 r -4
2x10 K and 16x10 K, respectively. A continuous record
of the temperature for several hours indicated cyclic
fluctuations of ± 0.001 K with a period of 2-3 minutes.
The heat capacity of the cell probably smooths out some of
this variation, but the absolute temperature must be con-
sidered uncertain to at least 0.002 K. This uncertainty
is equivalent to about 40 ppm in the conductance of the
solution.
Frequency effects resulting from polarization of the
electrodes are an inherent source of error in electrode-
type conductivity cells. It was considered desirable to
avoid platinization of the electrodes because of the un-
certainty associated with adsorption effects on platinum
black. Consequently, other experimental means of reducing
the effects of polarization were investigated. These
included: (l) differential measurement between cells with
different cell constants in the reference and unknown arms
of the bridge [j54], (2) constant impedance, in which the
reference arm was a fixed resistor and the variable resist-
58
Page 73
Figure 15 . Oil thermostat for conductivity measurements
ance was in series with the cell, and (3) four-electrode
cells, such as that shown in figure 16. In the latter
method the electrodes are part of the lead impedances,
and polarization effects were expected to cancel by the
four-terminal method of measurement. The cylindrical
potential electrodes shown in the photograph were placed
in a region of minimum potential gradient.
In each of these procedures very large frequency
effects were observed, which probably were a consequence
of introducing an impedance in series with the cell.
One current lead then was neither at the detector poten-
tial nor at the output potential of the bridge.
59
Page 74
Figure 16. Four-electrode conductivity cell.
Admittance from this lead to its shield would act as a
frequency-dependent shunt across other portions of the
circuit. When the impedance "between current and potential
electrodes of the four-electrode cells was made small, as
shown, the effect was reduced, but not to the le/el found
for the conventional two-electrode cells.
The mathematical correction for polarization effects
by extrapolation is strictly empirical, although Feates,
Ives, and Pryor [35] solved the balance conditions for a
simple model of electrode polarization. The Janz-Mclntyre
bridge is not very suitable for investigating frequency
effects because it provides only four output frequencies.
60
Page 75
Nevertheless, a computer program to fit the observations
to the Feates-Ives-Pryor model showed that the high-
frequency limit of extrapolation was always very close
to the value measured at 10 kHz. On the other hand,
measurement of some of the same cells with the unshielded
Jones-Dike bridge at nine or ten frequencies showed a
precisely linear relation between resistance and reciprocal
frequency between 1 and 20 kHz, provided the resistance
was less than 1500 ohms.
As a further check of results obtained with the Janz-
Mclntyre bridge, the same solution was measured in a cell
before and after the electrodes had been coated with
palladium black, and again after stripping off the pal-
ladium electrolytically. As expected, the calculated
double-layer capacity and leakage resistance varied con-
siderably with electrode treatment. The high-frequency
resistance of the electrolyte also varied significantly
according to the Feates-Ives-Pryor calculation but was
quite consistent according to the simpler inverse frequency
extrapolation. It was concluded that the theoretical
model [35] is not applicable to the systems under inves-
tigation.
(T. B. Hoover)
61
Page 76
C . Conductance of Natural and Synthetic Sea Water
Specific conductances of samples of synthetic sea
water used for acidity measurements (Section 2.C) were
measured at 15 and 25 °C. In general, the conductances
were about 7 percent lower than the values corresponding
to natural sea water of the same chlorinity [36]. Two
ampoules of Standard Sea Water, Lot P50, were also measur-
ed at 15 and 25 °C in each of two cells. These results
lay within a range of 50 ppm at each temperature and were
in close agreement with the published values of Reeburgh
[36]. Twenty-two samples of natural sea water varying in
salinity from 0.5 to 40^ o have been measured at 20 °C for
use by the Naval Oceanographic Instrumentation Center in
calibrating salinometers
.
(T. B. Hoover)
62
Page 77
6. PREPARATION AND PROPERTIES OF SOLVENTS
A. Dimethylformamide
Dimethylformamide and water appeared to form a suitable
solvent system for the study of the stability of complexes
dependent on acidity and dielectric constant. Dimethyl-
formamide boils at 153 °C, has a dielectric constant of 36.
7
at 25 °C, and dissolves readily most organic as well as many
inorganic compounds. It can be easily purified, but it has
the disadvantage of high hygroscopicity and is subject to
hydrolysis catalyzed by acids and bases. Dimethylformamide
of the highest grade commercially obtainable was stated to
contain less than 0.01 percent of water. The solvent was
distilled to remove possible organic impurities. After the
bottles had been opened several times during normal use,
the water content was found to be 0.015 percent by Karl
Fischer titration.
Unfortunately, dimethylformamide had to be abandoned
after preliminary emf measurements were made. The emf was
unstable, the marked drift presumably being caused by
hydrolysis and the formation of complexes with silver chlo-
ride [37,38].
(H. P. Thun)
B. 2-Methoxyethanol
Reagent-grade 2-methoxyethanol (methylcellosolve) was
acquired from commercial sources. It was stated to contain
less than 0.03 percent water. Gas chromatographic analysis,
performed by D. Enagonio of the Separation and Purification
Section, confirmed this statement; no other impurities
could be detected.
(H. P. Thun)
63
Page 78
C . Sulfolane
A new dipolar aprotic solvent, tetramethylene sulfone
(sulfolane), with a moderately high dielectric constant
(43 at 30 °C), has attracted recent attention. It has
been used as a solvent for potentiometric titrations, for
kinetic and spectrophotometric measurements, and for
polarography. As a continuation of our program of develop-
ment and application of acidity scales in nonaqueous media,
it was of interest to use this new solvent in emf studies.
Commercial sulfolane was purified by vacuum distilla-
tion from sodium hydroxide pellets [39] through a 1-meter
column packed with fine glass rings. This particular still
has been used previously in the Section for the purifica-
tion of various organic solvents. It is shown in figure 17
.
The original sample had a conductivity of 1.7x10 ft"
cm . A gas chromatographic analysis performed by Dr. R. T.
Leslie of the Separation and Purification Section indicated
that the sample contained about 0.5 percent water and about
1.8 percent of an unidentified compound.
The first distillation at 4 mm Hg reduced the con-
ductivity to 3 -7-7 .8x10 '
ft cm . The product of a
second distillation at 4 mm Hg and 126 °C had a conducti-
vity of 6.1x10 ft cm , and its appearance was clear
and colorless as compared to the original amber sample.
Emf measurements at 25 °C were made of the cell
Pt;H2 (g),
HC1 in sulfolane, AgCl;Ag
The cell solution was prepared by passing anhydrous
hydrogen chloride through sulfolane. The color of the
solution soon changed to pale yellow, and in a few days
it resembled the amber shade of the original sample.
64
Page 79
Figure 17 . Still for the purification of organic solvents,
The molality of hydrogen chloride was about 0.0175 as
determined by titration with aqueous sodium hydroxide solu-
tion using bromothymol blue indicator to detect the end
point. The emf of the cell never became constant; it in-
creased from -0.02 to +0.28V in the course of 2-1/2 days.
The concentration of hydrochloric acid was the same at
the end of the run as at the beginning.
65
Page 80
A second cell containing 0.026 molal HC1 in a mixture
of 50 moles percent sulfolane and water was studied. No
coloration of the aqueous solution of sulfolane was observ-
ed. The emf of the cell came to an equilibrium value of
about 0.255 V, but the emf readings were very sensitive to
the rate of hydrogen bubbling. An increase in the rate
reduced the emf by several millivolts, and a decrease of
the rate increased the emf. At a constant rate of flow
the emf was stable to about 0.5 mV for a period of 12 hours
The cause of the instability was not determined. Coetzee
and Bertozzi [40] found the hydrogen electrode to function
normally in sulfolane. It is likely that the source of
instability is the silver-silver chloride electrode.
(M. Paabo)
66
Page 81
7. STANDARD REFERENCE MATERIALS ACTIVITY
A. Summary
Material SRM No. Determined Analyst
Sodium Bicarbonate (191)
Sodium Carbonate (192)
Potassium Dihydrogen Phosphate (2l86l)
Disodium Hydrogen Phosphate (2l86ll)
Sodium Bicarbonate (2191)
Sodium Carbonate (2192)
pH BRS
pH BRS
pD MP
pD MP
pD MP
pD MP
Ion-selective electrodes(in process)
Sea Water Conductivity(in process)
Bilirubin(in process)
pH in Sea Water(in process)
(3024767) PA BRS, MA
(3024759) Conductivity TBH
(3024761) Assay
(3022753) pH
TBH
ESE
Analyst
BRS - B. R. Staples
MP - M. Paabo
MA - M. Alfenaar
TBH - T. B. Hoover
ESE - E. S. Etz
67
Page 82
B. Standard Materials for Acidity Measurements
With the completion of the analysis and certification
of potassium dihydrogen phosphate, disodium hydrogen
phosphate, sodium bicarbonate, and sodium carbonate [11],
these materials were added to the list of NBS Standard
Reference Materials for the measurement of pH and pD.
Potassium dihydrogen citrate promises to be a most useful
reference material for acidity measurements both in HpO
and DpO, and it is regrettable that no commercial source
of this salt in pure form has yet been found. In anticipa-
tion of the issuance of this material, however, SRM numbers
have already been assigned. Table 14 is a summary of the
Standard Reference Materials for acidity measurements;
although the potassium dihydrogen citrate is not yet avail-
able, it is listed in the table.
Table 14. Standard reference materials for acidity
measurements
.
SRM No
l85d1861 c
18611b187a188189190191192
pH Standards
Acid potassium phthalatePotassium dihydrogen phosphateDisodium hydrogen phosphateBoraxPotassium hydrogen tartratePotassium tetroxalatePotassium dihydrogen citrateSodium bicarbonateSodium carbonate
SRM No
218612186II219021912192
pD Standards
Potassium dihydrogen phosphateDisodium hydrogen phosphatePotassium dihydrogen citrateSodium bicarbonateSodium carbonate
(R. G. Bates)
68
Page 83
C . Standard Materials for Conductivity Measurements
The oceanographic conductance standards discussed In
Section 5 should find application as well in the calibra-
tion of conventional conductivity cells used in research.
Although it is fundamentally desirable that such standards
should be determined absolutely, e.g., in terms of the
physical dimensions of a suitable cell and the absolute
ohm, the difficulties of such a determination dictate that
all sources of error should be systematically investigated.
Several efforts in this direction have been described above.
On the other hand, the general adoption of the Jones and
Bradshaw [4l] aqueous potassium chloride conductance stan-
dards for research on electrolyte solutions emphasizes the
practical advantage of retaining these chemical standards
even though they may be shown to be in error. We have
adopted as a provisional reference the specific conductance
datum of Jones and Bradshaw for 0.1 demal potassium chloride
at 25 °C. As part of the development of accurate conducti-
vity techniques, inconsistencies among the other eight
standards of Jones and Bradshaw will be sought.
The adoption of a reference material (potassium chlo-
ride) for conductivity permits some specifications for purity
to be set up. The mobilities of most inorganic ions are suf-
ficiently similar that ionic impurities at the ppm level are
not a serious source of error. Exceptions are the hydrogen
and hydroxyl ions which have high mobilities in water. It
can be shown that if the pH of 5-5 M potassium chloride or
of 5.0 M sodium chloride is within 2 units of neutrality
the contribution to the specific conductance is less than
10 ppm. This requirement is not particularly stringent but
cannot be ignored. Nonelectrolyte impurities interfere only
as a weighing error and are not serious at the ppm level.
69
Page 84
Water, however, may be present at significant levels, espec-
ially in hygroscopic salts.
A comparison of 0.1 demal solutions was made between
a commercial "ultrapure" sample of potassium chloride and
a laboratory preparation that had been purified by the
procedure of Pinching and Bates [42] and in addition had
been treated by ion exchange to reduce other alkali metals
to a negligible concentration. The conductance of the
solution of the commercial sample was 0.07 percent lower
than that prepared from the fused laboratory preparation of
potassium chloride. When the commercial material was dried
for three hours at 300 °C it lost 0.045 percent of its
weight. The conductance of a 0.1 demal solution of the
dried material was again 0.035 percent lower than that of
the reference solution. Coulometric assay of the solutions
showed that the former was also 0.0^6 percent lower in
chloride. The discrepancy is believed to be due largely
to mother liquor entrained in the crystals of the com-
mercial specimen.
(T. B. Hoover)
D. Acidimetric Assay of Bilirubin
1. General Considerations
Effort has been directed toward developing a stoichio-
metric assay procedure for bilirubin, which is urgently
needed as a biological standard reference material. Bili-
rubin, which has a molecular weight of 584.7, has two
carboxyl groups, suggesting that these functional groups
might be titratable in a suitable system. Bilirubin was
known to be very insoluble in water but quite readily
soluble in dimethylsulfoxide (DMS0) and in strong alkali.
70
-
Page 85
In alkaline aqueous solution it is readily degraded by-
oxygen and light. Consequently, titrations were carried
out in closed vessels, under argon atmosphere, and shielded
from direct light. Reagents were added through a septum by
means of a hypodermic syringe. Efforts were made to avoid
a pH greater than 10 and to keep exposure to stronger al-
kali as brief as possible consistent with complete solution
of the sample.
2
.
Conductance Measurements
Exploratory measurements were made in dimethylformamide—T — 1 — 1
(solvent conductance 4x10 ' « cm ) and in DMSO (solvent_o _-] _ -i
conductance 4x10 ' ^ cm ) . In both solvents bilirubin
appeared to be a very weak electrolyte and the salt form
differed little in equivalent conductance from the titrant
(tetrabutylammonium hydroxide). Consequently, the end
points of the titrations were barely detectable.
In the aqueous system, bilirubin was dissolved in an
excess of 0.05 M sodium hydroxide and back-titrated with
0.05 M hydrochloric acid. Significant differences in the
slopes of the titration curve were observed for the three
major regions of the titration (free alkali, titration of
bilirubin, and excess acid), but the transitions were highly
rounded, preventing precise location of the end points.
The large excess of strong electrolyte needed to dissolve
the sample initially was a serious drawback in the con-
ductometric technique.
3. Emf Titrations
One object of potentiometric titrations in water was
to confirm published observations on the solubility, ioniza-
tion, and pH at half neutralization of bilirubin [4^].
An alkaline solution of bilirubin was back-titrated with
0.05 M hydrochloric acid while the pH was measured with a
71
Page 86
combination glass-calomel electrode that had been standard-
ized in phosphate buffer at pH 6.86. In confirmation of
the above reference, the curves showed a single, sharp
break at pH 8.3, when the acid form of bilirubin began to
precipitate; the half-neutralization pH at 22.5 °C was 8.20.
No separation of the two carboxyl groups was detectable.
In the titration range in which bilirubin was precipitating,
equilibrium was reached very slowly. After an addition of
acid, the pH immediately decreased and required as long as
half an hour to return to the equilibrium value, which was
reproducible to ± 0.05 pH unit in different runs. In con-
trast to the published report [4j5], back titration with
standard alkali did not retrace the equilibrium curve but
always showed hysteresis in the direction of higher pH.
The freshly precipitated bilirubin, however, redissolved
more readily than the original sample. These results indi-
cate that bilirubin, because of Its extreme insolubility
at pH less than 8, precipitates in a colloidal form that
traps some of the ionic or salt form and only very slowly
approaches a stoichiometric composition. Consequently,
an indirect approach was adopted of dissolving the sample
In a minimum of alkali and titrating only the excess base.
The most satisfactory procedure was to weigh the
sample into the clean, dry cell under argon and add DMSO
equivalent to 5 to 10 percent of the final volume. This
was not enough to dissolve the sample completely but it
wet and dispersed the bilirubin. Next, 0.05 M sodium
hydroxide was added, equivalent to not more than 100 percent
excess, and the solution was immediately diluted with suf-
ficient water to cover -the pH electrode. The standardized
electrode was inserted and the cell contents were titrated
by gravimetric additions of 0.02 M hydrochloric acid to pH 8
or until a definite break in the pH curve was reached.
72
Page 87
The cell used for 2-3 mg samples of bilirubin is shown
in figure lo . A similar cell having a capacity of 25 cm
was used for larger samples. In use, the cells were wrap-
ped in aluminum foil as a light shield. The results of
some titrations are summarized in table 15. Runs 10, 11,
and 12 show that repetitive titrations of the same sample
were reproducible to about 0.5 percent, even over a 24-hour
period, indicating that instability of the bilirubin was
not serious. The agreement between different samples is
much poorer, and the causes of this lack of reproducibility
are still under investigation.
Figure 18 Cell for the potentiometric titration
of bilirubin.
(T. B. Hoover)
73
Page 88
O SK (^ O KA VO oo invo in in in in in 4 ka -=t
cooo co 00 co oo CO oo 00 CO
Wa ffiO o O CX
oo 00 CO oCO
ino M WW W ffi 2 • •H a Ch
Ch a Q, fi 00£ ti
PO PJ C >s c c £
o o O >R M O o CD o o cd O o Op p -P o
HCh •HP
•Hp
H •HP
•HP
X5 •HP
•Hp
•HP
•\ *\ •\ ^ cd Cd C cd cd P cd cd cd
CQ o o O T* o U U •H Sh U X •\ U Fh •\ uP co co CO CD CO P p P P CD o P -P o pc S S S M s •H •H •S •H •H Pi CO •H •H CO •HCD Sh P. (H u P Q P •H p P P in P P <«
—
s P P s PB CD CD CD CD 6 CD p pB P P P p >£ ^ CD ^ T3 T3 P T5 T3 J2 T3 T5 T3o cd cd cd cd o O o U o £ U cd S Sh P >R £ !h >R £o ^ ^ ^ :s rH rH rH Ph H CVJ KA ;s CVJ ka =t in CVJ K\ m CVJ
p «J
£ p OA oo rH OA O vo m 00 \T\ 0- t- rH m in CVJ vo vo rH o ^fCD 5rH H t- in in VO OA H rH b~ 00 =* 00 vo vo l>- co in vo o c^
• cd a1 O co C3A o CO CO O O O o o H rH H H 0A 0A OA o a>s a CD m CAJ CM KA CVJ CAJ KA m ka KA KA KA KA KA KA CVJ CVJ CVJ m CVJ
•H Ch£2 <2Sh
•HrH K vo•H o <-—
.
o in O O m o O CVJ KA in in vo CA o KA co OArQ cd a1
CD
CVJ OA OA co C3A KA CVJ oo 00 VQ KA co o o OA K\ CO t- oo CA
Cp, d. rH vo VQ VO VO lA- 0- t>- KA KA -3" rH CVJ CVJ H O o O CVJ CVJ
O PCD
S3
—
-
H in in m ^t -3- ^t- -^ =t =f ^t in in
ao•H KAP •
cd rH CVJ
?H O C3A-P > CVJ
•H ka in in in in o O o o o o O-P rH 6 • • CD
cd o ts- t- t- IA- co OA oo co o rH CVJ ?O P CVJ CVJ CVJ rH•H O cd
in EH >-P(D rHB cd
o £ o•H •H •HP rQ H o VO O co MO 0A o -=t co o KA P£ 2 -—«. CD o KA co co rH vo vo =t o vo VO CD
CD rH 50 m o O o OA rH H KA in KA o CO UP •H B • • • OO rH V ' m CAJ <AJ CAJ rH CVJ CVJ CVJ vo KA CVJ m CD
Ph •H H H rH rHrH
•
in COrH •
oCD £rH H CVJ ka =f in vo 0- CO CA O rH CVJ
,o d rH rH rHcd 2FH cr;
74
Page 89
E. A Standard for Ion-Selective Electrodes
It is anticipated that a Standard Reference Material,
sodium chloride, will be issued in the near future, together
with a provisional certification of values for the activi-
ties of sodium and chloride Ions. When this first standard
is made available, a detailed publication will be prepared
describing methods for the standardization and use of ion-
selective electrodes.
(B. R. Staples)
75
Page 90
8. FOREIGN-CURRENCY PROGRAMS
The two projects sponsored by the Electrochemical
Analysis Section at universities in India and financed
through the provisions of Public Law 480 continued active
during the reporting year. A brief description of these
programs follows.
Properties of Electrolytes in Nonaqueous Media ,
Jadavpur University, Calcutta, Dr. M. N. Das and
Dr. K. K. Kundu
(a) Standard potentials of the Ag-AgI electrode in
ethylene glycol-water mixtures.
(b) Dissociation constants of tris(hydroxymethyl)-
aminomethane in ethylene glycol.
(c) Studies in isodielectric media.
1. Standard potentials of the Ag-AgBr electrode
in propylene glycol-methanol solvent systems.
2. Autoprotolysis constants of propylene glycol-
methanol solvent systems.
5. Standard potentials of the Ag-AgI electrode
in propylene glycol-methanol solvent systems.
(d) Standard potentials of the Na-Na+ electrode in
ethylene glycol-water systems.
Physicochemical Studies in Nonaqueous Solvents ,
Panjab University, Chandigarh, Professor R. C. Paul
Recent work is described in the following publication
and manuscript:
Paul, R.C., Singla, J. P., Narula, S.P.,Transference Numbers and Ionic Solvation of LithiumChloride in Dimethylformamide,J. Phys. Chem., £3, 7^1 (1969).
Paul, R.C., Singla, J. P., Narula, S.P.Transference Numbers and Ionic Solvation of SomeAlkali Salts in Dimethylformamide (in manuscript form),
76
Page 91
9. IMPACT OF SECTION'S ACTIVITIES
The impact of the Section's activities on the tech-
nical and scientific public can best be judged in terms
of the distribution of Section publications, number of
invited talks, and requests for advice and consultation
In this connection, the following statistics, compiled
for the calendar year 1968 unless otherwise indicated,
are pertinent
.
Reprints requested 68l
Manuscripts reviewed foroutside journals 22
Project proposals reviewed 2
Significant consultations 27federal and state
agencies 8industries 13universities 6
Committee memberships 16
Publications (7/68 to 6/69) 11
Talks (7/68 to 6/69) 21scientific societies 12universities 3industries 2government agencies 4
77
Page 92
10. PERSONNEL
Roger G. Bates, Section Chief
Marguerite Raudenbush, Section Secretary-
Conductance Measurements T. B. Hoover
Electromotive Force andAcidity Measurements
pH, Ion-selectiveelectrodes
Heavy water,mixed solvents
Nonaqueous solvents
Consultant
B. R. StaplesM. Alfenaar (July to Sept.)
from University ofUtrecht, Holland
J. T. Clark, Jr.(July to Sept
.
)
guest worker fromClarkson College ofTechnology
R. S. Carter, Jr.(June to Aug.
)
guest worker fromLandon School
M. PaaboH. P. Thun (Oct. to July)
guest worker fromUniversity of Ghent,Belgium
E. S. Etz (July to Sept.)from Clarkson Collegeof Technology
D. Rosenthal, ClarksonCollege of Technology
78
Page 93
11. COMMITTEE MEMBERSHIPS
R. G. Bates
Member, Subcommittee on Hydrogen Ion Determinations,ASTM Committee E-l, Sub. 22.
Councilor, American Chemical Society,representing the Division of Analytical Chemistry.
Member, ACS Council Committee on Publications.
Chairman, Undergraduate Awards CommitteeACS Division of Analytical Chemistry.
Member, NRC Committee on Symbols, Units, andTerminology for the Physical Sciences(U.S. National Committee for ISO/TC-12).
Member, Commission on Electrochemistry, IUPAC
.
Member, Commission on Symbols, Terminology, andUnits, IUPAC.
Associate Member, Commission on ElectroanalyticalChemistry, IUPAC.
Chairman, Subcommittee on Physico chemical Symbols andTerminology, Committee on Physical Chemistry, NRC.
Member, Committee Yl, Abbreviations for Science andEngineering, U.S.A. Standards Institute.
Member, Committee Y10, Letter Symbols, U.S.A.Standards Institute.
Member, Board of Editorial Advisers,Analytica Chimica Acta .
Member, Board of U.S. Civil Service Examiners(Chemistry Panel).
Member, Museum Committee (NBS).
T. B. Hoover
Treasurer, D.C. Chapter, Society of the Sigma Xi
.
B. R. Staples
Member, Ad Hoc Division Committee on Electronic DataSystems, Analytical Chemistry Division, NBS.
79
Page 94
12. PUBLICATIONS AND MANUSCRIPTS, JULY 1968 TO JUNE 1969
i. Bates, R.G. (Ed.)Electrochemical Analysis Section: Summary ofActivities, July 1967 to June 1968,NBS Technical Note 453 (July 1968).
2. Davis, M.M.Acid-Base Behavior in Aprotic Organic Solvents,NBS Monograph 105 (August 1968).
3. Bates, R.G.Equilibrium Properties of Acids and Bases inAmphiprotic Mixed Solvents, in Hydrogen-BondedSolvent Systems , A. K. Covington and P. Jones, Eds.),Taylor and Francis Ltd., London, 1968, pp. 49-86.
4. Pool, K.H., Bates, R.G.Thermodynamics of Hydrochloric Acid in 95 VolumePer Cent (92.41 Mass Per Cent) Ethanol fromE.M.F. Measurements at 5 to 50 °C,
J. Chem. Thermodynamics, 1_, 21-29 ( 1969 )
.
5. Paabo, M., Bates, R.G.Standards for a Practical Scale of pD in Heavy Water,Anal. Chem., 4l, 283 (1969).
6. Staples, B.R., Bates, R.G.Two New Standards for the pH Scale,J. Res. Nat. Bur. Stand., 73A, 37 (1969).
7. Hoover, T.B.The N-Methylpropionamide-Water System. Densitiesand Dielectric Constants at 20-40°,J. Phys. Chem., 73, 57 (1969).
8. Staples, B.R., Atkinson, G.Structure and Electrolyte Properties in BolaformElectrolytes. III. The Hydrodynamics of PotassiumSalts of Several Rigid Bolaform Disulfonic Acids inDioxane-Water Mixtures at 25°,J. Phys. Chem., 73, 520 (1969).
9. Waddell, W.J., Bates, R.G.Intracellular pH,"Physiol. Revs., 49, 285 (1969).
80
Page 95
10. Robinson, R.A., Paabo, M., Bates, R.G.Deuterium Isotope Effect on the Dissociationof Weak Acids in Water and Deuterium Oxide,J. Res. Nat. Bur. Stand., JJA, 289 ( 1969 )
.
11. Bates, R.G.Inner Reference Electrodes and Their Characteristics,in Glass Microelectrodes (M. Lavallee, 0. P. Schanne,and N. C. Hebert, Eds . )_, John Wiley and Sons,New York, 1969, pp. 1-24.
12. Bates, R.G.Medium Effects and pH in Nonaqueous Solvents, inSolute-Solvent Interactions (C. D. Ritchie andJ. P. Coetzee, Eds. )
Marcel Dekker, New York, 1969 (in press).
15. Bates, R.G.Hydrogen IonsEncyclopaedia Brittanica (in press).
14. Bates, R.G., Alfenaar, M.Activity Standards for Ion-Selective Electrodes, inIon-Selective Electrodes (R. A. Durst, Ed.)NBS Special Publication 314, 1969 (in press).
15. Paabo, M., Bates, R.G.Dissociation of Deuteriocarbonate Ion inDeuterium Oxide from 5 to 50 °C,J. Phys . Chem., 73 (in press).
16. Bates, R.G.Measurement of Reversible Electrode Potentials, inTechniques in Electrochemistry(E. Yeager and A. Salkind, Eds.
)
Wiley-Interscience, New York (in press).
17. Staples, B.R., Turner, D.J., Atkinson, G.An Apparatus for the Determination of Rates ofProton Transfer and Other "Very Past Reactions,Chem. Instrumentation (in press).
81
Page 96
1J>. TALKS, JULY 1968 TO JUNE I969
1. Bates, R.G., fr Acid-Base Interactions in Hydrogen-Bonded Mixed Solvents", Chemistry Seminar,University of Florida, Gainesville, Florida,July 15, 1968.
2. Bates, R.G., "Problems in Monitoring Ion Concentrationsin Dilute Aqueous Systems", Environmental EngineeringSeminar, University of Florida, Gainesville, Florida,July 15, 1968.
3. Hoover, T.B., "Dielectric Friction and Entropy ofConductance of Ions in Solution", 156th National ACSMeeting, Atlantic City, N.J., September 9, 1968
.
4. Paabo, M., "Thermodynamics of the Dissociation ofDeuterocarbonate Ion in Heavy Water from 5 to 50 °C",156th National ACS Meeting, Atlantic City, N.J.,September 9, 1968.
5. Alfenaar, M., "Ionic Activity Scales and Standardsfor Ion-Specific Electrodes"', 156th National ACSMeeting, Atlantic City, N.J., September 12, 1968
.
6. Bates, R.G., "Practical Approaches to AcidityMeasurement in Amphiprotic Solvents",Physical Chemistry Seminar, Tyco Laboratories, Inc.,Waltham, Mass., October 30, 1968
.
7. Bates, R.G., "Measurement of Acidity in Alcohol-WaterMixtures", Connecticut Valley ACS SectionUniversity of Connecticut, Storrs, Conn.,November 4, 1968
.
8. Bates, R.G., "Solvent Effects on Protolytic Equilibriain Hydrogen-Bonded Mixed Solvents", Western VermontACS Section, St. Michael's College, Winooski, Vt
.
,
November 6, 1968
.
9. Bates, R.G., "Solvent Effects on Protolytic Equilibriain Hydrogen-Bonded Mixed Solvents",Central Massachusetts ACS Section,Assumption College, Worcester, Mass.,November 7, 1968.
10. Bates, R.G., "Solvent Effects on Protolytic Equilibriain Hydrogen-Bonded Mixed Solvents",Maine ACS Section, Portland, Maine,November 8, 1968
.
82
Page 97
11. Bates, R.G., "Effect of the Solvent on Acid-BaseReactions In Solution", Chemistry Visitors Day,University of Kentucky, Lexington, KentuckyNovember 22, 1968
.
12. Bates, R.G., "Effect of Solvent Properties on theStrengths of Carboxylic and Cationic Acids inMethanol-Water Solvents", National Institutes ofHealth — National Bureau of Standards JointColloquium, NIH, Bethesda, Maryland,January 7, 1969
.
13. Bates, R.G., "Requirements for pH Analysis"Course on Advances in Instrumental Analysis,Walter Reed Army Institute of Research,Washington, D.C., January 16, 1969
.
14. Bates, R.G., "Activity Standards for Ion-SelectiveElectrodes", Symposium on Ion-Selective Electrodes,NBS, Gaithersburg, Maryland, January J>0, 1969.
15. Bates, R.G., "Measurement of Acidity in Alcohol-WaterSolvents", Northern New York ACS Section,Clarkson College of Technology, Potsdam, N.Y.,February 6, 1969
.
16. Staples, B.R., "Activity Scales for Ion-SelectiveElectrodes", Middle Atlantic Regional Meeting of ACS,Washington, D.C., February 15, 1969
.
17. Bates, R.G., "Solvent Effects on Acid-Base Equilibriain Hydrogen-Bonded Mixed Solvents", Analytical GroupNorth Jersey ACS Section, Seton Hall University,South Orange, N.J., February 24, 1969
.
18. Paabo, M., "Deuterium Isotope Effect on the FirstDissociation of Phosphoric Acid and RelatedThermodynamic Quantities", 157th National ACS Meeting,Minneapolis, Minnesota, April 17, 1969
.
19- Bates, R.G., "Solute-Solvent Interactions andAcid-Base Behavior", Fisher Award Address,157th National ACS Meeting, Minneapolis, Minnesota,April 17, 1969.
83
Page 98
20. Staples, B.R., "Ion-Selective Electrodes and ActivityScales", Central Electricity Research Laboratories,Analytical Chemistry Section, Leatherhead, Surrey,England, April 30, 1969.
21. Bates, R.G., "pH", Symposium on an InternationalStandard Reference Materials Program,National Bureau of Standards, Gaithersburg, MarylandMay 22, 1969.
84
Page 99
14. LIST OF REFERENCES
Electrochemical Analysis; Studies of Acids, Bases ,
and Salts by Emf , Conductance, Optical, and KineticMethods. July 1965 to June 1966"R. G. Bates, Ed.), NBS Technical Note 400September 6, i960).
Electrochemical Analysis Section: Summary ofActivities, July 1966 to June 1967 .
R. G. Bates, Ed.), NBS Technical Note 423October 1967)
•
British Standard 1647: Specification for pH Scale ,
British Standards Institution, London (1961).
Staples, B.R., Bates, R.G.J. Res. Nat. Bur. Stand., 73A, 37 (1969)
.
Paabo, M., Bates, R.G.Anal. Chem., 41, 283 (1969) .
Lewis, J.C.Anal. Biochem., 14, 495 (1966).
Bates, R.G., Guggenheim, E.A.Pure Appl. Chem., 1, 163 (i960).
Bates", R.G., Paabo, M., Robinson, R.A.J. Phys. Chem., 67, 1833 (1963).
Simon, W., Lyssy, G.H., Mbrikofer, A., Heilbronner, EZusammenstellung von Scheinbaren Dissoziations -
konstanten im Lbsungsmittelsystem Methylcellosolve/Wasser \ Juris-Verlag Zurich. Band I, 1959.
Sommer, P.F., Simon, W.Ibid . Band II, 1961. Band III, 1963.
Electrochemical Analysis Section: Summary ofActivities, July 1967 to June 1958"!
R. G. Bates, Ed.), NBS Technical Note 453'July 1968).
Bates, R.G., Alfenaar, M.Chapter 6 in Ion-Selective Electrodes .
(R. A. Durst, Ed.) NBS Special Publication 314,1969.
85
Page 100
13] Shedlovsky, T. Madnnes, D.A.J. Amer. Chem. Soc, 59, 503 (1937).
14] Robinson, R.A., Stokes, R.H.Electrolyte Solutions , 2nd ed
., appendix 8.10
Butterworths, London, 1959.
15] Shatkay, A.Anal. Chem., 39, 1056 ( 1967 )
.
16] Shatkay, A., Lerman, A.Anal. Chem., 4l, 514 (1969).
17] McDougall, A.O., Long, F.A.J. Phys. Chem., 66, 429 (1962).
18] Salomaa, P., Schaleger, L.L., Long, F.A.J. Amer. Chem. Soc, 86, 1 (1964).
19] Bates, R.G.J. Res. Nat. Bur. Stand., 47, 127 (1951).
20] Bell, R.P.The Proton in Chemistry , Chapter 11Cornell University Press, Ithaca, N.Y., 1959.
21] Robinson, R.A., Paabo, M., Bates, R.G.J. Res. Nat. Bur. Stand., 73A , 289 ( 1969 )
.
22] Paabo, M., Bates, R.G.Unpublished work.
23] Woodhead, M., Paabo, M., Robinson, R.A., Bates, R.G.J. Res. Nat. Bur. Stand., 69A , 263 (1965).
24] Paabo, M., Bates, R.G., Robinson, R.A.J. Phys. Chem., 70, 247 (1966).
25] Paabo, M., Robinson, R.A., Bates, R.G.Anal. Chem., 38, 1573 (1966).
26] Hetzer, H.B., Robinson, R.A., Bates, R.G.J. Phys. Chem., 72, 208l (1968).
27] Bates, R.G.In Hydrogen-Bonded Solvent Systems (A. K. Covingtonand P. Jones, Eds.), p. 49.Taylor and Francis, London, 1968.
86
Page 101
Schindler, P., Robinson, R.A., Bates, R.G.J. Res. Nat. Bur. Stand., 72A, l4l (1968).
Bates, R.G., Siegel, G.L., Acree, S.F.J. Res. Nat. Bur. Stand., 30, 347 (1943).
Bates, R.G., Hetzer, H.B.J. Phys. Chem., 65, 667 (1961).
Pranks, F., Ives, D.J.G.Quart. Rev., _20, 1 (1966).
Bates, R.G., Bower, V.E.J. Res. Nat. Bur. Stand., 53, 283 (1954).
Bates, R.G.Determination of pH, Theory and Practice , Chapter 7John Wiley and Sons, New York, 1964.
Ives, D.J.G. , Pryor, J.H.J. Chem. Soc, 2104 (1955).
Feates, F.S., Ives, D.J.G., Pryor, J.H.J. Electrochem. Soc, 103, 580 (1956).
Reeburgh, W.S.J. Marine Res., 23, 187 (1965).
Mandel, M., Decroly, P.
Nature, 182, 794 (1958).
Butler, J.N.J. Phys. Chem., 72, 3288 (1968).
Garnsey, R., Prue, J.E.Trans. Faraday Soc, 64, 1206 (1968).
Coetzee, J.F., Bertozzi, R.J.Anal. Chem., 4l, 860 (1969).
Jones, G., Bradshaw, B.C.J. Amer. Chem. Soc, 55, 1780 (1933).
Pinching, G.D., Bates, R.G.J. Res. Nat. Bur. Stand., 37, 311 (1946).
Overbeek, J.T.G., Vink, C.L.J., Deenstra, H.Rec Trav. Chim., 74, 8l (1955).
87
Page 103
NBS TECHNICAL PUBLICATIONS
PERIODICALS
JOURNAL OF RESEARCH reports National
Bureau of Standards research and development in
ics, mathematics, chemistry, and engineering.
prehensive scientific papers give complete details
r the work, including laboratory data, experimental
dures, and theoretical and mathematical analy-
Illustrated with photographs, drawings, andits.
hed in three sections, available separately:
• Physics and Chemistry
Pipers of interest primarily to scientists working in
t;ese fields. This section covers a broad range of
cal and chemical research, with major emphasis
en standards of physical measurement, fundamental
constants, and properties of matter. Issued six times
a Near. Annual subscription: Domestic, $9.50; for-
$11.75*.
• Mathematical Sciences
Studies and compilations designed mainly for the
mathematician and theoretical physicist. Topics in
mathematical statistics, theory of experiment design,
numerical analysis, theoretical physics and chemis-
iogical design and programming of computers
and computer systems. Short numerical tables.
Issued quarterly. Annual subscription: Domestic,
$5.00; foreign, $6.25*.
• Engineering and Instrumentation
Reporting results of interest chiefly to the engineer
and the applied scientist. This section includes manyof the new developments in instrumentation resulting
from the Bureau's work in physical measurement,data processing, and development of test methods.
It will also cover some of the work in acoustics,
applied mechanics, building research, and cryogenic
engineering. Issued quarterly. Annual subscription:
Domestic, $5.00; foreign, $6.25*.
TECHNICAL NEWS BULLETIN
The best single source of information concerning the
Bureau's research, developmental, cooperative andpublication activities, this monthly publication is
designed for the industry-oriented individual whosedaily work involves intimate contact with science andtechnology
—
for engineers, chemists, physicists, re-
search managers, product-development managers, andcompany executives. Annual subscription: Domestic,
$3.00; foreign, $4.00*.
• Difference in price is due to extra cost of foreign mailing.
NONPERIODICALS
Applied Mathematics Series. Mathematical tables,
manuals, and studies.
Building Science Series. Research results, test
methods, and performance criteria of building ma-terials, components, systems, and structures.
Handbooks. Recommended codes of engineering
and industrial practice (including safety codes) de-
veloped in cooperation with interested industries,
professional organizations, and regulatory bodies.
Special Publications. Proceedings of NBS confer-
ences, bibliographies, annual reports, wall charts,
pamphlets, etc.
Monographs. Major contributions to the technical
literature on various subjects related to the Bureau's
scientific and technical activities.
National Standard Reference Data Series.
NSRDS provides quantitive data on the physical
and chemical properties of materials, compiled from
the world's literature and critically evaluated.
Product Standards. Provide requirements for sizes,
types, quality and methods for testing various indus-
trial products. These standards are developed coopera-
tively with interested Government and industry groups
and provide the basis for common understanding of
product characteristics for both buyers and sellers.
Their use is voluntary.
Technical Notes. This series consists of communi-cations and reports (covering both other agency andNBS-sponsored work) of limited or transitory interest.
Federal Information Processing Standards Pub-lications. This series is the official publication within
the Federal Government for information on standards
adopted and promulgated under the Public Law89-306, and Bureau of the Budget Circular A-86entitled, Standardization of Data Elements and Codes
in Data Systems.
CLEARINGHOUSE
The Clearinghouse for Federal Scientific andTechnical Information, operated by NBS, supplies
unclassified information related to Government-gen-erated science and technology in defense, space,
atomic energy, and other national programs. Forfurther information on Clearinghouse services, write:
Clearinghouse
U.S. Department of CommerceSpringfield, Virginia 22151
Order NBS publications from: Superintendent of DocumentsGovernment Printing Office
Washington, D.C. 20402
Page 104
U.S. DEPARTMENT OF COMMERCEWASHINGTON, D.C. 20230
OFFICIAL BUSINESS POSTAGE AND FEES PAID
U.S. DEPARTMENT OF COMMI