242
Chapter 10
Electrochemical Anodic Oxidation of
Organic Compounds Coupled with the
Cathodic Production of Molecular Hydrogen
Sections reprinted with permission from Park, H.; Vecitis, C. D.; Hoffmann, M. R.
Journal of Physical Chemistry A 2008, 112, 33, 7616-7626.
© 2008 American Chemical Society
243
Abstract
A Bi-doped TiO2 anode, which is prepared from a mixed-metal oxide coating deposited
on Ti metal, coupled with a stainless steel cathode is shown to be efficient for
conventional water splitting. In this hybrid photovoltaic/electrochemical system, a
photovoltaic (PV) cell is used to convert solar light to electricity, which is then used to
oxidize a series of phenolic compounds at the semiconductor anode to carbon dioxide,
with the simultaneous production of molecular hydrogen from water/proton reduction at
the stainless steel cathode. Degradation of phenol in the presence of a background NaCl
electrolyte produces chlorinated phenols as reaction intermediates which are
subsequently oxidized completely to carbon dioxide and low-molecular-weight
carboxylic acids. The anodic current efficiency for the complete oxidation of phenolic
compounds ranges from 3 to 17%, while the cathodic current efficiency and the energy
efficiency for hydrogen gas generation ranges from 68 to 95% and from 30 to 70%,
respectively.
244
Introduction
Hydrogen is under consideration as a viable alternative and renewable energy source.
This is partially due to the increasing price of fossil fuels and a growing demand for fuels
that are carbon-free and therefore environmentally benign1–3. In the United States alone,
the hydrogen market was estimated to have an economic value of $798 million in 2005;
this number is expected to rise to $1,600 million in 20103. Hydrogen is produced
primarily by steam-methane reformation (SMR). SMR accounts for 95% and 48% of all
hydrogen produced in the U.S. and in the world, respectively. However, the SMR process
has a large carbon footprint in the form of carbon dioxide and carbon monoxide
emissions. For example, the carbon released during SMR is 2.5 times by mass greater
than the hydrogen produced.
Electrochemical water splitting (i.e., electrolysis) provides a zero-carbon alternative to
SMR. However, the major component of the cost of electrolytic hydrogen production is
not the energy efficiency, but the price of electricity. In this regard, the U.S. Department
of Energy (DOE) has established a target energy efficiency of 76% (corresponding to
$2.75/GGE H2) for electrolytic hydrogen generation (e.g., alkaline electrolyzers or proton
exchange membrane electrolyzers) by 2015. The current average for commercial
electrolyzers is 62%4. In order to reduce the overall cost of the electrolysis, low-cost,
renewable energy sources, such as solar light, should be utilized as an energy source.
Alternatively, the overall costs could also be reduced by implementation of a dual-
purpose electrolytic system that couples hydrogen generation with energy-intensive water
or wastewater treatment.
245
The underlying concept of solar-light driven (PV) electrolysis for hydrogen production
has been previously suggested and evaluated5–9. The primary objective is to produce
hydrogen as a storable fuel of high energy density for the dark generation of electricity.
This approach is an alternative to a battery-based storage system. However, the PV-
electrolyzer-hydrogen systems were determined to be economically impractical as
compared to the PV-electricity-battery systems, due to inefficiencies of converting
electrons to hydrogen. Thus it is suggested to simultaneously treat wastewater by
electrolysis to improve overall energy efficiencies. Hybrid systems which electrolytically
produce hydrogen while simultaneously oxidizing organic substrates have also been
reported10–12. However, the previously reported systems operate noncatalytically, with
much lower efficiencies, and require severe conditions (e.g., pH < 2, molar ranges of
reagents), making them nonpractical.
Therefore, in order to address the goal of PV-driven electrolytic hydrogen production
with simultaneous oxidation of wastewater constituents, we have combined a stainless-
steel (SS) cathode for reductive hydrogen production with a Bi-doped TiO2 anode for
oxidative organic destruction. It was determined that the hybrid electrolysis system
operates catalytically (addition of organics increases H2 production efficiencies) under
mild conditions (50 mM salt) with relatively high efficiencies (30% to 70% H2 energy
efficiencies).
The details of the electrochemistry give insight into these processes. The anode
generates oxidizing radical species (e.g., OH•, Cl•) (eq. 10.1), which subsequently react
with aqueous pollutants while the cathode splits water into hydrogen (eq. 10.2). Oxygen
evolution via water oxidation (eq. 10.3) is normally the complementary reaction to H2
246
production (eq. 10.2) and thus the generation of radical species (eq. 10.1) at the anode
results in nonstoichiometric water splitting (i.e., H2/O2 > 2).
H2O → OH• + H+ + e− (E° = 2.74 V vs. NHE) (10.1)
2H2O + 2e− → H2 + 2OH− (E° = 0 V) (10.2)
2H2O → O2 + 4H+ + 4e− (E° = 1.23 V) (10.3)
CxHyOz + (x + 0.25y – 0.5z) O2 → xCO2 + 0.5 yH2O (10.4)
Previously, we developed a Nb4+-doped polycrystalline TiO2 anode, which generated
hydroxyl radical via one-electron oxidation of water at average current efficiencies of
50%13-16. However, a newer, more robust, and longer lived semiconductor anode based
on a mixed metal oxide of BiOx-TiO2 has been developed. This anode operates at current
efficiencies in the range of 20 to 30%17. In this study, a BiOx-TiO2 anode is coupled with
stainless steel cathode and powered by a photovoltaic (PV) array to oxidize organic
substrates while simultaneously generating molecular hydrogen (Scheme 10.1)18,19.
Phenol is used as a model chemical substrate as phenolic compounds are a common
contaminant present in industrial (solvents) and municipal (detergent by-products)
wastewater20,21.
Experimental Methods
Electrodes
The anode was prepared as follows: 1) A Ti metal sheet (Ti-Gr.2 sheet, 0.50 mm thick)
was cleaned using SiC paper (120 to 240 grit) before coating with a sequence of
substrates (Scheme 10.2a). 2) An initial metal oxide coating containing Ir and Ta oxides
at an Ir:Ta = mole ratio of 0.67:0.33 is deposited and annealed to the Ti metal base. 3) A
second metal oxide coating of Bi-doped SnO at a Sn:Bi mole ratio of 0.9:0.1 is applied 2
247
and annealed. 4) A third layer of Bi-doped TiO at a Ti:Bi mole ratio of 0.96:0.04 is
applied and annealed at high temperature. 5) The final step involves the deposition of the
anodically active overcoat that also contains Bi-doped TiO at a Ti:Bi mole ratio of
0.9:0.1. Each successive step of coating requires a specific heat-treatment regime at
different temperatures and durations. More details are provided elsewhere . Two types
of anode-cathode couples were used for the experiments reported herein. The first couple
is composed of a single anode with an active area of contact with the electrolyte solution
of 10.0 × 2.0 cm , and two-piece stainless-steel (SS) cathodes (Hastelloy C-22) of the
same size on both sides (i.e., a sandwich configuration) of the Bi-doped TiO anode, at a
separation distance of 2 mm. The second configuration involves a small pilot-scale
reactor consisting of 5 anode plates (5 pieces × 800 cm /piece) and 6 stainless steel
cathode plates that face each other with a distance of separation of 2 mm (Scheme 10.2b).
2
2
17
2
2
2
Electrolysis Experiments
The BiOx-TiO2 anode and SS cathode couple was immersed in an aqueous electrolyte
solution of 50 mM NaCl (200 mL or 20 L) and was stirred under continuous purging with
air or nitrogen as a background carrier gas. The target substrates (e.g., phenol) were
mixed in with a background electrolyte or added during the course of electrolysis. A
constant cell voltage or current was applied to the electrodes with a DC power supply
(HP 6263B and 6260B). For the PV-powered electrolyses, a commercial thin film,
amorphous silicon PV (Silicon Solar, Inc.) with a peak power output of 6.4 W (PVpeak =
Epeak ×Ipeak; Epeak = 8 – 10 V; Ipeak = 0.95A) and with active surface area of 1280 cm2 was
used (Scheme 9.1). Incident solar radiation was monitored and recorded with a
pyranometer (Apogee) connected to a datalogger (Campbell Scientific). Cell voltage (Ecell)
248
and cell current (Icell) were measured by multimeters (Fluke). The current efficiencies
(CEs) and the energy efficiencies (EEs) for hydrogen production (i.e., higher heating
value) were obtained by the following equations 10.5–10.9
2 2 2Number of molecules produced (H , O , or CO ) or degraded (phenol)CE (%) = ×n×100Number of electrons flowed
(10.5)
22
cell cell
(39 W h/g H rate 2 g/mol)DC or PV-powered Electrolytic H EE = 100%E I
⎛ ⎞⋅ × ××⎜ ⎟×⎝ ⎠
(10.6)
cell cell cellPV = E (applied to the cell reactor)I× (10.7)
cellcell -2 2
PV (W)Solar-to-PV EE = 100%Solar Flux (W cm ) PV Area (cm )
⎛ ⎞×⎜ ⎟×⎝ ⎠
(10.8)
( )22Solar-to-H EE = Electrolytic H EE Solar-to-PV EE 100%× × (10.9)
where n = 2 and 4 for hydrogen and oxygen production in cathodic current efficiencies
(CCEs), respectively. For the anodic current efficiencies (ACEs), n = 1 for one-electron
oxidation of phenol (ACE-I), and n = 14/3 for complete oxidation from carbon at phenol
to carbon at carbon dioxide (ACE-II).
Analytical Procedures
The reactor was sealed from the ambient atmosphere. At a given rate, the headspace
gas of the reactor was extracted with a peristaltic pump and extracted by a differentially
pumped membrane inlet into a low-pressure cell with a quadrupole mass spectrometry
(Balzers) via a turbo pump (Pfeiffer; 5.0 × 10 torr). The volume percent of various gases
in the headspace was calculated assuming that the percent was directly proportional to the
ion current measured by the mass spectrometer, and that the transfer of all gases through
-6
249
the membrane and their 70 eV electron ionization cross-sections were approximately
equivalent. This assumption was validated in part since ambient air was measured to be
77% nitrogen, 17% oxygen, 5% water vapor, and 1% argon.
Aqueous organic compounds including intermediates were analyzed by a high-
performance liquid chromatography (HPLC, Agilent 1100 series) with a C18 column.
The eluent was composed of 55% Milli-Q water (0.1 wt% acetic acid) and 45%
acetonitrile at flow rate of 0.7 mL/min. Analyte concentration was monitored by UV-Vis
spectrophotometry. Total organic carbon was determined (TOC, OI Analytical Aurora
Model 1030) with an autosampler (OI Analytical Model 1096).
Results and Discussion
Electrolytic Nonstoichiometric Water Splitting
Figure 10.1 shows a typical DC-powered electrolysis at the BiO -TiO anode coupled
to the stainless-steel cathode couple in the presence of sodium chloride as a supporting
electrolyte. Water splitting is initiated at 2.0V which is approximately 0.8 V higher than
the ideal potential (E° = 1.23 V). The rates of H production and O production increase
with increasing cell voltage (E ). Furthermore, cell currents (I ) also increase in a
linear fashion with increasing E above 2.1V. The rates of formation of H and O ,
respectively, are 9.0 μmol/min per mA/cm and 1.3 μmol/min per mA/cm , which
correspond to nonstoichiometric H to O ratios between 6 and 7, depending on the
specific experimental conditions. This indicates additional anodic reactions (eq. 10.1) as
well as water oxidation (eq. 10.3) takes place simultaneously at the anode. Water
oxidation at the surface of a semiconducting, metal oxide (MO) anode like TiO is known
to proceed by the coupling of two surface-bound hydroxyl radicals (eq. 10.10 & 10.11).
x 2
2 2
cell cell
cell 2 2
2 2
2 2
2
250
≡Ti-OH+ H O → ≡Ti-OH[OH ] + H + e (10.10) 2•
ad+ −
2≡Ti-OH[OH ] → 2≡Ti-OH + O + 2H + 2e (10.11) •ad 2
+ −
The current efficiencies for the hydrogen production at the SS cathode are close to 70%
while those for the oxygen production at the BiO -TiO anode are in the range of 10 to
25% (Figure 10.1c). In spite of an initial N atmosphere, H O can be produced via
superoxide/hydroperoxyl radical pathway at the cathode (eqs. 10.12 to 10.14) due to
oxygen reduction.
x 2
2 2 2
O + e → O (at the SS) (10.12) 2−
2−
O + H → HOO (pK = 4.88) (10.13) 2− + •
a
2 HOO → H O + O (10.14) •2 2 2
The cathodic reaction 10.12 will limit the current efficiency for the hydrogen production.
The energy efficiencies, which are expressed in terms of Higher Heating Values (HHV)
for H production, are in the range of 35 to 60% (Figure 10.1d). This value decreases
with increasing applied power. However, the energy efficiency can be improved, either
by reducing the ohmic potential drop in the cell by increasing electrolyte concentration,
or by coating noble metal (e.g., Pt) on the stainless-steel cathode.
2
Electrochemical Oxidation of Organic Compounds
The electrochemical oxidation and complete degradation of phenol at current density
of I = 14 mA/cm is shown in Figure 10.2. Phenol is completely degraded following first-
order kinetics with an apparent half-life of t = 4.25 min.
2
1/2 The end-product of phenol
oxidation, CO2, is initially detected after 38 min of electrolysis (Figure 10.2a). Under
these conditions, the H2 production rate (i.e., 95 μmol/min) is reduced slightly to 90
μmol/min, concomitant with initiation of CO2 production, while the O2 production rate
251
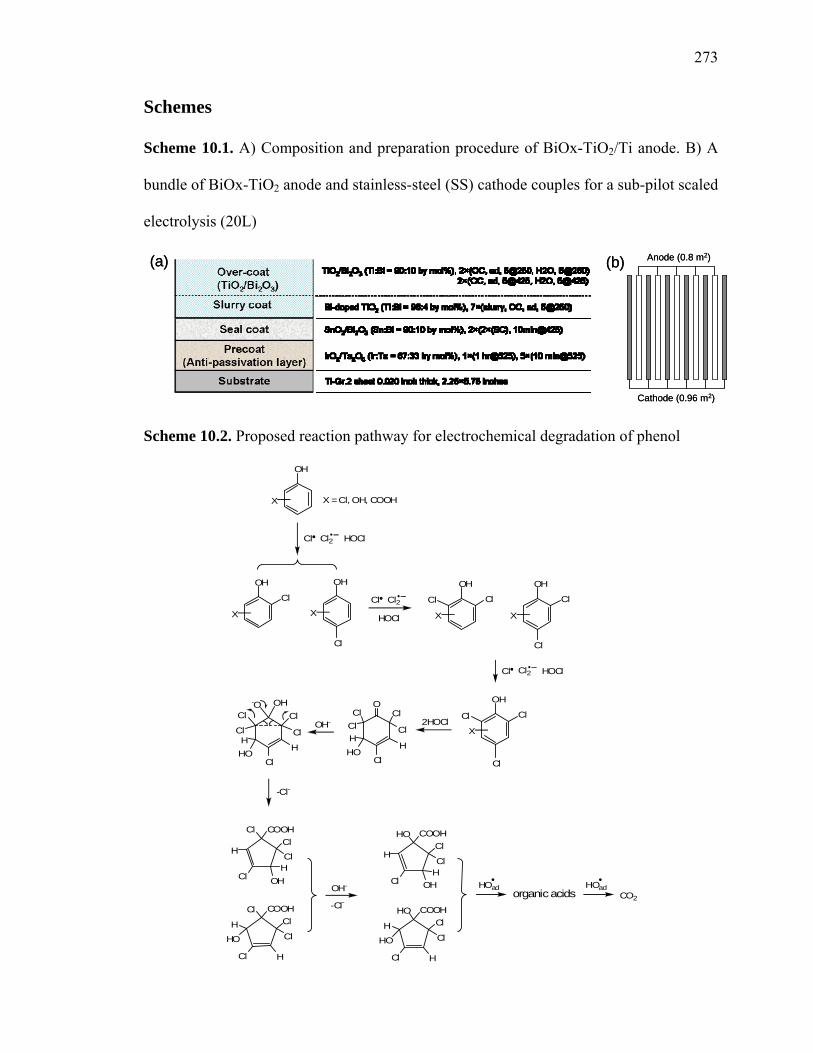
remains steady at 15 μmol/min. As phenol degrades, mono-, di-, and trichlorinated
phenols are formed as intermediates by stepwise chlorination of the parent phenol. The
chlorinated phenols are completely decomposed within 1 h (Figure 10.2b and Scheme
10.2). When added separately, the chlorinated phenols are degraded with similar kinetics
to phenol in following order of electrochemical reactivity: 2,4,6-trichlorophenol (3.74) >
2,6-dichlorophenol (1.84) > 2,4-dichlorophenol (1.38) > phenol (1.0) > 2-chlorophenol
(0.78) > 4-chlorophenol (0.57). The numbers in parenthesis are observed reaction rates
relative to phenol. At around 40 min of electrolysis, trichlorophenol begins to degrade
rapidly (Figure 10.2a) and at the same time carbon dioxide release begins (Figure 10.2a).
The total organic carbon (TOC) concentration also begins to decrease dramatically at this
time (Figure 10.2c), consistent with CO2 production. It is notable that after 2 h
electrolysis the total amount of CO2 released accounts for 25% of the initial amount of
carbon present in phenol, while carbon removal based on TOC measurements is close to
34%. The “apparent carbon deficit” (~ 9%) consists of dissolved carbonate (CO32−) and
bicarbonate (HCO3−), which are removed by acidification prior to actual TOC
measurements.
The phenol oxidation intermediates observed during the electrolytic degradation of
phenol vary depending on the composition of anode surface and on the nature of the
supporting electrolyte. In the case of Na2SO4, oxygenated or hydroxylated phenols such
as catechol, hydroquinone, and benzoquinone are observed as the primary aromatic
intermediates22–26. In contrast, for NaCl, a carbon-based anode produces chlorinated
phenols as intermediates and SnO2/Ti and IrO2/Ti anodes produce nonchlorinated
intermediates27. The electrolysis with NaCl as a background electrolyte is reported to
252
generate active chlorine species, such as chlorine radical (Cl•), dichloride radical anion
(Cl2•−), and hypochlorous acid/hyperchlorite (HOCl/OCl−) via surface-bound hydroxyl
radical mediated pathways (eqs. 10.15–10.18).
≡Ti-OH[OH ] + Cl → ≡Ti-OH + Cl•ad
− • + HO− (10.15)
Cl• + Cl → − Cl2•− (K = 1.4 × 10⁵ M-1) (10.16)
≡Ti-OH[OH•]ad + Cl− → ≡Ti-OH + HOCl + e− (10.17)
HOCl → OCl− + H+ (pKa = 7.46) (10.18)
The rate constants for the reaction of hydroxyl radical, chlorine radical, dichloride radical
anion, and HClO with phenol are 6.6×10⁹ M-1s-1,28 2.5×10¹⁰ M-1s-1, 2.5×10⁸ M-1s-1, and
2.2×10⁴ M-1s-1 29,30, respectively. As a consequence, phenol and its oxidation
intermediates have a variety of degradation pathways, including surface-bound/free
hydroxyl radicals, chlorine radicals, dichloride radical anions, hypochlorite ions, and
possibly hydrogen peroxide as well.
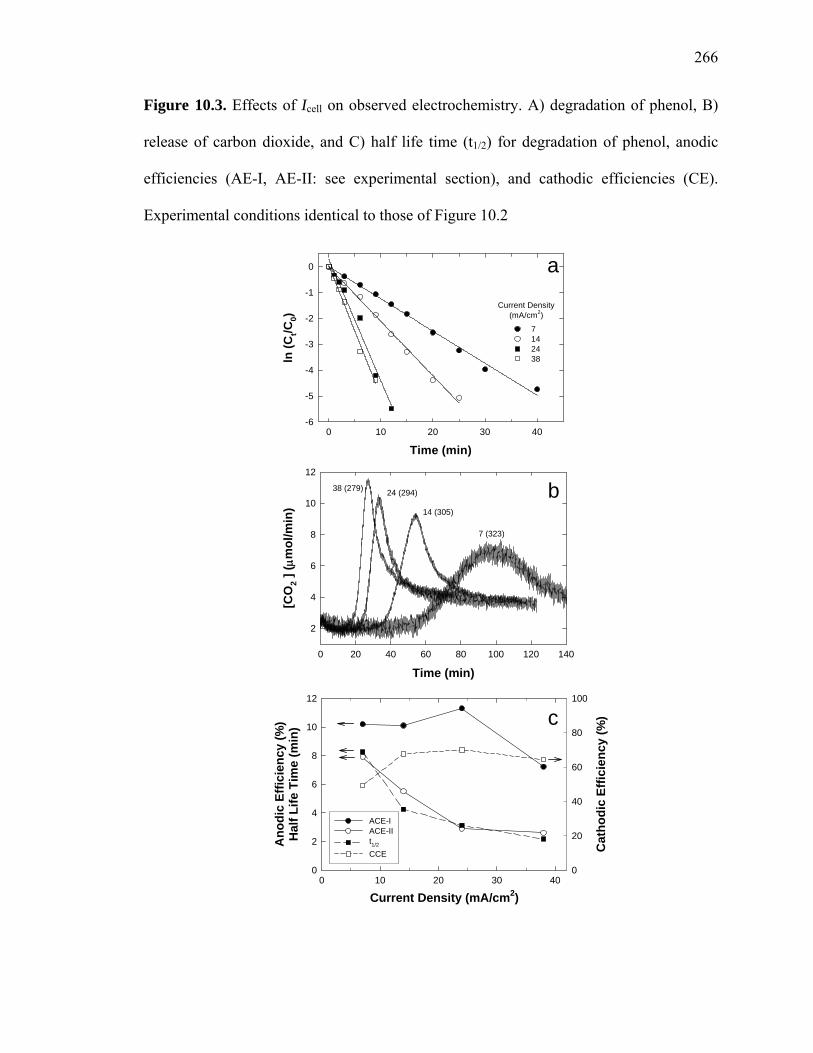
As the current density is increased from 7 to 38 mA/cm2, the half life (t1/2) for phenol
oxidation along with the anodic current efficiency (ACE-II) for complete oxidation of
phenol carbon (formal charge -2/3) to carbon dioxide (formal charge +4) decreases
(Figure 10.3). The faster phenol oxidation rates yield shorter CO2 release phase-delays of
60 to 15 min. However, the amount of carbon dioxide released during the course of the
electrolysis and the anodic current efficiency (ACE-I) for one-electron oxidation of
phenol (PhOH → PhOH+ + e−) is not altered significantly (Figure 10.3c). In addition,
cathodic current efficiency (CCE) for hydrogen production is almost invariable in the
range of 50 to 70%.
253
The initial concentration of phenol markedly affects the apparent degradation rate. The
half life grows linearly with concentration over the range of 0.5 to 2.0 mM (Figure 10.4)
and increases by two orders of magnitude at higher concentrations (i.e., t1/2 = 1.28 min at
0.5 mM and t1/2 = 150 min at 10 mM). As the concentration of phenol is increased, a
greater number of reaction intermediates are produced, which in turn compete with
phenol for oxidants. This should result in both a decrease in t1/2 and a lengthening of the
release onset time of carbon dioxide. The anodic current efficiency (ACE-I) is lowered
somewhat to 8% at concentrations above 1.0 mM, while the ACE-II ranges from 5 to
10%. On the other hand, CCE is invariable (~ 68%) to increasing the initial phenol
concentration. This indicates that anodic radical production and subsequent organic
oxidation has minimal effects on the hydrogen production as long as substrates are
initially present in the medium. A comparison of hydrogen production with and without
organic substrates suggests addition of aqueous pollutants synergistically enhances the H2
production rate18,19.
The electrolytic efficiency of Na2SO4 vs. NaCl as background electrolyte was also
compared. The phenol degradation rate in NaCl is two orders of magnitude faster than
that in Na2SO4 (Figure 10.5). Sodium phosphate and carbonate have similar effects to
sodium sulfate as background electrolytes. However, the cathodic H2 production
efficiency using Na2SO4 as an electrolyte is 23% greater than NaCl. When 50 mM NaCl
is added to a 50 mM Na2SO4 solution at increasing concentrations, the phenol
degradation efficiency increases while the H2 production efficiency decreases (i.e., CCE
at 50 mM Na2SO4 = 95%; CCE at 50 mM Na2SO4 + 50 mM NaCl = 73%; CCE at 50 mM
254
NaCl = 68%). This indicates the anode is oxidatively active during generation of chlorine
radical species and suggests these chlorine radicals can interrupt H2 production.
During the course of electrolysis of water and electrolyte alone, the pH of solution
rises initially from pH 6 to 10 and then remains constant throughout. After current is
removed, the pH decreases to 9.5 (Figure 10.6). In contrast, when electrolysis takes place
in the presence of phenol, the pH increases initially to 11 and then decreases quickly to
pH 7 after 20 min, and then remains in the circum-neutral range (~ pH 7.5) during the
latter stages of electrolysis. The cathodic reduction of protons results in a rise in the
measured pH. However, the progressive oxidation of phenol eventually produces organic
acids such as oxalic, maleic, and formic acid, which account for the subsequent drop in
pH. Eventually, these daughter acids are further degraded at the anode surface by
surface-bound hydroxyl radicals to aqueous CO2 (e.g., CO2⋅H2O, HCO3−, CO3
2−) with the
subsequent release of gaseous CO2 accounting for the slight increase of the pH after 38
min of electrolysis (Scheme 10.2). This is the time that measurable CO2 is released from
the reactor (Figure 10.2a vs. Figure 10.6).
At pH 10, phenol is partially deprotonated (pKa = 9.98) while the BiOx-TiO2 anode due
to the presence of Lewis acid metals (e.g., Bi) at the surface should be positively charged
despite the predominance of TiO2 (pHzpc of TiO2 ~ 6.8). Thus, the ability of phenol to
react directly at the anode surface at pH 10 is possible but the degree of interaction is
unlikely to be strong. In contrast, substrates that are able to strongly adsorb to the anode
via surface complexation should be oxidized quickly and immediately release CO2 by
multi-electron transfers instead of sequential one-electron transfers. This conjecture is
confirmed by the results shown in Figure 10.7 for the oxidation of catechol (pKa1 = 9.45;
255
pKa2 = 12.8)31. Catechol functions as a monodentate or a bidentate ligand binding at one
or two surface titanol groups. Thus as soon as the electrolysis is initiated, CO2 is
immediately released from solution and continues over the 2 hour period of electrolysis.
Salicylic acid (pKa1 = 2.97; pKa2 = 13.74) also shows the same behavior. Both
compounds have been observed to chelate TiO2 surfaces (as depicted on the right-hand
side of Figure 10.7)31,32, and multiple electrons can be transferred to the anode within
seconds after the initiation of electrolysis. Nevertheless, the first-order rate constants for
degradation of catechol and salicylic acid are lowered by approximately 50% compared
to phenol (kcatechol/kphenol = 0.59; ksalicylic acid/kphenol = 0.41). In the case of phenol, oxidation
primarily occurs on homogeneously distributed phenol molecules (and intermediates) in
the bulk solution, whereas in the cases of catechol and salicylic acid, the oxidation
preferentially occurs to the adsorbed molecules rather than the ones remaining in the bulk.
This should result in immediate and complete oxidation of the adsorbed phenol molecules,
but a slower oxidation rate of the phenol molecules in the bulk solution.
Solar Powered Electrolysis and Scale-Up
Figure 10.8 shows the hydrogen production and organic oxidation results of a PV-
driven hybrid reactor system under two different solar light irradiation conditions. The
total incident solar light radiation energy of A (I ) is measured at 0.107 ± 0.005 W/cm ,
while that of B (I ) is around 0.100 ± 0.005 W/cm . The overall reaction scheme is
similar to that in Figure 10.2a. As soon as the PV is connected to the electrode couples,
hydrogen and oxygen are produced and phenol is degraded, following apparent first-order
kinetics. Carbon dioxide is released during the latter stages of the electrolysis. The
difference of incident solar energy only affects the rate of hydrogen production; the
S,B2
S,A2
256
phenol degradation rate, the oxygen generation rate, and the carbon dioxide release time-
delay are almost invariable. At the condition B, the energy efficiency for the hydrogen
production is around 30%. According to manufacturer, a theoretical maximum power of
the PV is 6.4 W corresponding to 4.5% of the average solar light radiation energy (I
= 1100 W/m ). However, when the PV is directly connected to the electrode couple, the
power applied to the electrolysis (PV ) was 3.5 W (3.9V×0.9A). This corresponds to
55% of the PV and 2.5% of the I .
peak S,0
2
cell
peak S,0
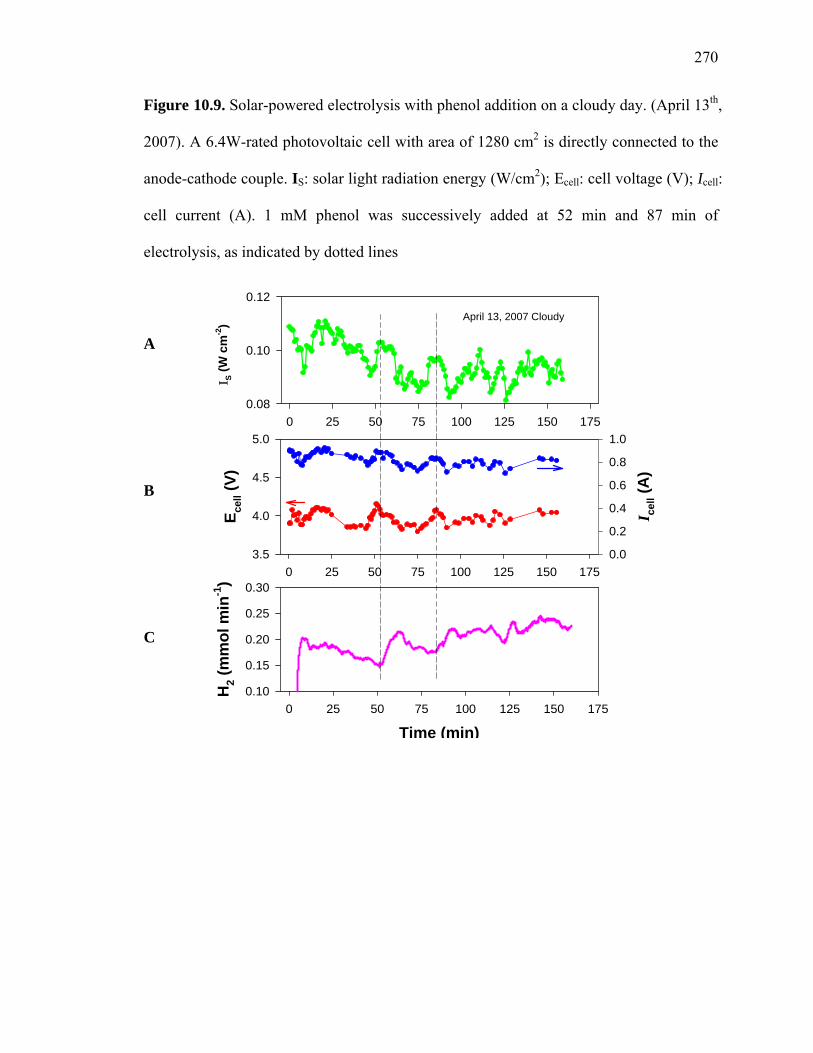
To investigate the effect of solar flux on the PV power and the H production, the PV-
connected hybrid reactor was tested on a cloudy day. As shown in Figure 10.9, I , E ,
and I vary over the range of 0.1 W/cm to 0.08 W/cm , 4.1 V to 3.7 V, and 0.7 A to 0.9
A, respectively. The I continually decreases over the period of time from 15 min to 50
min of electrolysis, and the PV and the H production rate also follow the trend.
However, upon addition of phenol to the reactor at 52 min, the H production rate
substantially increases in spite of a continued decrease in I and PV . The H production
rate begins to decrease again after reaching a rate maximum of ~ 0.21 mmol/min. This
behavior was observed again after a subsequent phenol addition at around 80 min.
2
S cell
cell2 2
S
cell 2
2
S cell 2
The
synergistic effect of phenol addition on H2 production efficiency has been qualitatively
described elsewhere18. Briefly, oxidants such as HO•, Cl•, Cl2•−, and HClO/ClO-
produced at the anode can act as electron shuttles consuming electrons at the cathode.
Reactive oxidant reduction is thermodynamically favored over proton/water reduction.
When organics such as phenol are added to the system, they consume oxidants and a
greater fraction of cathodic electrons are available for proton/water reduction. Our
257
observations show this can increase H2 production energy efficiencies by as much as 30
to 53% at low Icell.
The PVcell is correlated to the IS with and without phenol addition (Figure 10.10a).
Without phenol addition (i.e., pure electrolysis), the PVcell efficiency (= PVcell/IS × 100%)
is determined to be 2.0 to 2.8 %. The lower efficiency than supplier-reported (PVpeak =
4.5%) is probably due to overestimation of the array performance by the supplier and a
conversion efficiency loss by the heating of the array and ohmic drop within the reactor33.
The PVcell efficiency increases linearly by 1.5 times from 2.37% to 3.58% by addition of
phenol. The presence of phenol molecules also affects the electrolytic H2 energy
efficiency and behavior. As PVcell increases in the absence of organics, the electrolytic H2
production increases linearly with an average efficiency of 22% (= H2 energy/PVcell in
Figure 10.10b). However, in the presence of phenol, the H2 production energy
efficiencies do not correlate with PVcell. Prior to phenol addition, the electrolytic H2
energy efficiency is around 20%. After phenol addition, PVcell decreases to 2.1×10⁻³
W/cm2 and H2 production efficiencies increase to nearly 40%. The overall solar-to-H2
energy efficiency (= H2 energy/IS × 100%) also displays a similar trend. In the absence of
phenol, the overall efficiency is around 0.67% (Figure 10.10c). The addition of phenol
increases the overall efficiency from 0.53% (5.5×10⁻⁴ W cm-2/ 1.03×10⁻¹ W cm-2) to 1.0%
(8.1×10⁻⁴ W cm-2/8.1×10-2 W cm-2), which is similar to the efficiency observed in Figure
10.8.
For evaluation of a sub-pilot scale electrolysis, a 20 L batch reactor was prepared using
5 anodes (each, 800 cm2) and 6 cathodes of the same dimensions arranged in an
alternative fashion (Scheme 10.2b). At a total power of 60 W (3 V×20 A), carbon
258
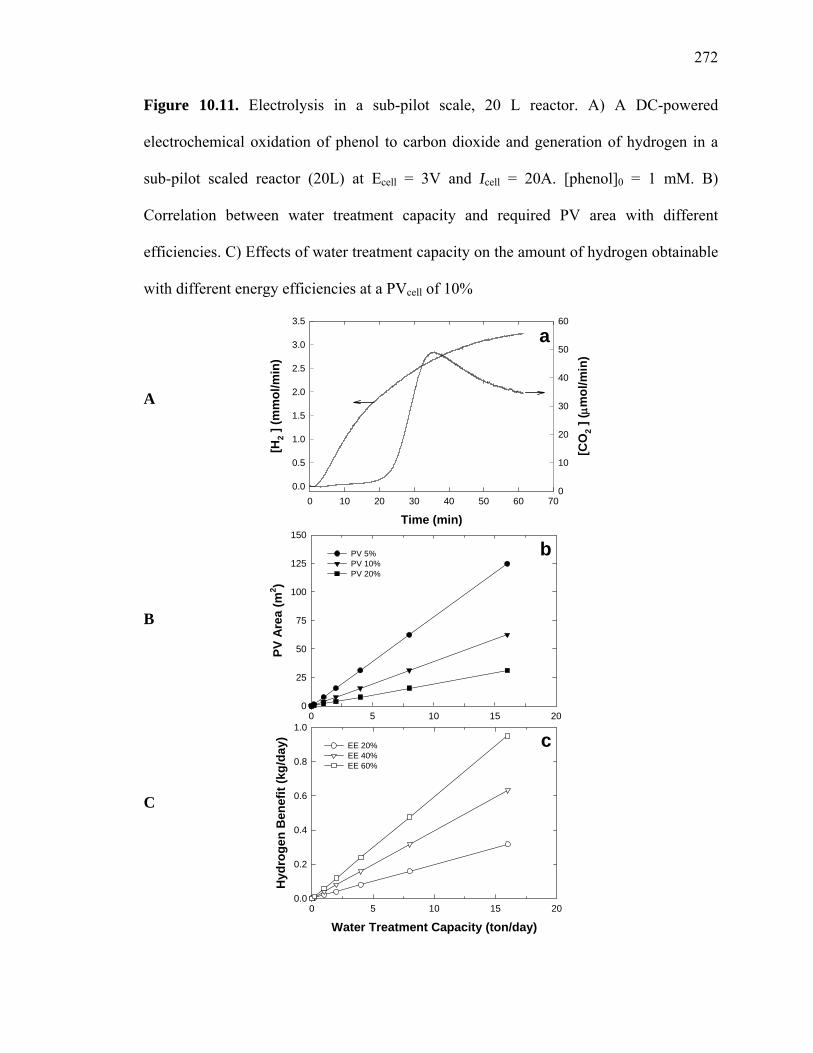
dioxide production is observed after 20 min, and the hydrogen production rate is 3.5×10⁻³
mol/min with an energy efficiency of 28% (Figure 10.11a). The degradation half-life of 1
mM phenol is < 2 min. Based on these operation conditions, we can estimate the PV area
required (i.e., PVcell efficiency = PVcell/(IS,0 × PV area) × 100%) to treat variable
volumes of wastewater contaminated with 1 mM phenol (Figure 10.11b). It is clear that
water-treatment capacity is strongly related to the PV area and efficiency. For example,
treatment of 16 metric tons of water (i.e., 1.6 kg phenol) daily (i.e., operation for 9 h/day)
requires a 62 m2 PV panel operating at 10% efficiency. In addition, hydrogen is obtained
as a potentially useful byproduct. Hydrogen production rates are affected both by the
water treatment capacity and H2 energy efficiency (Figure 10.11c). Small-scale reactors
are usually better than large reactors for energy efficiency. At a H2 energy efficiency of
60%, the treatment of 16 tons of water with a PV of 10% efficiency will yield around 1
kg of H2.
Technical Consideration.
Electrodes
Commercial electrolytic water splitting typically employs Pt group metals (PGM) as
anodes and Ni-based alloy (e.g., Ni-Zn, Ni-Al, Ni-Co, Ni-Mo-Cd)34-36, stainless steel36, or
noble metals (e.g., Pt, Au) as cathodes, and operates at extreme conditions such as high
electrolyte concentrations (> 1.0 mol/L), high pH (> 1.0 mol/L KOH), and high pressure.
The main reason for employing the Pt-based anode is that Pt catalyzes the four-electron
oxidation of water (10.3). However, for the electrochemical oxidation of organic
compounds (10.4), the anode should preferentially generate surface-bound or
homogeneous radical species (e.g., HO•, Cl•).
259
A variety of anodes, such as single metal oxides (e.g., PbO224,25,37-41, SnO2
24,37,39,42,
IrO242,43, RuO2
43), multiple metal oxides (e.g., Ta2O5/IrO244, Bi-PbO2/Pt40, PbO2/SnO2
45,
IrO2/RuO2/TiO246), and boron-doped diamond (BDD)47 have been utilized for the
electrolytic treatment of aqueous chemical contaminants. For example, PbO2 coated on
titanium substrate has been widely studied; however, the likely release of lead ions and
long-term anodic stability issues are drawbacks to the practical application of PbO2
anodes. The BDD electrode has also been the subject of a number of studies due to its
great stability and wide potential window47; yet the high price of synthetic diamond
hinders application even at the pilot scale. Application of Pt-based anodes is impractical
due to formation of polymeric surface films during phenol oxidation, which reduces
energy efficiencies22,48,49. In comparison, the BiOx-TiO2 anode employed in this study is
found to be very stable and results in decent current efficiencies in the range of 25 to 36%
for oxidation of propylene glycol17. In addition, it has been manufactured at the sub-pilot
scale with electrode areas nearing a square meter at relatively low costs. Various cathodes
are available for use in combination with the BiOx-TiO2 anode. From an economical
point of view, SS is the most feasible in cost, stability, and availability. Surface treatment
of SS (e.g., Ni or Pt-coating) may catalyze electron transfer to protons/water and increase
H2 energy efficiencies50,51. However, a great increase is not expected, since energy
efficiencies are already in the range of 30% to 70%.
Technical Comparison
It should be noted that the PV-electrolysis-water-treatment system used in this study
has many differences as compared to the commercial PV-electrolyzer systems. First, few
experimental studies on hybrid PV-electrolyzer technologies for H2 production and
260
organic oxidation operating at such mild conditions (atmospheric pressure, pH 6 to 11, 50
mM salt) have been reported. For example, Ahmad and Shenway evaluated a PV-driven
electrolysis system for hydrogen production with reported electrolysis efficiencies of
60% (similar to our system) under much harsher conditions (27% KOH solution; ~ 4.8
mol/L; pH 14.7)6. Comparison of the solar-to-H2 energy efficiency is not reliable due to
different overall purpose and conditions. A high-powered and efficient PV usually has a
high solar-to-H2 efficiency. Photovoltaic arrays of 5–9 kW PVpeak and 8.1–8.4% PVcell
efficiency, coupled with alkaline electrolyzer (30% KOH) of 62 to 77% electrolytic H2
efficiency, have overall solar-to-H2 efficiency of 3.6 to 6.2%33,52. The alkaline
electrolyzer of similar electrolytic H2 efficiency (60%) has a much lowered solar-to-H2
energy efficiency of 1.5% when coupled to a lower power PV (PVpeak = 53 W)6. Due to
the extremely high electrolyte concentration, which is a usual condition for optimal
efficiency during alkaline electrolysis, it is impractical for application to water treatment.
In comparison, our system operates over a similar efficiency range (electrolytic H2
energy efficiency of 30% to 70%; solar-to-H2 energy efficiency ~ 1.0%) with a low-
power PV (PVpeak = 6.4 W) at two-orders of magnitude lower electrolyte concentrations
(2 × 10⁻² to 5 × 10⁻² mol/L).
Second, PV-electrolyzer systems on a lab or pilot scale have been considered and
examined as alternatives to a system of PV-electricity-battery. The systems are typically
composed of PV arrays for converting solar light to electricity, alkaline electrolyzers for
producing hydrogen using the electricity, hydrogen storage tanks, and fuel cells for
producing electricity from the stored hydrogen (and oxygen). Therefore, the primary goal
of theses studies is to utilize hydrogen as a storable medium for the dark generation of
261
electricity. However, the PV-electrolyzer systems, which produce hydrogen, are found to
be economically impractical compared to conventional PV-electricity-battery
combinations. For example, total annual cost of the electricity from the electrolyze-based
systems is around 3 times and 4 times higher than those of the battery-based systems due
to energy losses during electrolysis and fuel-cell processes8. The hydrogen produced from
a typical PV-electrolyzer system is also more expensive than SMR. On the other hand, if
the hydrogen production can be combined with costly wastewater treatment, then PV-
electrolyzer systems may become economically viable53,54.
This hybrid system should be distinguished from reported electrochemical hybrid
systems for hydrogen production and chemical oxidation in terms of practical operation
and efficiency. Most hybrid systems operate with limited number of organic chemicals at
lower efficiencies. For example, the DC-powered electrolytic hydrogen production from
methanol was reported, but the system only works with methanol (i.e., a reversed direct
methanol fuel cell process)12. A hybrid system of electro-assisted photo-Fenton oxidation
and cathodic hydrogen production was described, yet the system operates only for a
limited number of substrates under limited conditions and needs post-electrolysis
treatment to separate the consumed reagents10. In contrast, our system has been proven to
decompose and mineralize a variety of phenolic compounds (e.g., phenol, mono-, di-,
trichlorinated phenols, catechol, hydroquinone, resorcinol, salicylic acids, etc.), aliphatic
acids (e.g., maleic acid, malonic acid, oxalic acid, fumaric acid, polypropylene, etc.), and
dyestuffs (methyl orange, ortho-methyl red, para-methyl red, methylene blue, acid orange
7, rhodamine B, etc.)18,19. These chemicals are commonly found in industrial and
domestic wastewaters.
262
Application
Some issues would limit the applications of the presented hybrid system to a
conventional water treatment facility. First the electrolyte (i.e., NaCl), which is
intrinsically necessary for the electrolysis. However, the sodium chloride is the most
abundant constituent of a water/wastewater stream, in the range 1 to 9300 kg/day21, and
wastewater inflows have a high conductivity in the range of 620 to 3550 μS/cm55. In
addition, this hybrid is found to work efficiently even at 21 mM NaCl (~ 1.2 g/L)17. The
other is that the electrolysis could produce some toxic byproducts. However, no
chlorinated gases such as methyl chloride, dichloromethane, chloroform, tetrachloride,
phosgene, vinyl chloride, or chlorine were detected during the electrolysis in the presence
of phenol. The chlorinated phenols produced are very rapidly converted to carbon dioxide
(e.g., k2,4,6-ClPhOH / kPhOH > 3.7), water, and chloride.
Separation and purification of the evolved gas stream is absolutely necessary. However,
it is not a difficult challenge. Proton-exchange membranes such as Nafion or porous
ceramic separators (e.g., fine glass frit) can be put between the anode and cathode. Since
oxygen and carbon dioxide are produced at the anode, both gases are effectively
separated from hydrogen produced at the cathode provided that there is an appropriate
membrane separating the two compartments. In addition, even if hydrogen is mixed with
carbon dioxide, CO2 can be readily removed just by chemical absorption process (e.g.,
flowing carbon dioxide gas through amine solution), which is a typical CO2 separation
process in gas turbine power plants.
Current water and wastewater treatment plants involving a series of water treatment
processes include pre-treatment steps to screen out solid debris and large particle
263
suspended solids, physical separation such as small particle coagulation, flocculation and
sedimentation, floatation and clarification, biological treatment for removal of biological
oxygen demand, and advanced oxidation treatment such as UV/ozone process for
disinfection and reduction of chemical oxygen demand. Therefore no unit process itself
could replace the overall wastewater treatment processes. Our PV-electrolytic system
would replace conventional UV/ozone steps as an advanced oxidation or disinfection
alternative.
264
Figures
Figure 10.1. Time profiles of a DC-powered hydrogen and oxygen production rate. A)
As a function of cell voltage (Ecell) at BiOx-TiO2 anode and stainless steel (SS) cathode in
50 mM NaCl solution. B) Effects of Ecell on cell currents (Icell) and the rates of hydrogen
and oxygen production. C) The rates and current efficiencies of hydrogen production and
oxygen production as a function of Icell. D) Effects of applied power on energy
efficiencies for hydrogen production
d
Applied Power (W)0 1 2 3 4 5 6
H2 E
nerg
y Ef
ficie
ncy
(%)
0
20
40
60
80c
Icell (mA/cm2)0 10 20 30 40 50
[H2
], [O
2 ] (μm
ol/m
in)
0
100
200
300
400
Cur
rent
Effi
cien
cy (%
)
0
20
40
60
80
H2
O2
H2
O2
Time (min)0 20 40 60 80 100
0
100
200
300
400
500
0
10
20
30
40
50
0
100
200
300
400
500
Rat
e ( μ
mol
min
-1)
2.674
3.06
3.35
3.86
4.28
O2
a
H2
NaCl
Ecell (V)
bCurrentH2
Rat
e ( μ
mol
/min
)
0 1 2 3 4 5
I cell (
mA
/cm
2 )
O2
265
Figure 10.2. Electrochemical oxidation of phenol to CO2 and simultaneous generation of
H2 and O2. A) At Icell = 14 mA/cm2. B) Time profiles of intermediates generated during
the oxidation of phenol. C) Time profiles of accumulation of carbon dioxide and TOC
decrease. [phenol]0 = 1 mM (0.2 L); [NaCl] = 50 mM; nitrogen purged continuously
a
Time (min)0 20 40 60 80 100 120 140
[H2 ]
, [O
2 ] ( μ
mol
/min
)
0
40
80
120
[CO
2 ] ( μ
mol
/min
)
0
2
4
6
8
Ct,P
hOH/C
0,Ph
OH
0.0
0.2
0.4
0.6
0.8
1.0Phenol
Hydrogen
Carbon dioxide
Oxygen
b
Time (min)
0.0
0.2
0.4
0.6
0.8
1.0
PhOH
Con
c. (m
M)
2-CP4-CP2,4-CP2,6-CP2,4,6-CP
0 10 20 30 40 50 60
0
100
200
300
400
500
600
c
Time (min)0 20 40 60 80 100 120 140 160
40
50
60
70
80
[CO
2 ]cu
mul
( μm
ol)
TOC
(ppm
)
25%
34%
266
Figure 10.3. Effects of Icell on observed electrochemistry. A) degradation of phenol, B)
release of carbon dioxide, and C) half life time (t1/2) for degradation of phenol, anodic
efficiencies (AE-I, AE-II: see experimental section), and cathodic efficiencies (CE).
Experimental conditions identical to those of Figure 10.2
Current Density (mA/cm2)0 10 20 30 40
Ano
dic
Effic
ienc
y (%
)H
alf L
ife T
ime
(min
)
0
2
4
6
8
10
12
Cat
hodi
c Ef
ficie
ncy
(%)
0
20
40
60
80
100
ACE-IACE-IIt1/2
CCE
Time (min)0 10 20 30 40
ln (C
t/C0)
-6
-5
-4
-3
-2
-1
0
7142438
Current Density(mA/cm2)
Time (min)0 20 40 60 80 100 120 140
[CO
2 ] ( μ
mol
/min
)
2
4
6
8
10
1238 (279) 24 (294)
14 (305)
7 (323)
a
b
c
267
Figure 10.4. Effects of phenol concentration on electrochemistry. A) degradation of
phenol, B) release of carbon dioxide, and C) half life time (t1/2) for degradation of phenol,
anodic efficiencies (AE-I, AE-II), and cathodic efficiencies (CE). Icell = 14 mA/cm2
Concentration of Phenol (mM)0.5 1.0 1.5 2.0
Ano
dic
Effic
ienc
y (%
)H
alf L
ife T
ime
(min
)
0
5
10
15
20
Cat
hodi
c Ef
ficie
ncy
(%)
0
20
40
60
80
100
ACE-I ACE-II t1/2 CCE
ln(phOH) vs rate
Time (min)0 20 40 60 80 100
ln (C
t/C0)
-6
-5
-4
-3
-2
-1
0
0.51.01.52.010
PhOH(mM)
Time (min)0 20 40 60 80 100 120 140
[CO
2 ] ( μ
mol
/min
)
2
4
6
8
10
12
14
16
0.5 (139)
1.0 (305)
1.5 (442)
2.0 (620)
a
b
c
268
Figure 10.5. Effect of NaCl concentration on the electrochemistry. Degradation rate (k)
of phenol (■) and the current efficiency for hydrogen production (●) in 50 mM Na2SO4.
For comparison, effect of 50 mM NaCl without Na2SO4 was also shown for k (□) and
hydrogen production (○). The current efficiency for hydrogen = (number of H2 molecules
× 2) / (number of electrons) × 100%
[NaCl] (mM) in 50 mM Na2SO40 10 20 30 40 50 60
k (m
in-1
)
0.00
0.05
0.10
0.15
0.20
0.25
H2 C
urre
nt E
ffici
ency
(%)
65
70
75
80
85
90
95
100
Figure 10.6. Time profiles of pH change during the course of electrolysis. Icell = 14
mA/cm2 in the absence and presence of 1 mM phenol
Time (min)0 40 80 120 160 200
pH
6
7
8
9
10
11
12
NaClNaCl+PhOH
OFF
OFF
ON
269
Figure 10.7. H2 and CO2 production during electrochemical catechol oxidation. 1 mM
catechol at Icell = 12.8 mA/cm2
Time (min)0 20 40 60 80 100 120 140
[H2 ]
( μm
ol/m
in)
0
20
40
60
80
100
[CO
2 ] ( μ
mol
/min
)
0.5
1.0
1.5
2.0
2.5
3.0
Ti
Ti
O
O
H
H
TiO
O
H
H
Figure 10.8. H2 and CO2 production during PV-electrochemical catechol oxidation. A
6.4W-rated photovoltaic cell with area of 1280 cm2 is directly connected to the anode-
cathode couple. Hydrogen A and B indicates the hydrogen production at incident solar
energy of 1.00±0.01 and 1.07±0.01 W/cm2, respectively
Time (min)0 20 40 60
[H2 ]
, [O
2 ] (m
mol
/min
)
0.00
0.05
0.10
0.15
0.20
0.25
0.30
[CO
2 ] ( μ
mol
/min
)
0
5
10
15
20C
t,PhO
H/C
0,Ph
OH
0.0
0.2
0.4
0.6
0.8
1.0PhOH
Hydrogen A
Hydrogen B
Carbon dioxide
Oyxgen
270
Figure 10.9. Solar-powered electrolysis with phenol addition on a cloudy day. (April 13th,
2007). A 6.4W-rated photovoltaic cell with area of 1280 cm2 is directly connected to the
anode-cathode couple. IS: solar light radiation energy (W/cm2); Ecell: cell voltage (V); Icell:
cell current (A). 1 mM phenol was successively added at 52 min and 87 min of
electrolysis, as indicated by dotted lines
April 13, 2007 Cloudy
0 25 50 75 100 125 150 175
Ι S (W
cm
-2)
0.08
0.10
0.12
0 25 50 75 100 125 150 175
E cell (
V)
3.5
4.0
4.5
5.0
I cell (
A)
0.0
0.2
0.4
0.6
0.8
1.0
Time (min)0 25 50 75 100 125 150 175
H2 (
mm
ol m
in-1
)
0.10
0.15
0.20
0.25
0.30
A B C
271
Figure 10.10. Relationships between IS, PVcell, and H2 energy. A) IS vs. PVcell B) PVcell
vs. H2 energy, and C) IS vs. H2 energy without and with phenol addition during
electrolysis
IS (W cm-2)
8.5e-2 9.0e-2 9.5e-2 1.0e-1 1.1e-1 1.1e-1 1.2e-1
PVce
ll (W
cm
-2)
2.0e-3
2.2e-3
2.4e-3
2.6e-3
2.8e-3
3.0e-3
w/o phenol
phenol
A
w/ phenol
y = 2.45e-4 + 2.37e-2x; R2 = 0.73
y = -9.17e-4 + 3.58e-2x; R2 = 0.86
PVcell (W cm-2)
2.0e-3 2.2e-3 2.4e-3 2.6e-3 2.8e-3 3.0e-3
H2 E
nerg
y (W
cm
-2)
5e-4
6e-4
7e-4
8e-4
9e-4
w/o phenol
y = 4.89e-5 + 2.19e-1x; R2 = 0.64
w/ phenolB
phenol
20%
40%
C
IS (W cm-2)
8.0e-2 9.0e-2 1.0e-1 1.1e-1 1.2e-1
H2 E
nerg
y (W
cm
-2)
5e-4
6e-4
7e-4
8e-4
9e-4
w/o phenol
y = -5.56e-5 + 6.735e-3x; R2 = 0.74
w/ phenol
phenol0.53%
1.0%
272
Figure 10.11. Electrolysis in a sub-pilot scale, 20 L reactor. A) A DC-powered
electrochemical oxidation of phenol to carbon dioxide and generation of hydrogen in a
sub-pilot scaled reactor (20L) at Ecell = 3V and Icell = 20A. [phenol]0 = 1 mM. B)
Correlation between water treatment capacity and required PV area with different
efficiencies. C) Effects of water treatment capacity on the amount of hydrogen obtainable
with different energy efficiencies at a PVcell of 10%
0 5 10 15 20
PV A
rea
(m2 )
0
25
50
75
100
125
150
PV 5% PV 10% PV 20%
Water Treatment Capacity (ton/day)0 5 10 15 20
Hyd
roge
n B
enef
it (k
g/da
y)
0.0
0.2
0.4
0.6
0.8
1.0
EE 20% EE 40% EE 60%
c
bTime (min)
0 10 20 30 40 50 60 70
[H2 ]
(mm
ol/m
in)
0.0
0.5
1.0
1.5
2.0
2.5
3.0
3.5
[CO
2 ] ( μ
mol
/min
)
0
10
20
30
40
50
60
a
A
B
C
273
Schemes
Scheme 10.1. A) Composition and preparation procedure of BiOx-TiO2/Ti anode. B) A
bundle of BiOx-TiO2 anode and stainless-steel (SS) cathode couples for a sub-pilot scaled
electrolysis (20L)
Anode (0.8 m2)
Cathode (0.96 m2)
(a) (b) Anode (0.8 m2)
Cathode (0.96 m2)
(a) (b)
Scheme 10.2. Proposed reaction pathway for electrochemical degradation of phenol
OH
Cl2Cl HOCl
X X =Cl, OH, COOH
OH
X
Cl
OH
X
Cl
Cl2Cl HOCl
OH
X
Cl
OH
X
Cl
Cl2Cl
HOCl
Cl Cl
OH
X
ClCl
Cl
2HOCl
OCl
Cl
ClCl
Cl
HHO
H
COOHCl
H
ClH
OH
Cl
Cl
OH-Cl
Cl
Cl
Cl
Cl
HHO
H
-O OH
COOHCl
H
Cl H
Cl
ClHO
-Cl-
OH-
-Cl-
COOHHO
H
ClH
OH
Cl
Cl
COOHHO
H
Cl H
Cl
ClHO
HOad HOadorganicacids CO2
274
Tables
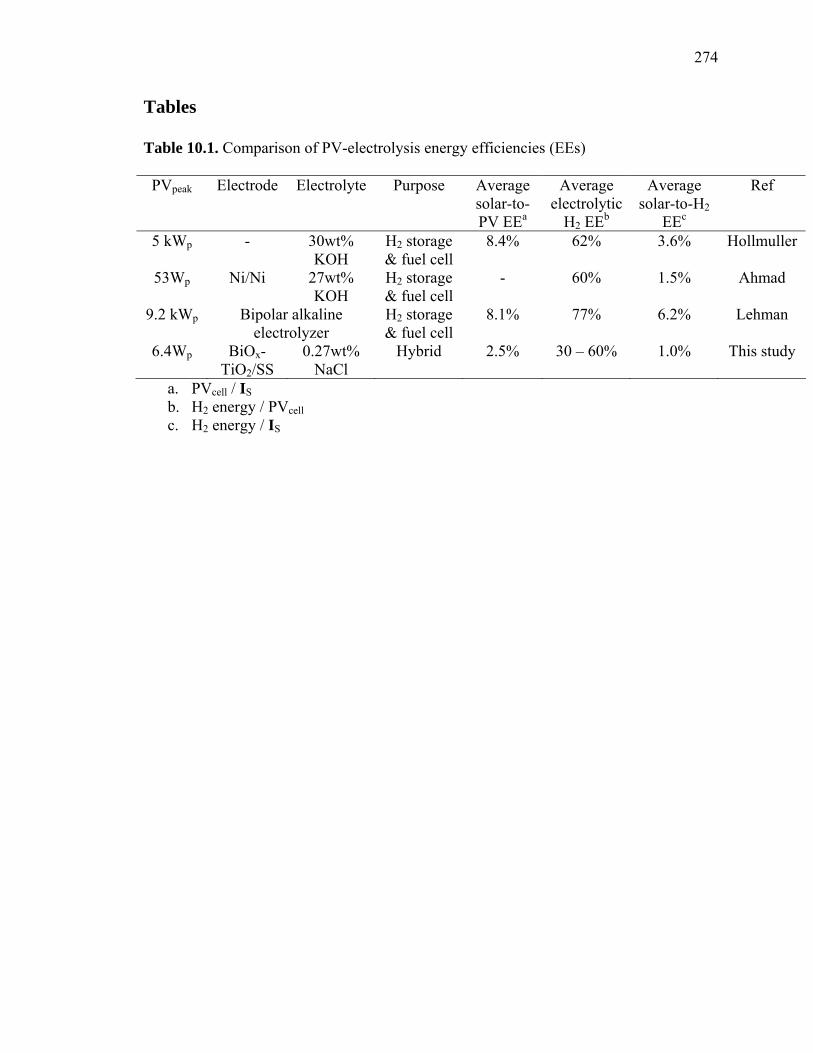
Table 10.1. Comparison of PV-electrolysis energy efficiencies (EEs)
PVpeak Electrode Electrolyte Purpose Average solar-to-PV EEa
Average electrolytic
H2 EEb
Average solar-to-H2
EEc
Ref
5 kWp - 30wt% KOH
H2 storage & fuel cell
8.4% 62% 3.6% Hollmuller
53Wp Ni/Ni 27wt% KOH
H2 storage & fuel cell
- 60% 1.5% Ahmad
9.2 kWp Bipolar alkaline electrolyzer
H2 storage & fuel cell
8.1% 77% 6.2% Lehman
6.4Wp BiOx-TiO2/SS
0.27wt% NaCl
Hybrid 2.5% 30 – 60% 1.0% This study
a. PVcell / IS b. H2 energy / PVcell c. H2 energy / IS
275
References
(1) International Energy Outlook 2006; Energy Information Administration.
(2) Penner, S. S. Energy 1998, 23, 71.
(3) 2005 Hydrogen Market, Hydrogen R&D and Commercial Implication in the U.S.
and E.U., available at http://www.researchandmarkets.com/reports/301714.
(4) Solar and Wind Technologies for Hydrogen Production, available at
http://www.hydrogen.energy.gov/congress_reports.html.
(5) Korposki, B.; Levene, J.; Harrison, K.; Sen, P. K.; Novachek, F. Electrolysis:
Information and Opportunities for Electric Power Plants, available at
http://www.osti.gov/bridge.
(6) Ahmad, G. E.; El Shenawy, E. T. Renewable Energy 2006, 31, 1043.
(7) Turner, J. A. Science 1999, 285, 687.
(8) Friberg, R. Int. J. Hydrogen Energy 1993, 18, 853.
(9) Szyszka, A. Int. J. Hydrogen Energy 1998, 23, 849.
(10) Soler, L.; Macanas, J.; Munoz, M.; Casado, J. Int. J. Hydrogen Energy 2006, 31,
129.
(11) Mathieson, G.; Langdon, A.; Jamieson, G. Dev. Chem. Eng. Mineral Process
2006, 14, 71.
(12) Narayanan, S. R.; W., C.; Jeffries-Nakamura, B.; Valdez, T. I. Hydrogen
Generation by Electrolysis of Aqueous Organic Solutions; U.S. Patent 6,368,492; Apr. 9,
2002.
(13) Kesselman, J. M.; Weres, O.; Lewis, N. S.; Hoffmann, M. R. J. Phys. Chem. B
1997, 101, 2637.
276
(14) Weres, O.; Hoffmann, M. R. Electrode, Electrode Manufacturing Process and
Electrochemical Cell, U.S. Patent 5,419,824, 1995.
(15) Weres, O.; Hoffmann, M. R. Electrochemical Method and Device for Generating
Hydroxyl Free Radicals and Oxidizing Chemical Substances Dissolved in Water; U.S.
Patent 5,364,508; Nov. 15, 1994.
(16) Weres, O.; Hoffmann, M. R. Electrochemical Device for Generating Hydroxyl
Free Radicals and Oxidizing Chemical Substances Dissolved in Water; U.S. Patent
5,439,577; Aug. 8, 1995.
(17) Weres, O. Electrode with Surface Comprising Oxides of Titanium and Bismuth
and Water Purification Process Using This Electrode; U.S. Patent 0,000,774 A1; Jan. 4,
2007.
(18) Park, H.; Vecitis, C. D.; Choi, W.; Weres, O.; Hoffmann, M. R. J. Phys. Chem. C
2008, 112, 885.
(19) Park, H.; Vecitis, C. D.; Hoffmann, M. R. J. Phys. Chem. C 2008, (accepted).
(20) Glassmeyer, S. T.; Furlong, E. T.; Kolpin, D. W.; Cahill, J. D.; Zaugg, S. D.;
Werner, S. L.; Meyer, M. T.; Kryak, D. D. Environ. Sci. Technol. 2005, 39, 5157.
(21) Barber, L. B.; Murphy, S. F.; Verplanck, P. L.; Sandstrom, M. W.; Taylor, H. E.;
Furlong, E. T. Environ. Sci. Technol. 2006, 40, 475.
(22) Gattrell, M.; Kirk, D. W. J. Electrochem. Soc. 1993, 140, 903.
(23) Canizares, P.; Martinez, F.; Diaz, M.; Garcia-Gomez, J.; Rodrigo, M. A. J.
Electrochem. Soc. 2002, 149, D118.
(24) Kotz, R.; Stucki, S.; Carcer, B. J. Appl. Electrochem. 1991, 21, 14.
(25) Tahar, N. B.; Savall, A. J. Electrochem. Soc. 1998, 145, 3427.
277
(26) Boudenne, J. L.; Cerclier, O.; Bianco, P. J. Electrochem. Soc. 1998, 145, 2763.
(27) Korbahti, B. K.; Salih, B.; Tanyolac, A. J. Chem. Technol. Biotechnol. 2002, 77,
70.
(28) Buxton, G. V.; Greenstock, C. L.; Helman, W. P.; Ross, A. B. J. Phys. Chem. Ref.
Data 1988, 17, 513.
(29) Hasegawa, K.; Neta, P. J. Phys. Chem. 1978, 82, 854.
(30) Gallard, H.; von Gunten, U. Environ. Sci. Technol. 2002, 36, 884.
(31) Araujo, P. Z.; Morando, P. J.; Blesa, M. A. Langmuir 2005, 21, 3470.
(32) Tunesi, S.; Anderson, M. J. Phys. Chem. 1991, 95, 3399.
(33) Hollmuller, P.; Joubert, J. M.; Lachal, B.; Yvon, K. Int. J. Hydrog. Energy 2000,
25, 97.
(34) Los, P.; Rami, A.; Lasia, A. J. Appl. Electrochem. 1993, 23, 135.
(35) Navarro-Flores, E.; Chong, Z. W.; Omanovic, S. J. Mol. Catal. A 2005, 226, 179.
(36) Radhakrishnamurthy, P.; Sathyanarayana, S.; Reddy, A. K. N. J. Appl.
Electrochem. 1977, 7, 51.
(37) Rodgers, J. D.; Jedral, W.; Bunce, N. I. Environ. Sci. Technol. 1999, 33, 1453.
(38) Bonfatti, F.; Ferro, S.; Lavezzo, F.; Malacarne, M.; Lodi, G.; De Battisti, A. J.
Electrochem. Soc. 2000, 147, 592.
(40) Iniesta, J.; Exposito, E.; Gonzalez-Garcia, J.; Montiel, V.; Aldaz, A. J.
Electrochem. Soc. 2002, 149, D57.
(41) Kaba, L.; Hitchens, G. D.; Bockris, J. O. J. Electrochem. Soc. 1990, 137, 1341.
(42) Comninellis, C.; Nerini, A. J. Appl. Electrochem. 1995, 25, 23.
278
(43) Kim, K. W.; Lee, E. H.; Kim, J. S.; Shin, K. H.; Jung, B. I. J. Electrochem. Soc.
2002, 149, D187.
(44) Fino, D.; Jara, C.; Saracco, G.; Specchia, V.; Spinelli, P. J. Appl. Electrochem.
2005, 35, 405.
(45) Gherardini, L.; Michaud, P. A.; Panizza, M.; Comninellis, C.; Vatistas, N. J.
Electrochem. Soc. 2001, 148, D78.
(46) Rajkumar, D.; Kim, J. G.; Palanivelu, K. Chem. Eng. Technol. 2005, 28, 98.
(47) Panizza, M.; Cerisola, G. Electrochim. Acta 2005, 51, 191.
(48) Koile, R. C.; Johnson, D. C. Anal. Chem. 1979, 51, 741.
(49) Boudenne, J. L.; Cerclier, O.; Galea, J.; VanderVlist, E. Appl. Catal. A. 1996, 143,
185.
(50) Whalen, J. J.; Weiland, J. D.; Searson, P. C. J. Electrochem. Soc. 2005, 152, C738.
(51) Dominey, R. N.; Lewis, N. S.; Bruce, J. A.; Bookbinder, D. C.; Wrighton, M. S. J.
Am. Chem. Soc. 1982, 104, 467.
(52) Lehman, P. A.; Chamberlin, C. E.; Pauletto, G.; Rocheleau, M. A. Int. J. Hydrog.
Energy 1997, 22, 465.
(53) Phenolic Wastewater Treatment Alternatives; Air Force Engineering and Service
Center: Tyndall AFB FL Engineering and Services Lab, 1980.
(54) Jones, O. A. H.; Green, P. G.; Voulvoulis, N.; Lester, J. N. Environ. Sci. Technol.
2007, 41, 5085.
(55) Conn, K. E.; Barber, L. B.; Brown, G. K.; Siegrist, R. L. Environ. Sci. Technol.
2006, 40, 7358.


![Anodic Corrosion of Copper in Presence of Organic CompoundsOrganic compounds containing polar groups including nitrogen, sulfur, oxygen [14-22] and heterocyclic compounds with polar](https://static.documents.pub/doc/80x56/60b30c7fb90de02c262ccb89/anodic-corrosion-of-copper-in-presence-of-organic-organic-compounds-containing-polar.jpg)


