Original Article ELECTROCHEMICAL BEHAVIOR AND DIFFERENTIAL PULSE POLAROGRAPHIC DETERMINATION OF ROSUVASTATIN IN PURE FORM AND IN PHARMACEUTICAL PREPARATIONS USING DROPPING MERCURY ELECTRODE 1 ABDUL AZIZE RAMADAN * , 2 HASNA MANDIL, NOUR GHAZAL Dept. of Chemistry, Faculty of Sciences, Aleppo University, Syria. Email: [email protected], mandil@ scs-net.org Received: 31 Jan 2014, Revised and Accepted: 26 Apr 2014 ABSTRACT Electrochemical behavior and differential pulse polarographic analysis (DPPA) of rosuvastatin (RSV) in pure form and in pharmaceutical preparations using dropping mercury electrode (DME) with di-sodium hydrogen orthophosphate buffer at pH0.5 was applied. One redaction peak was observed in the range -1081 to -1094 mV (Ep). The peak current Ip is linear over the ranges 0.0963-24.077 μg.mL -1 . The DPPA has been used successfully for the determination of RSV in pure form and in pharmaceutical formulations. The relative standard deviation did not exceed 4.0% for the concentrations of RSV 0.0963 μg.mL -1 . Regression analysis showed a good correlation coefficient (R 2 = 0.9998) between Ip and concentration over the mentioned range. The limit of detection (LOD) and the limit of quantification (LOQ) were to be 0.0125 and 0.038 μg.mL -1 , respectively. The proposed method was successfully applied to the analysis of RSV in pure and pharmaceutical dosage forms with average recovery of 95.0 to 103.95%. The results obtained agree well with the contents stated on the labels. Keywords: Differential Pulse Polarographic Analysis, Rosuvastatin, Pharmaceuticals. INTRODUCTION Rosuvastatin calcium (RSV) C44H54CaF2N6O12S2 or (C22H27FN3O6S)2Ca, a member of the class of statins, is the calcium salt of (E)-7-[4-(4- fluorophenyl)-6-isopropyl-2-[methyl (methylsulfonyl) amino] pyrimidin-5-yl] (3R,5S)-3,5-dihydroxyhept-6-enoic acid. Rosuvastatin is used to treat hypercholesterolemia and related conditions and to prevent cardiovascular disease. Rosuvastatin acts by inhibiting the activity of 3-hydroxy-3- methylglutaryl_coenzyme A (HMG_CoA) reductase, the rate_limiting enzyme that converts 3- hydroxy-3-methylglutaryl coenzyme A to Mevalonate, a precursor of cholesterol, mol. mass 1001.14 g, while rosuvastatin is C22H28FN3O6S and its mol. mass 481.539 g (Scheme1). Rosuvastatin calcium is a white amorphous powder that is sparingly soluble in water and methanol, and slightly soluble in ethanol. Rosuvastatin calcium is a hydrophilic compound with a partition coefficient (octanol/ water) of 0.13 at pH of 7.0 [1-3]. Literature survey revealed that HPLC [4-7], capillary zone electrophoresis [8], spectrophotometry [9-11] and electrochemical methods [12] are available for rosuvastatin analysis in pharmaceuticals either single or combine with other drugs. The polarographic analysis was successfully applied for determination some drugs as atorvastatin [13-15], gatifloxacin [16], carbinoxamine maleate [17], dipyrone [18] and lomefloxacin [19]. Rosuvastatin C22H28FN3O6S Rosuvastatin calcium(C22H27FN3O6S)2Ca Scheme 1: Chemical structure of rosuvastatin and rosuvastatin calcium. The electrochemical behavior of rosuvastatin calcium, which is a hydroxy methyl glutaryl Co-A inhibitor (a member of the statin group) was investigated using cyclic voltammetry (CV) and chronoamperometry (CA) methods. According to these studies it is assumed that the reaction is a diffusion-controlled process and irreversible. For the determination of rosuvastatin calcium from the pharmaceutical preparations, a square wave voltammetry (SWV) method was selected and developed because it is more sensitive and faster than the other voltammetric methods. Rosuvastatin calcium's reduction peak was seen at −1184 mV in pH 5 acetate buffer with a hanging mercury drop electrode (HMDE) used as the working electrode, an Ag/AgCl with saturated 3 M KCl reference electrode and a platinum wire counter electrode. 70 Hz frequency, 4 mV scan increment and 25 mV pulse amplitude were chosen as optimum parameters. Linearity for rosuvastatin calcium was found between 0.20 and 10.00 μg mL −1 . While the limit of detection for rosuvastatin calcium was 0.07 μg mL −1 , the limit of quantitation was 0.20 μg mL −1 . As a result of these validation studies, the selective, accurate and precise square wave voltammetric method, which gives sensitive and repeatable results, was applied to the determination of rosuvastatin calcium from pharmaceutical preparations. The results obtained from the developed method were compared with a spectrophotometric method and a capillary electrophoresis method reported in the literature and no significant difference was found statistically [12]. A simple, precise, accurate and reproducible spectrophotometric method has been developed and validated for the quantification of rosuvastatin calcium and glimepiride in solid dosage form by simultaneous equation method. This method uses the spectrum mode of analysis of Simardzu spectrophotometer (UV 1601 and 1240) and utilizes 241 nm and 231 nm as analytical wavelengths for simultaneous estimation. Both the drugs followed Beer’s law in concentration range of 10-22μg/ml. The method was validated in terms of linearity (within 10-22μg/ml), accuracy (Recovery%), precision (inter day and intraday) reproducibility (UV model-1601 and 1240) and robustness. Linearity of the method was within range and the recovery% was 99.04% for rosuvastatin calcium and 100.94% for glimepiride from the binary mixture. The method was found precise (RSD%< 2%). Therefore the proposed method is suitable and can be adopted for the simultaneous determination of rosuvastatin calcium and glimepiride from combined pharmaceutical dosage form in routine quality control analysis 3 . A reliable and sensitive isocratic stability indicating RP-HPLC method has been developed and validated for assay of rosuvastatin calcium in tablets and for determination of content uniformity. An isocratic International Journal of Pharmacy and Pharmaceutical Sciences ISSN- 0975-1491 Vol 6, Issue 3, 2014 Innovare Academic Sciences
Transcript
Original Article
ELECTROCHEMICAL BEHAVIOR AND DIFFERENTIAL PULSE POLAROGRAPHIC DETERMINATION OF ROSUVASTATIN IN PURE FORM AND IN PHARMACEUTICAL
PREPARATIONS USING DROPPING MERCURY ELECTRODE
1ABDUL AZIZE RAMADAN*, 2HASNA MANDIL, NOUR GHAZAL
Dept. of Chemistry, Faculty of Sciences, Aleppo University, Syria. Email: [email protected], mandil@ scs-net.org
Received: 31 Jan 2014, Revised and Accepted: 26 Apr 2014
ABSTRACT
Electrochemical behavior and differential pulse polarographic analysis (DPPA) of rosuvastatin (RSV) in pure form and in pharmaceutical preparations using dropping mercury electrode (DME) with di-sodium hydrogen orthophosphate buffer at pH0.5 was applied. One redaction peak was observed in the range -1081 to -1094 mV (Ep). The peak current Ip is linear over the ranges 0.0963-24.077 μg.mL-1. The DPPA has been used successfully for the determination of RSV in pure form and in pharmaceutical formulations. The relative standard deviation did not exceed 4.0% for the concentrations of RSV 0.0963 μg.mL-1. Regression analysis showed a good correlation coefficient (R2= 0.9998) between Ip and concentration over the mentioned range. The limit of detection (LOD) and the limit of quantification (LOQ) were to be 0.0125 and 0.038 μg.mL-1, respectively. The proposed method was successfully applied to the analysis of RSV in pure and pharmaceutical dosage forms with average recovery of 95.0 to 103.95%. The results obtained agree well with the contents stated on the labels.
Rosuvastatin calcium (RSV) C44H54CaF2N6O12S2 or (C22H27FN3O6S)2Ca, a member of the class of statins, is the calcium salt of (E)-7-[4-(4-fluorophenyl)-6-isopropyl-2-[methyl (methylsulfonyl) amino] pyrimidin-5-yl] (3R,5S)-3,5-dihydroxyhept-6-enoic acid. Rosuvastatin is used to treat hypercholesterolemia and related conditions and to prevent cardiovascular disease. Rosuvastatin acts by inhibiting the activity of 3-hydroxy-3- methylglutaryl_coenzyme A (HMG_CoA) reductase, the rate_limiting enzyme that converts 3-hydroxy-3-methylglutaryl coenzyme A to Mevalonate, a precursor of cholesterol, mol. mass 1001.14 g, while rosuvastatin is C22H28FN3O6S and its mol. mass 481.539 g (Scheme1). Rosuvastatin calcium is a white amorphous powder that is sparingly soluble in water and methanol, and slightly soluble in ethanol. Rosuvastatin calcium is a hydrophilic compound with a partition coefficient (octanol/ water) of 0.13 at pH of 7.0 [1-3]. Literature survey revealed that HPLC [4-7], capillary zone electrophoresis [8], spectrophotometry [9-11] and electrochemical methods [12] are available for rosuvastatin analysis in pharmaceuticals either single or combine with other drugs. The polarographic analysis was successfully applied for determination some drugs as atorvastatin [13-15], gatifloxacin [16], carbinoxamine maleate [17], dipyrone [18] and lomefloxacin [19].
Rosuvastatin C22H28FN3O6S
Rosuvastatin calcium(C22H27FN3O6S)2Ca
Scheme 1: Chemical structure of rosuvastatin and rosuvastatin
calcium.
The electrochemical behavior of rosuvastatin calcium, which is a hydroxy methyl glutaryl Co-A inhibitor (a member of the statin
group) was investigated using cyclic voltammetry (CV) and chronoamperometry (CA) methods. According to these studies it is assumed that the reaction is a diffusion-controlled process and irreversible. For the determination of rosuvastatin calcium from the pharmaceutical preparations, a square wave voltammetry (SWV) method was selected and developed because it is more sensitive and faster than the other voltammetric methods. Rosuvastatin calcium's reduction peak was seen at −1184 mV in pH 5 acetate buffer with a hanging mercury drop electrode (HMDE) used as the working electrode, an Ag/AgCl with saturated 3 M KCl reference electrode and a platinum wire counter electrode. 70 Hz frequency, 4 mV scan increment and 25 mV pulse amplitude were chosen as optimum parameters. Linearity for rosuvastatin calcium was found between 0.20 and 10.00 μg mL−1. While the limit of detection for rosuvastatin calcium was 0.07 μg mL−1, the limit of quantitation was 0.20 μg mL−1. As a result of these validation studies, the selective, accurate and precise square wave voltammetric method, which gives sensitive and repeatable results, was applied to the determination of rosuvastatin calcium from pharmaceutical preparations. The results obtained from the developed method were compared with a spectrophotometric method and a capillary electrophoresis method reported in the literature and no significant difference was found statistically [12].
A simple, precise, accurate and reproducible spectrophotometric method has been developed and validated for the quantification of rosuvastatin calcium and glimepiride in solid dosage form by simultaneous equation method. This method uses the spectrum mode of analysis of Simardzu spectrophotometer (UV 1601 and 1240) and utilizes 241 nm and 231 nm as analytical wavelengths for simultaneous estimation. Both the drugs followed Beer’s law in concentration range of 10-22μg/ml. The method was validated in terms of linearity (within 10-22μg/ml), accuracy (Recovery%), precision (inter day and intraday) reproducibility (UV model-1601 and 1240) and robustness. Linearity of the method was within range and the recovery% was 99.04% for rosuvastatin calcium and 100.94% for glimepiride from the binary mixture. The method was found precise (RSD%< 2%). Therefore the proposed method is suitable and can be adopted for the simultaneous determination of rosuvastatin calcium and glimepiride from combined pharmaceutical dosage form in routine quality control analysis3. A reliable and sensitive isocratic stability indicating RP-HPLC method has been developed and validated for assay of rosuvastatin calcium in tablets and for determination of content uniformity. An isocratic
International Journal of Pharmacy and Pharmaceutical Sciences
separation of rosuvastatin calcium was achieved on YMC C8, 150×4.6 mm i.d., 5 μm particle size columns with a flow rate of 1.5 ml/min and using a photodiode array detector to monitor at 242 nm. The mobile phase consisted of acetonitrile: water (40:60, v/v) pH 3.5 adjusted with phosphoric acid. Response was a linear function of drug concentration in the range of 0.5-80 μg/ml (r2= 0.9993) with a limit of detection and quantification of 0.1 and 0.5 μg/ml respectively. Accuracy (recovery) was between 99.6 and 101.7%. Degradation products resulting from the stress studies did not interfere with the detection of rosuvastatin and the assay is thus stability-indicating [7]. In the present work, electro chemical behavior and differential pulse polarographic determination of rosuvastatin in pure form and in pharmaceutical preparations using a dropping mercury electrode was applied.
MATERIALS AND METHODS
Reagents
Di-Sodium hydrogen orthophosphate and phosphoric acids, were purchased from Merck. Rosuvastatin calcium (98.6%) was supplied by BDR PHARMACEUTICALS INTERNATIONAL PVT. LTD. (INDIA), its purity as rosuvastatin was 94.66%.
Supporting electrolyte
Di-Sodium hydrogen orthophosphate of 0.075 mol.L−1 and H3PO4 was prepared by adding H3PO4 (1.0 M) to pH=0.5.
A stock standard solution of Rosuvastatin calcium (1x10⁻⁴ mol.L-1)
This solution was prepared by dissolving 25.38 mg from rosuvastatin calcium in 50 mL double distilled deionized water (1x10⁻³ mol.L-1), then dilute 10.000 mL from this solution to 100 mL (1x10⁻⁴ mol.L-1).
working solutions
The stock solution was further diluted to obtain working solutions daily just before use in the ranges of RSV: 0.200, 0.400, 1.000, 2.000, 4.000, 6.000, 8.000, 10.000, 20.000, 40.000 and 50.000 μmol.L-1 (0.0963, 0.1926, 0.4815, 0.9631, 1.9262, 2.8892, 3.8523, 4.8154, 9.6308, 19.2615 and 24.0770 μg.mL-1) by dilution of the volumes: 0.050, 0.100, 0.250, 0.500, 1.000, 1.500, 2.000, 2.500, 5.000, 10.000 and 12.500 mL from stock standard solutions to 25 mL with supporting electrolyte. All solutions and reagents were prepared with double-distilled deionised water and analytical grade chemicals. Ultrapure mercury from Metrohm Company was used throughout the experiments.
Instruments and apparatus
A Metrohm 746 VA processor, A Metrohm 747 VA stand with a dropping mercury electrode (DME) as a working electrode, an auxiliary platinum electrode and a reference electrode, double junction type, (Ag/AgCl) saturated with a 3.0 M KCl solution and the three-electrode cell were used. All measurements were done at room temperature 25 ± 5 oC. Highly pure nitrogen gas (99.999 %) was used for de-oxygenation. pH meter from Radiometer company model ion check was used for the studying and monitoring the pH effects. The diluter pipette model DIP-1 (Shimadzu), having 100 μL sample syringe and five continuously adjustable pipettes covering a volume range from 20 to 5000 μL (model PIPTMAN P, GILSON), were used for preparation of the experimental solutions. A ultrasonic processor model powersonic 405 was used to sonicate the sample solutions. Electronic balance (Sartorius-2474; d=0.01 mg) was used for weighing the samples.
Sample preparation
A commercial formulations (as tablet) were used for the analysis of rosuvastatin (RSV) by using differential pulse polarographic analysis (DPPA) with dropping mercury electrode (DME).
The pharmaceutical formulations were subjected to the analytical procedures
(1) Rosuvastatin-ElSaad tablets, ELSaad pharma, Aleppo–SYRIA, each tablet contains: 10, 20 and 40 mg of RSV.
(2) Rosuva tablets, Unipharma, Damascus–SYRIA, Each tablet contains: 5, 10 and 20 mg of RSV.
(3) Rosuvastatin Sandy tablets, Sandy pharmaceuticals, Aleppo –SYRIA, Each tablet contains:10, 20 and 40 mg of RSV.
(4) Turbovas tablets, City Pharma Co., Aleppo–SYRIA, each tablet contains: 10 and 20 mg of RSV.
(5) Crostatin tablets, Razi pharmaceutical industries, Aleppo–SYRIA, each tablet contains: 5, 10 and 20 mg of RSV.
Stock solutions of pharmaceutical formulations
Three tablets of each studied pharmaceutical formulations were weighted accurately, crushed to a fine powder and mixed well. Equivalent tenth the weight of one tablet, was solved in 20 ml double-distilled deionised water by using ultrasonic, filtered over a 50 mL flask and diluting to 50 mL with water, which content as the follows: 10, 20, 40 and 80 μg.mL-1 for all studied pharmaceutical formulations content 5, 10, 20 and 40 mg/tab, respectively.
Working solutions of pharmaceuticals
These solutions were prepared daily by diluting 5.000, 2.500, 1.250 and 0.625 mL from stock solutions of pharmaceutical formulations, respectively, then diluting to 25 mL with supporting electrolyte (each solution contents 2.000 μg.mL-1 of rosuvastatin).
Working standard addition solutions of pharmaceuticals
These solutions were prepared as the follows: same mentioned volumes of stock solutions of pharmaceuticals with 0.000, 1.000, 2.000, 3.000 and 4.000 mL from stock solution of rosuvastatin and diluting to 25 mL with supporting electrolytes; these solutions content (each one) 2.000 μg.mL-1 of RSV (from pharmaceuticals) plus 1.926, 3.852, 5.778 and 7.705 μg.mL-1 of RSV, respectively.
Analytical procedure
25 mL of working standard of rosuvastatin was transferred to the cell. The solution was well mixed by automatic mixer and deoxygenated with N2 gas for 200 s. Current-voltage curves were recorded. Limiting currents were measured. Calibration and standard addition of pharmaceuticals curves in supporting electrolytes were constructed.
RESULTS AND DISCUSSION
Differential pulse polarographic behavior
The polarograms in the optimal conditions (supporting electrolytes, pH, scan rate, initial potential, final potential, ….etc.) using DPPA at DME were studied.
The effect of pH
The influence of pH from 0.10 to 5.0 on Ip and Ep was studied. The values of Ip increase with increasing pH value of 0.1 to 0.5 then decrease to pH=1.0 after that become semi-fixed until pH = 2 and finally decrease until pH = 5, see Figures (1 and 2). While Ep values are growing a negative value from -1050 mV (when pH = 0.1) to -1380 mV (when pH = 5).
The effect of supporting electrolytes (buffer)
The effect of supporting electrolytes (buffer) on the Ip was studied. It was found that, the di-Sodium hydrogen orthophosphate was the better buffer at concentration 0.075 mol.L-1.
The effect of negative pulse amplitude (U ampl.)
The effect of negative pulse amplitude between 0 to -100 mV on Ip showed that, Ip increases linearly with increasing amplitude value until -60 mV and then increases in a non-linear, while Ep increasing of positive value. The value -60 mV was better than another’s, see Figures (3 and 4).
Ramadan et al.
Int J Pharm Pharm Sci, Vol 6, Issue 3, 128-133
130
The effect of scan rate
The different values of scan rate (3.3, 6.6, 10, 13.3, 16.6 and 20 mV/s) were studied. It was found that, the value scan rate 6.6 mV/s was the better.
The effect of initial and final potential
The effect of initial and final potential on the Ip was studied. It was found that better initial potential was -900 mV and better final potential was -1200 mV.
The effect of temperature and time
The effect of temperature and time on the electrochemical reaction of rosuvastatin was studied at different values (15-35oC, 5-60 min) by continuous monitoring of the Ip. It was found that, the value of Ip was not affected by temperature between 20 to 30oC (the temperature at 25±5°C was used). The effect of waiting time was determined at laboratory ambient temperature (25±5°C). It was found that, the value of Ip was not affected by time between 5 to 60 min.
Fig. 1: The effect of pH solution on the polarograms using DPPA at DME of RSV (9.63 µg.mL-1) at pH : 1- 0.1; 2- 0.2; 3- 0.5; 4- 1.0; 5- 2.0; 6- 3.0; 7- 4.0; 8- 5.0 (Purge gas N2, Purge
time 200 s, Scan rate 6.6 mV/s, U. amplitude -60 mV, t. meas. 20 ms, t. pulse 60 ms, t. step 0.9 s, Temperature of
solution25°± 5°C and buffer 0.075 mol.L−1 di-Sodium hydrogen orthophosphate).
Fig. 2: The effect of pH solution on Ip of RSV(9.63 µg.mL-1) using
DPPA at DME (Purge gas N2, Purge time 200 s, Scan rate 6.6 mV/s, U. amplitude -60 mV, t. meas. 20 ms, t. pulse 60 ms, t. step 0.9 s, Temperature of solution25°± 5°C and buffer 0.075 mol.L−1
di-Sodium hydrogen orthophosphate).
The effect of time pulse (t. pulse)
The effect of time pulse (25, 30, 35, 40, 45, 50, 55, 60, 65, 70, 75, 80, 85, 90, 95 and 100 ms) on polarograms was as the follows: Ip decreases with increasing time pulse and Ep has become increasingly latency positive value (-1108 to -1073 mV) with increasing t. pulse. The peak was more symmetrical when the t. pulse value of 60 ms.
The effect of time interval for voltage step (t. step)
Ip increases with increasing t. step (0.2, 0.3, 0.4, 0.5, 0.6, 0.7, 0.8, 0.9, 1.0, 1.5, 2.0,and 2.5 s) from 0.2 s to 2.0 s then decreases until 2.5 s, while Ep remains quasi-static. The value of the preferred t. step was 0.9 s.
Fig. 3: The effect of negative pulse amplitude (U ampl.) on the polarograms using DPPA at DME of RSV (9.63 µg.mL-1) at : 1) -
10; 2) -20; 3) -30; 4) -40; 5) -50; 6) -60; 7) -70; 8) -80; 9) -90 and 10) -100 mV (Purge gas N2, Purge time 200 s, Scan rate 6.6 mV/s, pH=0.5, t. meas. 20 ms, t. pulse 60 ms, t. step 0.9 s,
Temperature of solution25°± 5°C and buffer 0.075 mol.L−1 di-Sodium hydrogen orthophosphate).
Fig. 4: The effect of negative pulse amplitude (U ampl.) on Ip of
RSV(9.63 µg.mL-1) using DPPA at DME (pH=0.5, Purge gas N2, Purge time 200 s, Scan rate 6.6 mV/s, t. meas. 20 ms, t. pulse 60
ms, t. step 0.9 s, Temperature of solution25°± 5°C and buffer 0.075 mol.L−1 di-Sodium hydrogen orthophosphate).
The effect of measurement time (t. meas.)
Ip increases with increasing t. meas. (2, 4, 6, 8, 10, 12, 16, 20, 24, 28, 30, and 32 ms), while Ep remains quasi-static. The value of the preferred t. meas. was 20 ms. The optimum parameters established for determination of RSV using DPPA on DME showed in Table 1.
Calibration curves
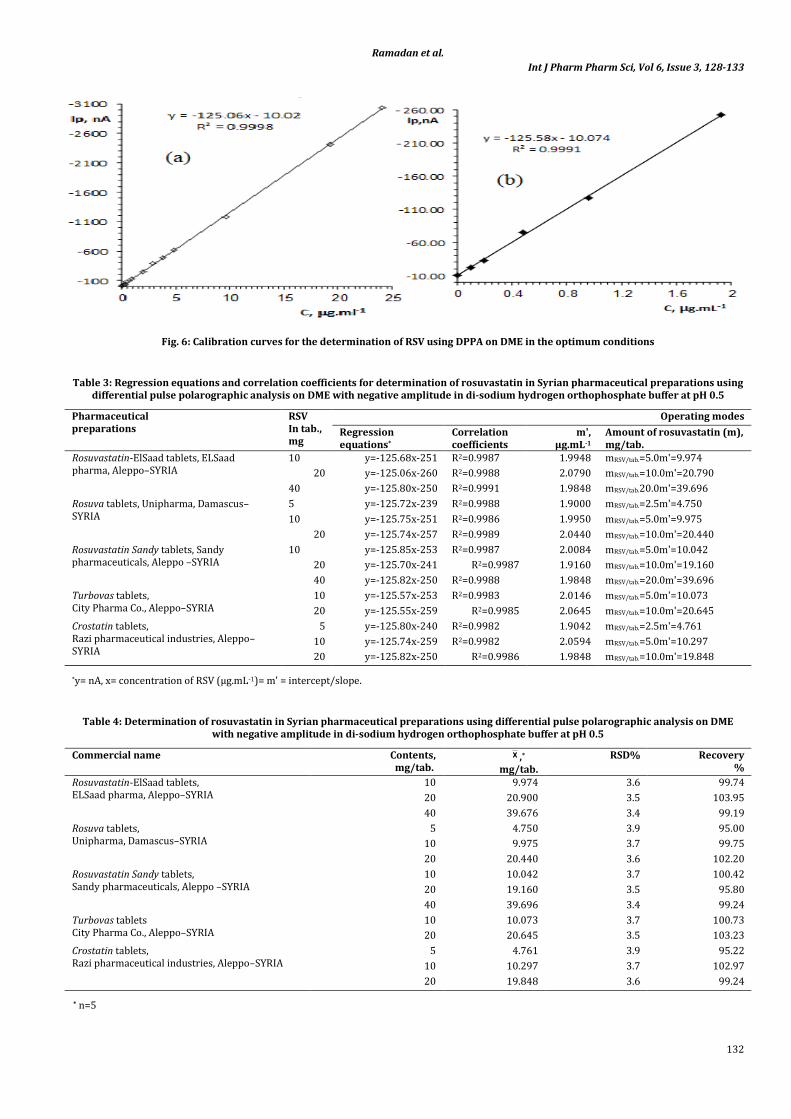
Calibration curves for the determination of rosuvastatin using differential pulse polarographic analysis on mercury drop electrode with negative amplitude in di-sodium hydrogen orthophosphate buffer at pH 0.5 were applied. One redaction peak was observed in the range -1081 to -1094 mV (Ep). The peak current (Ip) was proportional to the concentration of RSV over the ranges 0.0963-24.077 μg.mL-1 (0.200–50.000 μmol.L-1). The polarograms in the optimum conditions using DPPA at DME of RSV at different concentrations show in Figure 5. The regression equation and correlation coefficient ( R2) were as the follows: y=-125.06x-10.02, R2=0.9998; y: Ip, nA and x: CRSV, μg.mL-1, see Figure 6.
Ramadan et al.
Int J Pharm Pharm Sci, Vol 6, Issue 3, 128-133
131
Table 1: The optimum parameters established for determination of RSV using DPPA on MDE.
Parameters Operating modes Working electrode Dropping mercury electrode (DME) Supporting electrolytes (buffer) di-Sodium hydrogen orthophosphate buffer, 0.075 mol.L-1 pH 0.5 Solvent rosuvastatin calcium double distilled deionized water Value of pulse amplitude -60 mV Purge gas Pure N2 Purge time 200 s Initial potential -900 mV Final potential -1200 m Scan rate 6.6 mV/s U. amplitude -60 mV t. meas. 20 ms t. pulse 60 ms t. step 0.9 s Temperature of solution 25°± 5°C Peak Potential, mV -1081 to -1094 mV
* y= nA, x= concentration of rosuvastatin (µg.mL-1).
Table 2: Determination of rosuvastatin using differential pulse polarographic analysis on DME with negative amplitude in di-Sodium hydrogen orthophosphate buffer, 0.075 mol.L-1 at pH 0.5.
Fig. 5: The polarograms in the optimum conditions using DPPA on DME of RSV in di-Sodium hydrogen orthophosphate buffer, at pH 0.5 at concentrations: 1- 0; 2- 0.0963; 3- 0.192 ; 4- 0.481 ; 5- 0.963; 6- 1.926 ; 7- 2.889 ; 8- 3.832 ; 9- 4.815 ; 10- 9.631 ; 11- 19.26 and 12- 24.077
μg.mL-1
Ramadan et al.
Int J Pharm Pharm Sci, Vol 6, Issue 3, 128-133
132
Fig. 6: Calibration curves for the determination of RSV using DPPA on DME in the optimum conditions
Table 3: Regression equations and correlation coefficients for determination of rosuvastatin in Syrian pharmaceutical preparations using differential pulse polarographic analysis on DME with negative amplitude in di-sodium hydrogen orthophosphate buffer at pH 0.5
*y= nA, x= concentration of RSV (µg.mL-1)= m' = intercept/slope.
Table 4: Determination of rosuvastatin in Syrian pharmaceutical preparations using differential pulse polarographic analysis on DME with negative amplitude in di-sodium hydrogen orthophosphate buffer at pH 0.5
Fig. 7: The standard addition curve for determination of RSV in
Rosuvastatin-ElSaad (20 mg/tab.) using differential pulse
polarographic analysis on mercury drop electrode with
negative amplitude in di-sodium hydrogen orthophosphate
buffer at pH 0.5
Analytical results
Determination of RSV using DPPA on DME in the optimum conditions using analytical curves, Ip=f(CRSV), showed that the accuracy was ready over the ranges of RSV concentration between 0.0963–24.077µg.mL-1. The relative standard deviation (RSD) not
more than 4.0%, see Table 2. Limit of detection (LOD) and limit of quantitation (LOQ) for the determination of RSV by this method were as the follows : 0.0125 and 0.038 µg.mL-1, respectively.
APPLICATIONS
Many applications for the determination of rosuvastatin in some Syrian pharmaceutical preparations using differential pulse polarographic analysis on mercury drop electrode with negative amplitude in di-sodium hydrogen orthophosphate buffer at pH0.5 were proposed. Standard addition curves for determination of RSV in different Syrian pharmaceutical preparations (Rosuvastatin-ElSaad, Rosuva, Rosuvastatin Sandy, Turbovas and Crostatin) were used. The standard addition curve of Rosuvastatin-ElSaad (20 mg/tab.) was showed in Fig. 7, as an example. Regression equations and correlation coefficients were included in Table 3. Standard addition curves for determination of RSV in different Syrian pharmaceutical preparations were used. The amount (m) of RSV in one tablet by mg/tab (mRSV/tab.) calculated from the following relationship: m = h. m', where: m' is the amount of RSV in tablet, which calculated from the standard additions curve according to the following regression equation: y=a.x+b; when y=0; m'=x= b/a= intercept/slope (µg.mL-1) and h conversion factor is equal to 2.5, 5.0, 10.0 and 20.0 for all pharmaceuticals content 5, 10, 20 and 40 mg/tab, respectively. The results of quantitative analysis for RSV in the pharmaceutical preparations using this method were included in Tables 4. The proposed method was simple, economic, accurate and successfully applied to the determination of rosuvastatin in pharmaceuticals. The results obtained agree well with the contents stated on the labels.
CONCLUSION
Electrochemical behavior and DPPA of RSV in pure form and in pharmaceutical preparations using a DME with di-sodium hydrogen orthophosphate buffer at pH0.5 was applied. One redaction peak was observed. Ip is linear over the ranges 0.0963-24.077 μg.mL-1. The DPPA has been used successfully for the determination of RSV in pure form and in pharmaceutical formulations. The relative standard deviation did not exceed 4.0% for the concentrations of RSV 0.0963 μg.mL-1. Regression analysis showed a good correlation coefficient (R2= 0.9998) between Ip and concentration over the mentioned range. The limit of detection (LOD) and the limit of quantification (LOQ) were to be 0.0125 and 0.038 μg.mL-1, respectively. The proposed method was successfully applied to the analysis of RSV in pure and pharmaceutical dosage forms
with average recovery of 95.0 to 103.95%. The results obtained agree well with the contents stated on the labels.
REFERENCES
1. Nissen S, Nicholls S, Sipahi I, Libby P, Raichlen JS, Ballantyne CM. Effect of very high-intensity statin therapy on regression of coronary atherosclerosis. The Asteroid Trial JAMA, 2006; 295(13): 1556- 1565.
2. Lennernas H, Fager G. Pharmacodynamic and pharmacokinetics of the HMG_CoA reductase inhibitors. Clinical Pharmacokinetics, 1997;32: 403-425.
3. Afroz A, Haque T, Talukder Md.MU, Ashraful Islam SM, Spectrophotometric Estimation of Rosuvastatin Calcium and Glimepiride in Tablet Dosage Form. Asian J. Pharm. Ana, 2011; 1(4): 74-78.
4. Mehta TN, Patel AK, Kulkarni GM, Suubbaiah G. Determination of Rosuvastatin in the presence of its degradation products by a stability_indicating LC method. J AOAC Int, 2005; 88(4): 1142-1147.
5. Wanjari DB, Gaikwad NJ, Reversed phase HPLC method for determination of glimepiride in tablet dosage form. Indian J Pharm Sci, 2005;67:253-255.
6. Karthik A, Subramanian G, Mallikarjuna RC, Krishnamurthy B. Ranjithkumar A, Musmade P, Surulivelrajan M, Karthikeyan K, Udupan. Simultaneous determination of pioglitazone and glimepiride in bulk drug and pharmaceutical dosage form by RPHPLC method. Pakistan. J Pharml Sci, 2008; 21(4): 421-425.
7. Kaila HO, Ambasana MA, Thakkar R S, Saravaia HT, Shah AK, A New Improved RP-HPLC Method for Assay of Rosuvastatin Calcium in Tablets. Indian J Pharm Sci, 2010; 72(5): 592–598.
8. Suslu I, Celebier M, Altnoz S. Determination of Rosuvastatin in Pharmaceutical Formulations by Capillary Zone Electrophoresis. Chromatographia,. 66; 2007: 65-72.
9. Uyar B, Celebier M, Altinoz S. Spectrophotometric determination of Rosuvastatin calcium in tablets. Pharmazie, 2007;62: 411-413.
10. Altinoz S, Tekeli D, Analysis of glimepiride by using derivative UV spectrophotometric method. J Pharm Bio Anal, 2001; 24: 507-515.
11. Anju G, Singhvi I, Simultaneous spectrophotometric estimation of rosiglitazone maleate and glimepiride in tablet dosage forms. Indian Journal of Pharmaceutical Sciences, 2007; 69(6): 780-783.
12. Sacide Altınöz, Banu Uyar, Electrochemical behaviour and voltammetric determination of rosuvastatin calcium in pharmaceutical preparations using a square-wave voltammetric method. Analytical Methods, 2013; 5(20): 5709-5716.
13. Ramadan AA, Mandil H, Hafez B, Differential pulse polarographic determination of atorvastatin in pharmaceutical dosage forms using dropping mercury electrode, Asian J Chem, 2013; 25 (6): 3467-3472.
14. Ramadan AA, Mandil H, Hafez B, Differential pulse polarography of atorvastatin in pure and pharmaceutical dosage forms using static mercury drop electrode, Int J Pharm Pharm Sci, 2013; 5 (1): 434-440.
15. Ramadan AA, Mandil H, Hafez B, Effect of hanging mercury drop electrodeon differential pulse polarographic analysis of atorvastatin in pharmaceuticals using borax buffer at pH7.50, Int J Pharm Pharm Sci,, 2012; 4 (SUPPL. 5): 540-546.
16. Ramadan AA, Mandil H,, Determination of gatifloxacin in pure form and pharmaceutical formulations by differential pulse polarographic analysis, Anal Biochem, 2010; 404: 1-7.
17. Ramadan AA, Mandil H, Genco T, Determination of carbinoxamine maleate in pharmaceuticals by direct and differential pulse polarography, Asian J Chem, 2009; 21(9):7387-7397.
18. Ramadan AA, Mandil H,, Hafez B, Determination of dipyrone in pure form and pharmaceutical formulations by differential pulse polarographic analysis, Asian J Chem, 2011; 21(1):403-406.
19. Ramadan AA, Mandil H, Determination of lomefloxacin in pharmaceuticals using differential pulse polarographic analysis, Int J Pharm Pharm Sci,, 2012; 4 (SUPPL. 5): 255-261.