Electrochemical performance of zirconia/graphene oxide nanocomposites cathodedesigned for high power densitysupercapacitorHarish Mudila1, Sweta Rana2 and M. G. H. Zaidi2*
Abstract
Background: Carbon-based metal oxide nanocomposites are always been the prime material for study in the fieldof energy storage due to their rich abundance, low toxicity, high surface area, electrical conductivity and diverseoxidation states.
Methods: In this direction, novel zirconia/graphene oxide (ZrO2/GO) nanocomposites are fabricated on the surfaceof 316 stainless steel for studying their specific capacitance and power performance. ZrO2 and GO in varying massratio (1:1, 1:2, and 2:1) were used to fabricate the electroactive material. The physical interaction between the twowas determined by Fourier transform-infrared, X-ray diffraction and scanning electron microscopy. TG-DTA-DGinforms about the exhibited thermal property by the variants. The cyclic voltammetry was done to study thespecific capacitance of the electroactive materials with reference to Ag/AgCl at scan rate (V/s) ranging 0.15–0.001 in1.0 M KOH. The specific capacitance of ZrO2 was found to be 17.13 Fg−1 at 0.001 Vs−1. The representative(nanocomposite) NC-II shows the maximum specific capacitance of 299.26 Fg−1 at similar rate of scan with powerdensity of 59.40 W/kg.
Conclusion: The nanocomposites show comparable level of charge-discharge behavior with long-term cycleability,suggesting that fabricated ZrO2/GO nanocomposite electrodes are promising candidate for the high-performanceenergy storage devices.
Keywords: Zirconium oxide, Graphene oxide, Specific capacitance, Cyclic voltammetry
BackgroundMetal oxides depending upon their structural, geometries,and electronic structure play a very significant role inareas of chemistry, physics, biology and material sciences(Marcos and Rodriguez 2007; Graves 2014). Technicalapplications of these metal oxides involve the fabrica-tion of electronic circuits, sensors, optical devices,piezoelectric devices, fuel cells, corrosion less surfacescoatings and catalysis, etc. (Sahu and Rao 2000; Wanget al. 2010; Ye et al. 2013; Lee et al. 2010; Mugniery
et al. 1999). The proliferation of personal electronicsand commercialization of electric and hybrid electricvehicles have popularized the needs for rechargeableand portable power sources and thus had increase theexploration of metal oxide in this direction. Superca-pacitors in 21st era had attracted intense researchinterest as an auxiliary and clean source of power andenergy. Due to their low molecular weight and theirfavorable electrochemical and solid‐state properties,first and second row transition metal oxides seem to beespecially attractive as cathode materials in electro-chemical energy storage systems. In this perspective,many transition metal oxides alone and with nanostruc-tured carboneous filler had got special attention due to* Correspondence: [email protected]
2Department of Chemistry, G. B. Pant University of Agriculture & Technology,Pantnagar, Uttarakhand 263145, IndiaFull list of author information is available at the end of the article
their low price, rich abundance, low toxicity, and diverseoxidation states (Wu et al. 2012; Lee et al. 2011; Zhao etal. 2013; Mai et al. 2014; Chen et al. 2012). In this ex-ploration, a large number of metal oxide-graphene oxidecombinations are synthesized to study the supercapaci-tive behavior (Wu et al. 2012; Lee et al. 2011; Wu et al.2012). The electronic properties of the metal oxide areeffected by particle size of material, the quantum size orconfinement effects are produced in nanostructuredmaterials which essentially arise from the presence ofdiscrete, atom-like electronic states (Marcos and Rodri-guez 2007), and also nanosized material is observed tohave small band gap in its lattice. Thus, metal oxidenanoparticles can exhibit unique physical and chemicalproperties due to their limited size and a high density ofcorner or edge surface sites. Apart from this, metaloxide materials exhibit ionic or mixed ionic/electronicconductivity and are influenced by the nanostructure ofthe material (Tuller 2000).Nano-phase zirconia (ZrO2) is a widely used heteroge-
neous catalyst and is an n-type semiconductor withband-gap energy of 5.0 eV (Pouretedal and Hosseini2010). Zirconium oxide (ZrO2) is a smart material beingstudied for various applications such as oxygen sensor,solid state electrolytes for fuel cell, and gradient refract-ive index lenses due to its excellent mechanical, thermal,optical, and electrical characteristics (Pouretedal andHosseini 2010; Liu et al. 2013). Studies on depositingZrO2 onto carbon nanotubes (CNTs) (Lu et al. 2008;Shan and Gao 2005; Song et al. 2009; Guo et al. 2009),graphene (Wu et al. 2012, Liu et al. 2013), etc. for fuelcells and transistors as advanced gate dielectrics (Javeyet al. 2002) had placed it in the row of promising candi-date for high-power energy storage material.Since its discovery, graphene oxide and graphene
have become the key star in research associated withenergy production and energy storage because of theirsp2 carbon nanoform arrangement in 2D network withremarkable electronic, mechanical properties, and highmorphological anisotropy (Stoller et al. 2008; Kim et al.2009; Yoo et al. 2011; Tian et al. 2012, Yee et al. 2011).Graphene oxide (GO) provided large accessible surfacearea for effective transportation of ions onto the mater-ial surface, thus accomplishing high electric-double-layer capacitance in aqueous electrolytes (Yang et al.2011). Nanostructured metal oxides can effectually pre-vent the Van der Waals-induced agglomeration of GO,resulting large accessible electrochemical active surfacearea for energy storage. Size and morphology affect theperformance of metal oxides used as electrode mate-rials. Designing nanostructured semiconducting metaloxide materials with graphene family has been the keyto success in developing large-specific capacitive energystorage devices.
Studies based on I/V characteristics reveal very low CS
and stability for ZrO2 and other metal oxides (Ye et al.2013; He et al. 2013). While GO is a well-known materialfor its implication in the field of energy production andstorage, this accounts of higher CS of GO over ZrO2 whichprompted to investigate the effect of GO concentration onthe CS of ZrO2 in the respective nanocomposites (NCs). Inthe present study, three variant of ZrO2/GO NCs were syn-thesized with molar concentrations of ZrO2 and GO (1:1,1:2, and 2:1). GO dispersed in methanol was sonicated intoa solution comprising of tetraethyl ammonium bromide(TEAB). To this, requisite amounts of ZrO2 were suppliedand the contents were further sonicated. The resulting sus-pension was then washed repeatedly with methanol anddistilled water (20:80) to obtain nanosized ZrO2/GO com-posites which shows high level of specific capacitance,energy, and power density along with good capacitive re-tention of 98.6 %. Along with this, workers had also foundout that specific capacitance of ZrO2/GO is comparable toZrO2/graphene nanocomposite which was found to be10 F/g at 0.05 V/s by Liu et al. (2013).
MethodsStarting materialsZrO2 (MW 123.22, 99.5 %, APS 45 nm) was purchasedfrom Sisco Research Laboratories Pvt. Ltd., India. Polysul-phone (PSO, Mn, 26,000, ρ = 1.24 g/cm3) and chlorosulfo-nic acid (bp., 152 ± 1 °C/755 mmHg, ρ = 1.753 g/cm3 at25 °C) were procured from Aldrich Chemical Comp. Inc.,USA. Tetraethyl ammonium bromide (TEAB, MW 210.17,99 %) was procured from Molychem, and graphite(98.0 %, surface area 500 μm) was purchased from OttoChemicka-Biochemica reagents, India. All other chemicalsand solvents were purchased from s.d. fine Chemical,India. All the chemicals and solvents were used withoutfurther purifications. The commercially available 316-stainless steel (SS) was used as substrate for the prepar-ation of electrode.
Preparation of ZrO2/GO NCsThree variant of ZrO2/GO NCs were synthesized withmolar concentrations of ZrO2 and GO (Table 1). Therequisite amount of GO was dispersed in methanol(20 mL, 99.9 %) and was sonicated into a solution com-prising of TEAB (50 mg) for 3 hr at 40 ± 1 °C. To this,requisite amounts of ZrO2 were supplied and the con-tents were further sonicated for additional 3 hr at 40 ±
Table 1 Synthetic molar ratio of constituents
S. No. NCs ZrO2:GO Particle size (nm)
1. NC-I 1:1 26.63
2. NC-II 1:2 27.34
3. NC-III 2:1 24.76
Mudila et al. Journal of Analytical Science and Technology (2016) 7:3 Page 2 of 11
1 °C. The resulting suspension was then washed repeat-edly with methanol and distilled water (20:80), whichwas filtered and dried at 50 °C/400 mmHg over 48 hr.
Fabrication of working electrodePrior to use, well-finished 1 cm2 316-SS was supplied assubstrate and then de-greased with acetone and sub-jected to surface oxidation at 50 ± 1 °C over 1 hr undervacuum. The working electrode materials were preparedby mixing the electroactive material, graphite, and sul-phonated polysulphone (SPS) in a mass ratio of 65:10:25.After sonicating the mixtures for 1 h in N-methylpyrroli-done (NMP), the resulting slurry was pressed on a stain-less steel substrate which acts as a current collector. Thetreated substrate was dried at room temperature for4 hr, followed by 100 °C/400 mmHg for 48 hr. The massof the material deposited on the substrate was deter-mined from the weight difference between the electrodebefore and after deposition by using a high precisionmicrobalance. This has afforded cathodes with massthickness of electroactive materials by 1.0 ± 0.1 mg/cm2
over SS substrate. The electrodes were tested after 24 hrof fabrications.
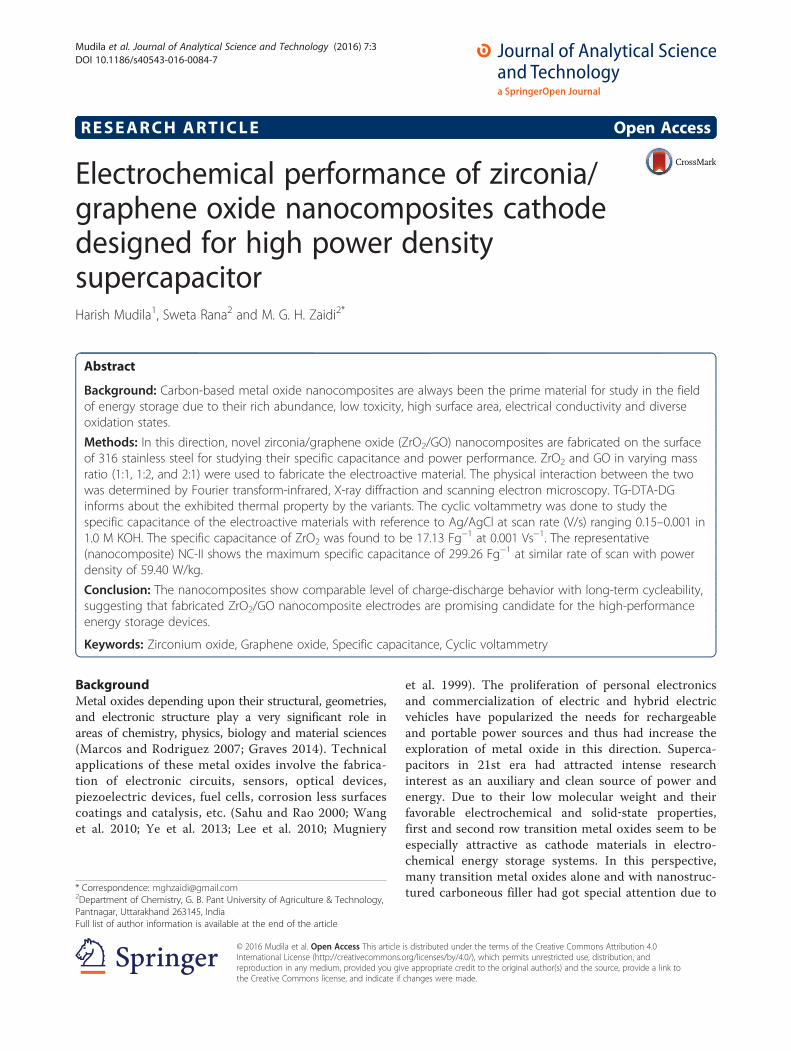
Result and discussionFT-IR spectraFourier transform-infrared (FT-IR) spectra were recordedon Thermo Nicolet FT-IR Spectrophotometer in KBr inthe range 4000–400 cm−1 (Fig. 1a–e). Graphite has
revealed characteristic absorptions (cm−1) at 3447 (v O–H) and 1628.79 (δ O–H) which attributes to the presenceof absorbed moisture (Fig. 1a) and characteristic absorp-tions at ~3333 (v O–H), 1723 (v COOH), 1613 (remainingsp2 character), 1378 (v COC), 1221.20 (C–O for oxirane),and 1033 cm−1 (v COH) indicates conversion of graphiteinto GO (Fig. 1b) (Reta et al. 2009). Figure 1c shows char-acteristic absorptions of ZrO2 particularly at 740 and 500(v as Zr–O–O–Zr and Zr–O stretching modes), respect-ively, which confirms the ZrO2 phase (Sahu and Rao2000). The absorptions at 3430 and 1630 correspond tothe vibration of stretching and deformation of the O–Hbond due to the absorption of water (Sahu and Rao 2000;Chen et al. 2012). The representative of ZrO2/GO nano-composite, NC-II, illuminates characteristic absorptions3430–3440 (v O–H), 1710 (v COOH), 1640 (δ O–H),1600 (sp2 character), 1390 (v COC), 1190 (v C–O epoxy),1040 (v COH), 748 (v Zr–O–O–Zr), and 503 (v Zr–O).The absorption corresponding to (v COOH) shifted to1710 in NC-II over GO at 1723. With concentration ofZrO2, a regular decrease in the intensity of absorption cor-responding to v O–H with simultaneous increase in theintensity of absorption corresponding to v Zr–O–O–Zrand v Zr–O, respectively, was observed. Such shift in theabsorption of v COOH from 1723 to 1710 may beassigned to the bonding of ZrO2 with GO. Furthermore,the increase in the intensity of v Zr–O–O–Zr and v Zr–Owith simultaneous decrease in v O–H in GO also supportsthe bonding of ZrO2 with GO (Fig. 1d).
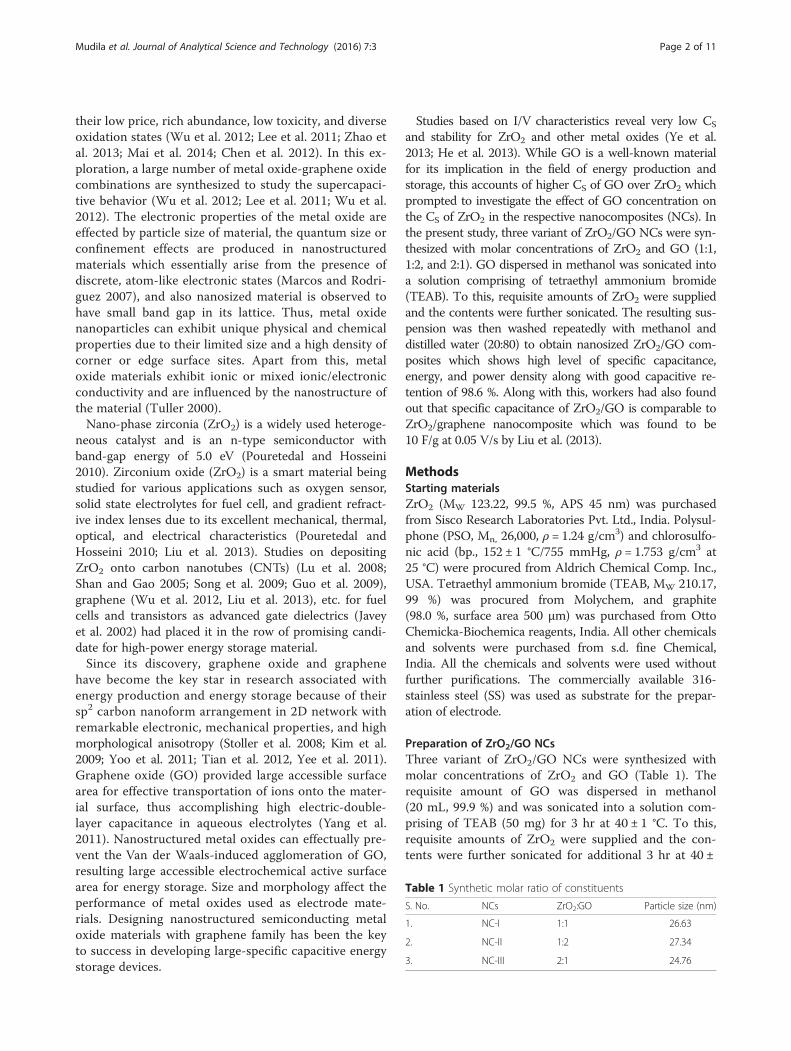
MicrostructureThe power X-ray diffraction (XRD) spectra of as-prepared samples were recorded at room temperatureover Rigaku-Geiger flex X-ray diffractometer using Cu-Kα radiation (λ = 0.154 nm) in the range of 10°–70° at30 kV and 15 mA with step size 0.05 and step time of19.2 s. The diffraction peaks observed at 2θ were used tocalculate the particle size using Bragg’s equation:
d ¼ nλ2 sinθ
ð1Þ
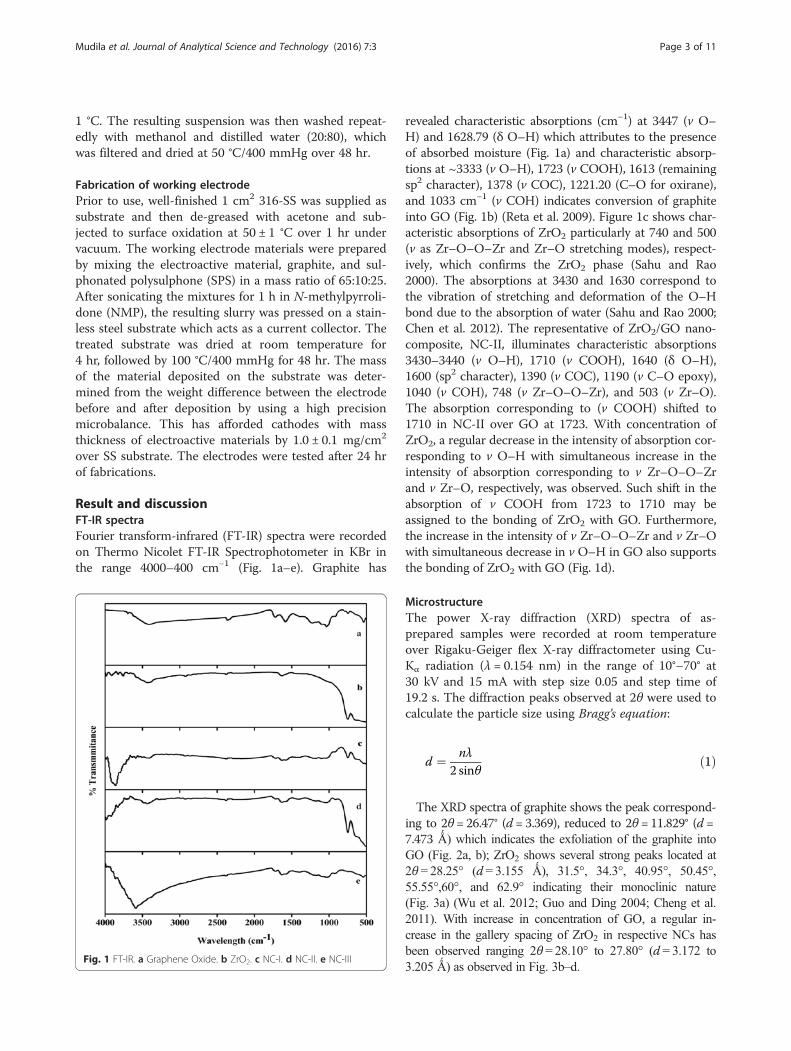
The XRD spectra of graphite shows the peak correspond-ing to 2θ = 26.47° (d = 3.369), reduced to 2θ = 11.829° (d =7.473 Ǻ) which indicates the exfoliation of the graphite intoGO (Fig. 2a, b); ZrO2 shows several strong peaks located at2θ = 28.25° (d = 3.155 Ǻ), 31.5°, 34.3°, 40.95°, 50.45°,55.55°,60°, and 62.9° indicating their monoclinic nature(Fig. 3a) (Wu et al. 2012; Guo and Ding 2004; Cheng et al.2011). With increase in concentration of GO, a regular in-crease in the gallery spacing of ZrO2 in respective NCs hasbeen observed ranging 2θ = 28.10° to 27.80° (d = 3.172 to3.205 Ǻ) as observed in Fig. 3b–d.
Fig. 1 FT-IR. a Graphene Oxide. b ZrO2. c NC-I. d NC-II. e NC-III
Mudila et al. Journal of Analytical Science and Technology (2016) 7:3 Page 3 of 11
The average particle size (Table 1) of all the sampleswas examined by using Debye-Scherrer formula:
D ¼ 0:9λβ cosθ
ð2Þ
where “λ” is the wave length of X-ray (1.541 Å), “β” isthe FWHM (full width at half maximum), “θ” is the dif-fraction angle, and “D” is the particle diameter size.
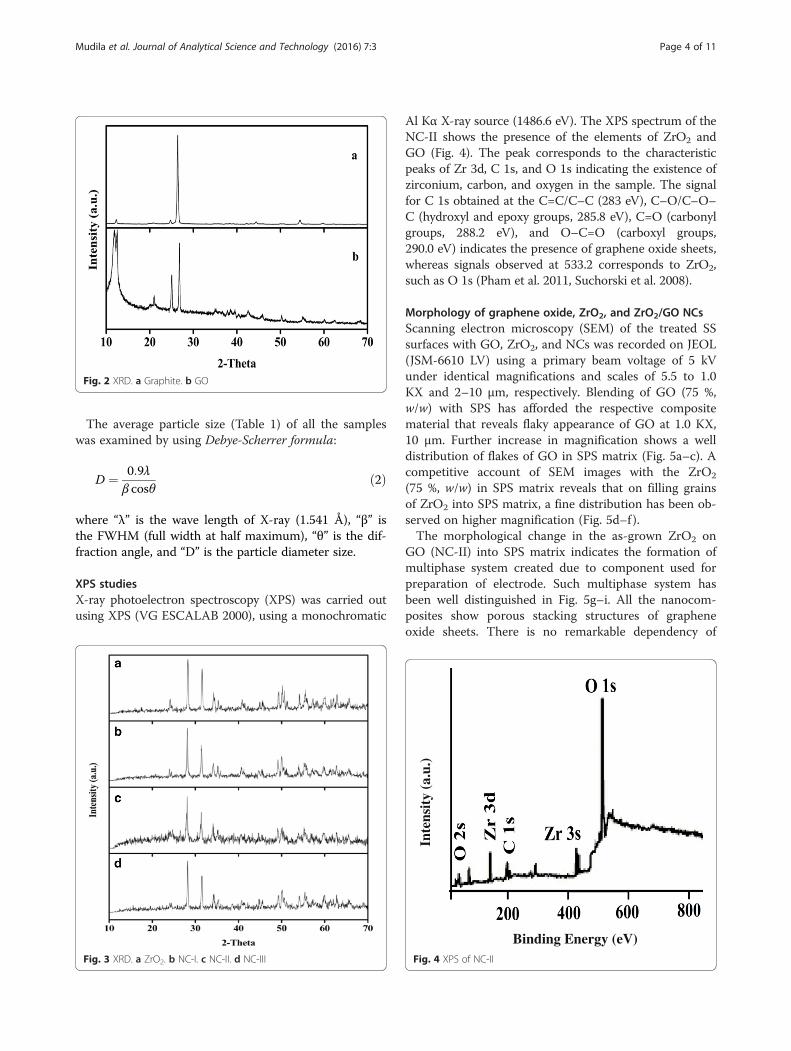
XPS studiesX-ray photoelectron spectroscopy (XPS) was carried outusing XPS (VG ESCALAB 2000), using a monochromatic
Al Kα X-ray source (1486.6 eV). The XPS spectrum of theNC-II shows the presence of the elements of ZrO2 andGO (Fig. 4). The peak corresponds to the characteristicpeaks of Zr 3d, C 1s, and O 1s indicating the existence ofzirconium, carbon, and oxygen in the sample. The signalfor C 1s obtained at the C=C/C–C (283 eV), C–O/C–O–C (hydroxyl and epoxy groups, 285.8 eV), C=O (carbonylgroups, 288.2 eV), and O–C=O (carboxyl groups,290.0 eV) indicates the presence of graphene oxide sheets,whereas signals observed at 533.2 corresponds to ZrO2,such as O 1s (Pham et al. 2011, Suchorski et al. 2008).
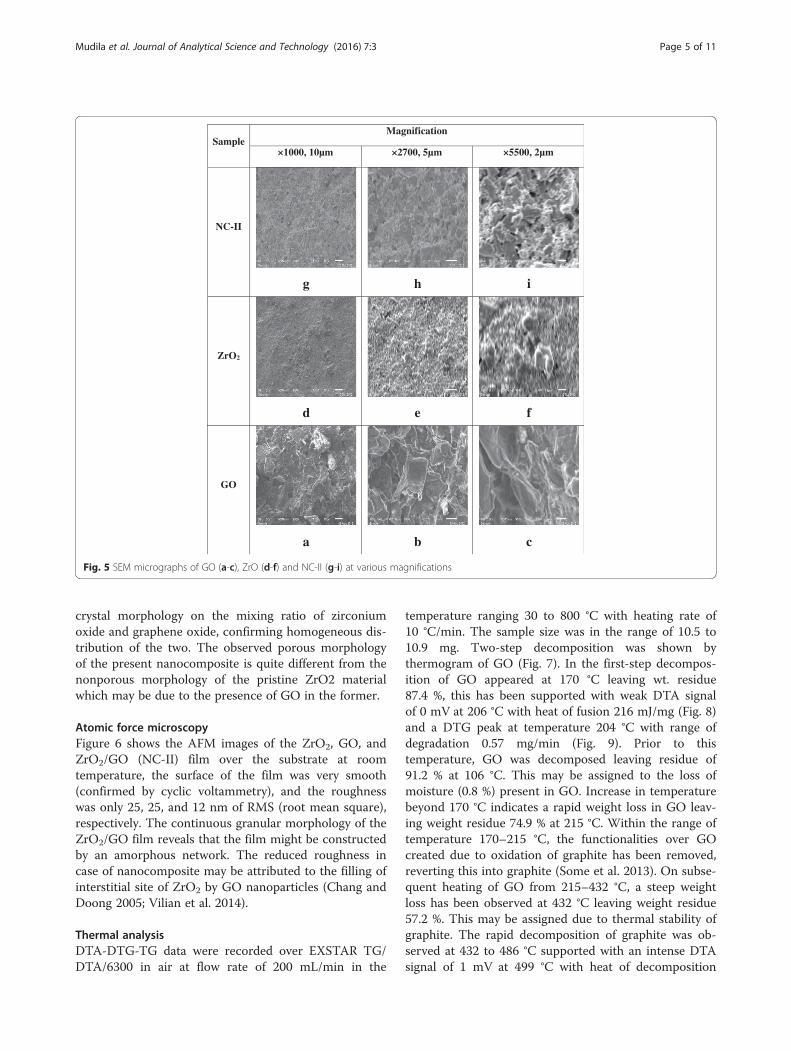
Morphology of graphene oxide, ZrO2, and ZrO2/GO NCsScanning electron microscopy (SEM) of the treated SSsurfaces with GO, ZrO2, and NCs was recorded on JEOL(JSM-6610 LV) using a primary beam voltage of 5 kVunder identical magnifications and scales of 5.5 to 1.0KX and 2–10 μm, respectively. Blending of GO (75 %,w/w) with SPS has afforded the respective compositematerial that reveals flaky appearance of GO at 1.0 KX,10 μm. Further increase in magnification shows a welldistribution of flakes of GO in SPS matrix (Fig. 5a–c). Acompetitive account of SEM images with the ZrO2
(75 %, w/w) in SPS matrix reveals that on filling grainsof ZrO2 into SPS matrix, a fine distribution has been ob-served on higher magnification (Fig. 5d–f ).The morphological change in the as-grown ZrO2 on
GO (NC-II) into SPS matrix indicates the formation ofmultiphase system created due to component used forpreparation of electrode. Such multiphase system hasbeen well distinguished in Fig. 5g–i. All the nanocom-posites show porous stacking structures of grapheneoxide sheets. There is no remarkable dependency of
Fig. 2 XRD. a Graphite. b GO
Fig. 3 XRD. a ZrO2. b NC-I. c NC-II. d NC-III
Inte
nsit
y (a
.u.)
Binding Energy (eV)Fig. 4 XPS of NC-II
Mudila et al. Journal of Analytical Science and Technology (2016) 7:3 Page 4 of 11
crystal morphology on the mixing ratio of zirconiumoxide and graphene oxide, confirming homogeneous dis-tribution of the two. The observed porous morphologyof the present nanocomposite is quite different from thenonporous morphology of the pristine ZrO2 materialwhich may be due to the presence of GO in the former.
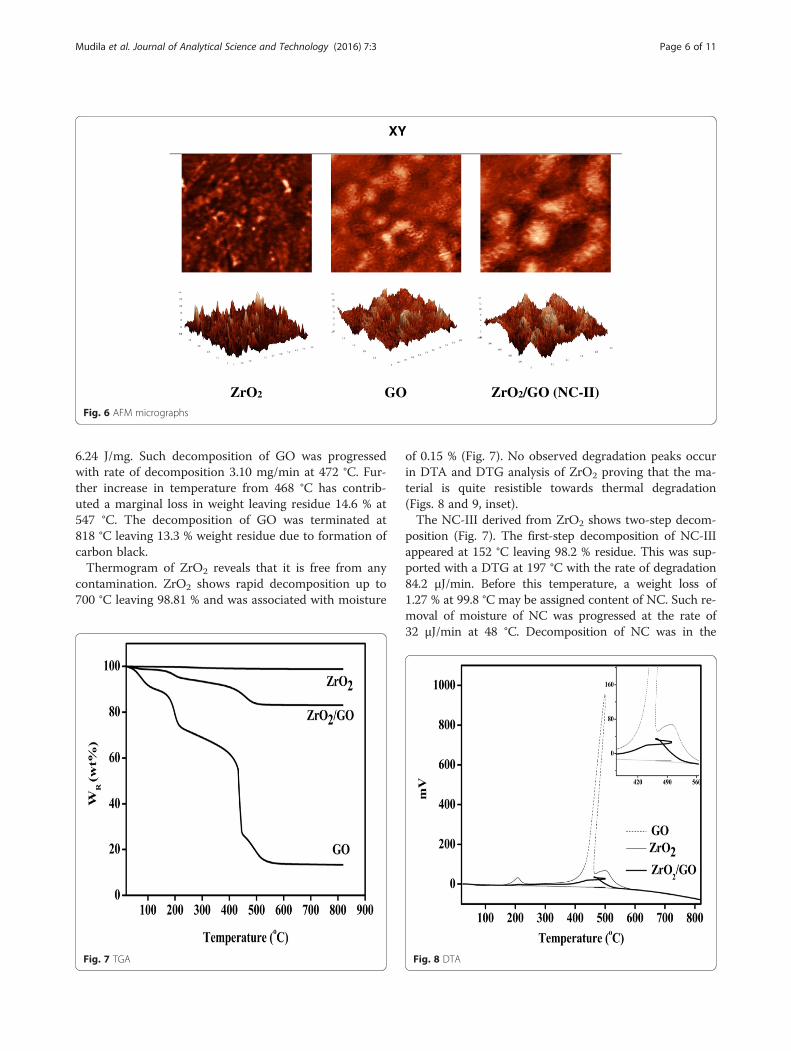
Atomic force microscopyFigure 6 shows the AFM images of the ZrO2, GO, andZrO2/GO (NC-II) film over the substrate at roomtemperature, the surface of the film was very smooth(confirmed by cyclic voltammetry), and the roughnesswas only 25, 25, and 12 nm of RMS (root mean square),respectively. The continuous granular morphology of theZrO2/GO film reveals that the film might be constructedby an amorphous network. The reduced roughness incase of nanocomposite may be attributed to the filling ofinterstitial site of ZrO2 by GO nanoparticles (Chang andDoong 2005; Vilian et al. 2014).
Thermal analysisDTA-DTG-TG data were recorded over EXSTAR TG/DTA/6300 in air at flow rate of 200 mL/min in the
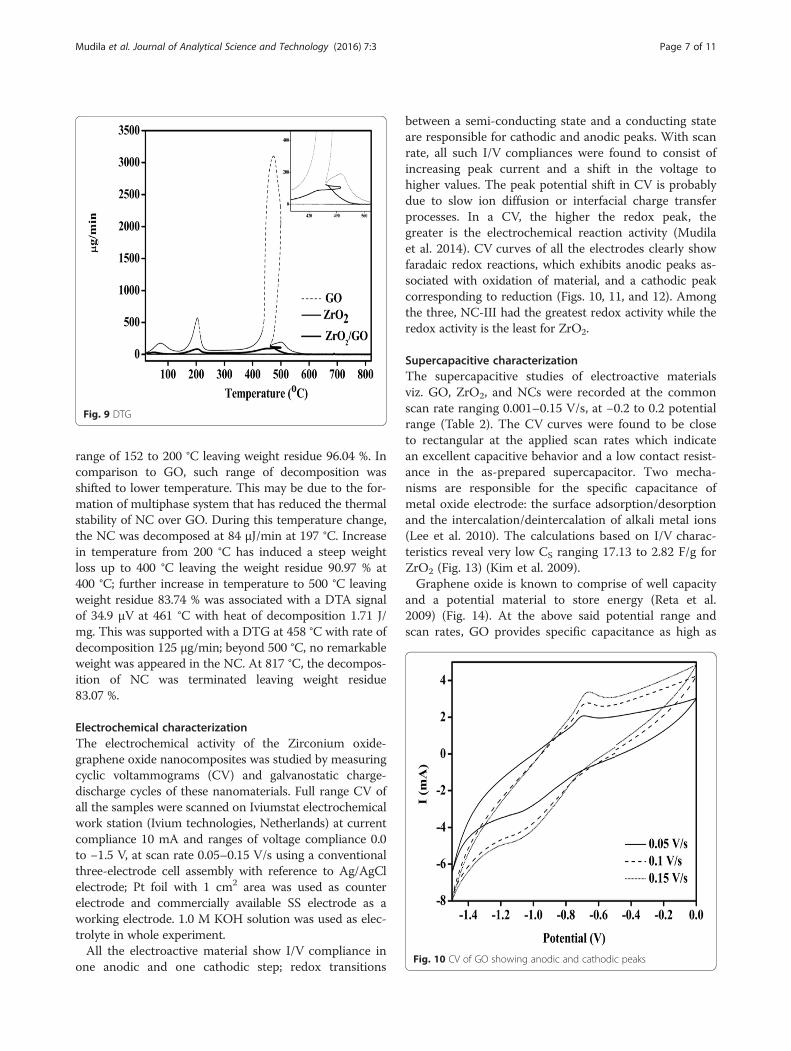
temperature ranging 30 to 800 °C with heating rate of10 °C/min. The sample size was in the range of 10.5 to10.9 mg. Two-step decomposition was shown bythermogram of GO (Fig. 7). In the first-step decompos-ition of GO appeared at 170 °C leaving wt. residue87.4 %, this has been supported with weak DTA signalof 0 mV at 206 °C with heat of fusion 216 mJ/mg (Fig. 8)and a DTG peak at temperature 204 °C with range ofdegradation 0.57 mg/min (Fig. 9). Prior to thistemperature, GO was decomposed leaving residue of91.2 % at 106 °C. This may be assigned to the loss ofmoisture (0.8 %) present in GO. Increase in temperaturebeyond 170 °C indicates a rapid weight loss in GO leav-ing weight residue 74.9 % at 215 °C. Within the range oftemperature 170–215 °C, the functionalities over GOcreated due to oxidation of graphite has been removed,reverting this into graphite (Some et al. 2013). On subse-quent heating of GO from 215–432 °C, a steep weightloss has been observed at 432 °C leaving weight residue57.2 %. This may be assigned due to thermal stability ofgraphite. The rapid decomposition of graphite was ob-served at 432 to 486 °C supported with an intense DTAsignal of 1 mV at 499 °C with heat of decomposition
SampleMagnification
×1000, 10µm ×2700, 5µm ×5500, 2µm
NC-II
g h i
ZrO2
d e f
GO
a b c
Fig. 5 SEM micrographs of GO (a-c), ZrO (d-f) and NC-II (g-i) at various magnifications
Mudila et al. Journal of Analytical Science and Technology (2016) 7:3 Page 5 of 11
6.24 J/mg. Such decomposition of GO was progressedwith rate of decomposition 3.10 mg/min at 472 °C. Fur-ther increase in temperature from 468 °C has contrib-uted a marginal loss in weight leaving residue 14.6 % at547 °C. The decomposition of GO was terminated at818 °C leaving 13.3 % weight residue due to formation ofcarbon black.Thermogram of ZrO2 reveals that it is free from any
contamination. ZrO2 shows rapid decomposition up to700 °C leaving 98.81 % and was associated with moisture
of 0.15 % (Fig. 7). No observed degradation peaks occurin DTA and DTG analysis of ZrO2 proving that the ma-terial is quite resistible towards thermal degradation(Figs. 8 and 9, inset).The NC-III derived from ZrO2 shows two-step decom-
position (Fig. 7). The first-step decomposition of NC-IIIappeared at 152 °C leaving 98.2 % residue. This was sup-ported with a DTG at 197 °C with the rate of degradation84.2 μJ/min. Before this temperature, a weight loss of1.27 % at 99.8 °C may be assigned content of NC. Such re-moval of moisture of NC was progressed at the rate of32 μJ/min at 48 °C. Decomposition of NC was in the
Fig. 7 TGA Fig. 8 DTA
XY
ZrO2 GO ZrO2/GO (NC-II)Fig. 6 AFM micrographs
Mudila et al. Journal of Analytical Science and Technology (2016) 7:3 Page 6 of 11
range of 152 to 200 °C leaving weight residue 96.04 %. Incomparison to GO, such range of decomposition wasshifted to lower temperature. This may be due to the for-mation of multiphase system that has reduced the thermalstability of NC over GO. During this temperature change,the NC was decomposed at 84 μJ/min at 197 °C. Increasein temperature from 200 °C has induced a steep weightloss up to 400 °C leaving the weight residue 90.97 % at400 °C; further increase in temperature to 500 °C leavingweight residue 83.74 % was associated with a DTA signalof 34.9 μV at 461 °C with heat of decomposition 1.71 J/mg. This was supported with a DTG at 458 °C with rate ofdecomposition 125 μg/min; beyond 500 °C, no remarkableweight was appeared in the NC. At 817 °C, the decompos-ition of NC was terminated leaving weight residue83.07 %.
Electrochemical characterizationThe electrochemical activity of the Zirconium oxide-graphene oxide nanocomposites was studied by measuringcyclic voltammograms (CV) and galvanostatic charge-discharge cycles of these nanomaterials. Full range CV ofall the samples were scanned on Iviumstat electrochemicalwork station (Ivium technologies, Netherlands) at currentcompliance 10 mA and ranges of voltage compliance 0.0to −1.5 V, at scan rate 0.05–0.15 V/s using a conventionalthree-electrode cell assembly with reference to Ag/AgClelectrode; Pt foil with 1 cm2 area was used as counterelectrode and commercially available SS electrode as aworking electrode. 1.0 M KOH solution was used as elec-trolyte in whole experiment.All the electroactive material show I/V compliance in
one anodic and one cathodic step; redox transitions
between a semi-conducting state and a conducting stateare responsible for cathodic and anodic peaks. With scanrate, all such I/V compliances were found to consist ofincreasing peak current and a shift in the voltage tohigher values. The peak potential shift in CV is probablydue to slow ion diffusion or interfacial charge transferprocesses. In a CV, the higher the redox peak, thegreater is the electrochemical reaction activity (Mudilaet al. 2014). CV curves of all the electrodes clearly showfaradaic redox reactions, which exhibits anodic peaks as-sociated with oxidation of material, and a cathodic peakcorresponding to reduction (Figs. 10, 11, and 12). Amongthe three, NC-III had the greatest redox activity while theredox activity is the least for ZrO2.
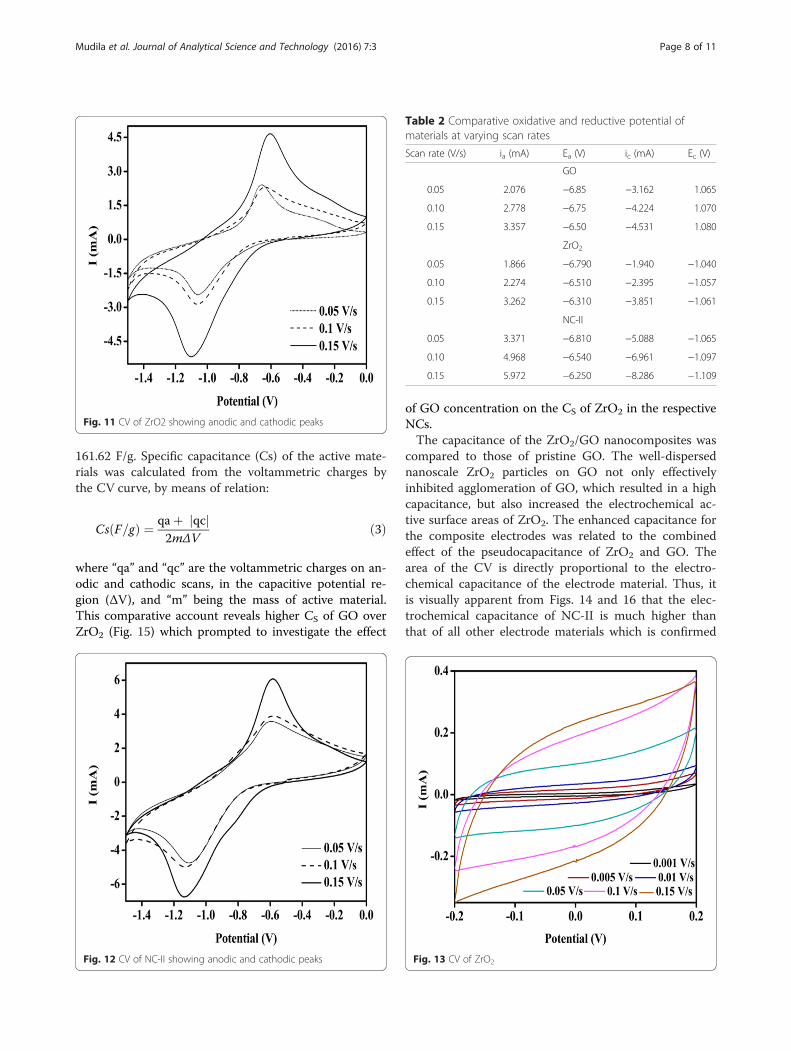
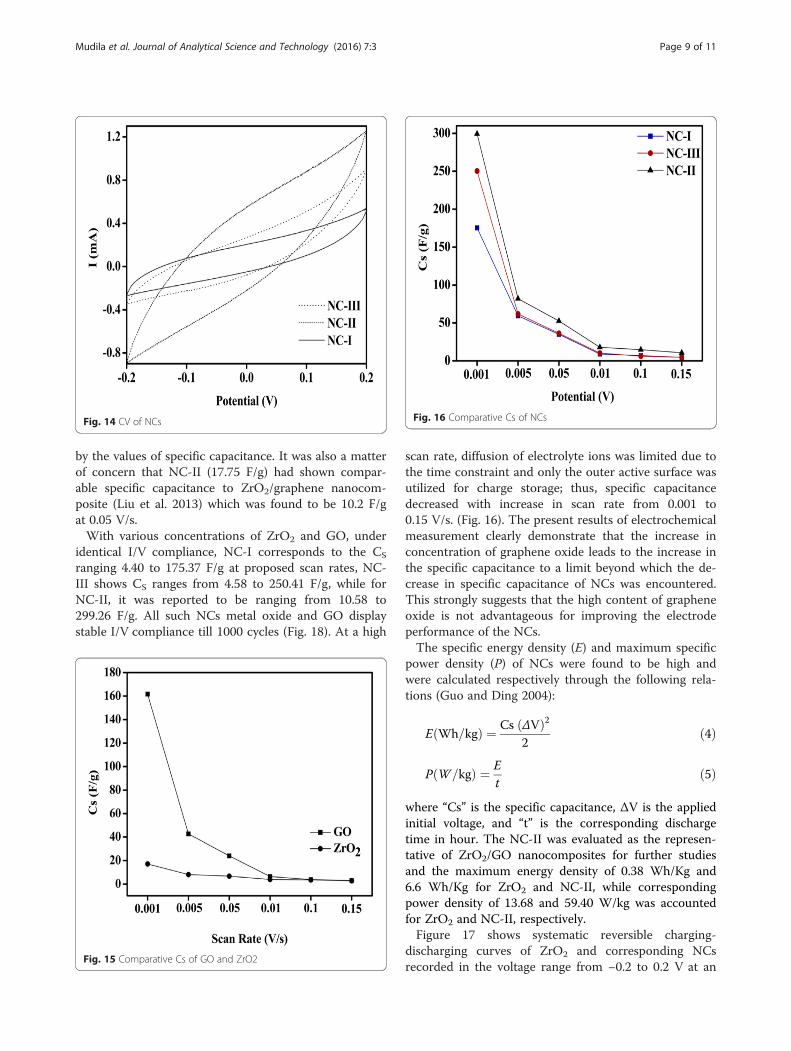
Supercapacitive characterizationThe supercapacitive studies of electroactive materialsviz. GO, ZrO2, and NCs were recorded at the commonscan rate ranging 0.001–0.15 V/s, at −0.2 to 0.2 potentialrange (Table 2). The CV curves were found to be closeto rectangular at the applied scan rates which indicatean excellent capacitive behavior and a low contact resist-ance in the as-prepared supercapacitor. Two mecha-nisms are responsible for the specific capacitance ofmetal oxide electrode: the surface adsorption/desorptionand the intercalation/deintercalation of alkali metal ions(Lee et al. 2010). The calculations based on I/V charac-teristics reveal very low CS ranging 17.13 to 2.82 F/g forZrO2 (Fig. 13) (Kim et al. 2009).Graphene oxide is known to comprise of well capacity
and a potential material to store energy (Reta et al.2009) (Fig. 14). At the above said potential range andscan rates, GO provides specific capacitance as high as
Fig. 10 CV of GO showing anodic and cathodic peaks
Fig. 9 DTG
Mudila et al. Journal of Analytical Science and Technology (2016) 7:3 Page 7 of 11
161.62 F/g. Specific capacitance (Cs) of the active mate-rials was calculated from the voltammetric charges bythe CV curve, by means of relation:
Cs F=gð Þ ¼ qaþ qcj j2mΔV
ð3Þ
where “qa” and “qc” are the voltammetric charges on an-odic and cathodic scans, in the capacitive potential re-gion (ΔV), and “m” being the mass of active material.This comparative account reveals higher CS of GO overZrO2 (Fig. 15) which prompted to investigate the effect
of GO concentration on the CS of ZrO2 in the respectiveNCs.The capacitance of the ZrO2/GO nanocomposites was
compared to those of pristine GO. The well-dispersednanoscale ZrO2 particles on GO not only effectivelyinhibited agglomeration of GO, which resulted in a highcapacitance, but also increased the electrochemical ac-tive surface areas of ZrO2. The enhanced capacitance forthe composite electrodes was related to the combinedeffect of the pseudocapacitance of ZrO2 and GO. Thearea of the CV is directly proportional to the electro-chemical capacitance of the electrode material. Thus, itis visually apparent from Figs. 14 and 16 that the elec-trochemical capacitance of NC-II is much higher thanthat of all other electrode materials which is confirmed
Fig. 11 CV of ZrO2 showing anodic and cathodic peaks
Fig. 12 CV of NC-II showing anodic and cathodic peaks
Table 2 Comparative oxidative and reductive potential ofmaterials at varying scan rates
Scan rate (V/s) ia (mA) Ea (V) ic (mA) Ec (V)
GO
0.05 2.076 −6.85 −3.162 1.065
0.10 2.778 −6.75 −4.224 1.070
0.15 3.357 −6.50 −4.531 1.080
ZrO2
0.05 1.866 −6.790 −1.940 −1.040
0.10 2.274 −6.510 −2.395 −1.057
0.15 3.262 −6.310 −3.851 −1.061
NC-II
0.05 3.371 −6.810 −5.088 −1.065
0.10 4.968 −6.540 −6.961 −1.097
0.15 5.972 −6.250 −8.286 −1.109
Fig. 13 CV of ZrO2
Mudila et al. Journal of Analytical Science and Technology (2016) 7:3 Page 8 of 11
by the values of specific capacitance. It was also a matterof concern that NC-II (17.75 F/g) had shown compar-able specific capacitance to ZrO2/graphene nanocom-posite (Liu et al. 2013) which was found to be 10.2 F/gat 0.05 V/s.With various concentrations of ZrO2 and GO, under
identical I/V compliance, NC-I corresponds to the CS
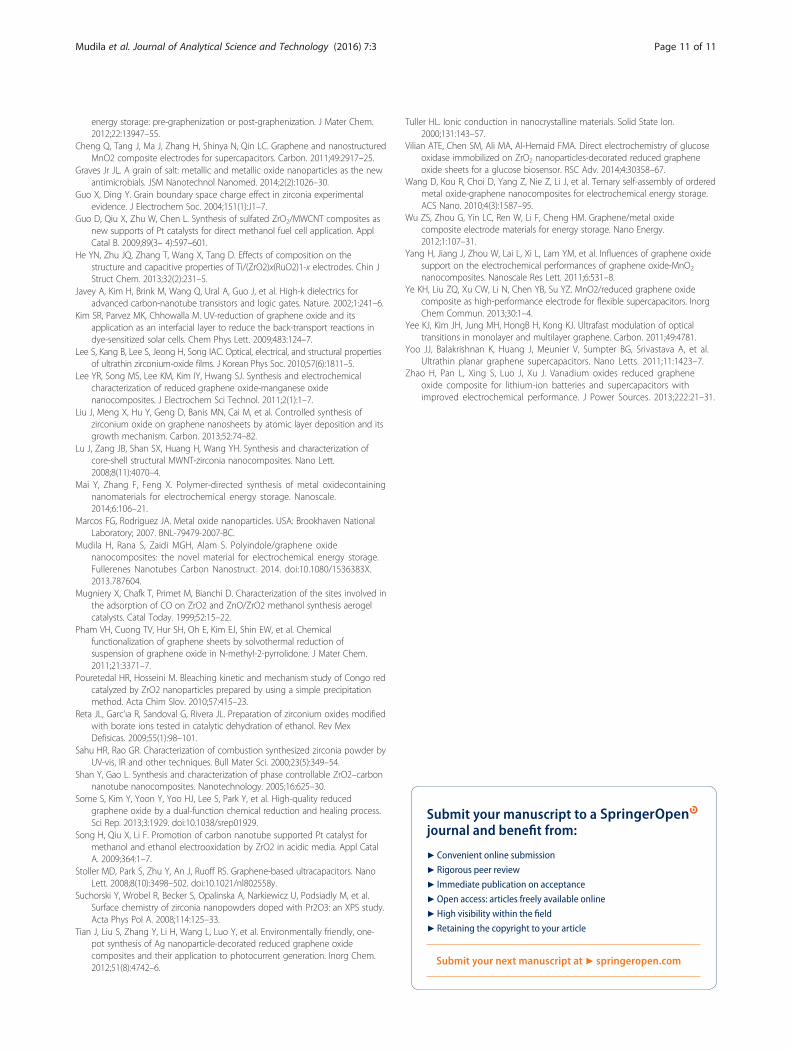
ranging 4.40 to 175.37 F/g at proposed scan rates, NC-III shows CS ranges from 4.58 to 250.41 F/g, while forNC-II, it was reported to be ranging from 10.58 to299.26 F/g. All such NCs metal oxide and GO displaystable I/V compliance till 1000 cycles (Fig. 18). At a high
scan rate, diffusion of electrolyte ions was limited due tothe time constraint and only the outer active surface wasutilized for charge storage; thus, specific capacitancedecreased with increase in scan rate from 0.001 to0.15 V/s. (Fig. 16). The present results of electrochemicalmeasurement clearly demonstrate that the increase inconcentration of graphene oxide leads to the increase inthe specific capacitance to a limit beyond which the de-crease in specific capacitance of NCs was encountered.This strongly suggests that the high content of grapheneoxide is not advantageous for improving the electrodeperformance of the NCs.The specific energy density (E) and maximum specific
power density (P) of NCs were found to be high andwere calculated respectively through the following rela-tions (Guo and Ding 2004):
E Wh=kgð Þ ¼ Cs ΔVð Þ22
ð4Þ
P W=kgð Þ ¼ Et
ð5Þ
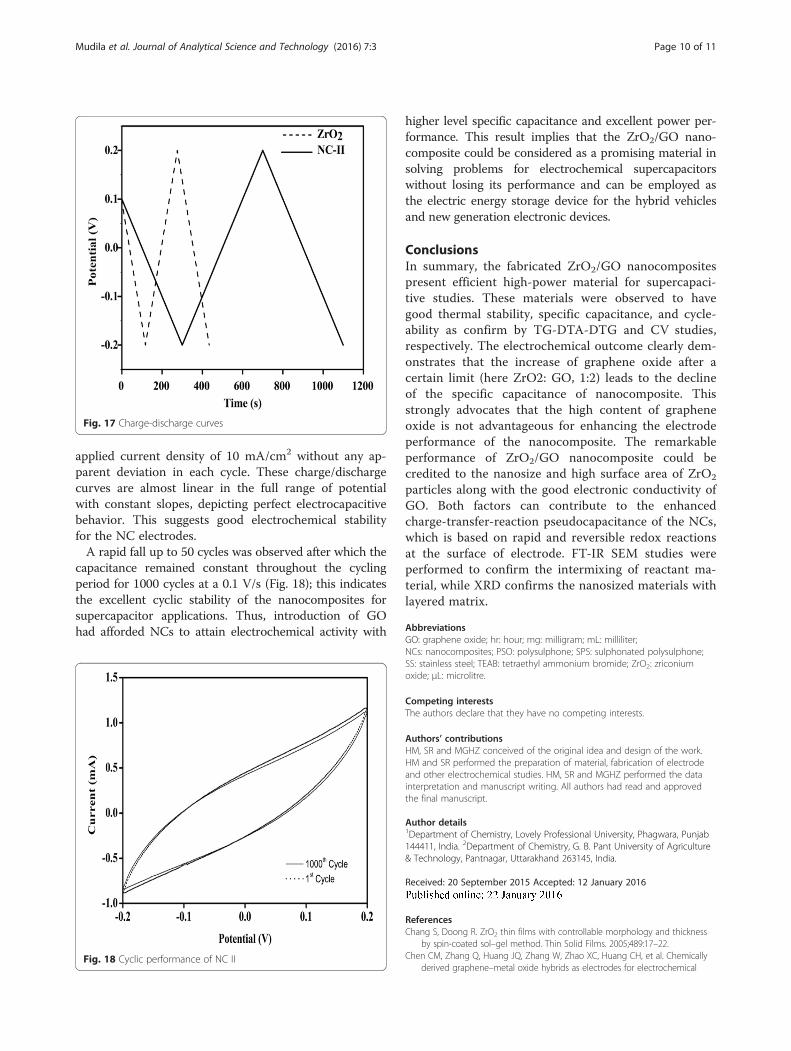
where “Cs” is the specific capacitance, ΔV is the appliedinitial voltage, and “t” is the corresponding dischargetime in hour. The NC-II was evaluated as the represen-tative of ZrO2/GO nanocomposites for further studiesand the maximum energy density of 0.38 Wh/Kg and6.6 Wh/Kg for ZrO2 and NC-II, while correspondingpower density of 13.68 and 59.40 W/kg was accountedfor ZrO2 and NC-II, respectively.Figure 17 shows systematic reversible charging-
discharging curves of ZrO2 and corresponding NCsrecorded in the voltage range from −0.2 to 0.2 V at an
Fig. 14 CV of NCs
Fig. 15 Comparative Cs of GO and ZrO2
Fig. 16 Comparative Cs of NCs
Mudila et al. Journal of Analytical Science and Technology (2016) 7:3 Page 9 of 11
applied current density of 10 mA/cm2 without any ap-parent deviation in each cycle. These charge/dischargecurves are almost linear in the full range of potentialwith constant slopes, depicting perfect electrocapacitivebehavior. This suggests good electrochemical stabilityfor the NC electrodes.A rapid fall up to 50 cycles was observed after which the
capacitance remained constant throughout the cyclingperiod for 1000 cycles at a 0.1 V/s (Fig. 18); this indicatesthe excellent cyclic stability of the nanocomposites forsupercapacitor applications. Thus, introduction of GOhad afforded NCs to attain electrochemical activity with
higher level specific capacitance and excellent power per-formance. This result implies that the ZrO2/GO nano-composite could be considered as a promising material insolving problems for electrochemical supercapacitorswithout losing its performance and can be employed asthe electric energy storage device for the hybrid vehiclesand new generation electronic devices.
ConclusionsIn summary, the fabricated ZrO2/GO nanocompositespresent efficient high-power material for supercapaci-tive studies. These materials were observed to havegood thermal stability, specific capacitance, and cycle-ability as confirm by TG-DTA-DTG and CV studies,respectively. The electrochemical outcome clearly dem-onstrates that the increase of graphene oxide after acertain limit (here ZrO2: GO, 1:2) leads to the declineof the specific capacitance of nanocomposite. Thisstrongly advocates that the high content of grapheneoxide is not advantageous for enhancing the electrodeperformance of the nanocomposite. The remarkableperformance of ZrO2/GO nanocomposite could becredited to the nanosize and high surface area of ZrO2
particles along with the good electronic conductivity ofGO. Both factors can contribute to the enhancedcharge-transfer-reaction pseudocapacitance of the NCs,which is based on rapid and reversible redox reactionsat the surface of electrode. FT-IR SEM studies wereperformed to confirm the intermixing of reactant ma-terial, while XRD confirms the nanosized materials withlayered matrix.
Competing interestsThe authors declare that they have no competing interests.
Authors’ contributionsHM, SR and MGHZ conceived of the original idea and design of the work.HM and SR performed the preparation of material, fabrication of electrodeand other electrochemical studies. HM, SR and MGHZ performed the datainterpretation and manuscript writing. All authors had read and approvedthe final manuscript.
Author details1Department of Chemistry, Lovely Professional University, Phagwara, Punjab144411, India. 2Department of Chemistry, G. B. Pant University of Agriculture& Technology, Pantnagar, Uttarakhand 263145, India.
Received: 20 September 2015 Accepted: 12 January 2016
ReferencesChang S, Doong R. ZrO2 thin films with controllable morphology and thickness
by spin-coated sol–gel method. Thin Solid Films. 2005;489:17–22.Chen CM, Zhang Q, Huang JQ, Zhang W, Zhao XC, Huang CH, et al. Chemically
derived graphene–metal oxide hybrids as electrodes for electrochemical
Fig. 17 Charge-discharge curves
Fig. 18 Cyclic performance of NC II
Mudila et al. Journal of Analytical Science and Technology (2016) 7:3 Page 10 of 11
energy storage: pre-graphenization or post-graphenization. J Mater Chem.2012;22:13947–55.
Cheng Q, Tang J, Ma J, Zhang H, Shinya N, Qin LC. Graphene and nanostructuredMnO2 composite electrodes for supercapacitors. Carbon. 2011;49:2917–25.
Graves Jr JL. A grain of salt: metallic and metallic oxide nanoparticles as the newantimicrobials. JSM Nanotechnol Nanomed. 2014;2(2):1026–30.
Guo X, Ding Y. Grain boundary space charge effect in zirconia experimentalevidence. J Electrochem Soc. 2004;151(1):J1–7.
Guo D, Qiu X, Zhu W, Chen L. Synthesis of sulfated ZrO2/MWCNT composites asnew supports of Pt catalysts for direct methanol fuel cell application. ApplCatal B. 2009;89(3– 4):597–601.
He YN, Zhu JQ, Zhang T, Wang X, Tang D. Effects of composition on thestructure and capacitive properties of Ti/(ZrO2)x(RuO2)1-x electrodes. Chin JStruct Chem. 2013;32(2):231–5.
Javey A, Kim H, Brink M, Wang Q, Ural A, Guo J, et al. High-k dielectrics foradvanced carbon-nanotube transistors and logic gates. Nature. 2002;1:241–6.
Kim SR, Parvez MK, Chhowalla M. UV-reduction of graphene oxide and itsapplication as an interfacial layer to reduce the back-transport reactions indye-sensitized solar cells. Chem Phys Lett. 2009;483:124–7.
Lee S, Kang B, Lee S, Jeong H, Song IAC. Optical, electrical, and structural propertiesof ultrathin zirconium-oxide films. J Korean Phys Soc. 2010;57(6):1811–5.
Lee YR, Song MS, Lee KM, Kim IY, Hwang SJ. Synthesis and electrochemicalcharacterization of reduced graphene oxide-manganese oxidenanocomposites. J Electrochem Sci Technol. 2011;2(1):1–7.
Liu J, Meng X, Hu Y, Geng D, Banis MN, Cai M, et al. Controlled synthesis ofzirconium oxide on graphene nanosheets by atomic layer deposition and itsgrowth mechanism. Carbon. 2013;52:74–82.
Lu J, Zang JB, Shan SX, Huang H, Wang YH. Synthesis and characterization ofcore-shell structural MWNT-zirconia nanocomposites. Nano Lett.2008;8(11):4070–4.
Mai Y, Zhang F, Feng X. Polymer-directed synthesis of metal oxidecontainingnanomaterials for electrochemical energy storage. Nanoscale.2014;6:106–21.
Mudila H, Rana S, Zaidi MGH, Alam S. Polyindole/graphene oxidenanocomposites: the novel material for electrochemical energy storage.Fullerenes Nanotubes Carbon Nanostruct. 2014. doi:10.1080/1536383X.2013.787604.
Mugniery X, Chafk T, Primet M, Bianchi D. Characterization of the sites involved inthe adsorption of CO on ZrO2 and ZnO/ZrO2 methanol synthesis aerogelcatalysts. Catal Today. 1999;52:15–22.
Pham VH, Cuong TV, Hur SH, Oh E, Kim EJ, Shin EW, et al. Chemicalfunctionalization of graphene sheets by solvothermal reduction ofsuspension of graphene oxide in N-methyl-2-pyrrolidone. J Mater Chem.2011;21:3371–7.
Pouretedal HR, Hosseini M. Bleaching kinetic and mechanism study of Congo redcatalyzed by ZrO2 nanoparticles prepared by using a simple precipitationmethod. Acta Chim Slov. 2010;57:415–23.
Reta JL, Garc’ıa R, Sandoval G, Rivera JL. Preparation of zirconium oxides modifiedwith borate ions tested in catalytic dehydration of ethanol. Rev MexDefisicas. 2009;55(1):98–101.
Sahu HR, Rao GR. Characterization of combustion synthesized zirconia powder byUV-vis, IR and other techniques. Bull Mater Sci. 2000;23(5):349–54.
Shan Y, Gao L. Synthesis and characterization of phase controllable ZrO2–carbonnanotube nanocomposites. Nanotechnology. 2005;16:625–30.
Some S, Kim Y, Yoon Y, Yoo HJ, Lee S, Park Y, et al. High-quality reducedgraphene oxide by a dual-function chemical reduction and healing process.Sci Rep. 2013;3:1929. doi:10.1038/srep01929.
Song H, Qiu X, Li F. Promotion of carbon nanotube supported Pt catalyst formethanol and ethanol electrooxidation by ZrO2 in acidic media. Appl CatalA. 2009;364:1–7.
Stoller MD, Park S, Zhu Y, An J, Ruoff RS. Graphene-based ultracapacitors. NanoLett. 2008;8(10):3498–502. doi:10.1021/nl802558y.
Suchorski Y, Wrobel R, Becker S, Opalinska A, Narkiewicz U, Podsiadly M, et al.Surface chemistry of zirconia nanopowders doped with Pr2O3: an XPS study.Acta Phys Pol A. 2008;114:125–33.
Tian J, Liu S, Zhang Y, Li H, Wang L, Luo Y, et al. Environmentally friendly, one-pot synthesis of Ag nanoparticle-decorated reduced graphene oxidecomposites and their application to photocurrent generation. Inorg Chem.2012;51(8):4742–6.
Tuller HL. Ionic conduction in nanocrystalline materials. Solid State Ion.2000;131:143–57.
Vilian ATE, Chen SM, Ali MA, Al-Hemaid FMA. Direct electrochemistry of glucoseoxidase immobilized on ZrO2 nanoparticles-decorated reduced grapheneoxide sheets for a glucose biosensor. RSC Adv. 2014;4:30358–67.
Wang D, Kou R, Choi D, Yang Z, Nie Z, Li J, et al. Ternary self-assembly of orderedmetal oxide-graphene nanocomposites for electrochemical energy storage.ACS Nano. 2010;4(3):1587–95.
Wu ZS, Zhou G, Yin LC, Ren W, Li F, Cheng HM. Graphene/metal oxidecomposite electrode materials for energy storage. Nano Energy.2012;1:107–31.
Yang H, Jiang J, Zhou W, Lai L, Xi L, Lam YM, et al. Influences of graphene oxidesupport on the electrochemical performances of graphene oxide-MnO2
nanocomposites. Nanoscale Res Lett. 2011;6:531–8.Ye KH, Liu ZQ, Xu CW, Li N, Chen YB, Su YZ. MnO2/reduced graphene oxide
composite as high-performance electrode for flexible supercapacitors. InorgChem Commun. 2013;30:1–4.
Yee KJ, Kim JH, Jung MH, HongB H, Kong KJ. Ultrafast modulation of opticaltransitions in monolayer and multilayer graphene. Carbon. 2011;49:4781.
Yoo JJ, Balakrishnan K, Huang J, Meunier V, Sumpter BG, Srivastava A, et al.Ultrathin planar graphene supercapacitors. Nano Letts. 2011;11:1423–7.
Zhao H, Pan L, Xing S, Luo J, Xu J. Vanadium oxides reduced grapheneoxide composite for lithium-ion batteries and supercapacitors withimproved electrochemical performance. J Power Sources. 2013;222:21–31.
Submit your manuscript to a journal and benefi t from:
7 Convenient online submission
7 Rigorous peer review
7 Immediate publication on acceptance
7 Open access: articles freely available online
7 High visibility within the fi eld
7 Retaining the copyright to your article
Submit your next manuscript at 7 springeropen.com
Mudila et al. Journal of Analytical Science and Technology (2016) 7:3 Page 11 of 11


![Study on electrochemical performances of sulfur-containing ...113-116]-04.pdf · Study on electrochemical performances of sulfur-containing graphene nanosheets electrodes for ...](https://static.documents.pub/doc/80x56/5a8884987f8b9a882e8e4299/study-on-electrochemical-performances-of-sulfur-containing-113-116-04pdfstudy.jpg)


