by
Zachary Paul Cano
A thesis
presented to the University of Waterloo
in fulfillment of the
thesis requirement for the degree of
Doctor of Philosophy
in
Chemical Engineering (Nanotechnology)
Electrode Design for Durable and Energy-Dense
Rechargeable Zinc-Air Batteries
Waterloo, Ontario, Canada, 2020
© Zachary Cano 2020
ii
Examining Committee Membership
The following served on the Examining Committee for this thesis. The decision of the Examining
Committee is by majority vote.
External Examiner Dr. Steen B. Schougaard
Professor
Supervisor Dr. Michael Fowler
Professor
Internal Member Dr. Zhongwei Chen
Professor
Internal Member Dr. Michael Pope
Professor
Internal-external Member Dr. Feridun Hamdullahpur
Professor
iii
Author’s Declaration
This thesis consists of material all of which I authored or co-authored: see Statement of
Contributions included in the thesis. This is a true copy of the thesis, including any required final
revisions, as accepted by my examiners.
I understand that my thesis may be made electronically available to the public.
iv
Statement of Contributions
The body of this thesis is based upon a combination of published and unpublished works.
Chapter 1 and Chapter 3 of this thesis contain parts of a review paper that was co-authored by
myself, my supervisor, Dr. M. Fowler, two collaborators, Drs. A. Yu and Z. Chen, and two PhD
students, Dr. J. Fu and M. Park. Dr. Fu and I contributed equally to the data collection and primary
manuscript writing, and M. Park assisted with data collection and manuscript writing. All authors
reviewed the manuscript.
“Electrically rechargeable zinc-air batteries: progress, challenges and perspectives”, Advanced
Materials, 29 (7) (2017) 1604685.
Chapter 2 and the introduction to Chapter 3 were adapted from a review paper that was co-
authored by myself, my supervisor (Dr. M. Fowler), and five collaborators (Dr. D. Banham, Dr.
S. Ye, Dr. A. Hintennach, Dr. J. Lu and Dr. Z. Chen). I created the manuscript synopsis, collected
and analyzed data from the literature, and primarily wrote the manuscript. Dr. Fowler and Dr. Chen
assisted with the manuscript synopsis and manuscript writing. Drs. Banham, Ye, Hintennach and
Lu assisted with manuscript writing. Dr. Hintennach provided additional battery and fuel cell data
courtesy of Daimler, AG. All authors reviewed the manuscript.
“Batteries and fuel cells for emerging electric vehicle markets”, Nature Energy, 3 (4) (2018) 279-
289.
v
Chapter 4 of this thesis is adapted from a paper that was co-authored by myself, my supervisor,
Dr. M. Fowler, three PhD students, M. Park, Dr. J. Fu, and H. Liu, one post-doctoral fellow, Dr.
D. Lee, and one collaborator, Dr. Z. Chen. I designed and carried out the experiments, collected
and analyzed the data, and primarily wrote the manuscript. M. Park assisted with X-ray diffraction
analysis and manuscript writing. H. Liu, Dr. Fowler, and Dr. Chen assisted with the experimental
design and discussion. Dr. Lee and Dr. Fu assisted with discussion and manuscript writing. All
authors reviewed the manuscript.
“New Interpretation of the Performance of Nickel-Based Air Electrodes for Rechargeable Zinc–
Air Batteries”, Journal of Physical Chemistry C, 122 (35) (2018) 20153-20166.
Chapter 5 of this thesis consists of previously unpublished work by myself, my supervisor, Dr.
M. Fowler, two PhD students, M. Park, and H. Liu, and one collaborator, Dr. Z. Chen. I designed
and carried out the experiments, collected and analyzed the data, and wrote all parts of the chapter.
M. Park assisted with X-ray diffraction analysis. H. Liu, Dr. Fowler, and Dr. Chen assisted with
the experimental design and discussion.
vi
Abstract
Energy storage has become an increasingly important topic due to the need for rapid
deployment of intermittent renewable energy sources and electric vehicles (EVs) around the world.
Today’s EVs, which have entered mass-market production over the past decade, are almost
exclusively powered by lithium-ion batteries. However, there is a long way to go before EVs
become dominant in the global automotive market. In addition to global government policy
support, widespread deployment of EVs will likely require high-performance and low-cost energy
storage technologies including both batteries and fuel cells. Zinc-air batteries have been proposed
as a low-cost and energy-dense candidate to replace or supplement lithium-ion batteries in EVs;
however, an electrically rechargeable zinc-air battery with a sufficient combination of energy
density, cycle life and calendar life for this application has yet to be developed. In an effort to
address this research gap, this thesis (i) explores the viability of zinc-air battery technology in EVs
with a thorough and evaluative literature review and (ii) experimentally investigates the use of
nickel-based air electrodes for durable and energy-dense rechargeable zinc-air batteries.
This work begins with a comprehensive evaluation of various batteries and hydrogen fuel
cells possessing the greatest potential to benefit future EVs. Three sectors that are not well served
by current lithium-ion powered EVs, namely the long-range, low-cost and high-utilization
transportation markets, are discussed. The technology properties which must be improved upon to
fully enable these EV markets include specific energy, cost, safety and power grid compatibility.
Six energy storage and conversion technologies which possess varying combinations of these
vii
improved characteristics are compared and separately evaluated for each market. Then, the
technological status of these battery and fuel cells are briefly reviewed, emphasizing barriers which
must be overcome. Zinc-air batteries are identified as one of the technologies which could enable
lower-cost and longer-range EVs, particularly when used as a range extender in conjunction with
another battery with complementary properties.
Next, a detailed review of the current status and technological barriers of zinc-air batteries
is provided. The limited cycle life and calendar life of these batteries is mainly caused by dendritic
growth and shape change of the zinc electrode in addition to corrosion and carbonate formation at
the air electrode. A variety of zinc electrodes and air electrodes designed to mitigate these issues
are evaluated, with a specific focus on the potential of these electrodes to be used in long-lasting
energy-dense zinc-air batteries.
The next part of the thesis focuses on nickel-based air electrodes, which have shown promise
as a corrosion-resistant substitute for conventional carbon-based air electrodes but have not
previously undergone an in-depth study of their performance in zinc-air batteries. Specifically, the
effect of the nickel (oxy)hydroxide passivating film on the electrode’s catalytic performance and
durability requires investigation. To fill this research gap, a method involving electrochemical
estimation of the nickel (oxy)hydroxide film capacity was used to correlate the growth of the film
to performance losses experienced on the air electrode after battery cycling. The main cause of
voltage loss was determined to be the nickel (oxy)hydroxide film growing overtop of and inside
the catalyst-coated nickel aggregates. This resulted in significant activation and mass transfer
losses, where the latter losses were caused by the film growing overtop of the catalyst and
viii
accounted for at least 65% of the total voltage degradation at 10 mA cm-2. Potential modifications
to the electrode structure which could mitigate these voltage losses are discussed, including
reducing the nickel particle aggregate size, using high-aspect ratio catalysts, and physically
separating the catalyst and nickel particles with non-film-forming conductive additives.
Finally, a new nickel-based air electrode having both improved cycle life and substantially
lower mass and volume than previous designs is presented. The thin nickel foam-based electrode
can provide more than 1100 charge-discharge cycles during over 700 hours of operation with a
discharge potential over 1.0 V vs. Zn at a current density of 10 mA cm-2, or more than 500 charge-
discharge cycles during over 340 hours of operation with a discharge potential over 1.0 V vs. Zn
at a current density of 20 mA cm-2. Estimates of the specific energy and energy density of
rechargeable zinc-air batteries incorporating this air electrode paired with various reversible zinc
electrodes from the literature are calculated. From these results, the potential viability of this
electrode and future work needed to successfully develop an energy-dense rechargeable zinc-air
battery for EVs are discussed.
ix
Acknowledgements
I would first like to thank my supervisor, Professor Michael Fowler, for the guidance and
dependable support he provided to me during my PhD degree work. His enthusiasm and openness
always made me feel comfortable to work on several different projects during my studies. I also
want to thank my committee member, Professor Zhongwei Chen, for providing additional
guidance and support as well as the opportunity to work in his lab and collaborate with members
of his research group. I also want to thank my entire examining committee for their time in
reviewing my proposed work and thesis and for the feedback they gave me.
I would also like to thank all the students and researchers in Dr. Fowler’s and Dr. Chen’s
groups for helping me with setting up experiments, giving me suggestions for new things to try,
giving me feedback on my writing and presentations, and most importantly for their friendship and
kindness. In particular, Moon Gyu Park, Hao Liu, Dr. Dong Un Lee, Dr. Jing Fu, and Dr. Yining
Zhang greatly helped me with my work. I would also like to thank the National Sciences and
Engineering Research Council of Canada (NSERC) and the University of Waterloo for providing
additional financial support during my studies.
Finally, I would like to thank my family and friends for their patience and support over the
past four-plus years. Most of all, I want to thank my partner Catherine Silva not only for pointing
me to some literature that I missed, including a reference that was very useful for improving the
performance of the nickel-based air electrode, but also for making me laugh and for being my best
friend over the past decade.
x
Table of Contents
Examining Committee Membership ........................................................................................... ii
Author’s Declaration ................................................................................................................... iii
Statement of Contributions ......................................................................................................... iv
Abstract ......................................................................................................................................... vi
Acknowledgements ...................................................................................................................... ix
List of Figures ............................................................................................................................. xiii
List of Tables ............................................................................................................................. xvii
List of Abbreviations .................................................................................................................. xx
Chapter 1: Introduction ........................................................................................................... 1
1.1 Motivation ............................................................................................................................. 1
1.2 Thesis Objectives and Structure............................................................................................ 5
Chapter 2: Evaluation of Batteries and Fuel Cells for Emerging Electric Vehicle Markets
6
2.1 Introduction ........................................................................................................................... 6
2.2 Energy Storage Barriers in Emerging Electric Vehicle Markets .......................................... 8
2.2.1 Long-Range Transport ................................................................................................... 8
2.2.2 Low-Cost Transport ..................................................................................................... 11
2.2.3 High-Utilization Transport .......................................................................................... 13
2.3 Evaluation of Electrochemical Technology Candidates ..................................................... 15
xi
2.3.1 Commercial Rechargeable Batteries ............................................................................ 22
2.3.2 Emerging Rechargeable Batteries ................................................................................ 23
2.3.3 Hydrogen Fuel Cells .................................................................................................... 27
2.4 Conclusions ......................................................................................................................... 33
Chapter 3: Challenges and Strategies for Designing Energy-Dense Rechargeable Zinc-air
Battery Electrodes ....................................................................................................................... 35
3.1 Introduction ......................................................................................................................... 35
3.2 Zinc-Air Battery Operation and Configuration................................................................... 36
3.3 Reversible Zinc Electrode ................................................................................................... 41
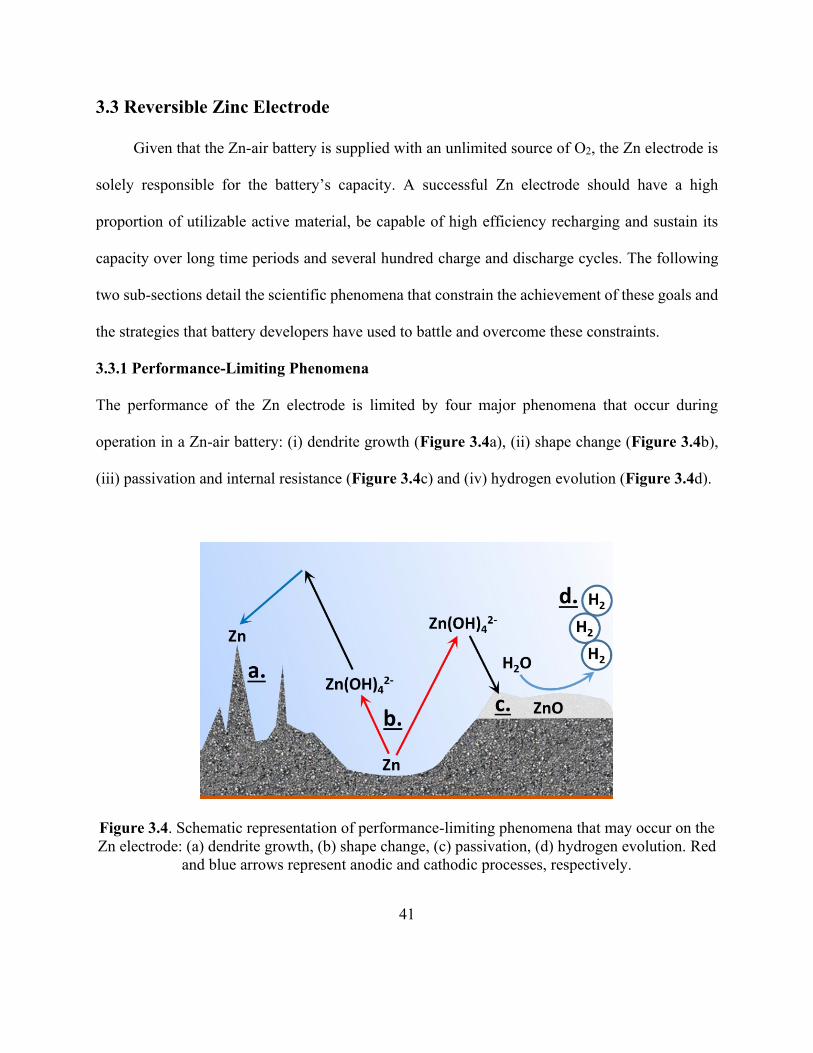
3.3.1 Performance-Limiting Phenomena .............................................................................. 41
3.3.2 Strategies for Improving Performance ......................................................................... 44
3.4 Electrolyte and Separator .................................................................................................... 48
3.5 Bifunctional Air Electrode .................................................................................................. 53
3.4.1 Electrode Design .......................................................................................................... 54
3.4.2 Oxygen Reaction Catalysts .......................................................................................... 59
Chapter 4: Performance and Failure Mechanism of Nickel-Based Air Electrodes for
Rechargeable Zinc-Air Batteries ............................................................................................... 62
4.1 Introduction ......................................................................................................................... 62
4.2 Experimental Methods ........................................................................................................ 64
4.2.1 Electrode Preparation and Characterization ................................................................ 64
4.2.2 Cell Design .................................................................................................................. 67
4.2.3 Electrochemical Testing .............................................................................................. 68
4.3 Results and Discussion ....................................................................................................... 73
4.4 Conclusions ......................................................................................................................... 96
xii
Chapter 5: Design and Feasibility of Thin Nickel Foam-Based Air Electrodes for
Rechargeable Zinc-Air Batteries ............................................................................................... 98
5.1 Introduction ......................................................................................................................... 98
5.2 Experimental Methods ........................................................................................................ 99
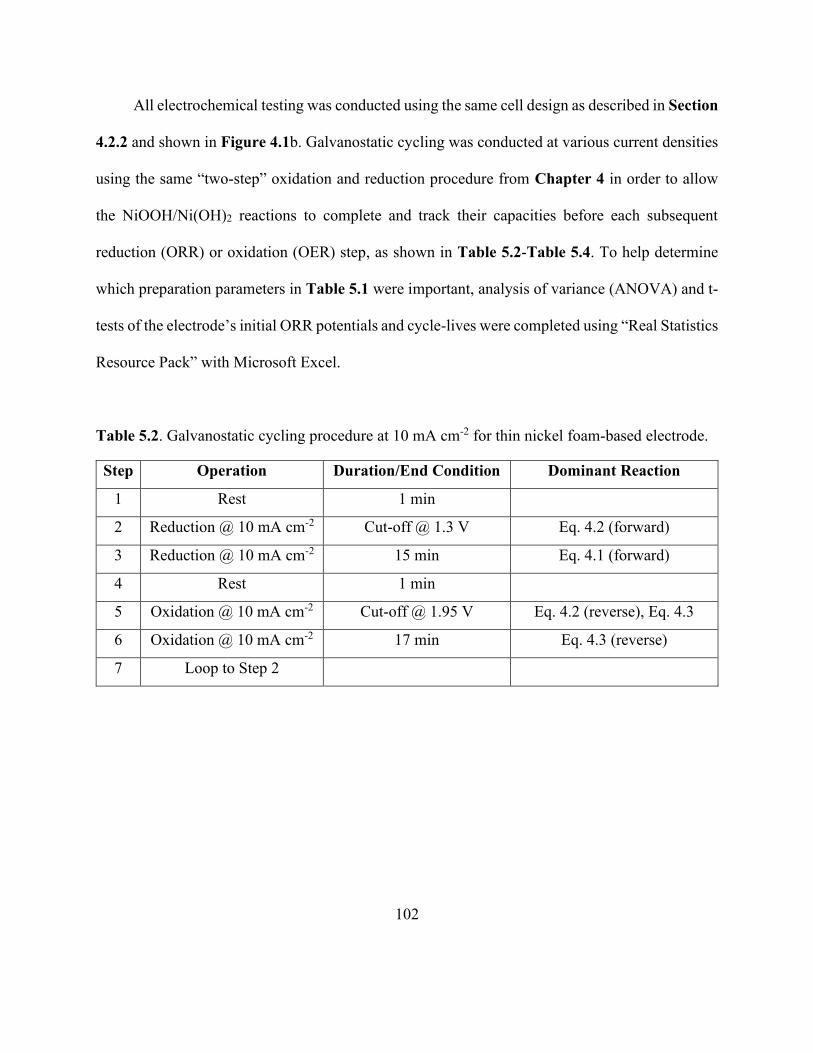
5.3 Results and Discussion ..................................................................................................... 104
5.3.1 Physical Characterization .......................................................................................... 104
5.3.2 Electrochemical Cycling Evaluation ......................................................................... 113
5.3.3 Specific Energy and Energy Density Estimation ....................................................... 128
5.4 Conclusions ....................................................................................................................... 130
Chapter 6: Conclusions and Future Work ......................................................................... 132
6.1 Conclusions ....................................................................................................................... 132
6.2 Future Work ...................................................................................................................... 135
Letters of Copyright Permission.............................................................................................. 138
1. John Wiley and Sons / Advanced Materials ................................................................... 138
2. Springer Nature / Nature Energy .................................................................................... 144
3. American Chemical Society / The Journal of Physical Chemistry C ............................. 146
References .................................................................................................................................. 147
Appendix .................................................................................................................................... 159
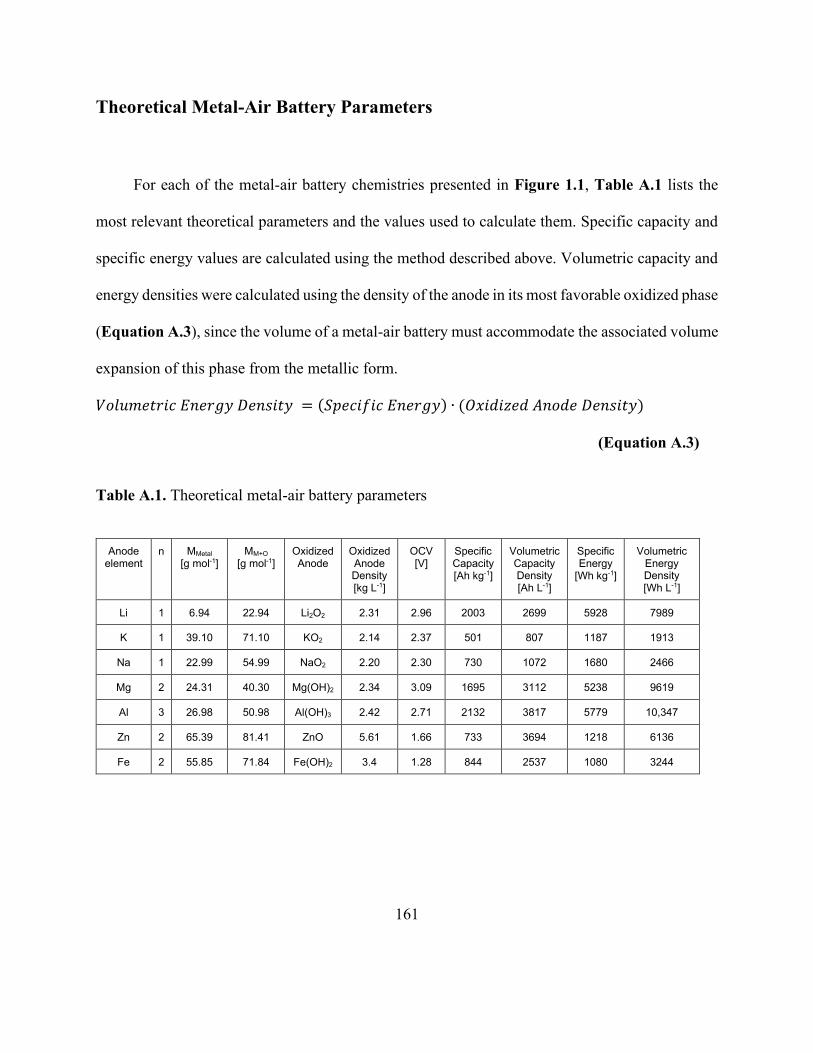
Theoretical Specific Energy Calculation ................................................................................ 159
Theoretical Metal-Air Battery Parameters .............................................................................. 161
Supplementary Tables for Chapter 2 ...................................................................................... 162
xiii
List of Figures
Figure 1.1. Theoretical specific energies, volumetric energy densities and nominal cell voltages
for various metal anodes in aqueous and non-aqueous metal-air batteries. .................................... 3
Figure 2.1. Evolution of cumulative EV sales and EV market share prescribed in the International
Energy Agency’s Beyond 2 Degrees Scenario. [37]. ........................................................................ 8
Figure 2.2. 2017 model EV ranges and price premiums. ............................................................. 10
Figure 2.3. Consumer vehicle purchasing habits in the United States versus emerging countries.
....................................................................................................................................................... 13
Figure 2.4. Characteristics of rechargeable batteries and hydrogen fuel cells. ............................ 16
Figure 2.5. Vehicle cost and cost of additional range as a function of driving range. ................. 19
Figure 2.6. Sensitivity plots of midsize vehicle cost and range. .................................................. 21
Figure 2.7. Vehicle cost as a function of driving range for Li-ion battery and hydrogen fuel cell
EVs. ............................................................................................................................................... 30
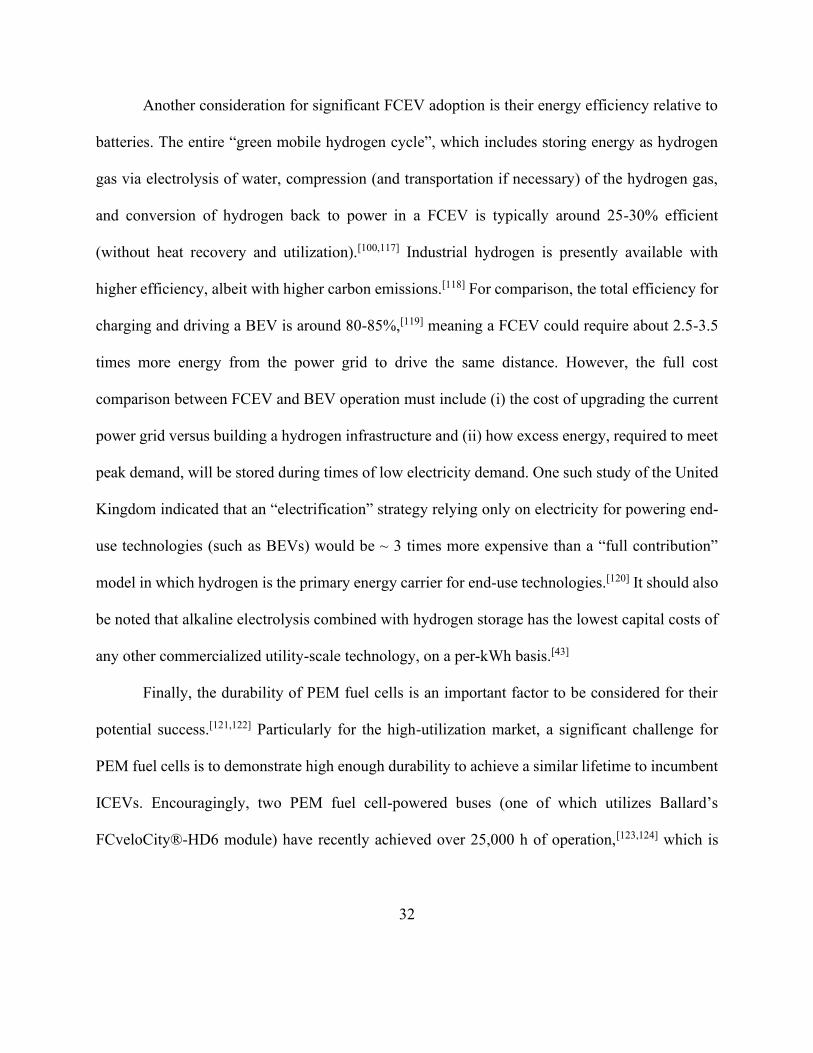
Figure 2.8. Suitability of alternative batteries and fuel cells to emerging EV markets. .............. 34
Figure 3.1. Schematic operating mechanism of a rechargeable Zn-air battery. ........................... 37
Figure 3.2. Schematic representation of prismatic Zn-air battery configuration. ........................ 39
Figure 3.3. Multi-cell Zn-air battery configuration with molopolar arrangement and bipolar
arrangement................................................................................................................................... 40
Figure 3.4. Schematic representation of performance-limiting phenomena that may occur on the
Zn electrode: dendrite growth, shape change, passivation, hydrogen evolution. ......................... 41
xiv
Figure 3.5. Electrolyte conductivity, Zn/Zn2+ exchange current density and ZnO solubility as a
function of KOH concentration .................................................................................................... 51
Figure 3.6. Example of discharge and charge voltages, power density and energy efficiency as a
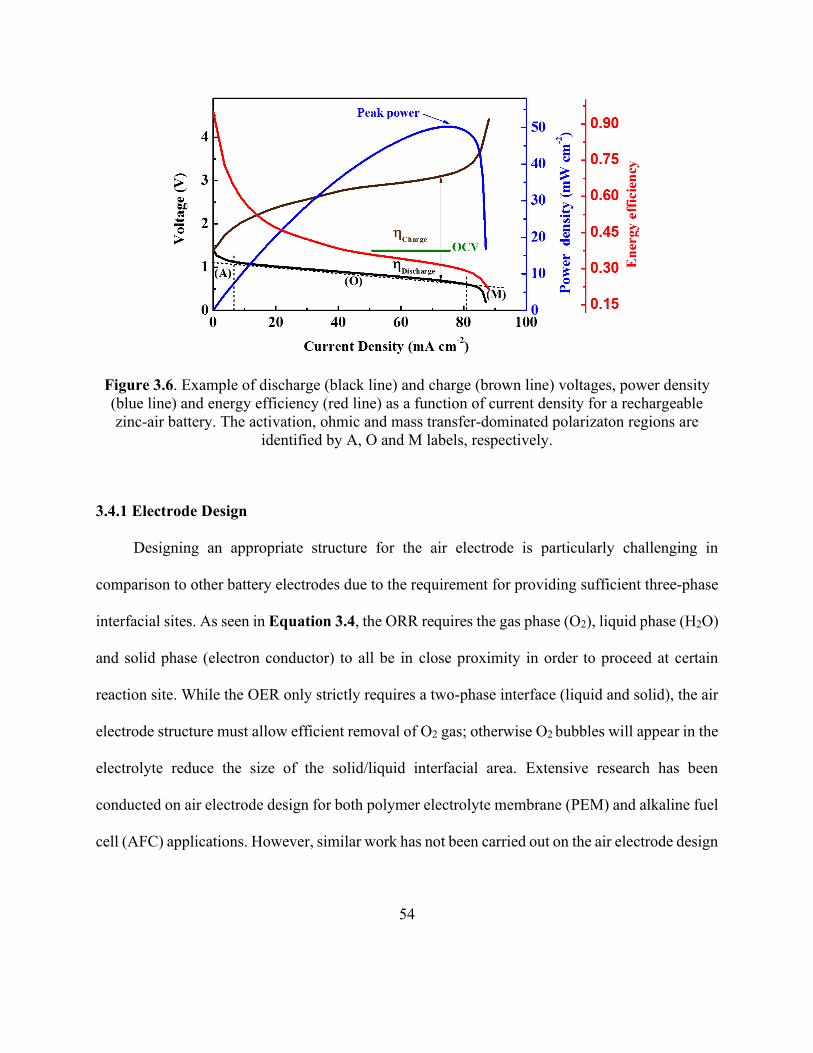
function of current density for a rechargeable zinc-air battery. .................................................... 54
Figure 3.7. General architecture of fuel cell or metal-air battery air electrode. ........................... 56
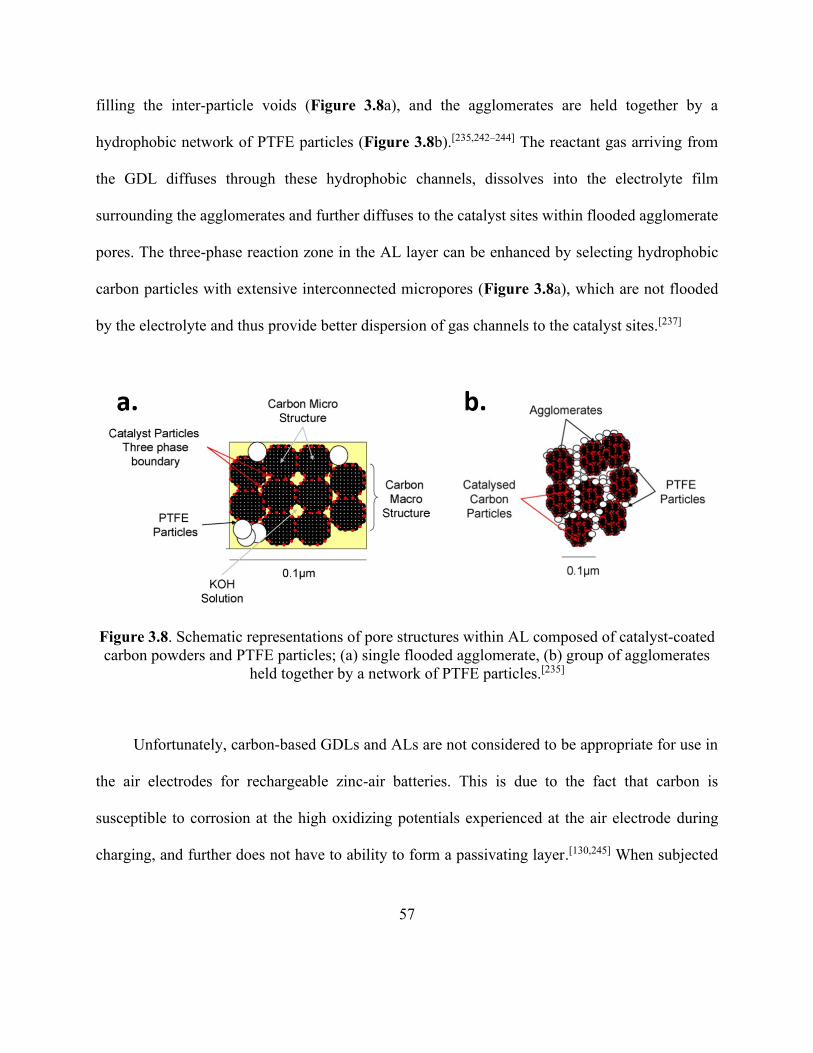
Figure 3.8. Schematic representations of pore structures within AL composed of catalyst-coated
carbon powders and PTFE particles. ............................................................................................ 57
Figure 4.1. Schematic depiction of single-layer nickel-based gas diffusion electrode, and
schematic representations of three-electrode cells for performance evaluation of nickel-based gas
diffusion electrode and nickel-based thin-layer electrode ............................................................ 66
Figure 4.2. Graphical demonstration of two-step reduction and two-step oxidation cycles and the
dominant reactions occurring at each step. ................................................................................... 71
Figure 4.3. SEM images of the nickel particle morphology, the Ni/PTFE slurry-deposited side of
the electrode, the non-slurry side of the electrode and the deposited NiCo2O4 catalyst. .............. 74
Figure 4.4. Galvanostatic cycling results for nickel-based gas diffusion electrode. .................... 76
Figure 4.5. SEM images of the nickel-based gas diffusion electrode before cycling and after 100
galvanostatic oxidation/reduction cycles. ..................................................................................... 78
Figure 4.6. XRD spectra of the nickel-based gas diffusion electrode surface before cycling and
after 10 and 100 galvanostatic oxidation/reduction cycles. .......................................................... 79
Figure 4.7. XPS analysis of the nickel-based gas diffusion electrode before and after 10 and 100
galvanostatic oxidation/reduction cycles. ..................................................................................... 81
xv
Figure 4.8. Galvanostatic EIS plots for nickel-based gas diffusion electrode. ............................ 85
Figure 4.9. Cyclic potentiodynamic polarization results for nickel-based gas diffusion electrode.
....................................................................................................................................................... 86
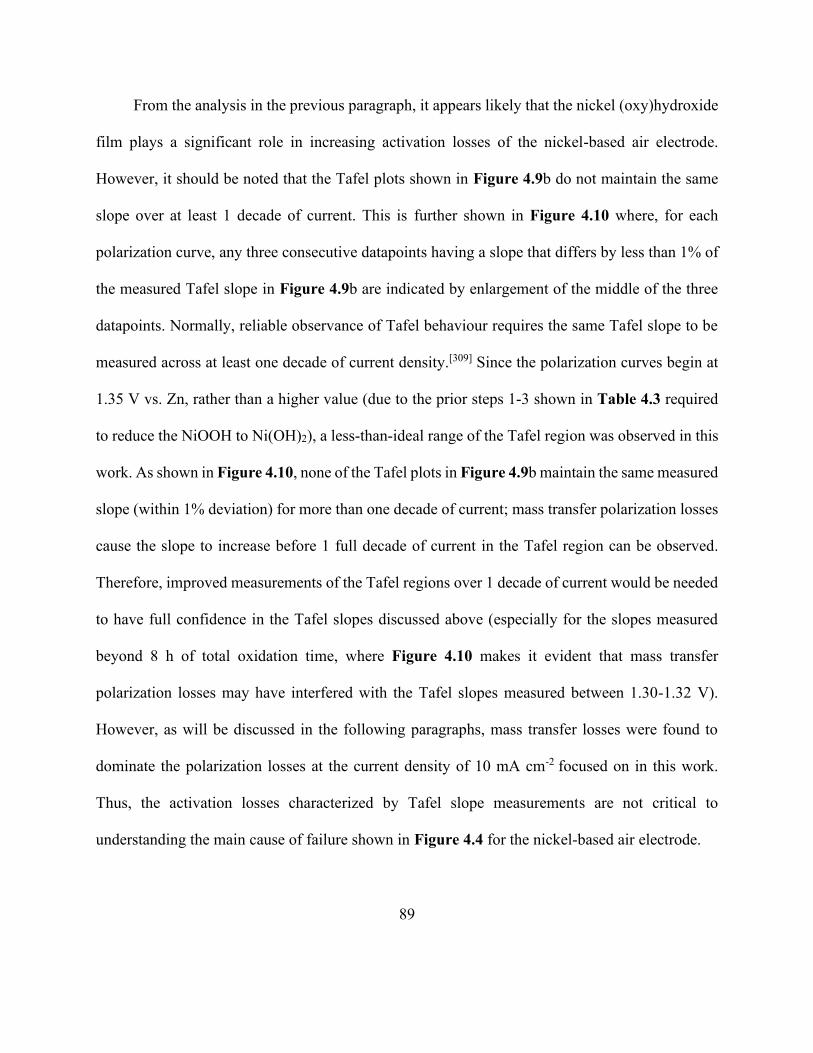
Figure 4.10. Magnified ORR polarization curves from Figure 4.9a. . ........................................ 90
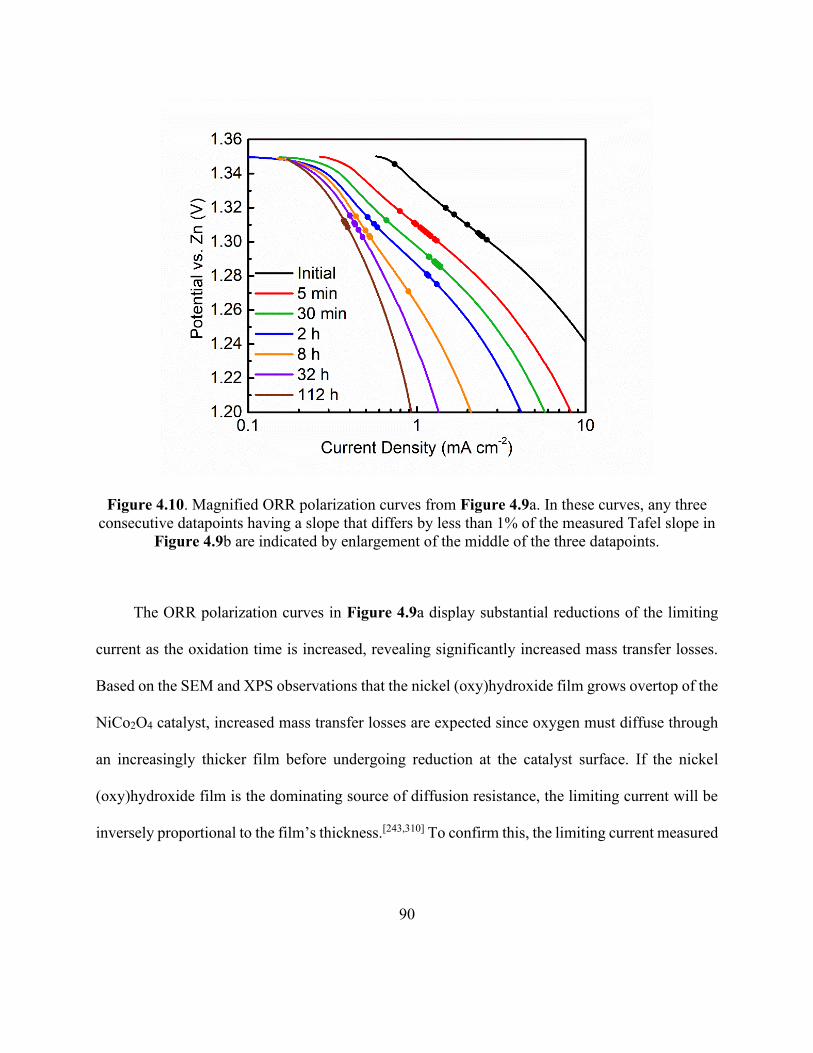
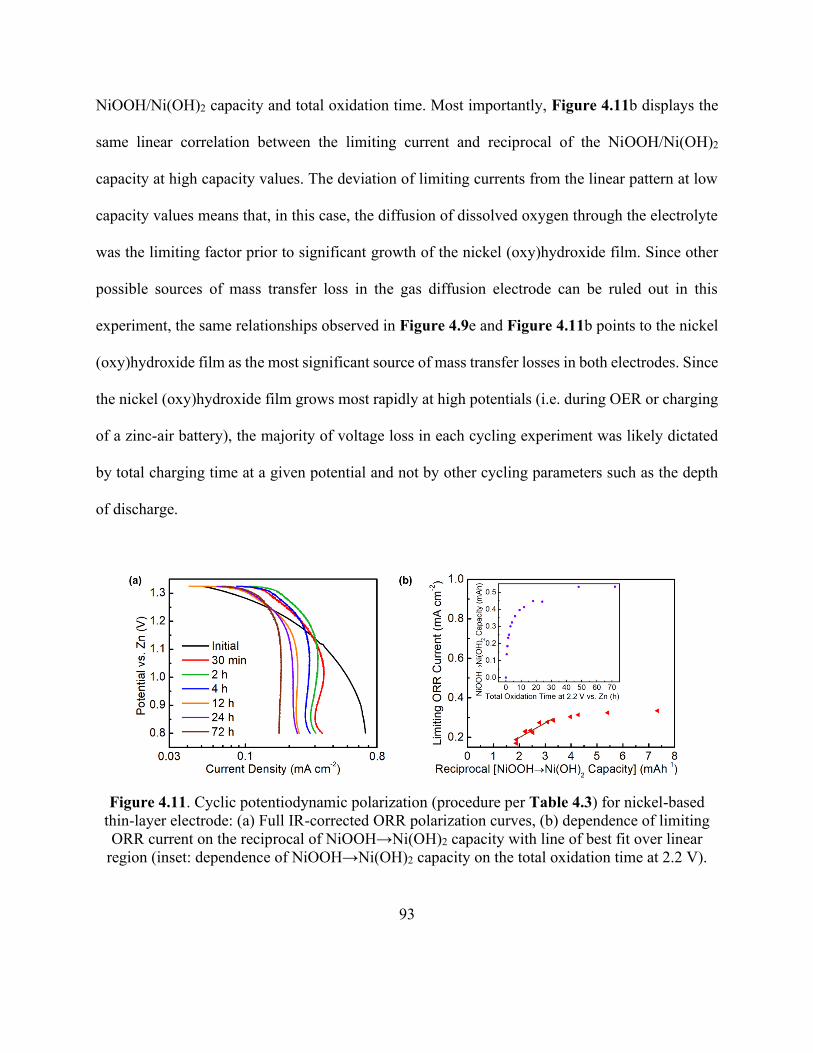
Figure 4.11. Cyclic potentiodynamic polarization for nickel-based thin-layer electrode. ........... 93
Figure 4.12. Schematic representation of an electrolyte-flooded agglomerate of catalyst-coated
nickel particles showing the nickel oxy(hydroxide) film growth resulting from prolonged
oxidation. ...................................................................................................................................... 95
Figure 5.1. SEM images of thin nickel-foam based air electrode. ............................................. 105
Figure 5.2. SEM images of the thin nickel foam-based air electrode after various stages of
preparation. ................................................................................................................................. 108
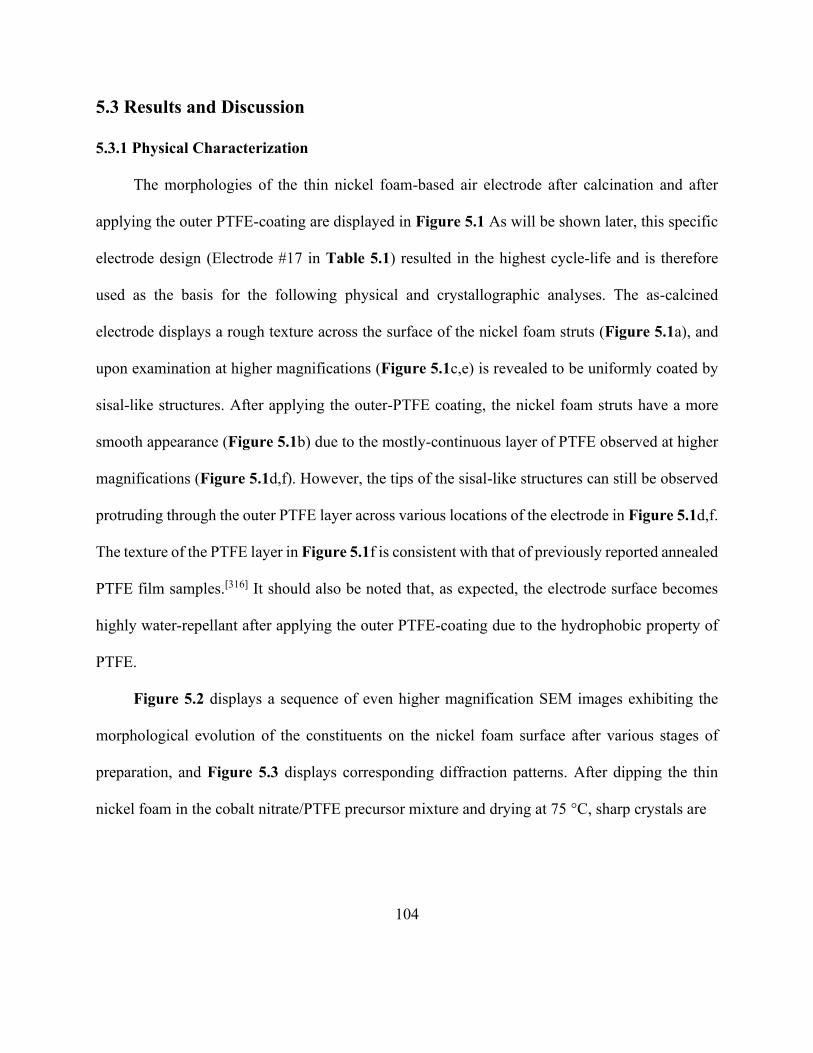
Figure 5.3. XRD spectra of the nickel foam-based air electrode after various stages of preparation.
..................................................................................................................................................... 109
Figure 5.4. SEM images of [Ni1/3Co2/3](NO3)2/PTFE-dipped and pre-heat-treated electrode. .. 110
Figure 5.5. Galvanostatic cycling at 10 mA cm-2 for thin-nickel foam-based air electrode with
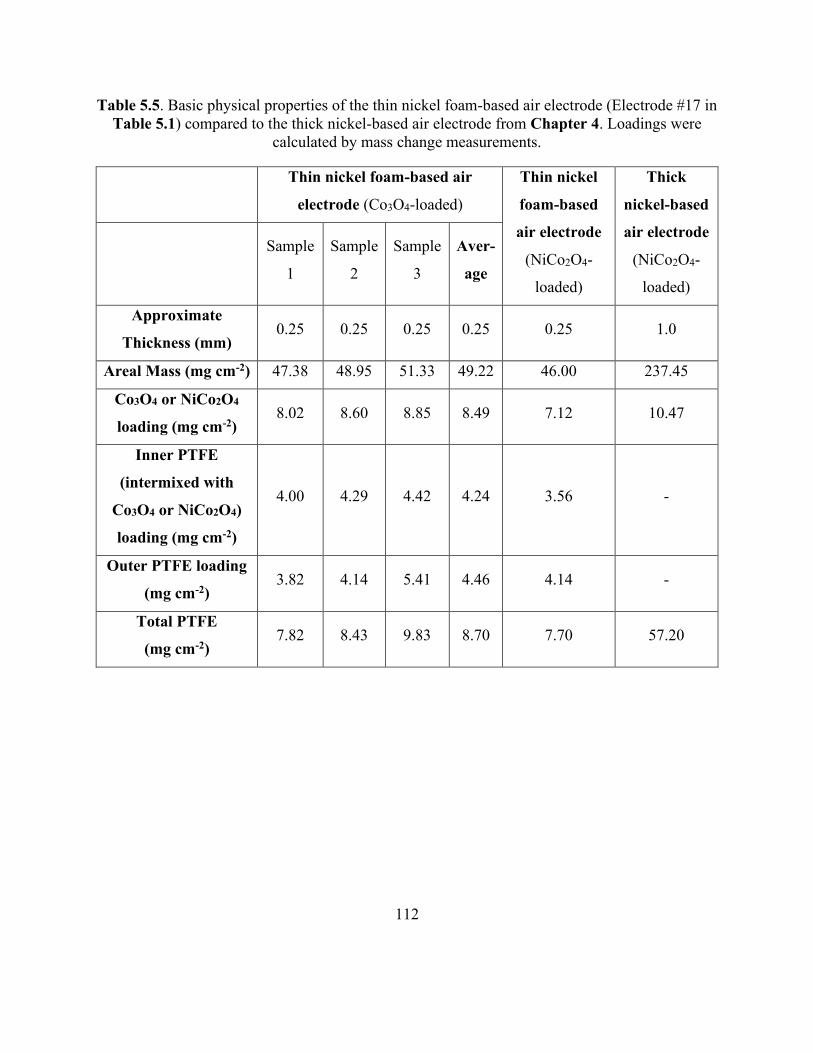
NiCo2O4 catalyst. ........................................................................................................................ 115
Figure 5.6. Galvanostatic cycling at 10 mA cm-2 for thin-nickel foam-based air electrode with
Co3O4 catalyst. ............................................................................................................................ 117
Figure 5.7. Galvanostatic cycling potentials for thin-nickel foam-based air electrode with Co3O4
catalyst at 20 mA cm-2 and 50 mA cm-2. .................................................................................... 119
xvi
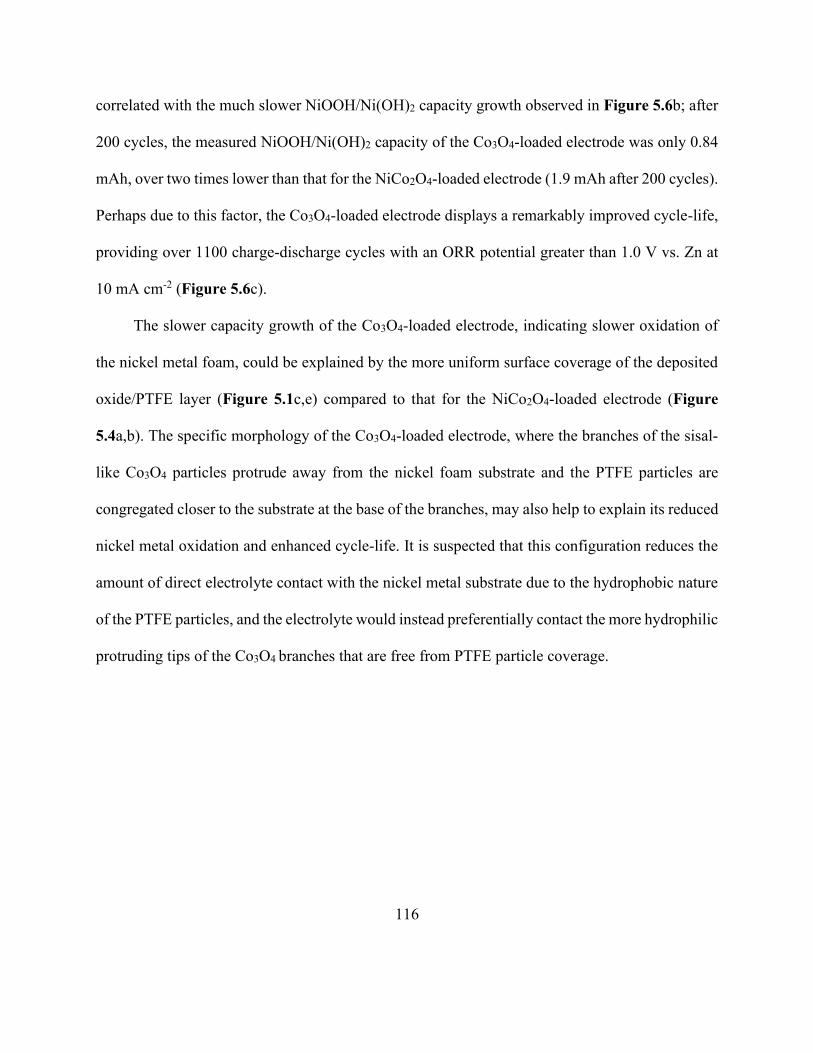
Figure 5.8. Initial ORR potential vs. Zn and cycle-life of thin nickel foam-based air electrodes at
20 mA cm-2 with the following three preparation factors: pre-heat/no pre-heat, calcination
temperature/time, duration of heat-treatment after PTFE soaking. ............................................ 121
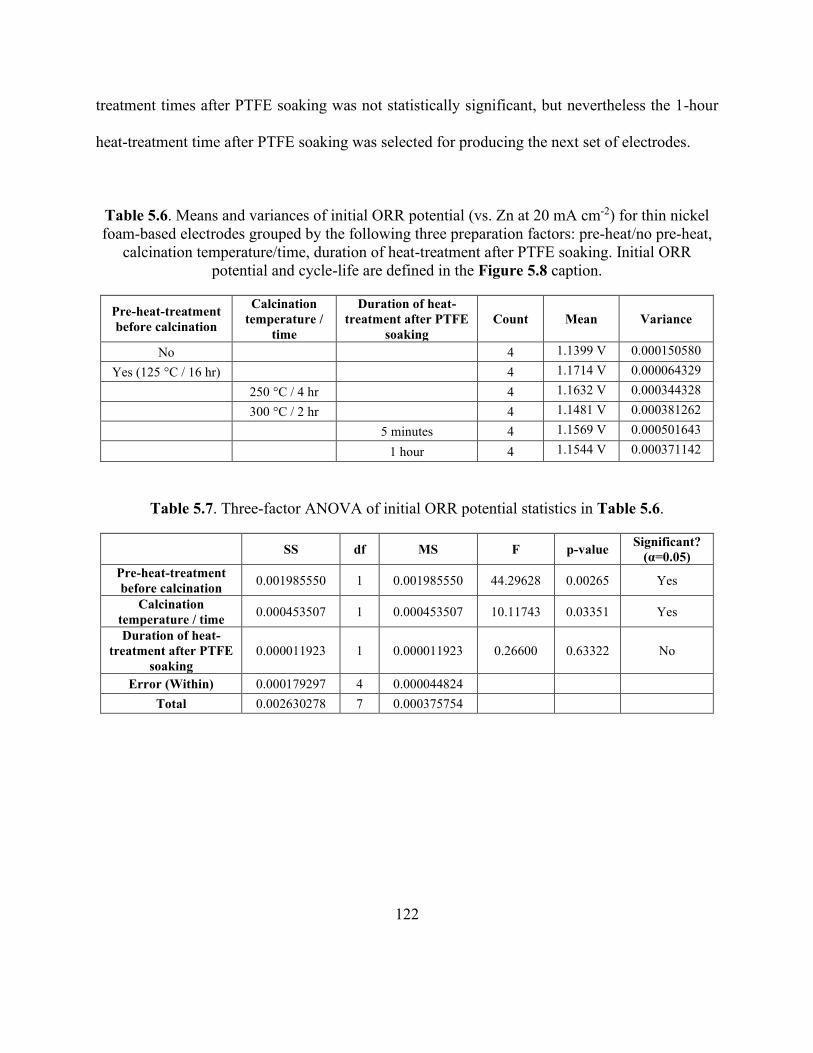
Figure 5.9. Initial ORR potential vs. Zn and cycle-life of thin nickel foam-based air electrodes at
20 mA cm-2 with the following two preparation factors: Co(NO3)2 concentration of precursor
mixture for electrode dipping and dip/pre-heat-treat/calcine sequence. .................................... 124
xvii
List of Tables
Table 3.1. Strategies for improving Zn electrode performance. .................................................. 46
Table 3.2. Performance metrics of selected Zn electrodes disclosed in the literature. ................ 47
Table 4.1. Galvanostatic Cycling Procedure for Nickel-Based Gas Diffusion Electrode. ........... 70
Table 4.2. Galvanostatic Cycling and EIS Procedure for Nickel-Based Gas Diffusion Electrode.
....................................................................................................................................................... 72
Table 4.3. Cyclic Potentiodynamic Polarization Procedure for the Nickel-Based Gas Diffusion
Electrode (GDE) and Thin-Layer Electrode (TLE). ..................................................................... 73
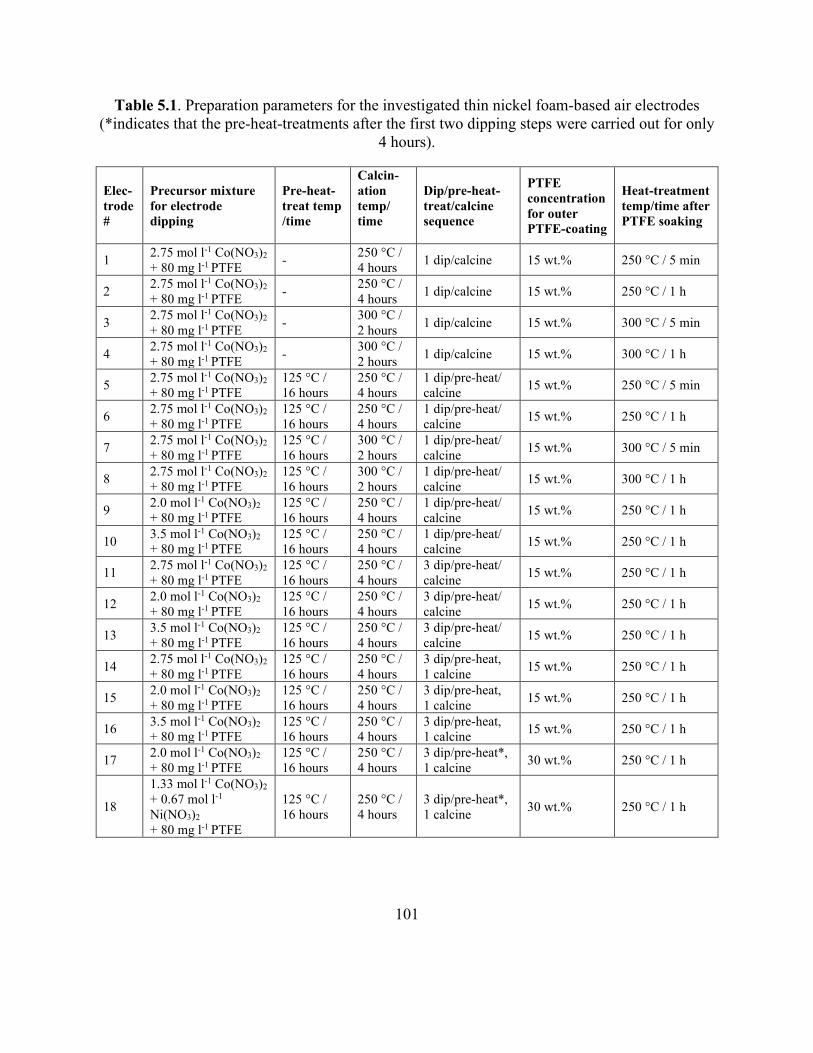
Table 5.1. Preparation parameters for the investigated thin nickel foam-based air electrodes. . 101
Table 5.2. Galvanostatic cycling procedure at 10 mA cm-2 for thin nickel foam-based electrode.
..................................................................................................................................................... 102
Table 5.3. Galvanostatic cycling procedure at 20 mA cm-2 for thin nickel foam-based electrode.
..................................................................................................................................................... 103
Table 5.4. Galvanostatic cycling procedure at 50 mA cm-2 for thin nickel foam-based electrode.
..................................................................................................................................................... 103
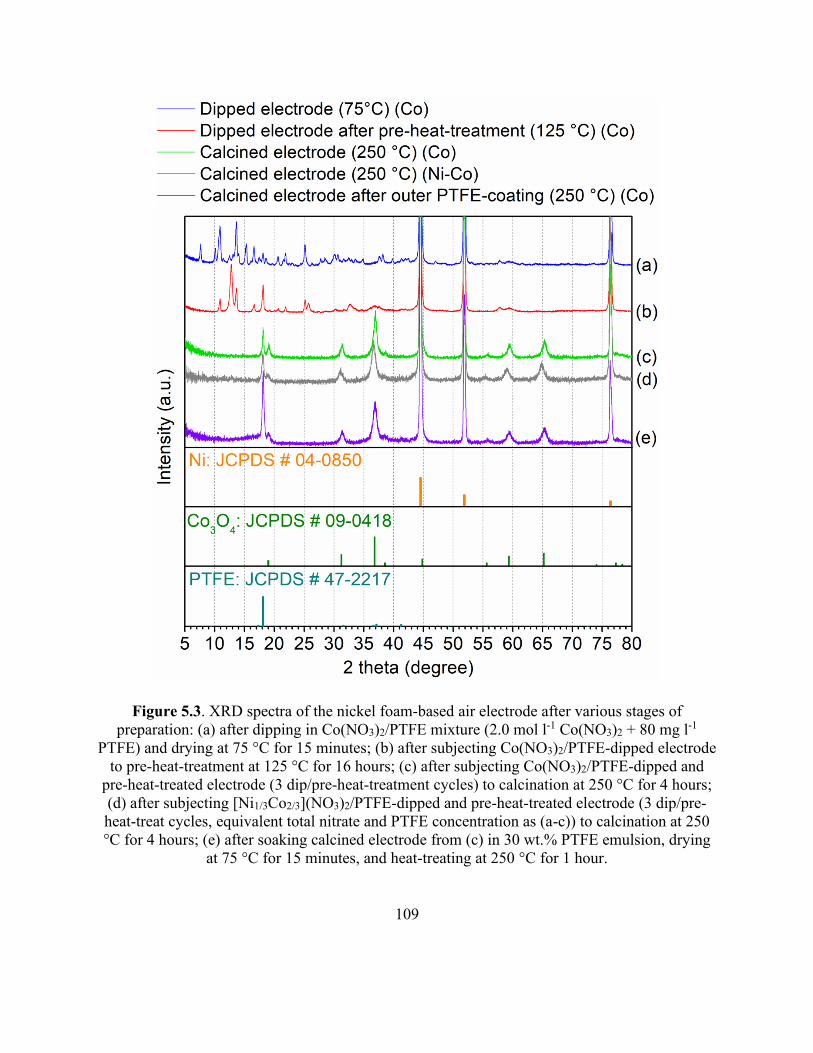
Table 5.5. Basic physical properties of the thin nickel foam-based air electrode compared to the
thick nickel-based air electrode from Chapter 4. ...................................................................... 112
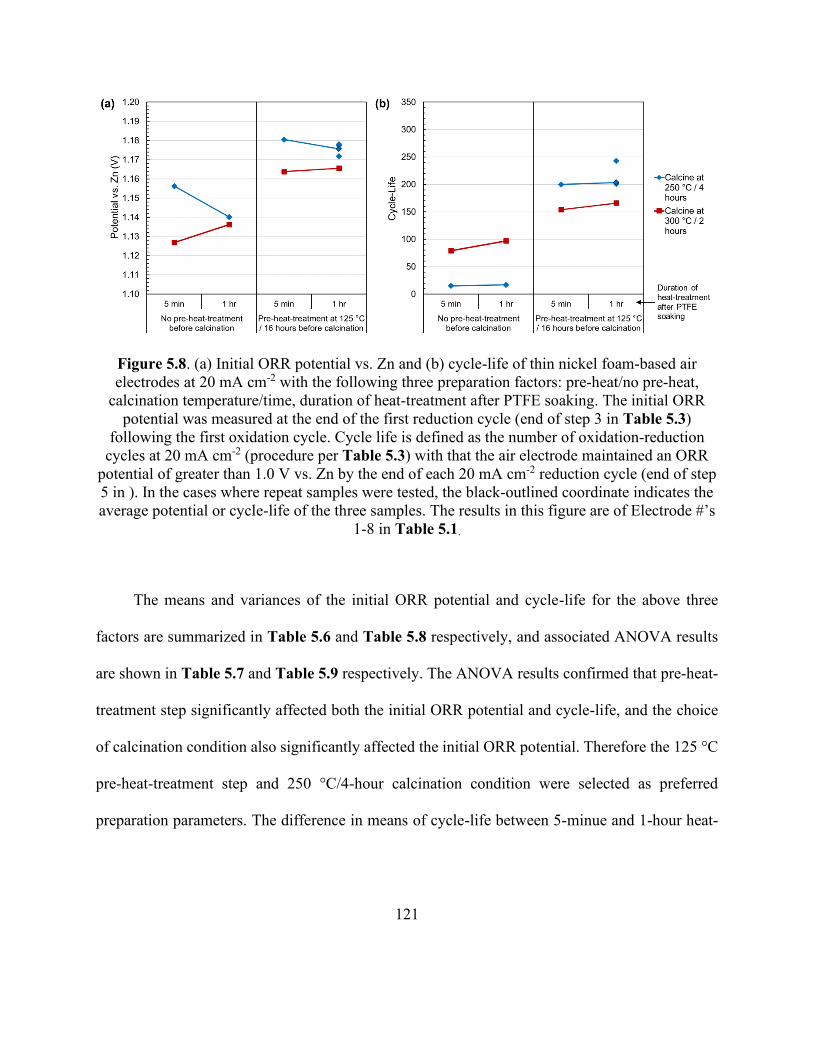
Table 5.6. Means and variances of initial ORR potential (vs. Zn at 20 mA cm-2) for thin nickel
foam-based electrodes grouped by the following three preparation factors: pre-heat/no pre-heat,
calcination temperature/time, duration of heat-treatment after PTFE soaking. ......................... 122
xviii
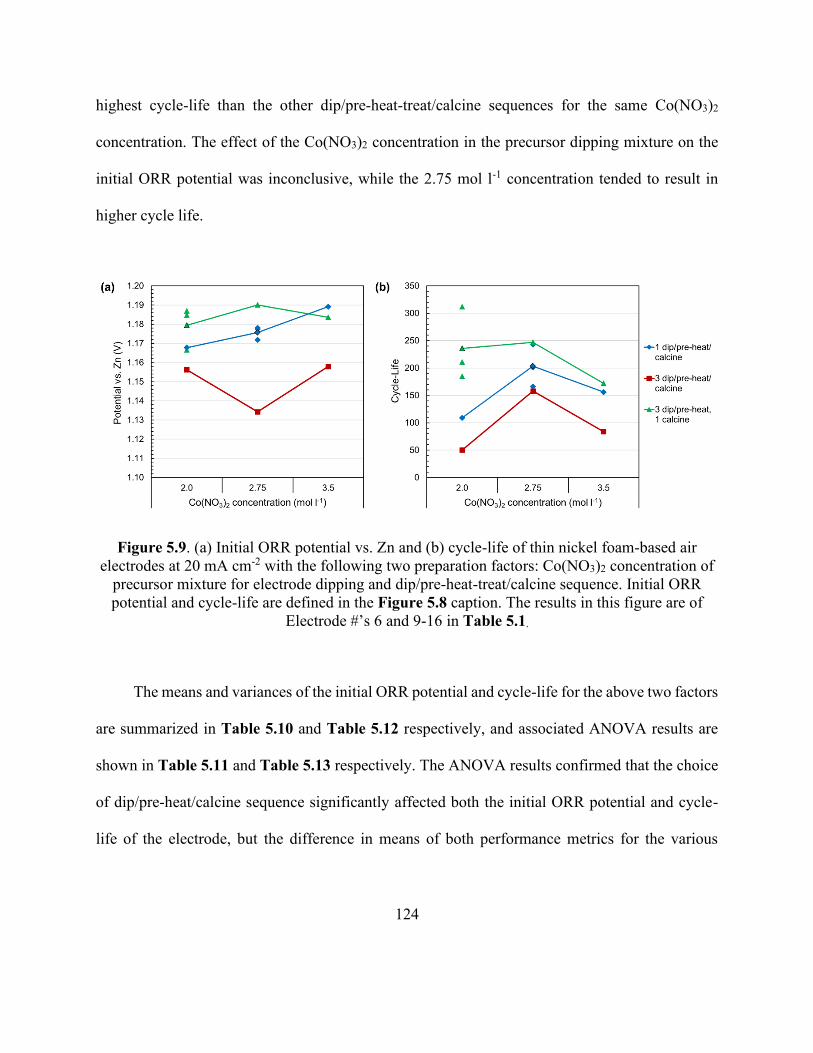
Table 5.7. Three-factor ANOVA of initial ORR potential statistics in Table 5.6. .................... 122
Table 5.8. Means and variances of cycle-life (at 20 mA cm-2) for thin nickel foam-based electrodes
grouped by the following three preparation factors: pre-heat/no pre-heat, calcination
temperature/time, duration of heat-treatment after PTFE soaking. ............................................ 123
Table 5.9. Three-factor ANOVA of cycle-life statistics in Table 5.8. ...................................... 123
Table 5.10. Means and variances of initial ORR potential (vs. Zn at 20 mA cm-2) for thin nickel
foam-based electrodes grouped by the following two preparation factors: Co(NO3)2 concentration
of precursor mixture for electrode dipping and dip/pre-heat-treat/calcine sequence. ................ 125
Table 5.11. Two-factor ANOVA of initial ORR potential statistics in Table 5.10. .................. 125
Table 5.12. Means and variances of cycle-life (at 20 mA cm-2) for thin nickel foam-based
electrodes grouped by the following two preparation factors: Co(NO3)2 concentration of precursor
mixture for electrode dipping and dip/pre-heat-treat/calcine sequence. ..................................... 126
Table 5.13. Two-factor ANOVA of cycle-life statistics in Table 5.12. .................................... 126
Table 5.14. Means and variances of initial ORR potential (vs. Zn at 20 mA cm-2) for thin nickel
foam-based electrodes prepared using 15 wt.% and 30 wt.% PTFE emulsions for outer PTFE-
coating. ....................................................................................................................................... 127
Table 5.15. Two-sample two-tail t-test assuming unequal variance of initial ORR potential
statistics in Table 5.14. ............................................................................................................... 127
Table 5.16. Means and variances of cycle-life (at 20 mA cm-2) for thin nickel foam-based
electrodes prepared using 15 wt.% and 30 wt.% PTFE emulsions for outer PTFE-coating. ..... 127
xix
Table 5.17. Two-sample two-tail t-test assuming unequal variance of cycle-life statistics in Table
5.16.............................................................................................................................................. 128
Table 5.18. Nominal voltage and air electrode, separator and electrolyte properties used for
Equations 5.1-5.5. ...................................................................................................................... 129
Table 5.19. Zinc electrode properties (from Table 3.2) and calculation of specific energy and
energy density of rechargeable zinc-air batteries containing each zinc electrode paired with a thin
nickel foam-based air electrode in an energy-dense configuration. ........................................... 131
xx
List of Abbreviations
AFC – Alkaline fuel cell
AL – Active layer
ANOVA – Analysis of variance
CE – Counter Electrode
EV – Electric vehicle
FCEV – Fuel cell electric vehicle
GDL – Gas diffusion layer
ICEV – Internal combustion engine vehicle
OER – Oxygen evolution reaction
ORR – Oxygen reduction reaction
PTFE - Polytetrafluoroethylene
RE – Reference electrode
SEM – Scanning electron microscopy
WE – Working electrode
XPS – X-ray photoelectron spectroscopy
XRD – X-ray diffraction
1
Chapter 1: Introduction
1.1 Motivation
Increasing energy demand in combination with volatile energy prices and climate change
awareness has accelerated the transition from fossil fuels to renewable energy. However, even with
the levelized energy cost for renewable energy sources approaching or headed below that of fossil
fuels, their intermittent nature remains a challenge to widespread adoption in the global energy
mix.[1,2] With this in mind, the task of developing new energy storage systems is more urgent than
ever. Batteries, which operate by storing and converting chemical energy into electrical energy,
are a well-known solution. One of their biggest advantages over traditional forms of energy storage
is the ability to be scaled down to small sizes, which has made them indispensable for portable
electronic devices.
Electric vehicles (EVs), which are expected to replace internal combustion engine vehicles
(ICEVs) in the coming years, are another industry where batteries have the potential to be the
dominant form of energy storage. Most EVs today use lithium (Li)-ion batteries, which have
dominated the rechargeable battery market since their advent in the late 1990s. The main
disadvantages of Li-ion batteries are their high cost and concerns regarding both their safety and
the supply of Li and cobalt (Co) (the latter of which is most commonly used in the positive
electrode). Their energy density is also limited by the fundamental capacity of the electrode
materials.[3,4] As a result, some believe that widespread consumer adoption of EVs could still be
decades away due to the issues of range anxiety and high upfront cost.[5–7]
2
Metal-air batteries display considerably high energy densities, because oxygen (O2) is used
as the reactant at the positive electrode and is stored outside of the battery until it is discharged.
Primary and secondary metal-air batteries with metals such as Li, potassium (K), sodium (Na),
magnesium (Mg), aluminum (Al), zinc (Zn) and iron (Fe) have attracted much attention.[8–11] The
theoretical specific energies (i.e. gravimetric energy densities), volumetric energy densities and
nominal cell voltages of various metal anodes in metal-air batteries are shown in Figure 1.1. For
secondary metal-air batteries, Li metal has received the most attention in academia since it has the
highest theoretical specific energy (5928 Wh kg-1) and a high cell voltage (nominally 2.96 V).
However, Li in the metallic form is plagued by its inherent instability when exposed to air and
aqueous electrolytes.[12] Mg and Al-air batteries are both compatible with aqueous electrolytes and
have energy densities comparable to Li-air; however, their low reduction potentials typically lead
to rapid self-discharge and poor coulombic charging efficiency.[8] Zn and Fe are more stable and
can be charged more efficiently in aqueous electrolytes; out of these two, Zn is more promising
due to its greater energy and cell voltage within an aqueous metal-air battery. Zn metal within a
metal-air battery has a high volumetric energy density (6136 Wh L-1) comparable to that of Li-air;
this is particularly desirable for EVs due to the limited volume for mounting the batteries.[13]
Moreover, the inherent safety of Zn means that Zn-air batteries can be employed with relatively
little protective components and placed in the front hood of an automobile, where provision for air
access is already well established in today’s vehicles.
3
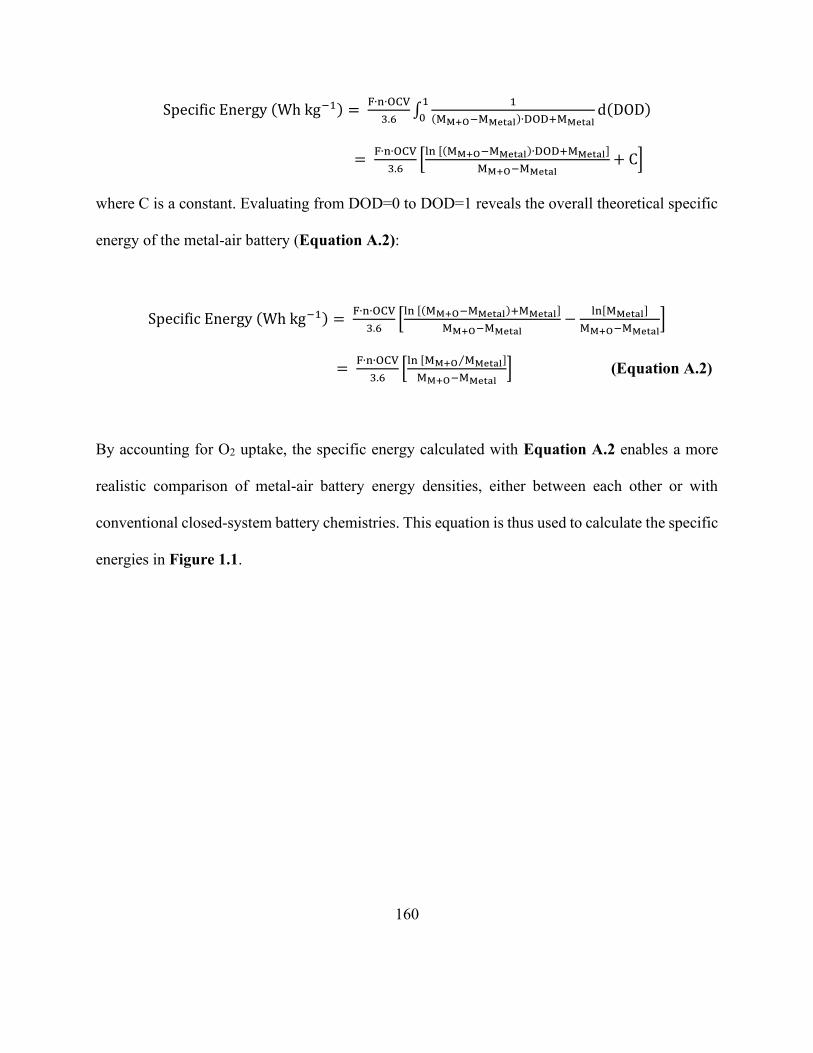
Figure 1.1. Theoretical specific energies, volumetric energy densities and nominal cell voltages
for various metal anodes in aqueous and non-aqueous metal-air batteries. Specific energy values
account for O2 uptake in the battery by numeric integration between the fully charged and fully
discharged states. Volumetric energy densities were calculated using the density of the anode in
the fully discharged state. (Refer to the Appendix for calculations and further explanations.)
Due to its low cost, high capacity and safe nature, zinc is the most common anode material
in primary metal-air batteries, which are often better known as disposable hearing-aid batteries.
Rechargeable Zn-air batteries for EVs were heavily investigated by the industry between circa
1975-2000,[14–27] but the rise of lithium-ion batteries likely caused a pause in these efforts until
around the start of this decade. EOS Energy Storage, NantEnergy (formerly Fluidic Energy) and
ZincNyx have recently introduced flowing electrolyte-based Zn-air systems which claim to offer
4
lower costs than lithium-ion batteries due to the use of more inexpensive materials and less need
for safety design considerations.[28–30] However, no electrically rechargeable zinc-air batteries with
a static electrolyte, which are most appropriate for EV applications due to their higher energy
density, have yet reached the market.
Despite their compelling cost and energy density advantages, electrically rechargeable Zn-
air batteries are unlikely to fully replace Li-ion batteries in EVs within the foreseeable future. This
is because of their relatively low energy efficiency (70% or less) and limited cycle life (hundreds
of full charge-discharge cycles at most).[31] However, Zn-air batteries have recently been proposed
as a range-extender in EVs containing both Li-ion and Zn-air battery packs.[32,33] In this concept,
the Li-ion battery is designed to provide enough capacity for a relatively short driving distance
(for example: 100 km, which a typical U.S. driver only surpasses approximately 15 days per
year[34]). The high-capacity Zn-air battery pack in this concept is only activated when the Li-ion
battery’s state of charge falls below a specified value on long-range vehicle trips. This dual-battery
operation thus takes advantage of the high cycle life and energy efficiency of a relatively low-
capacity Li-ion battery, while also benefitting from the high energy density and cost-effectiveness
of a high-capacity Zn-air battery. An EV with a dual-battery pack as such could offer an enticing
combination of a relatively low price and a high driving range, which is not currently available in
the market. The end-goal of this research thus lies in contribution to the development of an
electrically rechargeable Zn-air battery suitable for use in EV applications.
5
1.2 Thesis Objectives and Structure
The objectives of this thesis are to (i) evaluate the specific opportunities and scientific
challenges for zinc-air batteries to improve the performance of electric vehicles, (ii) contribute to
the understanding of air electrode design issues for this application, and (iii) develop and
demonstrate a new air electrode design that closes the technological gap needed to achieve a
durable and energy-dense electrically rechargeable battery. Chapter 2 places zinc-air batteries in
the context of other commercial and emerging rechargeable batteries and hydrogen fuel cells, thus
highlighting their specific strengths and most likely technological role in enabling new electric
vehicle markets. Chapter 3 provides a detailed overview of the scientific mechanisms and issues
associated with rechargeable zinc-air batteries, with a specific focus on the material research
directions needed to obtain durable and energy-dense cell designs. Chapter 4 aims to close an
identified research gap by investigating the performance and uncovering the failure mechanism of
corrosion-resistant nickel-based air electrodes for rechargeable zinc-air batteries. Next, Chapter
5 details a new thin nickel foam-based air electrode design which mitigates and withstands the
nickel oxidation issue identified in the previous chapter, and also can more easily enable a high-
energy density zinc-air battery in comparison to previously reported nickel-based electrode
designs. Finally, Chapter 6 summarizes the major findings from each chapter and offers some
future research suggestions which should aid in the further development of energy-dense
rechargeable zinc-air batteries.
6
Chapter 2: Evaluation of Batteries and Fuel Cells for
Emerging Electric Vehicle Markets
2.1 Introduction
Although first introduced as early as the 1800s,[35] electric vehicles (EVs) have only begun
to experience significant adoption since the start of the present decade. Global EV sales have
escalated from less than 10,000 in 2010 to 774,000 in 2016, surpassing a total of 2 million
cumulative sales.[36] Vehicle electrification is now seen as the major decarbonization pathway for
nearly all road-based transportation.[37] Worsening urban air quality has also led several countries
to announce intentions to ban sales of internal combustion engine vehicles (ICEVs),[38] which will
need to be replaced by EVs.
The growing success of EVs can be attributed, from a technological perspective, to
advancements in electrochemical energy storage technology. The specific energy of lithium-ion
(Li-ion) batteries, which increased from approximately 90 Wh kg-1cell in the 1990’s to over 250
Wh kg-1cell today,[39,40] has allowed full-size automobiles to travel sufficient distances for typical
driving patterns.[41] Meanwhile, the cost of Li-ion battery packs has decreased from over 1,000
US$ kWh-1 to approximately 250 US$ kWh-1,[39,42–45] allowing EV prices to fall to a price that
early adopters are willing to pay.
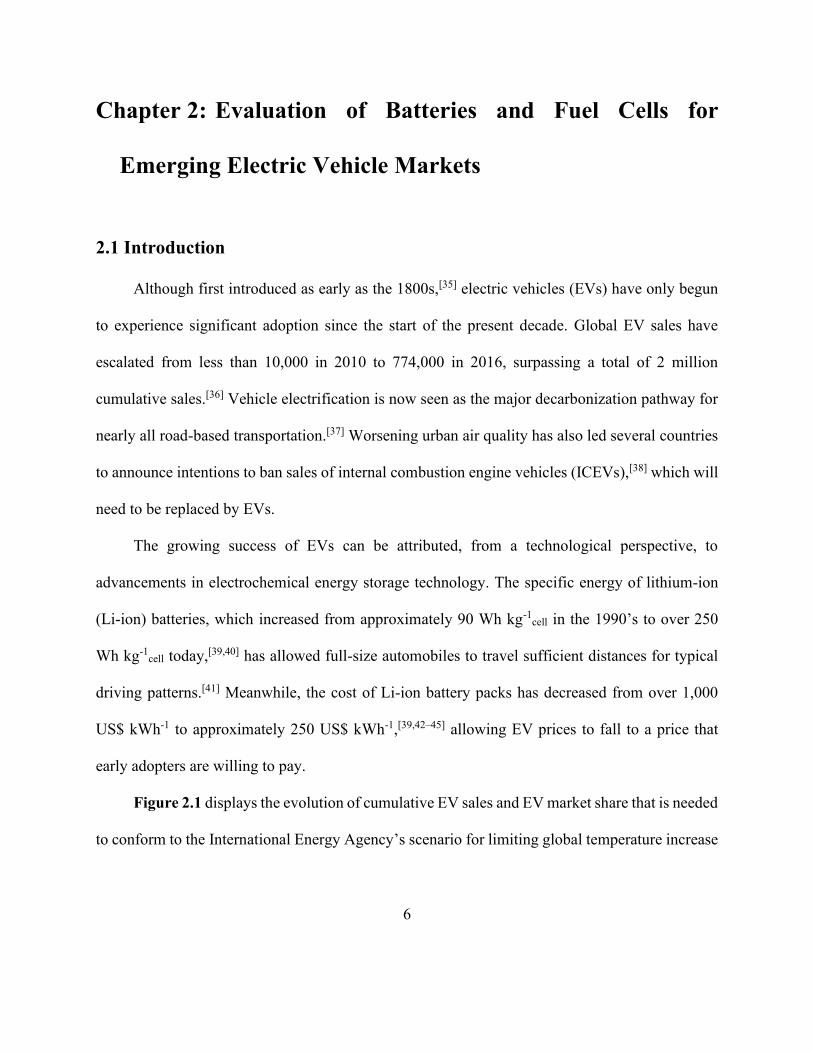
Figure 2.1 displays the evolution of cumulative EV sales and EV market share that is needed
to conform to the International Energy Agency’s scenario for limiting global temperature increase
7
to 1.75°C.[37] Referred to as the Beyond 2 Degrees Scenario (B2DS), this pathway calls for
cumulative EV sales of 1.8 billion and an EV market share of 86% by 2060. The inset within
Figure 2.1, displaying cumulative vehicle sales of ~2 million and a market share of 0.2% in 2016,
demonstrates the extremely early stage of current global EV adoption and the large amount of
future adoption that is needed. EV adoption to date has been heavily dictated by government policy
instruments, such as financial incentives, sales mandates and free vehicle charging.[46,47] Although
these policies are likely to spur further adoption, it could become financially unsustainable or
undesirable to scale them up to the level needed to facilitate the market share prescribed in Figure
2.1. Moreover, it is not certain that EVs powered by Li-ion batteries will be suitable for every
vehicle market due to inherent limits in their energy storage capacity, safety and achievable cost.
Alternative technologies which can power EV drivetrains are therefore an important focus.
In this chapter, the potential of batteries and hydrogen fuel cells for improving the
performance and reducing the cost of EVs is evaluated. First, three automotive markets which have
not seen significant penetration by Li-ion powered EVs are outlined, and the energy characteristics
which require improvement for EVs to succeed in these markets are discussed. Then, the properties
of five battery types which are commonly discussed as candidates to power new EVs are compared
and evaluated. Finally, brief status reviews of each battery as well as hydrogen fuel cells are
provided and the potentials of each technology in fulfilling requirements for emerging EV markets
are discussed.
8
Figure 2.1. Evolution of cumulative EV sales and EV market share prescribed in the
International Energy Agency’s Beyond 2 Degrees Scenario. Cumulative EV sales up to 2016[36]
are shown in the inset. Battery, plug-in hybrid and hydrogen fuel cell EVs are all included in
these data. The Scenario data is from ref. [37].
2.2 Energy Storage Barriers in Emerging Electric Vehicle Markets
2.2.1 Long-Range Transport
Inadequate driving range, or so-called “range anxiety”, is frequently reported as a key
technological barrier preventing consumers from purchasing EVs.[48,49] Longer EV ranges are
particularly desired in the United States,[50] which may be attributed to longer potential travel
distances and less reliance on public transit than other developed regions.[51] Over one half (54%)
of U.S. consumers in a 2016 survey required a range of at least 175 miles (282 km) to consider
purchasing an EV, while over one quarter (29%) required a range of 375 miles (604 km).[48] When
9
considering an EV that could reduce fuel costs by one-third, 52% of respondents were unwilling
to spend more than 5,000 US$ above a gasoline-powered vehicle, while 29% would not spend
above a 1,000 US$ premium.
In Figure 2.2, the driving ranges for EVs currently available in the U.S. market are
compared to their price premium relative to average vehicle prices in the same size segment.
Notably, each EV is at least $5,000 US$ more expensive than the average vehicle price in its
respective vehicle size class. While other factors such as low manufacturing volumes and extra
vehicle features may contribute to high prices, the positive correlation between EV range and price
premium indicates the significant cost contribution of the batteries. A range-dependent
willingness-to-pay model for U.S. consumers[50] was used to expand the aforementioned consumer
survey results into boundaries of requirement, where 52-54% of U.S. consumers require an EV
with a price premium and range below the upper requirement boundary, while 29% of U.S
consumers require an EV with a price premium and range below the lower requirement boundary.
This figure shows that without government incentives, none of the currently available EVs would
satisfy the requirements of over 50% of U.S. consumers.
10
Figure 2.2. 2017 model EV ranges and price premiums. Price premiums are defined relative to
average transaction price for vehicle size segment (including ICEVs and excluding luxury
vehicles). Selected 2017 model EVs are also re-plotted in the green area with their price adjusted
for a battery cost of 70 US$ kWh-1 (initial battery cost assumed to be 250 US$ kWh-1). The ‘+’
and ‘×’ coordinates represent the range and price requirements for 52-54% and 29% of U.S.
consumers, respectively.[48] These data points are expanded into requirement boundaries using a
range-dependent willingness-to-pay model for U.S. consumers.[50] Note that the price premiums
of luxury-class EVs were not measured relative to other luxury-class vehicles; this was chosen so
that each vehicle price premium could be compared to the price requirements of typical
consumers for whom cost is a primary concern. Further vehicle data provided in Supplementary
Table 1.
Recent forecasts predict lithium-ion battery pack costs will fall to near 70 US$ kWh-1 by
2030 or 2040 as manufacturing efficiency is further improved.[43,52] If 2017 EV prices are adjusted
to reflect this value, three models (Chevrolet Bolt, Hyundai Ioniq Electric and Tesla Model 3)
appear to pass the 50% U.S. consumer requirement threshold (Figure 2.2). However, EVs with
these adjusted prices would remain far short of meeting the requisites of nearly 30% U.S.
consumers, and likely many other consumers in highly automobile-dependent countries. Even if
11
energy storage costs are removed from the vehicle prices, none of the current EV models would
provide a driving range that 30% of U.S. consumers would be willing to pay for. Therefore,
substantially improving EV ranges without increasing cost appears to be the only way to satisfy
the long-range transportation market. This requires reducing vehicle weight by increasing the
specific energy (Wh kg-1) stored in the vehicle. However, with Li-ion batteries, substantially
increasing the specific energy likely requires metallic lithium anodes, increased cell voltages or
reduced safety components, all of which may involve an unacceptable trade-off for safety.[53–55]
Solid-state Li-ion batteries are one of the most promising pathways for safely incorporating lithium
metal and higher voltage materials; however, reported cells to date have either unacceptably low
areal capacities (less than 1 mAh cm-2, which would translate to lower specific energy than state-
of-the-art Li-ion batteries[56]) or unacceptably low cycle life (20 cycles or less).[57] Even a highly
optimized Li-ion cell with a lithium metal anode may not practically surpass 350 Wh L-1cell.
[56]
Consequently, alternative battery chemistries and energy storage technologies with higher specific
energy, lower cost and improved safety are needed to enable electrification of the long-range
transportation market.
2.2.2 Low-Cost Transport
The cost of EVs, as opposed to their range, is likely the primary concern for a large,
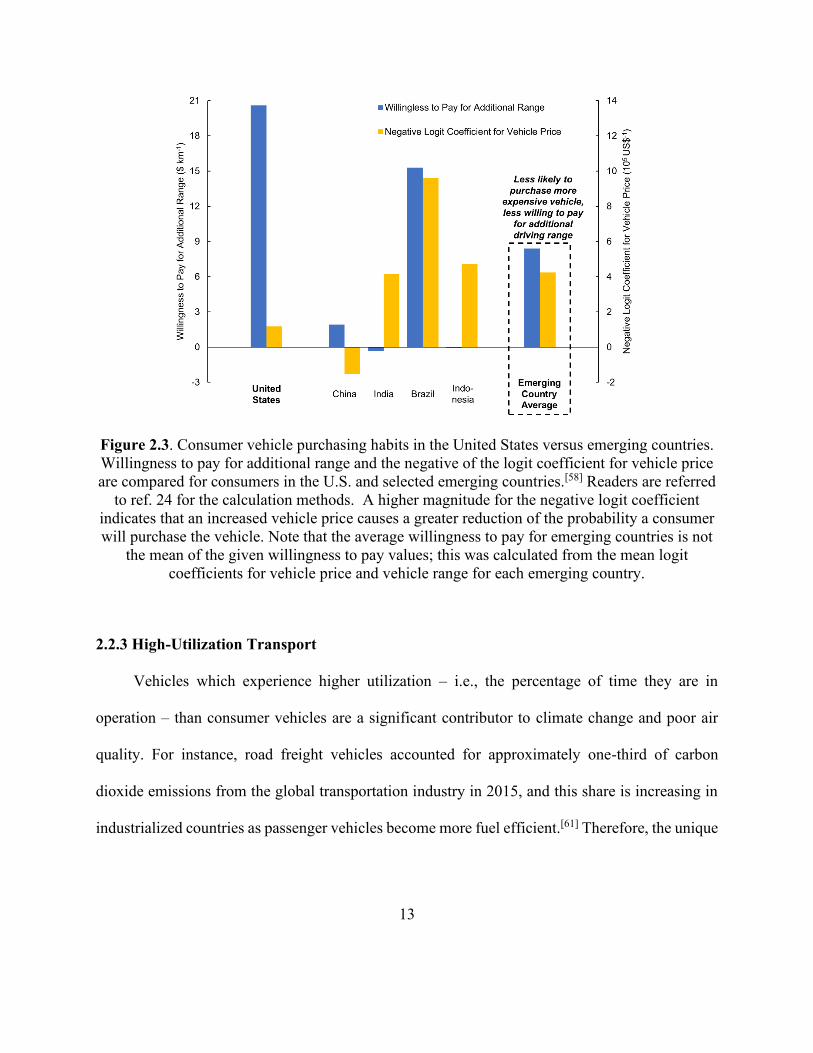
increasing percentage of future vehicle owners. Figure 2.3 displays results of a discrete choice
model fitted to vehicle registration data (for both EVs and conventional vehicles) from a selection
of countries.[58] U.S. consumers were willing to pay an additional 21 US$ per one additional
kilometre of range (21 US$ km-1), while consumers in emerging countries (China, India, Brazil
12
and Indonesia) were only willing to pay an average of 8.4 US$ km-1. Figure 2.3 also displays the
negative logit coefficient for vehicle price fitted to each country, which measures the degree to
which a price increase reduces the probability a consumer will purchase a vehicle.[58,59] The
negative coefficient for emerging countries was, on average, significantly higher than that of the
U.S. China was the one exception, with a negative value indicating that a higher price surprisingly
increased the probability of a vehicle purchase. Nevertheless, high Chinese sales figures for
cheaper and smaller low speed EVs, two-wheelers and three-wheelers versus those for
conventional EVs (over 200 million vs. 0.6 million in total as of 2016[47]) indicate the high market
desire for low-cost transportation in China alongside India, Brazil and Indonesia.
EVs available in emerging markets such as China have a similar price premium to the
developed countries.[60] The low-cost transportation market, which is expected to grow quickly as
emerging countries continue to industrialize, is thus underserved by current Li-ion powered EVs.
If the battery energy of the compact and subcompact cars in Figure 2.2 are plotted against vehicle
ranges, a slope of 0.19 kWh km-1 (representing energy consumption per additional kilometre of
range) is obtained. The average willingness to pay for emerging countries (8.4 $ km-1) is divided
by 0.19 kWh km-1 to obtain an energy storage cost target of approximately 45 US$ kWh-1.
Development of an electrochemical storage technology costing below 45 US$ kWh-1 is therefore
a worthwhile goal for enabling electrified transportation in emerging markets. Alternatively,
technologies with a higher specific energy and similar cost to Li-ion batteries can also help this
market by reducing the energy consumption value used in the above calculation.
13
Figure 2.3. Consumer vehicle purchasing habits in the United States versus emerging countries.
Willingness to pay for additional range and the negative of the logit coefficient for vehicle price
are compared for consumers in the U.S. and selected emerging countries.[58] Readers are referred
to ref. 24 for the calculation methods. A higher magnitude for the negative logit coefficient
indicates that an increased vehicle price causes a greater reduction of the probability a consumer
will purchase the vehicle. Note that the average willingness to pay for emerging countries is not
the mean of the given willingness to pay values; this was calculated from the mean logit
coefficients for vehicle price and vehicle range for each emerging country.
2.2.3 High-Utilization Transport
Vehicles which experience higher utilization – i.e., the percentage of time they are in
operation – than consumer vehicles are a significant contributor to climate change and poor air
quality. For instance, road freight vehicles accounted for approximately one-third of carbon
dioxide emissions from the global transportation industry in 2015, and this share is increasing in
industrialized countries as passenger vehicles become more fuel efficient.[61] Therefore, the unique
14
challenges of transitioning to high-utilization EVs for public transportation and goods
transportation is a crucial topic to address.
High utilization has important implications for the requirements of the energy storage
technology used in EVs. Firstly, the capability for fast charging (e.g. less than one hour) becomes
a more important consideration, since the time required to charge the vehicle should not disrupt
the operating schedule of the vehicle. Li-ion batteries are capable of fast charging, and electric
busses designed for quick partial recharging at bus stops have been deployed in several
countries;[62] however, this can cause enhanced cell degradation and safety issues.[63–65]
Simultaneous fast-charging of several EVs can also put excessive stress on the components of
power grids, thus necessitating expensive upgrades.[66,67] Therefore, an important aspect to
consider for high-utilization EVs is their ability to quickly recharge while smoothly integrating
with power grids.
Another key characteristic of many high-utilization vehicles such as trucks, busses and
trains is their larger weights relative to personal transport vehicles. Li-ion battery packs must be
proportionally scaled to larger sizes for these vehicles to travel an equivalent distance. However,
the lower surface-to-volume ratios of larger battery packs means that heat dissipation is slower,
often resulting in increased degradation and safety concerns and the need for complex cooling
techniques with expensive or toxic chemicals.[63] Therefore, energy storage and conversion
technologies which have higher specific energies and safer characteristics (e.g. non-flammable
materials) are particularly attractive for high-utilization EVs.
15
2.3 Evaluation of Electrochemical Technology Candidates
The previous section specified that increased specific energy or lower energy storage cost
(in comparison to Li-ion batteries) is essential for EVs with longer driving ranges and lower cost,
while fast-charging, power grid compatibility and safe operation are crucial for high-utilization
EVs. Of course, Li-ion batteries possess several other characteristics which other electrochemical
technologies need to compete with. Characteristics of the technologies regarded as candidates for
new EVs, in addition to those of Li-ion batteries, are compared in Figure 2.4. Qualitative safety
ratings were determined by the type of electrolyte (flammable or non-flammable), potential for
over-heating, and potential for toxic or corrosive material release. Fast-charging capability for each
battery was rated semi-quantitatively from its specific power, while each battery’s power grid
compatibility was rated semi-quantitatively from its energy efficiency. Hydrogen fuel cells have
the highest fast-charging and power grid compatibility due to the ability to quickly transfer
hydrogen gas without disrupting power grids.
16
Figure 2.4. Characteristics of rechargeable batteries and hydrogen fuel cells. The upper bounds
of the specific energy, energy density and specific power ranges represent estimates of what can
be practically achieved (refer to references in Supplementary Table 2 for details), while the
lower bounds indicate what has already been achieved (vice versa for energy storage cost). Cycle
life, calendar life, energy efficiency, self-discharge and operating temperature ranges represent
upper and lower values observed in commercial or prototype cells. Energy storage cost refers to
the cost of the battery pack or system, while specific energy, energy density and specific power
refer to cell-level values. Energy storage cost refers to the cost of the battery pack or system,
17
while specific energy, energy density and specific power refer to cell-level values. Literature
information was not sufficient to confidently specify upper and lower bounds/values for the
specific power, energy efficiency and self-discharge rate of Li-air batteries. For hydrogen fuel
cells, energy-related characteristics apply only to hydrogen within a typical hydrogen storage
tank (i.e. not including the fuel cell) and specific power applies only to the fuel cell (i.e. not
including hydrogen storage). Cycle life and self-discharge rates are not applicable to hydrogen
fuel cells, and thus are not included. Safety, fast-charging compatibility and power grid
compatibility are qualitative ratings between 0 (worst) and 10 (best). Separate safety ratings are
assigned to the solid-state versions of lithium-based batteries due to the replacement of
flammable, liquid electrolytes with solid, non-flammable electrolytes. Numeric values and
references for each characteristic are provided in Supplementary Table 2.
Note that the energy characteristics of hydrogen storage in Figure 2.4 (specific energy,
energy density and energy storage cost) should not be directly compared to those of the various
battery chemistries without accounting for the mass, volume and cost of a coupled fuel cell system.
Unlike batteries, the total energy of a hydrogen fuel cell combination (i.e. amount of stored
hydrogen) can be increased separately from the total power of the fuel cell. Due to this fundamental
difference, hydrogen fuel cells are not included in the analysis below; they are evaluated relative
to Li-ion batteries in a separate section.
Certain metrics for the batteries in Figure 2.4, namely specific energy, energy density and
energy storage cost, can be evaluated more practically by using them in approximating calculations
of vehicle range (RV), total vehicle cost (CV,T) and battery pack volume (VolB). Each of these are
a function of the battery pack energy (EB), and can be calculated from Equation 2.1,[68] Equation
2.2 and Equation 2.3 respectively:
𝑅𝑉 =𝐸𝐵
𝐸𝐶𝐸𝑉(𝑊𝑉+𝐸𝐵𝑘𝑤,𝐵
𝑆𝐸𝐵𝐶) (Equation 2.1)
18
𝐶𝑉,𝑇 = 𝐶𝑣 + 𝐶𝐵𝐸𝐵 (Equation 2.2)
𝑉𝑜𝑙𝐵 =𝐸𝐵×𝑘𝑣𝑜𝑙,𝐵
𝐸𝐷𝐵𝐶 (Equation 2.3)
where ECEV (Wh km-1 kg-1) is the energy consumption efficiency of the vehicle, WV and CV are
the vehicle weight and vehicle cost not including the battery pack, CB is the battery pack cost, SEBC
and EDBC are the specific energy and energy density of the battery cell, and kW,B and kVol,B are
factors for the battery pack weight and volume overheads, respectively. The overhead factors
assigned to each battery (Supplementary Table 2) reflect the level of safety equipment or air
management equipment (for metal-air batteries) needed to operate each battery.
Results for a mini vehicle (common in markets which demand low-cost vehicles), a midsize
vehicle (common in markets demanding long-range vehicles) and a semi-trailer truck (representing
the high-utilization market) are exhibited in Figure 2.5a,b, Figure 2.5c,d and Figure 2.5e,f
respectively. Vehicle cost as a function of driving range is plotted in Figure 2.5a,c,e until the
battery volume exceeds an assigned space limit within each vehicle. Here, the low energy densities
of lead-acid (Pb-acid) and nickel-metal hydride (Ni-MH) batteries are clearly recognized as a large
drawback. The potential for lithium-sulfur (Li-S), lithium-air (Li-air) and zinc-air (Zn-air) batteries
to enable long-range EVs at a significantly lower cost than Li-ion batteries is also apparent. The
cost of adding additional range (US$ km-1), which may be compared to investigations of
consumers’ willingness to pay for additional range,[50,58] is plotted against vehicle range in Figure
2.5b,d,f. Figure 2.5b shows that Li-S, Li-air and Zn-air batteries can bring the cost of additional
range of a mini vehicle substantially closer to the average willingness to pay value for emerging
countries identified in Figure 2.3.
19
Figure 2.5. Vehicle cost and cost of additional range as a function of driving range. Curves are
plotted for (a,b) mini vehicle (CV = 10,000 US$, WV = 650 kg, ECEV = 0.0985 Wh km-1 kg-1
(Supplementary Table 1)), (c,d) midsize vehicle (CV = 25,000 US$, WV = 1500 kg, ECEV =
0.0777 Wh km-1 kg-1 (Supplementary Table 1)) and (e,f) semi-trailer truck (CV = 100,000 US$,
WV = 24,000 kg, ECEV = 0.0445 Wh km-1 kg-1 [69]). Curves in a,c,e are calculated with
Equations 2.1 and 2.2, and are plotted until the battery volume (Equation 2.3) exceeds a chosen
maximum. Curves in b,d,f are plotted by calculating the respective tangents of curves from a,c,e.
Midpoint values of the specific energy, energy density, energy storage cost and battery system
overhead ranges (Figure 2.4, Supplementary Table 2) were used for each curve.
20
Figure 2.6 displays the approximate span of vehicle cost and range combinations which
could be achieved for a midsize vehicle using the upper and lower bounds of the energy and cost
characteristics of each battery in Figure 2.4. It can be seen here that Zn-air batteries have the
potential to enable the longest range EV, while Li-S batteries could enable the lowest cost EV.
However, this evaluation does not dictate whether each battery has sufficient power,
cycle/calendar life, efficiency, and self-discharge rate to function reliably in an EV. Therefore,
Figures 5 and 6 only demonstrate the basic potential of each battery chemistry to lower costs and
increase driving ranges. Details regarding the practicality of implementing these technologies in
consumer, commercial and public transportation applications are discussed below.
21
Figure 2.6. Sensitivity plots of midsize vehicle cost and range. Curves show sensitivity to
minimum specific energy, minimum energy density, maximum cost and maximum system
overheads (defined as the worst-case characteristics) and maximum specific energy, maximum
energy density, minimum cost and minimum system overheads (defined as the best-case
characteristics) for each battery. The area between the two curves shows the span of possible
costs and driving ranges that could be enabled by each battery.
22
2.3.1 Commercial Rechargeable Batteries
2.3.1.1 Lead-acid Batteries
Pb-acid batteries are currently the lowest-cost and most-used rechargeable batteries in the
world.[43,70] However, due to their low specific energy and energy density, they are only more cost-
effective than Li-ion batteries for low-range EVs (Figure 2.5). Also, their larger volume and lower
cycle life, specific power and energy efficiency tends to make them less preferred than Li-ion
batteries in newer low-cost and low-speed bikes and vehicles.[71] Nevertheless, Pb-acid batteries
have some advantages that make them attractive for assistive roles in vehicle electrification.
Besides their low cost, these include low-temperature operation (as low as -40 °C[72]), better
charging safety[73] and potentially very low self-discharge rates.[74]
Most work on Pb-acid batteries is thus now aimed at making them capable of regenerative
brake charging and motor assist in hybrid vehicles.[75,76] This requires batteries which can survive
up to hundreds of thousands of high-power “micro-cycles” at partial states of charge.[77] A major
problem when subjecting conventional Pb-acid batteries to high discharge rates is irreversible
growth of large, insulating lead sulphate crystals on the negative electrode, which subsequently
harms its ability to accept fast recharges.[76] Various carbon additives were discovered to mitigate
this problem by improving conductivity, promoting smaller sulphate crystal growth, and
introducing capacitive behaviour to buffer high charge and discharge rates.[75,78] These “Pb-
carbon” batteries have shown promise in low-cost hybrid EV concepts,[79] and with further power
improvements, could be attractive for fully electrified low-cost vehicles with dual energy sources.
23
2.3.1.2 Nickel-Metal Hydride Batteries
The Ni-MH battery, commercially introduced in 1989, is the most common nickel-based
battery and offers significantly better performance than Pb-acid batteries across most metrics.[80]
They were the default battery choice for hybrid EVs until very recently, and therefore the
technology is already well-optimized for regenerative brake charging and full-electric traction.[77]
However, the higher cost of nickel and hydride storage metals also makes them more expensive
than Pb-acid batteries; in fact, they are now more expensive than Li-ion batteries following the
latter’s rapid cost reduction.[43]
Since Li-ion batteries have higher specific energy, energy density and cycle life, while Pb-
acid batteries are cheaper, Ni-MH batteries do not appear to provide any distinct advantages for
emerging EV markets. However, the aqueous electrolyte and lower reactivity metals used in Ni-
MH batteries makes them inherently safer to operate, while their better low temperature
performance could make them useful for vehicle start-up in cold climates.[80] Their safer operation
also allows them to be placed in more impact-exposed areas of a vehicle, such as the front end,
which would be too dangerous for lithium-based batteries. Substitution of structural components
and energy absorption materials with Ni-MH batteries has been advocated as a creative method to
reduce vehicle weight, thus offering the potential for longer range EVs.[68]
2.3.2 Emerging Rechargeable Batteries
2.3.2.1 Lithium-sulfur Batteries
Li-S batteries have received elevated attention owing to the 4.5 times higher theoretical
lithium capacity and much lower cost of sulfur cathodes relative to typical Li-ion insertion
24
cathodes.[81] Unfortunately, sulfur cathodes have several challenging characteristics such as high
volume change upon cycling, low conductivity of the sulfur and lithium sulfide phases, and
relatively high solubility of sulfur species in common lithium battery electrolytes.[81,82] These
issues lead to low cycle life and high self-discharge rates, which are both problematic for EV
energy storage technologies. Li-S batteries must also incorporate a lithium metal anode to provide
an appreciable specific energy advantage over Li-ion batteries.[56] Lithium metal anodes have
several challenges including poor cycle life and fast-charging ability (due to lithium dendrite
formation and irreversible electrolyte consumption), high self-discharge (due to unwanted side
reactions) and increased safety concerns for both manufacturing and operation.[55,83,84]
To address the above difficulties, researchers have reported electrodes incorporating sulfur
intertwined with porous carbon or conductive polymer “containers”, which inhibit sulfur
dissolution while accommodating volume expansion, improving conductivity and allowing
reversible lithium ion migration during charging and discharging.[81,83,85] Regarding the lithium
metal anode, most strategies to reduce dendrite formation and mitigate side reactions involve
protecting the anode with a passivation layer, coating, separator or solid-state electrolyte.[84]
Developments such as these must result in higher cycle life and higher allowable currents without
sacrificing specific energy and energy density,[86] which has proven difficult as demonstration cells
in the literature thus far have not achieved more than 500 cycles at practical charge rates and
specific energies.[85]
The maximum practically achievable specific energy (600 Wh kg-1cell) and estimated
minimum cost (36 US$ kWh-1) for Li-S batteries would be a significant improvement over Li-ion
25
batteries, making them attractive for all three emerging EV markets discussed earlier. However,
unless their cycle life is substantially improved, Li-S batteries appear to be a poor choice for high-
utilization EVs. A consumer vehicle that is driven long distances occasionally, on the other hand,
could be practical because the battery would rarely be subjected to full discharge cycles. Very few
drivers travel long distances (greater than 200 km) necessary to cause deep discharges of
moderately sized Li-S batteries on a frequent basis;[41] thus, anxiety over battery degradation from
frequently driving long distances should be much less likely than conventional range anxiety (i.e.
inability to drive long distances). Therefore, Li-S batteries are a strong candidate to succeed Li-
ion batteries in consumer EVs, since they can lower costs and reduce range anxiety at a relatively
affordable cost (Figure 2.5).
2.3.2.2 Lithium-air Batteries
Li-air batteries offer a further improvement in specific energy and energy density above Li-
S batteries due to their use of atmospheric oxygen to produce power. However, their demonstrated
cycle life has thus far been much lower, with a maximum around only 100 cycles.[87,88] Improving
their cycle life has proven difficult due to several issues such as air electrode clogging from lithium
discharge products, catalyst degradation from high-voltage charging, lithium metal side-reactions
from atmospheric moisture and irreversible electrolyte decomposition.[89,90] In addition, while
reliable estimates of specific power and energy efficiency are not available for Li-air batteries,
these metrics are likely to be much poorer than the previously discussed batteries due to sluggish
oxygen kinetics at the air electrode.[91]
26
Moreover, the maximum energy density of Li-air batteries at an automotive system level
has been projected to be only 384 Wh L-1system after accounting for equipment to protect the battery
from atmospheric carbon dioxide and moisture.[92] This places a volumetric limit on the ability of
Li-air batteries to enable substantially longer driving ranges than Li-ion batteries (Figure 2.6). On
the other hand, their combined low cost and high specific energy are still attractive for long-range
and low-cost consumer EVs (Figure 2.5). Unlike Li-S batteries, however, Li-air batteries would
require a complimentary high-power battery for practical operation due to their likely poor specific
power.
2.3.2.3 Zinc-air Batteries
Zn-air batteries, despite having a lower specific energy relative to Li-air batteries, are more
likely to be used in future EVs due to their greater laboratory progress thus far (i.e. higher
demonstrated cycle life and current operability) and higher practically-achievable energy
density.[93] Rechargeable Zn-air batteries were identified as a promising candidate for vehicle
electrification in the decades prior to the emergence of Li-ion batteries.[94] Similarly to Li-air
batteries, their poor specific power and energy efficiency, as well as relatively poor cycle life
compared to lithium-ion batteries, will likely prevent them from being used as a primary energy
source for EVs; however, they could be promising when used in a dual-battery configuration. They
could be combined with high-power Pb-carbon batteries to produce a low-cost EV,[95] although
they would likely need a higher cycle life to provide a long vehicle lifetime. Alternatively, they
could be implemented as range-extenders for an EV primarily powered by Li-ion batteries, in order
to enable long-range EVs; this makes their short cycle life and low efficiency relatively
27
unimportant, assuming the driver only occasionally needs to travel long distances.[96] While dual-
battery concepts can significantly increase cost and complexity,[97] the inherent safety of Zn-air
batteries[25,98] also makes them well-suited for a dual-battery configuration because (similarly to
Ni-MH batteries) there are fewer constraints in their physical location within a vehicle.
2.3.3 Hydrogen Fuel Cells
Hydrogen is an energy carrier that can be produced from low-carbon sources and stored with
a high specific energy relative to most batteries (Figure 2.4). Therefore, hydrogen fuel cells have
been targeted for their potential to contribute to decarbonization in the transportation sector.[99,100]
The first mass-produced fuel cell electric vehicles (FCEVs), which use polymer electrolyte
membrane (PEM) fuel cells, were introduced in 2013-2014 by Hyundai, Toyota and Daimler. The
advantages of these vehicles relative to current battery electric vehicles (BEVs) include higher
driving ranges (over 500 km) and faster refuelling (3-5 minutes to re-fill the hydrogen storage
tank). However, cumulative FCEV deployments represent a small fraction of total EV sales
through 2016 (less than 10,000[101,102] or 0.5%), and they must overcome several challenges to
achieve significant market uptake.
FCEVs have higher purchase prices than conventional vehicles, and similarly to BEVs, this
is attributed to their electrochemical power supply. The hydrogen storage tank and fuel cell system
are the most expensive components due to the inclusion of expensive materials and equipment
such as platinum, carbon fibre, humidifiers and heat exchangers.[103–105] The cost of nearly all these
components will significantly decline with increased manufacturing volumes, with the main
exception being platinum group metal (PGM) catalysts due to their scarcity. To reach a similar
28
total PGM content to ICEVs, FCEVs must reduce PGM loadings to approximately one quarter of
their current state-of-the-art levels.[106] This highlights the importance of research efforts to
develop catalysts with reduced levels of PGMs and improved efficiency and durability.[107–109]
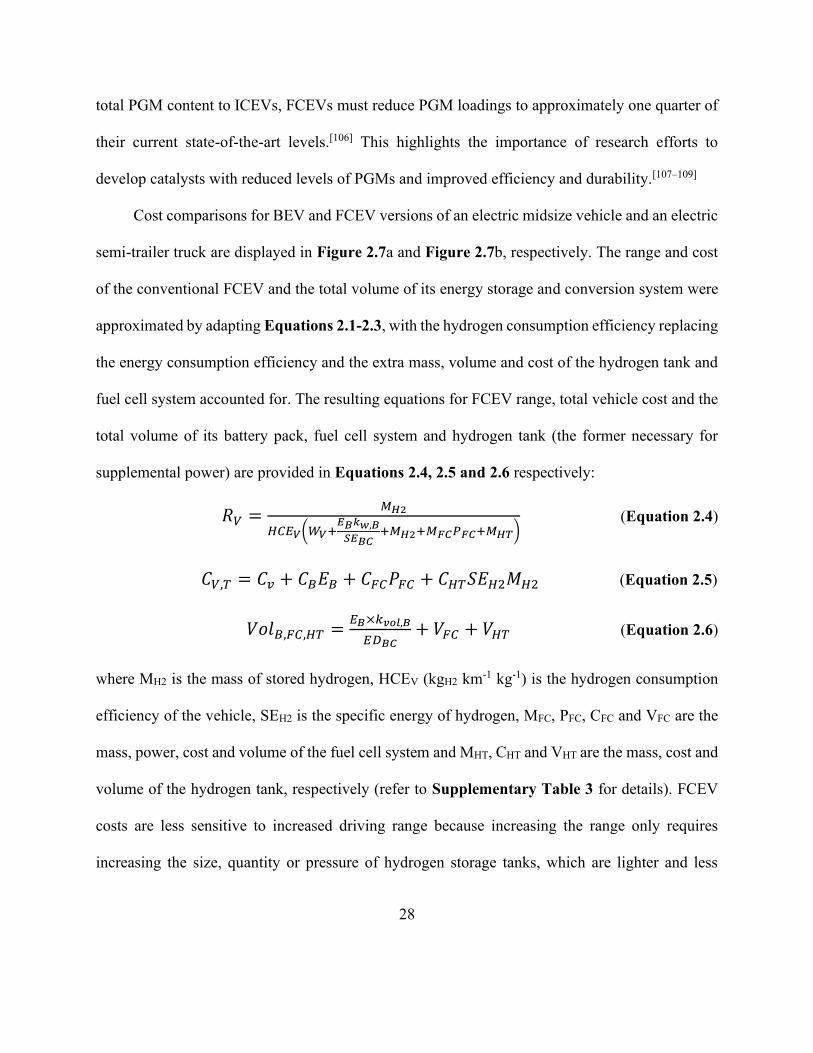
Cost comparisons for BEV and FCEV versions of an electric midsize vehicle and an electric
semi-trailer truck are displayed in Figure 2.7a and Figure 2.7b, respectively. The range and cost
of the conventional FCEV and the total volume of its energy storage and conversion system were
approximated by adapting Equations 2.1-2.3, with the hydrogen consumption efficiency replacing
the energy consumption efficiency and the extra mass, volume and cost of the hydrogen tank and
fuel cell system accounted for. The resulting equations for FCEV range, total vehicle cost and the
total volume of its battery pack, fuel cell system and hydrogen tank (the former necessary for
supplemental power) are provided in Equations 2.4, 2.5 and 2.6 respectively:
𝑅𝑉 =𝑀𝐻2
𝐻𝐶𝐸𝑉(𝑊𝑉+𝐸𝐵𝑘𝑤,𝐵
𝑆𝐸𝐵𝐶+𝑀𝐻2+𝑀𝐹𝐶𝑃𝐹𝐶+𝑀𝐻𝑇)
(Equation 2.4)
𝐶𝑉,𝑇 = 𝐶𝑣 + 𝐶𝐵𝐸𝐵 + 𝐶𝐹𝐶𝑃𝐹𝐶 + 𝐶𝐻𝑇𝑆𝐸𝐻2𝑀𝐻2 (Equation 2.5)
𝑉𝑜𝑙𝐵,𝐹𝐶,𝐻𝑇 =𝐸𝐵×𝑘𝑣𝑜𝑙,𝐵
𝐸𝐷𝐵𝐶+ 𝑉𝐹𝐶 + 𝑉𝐻𝑇 (Equation 2.6)
where MH2 is the mass of stored hydrogen, HCEV (kgH2 km-1 kg-1) is the hydrogen consumption
efficiency of the vehicle, SEH2 is the specific energy of hydrogen, MFC, PFC, CFC and VFC are the
mass, power, cost and volume of the fuel cell system and MHT, CHT and VHT are the mass, cost and
volume of the hydrogen tank, respectively (refer to Supplementary Table 3 for details). FCEV
costs are less sensitive to increased driving range because increasing the range only requires
increasing the size, quantity or pressure of hydrogen storage tanks, which are lighter and less
29
expensive than Li-ion battery packs on a per-kWh basis. However, the high present cost of fuel
cell systems makes current conventional FCEVs more expensive than BEVs for consumer vehicles
(Figure 2.7a). Previous estimates projected the equal-cost crossing point for consumer FCEVs and
BEVs to occur at lower driving ranges;[56,110] however, the steep decline of Li-ion battery costs in
recent years and their even lower long-term projected costs have significantly increased the equal-
cost point. Semi-trailer trucks, on the other hand, appear to be well suited to electrification by a
fuel cell system rather than Li-ion batteries at most practical driving ranges (Figure 2.7b). This is
particularly true when considering that the additional weight of the battery system (required to
achieve long driving ranges) reduces the total payload that the battery-powered semi-trailer truck
can haul.
30
Figure 2.7. Vehicle cost as a function of driving range for Li-ion battery and hydrogen fuel cell
EVs. Curves for BEVs and FCEVs plotted for (a) midsize vehicle and (b) semi-trailer truck.
Curves are calculated from Equations 2.4-2.7 using the variables in Supplementary Table 3.
Note that the differences between 2017 and 2040 only account for projected price reductions,
and do not account for specific energy improvements of Li-ion batteries nor specific power and
efficiency improvements of hydrogen fuel cells. Minimum values of specific energy and energy
density and maximum values for energy storage cost and overhead factors (Supplementary
Table 2) were used for the Li-ion batteries in each vehicle. The ‘×’ on each curve indicates the
point at which the total volume of the battery pack, hydrogen tank and fuel cell system surpasses
300 L (midsize vehicle) or 2,500 L (semi-trailer truck).
Some new FCEVs incorporate a larger Li-ion battery that provides (i) pure battery-powered
propulsion for short-range trips and (ii) greater power-assisting to the fuel cell, which allows for a
smaller fuel cell system.[111] The range of these plug-in hybrid FCEVs may be approximated with
Equation 2.7, which were adapted from a combination of Equations 2.1 and 2.4:
31
𝑅𝑉 =𝐸𝐵
𝐸𝐶𝐸𝑉(𝑊𝑉+𝐸𝐵𝑘𝑤,𝐵
𝑆𝐸𝐵𝐶+𝑀𝐻2+𝑀𝐹𝐶𝑃𝐹𝐶+𝑀𝐻𝑇)
+𝑀𝐻2
𝐻𝐶𝐸𝑉(𝑊𝑉+𝐸𝐵𝑘𝑤,𝐵
𝑆𝐸𝐵𝐶+𝑀𝐻2+𝑀𝐹𝐶𝑃𝐹𝐶+𝑀𝐻𝑇)
(Equation 2.7)
Plotting Equation 2.7 as a function of stored hydrogen mass (other parameter assumptions in
Supplementary Table 3) results in lower vehicle costs and significantly longer achievable ranges
due to the smaller size of the fuel cell system (Figure 2.7a). Using long-term projected costs and
800 km of range, a midsize plug-in hybrid FCEV could be 5,000 US$ less expensive than a midsize
Li-ion BEV and 6,000 US$ more expensive than an average midsize ICEV, making them more
attractive to a sizeable portion of U.S. consumers (Figure 2.2). Hybrid FCEV trucks enabling
ranges of nearly 2,000 km are also in development.[112]
A more significant barrier to FCEV adoption is the current lack of infrastructure for
hydrogen transportation and distribution.[100,113] The capital cost of a hydrogen refilling station
(including hydrogen delivery or on-site production) can range from 1 to 10 million US$,[114,115]
which is significantly larger than that for an EV fast-charging station (less than 0.2 million
US$[116]). Therefore, in the near-term, FCEVs and hydrogen infrastructure development are best
suited to the high-utilization commercial vehicle sector, where a small number of strategically
located hydrogen stations could service pre-planned high-utilization driving routes to justify their
high investment cost.[100] However, at large scales it may actually be more expensive to upgrade
the electrical grid to accommodate the charging demands of BEVs vs. installing a hydrogen
refuelling network.
32
Another consideration for significant FCEV adoption is their energy efficiency relative to
batteries. The entire “green mobile hydrogen cycle”, which includes storing energy as hydrogen
gas via electrolysis of water, compression (and transportation if necessary) of the hydrogen gas,
and conversion of hydrogen back to power in a FCEV is typically around 25-30% efficient
(without heat recovery and utilization).[100,117] Industrial hydrogen is presently available with
higher efficiency, albeit with higher carbon emissions.[118] For comparison, the total efficiency for
charging and driving a BEV is around 80-85%,[119] meaning a FCEV could require about 2.5-3.5
times more energy from the power grid to drive the same distance. However, the full cost
comparison between FCEV and BEV operation must include (i) the cost of upgrading the current
power grid versus building a hydrogen infrastructure and (ii) how excess energy, required to meet
peak demand, will be stored during times of low electricity demand. One such study of the United
Kingdom indicated that an “electrification” strategy relying only on electricity for powering end-
use technologies (such as BEVs) would be ~ 3 times more expensive than a “full contribution”
model in which hydrogen is the primary energy carrier for end-use technologies.[120] It should also
be noted that alkaline electrolysis combined with hydrogen storage has the lowest capital costs of
any other commercialized utility-scale technology, on a per-kWh basis.[43]
Finally, the durability of PEM fuel cells is an important factor to be considered for their
potential success.[121,122] Particularly for the high-utilization market, a significant challenge for
PEM fuel cells is to demonstrate high enough durability to achieve a similar lifetime to incumbent
ICEVs. Encouragingly, two PEM fuel cell-powered buses (one of which utilizes Ballard’s
FCveloCity®-HD6 module) have recently achieved over 25,000 h of operation,[123,124] which is
33
equivalent to 4 to 6 years and meets the U.S. Department of Energy and Federal Transit
Administration targeted lifetime for a fuel cell powertrain.[125] Consumer FCEVs are also near their
target of 5,000 hours of operation,[126] while plugin-hybrid FCEVs can provide greater reliability
due to optimized power shifting between the fuel cell and a larger battery.[111]
2.4 Conclusions
Batteries and fuel cells with improved specific energy, energy density, cost, safety and grid
compatibility are necessary to electrify the long-range, low-cost and high-utilization transportation
sectors. While no technology is suitable for every application, each one discussed in this Review
can help to enable at least one of the emerging EV markets (Figure 2.8). High-power Pb-acid (Pb-
carbon) batteries can supplant a low-power, high-specific energy battery within a low-cost EV,
while Ni-MH batteries could improve the range of lithium battery-powered EVs by simultaneously
acting as structural or energy adsorption components. Li-S batteries could completely replace Li-
ion batteries to enhance the long-range and low-cost EV markets, while Zn-air and Li-air batteries
could serve as range-extenders to succeed in these sectors as well. Finally, fast-refuelling and grid-
compatible hydrogen fuel cells are a natural fit for high-utilization transportation, while the high
specific energy and energy density of hydrogen also makes them attractive for long-range
consumer EVs. Li-ion batteries possess the best combination of properties for certain electric
mobility applications; however, targeted adoption of a diverse mix of battery and fuel cell-powered
EVs will increase the chance of a full transition to clean, low-carbon transportation.
34
Figure 2.8. Suitability of alternative batteries and fuel cells to emerging EV markets. Pb-acid
(Pb-carbon) batteries can provide supplementary power for low-cost EVs due to their low cost
and high specific power, but they must be paired with a complementary high-energy battery due
to their low specific energy and energy density. Ni-MH batteries, although having a higher cost
and lower specific energy and energy density than lithium-based batteries, may be implemented
in place of structural or energy adsorption components in long-range EVs due to their safer
internal chemistry. Li-S batteries can offer higher specific energy and lower cost than Li-ion
batteries, and are therefore attractive to both the long-range and low-cost transportation markets.
Li-air and Zn-air batteries have similarly attractive characteristics for both of these markets, but
their relatively low cycle life, calendar life and specific power make them better suited as range-
extenders to be paired with a more durable and higher-power battery. Hydrogen fuel cells are a
fundamentally different technology with decoupled energy and power characteristics, which can
make them more cost-effective than pure battery-powered vehicles in long-range applications.
Additionally, the flexibility of hydrogen production powered by intermittent renewable energy,
low cost of hydrogen storage and quick fuelling of hydrogen into FCEVs make them attractive to
high-utilization transportation markets.
35
Chapter 3: Challenges and Strategies for Designing Energy-
Dense Rechargeable Zinc-air Battery Electrodes
3.1 Introduction
In Chapter 1 and Chapter 2, the many advantages of zinc-air batteries (low projected cost,
high specific energy and energy density, and inherently safe operation) were discussed particularly
regarding their potential application as EV range-extenders. The success of this application mainly
depends on making rechargeable Zn-air batteries more durable. Improving the cycling stability of
bifunctional oxygen catalysts and zinc electrodes, while maintaining high specific energy and
energy density, will be necessary to achieve greater cycle life.[127,128] Reducing or eliminating
carbon in the air electrode[129] can also improve the calendar life of Zn-air batteries, since carbon-
based air electrodes are subjected to corrosion by the alkaline electrolyte,[130] even when the battery
is at rest. However, the only commercial rechargeable zinc-air battery systems to have overcome
many of these issues require a circulating electrolyte, electrolyte filtering or three or four-electrode
designs to maintain long-term performance,[131–135] which increases complexity and limits the
system-level energy density. Zinc-air batteries with a compact cell design and static electrolyte,
on the other hand, could meet the energy storage needs for electric vehicles. This chapter therefore
provides a review of specific challenges and strategies in designing electrodes for such energy-
dense rechargeable zinc-air batteries.
36
3.2 Zinc-Air Battery Operation and Configuration
The major components and operating mechanism of a Zn-air battery are displayed in Figure
3.1. A negative Zn electrode is coupled to a positive air electrode through an external circuit, while
an electrochemical pathway between the two electrodes is provided by an ionically conductive
electrolyte (typically an aqueous alkaline solution). When the battery is discharged, the Zn
electrode is oxidized according to the forward reactions in Equations 3.1-3.3, providing a flow of
electrons to the external circuit in the process. After travelling across the load in the external
circuit, the electrons are consumed at the air electrode by the O2 reduction reaction (ORR, forward
reaction of Equation 3.4), with O2 supplied by the outside ambient atmosphere. Charge balance
within the electrolyte is maintained by the diffusion of hydroxide (OH-) ions produced at the air
electrode (Equation 3.4) and consumed at the Zn electrode (Equation 3.3). The overall chemical
reaction, as provided in Equation 3.5, results in a nominal cell voltage of 1.66 V. When a
rechargeable Zn-air battery is charged by an external power source, the flow of electrons is
reversed and the reactions as written in Equations 3.1-3.5 occur in the reverse direction, releasing
O2 back into the outside atmosphere. An ionically permeable separator is placed between the two
electrodes in order to prevent direct physical contact between them.
37
Figure 3.1. Schematic operating mechanism of a rechargeable Zn-air battery. Red arrows and
blue arrows represent the direction of movement during discharging and charging, respectively.
Zn electrode reactions:
Zn + 4OH−
⇔ Zn(OH)42− + 2e− (Equation 3.1)
Zn(OH)42−
⇔ ZnO + 2OH− + H2O (Equation 3.2)
Overall:
Zn + 2OH−
⇔ ZnO + H2O + 2e−, E° = −1.26 V vs. SHE (Equation 3.3)
Air electrode reaction:
O2 + 2H2O + 4e−
⇔ 4OH−, E° = 0.40 V vs. SHE (Equation 3.4)
Overall cell reaction:
2Zn + 𝑂2
⇔ 2ZnO, E°cell = 1.66 V (Equation 3.5)
38
Most Zn-air batteries are designed with a planar arrangement; this configuration is
presumably favoured over a spiral-wound design, which would lower the amount of direct contact
with outside air needed to provide oxygen to the air electrode, although the latter design has
received some consideration.[136] In small primary button cells employed for hearing aids, the Zn
electrode compartment is composed of atomized Zn powder intermixed with a gelled KOH
electrolyte. This compartment is separated from the air electrode by an electrically isolating and
ionically conducting separator layer. In order to maximize the energy density, the button cell’s
casing and cap also act as the current collectors.[137] Larger and multi-cell primary Zn-air batteries
(historically used for railroad signaling, underwater navigation and electric fencing) employ a
prismatic configuration,[95] as shown in Figure 3.2. Besides the shape, this configuration differs
from the button cell by including conductive current collectors within a plastic casing, in addition
to external tabs from the positive and negative electrodes. The prismatic design is also the most
common configuration used in electrically rechargeable Zn-air battery research, where many
research groups use a combination of plastic plates and gaskets fastened together with bolts and
nuts to assemble the cell.[138–141]
39
Figure 3.2. Schematic representation of prismatic Zn-air battery configuration.
Several Zn-air cells can be stacked in series in order to raise the battery voltage to a required
level for its application. The cells can be stacked using two possible arrangements, referred to as
monopolar and bipolar.[142] In the monopolar arrangement (Figure 3.3a), the Zn electrode is
sandwiched in between two externally connected air electrodes and this basic unit is repeated over
multiple cells. To connect the cells in series, external connections are made between the Zn
electrode of one cell to the air electrode of the adjacent cell. In the bipolar arrangement (Figure
3.3b), each Zn electrode is paired with a single air electrode on only one of its sides. A series
connection is made between the air electrode and the Zn electrode of an adjacent cell through an
electrically conductive bipolar plate with air flow channels rather than through an external
connection.
A large advantage of the bipolar arrangement is that cells can be packaged more efficiently
due to the absence of external wiring. In addition, current distribution is more evenly distributed
across the electrodes of a bipolar arrangement versus a monopolar arrangement, since the latter
40
uses external connections to collect current from the electrode edges. However, it is known that
edge current collection can generally be employed without significant current distribution effects
in alkaline fuel cells (AFCs) with electrode areas less than 400 cm2.[143] Therefore, this advantage
for the bipolar arrangement is likely to be minimal in Zn-air batteries, which typically operate at
lower current densities than fuel cells. A disadvantage of the bipolar arrangement is that the air
electrode must be electrically conductive across its entire thickness. This means that the air-facing
side of the air electrode cannot be composed of a pure polytetrafluoroethylene (PTFE) layer, which
is often preferred in order to maximize hydrophobicity and minimize flooding or leakage of the
liquid electrolyte from the cell. The bipolar arrangement also requires that a certain pressure be
maintained in order to provide sufficient interfacial contact between the electrodes and bipolar
plates.[143]
Figure 3.3. Multi-cell Zn-air battery configuration with (a) molopolar arrangement and (b)
bipolar arrangement. Air access channels are depicted as going into the page.
41
3.3 Reversible Zinc Electrode
Given that the Zn-air battery is supplied with an unlimited source of O2, the Zn electrode is
solely responsible for the battery’s capacity. A successful Zn electrode should have a high
proportion of utilizable active material, be capable of high efficiency recharging and sustain its
capacity over long time periods and several hundred charge and discharge cycles. The following
two sub-sections detail the scientific phenomena that constrain the achievement of these goals and
the strategies that battery developers have used to battle and overcome these constraints.
3.3.1 Performance-Limiting Phenomena
The performance of the Zn electrode is limited by four major phenomena that occur during
operation in a Zn-air battery: (i) dendrite growth (Figure 3.4a), (ii) shape change (Figure 3.4b),
(iii) passivation and internal resistance (Figure 3.4c) and (iv) hydrogen evolution (Figure 3.4d).
Figure 3.4. Schematic representation of performance-limiting phenomena that may occur on the
Zn electrode: (a) dendrite growth, (b) shape change, (c) passivation, (d) hydrogen evolution. Red
and blue arrows represent anodic and cathodic processes, respectively.
42
Zn dendrites, which are defined as sharp, needle-like metallic protrusions, are well-known
to form under certain conditions during electrodeposition.[144–147] In secondary alkaline Zn-based
batteries, Zn dendrites may form during the charging process and can fracture and disconnect from
the electrode (resulting in capacity losses), or more critically, can puncture the separator and make
contact with the positive electrode (resulting in a short circuit). Dendritic morphologies arise as a
result of concentration-controlled Zn electrodeposition, whereby a positively-sloped concentration
gradient of Zn(OH)42- ions is established as a function of distance from the Zn electrode surface.
Under this condition, Zn(OH)42- ions are deposited preferentially at raised surface heterogeneities
such as screw dislocations which are higher up the concentration gradient.[144] Upon continued
deposition, these deposits grow past the boundary of diffusion-limited region, giving rise to
dendrites rapidly growing under nearly pure activation control.[148] Therefore, dendritic growth is
more likely to occur at higher deposition overpotentials where diffusion-limited conditions are
more prevalent.
Shape change is observed in Zn-air and other alkaline-Zn batteries when Zn is dissolved in
the electrolyte during the discharge reaction and then deposits at a different location on the Zn
electrode during charging. Over many charge-discharge cycles, this leads to densification of the
electrode and a loss of usable capacity.[149–151] In general, modelling and mechanistic investigations
have attributed shape change to uneven current distribution within the Zn electrode, uneven
reaction zones and convective flows caused by electro-osmotic forces across the
battery.[138,149,150,152–157] Many investigators use a KOH electrolyte that is pre-saturated with
Zn(OH)42- ions (usually by dissolving ZnO powder).[158–165] This is intended to minimize shape
43
change by inducing the formation of a solid ZnO discharge product at the Zn electrode at an earlier
point during discharge. However, the precipitation of ZnO from anodically-discharged Zn(OH)42-
can occur slowly even in Zn(OH)42--saturated KOH solutions.[166,167]
Passivation is the term used to describe an electrode that cannot be further discharged due to
the formation of an insulating film on its surface that blocks migration of the discharge product
and/or OH- ions. When a Zn electrode is discharged and the Zn(OH)42- discharge product has
reached its solubility limit, ZnO is precipitated on the electrode surface. In the case of a porous Zn
electrode, passivation is precluded by the reduction of the pore size due to precipitation of ZnO
(which takes up more volume than Zn) and finally occurs when freshly discharged Zn(OH)42- is
far above the solubility limit, causing it to immediately precipitate and fully plug the remaining
pore volume.[155,168] This helps to explain why rechargeable Zn electrodes typically require a
porosity of 60-75% (in the metallic or charged form),[150,159,169,170] while the theoretical porosity
required to physically accommodate the volume expansion from Zn to ZnO is only 37%. The non-
conductive property of ZnO also increases the internal resistance of the Zn electrode, which
naturally leads to voltage losses during discharging and voltage increases during charging. Zn
utilization, defined as the percentage of the theoretical capacity of the Zn mass that is actually used
when the electrode is fully discharged, is limited by the point at which the Zn electrode becomes
completely passivated or its internal resistance becomes too high to maintain a sufficient operating
voltage. The Zn utilization for conventional powder-based electrodes can range from 60-80%,[169–
171] while novel developments that will be discussed below can push this value up to 90% or above.
44
The hydrogen evolution reaction (Equation 3.6) has a Standard Reduction Potential (-0.83
V vs. SHE at pH 14) above that of Zn/ZnO (-1.26 V vs. SHE at pH 14). Therefore, hydrogen
evolution is thermodynamically favored and a Zn electrode at rest will be corroded over time
(Equation 3.7, referred to as self-discharge in a battery context, or simply corrosion). This also
means that a Zn electrode cannot be charged with 100% coulombic efficiency, since the hydrogen
evolution reaction will consume some of the electrons provided to the Zn electrode during
charging. The actual rate of hydrogen evolution is defined by its exchange current density and
Tafel slope on a Zn electrode surface, which has been measured at 8.5 × 10⁻⁷ mA cm-2 and 0.124
V decade-1, respectively in 6 M KOH.[172] Therefore, at the Zn/ZnO standard reduction potential,
the hydrogen evolution current on a Zn surface is on the order of 1 × 10⁻⁵ mA cm-2.[172] However,
the hydrogen evolution overpotential is significantly reduced on a ZnO surface,[173] which means
that the self-discharge rate will increase as ZnO forms on the discharging Zn electrode.
H2O + 2𝑒−
⇔ 2OH− + H2 (Equation 3.6)
Zn + 2H2O → ZnO + H2 (Equation 3.7)
3.3.2 Strategies for Improving Performance
A number of modifications to the Zn electrode have been investigated to increase its
performance, in terms of cycle life (measured by capacity retention as a function of cycle number),
capacity (determined by Zn utilization, among other factors) and coulombic efficiency (determined
by extent of hydrogen evolution). These strategies have been organized into six methods and are
summarized in Table 3.1. More detailed information on each strategy can be found in the listed
references within the table, as well as the review paper[174] this chapter was adapted from. To
45
summarize, structural modification through electrodeposition and advanced casting techniques, as
well as compositional modification by means of additives and/or chemical doping have been
demonstrated to be feasible solutions. The most promising additives are those which are effective
in small quantities, since a larger proportion of additives reduces the overall Zn capacity. Table
3.2 contains performance metrics, including capacity densities, Zn utilization and the number of
cycles with over 80% retained capacity, of some Zn electrodes that have employed these strategies.
The areal capacities are also calculated, which highlights the difficultly in achieving both a high
cycle life and high areal capacity
46
Table 3.1. Strategies for improving Zn electrode performance.
Strategy
Direct influence on
Dendritic
Growth Shape Change
Passivation and
Internal Resistance Hydrogen Evolution
(1) High Surface
Area/ 3-D Electrode
Structure[15,160,175–177]
Minimized
(Decreases
charging
overpotential)
Minimized
(3-D Structure
improves current
distribution)
Minimized
(High surface area
minimizes ZnO film
thicknesses)
Increased
(Higher surface area
causes more intense
hydrogen evolution)
(2) Polymeric
Binders[149,178,179] -
Minimized
(Improves
mechanical
strength)
Increased
(Increases electrode
resistance)
-
(3) Carbon-Based
Electrode
Additives[180–185]
-
Minimized
(Improves current
distribution)
Minimized
(Improves electrode
conductivity)
-
(4) Heavy Metal
Electrode
Additives[180,186–190]
Minimized
(“Substrate effect”
promotes denser
deposits)
Minimized
(Improves current
distribution)
Minimized
(Improves electrode
conductivity)
Minimized
(Increases hydrogen
overpotential)
(5) Discharge-
Trapping Electrode
Additives [150,158,161,165,171,191–195]
Minimized
(Zn(OH)42-
concentration
gradient is
reduced)
Minimized
(Discharge
product migration
is reduced)
Possibly minimized
(If trapped discharge
product conductivity
higher than ZnO)
-
(6) Electrode
Coatings[162,196–201]
Minimized
(Zn(OH)42-
concentration
gradient is
reduced)
Minimized
(Discharge
product migration
is reduced)
- -
47
Table 3.2. Performance metrics of selected Zn electrodes disclosed in the literature.
a)Includes mass of additives and based on mass of charged (non-oxidized) electrode with the
exception of 100% Solid ZnO; b)If the necessary information to calculate volumetric capacity
density was not reported, a range is calculated based on the electrode material densities and a
typical charged electrode porosity of 60-75%[48, 55-57]; c)Depth of Discharge abbreviated as DOD;
Refer-
ence
Strate-gies (
)
Electrode, Electrolyte
Composition
Elect-
rode Thick-
ness
[mm]
Specific
Capacity
[Ah kg-1]a)
Volu-
metric Capacity
Density
[Ah L-1]b)
Zn
Utiliz-
ation [%]
Cycling Condit-
ionsc)
# Cycles with
>80%
Retained Capacityd
)
Areal
mass
(g cm-2)
Areal
Capac-ity
(mAh
cm-2)
Theore
-tical
- 100% Zn - 820 5846 100 - - - -
- 100% ZnO - 658 3694 100 - - - -
Yan
2015[17
6]
1,6
Zn-electroplated Cu Foam, 8 M KOH +
0.5 M ZnO
2
754
39
92
100 mA cm-2
100% DOD
9000+
0.010 7.9
Chamoun
2015[17
7]
1
3D Hyper-dendritic
Zn sponge
electrodeposited onto Ni mesh, 8.9 M
KOH
e) 719 1282-
2051 88
C/5 Rate
40% DOD 100+ - -
Parker
2014[17
5]
1,2,4
3D Zn sponge +
300ppm In + 300ppm Bi, 6 M
KOH
1-4 728 928 89
5 mA cm-2
(discharge)
3 mA cm-2
(charge) 20% DOD
~25 0.13-0.51
92.8-371.2
Wang
2014[19
5]
1,2,3,5,6
Calcium zincate
powder + 5 wt.% Zn + 10
wt.% acetylene
black + 5 wt.% PTFE, 6M KOH +
Sat’d ZnO
0.2
385
338-540
98
2C Rate 100% DOD
250+
0.018-
0.028
6.8-
10.8
Huang 2015[16
5]
1,2,3,5,
6
Zn-Al-layered double oxide
powder + 10 wt.%
acetylene black + 5
wt.% PTFE, 6 M
KOH + Sat’d ZnO
0.2
469
552-883
87
1C Rate
100% DOD
1000+
0.024-
0.038
11.0-
17.7
Yuan
2011[19
8]
1,2,4,6,
7
Bi-based
nanoparticle-coated
ZnO powder + 4.8 wt.% PTFE + 0.6
wt.% CMC, 4.5 M
KOH + 1.6 M K2BO3 + 0.9 M KF
+ 0.1 M LiOH
0.3
656
1025-
1640
90
C/5 Rate
100% DOD
50+
0.047-0.075
30.7-49.2
Zeng 2011[16
3]
1,2,3,4,
6
In-doped ZnO powder + 8.3 wt.%
PTFE + 8.3 wt.% graphite, 4.5 M
KOH + 1.0 M
NaOH + 0.5 M
LiOH + Sat’d ZnO
0.28 586 727-1164 92 ~C/4 Rate
100% DOD 73+
0.035-
0.056
20.4-
32.6
48
d)“+” indicates that the electrode provided >80% of its initial capacity when cycling was
terminated; e)Not reported.
3.4 Electrolyte and Separator
Aqueous alkaline electrolytes are most commonly employed in Zn-based battery chemistries
for several reasons, which include cost effectiveness, high ionic conductivity and Zn electrode
stability.[202–204] Sufficient OH- concentrations within the electrolyte are also necessary to avoid
high overpotentials for the O2 reactions at the air electrode, and further allow the use of non-
precious metal catalysts.[31,205] KOH-based electrolytes are the most common in comparison to
NaOH or LiOH electrolytes, due to the former’s superior ionic conductivity.[12,206] Unfortunately,
issues that arise with using aqueous alkaline electrolytes within a Zn-air battery include
evaporation or moisture uptake (depending on relative humidity conditions) and carbon dioxide
(CO2) poisoning from the outside atmosphere. Electrolyte evaporation reduces the ionic pathway
between the battery electrodes, while moisture uptake lowers the alkalinity and can cause swelling
of the cell.[31,137,207] Diffusion of CO2 into the electrolyte lowers its alkalinity and eventually leads
to the precipitation of solid carbonates (e.g. potassium carbonate (K2CO3)) which clog the pores
of the air electrode.[31,142,207]
Room temperature ionic liquids (RTILs) have received increased attention in recent years as
an alternative to aqueous-based electrolytes for rechargeable Zn-air batteries. RTILs are molten
salts with melting temperatures at or below room temperature, and are stable at a wide range of
electrochemical potentials.[204] They have the advantage of being largely immune to both CO2
poisoning and evaporation,[208] and have also been reported to suppress dendrite growth of the Zn
49
electrode.[209] However, most RTILs that have been considered for Zn-air batteries have ionic
conductivities approximately 10-100 times lower than concentrated KOH solutions.[208] In
addition, the ORR mechanism in RTILs typically involves several electron transfer steps,[210]
unlike ORR in alkaline media which is typically close to the 4-electron mechanism (Equation 3.4)
with the appropriate catalyst. Both of these factors lead to large cell voltage decreases with
increasing currents,[208] which does not make them well suited for high-power applications such as
EVs.
Aqueous electrolytes are often “gelled” by mixing in polymers such as polyvinyl alcohol,
poly(acrylic acid) and polyethylene oxide.[207,211,212] Gelled, or “quasi-solid state”, electrolytes are
used extensively in primary Zn-air batteries in order to prevent leakage and slow down
evaporation.[95] Successful gelled electrolytes have conductivities on the same order of magnitude
as conventional aqueous alkaline electrolytes.[204] However, it is generally difficult to recharge Zn
electrodes in gelled electrolytes due to their low solubility for Zn(OH)42-, which leads to difficulties
in transforming ZnO back to the intermediate Zn(OH)42- before reduction to Zn metal.[204] Recent
work on flexible Zn-air[183] and Ni-Zn[213] batteries has shown that rechargeability is possible using
gelled electrolytes; however, the Zn electrode thicknesses and currents demonstrated were likely
too low for an EV application.
Therefore, it appears that primarily aqueous alkaline electrolytes may be the best choice for
EV applications, despite the above-mentioned problems of CO2 poisoning and
evaporation/moisture uptake. Various battery designs have been proposed to alleviate these
problems, such as incorporating an electrolyte dispenser system[214], moisture control system[215]
50
or a CO2 air scrubber[216,217] into the battery pack. Additionally, mechanical[16] or load-
responsive[218] air electrode seals have been proposed in order to limit ingress of CO2 and ingress
or egress of water when the cell is not in use.
If aqueous alkaline electrolytes are employed in rechargeable Zn-air batteries, the Zn
electrode shape change issue (Section 3.3.1) will certainly be a concern. It can be observed in
Figure 3.5 that this problem is exasperated by the properties of the maximum conductivity KOH
electrolyte (6-7 M or 25-30 wt.% KOH) that is most typically used in alkaline-Zn batteries. Zn
redox kinetics (indicated by the Zn/Zn2+ exchange current density) are near their maximum at this
concentration, and the solubility of the ZnO discharge product increases with increasing
concentration. Therefore, during battery operation a large amount of Zn is expected to be
dissolving, migrating and re-depositing under non-uniform conditions caused by the reasons
described in Section 3.3.1.
51
Figure 3.5. Electrolyte conductivity, Zn/Zn2+ exchange current density and ZnO solubility as a
function of KOH concentration (data from [202,219,220])
As shown in Figure 3.5, the solubility of ZnO is reduced at lower KOH concentrations,
which will reduce the tendency for Zn electrode shape change.[221,222] Therefore, a clever approach
(borrowed from rechargeable Ni-Zn battery research) to improve the Zn electrode lifetime involves
lowering the KOH concentration as much as possible without substantially reducing the catalytic
performance of the air electrode, and then adding other ionic compounds such as KF, K2CO3,
K3BO3 and K3PO4 to restore the electrolyte conductivity.[150] With this strategy, the Zn(OH)42-
solubility can be reduced to less than half of its original value (in 7 M KOH) while maintaining
above 75% of the original electrolyte conductivity.[166] Adler et al.[159,223] found that an electrolyte
52
composed of 3.2–4.5 M KOH, 2 M KF, 2M K2CO3, saturated ZnO and a suspension of 0.5 M LiF
resulted in optimal performance and cycle life of a Ni-Zn battery (the Li+ additive is beneficial to
the NiOOH/Ni(OH)2 electrode[150]). However, CO3- additives are not appropriate for aqueous
electrolytes of Zn-air batteries, since this will lead to quicker saturation and precipitation of K2CO3
in the air electrode pores as CO2 enters from the outside environment. K3BO3 and K3PO4 additives,
which have also shown promise for Ni-Zn batteries,[166,224] thus seem to be a better choice for Zn-
air batteries and deserve a thorough investigation.
In order to prevent short-circuits in rechargeable Zn-air cells, several stringent properties are
required from the chosen separator. It must be electronically insulating, ionically conductive,
chemically resistant to the alkaline electrolyte and also electrochemically stable at the wide range
of charging and discharging voltages experienced in the battery. Microporous polypropylene
membranes produced by Celgard LLC, such as Celgard 5550, possess these properties and are
extensively employed in rechargeable Zn-air battery research.[31,225] However, Zn(OH)42- ions can
also pass through the micropores of these separators, potentially leading to precipitation of ZnO
on the air electrode surface, and subsequent interference of the catalyst sites or blockage of the air
electrode pores.[226] Thus, anion exchange membranes (which allow hydroxide ion passage while
blocking Zn(OH)42- ions) are currently an active area of research for rechargeable Zn-air
batteries.[184,227–230]
53
3.5 Bifunctional Air Electrode
While the Zn electrode is the determining factor of the Zn-air battery’s capacity, its power
performance and energy efficiency are largely dependent not only on the electrolyte, but also on
the air electrode. This stems from the fact that the ORR during discharging and the O2 evolution
reaction (OER, reverse reaction in Equation 3.4) during charging both have much larger energy
barriers to overcome than the Zn electrode reactions. Energy barriers in a battery result in potential
(i.e. voltage) losses, which can be separated into activation polarization, ohmic resistance and
concentration (i.e. mass transfer) polarization. The sum of these losses equates to the difference
between the battery’s operating voltage and open circuit voltage. The example discharge and
charge polarization plots in Figure 3.6 show the importance of minimizing voltage losses in the
zinc air battery, since large polarization can cause substantial losses in energy efficiency and also
(for discharging) can lower the specific energy or energy density of the zinc-air battery. This
highlights the importance for the air electrode to be engineered with suitable catalysts to minimize
activation barriers for the ORR and OER in addition to an appropriate structure enabling efficient
transport of O2 and OH- to and from the catalyst sites.
54
Figure 3.6. Example of discharge (black line) and charge (brown line) voltages, power density
(blue line) and energy efficiency (red line) as a function of current density for a rechargeable
zinc-air battery. The activation, ohmic and mass transfer-dominated polarizaton regions are
identified by A, O and M labels, respectively.
3.4.1 Electrode Design
Designing an appropriate structure for the air electrode is particularly challenging in
comparison to other battery electrodes due to the requirement for providing sufficient three-phase
interfacial sites. As seen in Equation 3.4, the ORR requires the gas phase (O2), liquid phase (H2O)
and solid phase (electron conductor) to all be in close proximity in order to proceed at certain
reaction site. While the OER only strictly requires a two-phase interface (liquid and solid), the air
electrode structure must allow efficient removal of O2 gas; otherwise O2 bubbles will appear in the
electrolyte reduce the size of the solid/liquid interfacial area. Extensive research has been
conducted on air electrode design for both polymer electrolyte membrane (PEM) and alkaline fuel
cell (AFC) applications. However, similar work has not been carried out on the air electrode design
55
for rechargeable metal-air batteries; in fact, a large amount of research on catalysts for
rechargeable zinc-air batteries has been conducted using commercial carbon-based air electrode
supports designed for PEM fuel cells.[141,185,231–234] Given the lack of work on bifunctional air
electrode structures and designs, it is important to review the literature on fuel cell air electrodes
(particularly AFCs).
As shown in Figure 3.7, the air electrode architecture generally consists of three layers.[235]
The gas diffusion layer (GDL) facilitates the transfer of the air or oxygen reactant to the catalyst
sites within the active layer, while the active layer (AL) contains the oxygen reaction catalysts and
interfaces with the electrolyte to provide the three-phase reaction zone. The backing material or
backing layer provides structural support to the other layers; it may also act as the current collector
and is not necessarily located behind the GDL as indicated in Figure 3.7.[236] In fuel cell air
electrodes, the GDL and AL have traditionally been composed of mixtures of PTFE and carbon or
graphite powders, with the AL additionally containing ORR catalysts. PTFE is chosen for its
ability to bind the other powder components together and its highly hydrophobic property which
allows for the establishment of gas phase channels within the electrode.[237] PTFE also exhibits
relatively good chemical stability in a wide range of environments, including alkaline
electrolytes.[237,238] Carbon and graphite powders are typically chosen as the conductive component
of the air electrode due to their low cost, activity for the ORR and their widely tunable surface area
and porosity.[143,237,239–241] The GDL and AL are most often formed by rolling or pressing a wet
slurry of the chosen carbon, PTFE and catalysts onto the backing layer.[235]
56
Figure 3.7. General architecture of fuel cell or metal-air battery air electrode.[235]
For AFCs with a monopolar design (Figure 3.3a), the GDL is typically composed entirely
of PTFE in order to minimize the potential for flooding. Pores in the PTFE layer are produced by
mixing PTFE with a low decomposition-temperature additive such as ammonium carbonate, which
is burned off during a heat-treatment.[235] A current collector, typically a metal mesh or foam, must
be placed in front of the 100% PTFE GDL layer (e.g. between the GDL and AL) in this case. In a
bipolar design (Figure 3.3b), the GDL must be hydrophobic and conductive; therefore, the GDL
is usually fabricated using a mixture of PTFE and a hydrophobic carbon powder such as acetylene
black, with a PTFE content ranging from 25-60%.[143,235,237] The AL, which must be conductive
and slightly hydrophilic in order to establish three-phase reaction zones, is typically composed of
high-surface area carbons and a lower PTFE content ranging from 2-25%.[235]
The establishment of three-phase reaction zones is highly dependent on the pore structure of
the AL and is most often explained by the “flooded agglomerate” model described by Giner and
Hunter.[242] In this model, carbon particles are tightly packed in to agglomerates with electrolyte
57
filling the inter-particle voids (Figure 3.8a), and the agglomerates are held together by a
hydrophobic network of PTFE particles (Figure 3.8b).[235,242–244] The reactant gas arriving from
the GDL diffuses through these hydrophobic channels, dissolves into the electrolyte film
surrounding the agglomerates and further diffuses to the catalyst sites within flooded agglomerate
pores. The three-phase reaction zone in the AL layer can be enhanced by selecting hydrophobic
carbon particles with extensive interconnected micropores (Figure 3.8a), which are not flooded
by the electrolyte and thus provide better dispersion of gas channels to the catalyst sites.[237]
Figure 3.8. Schematic representations of pore structures within AL composed of catalyst-coated
carbon powders and PTFE particles; (a) single flooded agglomerate, (b) group of agglomerates
held together by a network of PTFE particles.[235]
Unfortunately, carbon-based GDLs and ALs are not considered to be appropriate for use in
the air electrodes for rechargeable zinc-air batteries. This is due to the fact that carbon is
susceptible to corrosion at the high oxidizing potentials experienced at the air electrode during
charging, and further does not have to ability to form a passivating layer.[130,245] When subjected
58
to high anodic potentials in an alkaline electrolyte, carbon produces carbon monoxide gas in
addition to carbonate (CO32-) ions;[130] the latter of these can combine with CO2 poisoning from
the outside atmosphere to hasten the precipitation of K2CO3 in the air electrode pores. The standard
potential of carbon oxidation in alkaline electrolyte (pH of 14) is -0.78 V vs. SHE (0.48 V vs.
Zn/ZnO), which is much lower than the ORR/OER equilibrium potential (0.40 V vs. SHE, 1.66 V
vs. Zn/ZnO).[246,247] Therefore, although graphitization of carbon improves its corrosion
resistance,[248–253] corrosion is thermodynamically favored even at the open circuit voltage of zinc-
air batteries. Graphitization of carbon powders improves their corrosion resistance,[248,249], and
bifunctional air electrodes with hundreds of charge-discharge cycles have been demonstrated using
graphitized carbon-based air electrodes (albeit at modest currents).[250,251,253]. However, the
formation of CO32- ions is likely inevitable even when they are graphitized; this is an increasingly
severe problem in commercially-relevant cell designs (e.g. Figure 3.2), since the CO32- saturation
point would be quickly reached with a minimum volume of electrolyte. Therefore, it appears that
metal-based air electrodes that are largely free of carbon components are more suitable for
rechargeable zinc-air batteries.
However, relatively few investigations have focussed on metal-based air electrodes for
rechargeable metal-air batteries. Silver (Ag)-based air electrodes with increased stability relative
to carbon-based air electrodes have been demonstrated for AFCs and Li-air batteries;[236,254,255]
however, the high cost of Ag makes it impractical for inexpensive Zn-air batteries. A promising
air electrode based on less expensive nickel (Ni) metal was recently demonstrated by Price and
coworkers[129,256] for flow-based rechargeable zinc-air batteries. Their fabrication technique
59
involved the pressing of a slurry composed of Ni powder and PTFE onto a Ni foam substrate
followed by dip-coating in a catalyst precursor solution. The resulting bifunctional air electrode
demonstrated stable potentials after 50 charge-discharge cycles at a relatively high current density
(50 mA cm-2), which is near the maximum required for a zinc-air battery EV range extender that
was recently modeled.[257] An 1981 report by Armstrong[258] for Canada’s Department of National
Defence also documented a nickel-based air electrode produced by dip-coating a 0.71 mm-thick,
84.7% porous sintered nickel plaque in a catalyst precursor solution, which displayed over 200
charge-discharge cycles at a relatively high current density (50 mA cm-2)
3.4.2 Oxygen Reaction Catalysts
The development of bifunctional catalysts that can efficiently facilitate the oxygen reduction
reaction (ORR) and the oxygen evolution reaction (OER) with low overpotentials, while also
remaining stable over hundreds of charge-discharge cycles in alkaline electrolytes, is currently the
most intense area of research involving rechargeable zinc-air batteries.[31,128,259,260] Traditionally,
noble metals such at platinum (Pt) have been employed for their high ORR activities while noble
metal oxides such as ruthenium(IV) oxide (RuO2) and iridium(IV) oxide (IrO2) are known for their
high OER activities. However, these catalysts are prohibitively expensive for low-cost zinc-air
batteries, and further, metal catalysts including Pt are unstable towards oxidation at the high
potentials that the OER operates at.[260,261] Therefore, most research is currently focussed on
bifunctional non-noble metal oxides; these are usually oxides with mixed valence states such as
spinels and perovskites.[31,128,260] Nanostructured carbon materials have also been heavily studied,
often in combination with metal oxides, due to their enhanced conductivity relative to metal
60
oxides.[31,128,260] However, as mentioned in Section 2.4.1, carbon materials are generally
detrimental to the lifetime of rechargeable zinc-air batteries due to their instability propensity to
form poisoning CO32- ions.[262] Therefore, carbon-free catalysts are exclusively focused on in the
brief discussion below.
Manganese oxides (MnOx), are well known for their strong ORR activity in addition to being
inexpensive, and are thus the primary choice for primary zinc-air batteries (particularly as
MnO2).[95,137,202] This is due to the ability of Mn to possess and transform between multiple
valences, allowing it to assist electron transfer by switching between an oxygen acceptor and
donor.[259] However, when acting as a bifunctional catalyst, MnOx have been found to switch
between different crystal structures during cycling between ORR and OER operation.[263] This
suggests that this catalyst may not display sufficient long-term stability in a rechargeable zinc-air
battery.
Mixed-metal perovskite oxides, with the general chemical formula ABO3, have traditionally
been a popular choice as a bifunctional catalyst for rechargeable zinc-air batteries.[250,262,264,265] In
the normal perovskite structure, the A sites are relatively large rare earth or alkali metal cations
while the B sites are relatively small transition metal cations.[262] By substituting the either or both
of the A and B sites with cations with other valence states, oxygen vacancies can be created and
the compound’s electronic structure can be widely tuned. Suntivich et al. have developed design
principles for optimizing the ORR[266] and OER[267] catalytic activity of perovskites based on
altering specific electron orbitals. Appropriately designed perovskites have excellent ORR and
61
OER activities and stability; however, they have a disadvantage of relatively difficult preparation
and generally require heat treatment at 600°C or above.[250,264,266,268,269]
Spinel oxides, with the general chemical formula AB2O4, are another common choice as
bifunctional catalysts.[129,256,270–275] The A and B sites are both transition metal cations with +2 and
+3 valences, respectively, and can either be represented by the one element (e.g. Co3O4) or multiple
elements (e.g. NiCo2O4). Co3O4 is the most heavily studied spinel oxide bifunctional catalyst,
which is known to facilitate good activity for ORR on the Co2+ sites and OER activity on the Co3+
sites.[275] While a vast number of binary element-spinel oxides have been investigated, NiCo2O4
has emerged as a widespread bifunctional catalyst due the improved 4-electron reaction ORR
pathway and lower OER overpotential imposed by the Ni2+ lattice sites.[271,273] Spinel oxides can
be synthesized relatively easily and at moderate temperatures between 300-480°C.[271] They are
already used in many industrial applications,[271] and are thus a logical choice for use rechargeable
zinc-air batteries. Both Price and coworkers[129,256,273] and Armstrong[258] chose NiCo2O4 as the
most suitable catalyst for their Ni-based air electrodes due to the ease of synthesis using the dip-
coating/co-precipitation method.
62
Chapter 4: Performance and Failure Mechanism of Nickel-
Based Air Electrodes for Rechargeable Zinc-Air Batteries
4.1 Introduction
Due to the kinetically slow oxygen reduction reaction (ORR) and oxygen evolution reaction
(OER), the power and energy efficiency of a rechargeable zinc-air battery is highly dependent on
the catalytic performance of the air electrode.[12] Most research has focused on surface and
structure engineering of bifunctional catalysts to optimize their oxygen binding energies and
cohesive strength for efficient and stable ORR and OER.[275–278] However, relatively little attention
has been paid to the support and/or current-collector materials of the air electrode, and as detailed
in Section 3.4.1, carbon-based gas diffusion electrodes as well as carbon and graphite powders are
often used as the conductive catalyst support even though they are susceptible to carbon corrosion.
Therefore, rechargeable zinc-air batteries with high energy density, long cycle life and long
calendar life require more corrosion-resistant materials in the air electrode.
Metal-based air electrodes can offer much higher corrosion resistance due to their ability to
form a passivating film on their surface, which greatly reduces the metal oxidation rate. Due to
their relatively high stability and low cost, nickel-based air electrodes have been adopted by some
research groups for demonstration of novel bifunctional catalysts.[274,279,280] The dip-coated nickel-
based electrodes mentioned at the end of Section 3.4.1 have also shown promising performance.
An interesting electrochemical phenomenon in these electrodes is that the oxidized nickel metal in
63
the (oxy)hydroxide passivating layer alternates between the 2+ and 3+ states (Ni(OH)2 and
NiOOH) during the start of discharging and charging, respectively, which was reported as
beneficial to its efficiency due to the lower overpotential of these reactions relative to the ORR
and OER.[256]
However, the degradation mechanism of nickel-based air electrodes after extended cycling
has not been discussed in the literature. This is an important consideration, since voltage losses
after battery cycling might be mistakenly attributed to degradation of the catalyst particles instead
of possible material changes on the supporting nickel electrode. The electrode structure is
presumed to resemble the “flooded agglomerate” model of typical carbon-based air electrodes
(Figure 3.8), with electrolyte-flooded agglomerates of catalyst-coated nickel particles bound by a
network of hydrophobic channels established by the PTFE binder. However, a key dynamic which
does not apply to carbon-based air electrodes is the influence of the (oxy)hydroxide passivating
layer on this mechanism. Whether this dynamic contributes to voltage losses of zinc-air batteries
with nickel-based air electrodes, and if so to what extent, needs to be understood for extending
battery durability.
To address this question in this work, nickel-based air electrodes were fabricated and
investigated with a series of cyclic galvanostatic and potentiodynamic polarization experiments.
The structure of the electrode before and after cycling was characterized to confirm the presence
of a passivating nickel (oxy)hydroxide film. A multi-step discharge method was used to estimate
the growth of the nickel (oxy)hydroxide passivating film, which was linked to dynamic potential
losses at the air electrode. Relative contributions of ohmic, activation and mass transfer potential
64
losses were evaluated at a current density of 10 mA cm-2, which is commonly used for evaluation
of static-electrolyte rechargeable zinc-air batteries. The results provide strong evidence of a
degradation mechanism for nickel-based air electrodes which is distinct from degradation of the
catalyst itself. This insight will aid in the design of more robust bifunctional metal-based air
electrodes for long-lasting rechargeable zinc-air batteries.
4.2 Experimental Methods
4.2.1 Electrode Preparation and Characterization
The preparation procedure for the nickel-based gas diffusion electrode was adapted from
Price et al.[129] Nickel foam (110 pores per inch, 42 mg cm-2, 1.7 mm thick) was used as the
electrode support and current collector. Prior to electrode rolling, the nickel foam was
ultrasonically treated in acetone for 20 min, etched in 1 mol L-1 HCl at 80°C for 1 h, rinsed and
ultrasonically treated in deionized water for 15 min, rinsed with isopropyl alcohol (IPA) and finally
dried in air. To prepare the electrode slurry, nickel powder (Sigma Aldrich, Product #266981) with
an average particle size of approximately 3 µm was added to a vial together with a 50/50 mixture
of IPA and deionized water. 60 wt.% PTFE emulsion (Sigma Aldrich, Product #665800) was then
added dropwise to the vial while stirring and the slurry was ultrasonically mixed for 30 min. The
slurry was blended in a planetary mixer for 5 min to bind the nickel powder with the PTFE. After
pouring out excess liquid, the blended mass was placed onto aluminum foil and rolled into a flat
sheet with the same area as the nickel foam. The nickel/PTFE sheet was then pressed into the
nickel foam and rolled to a combined thickness of 1000 µm using fixed-width rollers. The dried
65
nickel/PTFE slurry had a PTFE content of 30%, and the slurry mass loading in the nickel foam
was approximately 180 mg cm-2. After allowing the rolled electrode to dry overnight, the electrode
was heated at 350°C in air for 30 min and then immersed in a cobalt/nickel nitrate precursor
solution for 5 min. The precursor solution consisted of 2 mol L-1 cobalt (II) nitrate (Sigma Aldrich,
Product #239267) and 1 mol L-1 nickel (II) nitrate (Sigma Aldrich, Product #72253) dissolved in
a 60/40 mixture of H2O/IPA. The electrode was dried in air at room temperature for approximately
3 h and finally was heated at 350°C in air for 3 h to convert the nitrates into the nickel cobalt oxide
(NiCo2O4) spinel phase.
The final gas diffusion electrode (depicted in Figure 4.1a) had a diameter of 1.9 cm and
included an approximately 2 cm long extended piece of the nickel foam current collector which
acted as the working electrode connection. A thin-layer electrode was also fabricated by rolling an
identical nickel/PTFE mixture down to 150 µm (dry slurry mass of approximately 75 mg cm-2),
pressing it onto a nickel foil current collector and carrying out the same heating and dip-coat
treatment as described above. Morphological characterization of the gas diffusion electrode was
conducted with a Zeiss LEO 1530 field emission scanning electron microscope (SEM). X-ray
diffraction (XRD) was conducted on a MiniFlex 600 Rigaku instrument, and X-ray photoelectron
spectroscopy (XPS) was conducted on a Thermal Scientific K-Alpha XPS spectrometer.
66
Figure 4.1. (a) Schematic depiction of single-layer nickel-based gas diffusion electrode
(particles enlarged relative to the nickel foam pores for clarity), and schematic representations
(side-view) of three-electrode cells for performance evaluation of (b) nickel-based gas diffusion
electrode and (c) nickel-based thin-layer electrode as the working electrode (WE). A porous zinc
electrode and zinc wire were employed as the counter electrode (CE) and reference electrode
(RE), respectively.
67
4.2.2 Cell Design
Two cell designs (Figure 4.1b,c) containing a combination of acrylic plates and silicone
gaskets fastened together with bolts and nuts were employed for electrochemical testing. Each
design utilized a three-electrode configuration including a porous zinc counter electrode and zinc
wire reference electrode. Unlike a two-electrode configuration, the cells employed here ensured
that any possible degradation of the porous zinc electrode during cycling would not affect the
potential measurement at the air electrode. The electrolyte in each experiment was an aqueous
solution of 6 mol L-1 KOH prepared from distilled and deionized water. The electrolyte was also
pre-saturated with zinc oxide (ZnO) to improve cyclability of the zinc electrode and to ensure that
the potential of the zinc wire reference electrode maintained a stable equilibrium potential. Porous
zinc electrodes were prepared via cathodic electrodeposition from a fresh electrolyte with the same
composition as above onto a Cu mesh current collector at a potential of -300 mV vs. Zn/ZnO.[177]
The capacities of these zinc electrodes were at least 10 times the capacity required for discharge
(i.e. ORR) steps in the cycling procedures described below.
The cell depicted in Figure 4.1b was employed for electrochemical testing of the gas
diffusion electrode. The electrode was exposed to the electrolyte on the inner side and ambient air
on the outer side through 1.65 cm diameter circular holes in the adjacent gaskets and plates. The
Ni/PTFE slurry-deposited side of the electrode faced the air and the non-slurry-deposited side
faced the electrolyte. A microporous polypropylene separator (Celgard 5550) separated the zinc
counter electrode from the gas diffusion electrode. An additional microporous separator was also
placed directly adjacent to the gas diffusion electrode on the electrolyte side; this ensured that
68
oxygen gas evolved during OER exited through the air-side of the cell rather than bubbling into
the electrolyte. However, it should be noted that this separator placement caused slightly higher
OER potentials (approximately 0.1 V higher) to be observed, possibly due to some oxygen bubbles
becoming stuck between the electrode surface and separator and reducing electrolyte coverage of
the electrode. The distance between the zinc wire reference electrode and gas diffusion electrode
was approximately 2 mm.
The cell depicted in Figure 4.1c was used for electrochemical testing of the thin-layer
electrode. The electrode in this cell was not exposed to the air; oxygen exposure was instead
provided via dissolved oxygen in an oxygen-saturated electrolyte. A magnetic stir bar in the cell
was rotated at 500 rpm to facilitate electrolyte wetting and oxygen transport to the electrode, which
was exposed to the electrolyte through a 1.05 cm diameter opening. As will be discussed in more
detail, this design was mainly employed to avoid time-sensitive potential losses caused by
electrolyte flooding into the gas pores of the thicker gas diffusion electrode. A distance over 1 cm
separated the zinc wire reference electrode and thin-layer electrode in this cell; however, IR-
compensation was employed for polarization experiments using both designs to negate any
associated potential drops in the electrolyte.
4.2.3 Electrochemical Testing
Galvanostatic charge/discharge cycling of the gas diffusion electrode was conducted on a
Neware BTS3000 battery tester, while galvanostatic electrochemical impedance spectroscopy
(EIS) and potentiodynamic polarization experiments were conducted on a Bio-Logic VSP
potentiostat. All potentials herein are reported relative to the zinc wire reference electrode
69
(Zn/ZnO). Several reactions occurred on the air electrodes in each experiment, including ORR and
OER (Equation 4.1), NiOOH reduction and Ni(OH)2 oxidation (Equation 4.2) and nickel metal
oxidation (Equation 4.3). Each reaction and its standard equilibrium potential[247,281] relative to
Zn/ZnO in alkaline electrolyte is provided below.
O2 + 2H2O + 4e− ↔ 4OH−, E° = 1.66 V vs. Zn/ZnO (Equation 4.1)
NiOOH + H2O + e− ↔ Ni(OH)2 + OH−, E° = 1.75 V vs. Zn/ZnO (Equation 4.2)
Ni + 2OH− → Ni(OH)2 + 2e−, E° = 0.54 V vs. Zn/ZnO (Equation 4.3)
Galvanostatic cycling was used to evaluate the rechargeability of the nickel-based gas
diffusion electrode at 10 mA cm-2. The exact test sequence is shown in Table 4.1 and is also
demonstrated graphically in Figure 4.2. Unlike a typical cycling experiment, two-step reduction
(corresponding to battery discharge) and two-step oxidation (battery charge) cycles were employed
to separately evaluate the oxygen reactions (Equation 4.1) and the NiOOH/Ni(OH)2 reactions
(Equation 4.2). This was possible due to the relatively smaller overpotentials of the
NiOOH/Ni(OH)2 reactions, which enabled cut-off potentials used in the first step of the reduction
or oxidation cycle to indicate when these reactions were approximately completed. Since the ORR
potential was never higher than 1.3 V vs. Zn and the OER potential was never lower than 1.95 V
vs. Zn at 10 mA cm-2, cut-off potentials of 1.3 V and 1.95 V vs. Zn were used respectively during
reduction and oxidation to determine the approximate capacity of Equation 4.2. This capacity is
assumed to be proportional to the volume or thickness of the nickel (oxy)hydroxide film in each
70
cycle. Therefore, changes of the NiOOH/Ni(OH)2 capacity could be compared with changes of the
ORR or OER overpotentials to determine if there is a correlation between the film growth and the
electrode’s catalytic performance. After the electrode potential passed these cut-off voltages,
reduction continued for 15 minutes to evaluate the ORR potential or 17 minutes to evaluate the
OER potential. Extra time was allocated to the oxidation step to ensure the Zn counter electrode’s
capacity did not rapidly drop during cycling, since some of the deposition current at the Zn
electrode is lost to hydrogen evolution. While the hydrogen quantity evolved from the Zn electrode
during this step was not quantified, 2 extra minutes was determined to be suitable based on visual
observation that the Zn electrode’s size did substantially change after the cycling procedure.
During the rest steps in this procedure, the gradual recovery of the open circuit potential as shown
in Figure 4.2 can be attributed to the slow rebalancing of the oxygen and/or hydroxide
concentration gradients established during oxidation or reduction steps.[282,283]
Table 4.1. Galvanostatic Cycling Procedure for Nickel-Based Gas Diffusion Electrode.
Step Operation Duration/End Condition Dominant Reaction
1 Rest 5 min
2 Reduction @ 10 mA cm-2 Cut-off @ 1.3 V Eq. 4.2 (forward)
3 Reduction @ 10 mA cm-2 15 min or cut-off @ 0.1 V Eq. 4.1 (forward)
4 Rest 5 min
5 Oxidation @ 10 mA cm-2 Cut-off @ 1.95 V Eq. 4.2 (reverse), Eq. 4.3
6 Oxidation @ 10 mA cm-2 17 min Eq. 4.1 (reverse)
7 Loop to Step 1
71
Figure 4.2. Graphical demonstration of two-step reduction and two-step oxidation cycles and the
dominant reactions occurring at each step.
In the next electrochemical experiment, galvanostatic cycling was employed together with
galvanostatic EIS on the gas diffusion electrode (Table 4.2). This was used to measure changes of
the ohmic resistance of the cell and impedance characteristics of the ORR as cycling progressed.
For each cycle, a 60-minute reduction step at 10 mA cm-2 was used prior to each EIS measurement
to ensure the NiOOH film was fully reduced to Ni(OH)2 and that the air electrode had reached a
stable potential. The galvanostatic EIS measurement was conducted at 10 mA cm-2 with a
frequency range from 100 kHz to 10 mHz and an amplitude of 2 mA cm-2.
72
Table 4.2. Galvanostatic Cycling and EIS Procedure for Nickel-Based Gas Diffusion Electrode.
Step Operation Duration Dominant Reactions
1 Rest 5 min
2 Reduction @ 10 mA cm-2 60 min. Eq. 1 (forward), Eq. 2 (forward)
3 Reduction @ 10 mA cm-2 with EIS ~ 30 min. Eq. 1 (forward)
4 Rest 5 min.
5 Oxidation @ 10 mA cm-2 90 min. Eq. 1 (reverse), Eq. 2 (reverse), Eq. 3
6 Loop to Step 1
Cyclic potentiodynamic polarization experiments were then conducted on the gas diffusion
and thin-layer electrodes according to the protocol outlined in Table 4.3. To evaluate the effect of
(oxy)hydroxide film growth on the ORR kinetics, the polarization curves were recorded after
various cumulative times of oxidation at 2.2 V vs. Zn. Like the previous experiments, multi-step
oxidation and reduction reactions were applied to distinguish the oxygen reactions from the
NiOOH/Ni(OH)2 reactions. An additional galvanostatic reduction step at 1 mA cm-2 with an
appropriate cut-off voltage and a following potentiostatic reduction step at the cut-off voltage were
applied to ensure that NiOOH reduction and any associated capacitive currents[284] were fully
completed prior to recording the ORR polarization curves. IR-correction to the polarization curves
was applied using ohmic resistance measurements at the starting potential and 85% correction to
the applied potentials. The remaining 15% correction was applied to the polarization data
afterwards.
73
Table 4.3. Cyclic Potentiodynamic Polarization Procedure for the Nickel-Based Gas Diffusion
Electrode (GDE) and Thin-Layer Electrode (TLE).
Step Operation Duration/End Condition Dominant Reaction
1 Rest 5 min.
2 Reduction @ 10 mA cm-2 Cut-off @ 1.3 V (GDE),
@ 1.2 V (TLE) Eq. 2 (forward)
3 Reduction @ 1 mA cm-2 Cut-off @ 1.35 V (GDE),
@ 1.325 V (TLE) Eq. 2 (forward)
4
Reduction
@ 1.35 V vs. Zn (GDE),
@ 1.325 V vs. Zn (TLE)
60 min. Eq. 1 (forward), Eq.
2 (forward)
5 IR-corrected potentiodynamic
polarization
1.35 V to 0.875 V
@ 0.25 mV s-1 (GDE),
1.325 V to 0.8 V
@ 0.1 mV s-1 (TLE)
Eq. 1 (forward)
6 Rest 5 min.
7 Oxidation @ 10 mA cm-2 Cut-off @ 1.95 V vs. Zn Eq. 2 (reverse)
8 Oxidation @ 2.2 V vs. Zn Variable duration Eq. 1 (reverse), Eq. 2
(reverse), Eq. 3
9 Loop to Step 1
4.3 Results and Discussion
The morphology of the nickel particles used to fabricate the nickel-based air electrodes are
shown in Figure 4.3a. Carbonyl nickel particles were selected due to their rough texture which
provided a high surface area for catalyst deposition. The Ni/PTFE slurry-deposited side of the
electrode is shown at low magnification in Figure 4.3b, revealing a smooth surface with several
74
micropores allowing for gas diffusion. The higher magnification SEM image in Figure 4.3c shows
the PTFE-bonded nickel particles more clearly. Figure 4.3d,e show the nickel foam morphology
at low and high magnification on the non-slurry side of the electrode. After the Co/Ni nitrate dip-
coating procedure, the NiCo2O4 catalyst particles displayed a nanoflake structure (Figure 4.3f).
Figure 4.3. SEM images of (a) the nickel particle morphology; the Ni/PTFE slurry-deposited
side of the electrode at (b) low magnification and (c) high magnification; the non-slurry side of
the electrode at (d) low magnification, (e) high magnification and (f) high magnification after
deposition of the NiCo2O4 catalyst.
Galvanostatic cycling test results for the gas diffusion electrode are provided in Figure 4.4.
The electrode was subjected to 100 cycles of the test protocol outlined in Table 4.1, with the
potential variations for cycles 1-10, 51-60 and 91-100 shown in Figure 4.4a. The ORR potential
75
at the end of each cycle decreased from 1.24 V to 1.17 V vs. Zn within the first ten cycles, and fell
further to 1.04 V by the end of the 50th cycle. After the 50th cycle, the ORR potential started to
decline more rapidly, and after approximately 75 cycles it consistently fell below the lower cut-
off voltage of 0.1 V vs. Zn. The OER potential displayed fluctuating potentials within each cycle,
which has been previously observed[129,273] and could be explained by the growth and detachment
of oxygen bubbles disrupting the solid/electrolyte interface. However, the OER potentials
remained relatively consistent throughout the 100 cycles. Therefore, the remainder of the
investigation was focused on uncovering the origin(s) of ORR kinetic losses.
Figure 4.4b displays oxidation and reduction transients at various cycle numbers. For the
first reduction and oxidation cycles, the electrode potential quickly attained stable values in the
expected potential ranges for ORR and OER, indicating that very little nickel oxidation had yet
occurred. However, subsequent cycles displayed an initial period of lower overpotentials before a
stabilized ORR or OER potential was established. The profiles for the 10th, 40th and 100th cycles
show that this low-overpotential period became increasingly longer as cycling progressed,
indicating a continual increase of the conversion capacity between Ni(OH)2 and NiOOH. This
demonstrates the importance of using sufficiently long cycles for ORR/OER evaluation of nickel-
based air electrodes, since the NiOOH/Ni(OH)2 conversion reactions must be completed before
measuring the oxygen reaction potentials.
76
Figure 4.4. Galvanostatic cycling (procedure per Table 4.1) for nickel-based gas diffusion
electrode: (a) Galvanostatic cycling potentials, (b) oxidation and reduction transients at different
cycle numbers, (c) NiOOH→Ni(OH)2 and Ni(OH)2→NiOOH conversion capacities with 10-
point adjacent-average smoothed lines, (d) ORR/ OER potentials and average NiOOH/Ni(OH)2
capacity as a function of cycle number.
The capacities of the NiOOH→Ni(OH)2 conversion reaction (measured by the capacity of
the reduction step before the potential fell below 1.3 V vs. Zn) and the Ni(OH)2→NiOOH
conversion reaction (measured by the capacity of the oxidation step before the potential rose above
1.95 V vs. Zn) are shown as a function of cycle number in Figure 4.4c. Both capacity
measurements rose quickly above an assumed initial value of zero during the first 5 cycles, and
then continued to rise almost linearly at a more gradual rate. After the 50th cycle, the measured
77
capacities started to diverge, with the NiOOH→Ni(OH)2 conversion reaction displaying
apparently lower values. This was likely caused by the rapidly decreasing ORR activity, since the
potential above 1.3 V (although mainly attributable to the NiOOH→Ni(OH)2 conversion reaction)
may be partially dictated by the ORR activity. After the 80th cycle, both measured capacities
appeared to reach a maximum, suggesting that Ni (oxy)hydroxide growth stopped at this point.
The ORR and OER potentials observed at the end of each cycle, along with the average measured
NiOOH/Ni(OH)2 capacity during each cycle, are plotted together in Figure 4.4d. Although the
ORR potential decreased and the NiOOH/Ni(OH)2 capacity increased during the 100 cycles, no
direct correlation between the two measurements as a function of cycle number was evident here.
To view morphological changes which may have contributed to the steep drop in ORR
activity, SEM images of the gas diffusion electrode were taken before and after 100 cycles of the
protocol outlined in Table 4.1. Figure 4.5a and Figure 4.5b respectively show the non-slurry and
slurry-deposited side of the electrode before cycling, and Figure 4.5c and Figure 4.5d respectively
show the non-slurry and slurry-deposited side of the electrode after 100 cycles. Before cycling, the
NiCo2O4 catalyst flakes are clearly visible on both sides of the electrode. However, after 100
cycles, both sides of the electrode appeared to be covered by a spongey film and the NiCo2O4
flakes were no longer visible, suggesting the film grew overtop of the catalyst.
78
Figure 4.5. SEM images of the nickel-based gas diffusion electrode: (a) non-slurry side and (b)
slurry-deposited side before cycling; (c) non-slurry side and (d) slurry-deposited side after 100
galvanostatic oxidation/reduction cycles (Table 4.1).
XRD spectra of the electrode surface before cycling and after 10 and 100 cycles were
recorded to try to identify the material phases observed visually in SEM. The largest peaks
observed on all samples were those of metallic nickel (JCPDS # 04-0850), as shown in Figure 4.6.
Smaller peaks corresponding to NiCo2O4 (JCPDS # 20-0781) were also observed on each sample,
and their intensities became progressively smaller after cycling, which is consistent with
observation in Figure 4.5 of the NiCo2O4 catalyst becoming covered by the overlying film.
79
However, diffraction peaks corresponding to the Ni(OH)2 or NiOOH phases which were expected
to constitute the film observed in SEM were not detected. This could be explained by previous
observations that nickel (oxy)hydroxides grown electrochemically have poor crystalline
ordering.[285] After 100 cycles, new peaks corresponding to the metastable ε-Zn(OH)2 phase were
observed. This phase likely resulted from precipitation of the Zn(OH)42- ion from the
electrolyte.[286,287]
Figure 4.6. XRD spectra of the nickel-based gas diffusion electrode surface before cycling and
after 10 and 100 galvanostatic oxidation/reduction cycles (Table 4.1).
To further study the chemical changes of the nickel-based air electrode surface, XPS was
performed before and after 10 and 100 cycles of the protocol outlined in Table 4.1. As shown in
the survey spectra (Figure 4.7a), peaks corresponding to Co, Ni and O (from the NiCo2O4 catalyst)
80
and C and F (from the PTFE binder) were observed before cycling. After cycling, the Co peaks
became progressively weaker while the Ni peaks became stronger especially after 100 cycles.
Peaks corresponding to residual Zn from the ZnO-saturated electrolyte were also present after
cycling. Figure 4.7b shows the evolution of the electrode surface’s elemental composition before
and after cycling. The most important observation was a dramatic reduction of the Co content after
cycling, indicating a reduced presence of the NiCo2O4 catalyst flakes on the surface which is
consistent with the SEM and XRD results. Concurrently, the Ni content increased after 100 cycles,
and would have also increased after 10 cycles if the quantification of residual Zn from the
electrolyte was ignored. This, together, with the progressively increased O content after cycling,
indicates the growth of an oxidized and/or hydrated Ni film overtop of the NiCo2O4 catalyst. The
reduction of C and F were likely caused by the growing Ni-rich film overtop of the PTFE binder.
Also, the fact that the Zn content only slightly increased between 10 to 100 cycles means that it
was unlikely to have played a major role in the severe ORR potential losses observed between
cycles 50 to 70 in Figure 4.4d, even if it had precipitated on the electrode surface during cycling
and not after removal of the electrode from the cell.
81
Figure 4.7. XPS analysis of the nickel-based gas diffusion electrode before and after 10 and 100
galvanostatic oxidation/reduction cycles (Table 4.1): (a) Survey spectra, (b) quantified chemical
composition of electrode surfaces where the error bars represent the uncertainty (one standard
deviation) of the quantified measurement,[288,289] (c) high-resolution deconvoluted Ni 2p spectra,
(d) high-resolution deconvoluted O 1s spectra.
82
The high-resolution XPS spectra of the Ni 2p and O 1s peaks were investigated and
deconvoluted to gain better insight into the chemical state of the Ni-rich film which grew on the
electrode surface after cycling. The Ni 2p spectra, for which only the 2p3/2 spectra were
deconvoluted, are presented in Figure 4.7c. The spectrum recorded before cycling was fitted with
a multiplet envelope of three main peaks and two satellite peaks assigned to NiCo2O4.[290] After 10
cycles, the main peak in the 2p3/2 spectral pattern was noticeably broadened, which was well-fitted
by adding the two major peaks of the multiplet envelope for Ni(OH)2[290] and reducing the main
NiCo2O4 peak intensities. This confirms the growth of a Ni (oxy)hydroxide film (observed as
Ni(OH)2 here, since the electrode was analyzed after the electrochemical reduction steps in Table
4.1) overtop of the NiCo2O4 catalyst in the early cycling stages. The spacing and relative sizes and
shapes of the deconvoluted NiCo2O4 peaks remained largely unchanged in the optimized fitting,
meaning that their chemical states did not appear to be altered after growth of the Ni(OH)2 film.
After 100 cycles, the main peak and satellite peak structures became larger and significantly shifted
to higher binding energies. This spectrum was fitted by adding a main peak around 857 eV
corresponding to NiOOH[291–293] and a new satellite peak around 863 eV, using fixed full width at
half maximum values previously reported for electrochemically prepared γ-NiOOH.[294] The
presence of NiOOH together with Ni(OH)2 after 100 cycles means that the Ni (oxy)hydroxide film
was not fully reduced to Ni(OH)2 after it grew significantly thick, which could mean the film
continued to grow even after its capacity appeared to plateau in Figure 4.4c.
The high-resolution O 1s spectra are shown in Figure 4.7d. The first spectrum before cycling
was deconvoluted into two peaks corresponding to lattice oxides (529.7 eV) and defective oxides
83
(531.3 eV) in the NiCo2O4 catalyst.[290,295,296] After 10 cycles, the low-binding energy peak of the
spectrum decreased while the high-binding energy peak increased, which was fitted by adding a
sharper hydroxide peak at 531.3 eV.[296,297] An additional peak at 532.4 eV corresponding to
physisorbed or intercalated water[298,299] was also necessary to produce an accurate fitting. After
100 cycles, the lattice oxide peak was significantly reduced while the hydroxide and water peaks
were enhanced. An additional higher-binding energy water peak that has been previously noted in
oxyhydroxide compounds[290] was also needed to fit the spectral data. Zn(OH)42- dissolved in this
bound or intercalated water within the nickel (oxy)hydroxide film likely gave rise to the metastable
ε-Zn(OH)2 phase observed in XRD analysis (Figure 4.6). More importantly, intercalated water in
the nickel (oxy)hydroxide film might play a role in preventing mass transfer of oxygen to the
underlying NiCo2O4 catalyst, thus causing reduced ORR kinetics after cycling. Regardless, the
nickel (oxy)hydroxide film observed with SEM and XPS is proposed to be the principal cause of
potential degradation observed during galvanostatic cycling, since it likely increases the resistance
of oxygen diffusion to the NiCo2O4 catalyst.
For deeper electrochemical insight on the increasing ORR overpotentials, galvanostatic
cycling with EIS measurements at a reduction current of 10 mA cm-2 were conducted according to
Table 4.2 on a new gas diffusion electrode. The first important observation is that the ohmic
resistance, indicated by the high-frequency real impedance intercepts (Figure 4.8 inset), did not
substantially increase as cycling progressed. This resistance was 1.3 Ω cm2 during the first cycle
and 2.5 Ω cm2 during the 50th cycle, corresponding to a very minor 12 mV increase of the ohmic
drop at 10 mA cm-2. Therefore, ohmic resistance (within the electrolyte, electrode or current
84
collectors) could not have accounted for the large ORR potential loss observed in Figure 4.4a,b,d.
Secondly, it should be noted that each of the EIS plots in Figure 4.8 begin at an approximate 45°
angle. EIS curves typically begin at a 45° angle for diffusion-limited systems and a 90° angle for
charge transfer-limited systems,[300] meaning that the electrodes studied here were likely limited
by diffusion at 10 mA cm-2. The EIS spectra appeared as two depressed semicircles, especially
visible after higher cycle numbers, which is characteristic of porous electrodes.[301] Similar EIS
spectra for gas diffusion electrodes have previously been modeled by a modified Randles circuit
with one or more finite diffusion elements in series with the charge transfer resistance
term.[251,300,301] Arai et al.[300] determined that, in a carbon-based air electrode, the high-frequency
(leftmost) semicircle was indicative of ionic diffusion resistance while the low-frequency
(rightmost) semicircle was indicative of oxygen diffusion resistance. In this case, the low-
frequency (rightmost) semicircle appeared to experience the most growth as cycling progressed.
This suggests that increased oxygen diffusion resistance was responsible for most of the ORR
potential loss observed in Figure 4.4a,b,d.[301]
85
Figure 4.8. Galvanostatic EIS plots (procedure per Table 4.2) for nickel-based gas diffusion
electrode.
Cyclic potentiodynamic polarization experiments were conducted on the gas diffusion
electrode to directly investigate the role of activation loss (measured by analysis of the Tafel
region) and mass transfer loss (measured by the limiting currents). The IR-corrected ORR
polarization curves, which were measured as part of the procedure outlined in Table 4.3, are
displayed in Figure 4.9a. Figure 4.9b shows the Tafel region of the ORR polarization curves
measured after different cumulative times of oxidation at 2.2 V. Tafel slopes observed for the ORR
on spinel catalysts in alkaline electrolytes have a minimum value of approximately 40 mV dec-
1.[302–304] This is consistent with a theoretical value of 39 mV dec-1 (2.303RT/αF, α=1.5),[305] which
is predicted for the ORR where the second electron-transfer step of the 4-electron pathway is rate-
86
determining.[306] Doubled Tafel slopes are often observed on porous air electrodes due to oxygen
transport limitations within porous aggregates,[243,244,305,307] which would explain the initial value
of 76 mV dec-1 observed in Figure 4.9b. The shift from the normal Tafel slope to the double Tafel
slope likely occurred at a potential above the polarization range.
Figure 4.9. Cyclic potentiodynamic polarization (procedure per Table 4.3) for nickel-based gas
diffusion electrode: (a) Full IR-corrected ORR polarization curves and (b) ORR Tafel plots after
various total oxidation times at 2.2 V, (c) dependence of NiOOH→Ni(OH)2 capacity and ORR
Tafel slope magnitude on the total oxidation time at 2.2 V, (d) dependence of ORR Tafel slope
magnitude on NiOOH→Ni(OH)2 capacity, (e) dependence of limiting ORR current on the
reciprocal of NiOOH→Ni(OH)2 capacity with line of best fit over linear region, (f) ORR
polarization curves before and after oxidation at 2.2 V for 8 h with extrapolation of the Tafel
regions.
87
The first oxidation cycle (oxidized at 10 mA cm-2 until reaching the cut-off of 1.95 V and
skipping step 8 of Table 4.3) and second oxidation cycle (5 min at 2.2 V) caused the
NiOOH/Ni(OH)2 capacity to quickly increase from zero to 1.1 mAh and 1.8 mAh, respectively
(Figure 4.9c). The Tafel slope remained close (79 mV dec-1) to its initial value after 5 min of
charging (Figure 4.9b); however, the recorded current densities shifted negatively, which likely
indicates the transition to a doubled Tafel slope occurred at a higher potential compared to the
initial polarization curve. This could be attributed to the nickel (oxy)hydroxide film growing inside
the pores of the catalyst-coated nickel aggregates, causing increased internal oxygen diffusion
resistance and thus a transition to a doubled Tafel slope at a smaller ORR overpotential.[244] After
greater oxidation time periods, currents in the Tafel region were further reduced. While this is
partially explained by a further negative shift of the Tafel regions, it was also due to increasing
Tafel slope magnitudes which reached nearly 200 mV dec-1 (Figure 4.9b). The dependence of both
the NiOOH/Ni(OH)2 capacity and ORR Tafel slope magnitude on the total oxidation time is shown
in Figure 4.9c. Both values displayed relatively rapid increases within the first 8 h of oxidation at
2.2 V, followed by more gradual increases during the remaining 104 h.
An increasing Tafel slope could be attributed to two different factors, which in turn may be
at least partially attributed to the growing nickel (oxy)hydroxide film. Firstly, if the rate-
determining step of the ORR is changed from the second electron transfer step to the previous step
(between the first and second electron transfers) involving adsorbed superoxide exchange with a
surface hydroxide on the catalyst surface,[306] the theoretical Tafel slope would change from 39
mV dec-1 to 59 mV dec-1 (2.303RT/αF, α=1.0),[305] or an increase of 1.5 times. This may be caused
88
by the increased presence of Ni(OH)2 or NiOOH surfaces, which have relatively slow redox
reaction kinetics to support superoxide exchange.[308] Secondly, the Tafel slope (already presumed
to be doubled due to oxygen transport limitations, as mentioned two paragraphs above) could be
doubled again if both oxygen and ionic transport resistances become significant within the porous
nickel aggregates of the electrode.[244] Ionic transport limitations within the porous aggregates are
expected to occur due to reduced pore sizes between the Ni particles resulting from growth of the
nickel (oxy)hydroxide film. Contributions from both factors would be needed to explain the Tafel
slope increases observed in Figure 4.9b, since the first factor or second factor alone (i.e. only one
of these factors considered together with the already doubled Tafel slope mentioned two
paragraphs above) would result in a maximum Tafel slope of only 118 mV dec-1 (2×2.303RT/αF,
α=1.0) or 158 mV dec-1 (2×2×2.303RT/αF, α=1.5), respectively.[244,305] Figure 4.9d displays the
relationship between the ORR Tafel slope magnitude and the NiOOH/Ni(OH)2 capacity, where a
relatively minor positive dependence is observed within the first 3 mAh of growth followed by an
approximate doubling of the Tafel slope as the NiOOH/Ni(OH)2 capacity approaches its maximum
(limiting) value. The doubling of the Tafel slope during the latter period is consistent with the
explanation of it being caused by significant ionic transport limitations (second factor above); this
is reasoned because ionic transfer limitations are also likely to cause the nickel (oxy)hydroxide
film’s growth to become limited during this period, since hydroxide ions are required for the nickel
oxidation reaction (Equation 4.3) to continue. This leaves the initial Tafel slope increase within
the first 3 mAh of growth to be explained by a change of the rate-determining step (first factor
above).
89
From the analysis in the previous paragraph, it appears likely that the nickel (oxy)hydroxide
film plays a significant role in increasing activation losses of the nickel-based air electrode.
However, it should be noted that the Tafel plots shown in Figure 4.9b do not maintain the same
slope over at least 1 decade of current. This is further shown in Figure 4.10 where, for each
polarization curve, any three consecutive datapoints having a slope that differs by less than 1% of
the measured Tafel slope in Figure 4.9b are indicated by enlargement of the middle of the three
datapoints. Normally, reliable observance of Tafel behaviour requires the same Tafel slope to be
measured across at least one decade of current density.[309] Since the polarization curves begin at
1.35 V vs. Zn, rather than a higher value (due to the prior steps 1-3 shown in Table 4.3 required
to reduce the NiOOH to Ni(OH)2), a less-than-ideal range of the Tafel region was observed in this
work. As shown in Figure 4.10, none of the Tafel plots in Figure 4.9b maintain the same measured
slope (within 1% deviation) for more than one decade of current; mass transfer polarization losses
cause the slope to increase before 1 full decade of current in the Tafel region can be observed.
Therefore, improved measurements of the Tafel regions over 1 decade of current would be needed
to have full confidence in the Tafel slopes discussed above (especially for the slopes measured
beyond 8 h of total oxidation time, where Figure 4.10 makes it evident that mass transfer
polarization losses may have interfered with the Tafel slopes measured between 1.30-1.32 V).
However, as will be discussed in the following paragraphs, mass transfer losses were found to
dominate the polarization losses at the current density of 10 mA cm-2 focused on in this work.
Thus, the activation losses characterized by Tafel slope measurements are not critical to
understanding the main cause of failure shown in Figure 4.4 for the nickel-based air electrode.
90
Figure 4.10. Magnified ORR polarization curves from Figure 4.9a. In these curves, any three
consecutive datapoints having a slope that differs by less than 1% of the measured Tafel slope in
Figure 4.9b are indicated by enlargement of the middle of the three datapoints.
The ORR polarization curves in Figure 4.9a display substantial reductions of the limiting
current as the oxidation time is increased, revealing significantly increased mass transfer losses.
Based on the SEM and XPS observations that the nickel (oxy)hydroxide film grows overtop of the
NiCo2O4 catalyst, increased mass transfer losses are expected since oxygen must diffuse through
an increasingly thicker film before undergoing reduction at the catalyst surface. If the nickel
(oxy)hydroxide film is the dominating source of diffusion resistance, the limiting current will be
inversely proportional to the film’s thickness.[243,310] To confirm this, the limiting current measured
91
at 0.875 V vs. Zn was plotted against the reciprocal of the measured NiOOH/Ni(OH)2 capacity
(which is assumed to be proportional to its thickness) in Figure 4.9e. A linear correlation was
indeed observed at high capacities (low reciprocal values), indicating that the nickel
(oxy)hydroxide film was likely the dominant source of diffusion resistance when it became
significantly thick. At low nickel (oxy)hydroxide thickness (high reciprocal capacity), deviation
of the measured limiting currents from the linear pattern indicates that the porous
PTFE/electrolyte/gas network in the air electrode (schematically shown in Figure 4.1a) was the
initial dominant source of diffusion resistance.
Figure 4.9f compares the ORR polarization curves before oxidation (initial) and after 8 h of
oxidation, including dashed lines for extrapolation of the Tafel slopes. This enables a comparison
of the relative contributions of activation and mass transfer overpotential at different current
densities. At 10 mA cm-2, which was the current density for the galvanostatic oxidation/reduction
experiments (Figure 4.4), mass transfer losses are the more significant source of overpotential
after 8 h. After longer oxidation times, mass transfer losses are even more significant. Therefore,
the rapid potential loss observed after 50 cycles in Figure 4.4d likely occurred when the limiting
current approached and fell below 10 mA cm-2. Even for shorter oxidation times, mass transfer
losses were always responsible for at least 65% of the total potential loss from the initial
performance at 10 mA cm-2, indicating the high significance of performance degradation caused
by the nickel (oxy)hydroxide film growing overtop of the catalyst.
Although the linear portion of Figure 4.9e strongly suggested that the nickel (oxy)hydroxide
film was the dominate source of mass transfer losses, other time-dependent sources such as
92
electrolyte flooding into the gas diffusion channels or carbonate precipitation within the electrode
pores could potentially contribute to diffusion resistance. Therefore, a similar experiment using a
thin-layer electrode and the cell shown in Figure 4.1c was performed to further investigate mass
transfer losses. The thin-layer electrode (150 µm thick) minimizes the importance of through-
thickness oxygen diffusion in comparison to the relatively thick (1000 µm) gas diffusion electrode.
Also, the only source of oxygen in this cell is dissolved in the electrolyte (i.e. no gas phase oxygen),
meaning that mass transfer losses caused by electrolyte flooding into gas channels is not
applicable. Moreover, since the oxygen and water reactants arrive from the same side of the
electrode in this case, the ORR should be concentrated on the surface of the thin-layer electrode,
which further minimizes the importance of through-thickness oxygen diffusion. Finally, the large
volume of circulating electrolyte means that carbonates are unlikely to precipitate inside the
electrode pores. Therefore, if the same relationship between limiting current and reciprocal
NiOOH/Ni(OH)2 capacity is observed in this experiment, mass transfer losses can be more
definitively attributed to oxygen diffusion limitations through the nickel (oxy)hydroxide film.
Figure 4.11a shows the ORR polarization curves for the thin-layer electrode after various
cumulative times of oxidation at 2.2 V vs. Zn. Much smaller limiting currents were observed in
comparison to the gas diffusion electrode, highlighting the importance of exposure to the oxygen
gas phase. It should be noted that Tafel slopes could not be measured from most of these curves
since mass transfer losses appeared to dominate even at low overpotentials. Despite the much
lower limiting currents, a similar trend of decreasing limiting currents with higher oxidation times
was seen, while the inset of Figure 4.11b shows a similar relationship between the
93
NiOOH/Ni(OH)2 capacity and total oxidation time. Most importantly, Figure 4.11b displays the
same linear correlation between the limiting current and reciprocal of the NiOOH/Ni(OH)2
capacity at high capacity values. The deviation of limiting currents from the linear pattern at low
capacity values means that, in this case, the diffusion of dissolved oxygen through the electrolyte
was the limiting factor prior to significant growth of the nickel (oxy)hydroxide film. Since other
possible sources of mass transfer loss in the gas diffusion electrode can be ruled out in this
experiment, the same relationships observed in Figure 4.9e and Figure 4.11b points to the nickel
(oxy)hydroxide film as the most significant source of mass transfer losses in both electrodes. Since
the nickel (oxy)hydroxide film grows most rapidly at high potentials (i.e. during OER or charging
of a zinc-air battery), the majority of voltage loss in each cycling experiment was likely dictated
by total charging time at a given potential and not by other cycling parameters such as the depth
of discharge.
Figure 4.11. Cyclic potentiodynamic polarization (procedure per Table 4.3) for nickel-based
thin-layer electrode: (a) Full IR-corrected ORR polarization curves, (b) dependence of limiting
ORR current on the reciprocal of NiOOH→Ni(OH)2 capacity with line of best fit over linear
region (inset: dependence of NiOOH→Ni(OH)2 capacity on the total oxidation time at 2.2 V).
94
To summarize, the ORR potential losses observed during cycling of the nickel-based air
electrode investigated in this work were caused by a combination of activation and mass transfer
losses. Both losses were mainly attributed to the growth of the nickel (oxy)hydroxide film, which
is shown schematically for an aggregate of catalyst-coated nickel particles in Figure 4.12 (actual
aggregates could potentially be much more than 8 particles as shown here). Activation losses were
associated with a steeper and negatively-shifted Tafel slope, which are caused by increased
resistance to oxygen and ionic transport within the aggregate due to film growth inside the pores
between the particles. The increased Tafel slope was also attributed to rate limitations of the
adsorbed superoxide exchange step in the ORR mechanism, which might also be influenced by
nickel (oxy)hydroxide film growth. Mass transfer losses were caused by increased oxygen
transport resistance from the gas diffusion channels to the inside of the aggregate due to the nickel
(oxy)hydroxide film growth on the outer nickel surfaces. At 10 mA cm-2, mass transfer losses were
the dominant source of ORR overpotential. These findings are applicable not only to nickel-
supported catalysts, but to any catalyst system involving a metal component where an oxidation
film could grow from its surface and block a nearby catalyst site (possibly the metal itself) from
access to reactants.
95
Figure 4.12. Schematic representation of an electrolyte-flooded agglomerate of catalyst-coated
nickel particles. The nickel oxy(hydroxide) film growth resulting from prolonged oxidation
causes increased oxygen and ionic transport resistance within the aggregate and increased
oxygen transport resistance from the outside to the inside of the aggregate.
The results of this investigation have important implications for the design of nickel-based
bifunctional air electrodes with improved stability, as well as air electrodes based on other porous
networks of metals which may form passivating films. Firstly, the size of the nickel particle
aggregates should be reduced; this would shorten the diffusion lengths within the aggregate and
mitigate the activation losses from higher effective diffusion coefficients arising from film growth
within the aggregate. This could be accomplished by improving the dispersion of nickel and PTFE
to minimize nickel particle aggregation during electrode preparation.[311] While the influence of
the nickel particle size itself is not clear, it is suspected that the use of larger particles could help
minimize aggregation, although larger particles could also result in a significantly lower surface
area for catalyst deposition. For mitigating mass transfer losses, the deposited catalyst could be
96
engineered with a high aspect ratio (e.g. nanowire morphology[225,277]) such that it extends far
enough from the nickel support to maintain direct exposure to the electrolyte/gas phase after the
passivating film growth begins to slow down. Alternatively, a physical mixture of nickel and
catalyst particles (rather than catalyst-coated nickel particles employed in this work) could provide
greater separation between the two materials, thus avoiding total (oxy)hydroxide film coverage of
the catalyst. However, this could lead to significant ohmic resistance losses if the (oxy)hydroxide
film grows between the nickel and catalyst particles. In this case, incorporating a small amount of
non-film-forming conductive additives (i.e. carbon or graphite) in the air electrode to maintain
electron-conductive interfaces[274] may be beneficial, if the relatively minor carbonate generation
from the corrosion of the distributed carbon is tolerable. Finally, it may be possible to completely
replace metal supports with metal oxide/hydroxide supports if their conductivity could be
sufficiently increased,[312,313] since the growth of oxidation films would not apply in this case.
Certainly, the rechargeability of carbon-free or low-carbon air electrodes can be greatly improved
by optimizing these structural and compositional factors.
4.4 Conclusions
In this work, the nature and underlying mechanism of nickel-based air electrode performance
loss was investigated within rechargeable zinc-air batteries. It was shown that increased ORR
overpotential after extended battery cycling was caused by a combination of activation and mass
transfer losses, with the latter more significant at a current density of 10 mA cm-2. Electron
97
microscopy and X-ray photoelectron spectroscopy revealed the growth of a nickel (oxy)hydroxide
film overtop of the NiCo2O4 catalyst, which impeded oxygen diffusion and was the dominant
source of mass transfer losses after it grew significantly thick. Nickel (oxy)hydroxide film growth
within the pores of the catalyst-coated nickel particle aggregates also likely contributed to higher
activation losses evidenced by steeper and negatively-shifted Tafel slopes. The diagnostic methods
in this work shed light on various strategies for mitigating performance loss caused by the
(oxy)hydroxide film growth. Implementing these strategies could lead to high-energy density
rechargeable zinc-air batteries with long cycle life and calendar life.
98
Chapter 5: Design and Feasibility of Thin Nickel Foam-Based
Air Electrodes for Rechargeable Zinc-Air Batteries
5.1 Introduction
In the previous chapter, it was shown that oxidation of nickel metal supports for nickel-based
air electrodes is an important factor contributing to the degradation of their ORR activity,
particularly when the nickel (oxy)hydroxide film grows overtop of the adhered catalyst. Therefore,
to improve the performance of nickel-based air electrodes, electrode designs which can reduce
metal oxidation or catalyst structures which can withstand the growth of the nickel (oxy)hydroxide
film should be explored. In addition, the mass and thickness of such nickel-based air electrodes
should be minimized if they are to succeed in energy-dense rechargeable zinc-air batteries. For
instance, the areal mass and thickness of the nickel-based air electrode reported by Price and
coworkers[129,256,273] were about 195 mg cm-2 and 1.0 mm, while those reported by Armstrong[258]
were about 122 mg cm-2 and 0.71 mm, respectively. By comparison, carbon felts and papers used
for carbon-based air electrodes have areal masses ranging from 4-70 mg cm-2 with thicknesses less
than 0.5 mm.[314,315]
Unlike the nickel-based air electrode investigated in Chapter 4, the nickel metal substrate
(sintered nickel plaque with 85% porosity) employed by Armstrong was not loaded with a nickel
powder/PTFE slurry before dip-coating. To achieve hydrophobicity, the electrode was either
soaked with PTFE emulsion after calcining the dip-coated nickel/cobalt nitrates to nickel/cobalt
99
oxide, or it was dip-coated in an aqueous mixture of cobalt/nickel nitrate and PTFE particles, which
were then calcined/heat-treated together. The latter method was found to result in improved
electrochemical performance of the bifunctional air electrode.
It is worthwhile to explore whether the method of co-dip-coating cobalt/nickel nitrates and
PTFE particles could also be used to coat a bare nickel foam substrate rather than nickel foam pre-
loaded with nickel powder and PTFE. Since nickel foam has an areal mass comparable to carbon
papers and felts, such an electrode would be less heavy than the previously investigated nickel-
based air electrodes. The nickel foam can also be compressed to a lower thickness prior to dip-
coating to produce a thin air electrode that could be practically used in an energy-dense
rechargeable zinc-air battery. Also, since a lower ratio of nickel metal to catalyst particles in the
electrode can be achieved by eliminating nickel metal powder, less growth and lower interference
of the nickel (oxy)hydroxide film with the catalyst is hypothesized. Therefore, this work
investigates nickel foam pre-compressed to a thickness of about 0.2 mm and loaded with a mixed
cobalt or nickel/cobalt oxide and PTFE coating, herein referred to as thin nickel-foam based air
electrodes.
5.2 Experimental Methods
Commercially available nickel foam (110 pores per inch, 35 mg cm-2, 1.6 mm thick), 60
wt.% PTFE emulsion (Sigma Aldrich, product #665800), cobalt (II) nitrate hexahydrate (Alfa
Aesar, product #11341A1) and nickel (II) nitrate hexahydrate (Sigma Aldrich, product #72253)
were used for fabrication of the air electrode. Morphological characterizations were conducted
100
with a Zeiss UltraPlus field emission SEM and XRD analyses were completed on a MiniFlex 600
Rigaku instrument.
The thin nickel foam-based air electrode was prepared from which. The nickel foam, which
acted as both the catalyst support and current collector, was cut into the desired size and then
compressed down to a thickness of approximately 0.2 mm with fixed-width rollers. After rinsing
in ethanol and air-drying, the nickel foam was first dip-coated in various precursor mixtures
containing suspended PTFE particles and dissolved cobalt nitrate (or nickel/cobalt nitrate). Dip-
coating was accomplished by immersing the nickel foam in the precursor solution for 5 minutes,
followed by drying in a non-convective oven at 75 °C for approximately 15 minutes, resulting in
a mixed coating of PTFE and cobalt nitrate (or nickel/cobalt nitrate) adhered on the nickel foam.
The cobalt (or nickel/cobalt nitrates) were converted to the spinel oxide phase (Co3O4 or NiCo2O4)
by calcining in an air atmosphere for various temperatures and times. Prior to calcination, some
electrodes were also subjected to a pre-heat-treatment step at 125 °C in an air atmosphere, usually
for 16 hours. After calcination, the electrodes were soaked in PTFE emulsion with various
concentrations, dried at 75 °C for approximately 15 minutes, and then subjected to a heat-treatment
in air at the same temperature as the prior calcination, resulting in an outer PTFE-coating. Specific
details and parameters of each preparation step are shown in Table 5.1. As indicated by the
“Dip/pre-heat-treat/calcine sequence” column, some electrodes were subjected to dipping, pre-
heating and calcination three times prior to the outer PTFE-coating step (denoted as “3 dip/pre-
heat/calcine”), and other electrodes were subjected to dipping and pre-heating three times prior to
the calcination step (denoted as “3 dip/pre-heat, 1 calcine”).
101
Table 5.1. Preparation parameters for the investigated thin nickel foam-based air electrodes
(*indicates that the pre-heat-treatments after the first two dipping steps were carried out for only
4 hours).
Elec-
trode
#
Precursor mixture
for electrode
dipping
Pre-heat-
treat temp
/time
Calcin-
ation
temp/
time
Dip/pre-heat-
treat/calcine
sequence
PTFE
concentration
for outer
PTFE-coating
Heat-treatment
temp/time after
PTFE soaking
1 2.75 mol l-1 Co(NO3)2
+ 80 mg l-1 PTFE -
250 °C /
4 hours 1 dip/calcine 15 wt.% 250 °C / 5 min
2 2.75 mol l-1 Co(NO3)2
+ 80 mg l-1 PTFE -
250 °C /
4 hours 1 dip/calcine 15 wt.% 250 °C / 1 h
3 2.75 mol l-1 Co(NO3)2
+ 80 mg l-1 PTFE -
300 °C /
2 hours 1 dip/calcine 15 wt.% 300 °C / 5 min
4 2.75 mol l-1 Co(NO3)2
+ 80 mg l-1 PTFE -
300 °C /
2 hours 1 dip/calcine 15 wt.% 300 °C / 1 h
5 2.75 mol l-1 Co(NO3)2
+ 80 mg l-1 PTFE
125 °C /
16 hours
250 °C /
4 hours
1 dip/pre-heat/
calcine 15 wt.% 250 °C / 5 min
6 2.75 mol l-1 Co(NO3)2
+ 80 mg l-1 PTFE
125 °C /
16 hours
250 °C /
4 hours
1 dip/pre-heat/
calcine 15 wt.% 250 °C / 1 h
7 2.75 mol l-1 Co(NO3)2
+ 80 mg l-1 PTFE
125 °C /
16 hours
300 °C /
2 hours
1 dip/pre-heat/
calcine 15 wt.% 300 °C / 5 min
8 2.75 mol l-1 Co(NO3)2
+ 80 mg l-1 PTFE
125 °C /
16 hours
300 °C /
2 hours
1 dip/pre-heat/
calcine 15 wt.% 300 °C / 1 h
9 2.0 mol l-1 Co(NO3)2
+ 80 mg l-1 PTFE
125 °C /
16 hours
250 °C /
4 hours
1 dip/pre-heat/
calcine 15 wt.% 250 °C / 1 h
10 3.5 mol l-1 Co(NO3)2
+ 80 mg l-1 PTFE
125 °C /
16 hours
250 °C /
4 hours
1 dip/pre-heat/
calcine 15 wt.% 250 °C / 1 h
11 2.75 mol l-1 Co(NO3)2
+ 80 mg l-1 PTFE
125 °C /
16 hours
250 °C /
4 hours
3 dip/pre-heat/
calcine 15 wt.% 250 °C / 1 h
12 2.0 mol l-1 Co(NO3)2
+ 80 mg l-1 PTFE
125 °C /
16 hours
250 °C /
4 hours
3 dip/pre-heat/
calcine 15 wt.% 250 °C / 1 h
13 3.5 mol l-1 Co(NO3)2
+ 80 mg l-1 PTFE
125 °C /
16 hours
250 °C /
4 hours
3 dip/pre-heat/
calcine 15 wt.% 250 °C / 1 h
14 2.75 mol l-1 Co(NO3)2
+ 80 mg l-1 PTFE
125 °C /
16 hours
250 °C /
4 hours
3 dip/pre-heat,
1 calcine 15 wt.% 250 °C / 1 h
15 2.0 mol l-1 Co(NO3)2
+ 80 mg l-1 PTFE
125 °C /
16 hours
250 °C /
4 hours
3 dip/pre-heat,
1 calcine 15 wt.% 250 °C / 1 h
16 3.5 mol l-1 Co(NO3)2
+ 80 mg l-1 PTFE
125 °C /
16 hours
250 °C /
4 hours
3 dip/pre-heat,
1 calcine 15 wt.% 250 °C / 1 h
17 2.0 mol l-1 Co(NO3)2
+ 80 mg l-1 PTFE
125 °C /
16 hours
250 °C /
4 hours
3 dip/pre-heat*,
1 calcine 30 wt.% 250 °C / 1 h
18
1.33 mol l-1 Co(NO3)2
+ 0.67 mol l-1
Ni(NO3)2
+ 80 mg l-1 PTFE
125 °C /
16 hours 250 °C /
4 hours 3 dip/pre-heat*,
1 calcine 30 wt.% 250 °C / 1 h
102
All electrochemical testing was conducted using the same cell design as described in Section
4.2.2 and shown in Figure 4.1b. Galvanostatic cycling was conducted at various current densities
using the same “two-step” oxidation and reduction procedure from Chapter 4 in order to allow
the NiOOH/Ni(OH)2 reactions to complete and track their capacities before each subsequent
reduction (ORR) or oxidation (OER) step, as shown in Table 5.2-Table 5.4. To help determine
which preparation parameters in Table 5.1 were important, analysis of variance (ANOVA) and t-
tests of the electrode’s initial ORR potentials and cycle-lives were completed using “Real Statistics
Resource Pack” with Microsoft Excel.
Table 5.2. Galvanostatic cycling procedure at 10 mA cm-2 for thin nickel foam-based electrode.
Step Operation Duration/End Condition Dominant Reaction
1 Rest 1 min
2 Reduction @ 10 mA cm-2 Cut-off @ 1.3 V Eq. 4.2 (forward)
3 Reduction @ 10 mA cm-2 15 min Eq. 4.1 (forward)
4 Rest 1 min
5 Oxidation @ 10 mA cm-2 Cut-off @ 1.95 V Eq. 4.2 (reverse), Eq. 4.3
6 Oxidation @ 10 mA cm-2 17 min Eq. 4.3 (reverse)
7 Loop to Step 2
103
Table 5.3. Galvanostatic cycling procedure at 20 mA cm-2 for thin nickel foam-based electrode.
Step 4 was added to additionally monitor the ORR potential at 10 mA cm-2 during cycling.
Step Operation Duration/End Condition Dominant Reaction
1 Rest 1 min
2 Reduction @ 20 mA cm-2 Cut-off @ 1.25 V Eq. 4.2 (forward)
3 Reduction @ 20 mA cm-2 15 min Eq. 4.1 (forward)
4 Reduction @ 10 mA cm-2 1 min Eq. 4.1 (forward)
5 Rest 1 min
6 Oxidation @ 20 mA cm-2 Cut-off @ 2.0 V Eq. 4.2 (reverse), Eq. 4.3
7 Oxidation @ 20 mA cm-2 19 min Eq. 4.3 (reverse)
8 Loop to Step 2
Table 5.4. Galvanostatic cycling procedure at 50 mA cm-2 for thin nickel foam-based electrode.
Steps 4 and 5 were added to additionally monitor the ORR potentials at 10 mA cm-2 and 20 mA
cm-2 during cycling.
Step Operation Duration/End Condition Dominant Reaction
1 Rest 1 min
2 Reduction @ 50 mA cm-2 Cut-off @ 1.20 V Eq. 4.2 (forward)
3 Reduction @ 50 mA cm-2 15 min Eq. 4.1 (forward)
4 Reduction @ 20 mA cm-2 1 min Eq. 4.1 (forward)
5 Reduction @ 10 mA cm-2 1 min Eq. 4.1 (forward)
6 Rest 1 min
7 Oxidation @ 50 mA cm-2 Cut-off @ 2.05 V Eq. 4.2 (reverse), Eq. 4.3
8 Oxidation @ 50 mA cm-2 19 min Eq. 4.3 (reverse)
9 Loop to Step 2
104
5.3 Results and Discussion
5.3.1 Physical Characterization
The morphologies of the thin nickel foam-based air electrode after calcination and after
applying the outer PTFE-coating are displayed in Figure 5.1 As will be shown later, this specific
electrode design (Electrode #17 in Table 5.1) resulted in the highest cycle-life and is therefore
used as the basis for the following physical and crystallographic analyses. The as-calcined
electrode displays a rough texture across the surface of the nickel foam struts (Figure 5.1a), and
upon examination at higher magnifications (Figure 5.1c,e) is revealed to be uniformly coated by
sisal-like structures. After applying the outer-PTFE coating, the nickel foam struts have a more
smooth appearance (Figure 5.1b) due to the mostly-continuous layer of PTFE observed at higher
magnifications (Figure 5.1d,f). However, the tips of the sisal-like structures can still be observed
protruding through the outer PTFE layer across various locations of the electrode in Figure 5.1d,f.
The texture of the PTFE layer in Figure 5.1f is consistent with that of previously reported annealed
PTFE film samples.[316] It should also be noted that, as expected, the electrode surface becomes
highly water-repellant after applying the outer PTFE-coating due to the hydrophobic property of
PTFE.
Figure 5.2 displays a sequence of even higher magnification SEM images exhibiting the
morphological evolution of the constituents on the nickel foam surface after various stages of
preparation, and Figure 5.3 displays corresponding diffraction patterns. After dipping the thin
nickel foam in the cobalt nitrate/PTFE precursor mixture and drying at 75 °C, sharp crystals are
105
Figure 5.1. SEM images of thin nickel-foam based air electrode (Electrode #17 in Table 5.1):
(a,c,e) calcined electrode and (b,d,f) calcined electrode with outer PTFE-coating. (a,b) 100 X
magnification; (c,d) 1000X magnification; (d,e) 10,000X magnification.
106
observed on the foam surface (Figure 5.2a). These crystals were assumed to have resulted from
the precipitation of dissolved cobalt nitrate upon evaporation of water during drying. The
associated diffraction pattern after drying at 75 °C (Figure 5.3a) displays a large number of peaks
ranging from approximately 7 to 43 degrees. Hydrated cobalt nitrates often similarly display a high
density of diffraction peaks[317,318]; however, the diffraction pattern in Figure 5.3a could not be
indexed to any hydrated cobalt nitrate pattern references, perhaps because the intermixed PTFE
particles could change the facets of the typical hydrated cobalt nitrate crystal structure.
Figure 5.2b shows the Co(NO3)2/PTFE-dipped electrode after the 16-hour pre-heat-
treatment at 125 °C. A much smoother surface is observed after this pre-heat-treatment, likely due
to the melting and partial dehydration/decomposition[317,319] of the hydrated cobalt nitrate resulting
in a more compact coating. The associated diffraction pattern in Figure 5.3b shows a reduced
number of crystal facets likely due to the partial dehydration/decomposition of the cobalt nitrate,
but once again it could not be indexed to any cobalt nitrate pattern references. The compacted
coating is suspected to be beneficial to the electrode’s stability by providing better protection of
the underlying nickel metal struts from oxidation by the electrolyte. Figure 5.2c shows a higher-
magnification image of the same sample, highlighting the presence of small particles likely
corresponding to PTFE due to their similar size and morphology to previously reported images of
PTFE particles.[316,320] This is also consistent with the existence of a diffraction peak at 17 degrees
in Figure 5.3b corresponding to PTFE.
The SEM images in Figure 5.2d,e show the aforementioned sisal-like structure at higher
magnification that is formed after calcining the electrode at 250 °C, while the diffraction pattern
107
in Figure 5.3c shows the added presence of Co3O4-indexed peaks, confirming that the cobalt
nitrate coating is converted to cobalt oxide. The higher-magnification image in Figure 5.2d,e also
highlights that the PTFE particles remain in place after calcination and are well-dispersed around
the branches of the sisal-like cobalt oxide. This could be beneficial to the mechanical stability of
the cobalt oxide branches during electrochemical cycling, especially during high-current OER
where oxygen bubbles are rapidly evolved from the oxide surface, due to the binding property of
PTFE. The partial coverage of the cobalt oxide branches by PTFE particles could also provide
ample three-phase interfaces between the oxide, electrolyte and oxygen during ORR due to the
hydrophobic function of PTFE. It is also interesting to note that previous reporters of sisal-like
cobalt oxides[321,322] employed more complicated synthesis routes than the simple dip-coating
method employed here.
Figure 5.2f finally shows the thin nickel foam surface after applying the outer-PTFE layer,
and the associated diffraction pattern in Figure 5.3e predictably shows a more intense peak
corresponding to PTFE. Unlike Figure 5.1f, this region of the PTFE-coating contains a relatively
large hole around a cobalt oxide branch. While the purpose of the outer PTFE-coating is to prevent
over-flooding of the electrolyte throughout the entire pore volume of the nickel foam, it is
speculated that these holes could allow a thin film of electrolyte to travel underneath the outer
PTFE layer, providing necessary contact with the cobalt oxide branches. However, the electrolyte
could also possibly contact the tips of the branches which protrude through the outer PTFE layer.
108
Figure 5.2. SEM images of the thin nickel foam-based air electrode after various stages of
preparation: (a) after dipping in Co(NO3)2/PTFE mixture (2.0 mol l-1 Co(NO3)2 + 80 mg l-1
PTFE) and drying at 75 °C for 15 minutes; (b,c) after subjecting Co(NO3)2/PTFE-dipped
electrode to pre-heat-treatment at 125 °C for 16 hours; (d,e) after subjecting Co(NO3)2/PTFE-
dipped and pre-heat-treated electrode (3 dip/pre-heat-treatment cycles) to calcination at 250 °C
for 4 hours; (f) after soaking calcined electrode from (d,e) in 30 wt.% PTFE emulsion, drying at
75 °C for 15 minutes, and heat-treating at 250 °C for 1 hour. (a,b,d,f) 20,000X magnification;
(c,e) 50,000X magnification, with blue arrows highlighting the existence of PTFE particles.
109
Figure 5.3. XRD spectra of the nickel foam-based air electrode after various stages of
preparation: (a) after dipping in Co(NO3)2/PTFE mixture (2.0 mol l-1 Co(NO3)2 + 80 mg l-1
PTFE) and drying at 75 °C for 15 minutes; (b) after subjecting Co(NO3)2/PTFE-dipped electrode
to pre-heat-treatment at 125 °C for 16 hours; (c) after subjecting Co(NO3)2/PTFE-dipped and
pre-heat-treated electrode (3 dip/pre-heat-treatment cycles) to calcination at 250 °C for 4 hours;
(d) after subjecting [Ni1/3Co2/3](NO3)2/PTFE-dipped and pre-heat-treated electrode (3 dip/pre-
heat-treat cycles, equivalent total nitrate and PTFE concentration as (a-c)) to calcination at 250
°C for 4 hours; (e) after soaking calcined electrode from (c) in 30 wt.% PTFE emulsion, drying
at 75 °C for 15 minutes, and heat-treating at 250 °C for 1 hour.
110
Figure 5.4 shows an equivalently prepared as-calcined electrode which was dipped in a
mixture of nickel and cobalt nitrate (1.33 mol l-1 Co(NO3)2 + 0.67 mol l-1 Ni(NO3)2) with PTFE
instead of only cobalt nitrate and PTFE. While the left-shifted spinel diffraction peaks in Figure
5.3d indicate the formation of NiCo2O4, the sisal-like oxide morphology was not observed on this
electrode, which instead displayed a more flat and cracked structure. Cracks could perhaps form
due to stress buildup if the cobalt and nickel nitrate ions precipitate at different rates during drying,
or if cobalt and nickel nitrates decompose at different rates during the pre-heat-treatment or
calcination steps. A previous report[323] also showed considerably different morphologies between
calcined Co3O4 and NiCo2O4 nanostructures.
Figure 5.4. SEM images of [Ni1/3Co2/3](NO3)2/PTFE-dipped and pre-heat-treated electrode (3
dip/pre-heat-treat cycles, 1.33 mol l-1 Co(NO3)2 + 0.67 mol l-1 Ni(NO3)2 + 80 mg l-1 PTFE) after
calcination at 250 °C for 4 hours: (a) 1000X magnification; (b) 10,000X magnification.
Table 5.5 shows some basic physical properties of the developed thin nickel foam-based air
electrode. Typical values for the nickel-based air electrode investigated in Chapter 4 (hereafter
referred to as the thick nickel-based air electrode) are also shown for comparison. The
111
approximately four-times thinner and over four-times lighter electrode developed here is much
better suited to an energy-dense zinc-air battery configuration, since there would be far less
“wasted” mass and thickness on a component which does not itself provide electrochemical
capacity. The Co3O4 or NiCo2O4 loading of the thin nickel foam-based electrode, despite
undergoing three dip-coat cycles rather than only one for the thick nickel-based air electrode, is
slightly lower than the NiCo2O4 loading on the thick nickel-based air electrode. This is likely due
to the higher surface area of the pre-dipped thick nickel-based air electrode, which unlike the
present electrode, was loaded with nickel powder. The thin nickel foam-based electrode also has
over six times less PTFE than the thick nickel-based electrode, which (along with the complete
absence of nickel powder) should substantially lower the material costs for the former. The absence
of a nickel powder slurry also means that the manufacturing cost of large-scale fabrication of the
thin nickel foam-based air electrode should be lower due, since slurry mixing and slurry pasting
equipment is not needed.
112
Table 5.5. Basic physical properties of the thin nickel foam-based air electrode (Electrode #17 in
Table 5.1) compared to the thick nickel-based air electrode from Chapter 4. Loadings were
calculated by mass change measurements.
Thin nickel foam-based air
electrode (Co3O4-loaded)
Thin nickel
foam-based
air electrode
(NiCo2O4-
loaded)
Thick
nickel-based
air electrode
(NiCo2O4-
loaded)
Sample
1
Sample
2
Sample
3
Aver-
age
Approximate
Thickness (mm) 0.25 0.25 0.25 0.25 0.25 1.0
Areal Mass (mg cm-2) 47.38 48.95 51.33 49.22 46.00 237.45
Co3O4 or NiCo2O4
loading (mg cm-2) 8.02 8.60 8.85 8.49 7.12 10.47
Inner PTFE
(intermixed with
Co3O4 or NiCo2O4)
loading (mg cm-2)
4.00 4.29 4.42 4.24 3.56 -
Outer PTFE loading
(mg cm-2) 3.82 4.14 5.41 4.46 4.14 -
Total PTFE
(mg cm-2) 7.82 8.43 9.83 8.70 7.70 57.20
113
5.3.2 Electrochemical Cycling Evaluation
The galvanostatic cycling performance of the NiCo2O4-loaded thin nickel foam electrode
(Electrode #18 in Table 5.1) is evaluated here first at 10 mA cm-2 in order to provide a direct
comparison to the thick nickel-based air electrode from Chapter 4:. The galvanostatic cycling
potentials over time are shown in Figure 5.5a. The initial ORR potential at 10 mA cm-2 for the
thin nickel foam electrode was over 1.25 V vs. Zn, which was slightly higher than the thick nickel
electrode (1.24 V vs. Zn, Figure 4.4a). The OER potential at 10 mA cm-2 was also slightly lower
for the thin nickel foam electrode, remaining below 2.05 V vs. Zn during the entire cycling
experiment. Moreover, no within-cycle fluctuations of the OER potential (as was shown for the
thick nickel-based electrode in Figure 4.4a,b) were observed for the thin nickel foam electrode,
which could be explained by the electrode’s larger porosity which avoids trapping evolved oxygen.
In Figure 5.5b it is seen that the NiOOH/Ni(OH)2 capacity of the thin nickel foam air
electrode grows larger as the cycle number increases, showing that the underlying nickel metal
foam is progressively oxidized to nickel hydroxide which subsequently oxidizes and reduces
between NiOOH and Ni(OH)2. However, the capacity growth on the thick nickel-based air
electrode was considerably faster than that of the thin nickel foam-based air electrode; for instance,
after 80 cycles, the NiOOH/Ni(OH)2 capacity of the former grew to approximately 4 mAh (Figure
4.4c), compared to only 1.7 mAh for the latter (Figure 5.5b). This likely helps to explain why the
thin nickel foam electrode withstood over three times more charge-discharge cycles than the thick
nickel-based electrode, lasting 187 charge-discharge cycles with an ORR voltage higher than 1.0
V vs. Zn at 10 mA cm-2 (Figure 5.5c).
114
If the same failure mechanism (Figure 4.12) applies to both types of electrodes, the thin
nickel foam electrode likely can withstand more charge/discharge cycles because only the nickel
metal foam struts grow a nickel (oxy)hydroxide film, as compared to both the nickel metal powder
particles and nickel metal struts in the thick nickel-based electrode. Also, while the total catalyst
loading is relatively similar on both electrodes (Table 5.5), the catalyst is dispersed across a much
lower surface area on the thin nickel foam electrode (i.e. only across the nickel struts, whereas the
catalyst is dispersed across both the nickel metal struts and nickel powder particles for the thick
nickel-based electrode). This means that the catalyst layer thickness on the thin nickel foam-based
electrode is likely significantly thicker than that on the thick nickel-based electrode, meaning that
the underlying nickel metal is better protected from oxidation and also that a growing
(oxy)hydroxide layer will require a longer time to completely grow overtop of the catalyst
particles.
115
Figure 5.5. Galvanostatic cycling at 10 mA cm-2 (procedure per Table 5.2) for thin-nickel foam-
based air electrode with NiCo2O4 catalyst (Electrode #18 in Table 5.1): (a) Galvanostatic cycling
potentials; (b) NiOOH→Ni(OH)2 and Ni(OH)2→NiOOH conversion capacities with 10-point
adjacent-average smoothed lines; (c) ORR/ OER potentials and average NiOOH/Ni(OH)2
capacity as a function of cycle number.
Next, the galvanostatic cycling performance of the equivalently prepared Co3O4-loaded thin
nickel foam electrode (Electrode #17 in Table 5.1) at 10 mA cm-2 is evaluated to observe the
outcome when using Co3O4 as the dip-coated catalyst rather than NiCo2O4. Figure 5.6a shows the
galvanostatic cycling potentials, where it is apparent that although the initial ORR potential is
slightly lower (1.24 V vs. Zn) in comparison to the NiCo2O4-loaded electrode, the cycle-stability
of the ORR potential is dramatically improved for the Co3O4-loaded electrode. This result can be
116
correlated with the much slower NiOOH/Ni(OH)2 capacity growth observed in Figure 5.6b; after
200 cycles, the measured NiOOH/Ni(OH)2 capacity of the Co3O4-loaded electrode was only 0.84
mAh, over two times lower than that for the NiCo2O4-loaded electrode (1.9 mAh after 200 cycles).
Perhaps due to this factor, the Co3O4-loaded electrode displays a remarkably improved cycle-life,
providing over 1100 charge-discharge cycles with an ORR potential greater than 1.0 V vs. Zn at
10 mA cm-2 (Figure 5.6c).
The slower capacity growth of the Co3O4-loaded electrode, indicating slower oxidation of
the nickel metal foam, could be explained by the more uniform surface coverage of the deposited
oxide/PTFE layer (Figure 5.1c,e) compared to that for the NiCo2O4-loaded electrode (Figure
5.4a,b). The specific morphology of the Co3O4-loaded electrode, where the branches of the sisal-
like Co3O4 particles protrude away from the nickel foam substrate and the PTFE particles are
congregated closer to the substrate at the base of the branches, may also help to explain its reduced
nickel metal oxidation and enhanced cycle-life. It is suspected that this configuration reduces the
amount of direct electrolyte contact with the nickel metal substrate due to the hydrophobic nature
of the PTFE particles, and the electrolyte would instead preferentially contact the more hydrophilic
protruding tips of the Co3O4 branches that are free from PTFE particle coverage.
117
Figure 5.6. Galvanostatic cycling at 10 mA cm-2 (procedure per Table 5.2) for thin-nickel foam-
based air electrode with Co3O4 catalyst (Electrode #17 in Table 5.1): (a) Galvanostatic cycling
potentials; (b) NiOOH→Ni(OH)2 and Ni(OH)2→NiOOH conversion capacities with 10-point
adjacent-average smoothed lines; (c) ORR/ OER potentials and average NiOOH/Ni(OH)2
capacity as a function of cycle number.
Due to the long cycle-life of the Co3O4-loaded thin foam electrode at 10 mA cm-2 (over 650
hours of operation with an ORR potential above 1.0 V vs. Zn), the electrode cycle-life was also
evaluated with higher-current galvanostatic cycling tests. The galvanostatic cycling potentials for
cycle-tests using 20 mA cm-2 and 50 mA cm-2 alternating oxidation and reduction currents are
shown in Figure 5.7a and Figure 5.7b, respectively. At 20 mA cm-2, the thin foam electrode is
still capable of providing over 500 cycles with ORR potentials above 1.0 V vs. Zn during over 350
118
hours of operation. At 50 mA cm-2, the electrode can provide over 100 cycles with ORR potentials
above 1.0 V vs Zn. A recent modeling study[257] determined that a theoretical rechargeable zinc-
air battery capable of providing 150 charge-discharge cycles with discharge currents up to 40 mA
cm-2 would be feasible in a dual-battery electric vehicle, with the zinc-air battery pack acting as a
range extender to supplement a small lithium-ion battery pack. Therefore, the result in Figure 5.7b
for cycling at a constant current of 50 mA cm-2 seems to indicate that the thin nickel foam-based
electrode developed here could be a promising air electrode candidate in an automotive zinc-air
battery application. Also, as discussed in earlier chapters, the absence of any carbon-phase
constituent in nickel-based air electrodes would eliminate the issue of carbon corrosion in
conventional carbon-based air electrodes,[130] which would occur in the latter electrode type even
when the battery is not operating. This is an important consideration especially for a zinc-air
battery acting as an occasionally used range-extender, since such a battery would be inactive for
long periods of time.
119
Figure 5.7. Galvanostatic cycling potentials for thin-nickel foam-based air electrode with Co3O4
catalyst (Electrode #17 in Table 5.1) at (a) 20 mA cm-2 (procedure per Table 5.3) and (b) 50 mA
cm-2 (procedure per Table 5.4).
The next section briefly discusses and compares the performances of Electrode #’s 1 through
17 in Table 5.1, showing how the preferred combination of preparation parameters to produce the
above Co3O4-loaded thin nickel foam-based air electrode was arrived at. All evaluations were
conducted at 20 mA cm-2 using the procedure outlined in Table 5.3, and the initial ORR potentials
and cycle-lives of the electrodes were both evaluated. The initial ORR potential was measured at
the end of the first reduction cycle (end of step 3 in Table 5.3) following the first oxidation cycle,
and the cycle-life was defined as the number of completed oxidation-reduction cycles that the air
120
electrode displayed an ORR potential of greater than 1.0 V vs. Zn by the end of step 3 in Table
5.3.
First, Figure 5.8 summarizes the initial ORR potentials and cycle-lives of electrodes (i) with
and without the 16-hour, 125 °C pre-heat-treatment step, (ii) calcined at 250 °C for 4 hours or 300
°C for 2 hours, and (iii) heat-treated for 5 minutes or 1 hour after PTFE soaking for the outer PTFE-
coating. In all cases, the initial ORR potential was higher for electrodes calcined at 250 °C for 4
hours, and electrodes pre-heat-treated at 125°C for 16 hours prior to calcination. The cycle-life
was also higher for all electrodes subjected to the pre-heat-treatment step, but the effect of the
calcination condition on cycle-life was inconclusive. The effect of heat-treatment time after PTFE
soaking on the initial ORR potential was inconclusive, but the 1-hour heat-treatment time appeared
to be slightly beneficial to the cycle-life.
121
Figure 5.8. (a) Initial ORR potential vs. Zn and (b) cycle-life of thin nickel foam-based air
electrodes at 20 mA cm-2 with the following three preparation factors: pre-heat/no pre-heat,
calcination temperature/time, duration of heat-treatment after PTFE soaking. The initial ORR
potential was measured at the end of the first reduction cycle (end of step 3 in Table 5.3)
following the first oxidation cycle. Cycle life is defined as the number of oxidation-reduction
cycles at 20 mA cm-2 (procedure per Table 5.3) with that the air electrode maintained an ORR
potential of greater than 1.0 V vs. Zn by the end of each 20 mA cm-2 reduction cycle (end of step
5 in ). In the cases where repeat samples were tested, the black-outlined coordinate indicates the
average potential or cycle-life of the three samples. The results in this figure are of Electrode #’s
1-8 in Table 5.1.
The means and variances of the initial ORR potential and cycle-life for the above three
factors are summarized in Table 5.6 and Table 5.8 respectively, and associated ANOVA results
are shown in Table 5.7 and Table 5.9 respectively. The ANOVA results confirmed that pre-heat-
treatment step significantly affected both the initial ORR potential and cycle-life, and the choice
of calcination condition also significantly affected the initial ORR potential. Therefore the 125 °C
pre-heat-treatment step and 250 °C/4-hour calcination condition were selected as preferred
preparation parameters. The difference in means of cycle-life between 5-minue and 1-hour heat-
122
treatment times after PTFE soaking was not statistically significant, but nevertheless the 1-hour
heat-treatment time after PTFE soaking was selected for producing the next set of electrodes.
Table 5.6. Means and variances of initial ORR potential (vs. Zn at 20 mA cm-2) for thin nickel
foam-based electrodes grouped by the following three preparation factors: pre-heat/no pre-heat,
calcination temperature/time, duration of heat-treatment after PTFE soaking. Initial ORR
potential and cycle-life are defined in the Figure 5.8 caption.
Pre-heat-treatment
before calcination
Calcination
temperature /
time
Duration of heat-
treatment after PTFE
soaking
Count Mean Variance
No 4 1.1399 V 0.000150580
Yes (125 °C / 16 hr) 4 1.1714 V 0.000064329
250 °C / 4 hr 4 1.1632 V 0.000344328
300 °C / 2 hr 4 1.1481 V 0.000381262
5 minutes 4 1.1569 V 0.000501643
1 hour 4 1.1544 V 0.000371142
Table 5.7. Three-factor ANOVA of initial ORR potential statistics in Table 5.6.
SS df MS F p-value Significant?
(α=0.05)
Pre-heat-treatment
before calcination 0.001985550 1 0.001985550 44.29628 0.00265 Yes
Calcination
temperature / time 0.000453507 1 0.000453507 10.11743 0.03351 Yes
Duration of heat-
treatment after PTFE
soaking
0.000011923 1 0.000011923 0.26600 0.63322 No
Error (Within) 0.000179297 4 0.000044824
Total 0.002630278 7 0.000375754
123
Table 5.8. Means and variances of cycle-life (at 20 mA cm-2) for thin nickel foam-based
electrodes grouped by the following three preparation factors: pre-heat/no pre-heat, calcination
temperature/time, duration of heat-treatment after PTFE soaking. Initial ORR potential and
cycle-life are defined in the Figure 5.8 caption.
Pre-heat-treatment
before calcination
Calcination
temperature /
time
Duration of heat-
treatment after PTFE
soaking
Count Mean Variance
No 4 52 1783
Yes (125 °C / 16 hr) 4 181 605
250 °C / 4 hr 4 109 11493
300 °C / 2 hr 4 124 1806
5 minutes 4 112 6669
1 hour 4 121 6732
Table 5.9. Three-factor ANOVA of cycle-life statistics in Table 5.8.
SS df MS F p-value Significant?
(α=0.05)
Pre-heat-treatment
before calcination 33196 1 33196 20.28616534 0.010789324 Yes
Calcination
temperature / time 460 1 460 0.281140723 0.624023114 No
Duration of heat-
treatment after PTFE
soaking
156 1 156 0.095365812 0.772879111 No
Error (Within) 6546 4 1636
Total 40358 7 5765
Figure 5.9 summarizes the initial ORR potentials and cycle-lives of electrodes with (i) three
different Co(NO3)2 concentrations in the precursor dipping mixture (2.0, 2.75, 3.5 mol l-1) and (ii)
dip/pre-heat-treat/calcine sequence (1 dip/pre-heat/calcine, 3 dip/pre-heat/calcine, 3 dip/pre-heat,
1 calcine). In all cases, the electrodes subjected to 3 dip/pre-heat/calcine cycles showed the lowest
initial ORR potentials and the lowest cycle-lives. The electrodes subjected to 3 dip/pre-heat cycles
prior to calcination tended to show higher initial ORR potential and in all cases displayed the
124
highest cycle-life than the other dip/pre-heat-treat/calcine sequences for the same Co(NO3)2
concentration. The effect of the Co(NO3)2 concentration in the precursor dipping mixture on the
initial ORR potential was inconclusive, while the 2.75 mol l-1 concentration tended to result in
higher cycle life.
Figure 5.9. (a) Initial ORR potential vs. Zn and (b) cycle-life of thin nickel foam-based air
electrodes at 20 mA cm-2 with the following two preparation factors: Co(NO3)2 concentration of
precursor mixture for electrode dipping and dip/pre-heat-treat/calcine sequence. Initial ORR
potential and cycle-life are defined in the Figure 5.8 caption. The results in this figure are of
Electrode #’s 6 and 9-16 in Table 5.1.
The means and variances of the initial ORR potential and cycle-life for the above two factors
are summarized in Table 5.10 and Table 5.12 respectively, and associated ANOVA results are
shown in Table 5.11 and Table 5.13 respectively. The ANOVA results confirmed that the choice
of dip/pre-heat/calcine sequence significantly affected both the initial ORR potential and cycle-
life of the electrode, but the difference in means of both performance metrics for the various
125
Co(NO3)2 concentrations was not statistically significant. The 3 dip/pre-heat, 1 calcine sequence
was selected as the preferred production method since the electrodes resulting from this process
achieved the highest cycle lives and mostly displayed the highest initial ORR potentials. Although
the 2.75 mol l-1 Co(NO3)2 precursor concentration tended to result in higher cycle-lives, the 2.0
mol l-1 Co(NO3)2 concentration was selected due to the lower cost and lower toxicity associated
with using a lower Co(NO3)2 concentration for electrode dipping. Further investigation is needed
to determine if an even lower Co(NO3)2 concentration is feasible, and also if changing the PTFE
concentrations in the precursor mixture would result in different ORR activities or cycle-lives.
Table 5.10. Means and variances of initial ORR potential (vs. Zn at 20 mA cm-2) for thin nickel
foam-based electrodes grouped by the following two preparation factors: Co(NO3)2
concentration of precursor mixture for electrode dipping and dip/pre-heat-treat/calcine sequence.
Initial ORR potential and cycle-life are defined in the Figure 5.8 caption.
D/P/C sequence
Co(NO3)2
concentration
1 dip/pre-heat/
calcine
3 dip/pre-heat/
calcine
3 dip/pre-heat,
1 calcine Mean Variance
2.0 mol l-1 1.1678 V 1.1563 V 1.1795 V 1.1679 V 0.000134176
2.75 mol l-1 1.1757 V 1.1343 V 1.1901 V 1.1667 V 0.00083946
3.5 mol l-1 1.1892 V 1.1579 V 1.1836 V 1.1769 V 0.00027859
Mean 1.1776 V 1.1495 V 1.1844 V 1.1705 V
Variance 0.000117041 0.00017392 2.87337E-05 0.000336422
Table 5.11. Two-factor ANOVA of initial ORR potential statistics in Table 5.10.
SS df MS F p-value Significant?
(α=0.05)
Co(NO3)2
concentration 0.00018693 2 9.3463E-05 0.82625223 0.50076983 No
D/P/C sequence 0.00205199 2 0.00102599 9.07025546 0.03263959 Yes
Error (Within) 0.00045247 4 0.00011312
Total 0.00269138 8 0.00033642
126
Table 5.12. Means and variances of cycle-life (at 20 mA cm-2) for thin nickel foam-based
electrodes grouped by the following two preparation factors: Co(NO3)2 concentration of
precursor mixture for electrode dipping and dip/pre-heat-treat/calcine sequence. Initial ORR
potential and cycle-life are defined in the Figure 5.8 caption
D/P/C sequence
Co(NO3)2
concentration
1 dip/pre-heat/
calcine
3 dip/pre-heat/
calcine
3 dip/pre-heat,
1 calcine Mean Variance
2.0 mol l-1 109 50 236 132 9034
2.75 mol l-1 203 158 247 203 1980
3.5 mol l-1 156 84 172 137 2197
Mean 156 97 218 157
Variance 2225 3049 1640 4475
Table 5.13. Two-factor ANOVA of cycle-life statistics in Table 5.12.
SS df MS F p-value Significant?
(α=0.05)
Co(NO3)2
concentration 9372 2 4686 4.205592151 0.103870814 No
D/P/C sequence 21967 2 10984 9.857797377 0.028448013 Yes
Error (Within) 4457 4 1114
Total 35796 8 4475
Finally, the effect of the concentration of the PTFE emulsion used for applying the outer
PTFE-coating was investigated by comparing three samples soaked in 15 wt.% PTFE to three
samples soaked in 30 wt.% PTFE (three each of Electrode #’s 15 and 17 in Table 5.1). A two-
sample two-tail t-test assuming unequal variance was performed on the two groups of initial ORR
potentials and cycle-lives. As shown in Table 5.14, the electrode soaked in 30 wt.% PTFE had a
higher average mean ORR potential, but the t-test result in Table 5.15 showed that this difference
was not statistically significant. Remarkably, however, the mean cycle-life of the electrodes soaked
in 30 wt.% PTFE was 539, over double that of the 15 wt.% PTFE-soaked electrodes (Table 5.16),
127
which was shown to be statistically significant in Table 5.17. It should also be noted that Electrode
#17 was produced using only 4-hour pre-heat-treatment steps for the first two of the three dip/pre-
heat cycles, instead of the usual 16-hour times. This did not appear to have adverse affects on the
electrode cycle life, at least not compared to the improvement from using a higher PTFE
concentration for electrode soaking.
Table 5.14. Means and variances of initial ORR potential (vs. Zn at 20 mA cm-2) for thin nickel
foam-based electrodes prepared using 15 wt.% and 30 wt.% PTFE emulsions for outer PTFE-
coating. Initial ORR potential is defined in the Figure 5.8 caption. The results in this table are of
Electrode #’s 15 and 17 in Table 5.1.
PTFE concentration for
outer PTFE-coating
Count Mean Variance
15 wt.% 3 1.1795 V 0.00012537
30 wt.% 3 1.1912 V 0.00015050
Pooled 0.00013794
Table 5.15. Two-sample two-tail t-test assuming unequal variance of initial ORR potential
statistics in Table 5.14.
std err t-stat df p-value t-crit Significant?
(α=0.05)
Two Tail 0.00959 1.22703 3.96708 0.28761 2.78555 No
Table 5.16. Means and variances of cycle-life (at 20 mA cm-2) for thin nickel foam-based
electrodes prepared using 15 wt.% and 30 wt.% PTFE emulsions for outer PTFE-coating. Cycle-
life is defined in the Figure 5.8 caption. The results in this table are of Electrode #’s 15 and 17 in
Table 5.1.
PTFE concentration for
outer PTFE-coating
Count Mean Variance
15 wt.% 3 236 4501
30 wt.% 3 539 76
Pooled 2288.5
128
Table 5.17. Two-sample two-tail t-test assuming unequal variance of cycle-life statistics in
Table 5.16.
std err t-stat df p-value t-crit Significant?
(α=0.05)
Two Tail 39 7.757 2.068 0.0147 4.171 Yes
5.3.3 Specific Energy and Energy Density Estimation
To gain insight into the feasibility of using the developed thin nickel foam-based air
electrode in a rechargeable zinc-air battery, the specific energy and energy density of an idealized
zinc-air battery design using this air electrode and various reversible zinc electrodes evaluated in
Table 3.2 is calculated here. The specific energy (SE) and energy density (ED) of a zinc-air cell
in an energy-dense configuration (electrolyte-soaked separator sandwiched between an air
electrode and electrolyte-soaked zinc electrode, i.e. Figure 3.2) can be estimated according to
Equations 5.1-5.5:
𝑆𝐸𝑍𝑛−𝑎𝑖𝑟 𝑐𝑒𝑙𝑙 =𝐴𝐶𝑍𝑛 𝑒𝑙𝑒𝑐𝑡𝑟𝑜𝑑𝑒
𝐴𝑀𝑍𝑛−𝑎𝑖𝑟 𝑐𝑒𝑙𝑙× 𝑉𝑛𝑜𝑚𝑖𝑛𝑎𝑙 (Equation 5.1)
𝐴𝑀𝑍𝑛−𝑎𝑖𝑟 𝑐𝑒𝑙𝑙 = 𝐴𝑀𝐴𝑖𝑟 𝑒𝑙𝑒𝑐𝑡𝑟𝑜𝑑𝑒 + 𝐴𝑀𝑆𝑒𝑝𝑎𝑟𝑎𝑡𝑜𝑟 + 𝐴𝑀𝐸𝑙𝑒𝑐𝑡𝑟𝑜𝑙𝑦𝑡𝑒 + 𝐴𝑀𝑍𝑛 𝑒𝑙𝑒𝑐𝑡𝑟𝑜𝑑𝑒
(Equation 5.2)
𝐴𝑀𝐸𝑙𝑒𝑐𝑡𝑟𝑜𝑙𝑦𝑡𝑒 = 𝐷𝐸𝑙𝑒𝑐𝑡𝑟𝑜𝑙𝑦𝑡𝑒 × (𝑃𝑆𝑒𝑝𝑎𝑟𝑎𝑡𝑜𝑟𝑡𝑆𝑒𝑝𝑎𝑟𝑎𝑡𝑜𝑟 + 𝑃𝑍𝑛 𝐸𝑙𝑒𝑐𝑡𝑟𝑜𝑑𝑒𝑡𝑍𝑛 𝐸𝑙𝑒𝑐𝑡𝑟𝑜𝑑𝑒)
(Equation 5.3)
𝐸𝐷𝑍𝑖𝑛𝑐−𝑎𝑖𝑟 𝑐𝑒𝑙𝑙 =𝐴𝐶𝑍𝑛 𝑒𝑙𝑒𝑐𝑡𝑟𝑜𝑑𝑒
𝑡𝑍𝑛−𝑎𝑖𝑟 𝑐𝑒𝑙𝑙× 𝑉𝑁𝑜𝑚𝑖𝑛𝑎𝑙 (Equation 5.4)
129
𝑡𝑍𝑛−𝑎𝑖𝑟 𝑐𝑒𝑙𝑙 = 𝑡𝐴𝑖𝑟 𝑒𝑙𝑒𝑐𝑡𝑟𝑜𝑑𝑒 + 𝑡𝑆𝑒𝑝𝑎𝑟𝑎𝑡𝑜𝑟 + 𝑡𝑍𝑛 𝑒𝑙𝑒𝑐𝑡𝑟𝑜𝑑𝑒
(Equation 5.5)
where SE is specific energy, AC is areal capacity, AM is areal mass, V is voltage, D is density, P
is porosity, and t is thickness. It should be noted that the mass of current collectors and cell casing
is excluded from this analysis. The nominal voltage and the air electrode, separator and electrolyte
properties used in Equations 5.1-5.5 are shown in Table 5.18.
Table 5.18. Nominal voltage and air electrode, separator and electrolyte properties used for
Equations 5.1-5.5.
Vnominal (V) 1.1
AMAir electrode (g cm-2) 0.0491
tAir electrode (cm) 0.025
AMSeparator (g cm-2) 0.00284
tseparator (cm) 0.011
PSeparator 0.55
Delectrolyte (6 mol l-1 KOH) (g cm-3) 1.25
Table 5.19 shows the results of performing these calculations. The idealized rechargeable
zinc-air battery incorporating the thin nickel foam-based air electrode and either the 3D Zn sponge
electrode[175] or the Bi-based nanoparticle coated Zn electrode[198] has competitive or better
specific energy and energy densities in comparison to lithium-ion batteries (Figure 2.4), although
this conclusion might change if the mass of current collectors and cell casings are taken into
130
account. However, both of these zinc electrodes have less than 100 demonstrated cycle lives, which
may be insufficient even for automotive range-extender applications.[257] The other zinc electrodes
considered here have higher cycle lives, but as seen in Table 5.19, their areal capacities are too
low to enable a rechargeable zinc-air battery with competitive specific energy and energy density
values even in the idealized cell calculation. Therefore, future work on zinc electrodes should
prioritize achieving high cycle lives with areal capacities comparable to the 3D Zn sponge
electrode or Bi-based nanoparticle coated Zn electrode in this analysis.
5.4 Conclusions
In this work, a thin nickel foam-based air electrode was designed and successfully
demonstrated for use in electrically rechargeable zinc-air batteries. The electrode was 2-4 times
lighter and thinner than previously reported nickel-based air electrodes, while displaying similar
or better ORR/OER activities and a higher cycle-life than the previously investigated thick nickel-
based air electrode. Specifically, more than 1100 charge-discharge cycles during over 700 hours
of cycling at 10 mA cm-2 or more than 500 charge-discharge cycles during over 340 hours of
operation at 20 mA cm-2 with a discharge potential over 1.0 V vs. Zn was observed. Calculations
for an energy-dense zinc-air battery configuration were also performed, which showed that the
thin nickel foam-based air electrode could enable competitive or better specific energy and energy
density values compared to lithium-ion batteries, when paired with a high-areal capacity zinc
electrode. The carbon-free design of the air electrode also makes it a promising candidate for use
in zinc-air battery range-extender applications for EVs.
131
Table 5.19. Zinc electrode properties (from Table 3.2) and calculation of specific energy and
energy density of rechargeable zinc-air batteries containing each zinc electrode paired with a thin
nickel foam-based air electrode in an energy-dense configuration.
3D Zn
sponge
elec-
trode [175]
Calcium
zincate
elec-
trode [195]
Zn-Al-layer
double
oxide
electrode [165]
Bi-based
nanoparticle
coated Zn
electrode [198]
In-doped
Zn elec-
trode [163]
PZn electrode (higher) 0.795 0.75 0.75 0.75 0.75
PZn electrode (lower) 0.795 0.60 0.60 0.60 0.60
tZn electrode (lower) (cm) 0.100 0.020 0.020 0.030 0.028
tZn electrode (higher) (cm) 0.400 0.020 0.020 0.030 0.028
ACZn electrode (high Zn electrode porosity or
low Zn electrode thickness)
(mAh cm-2)
92.8 6.75 11.04 30.74 20.36
ACZn electrode (low Zn electrode porosity or
high Zn electrode thickness)
(mAh cm-2)
371.2 10.80 17.66 49.19 32.58
AMZn electrode (high Zn electrode porosity or
low Zn electrode thickness) (g cm-2)
0.127 0.0175 0.0235 0.0468 0.0347
AMZn electrode (low Zn electrode porosity or
high Zn electrode thickness) (g cm-2)
0.510 0.0281 0.0376 0.0750 0.0556
AMElectrolyte (high Zn electrode porosity or
low Zn electrode thickness) (g cm-2)
0.1069 0.0263 0.0263 0.0357 0.0338
AMElectrolyte (low Zn electrode porosity or
high Zn electrode thickness) (g cm-2)
0.4051 0.0226 0.0226 0.0301 0.0286
AMZn-air cell (high Zn electrode porosity or
low Zn electrode thickness) (g cm-2)
0.2864 0.0958 0.1018 0.1345 0.1205
AMZn-air cell (low Zn electrode porosity or
high Zn electrode thickness) (g cm-2)
0.9669 0.1026 0.1121 0.1570 0.1361
tZn-air cell (low Zn electrode thickness)
(cm)
0.1360 0.0560 0.0560 0.0660 0.0640
tZn-air cell (high Zn electrode thickness) (cm) 0.4360 0.0560 0.0560 0.0660 0.0640
SEZn-air cell (high Zn electrode porosity or
low Zn electrode thickness)
(Wh kg-1)
356.5 77.5 119.3 251.5 185.9
SEZn-air cell (low Zn electrode porosity or
high Zn electrode thickness)
(Wh kg-1)
422.3 115.9 173.3 344.7 263.3
EDZn-air cell (high Zn electrode porosity or
low Zn electrode thickness) (Wh L-1)
750.6 132.7 216.8 512.4 350.0
EDZn-air cell (low Zn electrode porosity or
high Zn electrode thickness) (Wh L-1)
936.5 212.2 346.9 819.8 560.0
Demonstrated cycle-life of Zn electrode ~25 250+ 1000+ 50+ 73+
132
Chapter 6: Conclusions and Future Work
6.1 Conclusions
This thesis investigated the feasibility of using rechargeable zinc-air batteries for electric
vehicle applications as well as electrode design considerations for achieving an energy-dense and
long-lasting zinc-air battery cell. In Chapter 2, the energy and economic characteristics of zinc-
air batteries in comparison to hydrogen fuel cells and a number of other batteries (lead-acid, nickel-
metal hydride, lithium-sulfur, lithium-air) was thoroughly reviewed. Then, the potential abilities
of these energy technologies to facilitate the growth of emerging electric vehicle markets, which
so far have not been well served by the properties of lithium-ion batteries, were evaluated. Zinc-
air batteries have the highest practically achievable volumetric energy density among the other
batteries, as well as a potentially higher specific energy, lower or equal cost and better safety
relative to lithium-ion batteries. The gives them the ability to possibly better serve the emerging
long-range and low-cost electric vehicle markets, and unlike hydrogen fuel cells, would not rely
on the global development of renewable hydrogen production and transportation infrastructure.
However, the low specific power, energy efficiency and cycle-life of zinc-air batteries means that
they likely will not act as a primary energy source for electric vehicles, and instead they should be
paired with a high-power, high-efficiency and high-cycle life battery. The most logical dual-
battery configuration that exploits the strengths and shelters the weaknesses of zinc-air batteries
would employ them as a low-cost and energy-dense range-extender.
133
Chapter 3 provided an overview of the specific technology challenges that electrically-
rechargeable zinc-air batteries are currently facing, with a specific lens placed on energy-dense
zinc electrodes and configurations that need to be developed for electric vehicle range-extender
applications. Four performance-limiting phenomena which typically hinder reversible zinc
electrodes were detailed, namely dendrite growth, shape change, passivation/internal resistance
and hydrogen evolution. Strategies to overcome these issues were summarized, and a selection of
zinc electrodes from the literature incorporating one or more of these strategies was also evaluated.
Table 3.2 revealed that many zinc electrodes with high reported cycle-lives have quite low areal
capacities, while those with higher areal capacities tend to have lower cycle-lives, highlighting the
difficulty in optimizing both parameters simultaneously. Electrode design fundamentals for
bifunctional air electrodes were then reviewed, including their general architecture and the flooded
agglomerate model which explains the need for a balance of hydrophobic and hydrophilic
properties as well as electronic conductivity in the electrode design. Carbon-based materials and
substrates together with polytetrafluoroethylene (PTFE) have conventionally been used to achieve
these properties, but for zinc-air batteries with long calendar lives needed for EV range-extender
applications, durable and corrosion-resistant metals such as nickel offer a promising alternative to
carbon. Nickel-based air electrodes, however, have received relatively little attention in the
literature, which provided the motivation for the experimental investigations in Chapters 4 and 5
of the thesis.
In Chapter 4, the failure mechanism of nickel-based air electrodes in rechargeable zinc-air
batteries was investigated. Nickel metal forms a passivating (oxy)hydroxide film when exposed to
134
the alkaline electrolyte of rechargeable zinc-air batteries, preventing the structure from breaking
down due to corrosion. However, the (oxy)hydroxide film also grows progressively thicker when
the air electrode is subjected to repeated ORR and OER cycling. Since this film also converts
between Ni(OH)2 and NiOOH with relatively low overpotentials at the beginning of each charge
and discharge cycle, cut-off voltages were introduced into a “two-step” cycling regime that
enabled electrochemical tracking of the (oxy)hydroxide film growth during the battery cycling. A
correlation between the film growth and a loss of ORR activity mainly caused by mass transfer
losses was revealed, and SEM, XRD and XPS analyses provided corroborating evidence of
increasing resistance to oxygen transport caused by the film growing overtop of the metal-
supported catalyst.
Finally, in Chapter 5, a new nickel-based air electrode design with dramatically improved
cycle-life and 2-4 times lower thickness and weight than previously proposed designs was
introduced. This electrode, produced by a simple dip-coating procedure in a mixture of cobalt
nitrate and PTFE particles, displayed over 1100 charge-discharge cycles at 10 mA cm-2, over 500
charge-discharge cycles at 20 mA cm-2 and over 100 charge-discharge cycles at 50 mA cm-2 while
maintaining an ORR potential greater than 1.0 V vs. Zn. The improved cycle-life was attributed to
the absence of nickel metal powder and uniformly coated nickel foam struts, both resulting in
slower nickel (oxy)hydroxide film growth, as well as the presence of sisal-like Co3O4 branches
intermixed with PTFE particles, which were hypothesized to provide a beneficial balance between
hydrophobic and hydrophilic properties needed for high-current cycling operation. The specific
energy and energy density of a hypothetical rechargeable zinc-air battery incorporating the thin
135
nickel foam-based air electrode and the zinc electrodes evaluated in Chapter 3 were calculated,
showing values which were competitive or better than lithium-ion batteries if the zinc electrode
had a relatively high areal capacity. Therefore, the thin, light-weight, high-stability, carbon-free
and easily reproducible air electrode developed in this work could be an ideal choice to employ in
a durable and energy-dense rechargeable zinc-air battery for electric vehicle range-extender
applications.
6.2 Future Work
Based on the results of this thesis, three major recommendations for future work are provided
here. First, more fundamental research on the performance and failure mechanism of nickel-based
air electrodes should be completed. For instance, cross-sectional SEM or transmission electron
microscopy (TEM) characterization of the air electrode after cycling could more directly confirm
the presence of the nickel (oxy)hydroxide layer overtop of the catalyst-coated electrode. Further
SEM, XPS and XRD analyses before and after electrochemical cycling should also be carried out
with direct comparisons made between cobalt nitrate-coated electrodes and mixed PTFE/cobalt
nitrate-coated electrodes, as well as between Co3O4-coated electrodes and NiCo2O4-coated
electrodes, to provide further insight into the morphological, crystallographic and surface
chemistry changes (and their relative rates) resulting from electrochemical operation. This could
enable a more detailed understanding of the mechanism in which the nickel (oxy)hydroxide film
growth interacts or interferes with the catalyst, and how the various preparation methods affect
this mechanism, which could in turn lead to better preparation methods for enabling electrodes
136
with higher durability or higher current operability. Additionally, other metal-based air electrodes
could be investigated in terms of their oxide growth rates, post-cycling morphologies, and
ultimately their electrochemical durability compared to nickel-based air electrodes.
Secondly, further design and testing of the thin nickel foam-based air electrode (or other
metal-based air electrodes) should be completed. Several design factors were not explored in this
work, such as the nickel foam thickness and the concentration of PTFE in the precursor dip-coating
solution, while other parameters such as possibly even lower cobalt nitrate concentration, more
precisely optimized outer-PTFE coating emulsion concentration, and other heat-
treatment/calcination temperatures and times could use further investigation. Additionally,
protective coatings with sufficient electronic conductivity could also be applied to the nickel foam
before applying the catalyst/PTFE layer in order to provide a barrier between the nickel metal foam
and electrolyte, thus reducing its oxidation rate during electrochemical cycling. Long-term
operational testing of the air electrodes, including long periods of inactivity between
charge/discharge cycles, should also be conducted to determine whether the electrode can provide
a long calendar-life in addition to its long cycle-life. An air electrode that shows long calendar-life
in addition to long cycle-life is ultimately what would be needed to enable long-lasting zinc-air
battery range-extenders in electric vehicles.
The last major recommendation arising from this work is to spend significant efforts on the
zinc electrode design and total cell design. Zinc electrodes with high areal capacities and decent
cycle-lives are necessary to enable energy-dense, electrically rechargeable zinc-air batteries for
electric vehicle applications. Testing and designing of both the zinc electrode and air electrode for
137
operation in an energy-dense cell configuration should also be prioritized, since their cycle-lives
and also the overall durability of the whole cell is likely to face more challenges in a minimum-
electrolyte configuration. Hydrophilic materials or gelled electrolytes will likely need to be
developed to prevent electrolyte evaporation, and hydrogen evolution at the zinc electrode will
also need to receive greater consideration in the minimum-electrolyte configuration to minimize
electrolyte consumption. Ultimately, full-cell testing under cycling protocols relevant to electric
vehicle range-extenders is needed to fully evaluate the potential of zinc-air batteries in this
application.
138
Letters of Copyright Permission
1. John Wiley and Sons / Advanced Materials
JOHN WILEY AND SONS LICENSE
TERMS AND CONDITIONS
Jan 17, 2020
This Agreement between Zachary P Cano ("You") and John Wiley and Sons ("John Wiley
and Sons") consists of your license details and the terms and conditions provided by John
Wiley and Sons and Copyright Clearance Center.
License Number 4751430928543
License date Jan 17, 2020
Licensed Content Publisher John Wiley and Sons
Licensed Content Publication Advanced Materials
Licensed Content Title Electrically Rechargeable Zinc–Air Batteries: Progress,
Challenges, and Perspectives
Licensed Content Author Zhongwei Chen, Michael Fowler, Aiping Yu, et al
Licensed Content Date Nov 28, 2016
Licensed Content Volume 29
Licensed Content Issue 7
Licensed Content Pages 34
Type of use Dissertation/Thesis
Requestor type Author of this Wiley article
Format Electronic
Portion Full article
Will you be translating? No
Title of your thesis /
dissertation
Electrode Design for Durable and Energy-Dense
Rechargeable Zinc-Air Batteries
Expected completion date Jan 2020
Expected size (number of
pages) 174
Requestor Location
Zachary P Cano
Department of Chemical Engineering
University of Waterloo
139
200 University Avenue West
Waterloo, ON N2L3G1
Canada
Attn: Zachary P Cano
Publisher Tax ID EU826007151
Total 0.00 CAD
Terms and Conditions
TERMS AND CONDITIONS
This copyrighted material is owned by or exclusively licensed to John Wiley & Sons, Inc. or
one of its group companies (each a"Wiley Company") or handled on behalf of a society with
which a Wiley Company has exclusive publishing rights in relation to a particular work
(collectively "WILEY"). By clicking "accept" in connection with completing this licensing
transaction, you agree that the following terms and conditions apply to this transaction (along
with the billing and payment terms and conditions established by the Copyright Clearance
Center Inc., ("CCC's Billing and Payment terms and conditions"), at the time that you opened
your RightsLink account (these are available at any time at http://myaccount.copyright.com).
Terms and Conditions
• The materials you have requested permission to reproduce or reuse (the "Wiley
Materials") are protected by copyright.
• You are hereby granted a personal, non-exclusive, non-sub licensable (on a stand-
alone basis), non-transferable, worldwide, limited license to reproduce the Wiley
Materials for the purpose specified in the licensing process. This license, and any
CONTENT (PDF or image file) purchased as part of your order, is for a one-
time use only and limited to any maximum distribution number specified in the
license. The first instance of republication or reuse granted by this license must be
completed within two years of the date of the grant of this license (although copies
prepared before the end date may be distributed thereafter). The Wiley Materials
shall not be used in any other manner or for any other purpose, beyond what is
granted in the license. Permission is granted subject to an appropriate
acknowledgement given to the author, title of the material/book/journal and the
publisher. You shall also duplicate the copyright notice that appears in the Wiley
publication in your use of the Wiley Material. Permission is also granted on the
understanding that nowhere in the text is a previously published source
acknowledged for all or part of this Wiley Material. Any third party content is
expressly excluded from this permission.
140
• With respect to the Wiley Materials, all rights are reserved. Except as expressly
granted by the terms of the license, no part of the Wiley Materials may be copied,
modified, adapted (except for minor reformatting required by the new Publication),
translated, reproduced, transferred or distributed, in any form or by any means, and
no derivative works may be made based on the Wiley Materials without the prior
permission of the respective copyright owner.For STM Signatory Publishers
clearing permission under the terms of the STM Permissions Guidelines only,
the terms of the license are extended to include subsequent editions and for
editions in other languages, provided such editions are for the work as a whole
in situ and does not involve the separate exploitation of the permitted figures
or extracts, You may not alter, remove or suppress in any manner any copyright,
trademark or other notices displayed by the Wiley Materials. You may not license,
rent, sell, loan, lease, pledge, offer as security, transfer or assign the Wiley Materials
on a stand-alone basis, or any of the rights granted to you hereunder to any other
person.
• The Wiley Materials and all of the intellectual property rights therein shall at all
times remain the exclusive property of John Wiley & Sons Inc, the Wiley
Companies, or their respective licensors, and your interest therein is only that of
having possession of and the right to reproduce the Wiley Materials pursuant to
Section 2 herein during the continuance of this Agreement. You agree that you own
no right, title or interest in or to the Wiley Materials or any of the intellectual
property rights therein. You shall have no rights hereunder other than the license as
provided for above in Section 2. No right, license or interest to any trademark, trade
name, service mark or other branding ("Marks") of WILEY or its licensors is
granted hereunder, and you agree that you shall not assert any such right, license or
interest with respect thereto
• NEITHER WILEY NOR ITS LICENSORS MAKES ANY WARRANTY OR
REPRESENTATION OF ANY KIND TO YOU OR ANY THIRD PARTY,
EXPRESS, IMPLIED OR STATUTORY, WITH RESPECT TO THE
MATERIALS OR THE ACCURACY OF ANY INFORMATION CONTAINED
IN THE MATERIALS, INCLUDING, WITHOUT LIMITATION, ANY IMPLIED
WARRANTY OF MERCHANTABILITY, ACCURACY, SATISFACTORY
QUALITY, FITNESS FOR A PARTICULAR PURPOSE, USABILITY,
INTEGRATION OR NON-INFRINGEMENT AND ALL SUCH WARRANTIES
ARE HEREBY EXCLUDED BY WILEY AND ITS LICENSORS AND WAIVED
BY YOU.
• WILEY shall have the right to terminate this Agreement immediately upon breach
of this Agreement by you.
141
• You shall indemnify, defend and hold harmless WILEY, its Licensors and their
respective directors, officers, agents and employees, from and against any actual or
threatened claims, demands, causes of action or proceedings arising from any
breach of this Agreement by you.
• IN NO EVENT SHALL WILEY OR ITS LICENSORS BE LIABLE TO YOU OR
ANY OTHER PARTY OR ANY OTHER PERSON OR ENTITY FOR ANY
SPECIAL, CONSEQUENTIAL, INCIDENTAL, INDIRECT, EXEMPLARY OR
PUNITIVE DAMAGES, HOWEVER CAUSED, ARISING OUT OF OR IN
CONNECTION WITH THE DOWNLOADING, PROVISIONING, VIEWING OR
USE OF THE MATERIALS REGARDLESS OF THE FORM OF ACTION,
WHETHER FOR BREACH OF CONTRACT, BREACH OF WARRANTY,
TORT, NEGLIGENCE, INFRINGEMENT OR OTHERWISE (INCLUDING,
WITHOUT LIMITATION, DAMAGES BASED ON LOSS OF PROFITS, DATA,
FILES, USE, BUSINESS OPPORTUNITY OR CLAIMS OF THIRD PARTIES),
AND WHETHER OR NOT THE PARTY HAS BEEN ADVISED OF THE
POSSIBILITY OF SUCH DAMAGES. THIS LIMITATION SHALL APPLY
NOTWITHSTANDING ANY FAILURE OF ESSENTIAL PURPOSE OF ANY
LIMITED REMEDY PROVIDED HEREIN.
• Should any provision of this Agreement be held by a court of competent jurisdiction
to be illegal, invalid, or unenforceable, that provision shall be deemed amended to
achieve as nearly as possible the same economic effect as the original provision, and
the legality, validity and enforceability of the remaining provisions of this
Agreement shall not be affected or impaired thereby.
• The failure of either party to enforce any term or condition of this Agreement shall
not constitute a waiver of either party's right to enforce each and every term and
condition of this Agreement. No breach under this agreement shall be deemed
waived or excused by either party unless such waiver or consent is in writing signed
by the party granting such waiver or consent. The waiver by or consent of a party to
a breach of any provision of this Agreement shall not operate or be construed as a
waiver of or consent to any other or subsequent breach by such other party.
• This Agreement may not be assigned (including by operation of law or otherwise)
by you without WILEY's prior written consent.
• Any fee required for this permission shall be non-refundable after thirty (30) days
from receipt by the CCC.
• These terms and conditions together with CCC's Billing and Payment terms and
conditions (which are incorporated herein) form the entire agreement between you
and WILEY concerning this licensing transaction and (in the absence of fraud)
142
supersedes all prior agreements and representations of the parties, oral or written.
This Agreement may not be amended except in writing signed by both parties. This
Agreement shall be binding upon and inure to the benefit of the parties' successors,
legal representatives, and authorized assigns.
• In the event of any conflict between your obligations established by these terms and
conditions and those established by CCC's Billing and Payment terms and
conditions, these terms and conditions shall prevail.
• WILEY expressly reserves all rights not specifically granted in the combination of
(i) the license details provided by you and accepted in the course of this licensing
transaction, (ii) these terms and conditions and (iii) CCC's Billing and Payment
terms and conditions.
• This Agreement will be void if the Type of Use, Format, Circulation, or Requestor
Type was misrepresented during the licensing process.
• This Agreement shall be governed by and construed in accordance with the laws of
the State of New York, USA, without regards to such state's conflict of law rules.
Any legal action, suit or proceeding arising out of or relating to these Terms and
Conditions or the breach thereof shall be instituted in a court of competent
jurisdiction in New York County in the State of New York in the United States of
America and each party hereby consents and submits to the personal jurisdiction of
such court, waives any objection to venue in such court and consents to service of
process by registered or certified mail, return receipt requested, at the last known
address of such party.
WILEY OPEN ACCESS TERMS AND CONDITIONS
Wiley Publishes Open Access Articles in fully Open Access Journals and in Subscription
journals offering Online Open. Although most of the fully Open Access journals publish open
access articles under the terms of the Creative Commons Attribution (CC BY) License only,
the subscription journals and a few of the Open Access Journals offer a choice of Creative
Commons Licenses. The license type is clearly identified on the article.
The Creative Commons Attribution License
The Creative Commons Attribution License (CC-BY) allows users to copy, distribute and
transmit an article, adapt the article and make commercial use of the article. The CC-BY
license permits commercial and non-
143
Creative Commons Attribution Non-Commercial License
The Creative Commons Attribution Non-Commercial (CC-BY-NC)License permits use,
distribution and reproduction in any medium, provided the original work is properly cited
and is not used for commercial purposes.(see below)
Creative Commons Attribution-Non-Commercial-NoDerivs License
The Creative Commons Attribution Non-Commercial-NoDerivs License (CC-BY-NC-ND)
permits use, distribution and reproduction in any medium, provided the original work is
properly cited, is not used for commercial purposes and no modifications or adaptations are
made. (see below)
Use by commercial "for-profit" organizations
Use of Wiley Open Access articles for commercial, promotional, or marketing purposes
requires further explicit permission from Wiley and will be subject to a fee.
Further details can be found on Wiley Online Library
http://olabout.wiley.com/WileyCDA/Section/id-410895.html
Other Terms and Conditions:
v1.10 Last updated September 2015
Questions? [email protected] or +1-855-239-3415 (toll free in the US) or
+1-978-646-2777.
144
2. Springer Nature / Nature Energy
Batteries and fuel cells for emerging electric vehicle markets
Author: Zachary P. Cano et al
Publication: Nature Energy
Publisher: Springer Nature
Date: Apr 12, 2018
Copyright © 2018, Springer Nature
Author Request
If you are the author of this content (or his/her designated agent) please read the following. If
you are not the author of this content, please click the Back button and select no to the question
"Are you the Author of this Springer Nature content?".
Ownership of copyright in original research articles remains with the Author, and provided that,
when reproducing the contribution or extracts from it or from the Supplementary Information,
the Author acknowledges first and reference publication in the Journal, the Author retains the
following non-exclusive rights:
To reproduce the contribution in whole or in part in any printed volume (book or thesis) of which
they are the author(s).
The author and any academic institution, where they work, at the time may reproduce the
contribution for the purpose of course teaching.
To reuse figures or tables created by the Author and contained in the Contribution in oral
presentations and other works created by them.
To post a copy of the contribution as accepted for publication after peer review (in locked Word
processing file, of a PDF version thereof) on the Author's own web site, or the Author's
institutional repository, or the Author's funding body's archive, six months after publication of
the printed or online edition of the Journal, provided that they also link to the contribution on the
publisher’s website.
Authors wishing to use the published version of their article for promotional use or on a web site
must request in the normal way.
If you require further assistance please read Springer Nature's online author reuse guidelines.
145
For full paper portion: Authors of original research papers published by Springer Nature are
encouraged to submit the author's version of the accepted, peer-reviewed manuscript to their
relevant funding body's archive, for release six months after publication. In addition, authors are
encouraged to archive their version of the manuscript in their institution's repositories (as well as
their personal Web sites), also six months after original publication.
v1.0
146
3. American Chemical Society / The Journal of Physical Chemistry C
New Interpretation of the Performance of Nickel-Based Air Electrodes for Rechargeable Zinc–
Air Batteries
Author: Zachary P. Cano, Moon Gyu Park, Dong Un Lee, et al
Publication: The Journal of Physical Chemistry C
Publisher: American Chemical Society
Date: Sep 1, 2018
Copyright © 2018, American Chemical Society
PERMISSION/LICENSE IS GRANTED FOR YOUR ORDER AT NO CHARGE
This type of permission/license, instead of the standard Terms & Conditions, is sent to you
because no fee is being charged for your order. Please note the following:
- Permission is granted for your request in both print and electronic formats, and translations.
- If figures and/or tables were requested, they may be adapted or used in part.
- Please print this page for your records and send a copy of it to your publisher/graduate school.
- Appropriate credit for the requested material should be given as follows: "Reprinted (adapted)
with permission from (COMPLETE REFERENCE CITATION). Copyright (YEAR) American
Chemical Society." Insert appropriate information in place of the capitalized words.
- One-time permission is granted only for the use specified in your request. No additional uses
are granted (such as derivative works or other editions). For any other uses, please submit a new
request.
147
References
[1] C. Breyer, A. Gerlach, Prog. Photovolt. Res. Appl. 2013, 21, 121.
[2] L. A. H. Munoz, J. C. C. M. Huijben, B. Verhees, G. P. J. Verbong, Technol. Forecast. Soc.
Change 2014, 87, 179.
[3] J. B. Goodenough, K.-S. Park, J. Am. Chem. Soc. 2013, 135, 1167.
[4] S. Goriparti, E. Miele, F. De Angelis, E. Di Fabrizio, R. Proietti Zaccaria, C. Capiglia, J.
Power Sources 2014, 257, 421.
[5] E. Shafiei, H. Thorkelsson, E. I. Ásgeirsson, B. Davidsdottir, M. Raberto, H. Stefansson,
Technol. Forecast. Soc. Change 2012, 79, 1638.
[6] B. Propfe, D. Kreyenberg, J. Wind, S. Schmid, Int. J. Hydrog. Energy 2013, 38, 5201.
[7] O. Egbue, S. Long, Energy Policy 2012, 48, 717.
[8] M. A. Rahman, X. Wang, C. Wen, J. Electrochem. Soc. 2013, 160, A1759.
[9] S. R. Narayanan, G. K. S. Prakash, A. Manohar, B. Yang, S. Malkhandi, A. Kindler, Solid
State Ion. 2012, 216, 105.
[10] X. Ren, Y. Wu, J. Am. Chem. Soc. 2013, 135, 2923.
[11] P. Hartmann, C. L. Bender, M. Vračar, A. K. Dürr, A. Garsuch, J. Janek, P. Adelhelm, Nat.
Mater. 2013, 12, 228.
[12] J.-S. Lee, S. Tai Kim, R. Cao, N.-S. Choi, M. Liu, K. T. Lee, J. Cho, Adv. Energy Mater.
2011, 1, 34.
[13] J. Muldoon, C. B. Bucur, T. Gregory, Chem. Rev. 2014, 114, 11683.
[14] A. J. Appleby, J. Jacquelin, J. P. Pompon, SAE Tech. Pap. 1977, 770381, DOI
10.4271/770381.
[15] P. N. J. Ross, in Proceedlngs 21st Intersoc. Energy Convers. Eng. Conf., San Diego,
California, 1986.
[16] M. C. Cheiky, L. G. Danczyk, M. C. Wehrey, SAE Tech. Pap. 1990, 901516, DOI
10.4271/901516.
[17] M. C. Cheiky, L. G. Danczyk, R. L. Scheffler, in Battery Conf. Appl. Adv. 1991 Proc. Sixth
Annu., 1991, pp. 29–36.
[18] L. G. Danczyk, R. L. Scheffler, R. S. Hobbs, SAE Tech. Pap. 1991, 911633, DOI
10.4271/911633.
[19] G. W. Merry, SAE Tech. Pap. 1991, 911912, DOI 10.4271/911912.
[20] M. C. Cheiky, L. G. Danczyk, M. C. Wehrey, SAE Tech. Pap. 1992, 920448, DOI
10.4271/920448.
[21] J. R. Goldstein, B. Koretz, IEEE Aerosp. Electron. Syst. Mag. 1993, 8, 34.
[22] C. Clark, K. Kinoshita, Zinc/Air Technology, December 1993 Meeting Report, Sandia
National Labs., Albuquerque, NM (United States), 1994.
[23] P. N. Ross, in Battery Conf. Appl. Adv. 1995 Proc. Tenth Annu., 1995, pp. 131–133.
148
[24] J. F. Cooper, D. Fleming, D. Hargrove, R. Koopman, K. Peterman, SAE Tech. Pap. 1995,
951948, DOI 10.4271/951948.
[25] D. Sieminski, in Battery Conf. Appl. Adv. 1997 Twelfth Annu., IEEE, Long Beach, CA, 1997,
pp. 171–180.
[26] F. G. Will, in Battery Conf. Appl. Adv. 1998 Thirteen. Annu., 1998, pp. 1–6.
[27] J. Goldstein, I. Brown, B. Koretz, J. Power Sources 1999, 80, 171.
[28] K. Tweed, “Eos Energy Storage Closes $23M Funding Round for Cheap Grid Batteries,” can
be found under http://www.greentechmedia.com/articles/read/eos-energy-storage-closes-
23m-funding-round, 2015.
[29] E. Wesoff, “Fluidic Energy Is the Biggest Zinc-Air Battery Startup You Haven’t Heard Of,”
can be found under http://www.greentechmedia.com/articles/read/Fluidic-Energy-is-the-
Biggest-Zinc-Air-Battery-Startup-You-Havent-Heard-Of, 2015.
[30] N. R. C. Government of Canada, “Canada News Centre - Archived - Government of Canada
and SDTC Announce New Clean Technology Funding in British Columbia,” can be found
under http://news.gc.ca/web/article-en.do?nid=950589, 2015.
[31] Y. Li, H. Dai, Chem. Soc. Rev. 2014, 43, 5257.
[32] S. G. Stewart, S. I. Kohn, K. R. Kelty, J. B. Straubel, Electric Vehicle Extended Range Hybrid
Battery Pack System, 2013, US8471521 B2.
[33] R. Eckl, P. Burda, A. Foerg, H. Finke, P. D.-I. M. Lienkamp, in Conf. Future Automot.
Technol. (Ed.: M. Lienkamp), Springer Fachmedien Wiesbaden, 2013, pp. 3–18.
[34] A. Santos, N. McGuckin, H. Y. Nakamoto, D. Gray, S. Liss, 2011.
[35] M. Guarnieri, in 2012 Third IEEE Hist. Electro-Technol. Conf. HISTELCON, 2012, pp. 1–6.
[36] “Global Plug-in Sales for 2016,” can be found under http://www.ev-
volumes.com/news/global-plug-in-sales-for-2016/, 2017.
[37] Energy Technology Perspectives 2017, International Energy Agency, Paris, 2017.
[38] S. Castle, N. Y. Times 2017.
[39] M. Hocking, J. Kan, P. Young, C. Terry, D. Begleiter, Welcome to the Lithium-Ion Age,
Deutsche Bank Markets Research, 2016.
[40] T. Placke, R. Kloepsch, S. Dühnen, M. Winter, J. Solid State Electrochem. 2017, 21, 1939.
[41] S. Saxena, J. MacDonald, S. Moura, Appl. Energy 2015, 157, 720.
[42] B. Nykvist, M. Nilsson, Nat. Clim. Change 2015, 5, 329.
[43] O. Schmidt, A. Hawkes, A. Gambhir, I. Staffell, Nat. Energy 2017, 6, nenergy2017110.
[44] C. Curry, “Lithium-ion Battery Costs: Squeezed Margins and New Business Models,” can be
found under https://about.bnef.com/blog/lithium-ion-battery-costs-squeezed-margins-new-
business-models/, 2017.
[45] S. M. Knupfer, R. Hensley, P. Hertzke, P. Schaufuss, N. Laverty, N. Kramer, Electrifying
Insights: How Automakers Can Drive Electrified Vehicle Sales and Profitability | McKinsey
& Company, McKinsey & Company, 2017.
[46] W. Sierzchula, S. Bakker, K. Maat, B. van Wee, Energy Policy 2014, 68, 183.
[47] Global EV Outlook 2017: Two Million and Counting, International Energy Agency, 2017.
[48] M. Singer, Consumer Views on Plug-in Electric Vehicles–National Benchmark Report
(Second Edition), National Renewable Energy Laboratory (NREL), Golden, CO, 2016.
149
[49] W. Li, R. Long, H. Chen, J. Geng, Renew. Sustain. Energy Rev. 2017, 78, 318.
[50] A. Dimitropoulos, P. Rietveld, J. N. van Ommeren, Transp. Res. Part Policy Pract. 2013, 55,
27.
[51] J. R. Kenworthy, F. B. Laube, Transp. Res. Part Policy Pract. 1999, 33, 691.
[52] M. Liebreich, 2017.
[53] J. Dahn, G. M. Ehrlich, in Linden’s Handb. Batter. Fourth Ed., McGraw Hill Professional,
Access Engineering, New York, 2011.
[54] D. Andre, S.-J. Kim, P. Lamp, S. F. Lux, F. Maglia, O. Paschos, B. Stiaszny, J. Mater. Chem.
A 2015, 3, 6709.
[55] M. Hagen, D. Hanselmann, K. Ahlbrecht, R. Maça, D. Gerber, J. Tübke, Adv. Energy Mater.
2015, 5, n/a.
[56] O. Gröger, H. A. Gasteiger, J.-P. Suchsland, J. Electrochem. Soc. 2015, 162, A2605.
[57] K. Kerman, A. Luntz, V. Viswanathan, Y.-M. Chiang, Z. Chen, J. Electrochem. Soc. 2017,
164, A1731.
[58] L. Fulton, A. Jenn, G. Tal, GFEI Working Paper 16: Can We Reach 100 Million Electric
Cars Worldwide by 2030? A Modelling/Scenario Analysis, Global Fuel Economy Initiative,
2017.
[59] D. McFadden, 1973.
[60] “Chinese-Made Electric Cars,” can be found under http://chinaautoweb.com/electric-cars/,
n.d.
[61] The Future of Trucks - Implications for Energy and the Environment, International Energy
Agency, 2017.
[62] J.-Q. Li, Int. J. Sustain. Transp. 2016, 10, 157.
[63] Y. Ye, L. H. Saw, Y. Shi, K. Somasundaram, A. A. O. Tay, Electrochimica Acta 2014, 134,
327.
[64] Q. Liu, C. Du, B. Shen, P. Zuo, X. Cheng, Y. Ma, G. Yin, Y. Gao, RSC Adv. 2016, 6, 88683.
[65] Y. Gao, J. Jiang, C. Zhang, W. Zhang, Z. Ma, Y. Jiang, J. Power Sources 2017, 356, 103.
[66] E. Akhavan-Rezai, M. F. Shaaban, E. F. El-Saadany, A. Zidan, in 2012 IEEE Power Energy
Soc. Gen. Meet., 2012, pp. 1–7.
[67] C. H. Dharmakeerthi, N. Mithulananthan, T. K. Saha, Int. J. Electr. Power Energy Syst. 2014,
57, 241.
[68] P. Liu, R. Ross, A. Newman, MRS Energy Amp Sustain.- Rev. J. 2015, 2, DOI
10.1557/mre.2015.13.
[69] S. Sripad, V. Viswanathan, ACS Energy Lett. 2017, 2, 1669.
[70] Y. Yamaguchi, in Encycl. Appl. Electrochem. (Eds.: G. Kreysa, K. Ota, R.F. Savinell),
Springer New York, New York, 2014, pp. 1161–1165.
[71] W. Liu, L. Chen, J. Tian, Environ. Sci. Technol. 2016, 50, 5412.
[72] J. Jung, L. Zhang, J. Zhang, Lead-Acid Battery Technologies: Fundamentals, Materials, and
Applications, CRC Press, Boca Raton, 2015.
[73] J. X. Weinert, A. F. Burke, X. Wei, J. Power Sources 2007, 172, 938.
[74] A. Salkind, G. Zguris, in Linden’s Handb. Batter. Fourth Ed., McGraw Hill Professional,
Access Engineering, New York, 2011.
150
[75] P. T. Moseley, D. A. J. Rand, K. Peters, J. Power Sources 2015, 295, 268.
[76] J. Yang, C. Hu, H. Wang, K. Yang, J. B. Liu, H. Yan, Int. J. Energy Res. 2017, 41, 336.
[77] E. Karden, S. Ploumen, B. Fricke, T. Miller, K. Snyder, J. Power Sources 2007, 168, 2.
[78] A. Jaiswal, S. C. Chalasani, J. Energy Storage 2015, 1, 15.
[79] The Advanced Lead-Acid Battery Consortium, “Lead-Carbon Batteries to Boost Market
Prospects of 48V Hybrids — ALABC,” can be found under http://www.alabc.org/press-
releases/lead-carbon-batteries-to-boost-market-prospects-of-48v-hybrids, n.d.
[80] M. Fetcenko, J. Koch, in Linden’s Handb. Batter. Fourth Ed., McGraw Hill Professional,
Access Engineering, New York, 2011.
[81] A. Manthiram, Y. Fu, S.-H. Chung, C. Zu, Y.-S. Su, Chem. Rev. 2014, 114, 11751.
[82] D. Eroglu, K. R. Zavadil, K. G. Gallagher, J. Electrochem. Soc. 2015, 162, A982.
[83] Y.-X. Yin, S. Xin, Y.-G. Guo, L.-J. Wan, Angew. Chem. Int. Ed. 2013, 52, 13186.
[84] X.-B. Cheng, J.-Q. Huang, Q. Zhang, J. Electrochem. Soc. 2018, 165, A6058.
[85] M. A. Pope, I. A. Aksay, Adv. Energy Mater. 2015, 5, 1500124.
[86] P. Bonnick, E. Nagai, J. Muldoon, J. Electrochem. Soc. 2018, 165, A6005.
[87] Q.-C. Liu, T. Liu, D.-P. Liu, Z.-J. Li, X.-B. Zhang, Y. Zhang, Adv. Mater. 2016, 28, 8413.
[88] F. Mizuno, S. Nakanishi, Y. Kotani, S. Yokoishi, H. Iba, Electrochemistry 2010, 78, 403.
[89] A. C. Luntz, B. D. McCloskey, Chem. Rev. 2014, 114, 11721.
[90] A. Manthiram, L. Li, Adv. Energy Mater. 2015, 5, n/a.
[91] J. Christensen, P. Albertus, R. S. Sanchez-Carrera, T. Lohmann, B. Kozinsky, R. Liedtke, J.
Ahmed, A. Kojic, J. Electrochem. Soc. 2012, 159, R1.
[92] K. G. Gallagher, S. Goebel, T. Greszler, M. Mathias, W. Oelerich, D. Eroglu, V. Srinivasan,
Energy Environ. Sci. 2014, 7, 1555.
[93] Y. Li, J. Lu, ACS Energy Lett. 2017, 2, 1370.
[94] K. F. Blurton, A. F. Sammells, J. Power Sources 1979, 4, 263.
[95] T. B. Atwater, A. Dobley, in Lindens Handb. Batter. 4th Ed., McGraw Hill Professional,
New York, 2010.
[96] R. Eckl, B. Ehrl, M. Lienkamp, 2013.
[97] J. Bockstette, K. Habermann, J. Ogrzewalla, M. Pischinger, D. Seibert, SAE Int. J. Altern.
Powertrains 2013, 2, 156.
[98] F. Larsson, A. Rytinki, I. Ahmed, I. Albinsson, B.-E. Mellander, Batteries 2017, 3, 1.
[99] B. Pivovar, H2 at Scale: Deeply Decarbonizing Our Energy System, NREL (National
Renewable Energy Laboratory (NREL), Golden, CO (United States)), 2016.
[100] Technology Roadmap: Hydrogen and Fuel Cells, International Energy Agency, Paris, 2017.
[101] J. Pontes, “Fuel Cells 2016,” can be found under http://ev-sales.blogspot.com/2017/02/fuel-
cells-2016.html, n.d.
[102] “Toyota Mirai US car sales figures,” can be found under http://carsalesbase.com/us-car-
sales-data/toyota/toyota-mirai/, n.d.
[103] N. Guerrero Moreno, M. Cisneros Molina, D. Gervasio, J. F. Pérez Robles, Renew. Sustain.
Energy Rev. 2015, 52, 897.
[104] M. Wei, S. J. Smith, M. D. Sohn, Appl. Energy 2017, 191, 346.
[105] M. Miotti, J. Hofer, C. Bauer, Int. J. Life Cycle Assess. 2017, 22, 94.
151
[106] A. Kongkanand, M. F. Mathias, J. Phys. Chem. Lett. 2016, 7, 1127.
[107] J. Wang, Energy 2015, 80, 509.
[108] D. Banham, S. Ye, K. Pei, J. Ozaki, T. Kishimoto, Y. Imashiro, J. Power Sources 2015, 285,
334.
[109] D. Banham, T. Kishimoto, T. Sato, Y. Kobayashi, K. Narizuka, J. Ozaki, Y. Zhou, E.
Marquez, K. Bai, S. Ye, J. Power Sources 2017, 344, 39.
[110] F. T. Wagner, B. Lakshmanan, M. F. Mathias, J. Phys. Chem. Lett. 2010, 1, 2204.
[111] Fuel Cells Bull. 2016, 2016, 12.
[112] B. Vinsnic, “Nikola CEO: Fuel-Cell Class 8 truck on track for 2021 - SAE International,”
can be found under http://articles.sae.org/15616/, 2017.
[113] J. Alazemi, J. Andrews, Renew. Sustain. Energy Rev. 2015, 48, 483.
[114] M. Melaina, M. Penev, Hydrogen Station Cost Estimates: Comparing Hydrogen Station
Cost Calculator Results with Other Recent Estimates, NREL (National Renewable Energy
Laboratory (NREL), Golden, CO (United States)), 2013.
[115] N. Qin, P. Brooker, S. Srinivasan, 2014.
[116] A. Schroeder, T. Traber, Energy Policy 2012, 43, 136.
[117] A. Lajunen, T. Lipman, Energy 2016, 106, 329.
[118] C. M. Kalamaras, A. M. Efstathiou, in Conf. Pap. Sci., Hindawi Publishing Corporation,
2013.
[119] S. Ramachandran, U. Stimming, Energy Environ. Sci. 2015, 8, 3313.
[120] I. Staffell, P. Dodds, The Role of Hydrogen and Fuel Cells in Future Energy Systems, H2FC
SUPERGEN, London, UK, 2017.
[121] P. Zihrul, I. Hartung, S. Kirsch, G. Huebner, F. Hasché, H. A. Gasteiger, J. Electrochem.
Soc. 2016, 163, F492.
[122] T. Hua, R. Ahluwalia, L. Eudy, G. Singer, B. Jermer, N. Asselin-Miller, S. Wessel, T.
Patterson, J. Marcinkoski, J. Power Sources 2014, 269, 975.
[123] Ballard Power Systems, “Ballard Powered Fuel Cell Electric Bus Achieves 25,000 Hours of
Revenue Operation,” can be found under http://www.ballard.com/modules-display/news-
releases/2017/08/29/ballard-powered-fuel-cell-electric-bus-achieves-25-000-hours-of-
revenue-operation, 2017.
[124] AC Transit, “AC Transit’s Fuel Cell Program Breaks 25,000 Hour Operating Record,” can
be found under http://www.actransit.org/2017/07/11/fuel-cell-record-25k/, 2017.
[125] L. Eudy, M. Post, M. Jeffers, Fuel Cell Buses in US Transit Fleets: Current Status 2016,
National Renewable Energy Laboratory (NREL), 2016.
[126] J. Kurtz, S. Sprik, C. Ainscough, G. Saur, 2017.
[127] A. R. Mainar, L. C. Colmenares, J. A. Blázquez, I. Urdampilleta, Int. J. Energy Res. 2017,
42, 903.
[128] D. U. Lee, P. Xu, Z. P. Cano, A. G. Kashkooli, M. G. Park, Z. Chen, J. Mater. Chem. A
2016, 4, 7107.
[129] S. W. T. Price, S. J. Thompson, X. Li, S. F. Gorman, D. Pletcher, A. E. Russell, F. C. Walsh,
R. G. A. Wills, J. Power Sources 2014, 259, 43.
[130] P. N. Ross, H. Sokol, J. Electrochem. Soc. 1984, 131, 1742.
152
[131] C. A. Friesen, R. Krishnan, G. Friensen, Electrochemical Cell with Spacers for Flow
Management System, 2013, US8492052 B2.
[132] S. Amendola, L. Johnson, M. Binder, M. Kunz, P. J. Black, M. Oster, S. Sharp-Goldman, T.
Chciuk, R. Johnson, Electrically Rechargeable, Metal-Air Battery Systems and Methods,
2013, US20130115531 A1.
[133] D. Wolfe, C. A. Friesen, P. B. Johnson, Ionic Liquid Containing Sulfonate Ions, 2014,
US8741491 B2.
[134] M. Pinto, S. Smedley, J. A. Colborn, Refuelable Electrochemical Power Source Capable of
Being Maintained in a Substantially Constant Full Condition and Method of Using the Same,
2004, US6706433 B2.
[135] M. Pinto, S. Smedley, G. Wu, Recirculating Anode, 2004, US20040251126 A1.
[136] W. A. Garcia, H. F. Wilkins, Metal-Air Battery with Reduced Gas Diffusion Layer, 2014,
US8871394 B1.
[137] J. Passaniti, D. Carpenter, R. McKenzie, in Lindens Handb. Batter. 4th Ed., McGraw Hill
Professional, New York, 2010.
[138] E. Deiss, F. Holzer, O. Haas, Electrochimica Acta 2002, 47, 3995.
[139] H. Ma, B. Wang, Y. Fan, W. Hong, Energies 2014, 7, 6549.
[140] W. Hong, H. Li, B. Wang, Int J Electrochem Sci 2016, 11, 3843.
[141] P.-C. Li, Y.-J. Chien, C.-C. Hu, J. Power Sources 2016, 313, 37.
[142] O. Haas, F. Holzer, K. Müller, S. Müller, in Handb. Fuel Cells, John Wiley & Sons, Ltd,
Hoboken, 2010.
[143] K. Kordesch, V. Hacker, in Handb. Fuel Cells, John Wiley & Sons, Ltd, Hoboken, 2010.
[144] J. W. Diggle, A. R. Despic, J. O. Bockris, J. Electrochem. Soc. 1969, 116, 1503.
[145] A. R. Despić, M. M. Purenović, J. Electrochem. Soc. 1974, 121, 329.
[146] M. V. Simičić, K. I. Popov, N. V. Krstajić, J. Electroanal. Chem. 2000, 484, 18.
[147] R. Y. Wang, D. W. Kirk, G. X. Zhang, J. Electrochem. Soc. 2006, 153, C357.
[148] R. V. Moshtev, P. Zlatilova, J. Appl. Electrochem. 1978, 8, 213.
[149] J. McBreen, J. Electrochem. Soc. 1972, 119, 1620.
[150] F. R. McLarnon, E. J. Cairns, J. Electrochem. Soc. 1991, 138, 645.
[151] Y. Shen, K. Kordesch, J. Power Sources 2000, 87, 162.
[152] K. W. Choi, D. N. Bennion, J. Newman, J. Electrochem. Soc. 1976, 123, 1616.
[153] K. W. Choi, D. Hamby, D. N. Bennion, J. Newman, J. Electrochem. Soc. 1976, 123, 1628.
[154] W. G. Sunu, D. N. Bennion, J. Electrochem. Soc. 1980, 127, 2007.
[155] W. G. Sunu, D. N. Bennion, J. Electrochem. Soc. 1980, 127, 2017.
[156] R. E. F. Einerhand, W. Visscher, J. J. M. de Goeij, E. Barendrecht, J. Electrochem. Soc.
1991, 138, 1.
[157] R. E. F. Einerhand, W. Visscher, J. J. M. de Goeij, E. Barendrecht, J. Electrochem. Soc.
1991, 138, 7.
[158] R. Jain, T. C. Adler, F. R. McLarnon, E. J. Cairns, J. Appl. Electrochem. 1992, 22, 1039.
[159] T. C. Adler, F. R. McLarnon, E. J. Cairns, J. Electrochem. Soc. 1993, 140, 289.
[160] S. Müller, F. Holzer, O. Haas, J. Appl. Electrochem. 1998, 28, 895.
[161] J. Yu, H. Yang, X. Ai, X. Zhu, J. Power Sources 2001, 103, 93.
153
[162] S. Wang, Z. Yang, L. Zeng, J. Electrochem. Soc. 2009, 156, A18.
[163] D. Zeng, Z. Yang, S. Wang, X. Ni, D. Ai, Q. Zhang, Electrochimica Acta 2011, 56, 4075.
[164] P. Bonnick, J. R. Dahn, J. Electrochem. Soc. 2012, 159, A981.
[165] J. Huang, Z. Yang, R. Wang, Z. Zhang, Z. Feng, X. Xie, J. Mater. Chem. A 2015, 3, 7429.
[166] R. F. Thornton, E. J. Carlson, J. Electrochem. Soc. 1980, 127, 1448.
[167] T. P. Dirkse, J. Electrochem. Soc. 1981, 128, 1412.
[168] C.-Y. Jung, T.-H. Kim, W.-J. Kim, S.-C. Yi, Energy 2016, 102, 694.
[169] T. S. Chang, Y. Y. Wang, C. C. Wan, J. Power Sources 1983, 10, 167.
[170] X. G. Zhang, J. Power Sources 2006, 163, 591.
[171] E. G. Gagnon, Y.-M. Wang, J. Electrochem. Soc. 1987, 134, 2091.
[172] T. S. Lee, J. Electrochem. Soc. 1971, 118, 1278.
[173] C. W. Lee, S. W. Eom, K. Sathiyanarayanan, M. S. Yun, Electrochimica Acta 2006, 52,
1588.
[174] J. Fu, Z. P. Cano, M. G. Park, A. Yu, M. Fowler, Z. Chen, Adv. Mater. 2017, 29, 1604685.
[175] J. F. Parker, C. N. Chervin, E. S. Nelson, D. R. Rolison, J. W. Long, Energy Environ. Sci.
2014, 7, 1117.
[176] Z. Yan, E. Wang, L. Jiang, G. Sun, RSC Adv. 2015, 5, 83781.
[177] M. Chamoun, B. J. Hertzberg, T. Gupta, D. Davies, S. Bhadra, B. Van Tassell, C. Erdonmez,
D. A. Steingart, NPG Asia Mater. 2015, 7, e178.
[178] K. Bass, P. J. Mitchell, G. D. Wilcox, J. Smith, J. Power Sources 1991, 35, 333.
[179] M. N. Masri, A. A. Mohamad, Corros. Sci. 2009, 51, 3025.
[180] C. Biegler, R. L. Deutscher, S. Fletcher, S. Hua, R. Woods, J. Electrochem. Soc. 1983, 130,
2303.
[181] R. Othman, A. H. Yahaya, A. K. Arof, J. Appl. Electrochem. 2002, 32, 1347.
[182] M. N. Masri, A. A. Mohamad, J. Electrochem. Soc. 2013, 160, A715.
[183] J. Fu, D. U. Lee, F. M. Hassan, L. Yang, Z. Bai, M. G. Park, Z. Chen, Adv. Mater. 2015, 27,
5617.
[184] J. Fu, J. Zhang, X. Song, H. Zarrin, X. Tian, J. Qiao, L. Rasen, K. Li, Z. Chen, Energy
Environ. Sci. 2016, 9, 663.
[185] D. U. Lee, J. Fu, M. G. Park, H. Liu, A. Ghorbani Kashkooli, Z. Chen, Nano Lett. 2016, 16,
1794.
[186] J. McBreen, E. Gannon, Electrochimica Acta 1981, 26, 1439.
[187] J. McBreen, M. G. Chu, G. Adzic, J. Electrochem. Soc. 1981, 128, 2287.
[188] J. McBreen, E. Gannon, J. Electrochem. Soc. 1983, 130, 1980.
[189] J. McBreen, E. Gannon, J. Power Sources 1985, 15, 169.
[190] F. Moser, F. Fourgeot, R. Rouget, O. Crosnier, T. Brousse, Electrochimica Acta 2013, 109,
110.
[191] Y. Sato, M. Kanda, H. Niki, M. Ueno, K. Murata, T. Shirogami, T. Takamura, J. Power
Sources 1983, 9, 147.
[192] J.-S. Chen, L.-F. Wang, J. Appl. Electrochem. 1996, 26, 227.
[193] H. Yang, H. Zhang, X. Wang, J. Wang, X. Meng, Z. Zhou, J. Electrochem. Soc. 2004, 151,
A2126.
154
[194] X. Fan, Z. Yang, R. Wen, B. Yang, W. Long, J. Power Sources 2013, 224, 80.
[195] R. Wang, Z. Yang, B. Yang, X. Fan, T. Wang, J. Power Sources 2014, 246, 313.
[196] J. Zhu, Y. Zhou, J. Power Sources 1998, 73, 266.
[197] J. Vatsalarani, D. C. Trivedi, K. Ragavendran, P. C. Warrier, J. Electrochem. Soc. 2005, 152,
A1974.
[198] Y. F. Yuan, L. Q. Yu, H. M. Wu, J. L. Yang, Y. B. Chen, S. Y. Guo, J. P. Tu, Electrochimica
Acta 2011, 56, 4378.
[199] X. Fan, Z. Yang, W. Long, Z. Zhao, B. Yang, Electrochimica Acta 2013, 92, 365.
[200] Y. F. Yuan, J. P. Tu, H. M. Wu, C. Q. Zhang, S. F. Wang, X. B. Zhao, J. Power Sources
2007, 165, 905.
[201] S.-H. Lee, C.-W. Yi, K. Kim, J. Phys. Chem. C 2011, 115, 2572.
[202] X. G. Zhang, in Encycl. Electrochem. Power Sources (Ed.: J. Garche), Elsevier, Amsterdam,
2009, pp. 454–468.
[203] V. Caramia, B. Bozzini, Mater. Renew. Sustain. Energy 2014, 3, 1.
[204] M. Xu, D. G. Ivey, Z. Xie, W. Qu, J. Power Sources 2015, 283, 358.
[205] D. U. Lee, J. Fu, Z. Chen, 2016.
[206] A. R. Mainar, O. Leonet, M. Bengoechea, I. Boyano, I. de Meatza, A. Kvasha, A. Guerfi, J.
Alberto Blázquez, Int. J. Energy Res. 2016, n/a.
[207] P. Pei, K. Wang, Z. Ma, Appl. Energy 2014, 128, 315.
[208] K. Harting, U. Kunz, T. Turek, Z. Für Phys. Chem. Int. J. Res. Phys. Chem. Chem. Phys.
2011, 226, 151.
[209] T. J. Simons, A. A. J. Torriero, P. C. Howlett, D. R. MacFarlane, M. Forsyth, Electrochem.
Commun. 2012, 18, 119.
[210] M. Kar, T. J. Simons, M. Forsyth, D. R. MacFarlane, Phys. Chem. Chem. Phys. 2014, 16,
18658.
[211] C.-C. Yang, S.-J. Lin, J. Power Sources 2002, 112, 497.
[212] A. A. Mohamad, N. S. Mohamed, M. Z. A. Yahya, R. Othman, S. Ramesh, Y. Alias, A. K.
Arof, Solid State Ion. 2003, 156, 171.
[213] J. Liu, C. Guan, C. Zhou, Z. Fan, Q. Ke, G. Zhang, C. Liu, J. Wang, Adv. Mater. 2016, n/a.
[214] M. C. Cheiky, Electrolyte Distributing System and Method, 1997, US5615717 A.
[215] L. T. Skeggs, J. E. Young, E. C. Cherry, Cathode Air Recirculation and Moisture Control,
1996, EP0696384 B1.
[216] M. C. Cheiky, Coated Cathode for Rechargeable Metal Battery, 1995, US5432022 A.
[217] J. R. Goldstein, Y. Harats, Y. Sharon, N. Naimer, Scrubber System for Removing Carbon
Dioxide from a Metal-Air or Fuel Cell Battery, 1997, US5595949 A.
[218] C. S. Pedicni, Load Responsive Air Door for an Electrochemical Cell, 2002, US6350537
B1.
[219] T. P. Dirkse, N. A. Hampson, Electrochimica Acta 1972, 17, 383.
[220] R. J. Gilliam, J. W. Graydon, D. W. Kirk, S. J. Thorpe, Int. J. Hydrog. Energy 2007, 32, 359.
[221] E. G. Gagnon, J. Electrochem. Soc. 1986, 133, 1989.
[222] E. G. Gagnon, J. Electrochem. Soc. 1991, 138, 3173.
[223] T. C. Adler, F. R. McLarnon, E. J. Cairns, Ind. Eng. Chem. Res. 1998, 37, 3237.
155
[224] J. T. Nichols, F. R. McLarnon, E. J. Cairns, Chem. Eng. Commun. 1985, 37, 355.
[225] D. U. Lee, J.-Y. Choi, K. Feng, H. W. Park, Z. Chen, Adv. Energy Mater. 2014, 4, 1301389.
[226] E. L. Dewi, K. Oyaizu, H. Nishide, E. Tsuchida, J. Power Sources 2003, 115, 149.
[227] N. Fujiwara, M. Yao, Z. Siroma, H. Senoh, T. Ioroi, K. Yasuda, J. Power Sources 2011, 196,
808.
[228] F. Büker, D. Hertkorn, C. Müller, H. Reinecke, ECS Trans. 2014, 58, 69.
[229] B. Bertolotti, H. Messaoudi, L. Chikh, C. Vancaeyzeele, S. Alfonsi, O. Fichet, J. Power
Sources 2015, 274, 488.
[230] J. Zhang, J. Fu, X. Song, G. Jiang, H. Zarrin, P. Xu, K. Li, A. Yu, Z. Chen, Adv. Energy
Mater. 2016, n/a.
[231] S. Zhu, Z. Chen, B. Li, D. Higgins, H. Wang, H. Li, Z. Chen, Electrochimica Acta 2011, 56,
5080.
[232] D. U. Lee, H. W. Park, D. Higgins, L. Nazar, Z. Chen, J. Electrochem. Soc. 2013, 160, F910.
[233] J. W. D. Ng, M. Tang, T. F. Jaramillo, Energy Environ. Sci. 2014, 7, 2017.
[234] C. Ma, N. Xu, J. Qiao, S. Jian, J. Zhang, Int. J. Hydrog. Energy 2016, 41, 9211.
[235] F. Bidault, D. J. L. Brett, P. H. Middleton, N. P. Brandon, J. Power Sources 2009, 187, 39.
[236] F. Bidault, A. Kucernak, J. Power Sources 2010, 195, 2549.
[237] K. Tomantschger, K. V. Kordesch, J. Power Sources 1989, 25, 195.
[238] K. Kordesch, M. Cifrain, Handb. Fuel Cells 2010.
[239] G. V. Shteinberg, A. V. Dribinsky, I. A. Kukushkina, L. N. Mokorousov, V. S. Bagotzky, J.
Electroanal. Chem. Interfacial Electrochem. 1984, 180, 619.
[240] A. L. Dicks, J. Power Sources 2006, 156, 128.
[241] V. Neburchilov, H. Wang, J. J. Martin, W. Qu, J. Power Sources 2010, 195, 1271.
[242] J. Giner, C. Hunter, J. Electrochem. Soc. 1969, 116, 1124.
[243] P. Björnbom, Electrochimica Acta 1987, 32, 115.
[244] M. L. Perry, J. Newman, E. J. Cairns, J. Electrochem. Soc. 1998, 145, 5.
[245] N. Staud, P. N. Ross, J. Electrochem. Soc. 1986, 133, 1079.
[246] K. Kinoshita, in Handb. Battery Mater. (Eds.: -Ing Claus Daniel, J.O. Besenhard), Wiley-
VCH Verlag GmbH & Co. KGaA, Weinheim, 2011, pp. 269–284.
[247] P. Vanýsek, in CRC Handb. Chem. Phys. 97th Ed., CRC Press, Boca Raton, 2016.
[248] P. N. Ross, M. Sattler, J. Electrochem. Soc. 1988, 135, 1464.
[249] N. Staud, H. Sokol, P. N. Ross, J. Electrochem. Soc. 1989, 136, 3570.
[250] S. Müller, K. Striebel, O. Haas, Electrochimica Acta 1994, 39, 1661.
[251] S. Müller, F. Holzer, H. Arai, O. Haas, J. New Mater. Electrochem. Syst. 1999, 2, 227.
[252] T. Thippani, S. Mandal, G. Wang, V. K. Ramani, R. Kothandaraman, RSC Adv. 2016, 6,
71122.
[253] J.-F. Drillet, F. Holzer, T. Kallis, S. Müller, V. M. Schmidt, Phys. Chem. Chem. Phys. 2001,
3, 368.
[254] E. Gülzow, N. Wagner, M. Schulze, Fuel Cells 2003, 3, 67.
[255] D. Wittmaier, N. Wagner, K. A. Friedrich, H. M. A. Amin, H. Baltruschat, J. Power Sources
2014, 265, 299.
156
[256] X. Li, D. Pletcher, A. E. Russell, F. C. Walsh, R. G. A. Wills, S. F. Gorman, S. W. T. Price,
S. J. Thompson, Electrochem. Commun. 2013, 34, 228.
[257] S. B. Sherman, Z. P. Cano, M. Fowler, Z. Chen, Energy 2018 Vol 5 Pages 121-145 2018,
DOI 10.3934/energy.2018.1.121.
[258] W. A. Armstrong, An Oxygen Electrode Based on Nickel/Cobalt Spinel, Defence Research
Establishment Ottawa, Ottawa, Ontario (Canada), 1981.
[259] F. Cheng, J. Chen, Chem. Soc. Rev. 2012, 41, 2172.
[260] Z.-L. Wang, D. Xu, J.-J. Xu, X.-B. Zhang, Chem. Soc. Rev. 2014, 43, 7746.
[261] L. Jöerissen, in Encycl. Electrochem. Power Sources, Elsevier, Amsterdam, 2009, pp. 356–
371.
[262] S. Gupta, W. Kellogg, H. Xu, X. Liu, J. Cho, G. Wu, Chem. – Asian J. 2016, 11, 10.
[263] Y. Gorlin, B. Lassalle-Kaiser, J. D. Benck, S. Gul, S. M. Webb, V. K. Yachandra, J. Yano,
T. F. Jaramillo, J. Am. Chem. Soc. 2013, 135, 8525.
[264] Y. Shimizu, K. Uemura, H. Matsuda, N. Miura, N. Yamazoe, J. Electrochem. Soc. 1990,
137, 3430.
[265] J.-I. Jung, H. Y. Jeong, J.-S. Lee, M. G. Kim, J. Cho, Angew. Chem. Int. Ed. 2014, 53, 4582.
[266] J. Suntivich, H. A. Gasteiger, N. Yabuuchi, H. Nakanishi, J. B. Goodenough, Y. Shao-Horn,
Nat. Chem. 2011, 3, 546.
[267] J. Suntivich, K. J. May, H. A. Gasteiger, J. B. Goodenough, Y. Shao-Horn, Science 2011,
334, 1383.
[268] J.-I. Jung, H. Y. Jeong, M. G. Kim, G. Nam, J. Park, J. Cho, Adv. Mater. 2015, 27, 266.
[269] J.-I. Jung, S. Park, M.-G. Kim, J. Cho, Adv. Energy Mater. 2015, 5, n/a.
[270] J. Ponce, J.-L. Rehspringer, G. Poillerat, J. L. Gautier, Electrochimica Acta 2001, 46, 3373.
[271] M. Hamdani, R. N. Singh, P. Chartier, Int. J. Electrochem. Sci. 2010, 5, 556.
[272] F. Cheng, J. Shen, B. Peng, Y. Pan, Z. Tao, J. Chen, Nat. Chem. 2011, 3, 79.
[273] D. Pletcher, X. Li, S. W. T. Price, A. E. Russell, T. Sönmez, S. J. Thompson, Electrochimica
Acta 2016, 188, 286.
[274] M. G. Park, D. U. Lee, M. H. Seo, Z. P. Cano, Z. Chen, Small 2016, 12, 2707.
[275] W. Song, Z. Ren, S.-Y. Chen, Y. Meng, S. Biswas, P. Nandi, H. A. Elsen, P.-X. Gao, S. L.
Suib, ACS Appl. Mater. Interfaces 2016, 8, 20802.
[276] X. Han, X. Wu, C. Zhong, Y. Deng, N. Zhao, W. Hu, Nano Energy 2017, 31, 541.
[277] J.-T. Ren, G.-G. Yuan, C.-C. Weng, Z.-Y. Yuan, ACS Sustain. Chem. Eng. 2018, 6, 707.
[278] X. Han, G. He, Y. He, J. Zhang, X. Zheng, L. Li, C. Zhong, W. Hu, Y. Deng, T.-Y. Ma, Adv.
Energy Mater. 2018, 8, 1702222.
[279] X. Liu, M. Park, M. G. Kim, S. Gupta, X. Wang, G. Wu, J. Cho, Nano Energy 2016, 20,
315.
[280] J. Park, M. Risch, G. Nam, M. Park, T. J. Shin, S. Park, M. G. Kim, Y. Shao-Horn, J. Cho,
Energy Environ. Sci. 2017, 10, 129.
[281] A. K. Shukla, S. Venugopalan, B. Hariprakash, J. Power Sources 2001, 100, 125.
[282] K. Watanabe, T. Kikuoka, N. Kumagai, J. Appl. Electrochem. 1995, 25, 219.
[283] Y. L. Cao, H. X. Yang, X. P. Ai, L. F. Xiao, J. Electroanal. Chem. 2003, 557, 127.
157
[284] J. Yan, Z. Fan, W. Sun, G. Ning, T. Wei, Q. Zhang, R. Zhang, L. Zhi, F. Wei, Adv. Funct.
Mater. 2012, 22, 2632.
[285] S. L. Medway, C. A. Lucas, A. Kowal, R. J. Nichols, D. Johnson, J. Electroanal. Chem.
2006, 587, 172.
[286] S. Yamabi, H. Imai, J. Mater. Chem. 2002, 12, 3773.
[287] X. Qu, D. Jia, J. Cryst. Growth 2009, 311, 1223.
[288] K. Harrison, L. B. Hazell, Surf. Interface Anal. 1992, 18, 368.
[289] S. Evans, Surf. Interface Anal. 1992, 18, 323.
[290] M. C. Biesinger, B. P. Payne, A. P. Grosvenor, L. W. M. Lau, A. R. Gerson, R. St. C. Smart,
Appl. Surf. Sci. 2011, 257, 2717.
[291] I. G. Casella, M. R. Guascito, M. G. Sannazzaro, J. Electroanal. Chem. 1999, 462, 202.
[292] M. Schulze, R. Reissner, M. Lorenz, U. Radke, W. Schnurnberger, Electrochimica Acta
1999, 44, 3969.
[293] D. Gioia, A. Laurita, G. D. Bello, I. G. Casella, J. Solid State Electrochem. 2016, 20, 3383.
[294] A. N. Mansour, C. A. Melendres, Surf. Sci. Spectra 1994, 3, 271.
[295] J.-G. Kim, D. L. Pugmire, D. Battaglia, M. A. Langell, Appl. Surf. Sci. 2000, 165, 70.
[296] J. Yang, H. Liu, W. N. Martens, R. L. Frost, J. Phys. Chem. C 2010, 114, 111.
[297] C. Yuan, J. Li, L. Hou, X. Zhang, L. Shen, X. W. (David) Lou, Adv. Funct. Mater. 2012, 22,
4592.
[298] J. F. Marco, J. R. Gancedo, M. Gracia, J. L. Gautier, E. Ríos, F. J. Berry, J. Solid State Chem.
2000, 153, 74.
[299] B. P. Payne, M. C. Biesinger, N. S. McIntyre, J. Electron Spectrosc. Relat. Phenom. 2012,
185, 159.
[300] H. Arai, S. Müller, O. Haas, J. Electrochem. Soc. 2000, 147, 3584.
[301] X.-Z. Yuan, C. Song, H. Wang, J. Zhang, in Electrochem. Impedance Spectrosc. PEM Fuel
Cells Fundam. Appl., Springer London, London, 2010, pp. 139–192.
[302] M. De Koninck, B. Marsan, Electrochimica Acta 2008, 53, 7012.
[303] Y. Liang, Y. Li, H. Wang, J. Zhou, J. Wang, T. Regier, H. Dai, Nat. Mater. 2011, 10, 780.
[304] M. Prabu, K. Ketpang, S. Shanmugam, Nanoscale 2014, 6, 3173.
[305] J. N. Soderberg, A. C. Co, A. H. C. Sirk, V. I. Birss, J. Phys. Chem. B 2006, 110, 10401.
[306] X. Ge, A. Sumboja, D. Wuu, T. An, B. Li, F. W. T. Goh, T. S. A. Hor, Y. Zong, Z. Liu, ACS
Catal. 2015, 5, 4643.
[307] B. V. Tilak, S. Venkatesh, S. K. Rangarajan, J. Electrochem. Soc. 1989, 136, 1977.
[308] Z. X. Liu, Z. P. Li, H. Y. Qin, B. H. Liu, J. Power Sources 2011, 196, 4972.
[309] A. T. Marshall, L. Vaisson-Béthune, Electrochem. Commun. 2015, 61, 23.
[310] S. Panero, in Encycl. Electrochem. Power Sources (Ed.: J. Garche), Elsevier, Amsterdam,
2009, pp. 14–22.
[311] S. H. Masood, W. Q. Song, Mater. Des. 2004, 25, 587.
[312] X. He, Q. Liu, J. Liu, R. Li, H. Zhang, R. Chen, J. Wang, J. Alloys Compd. 2017, 724, 130.
[313] X. Guo, T. Zheng, G. Ji, N. Hu, C. Xu, Y. Zhang, J. Mater. Chem. A 2018, 6, 10243.
[314] J. Benziger, J. Nehlsen, D. Blackwell, T. Brennan, J. Itescu, J. Membr. Sci. 2005, 261, 98.
158
[315] R. Banerjee, J. Hinebaugh, H. Liu, R. Yip, N. Ge, A. Bazylak, Int. J. Hydrog. Energy 2016,
41, 14885.
[316] P. Glaris, J.-F. Coulon, M. Dorget, F. Poncin-Epaillard, Polymer 2013, 54, 5858.
[317] S. A. A. Mansour, Mater. Chem. Phys. 1994, 36, 317.
[318] L. Ouyang, Q. Liu, C. Xu, C. Liu, H. Liang, Talanta 2017, 164, 283.
[319] B. Małecka, A. Łącz, E. Drożdż, A. Małecki, J. Therm. Anal. Calorim. 2015, 119, 1053.
[320] Y. Takagi, J.-C. Lee, S. Yagi, H. Yamane, T. Wano, D. Kitagawa, A. El Salmawy, Polymer
2011, 52, 4099.
[321] X. Tan, H. Gao, M. Yang, Y. Luan, W. Dong, Z. Jin, J. Yu, Y. Qi, Y. Feng, G. Wang, J.
Alloys Compd. 2014, 608, 278.
[322] Q. Wang, S. Liu, H. Sun, Q. Lu, Ind. Eng. Chem. Res. 2014, 53, 7917.
[323] D. U. Lee, J. Li, M. G. Park, M. H. Seo, W. Ahn, I. Stadelmann, L. Ricardez-Sandoval, Z.
Chen, ChemSusChem 2017, 10, 2258.
159
Appendix
Theoretical Specific Energy Calculation
Unlike conventional batteries, metal-air batteries gain mass as they are discharged. This is
due to oxidation of the metal from O2, which enters from outside the battery during the discharge
process. Therefore, the “instantaneous” theoretical specific energy of a metal-air battery changes
as it is discharged, and is governed by Equation A.1:
Instantaneous Specific Energy (Wh kg−1) = F∙n∙OCV
3.6∙
1
DOD∙MM+O+(1−DOD)∙MMetal
= F∙n∙OCV
3.6∙
1
(MM+O−MMetal)∙DOD+MMetal
(Equation A.1)
where F is the Faraday constant, n is the number of electrons transferred per metal ion, OCV is the
metal-air battery’s nominal voltage, DOD is the fractional depth of discharge (0 for fully charged
state, 1 for fully discharged state), MMetal is the molar mass of the metal anode and MM+O is the
combined molar mass of the metal anode and the stoichiometric amount of O2 that enters the
battery. To calculate the overall theoretical specific energy of the metal-air battery, Equation A.1
must be integrated:
160
Specific Energy (Wh kg−1) = F∙n∙OCV
3.6∫
1
(MM+O−MMetal)∙DOD+MMetald(DOD)
1
0
= F∙n∙OCV
3.6[
ln [(MM+O−MMetal)∙DOD+MMetal]
MM+O−MMetal+ C]
where C is a constant. Evaluating from DOD=0 to DOD=1 reveals the overall theoretical specific
energy of the metal-air battery (Equation A.2):
Specific Energy (Wh kg−1) = F∙n∙OCV
3.6[
ln [(MM+O−MMetal)+MMetal]
MM+O−MMetal−
ln[MMetal]
MM+O−MMetal]
= F∙n∙OCV
3.6[
ln [MM+O MMetal⁄ ]
MM+O−MMetal] (Equation A.2)
By accounting for O2 uptake, the specific energy calculated with Equation A.2 enables a more
realistic comparison of metal-air battery energy densities, either between each other or with
conventional closed-system battery chemistries. This equation is thus used to calculate the specific
energies in Figure 1.1.
161
Theoretical Metal-Air Battery Parameters
For each of the metal-air battery chemistries presented in Figure 1.1, Table A.1 lists the
most relevant theoretical parameters and the values used to calculate them. Specific capacity and
specific energy values are calculated using the method described above. Volumetric capacity and
energy densities were calculated using the density of the anode in its most favorable oxidized phase
(Equation A.3), since the volume of a metal-air battery must accommodate the associated volume
expansion of this phase from the metallic form.
𝑉𝑜𝑙𝑢𝑚𝑒𝑡𝑟𝑖𝑐 𝐸𝑛𝑒𝑟𝑔𝑦 𝐷𝑒𝑛𝑠𝑖𝑡𝑦 = (𝑆𝑝𝑒𝑐𝑖𝑓𝑖𝑐 𝐸𝑛𝑒𝑟𝑔𝑦) ∙ (𝑂𝑥𝑖𝑑𝑖𝑧𝑒𝑑 𝐴𝑛𝑜𝑑𝑒 𝐷𝑒𝑛𝑠𝑖𝑡𝑦)
(Equation A.3)
Table A.1. Theoretical metal-air battery parameters
Anode element
n MMetal
[g mol-1] MM+O
[g mol-1] Oxidized Anode
Oxidized Anode Density [kg L-1]
OCV [V]
Specific Capacity [Ah kg-1]
Volumetric Capacity Density [Ah L-1]
Specific Energy
[Wh kg-1]
Volumetric Energy Density [Wh L-1]
Li 1 6.94 22.94 Li2O2 2.31 2.96 2003 2699 5928 7989
K 1 39.10 71.10 KO2 2.14 2.37 501 807 1187 1913
Na 1 22.99 54.99 NaO2 2.20 2.30 730 1072 1680 2466
Mg 2 24.31 40.30 Mg(OH)2 2.34 3.09 1695 3112 5238 9619
Al 3 26.98 50.98 Al(OH)3 2.42 2.71 2132 3817 5779 10,347
Zn 2 65.39 81.41 ZnO 5.61 1.66 733 3694 1218 6136
Fe 2 55.85 71.84 Fe(OH)2 3.4 1.28 844 2537 1080 3244
162
Supplementary Tables for Chapter 2
Supplementary Tables for Chapter 2 are available in Excel format online at
https://static-content.springer.com/esm/art%3A10.1038%2Fs41560-018-0108-
1/MediaObjects/41560_2018_108_MOESM1_ESM.xlsx
or
https://tinyurl.com/y5mx7yyh