Page 1
ELECTROMAGNETIC FORCE OF HIGH-SPEED
SOLENOID VALVE BASED ON
CORRELATION ANALYSIS
Xu De, Fei Hong-Zi, Liu Peng, Zhou Wei and Fan Li-Yun
School of Power and Energy Engineering
Harbin Engineering University, Nantong Street, Nangang District
Harbin City, 150001, China
Emails: [email protected] , [email protected] , [email protected] , [email protected]
Submitted: Aug. 14, 2015 Accepted: Nov. 4, 2015 Published: Dec. 1, 2015
Abstract- High-speed solenoid valve (HSV) is the heart of electronic control fuel system for diesel
engines, whose electromagnetic force (EF) determines the dynamic response speed of fuel system. The
finite element model of HSV has been established and validated by experiment. Methods of
experimental design and correlation analysis have been used for the simulation experiment. The effect
laws of six key parameters’ interactions on EF under HSV’s overall operating conditions have been
revealed from the results of the simulation. In addition, three key second-order factors’ interaction
principles are explained. Results show that under overall operating conditions HSV’s EF is influenced
not only by its parameters singly, but also parameters’ interactions.
Index terms: High-speed solenoid valve, electronic control fuel system, experimental design, interaction
principles.
INTERNATIONAL JOURNAL ON SMART SENSING AND INTELLIGENT SYSTEMS VOL. 8, NO. 4, DECEMBER 2015
2267
Page 2
I. INTRODUCTION
With the increasing concern about the pollutant emission and energy shortage, the requirements
of economy and emission for diesel engine become increasingly strict. Then the electronic
control fuel system has become the development trend of modern diesel engine’s fuel injection
system and also the research hotspot [1-5]. The electronic control fuel system mainly includes
electronic controlled unit injector system [6], electronic unit pump system [7], high-pressure
common rail system [8] and so on. Whereas high-speed solenoid valve (HSV) is one of the most
important parts of electronic control fuel system for diesel engine, its dynamic response
characteristics have a significant influence on the control precision of fuel injection duration and
timing [9-11]. Heightening the dynamic response speed of HSV will improve the control
precision of fuel injection duration and timing. As a result, the diesel engine’s economy and
emission are improved. Thus, it is of great significance to carry out research on HSV.
At present many researches regarding this subject have been carried out, mostly focusing on the
modeling and control method of HSV. In [12], a plunger-type solenoid is investigated, by
introducing appropriate assumptions, the author developed a set of equations which requires
small amount of computer time to execute. These equations describe the de-energizing state of
solenoids and perform test results satisfactorily. In [13], an injection quantity simulator was
developed to investigate the relation between armature and the injection quantity, and it devised a
current waveform control technique to reduce the armature bounce, so the linearity of the
injection quantity characteristics is improved. In [14], a novel magnetic levitation system using
the eddy current repulsion mechanism is proposed, finite-element approach is used for the
analysis of the magnetic field, the structure showed a larger repulsive force comparing to the
general electromagnetic, and the precision of the control system can be higher. In [15], a
computer program is developed for simulating and predicting the performance of two-valve
solenoid actuators, which contains a module for magnetic field analysis and force calculations
and a dynamic simulation module which predicts the effects of specific magnetic designs on
solenoid opening and closing dynamic performance. In [16], it proposes a feedback control
method for a linear resonant actuator (LRA), in which an external load estimated from two
signals of the back-EMF is used as a target voltage in PID control. By the estimated load, it
becomes possible to obtain an arbitrary amplitude of the mover. In [17], different driving circuits
Xu De, Fei Hong-Zi, Liu Peng, Zhou Wei and Fan Li-Yun, ELECTROMAGNETIC FORCE OF HIGH-SPEED SOLENOID VALVE BASED ON CORRELATION ANALYSIS
2268
Page 3
and control methods of solenoid valve were investigated, and the pre-energizing and
reverse-energizing control strategy was applied to speed up the response of solenoid valve.
However, the structure of HSV itself is of importance to speed up the dynamic response speed of
HSV, because its performance can be limited by the initial designs such as structure parameters,
coil turns and driving current. The strong EF of HSV makes a big influence on its dynamic
response speed and the stability of electronic control fuel system, but due to the HSV’s operating
characteristics and its structure parameters and parameters’ interactions, EF has complicated
change rules. Therefore, it is important to reveal the effect laws of the key parameters and
parameters’ interactions on the EF in overall operating conditions, which can provide certain
theoretical guidance for HSV’s optimization design and is of great importance to create the
HSV’s prediction mathematic model. At last, the precision of electronic control fuel injection
system is improved.
In this paper the finite element model (FEM) of HSV has been developed according to its actual
structure, and the accuracy of the model has been verified by experiment. Six key parameters of
HSV have been selected, which are pole length, coil turns, coil location, armature thickness,
damping hole location and its radius, to try to investigate the effect laws of these parameters’
interacting first-order and second-order factors on EF. Then based on HSV’s working
characteristics its overall operating conditions have been dispersed to nine operating condition
points formed by the driving currents and working air gaps. With the experimental design and the
method of correlation analysis, correlation coefficients of the first-order and second-order factors
with EF of HSV have been gotten under overall operating conditions. By analyzing the
correlation coefficients, some important rules of the first-order and second-order factors on EF
under overall operating conditions have been revealed. Coil turns and armature thickness have
been shown to have significant influence on EF of HSV under overall operating conditions in
first-order factors. Moreover interaction principles between coil turns and armature thickness,
armature thickness and damping hole location, damping hole location and damping hole radius
have been explained in second-order factors’ analysis.
The rest of this paper is organized as follows. HSV’s structure and working principle in fuel
injection system have been described briefly in section II. The methodology and research flow
chart of this paper are described in section III. HSV’s finite element model and its experimental
validation are presented in section IV. Experimental parameters’ detailed introduction, operating
INTERNATIONAL JOURNAL ON SMART SENSING AND INTELLIGENT SYSTEMS VOL. 8, NO. 4, DECEMBER 2015
2269
Page 4
points’ selection and experimental design are presented and explained in section V. Section VI
are the correlation analysis of the 27 factors with EF and the interaction principles between coil
turns and armature thickness, armature thickness and damping hole location and damping hole
location and damping hole radius. Conclusions are made in section VII.
II. HSV IN FUEL INJECTION SYSTEM
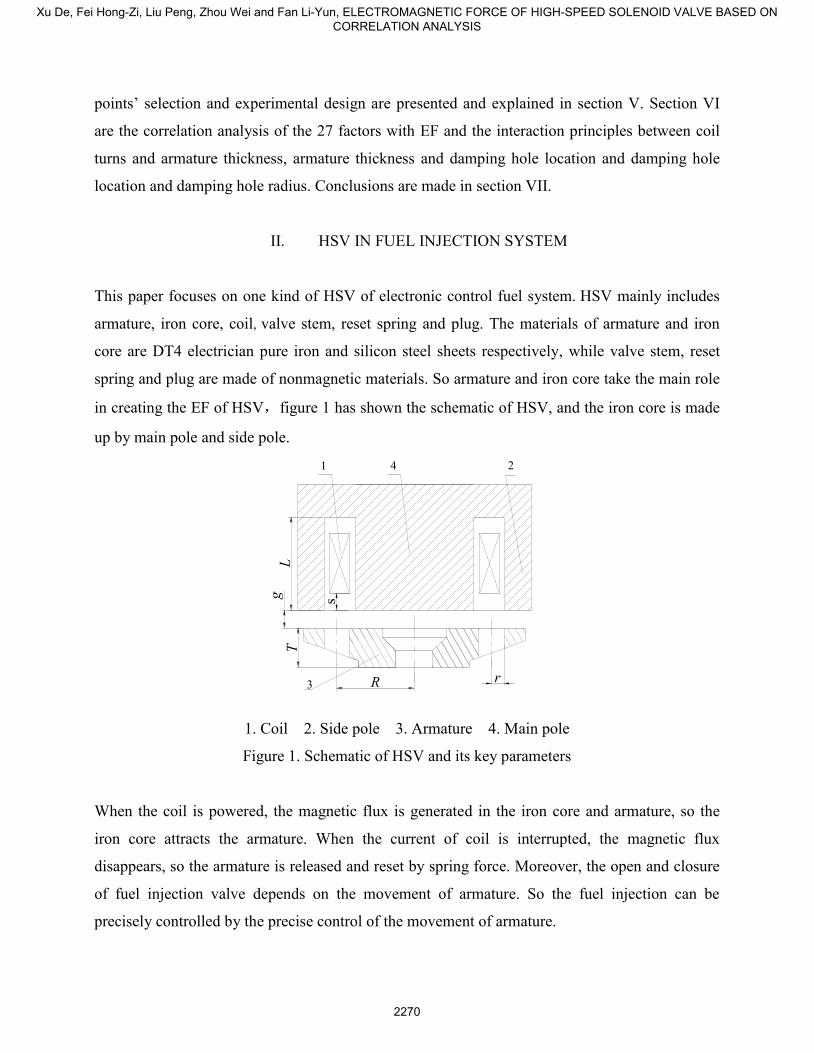
This paper focuses on one kind of HSV of electronic control fuel system. HSV mainly includes
armature, iron core, coil, valve stem, reset spring and plug. The materials of armature and iron
core are DT4 electrician pure iron and silicon steel sheets respectively, while valve stem, reset
spring and plug are made of nonmagnetic materials. So armature and iron core take the main role
in creating the EF of HSV,figure 1 has shown the schematic of HSV, and the iron core is made
up by main pole and side pole.
1 2
3
gT
L
R r
4
s
1. Coil 2. Side pole 3. Armature 4. Main pole
Figure 1. Schematic of HSV and its key parameters
When the coil is powered, the magnetic flux is generated in the iron core and armature, so the
iron core attracts the armature. When the current of coil is interrupted, the magnetic flux
disappears, so the armature is released and reset by spring force. Moreover, the open and closure
of fuel injection valve depends on the movement of armature. So the fuel injection can be
precisely controlled by the precise control of the movement of armature.
Xu De, Fei Hong-Zi, Liu Peng, Zhou Wei and Fan Li-Yun, ELECTROMAGNETIC FORCE OF HIGH-SPEED SOLENOID VALVE BASED ON CORRELATION ANALYSIS
2270
Page 5
III. METHODOLOGY
The entire process and method of this paper are shown in Figure 2. Firstly, FEM of HSV was
developed and validated. Secondly, the operating points were selected according to the working
characteristics of HSV to stand for its overall operating conditions. Thirdly, the key parameters of
HSV and their each three-level values were determined. Fourthly, by the method of experimental
design, the sample points of correlation analysis were obtained. Fifthly, HSV’s EF was calculated
at every sample point by FEM. Sixthly, the correlation coefficients were computed and gotten
based on the method of correlation analysis. Seventhly, by analyzing the correlation coefficients,
effect laws of the first-order and second-order factors on EF under overall operating conditions
were revealed, based on this, the interaction principles between coil turns and armature thickness,
armature thickness and damping hole location, damping hole location and damping hole radius
were explained.
FEM modeling
FEM validation
Meet the accuracy
requirement ?
Nine operating points based
on driving current and
working air gap
Experimental parameters and
its three levels
Experimental design
Sample points for simulation
Elctromagnetic force at
different sample points
Yes
No
Correlation analysis of first-
order and second-order
factors
Figure 2. Research flow chart
INTERNATIONAL JOURNAL ON SMART SENSING AND INTELLIGENT SYSTEMS VOL. 8, NO. 4, DECEMBER 2015
2271
Page 6
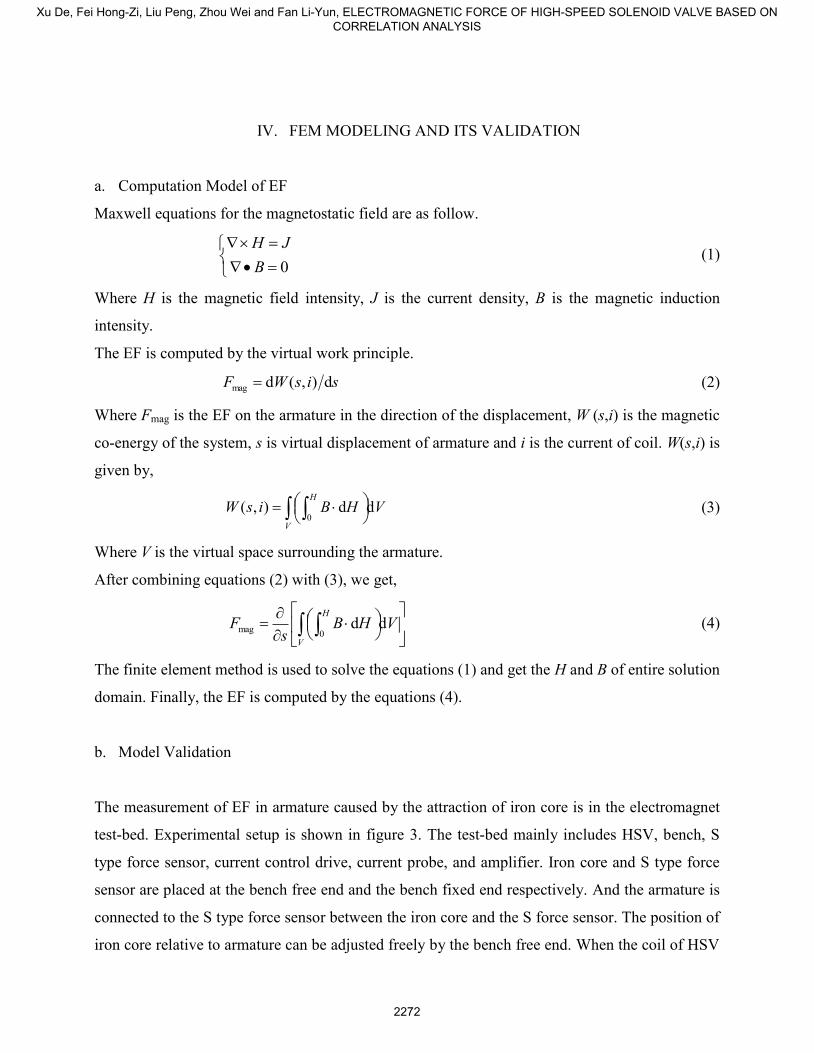
IV. FEM MODELING AND ITS VALIDATION
a. Computation Model of EF
Maxwell equations for the magnetostatic field are as follow.
0B
JH (1)
Where H is the magnetic field intensity, J is the current density, B is the magnetic induction
intensity.
The EF is computed by the virtual work principle.
sisWF d),(dmag (2)
Where Fmag is the EF on the armature in the direction of the displacement, W (s,i) is the magnetic
co-energy of the system, s is virtual displacement of armature and i is the current of coil. W(s,i) is
given by,
VHBisWV
H
dd),(0
(3)
Where V is the virtual space surrounding the armature.
After combining equations (2) with (3), we get,
VHB
sF
V
H
dd0
mag (4)
The finite element method is used to solve the equations (1) and get the H and B of entire solution
domain. Finally, the EF is computed by the equations (4).
b. Model Validation
The measurement of EF in armature caused by the attraction of iron core is in the electromagnet
test-bed. Experimental setup is shown in figure 3. The test-bed mainly includes HSV, bench, S
type force sensor, current control drive, current probe, and amplifier. Iron core and S type force
sensor are placed at the bench free end and the bench fixed end respectively. And the armature is
connected to the S type force sensor between the iron core and the S force sensor. The position of
iron core relative to armature can be adjusted freely by the bench free end. When the coil of HSV
Xu De, Fei Hong-Zi, Liu Peng, Zhou Wei and Fan Li-Yun, ELECTROMAGNETIC FORCE OF HIGH-SPEED SOLENOID VALVE BASED ON CORRELATION ANALYSIS
2272
Page 7
is powered, the armature is attracted to the iron core, and then a weak voltage signal is generated
by the S type force sensor and amplified by the high precision amplifier. The voltage signal
provides the size of EF on armature. The current of coil is adjusted by the current control drive
and measured by the current probe.
Current control drive
Current probe HSV
Bench free endBench fixed end
Amplifier
S type force sensor
Figure 3. The figure of electromagnet test-bed
Figure 4 shows the changes of FEM results and measurement values along with the change of
driving current when the working air gap is 0.2 mm, 0.15 mm, and 0.1 mm respectively. It is easy
to infer that the FEM and measurement results match closely under different driving currents and
working air gaps and the maximum error is 6%. The error is caused by follows: firstly, the FEM
uses initial magnetization curve to approximate magnetization process of soft magnetic materials
of HSV; secondly, FEM ignores the heat effect in the HSV’ real working condition [18]. As the
FEM’s accuracy meets the requirement of engineering needs, the FEM can accurately predict the
EF of HSV in this paper’s analysis.
5 8 11 14 17 2020
40
60
80
100
120
140
160
Ele
ctro
mag
net
ic f
orc
e (N
)
Driving current (A)
Measurement
FEM
5 8 11 14 17 2040
60
80
100
120
140
160
Ele
ctro
mag
net
ic f
orc
e(N
)
Driving current (A) Measurement
FEM
5 8 11 14 17 2080
100
120
140
160
180
Ele
ctro
mag
net
ic f
orc
e(N
)
Driving current (A) Measurement
FEM
(a) 0.2 mm (b) 0.15 mm (c) 0.1 mm
Figure 4. Comparisons between the FEM and measurement results
INTERNATIONAL JOURNAL ON SMART SENSING AND INTELLIGENT SYSTEMS VOL. 8, NO. 4, DECEMBER 2015
2273
Page 8
V. PARAMETERS AND OPERATING CONDITIONS OF HSV, EXPERIMENTAL
DESIGN
Key parameters of HSV selected in this paper mainly include pole length L, coil turns n, coil
location s (the distance between coil and working air gap), armature thickness T, damping hole
location R (the distance between damping hole and armature’s center) and damping hole radius r.
The parameters have been shown in figure 1.
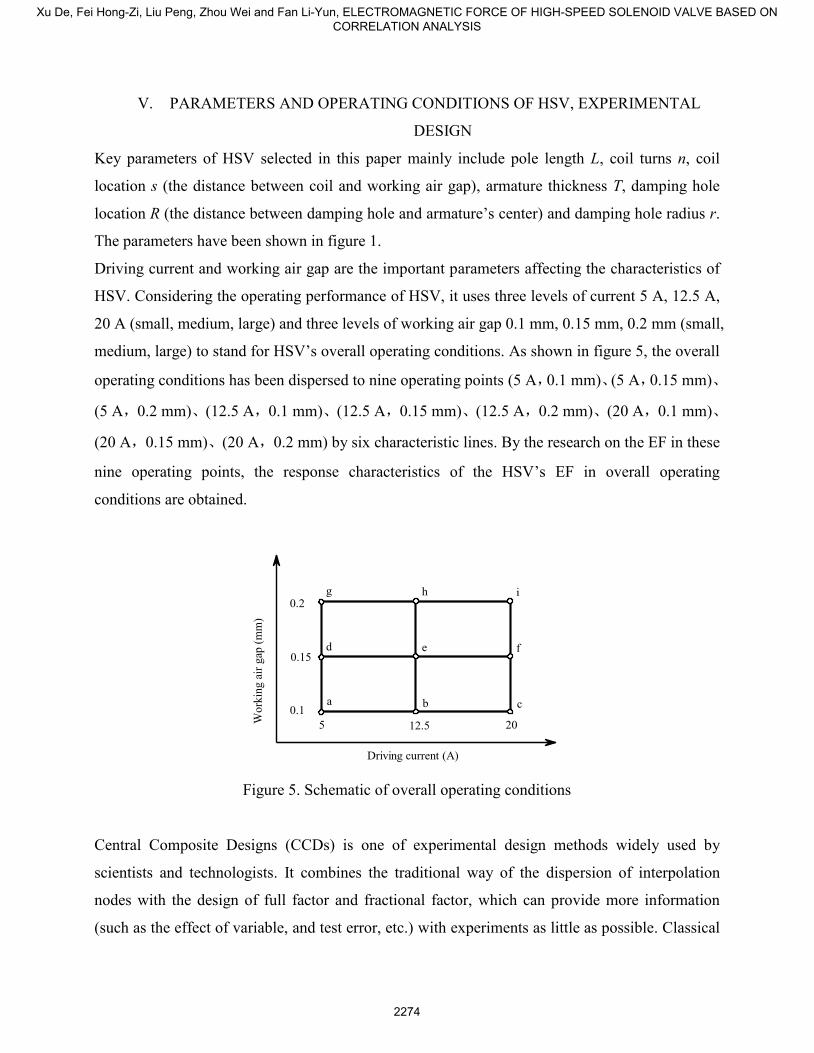
Driving current and working air gap are the important parameters affecting the characteristics of
HSV. Considering the operating performance of HSV, it uses three levels of current 5 A, 12.5 A,
20 A (small, medium, large) and three levels of working air gap 0.1 mm, 0.15 mm, 0.2 mm (small,
medium, large) to stand for HSV’s overall operating conditions. As shown in figure 5, the overall
operating conditions has been dispersed to nine operating points (5 A,0.1 mm)、(5 A,0.15 mm)、
(5 A,0.2 mm)、(12.5 A,0.1 mm)、(12.5 A,0.15 mm)、(12.5 A,0.2 mm)、(20 A,0.1 mm)、
(20 A,0.15 mm)、(20 A,0.2 mm) by six characteristic lines. By the research on the EF in these
nine operating points, the response characteristics of the HSV’s EF in overall operating
conditions are obtained.
cba
0.2
0.15
0.1
2012.5
Driving current (A)
Work
ing a
ir g
ap (
mm
)
5
d e f
g h i
Figure 5. Schematic of overall operating conditions
Central Composite Designs (CCDs) is one of experimental design methods widely used by
scientists and technologists. It combines the traditional way of the dispersion of interpolation
nodes with the design of full factor and fractional factor, which can provide more information
(such as the effect of variable, and test error, etc.) with experiments as little as possible. Classical
Xu De, Fei Hong-Zi, Liu Peng, Zhou Wei and Fan Li-Yun, ELECTROMAGNETIC FORCE OF HIGH-SPEED SOLENOID VALVE BASED ON CORRELATION ANALYSIS
2274
Page 9
CCDs mainly contains these three parts: (1) 2k factorial designs or fractional factorial designs; (2)
2k axial points; (3) a series of central points, where k means the number of the selected
parameters [19]. The CCDs has been shown as figure 6 when k is 2, the distance is ±1
(variables use standardized unit) from the central point (located in the center of the quadrangle) to
factors (four vertices of the quadrangle), the distance is ±α from axial points (located in
coordinate axis expect the central point) to central point. By the CCDs, the effective sample
points of experiment can be obtained instead of making researches at the whole sample points,
which can save much time and work [20]. Then the individual and interactive effects of the key
parameters affecting the EF of HSV can be revealed, which provides a full insight of interaction
between these key parameters.
X2
(0,-α)
(0,α)
(α,0)(-α,0)
(1,1)(-1,1)
(-1,-1) (1,-1)
X1
Figure 6. CCDs of two factors
This paper uses the 6 parameters introduced above as the experimental factors (independent
variable) of experimental design, which means k is 6, and α is defined as 1. EF is the response
variable. Based on the actual value of each of the 6 factors, three-level values of each
experimental factor are identified as shown in Table 1, and the 0-level value means the reference
value of the factor, -1-level and +1-level values are their each minimum and maximum values.
Experimental sample points are obtained based on the combinations of the 6 factors’ three-level
values. And by CCDs, for nine operating points of the overall operating condition of HSV and
three levels of each 6 factors, it only requires 47×9=423 groups of experiments, while in the
INTERNATIONAL JOURNAL ON SMART SENSING AND INTELLIGENT SYSTEMS VOL. 8, NO. 4, DECEMBER 2015
2275
Page 10
condition of full factors 36×9=9561 groups of experiments must be conducted to investigate in
conventional research method. It can be seen that method of CCDs not only avoids huge amount
of workload, but also can guarantee the reliability of the experimental sample points.
Table 1: Three-level values of each experimental factor
Experimental factors -1-level 0-level +1-level
Pole length L/mm 7 9.5 12
Coil turns n/turns 40 60 80
Coil location s/mm 0 0.6 1.2
Armature thickness T/mm 2.5 4 5.5
Damping hole location R/mm 4.2 6.4 8.6
Damping hole radius r/mm 0 1 2
VI. CORRELATION ANALYSIS
HSV in electronic control fuel system always works with comprehensive impact of electric field,
magnetic field, flow field and mechanical movement [21], the EF is not only influenced by each
key parameter separately, but also the interaction between each parameter. And the correlation
analysis based on experimental design can not only get the effect laws of single parameter on EF
efficiently and accurately, but also can draw more on the effect laws of the parameters’
interactions on EF.
Correlation analysis is a method to reveal the mutual relation between two or more parameters. It
is not causation and can be quantified by correlation coefficient R, whose formula is depicted as
equation (5).
n
i
n
i
n
iii
yyxx
yx
ii
yx
R
1 1
22
1
)()(
))((
(5)
Where i is the ith sample point, ix is the value of the ith sample point of parameter x, x is the
average value of parameter x. As same as parameter x, iy is the value of the ith sample point of
parameter y, y is the average value of parameter y. Parameter x and y have a correlation, by the
equation (5) value of R is computed and gotten between -1 and +1. When R is greater than 0, it
means x and y have a positive correlation. When R is less than 0, it means x and y have a negative
Xu De, Fei Hong-Zi, Liu Peng, Zhou Wei and Fan Li-Yun, ELECTROMAGNETIC FORCE OF HIGH-SPEED SOLENOID VALVE BASED ON CORRELATION ANALYSIS
2276
Page 11
correlation. And when R happens to be 0, it means there is no correlation between x and y.
Besides, the bigger the absolute value of R is, the more significant the correlation between x and y
is.
By CCDs the sample points of every operating condition can be obtained. Then the simulation
experiment is carried out by FEM and the simulation results of the sample points are gotten. At
last, by the method of the correlation analysis the correlation results of the EF with the 27 factors
are found. The 27 factors are formed by the 6 parameters’ interactions, which contains 6
first-order factors and 21 second-order factors. The result of correlation analysis has been shown
in figure 7, and the X-axis represents the first-order factors and second-order factors formed by
the 6 parameters: 1-6 are first-order factors, 1 is pole length L, 2 is coil turns n, 3 is coil location s,
4 is armature thickness T, 5 is damping hole location R, 6 is damping hole radius r. 7-12 are the
self-interacting second-order factors, 7 is the second-order factor under the self-interaction of
pole length, 8 is the second-order factor under the self-interaction of coil turns, 9 is the
second-order factor under the self-interaction of coil location, 10 is the second-order factor under
the self-interaction of armature thickness, 11 is the second-order factor under the self-interaction
of damping hole location, 12 is the second-order factor under the self-interaction of damping hole
radius. 13-27 are second-order factors under the interaction of different parameters, 13 is the
second-order factor under the interaction of pole length and coil turns, 14 is the second-order
factor under the interaction of pole length and coil location, 15 is the second-order factor under
the interaction of pole length and armature thickness, 16 is the second-order factor under the
interaction of pole length and damping hole location, 17 is the second-order factor under the
interaction of pole length and damping hole radius, 18 is the second-order factor under the
interaction of coil turns and coil location, 19 is the second-order factor under the interaction of
coil turns and armature thickness, 20 is the second-order factor under the interaction of coil turns
and damping hole location, 21 is the second-order factor under the interaction of coil turns and
damping hole radius, 22 is the second-order factor under the interaction of coil location and
armature thickness, 23 is the second-order factor under the interaction of coil location and
damping hole location, 24 is the second-order factor under the interaction of coil location and
damping hole radius, 25 is the second-order factor under the interaction of armature thickness and
damping hole location, 26 is the second-order factor under the interaction of armature thickness
and damping hole radius, 27 is the second-order factor under the interaction of damping hole
INTERNATIONAL JOURNAL ON SMART SENSING AND INTELLIGENT SYSTEMS VOL. 8, NO. 4, DECEMBER 2015
2277
Page 12
location and damping hole radius. The Y-axis represents the factors’ corresponding correlation
coefficient. It can be seen from figure 7(a), 7(b), 7(c) that how correlation coefficients change
with the change of working air gap at different currents, and it can be seen from figure 7(d), 7(e),
7(f) that how correlation coefficients change with the change of current at different working air
gaps.
1 2 3 4 5 6 7 8 9 10 11 12 13 14 15 16 17 18 19 20 21 22 23 24 25 26 27-0.6
-0.4
-0.2
0.0
0.2
0.4
0.6
0.8
1.0
0.1 mm
0.15 mm
0.2 mm
27 factors
Corr
elat
ion c
oef
fici
ent
(a) Driving current 5 A
1 2 3 4 5 6 7 8 9 10 11 12 13 14 15 16 17 18 19 20 21 22 23 24 25 26 27-0.6
-0.4
-0.2
0.0
0.2
0.4
0.6
0.8
1.0
Corr
elat
ion c
oef
fici
ent
27 factors
0.1 mm
0.15 mm
0.2 mm
(b) Driving current 12.5 A
1 2 3 4 5 6 7 8 9 10 11 12 13 14 15 16 17 18 19 20 21 22 23 24 25 26 27-0.6
-0.4
-0.2
0.0
0.2
0.4
0.6
0.8
1.0
Corr
elat
ion c
oef
fici
ent
27 factors
0.1 mm
0.15 mm
0.2 mm
(c) Driving current 20 A
1 2 3 4 5 6 7 8 9 10 11 12 13 14 15 16 17 18 19 20 21 22 23 24 25 26 27-0.6
-0.4
-0.2
0.0
0.2
0.4
0.6
0.8
1.0
Corr
elat
ion c
oef
fici
ent
27 factors
5 A
12.5 A
20 A
(d) Working air gap 0.1 mm
Xu De, Fei Hong-Zi, Liu Peng, Zhou Wei and Fan Li-Yun, ELECTROMAGNETIC FORCE OF HIGH-SPEED SOLENOID VALVE BASED ON CORRELATION ANALYSIS
2278
Page 13
1 2 3 4 5 6 7 8 9 10 11 12 13 14 15 16 17 18 19 20 21 22 23 24 25 26 27-0.6
-0.4
-0.2
0.0
0.2
0.4
0.6
0.8
1.0
Corr
elat
ion c
oef
fici
ent
27 factors
5 A
12.5 A
20 A
(e) Working air gap 0.15 mm
1 2 3 4 5 6 7 8 9 10 11 12 13 14 15 16 17 18 19 20 21 22 23 24 25 26 27-0.6
-0.4
-0.2
0.0
0.2
0.4
0.6
0.8
1.0
Corr
elat
ion c
oef
fici
ent
27 factors
5 A
12.5 A
20 A
(f) Working air gap 0.2 mm
Figure 7. The correlation coefficients of the 27 factors with EF under overall operating conditions
a. Correlation analysis of first-order factors
The first factor in figure 7 is pole length L, the corresponding correlation coefficients are all
unobvious at every operating condition. The second factor in figure 7 is coil turns n, the
corresponding correlation coefficients are all greater than 0 at every operating condition,
moreover the absolute value of correlation coefficient decreases with the increase of driving
current, and it increases with the increase of working air gap. The third factor in figure 7 is coil
location s, the corresponding correlation coefficients are all less than 0 at every operating
condition, moreover the absolute value of correlation coefficient rises slightly with the increase of
driving current, and it mainly keeps the same with the increase of working air gap. The fourth
factor in figure 7 is armature thickness T, the corresponding correlation coefficients are all greater
than 0 at every operating condition, and moreover the absolute value of correlation coefficient
increases with the increase of driving current while decreases with the increase of working air
gap. The fifth factor in figure 7 is damping hole location R, the corresponding correlation
coefficients are all greater than 0 at every operating condition, moreover the absolute value of
correlation coefficient increases with the increase of driving current while decreases with the
increase of working air gap. The sixth factor in figure 7 is damping hole radius r, the
corresponding correlation coefficients are all less than 0 at every operating condition, moreover
the absolute value of correlation coefficient almost keeps the same with the change of the
INTERNATIONAL JOURNAL ON SMART SENSING AND INTELLIGENT SYSTEMS VOL. 8, NO. 4, DECEMBER 2015
2279
Page 14
operating condition.
All of above are the correlation analyses of first-order factors formed by the 6 parameters with
EF under overall operating conditions, which reveals the effect laws of each first-order factor on
EF with the change of operating condition. It can be seen that coil turns n and armature thickness
T have significant influence on EF.
b. Correlation analysis of second-order factors
Factors from the seventh to twelfth in figure 7 are second-order factors formed by the
self-interaction of the 6 parameters. Their correlation coefficients are all less than 0 at different
operating conditions, and the absolute values of correlation coefficients are all large. When
driving current is at a small level, their absolute values of correlation coefficients decrease with
the increase of working air gap; yet when driving current is at a high level, their absolute values
of correlation coefficients at different working air gaps are all large. The correlation between each
of factor 7, 8, 10, 11 and EF is opposite to their each first-order factor’s. For second-order factor
7 and 11 the absolute values of correlation coefficients are larger than their each first-order
factor’s at different operating conditions, which means each influence of the two factors on EF is
more significant than their each first-order factor’s. So it can be seen that first-order and
second-order factors have different effect laws.
The rest factors from the thirteenth to twenty-seventh in figure 7 are second-order factors formed
by the different parameters’ interactions. Among them the correlation coefficients of factor 19, 25
and 27 are all greater than 0 at each operating condition and their absolute values are all large.
The correlation coefficients of factor 18, 21 and 22 are all less than 0 at each operating condition
and their absolute values are all large too. Besides, the correlation coefficients of factor 14, 21
and 26 have complicate change rules. So it can be seen that their relations with EF of HSV are
complicate and nonlinear.
All of above are the correlation analyses of the 21 second-order factors with EF under overall
operating conditions. Among the second-order factors, correlation coefficients of 19, 25, 27 are
relatively large, they are respectively the interactions of coil turns and armature thickness,
armature thickness and damping hole location, damping hole location and damping hole radius.
Then the analysis will be focused on interaction mechanisms of these three factors on EF. The
figures of interaction analysis have been shown in figure 8, 9 and 10.
Xu De, Fei Hong-Zi, Liu Peng, Zhou Wei and Fan Li-Yun, ELECTROMAGNETIC FORCE OF HIGH-SPEED SOLENOID VALVE BASED ON CORRELATION ANALYSIS
2280
Page 15
2.5 4 5.5
30
40
50
60
70
80
90
Armature thickness (mm) E
lect
rom
agn
etic
fo
rce
(N)
40 turns
60 turns
80 turns
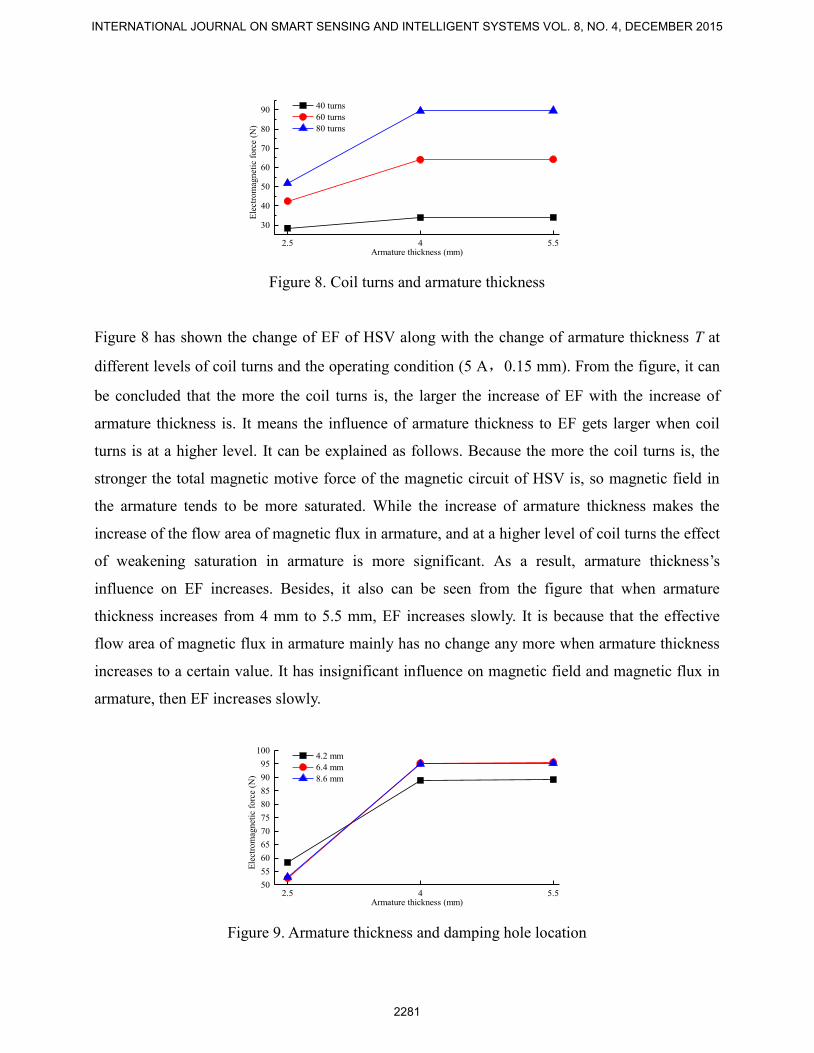
Figure 8. Coil turns and armature thickness
Figure 8 has shown the change of EF of HSV along with the change of armature thickness T at
different levels of coil turns and the operating condition (5 A,0.15 mm). From the figure, it can
be concluded that the more the coil turns is, the larger the increase of EF with the increase of
armature thickness is. It means the influence of armature thickness to EF gets larger when coil
turns is at a higher level. It can be explained as follows. Because the more the coil turns is, the
stronger the total magnetic motive force of the magnetic circuit of HSV is, so magnetic field in
the armature tends to be more saturated. While the increase of armature thickness makes the
increase of the flow area of magnetic flux in armature, and at a higher level of coil turns the effect
of weakening saturation in armature is more significant. As a result, armature thickness’s
influence on EF increases. Besides, it also can be seen from the figure that when armature
thickness increases from 4 mm to 5.5 mm, EF increases slowly. It is because that the effective
flow area of magnetic flux in armature mainly has no change any more when armature thickness
increases to a certain value. It has insignificant influence on magnetic field and magnetic flux in
armature, then EF increases slowly.
2.5 4 5.550
55
60
65
70
75
80
85
90
95
100
Ele
ctro
mag
net
ic f
orc
e (N
)
Armature thickness (mm)
4.2 mm
6.4 mm
8.6 mm
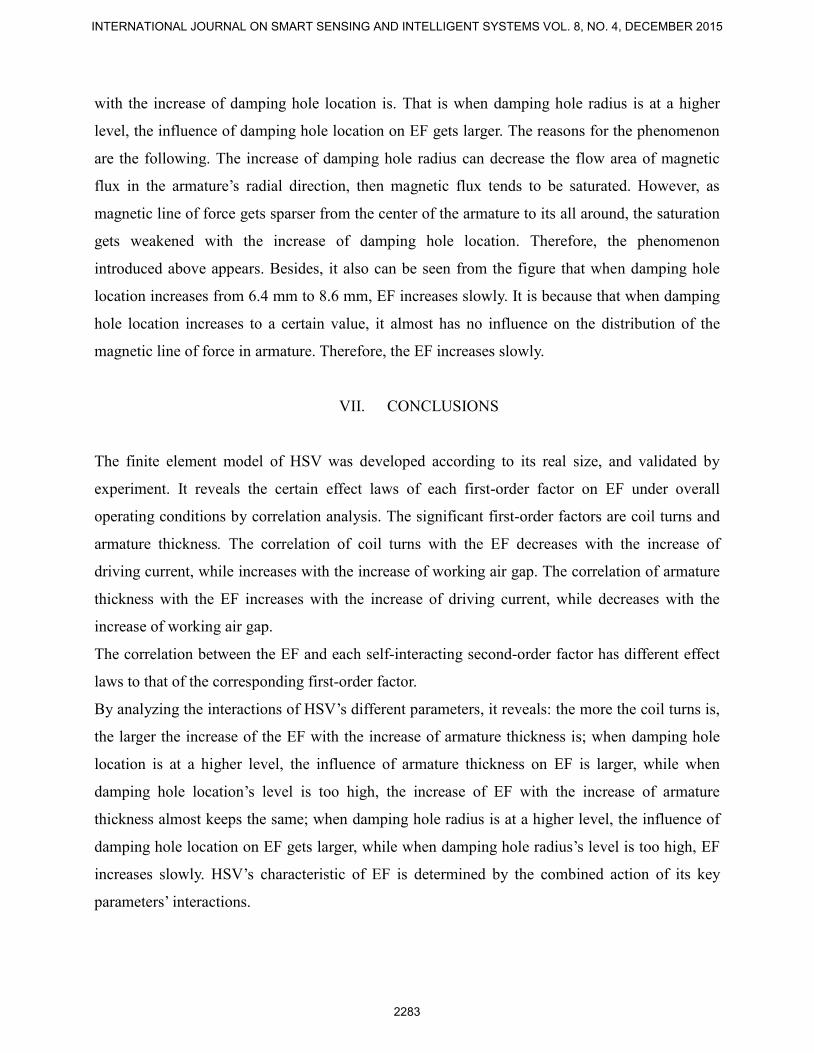
Figure 9. Armature thickness and damping hole location
INTERNATIONAL JOURNAL ON SMART SENSING AND INTELLIGENT SYSTEMS VOL. 8, NO. 4, DECEMBER 2015
2281
Page 16
Figure 9 has shown the change of EF of HSV along with the change of armature thickness T at
different levels of damping hole location R and the operating condition (5 A, 0.1 mm). From the
figure, it can be concluded that when damping hole location R increases from 4.2 mm to 6.4 mm,
the increase of EF with the increase of armature thickness gets larger; while when damping hole
location R increases from 6.4 mm to 8.6 mm, the increase of EF with the increase of armature
thickness is unobvious. That is when damping hole location is at a higher level, the influence of
armature thickness on EF is larger, while when damping hole location’s level is too high, the
increase of EF with the increase of armature thickness almost keeps the same. The reasons for the
phenomenon are the following.
Magnetic flux in armature flows through its radial direction, magnetic line of force gets sparser
from the center of the armature to its all around. Therefore, when damping hole location is at a
higher level, the influence of damping hole on magnetic line of force decreases. Yet at the same
time, armature thickness increases, the sectional area in its radial direction increases, the
saturation in armature gets weakened, then magnetic field increases, which in turn makes the
influence of armature thickness on EF increases. Therefore, when damping hole location R
increases from 4.2 mm to 6.4 mm, the increase of EF with the increase of armature thickness gets
larger. But when damping hole location R increases from 6.4 mm to 8.6 mm the sectional area in
armature’s radial direction of magnetic flux becomes large enough, with the combined action of
magnetic resistance and flow area of magnetic flux EF turns out to increase slowly.
4.2 6.4 8.6125
130
135
140
145
150
155
160
165
E
lect
rom
agn
etic
fo
rce
(N)
Damping hole location (mm)
1 mm
2 mm
Figure 10. Damping hole location and damping hole radius
Figure 10 has shown the change of EF of HSV along with the change of damping hole location R
at different levels of damping hole radius r and the operating condition (20 A,0.1 mm). From the
figure, it can be concluded that the larger the damping hole radius is, the larger the increase of EF
Xu De, Fei Hong-Zi, Liu Peng, Zhou Wei and Fan Li-Yun, ELECTROMAGNETIC FORCE OF HIGH-SPEED SOLENOID VALVE BASED ON CORRELATION ANALYSIS
2282
Page 17
with the increase of damping hole location is. That is when damping hole radius is at a higher
level, the influence of damping hole location on EF gets larger. The reasons for the phenomenon
are the following. The increase of damping hole radius can decrease the flow area of magnetic
flux in the armature’s radial direction, then magnetic flux tends to be saturated. However, as
magnetic line of force gets sparser from the center of the armature to its all around, the saturation
gets weakened with the increase of damping hole location. Therefore, the phenomenon
introduced above appears. Besides, it also can be seen from the figure that when damping hole
location increases from 6.4 mm to 8.6 mm, EF increases slowly. It is because that when damping
hole location increases to a certain value, it almost has no influence on the distribution of the
magnetic line of force in armature. Therefore, the EF increases slowly.
VII. CONCLUSIONS
The finite element model of HSV was developed according to its real size, and validated by
experiment. It reveals the certain effect laws of each first-order factor on EF under overall
operating conditions by correlation analysis. The significant first-order factors are coil turns and
armature thickness. The correlation of coil turns with the EF decreases with the increase of
driving current, while increases with the increase of working air gap. The correlation of armature
thickness with the EF increases with the increase of driving current, while decreases with the
increase of working air gap.
The correlation between the EF and each self-interacting second-order factor has different effect
laws to that of the corresponding first-order factor.
By analyzing the interactions of HSV’s different parameters, it reveals: the more the coil turns is,
the larger the increase of the EF with the increase of armature thickness is; when damping hole
location is at a higher level, the influence of armature thickness on EF is larger, while when
damping hole location’s level is too high, the increase of EF with the increase of armature
thickness almost keeps the same; when damping hole radius is at a higher level, the influence of
damping hole location on EF gets larger, while when damping hole radius’s level is too high, EF
increases slowly. HSV’s characteristic of EF is determined by the combined action of its key
parameters’ interactions.
INTERNATIONAL JOURNAL ON SMART SENSING AND INTELLIGENT SYSTEMS VOL. 8, NO. 4, DECEMBER 2015
2283
Page 18
VIII. ACKNOWLEDGEMENT
This work is supported by the National Natural Science Foundation of China (NSFC 51379041,
51279037, 51475100) and the Key Project of Chinese Ministry of Education (113060A).
REFERENCES
[1] N. Guerrassi and P. Dupraz, “A Common Rail Injection System For High Speed Direct
Injection Diesel Engines”, SAE Technical Paper 980803, 1998.
[2] K. C. Bayindir, M. A. Gözüküçük and A. Teke, “A comprehensive overview of hybrid
electric vehicle: Powertrain configurations, powertrain control techniques and electronic control
units”, Energy Conversion and Management, vol. 52, No. 2, 2011, pp. 1305-1313.
[3] Q. Hayat, L. Y. Fan, X. Z. Ma and B. Q. Tian, “Comparative Study of Pressure Wave
Mathematical Models for HP Fuel Pipeline of CEUP at Various Operating Conditions”,
International Journal of Smart Sensing and Intelligent Systems, vol. 6, No. 3, 2013, pp.
1077-1101.
[4] L. Y. Fan, P. H. Li and E. Z. Song, “Research on Electronic Control Unit of Electronic Unit
Pump Fuel Injection System for Diesel Engines”, Proceedings of the 2012 Third International
Conference on Mechanic Automation and Control Engineering. IEEE Computer Society, 2012,
pp. 605-608.
[5] S. Y. Yang and S. H. Chung, “An experimental Study on the Effects of High-Pressure and
Multiple Injection Strategies on DI Diesel Engine Emissions”, SAE Technical Paper
2013-01-0045, 2013.
[6] P. Lauvin, A. Löffler, A. Schmitt and W. Zimmermann, “Electronically Controlled High
Pressure Unit Injector System for Diesel Engines”, SAE Technical Paper 911819, 1991.
[7] C. L. Zhao, “Research on Injection System of Electronic Unit Pump Diesel”, Chinese Internal
Combustion Engine Engineering, 2004, 2, pp. 22-23.
[8] W. Boehner and K. Hummel, “Common Rail Injection System for Commercial Diesel
Vehicles”, SAE Technical Paper 970345, 1997.
[9] G. L. Shi, “On the researches of high speed solenoid on/off valve and its applications”,
Machine Tool & Hydraulics, 2001, 1, pp. 1-2.
Xu De, Fei Hong-Zi, Liu Peng, Zhou Wei and Fan Li-Yun, ELECTROMAGNETIC FORCE OF HIGH-SPEED SOLENOID VALVE BASED ON CORRELATION ANALYSIS
2284
Page 19
[10] L. C. Passarini and P. R. Nakajima, “Development of a high-speed solenoid valve: an
investigation of the importance of the armature mass on the dynamic response”, Journal of the
Brazilian Society of Mechanical Sciences and Engineering, vol. 25, No. 4, 2003, pp. 329-335.
[11] G. Bianchi, P. Pelloni, F. Filicori and G. Vannini, “Optimization of the Solenoid Valve
Behavior in Common-Rail Injection Systems”, SAE Technical Paper 2000-01-2042, 2000.
[12] Kajima and Takashi. “Dynamic model of the plunger type solenoids at deenergizing state”,
IEEE Transactions on magnetics, vol. 31, No. 3, 1995, pp. 2315-2323.
[13] R. Kusakabe, M. Abe, H. Ehara and T. Ishikawa, “Injection Quantity Range Enhancement
by Using Current Waveform Control Technique for DI Gasoline Injector”, SAE Technical Paper
2014-01-1211, 2014.
[14] T. Nakao, H. Han and Y. Koshimoto, “Fundamental study of magnetically levitated
contact-free micro-bearing for MEMS applications”, International Journal on Smart Sensing and
Intelligent Systems, vol. 3, No. 3, 2010, pp. 536-549.
[15] S. Wang, T. Miyano and M. Hubbard, “Personal Computer Design Software for Magnetic
Analysis and Dynamic Simulation of a Two-Valve Solenoid Actuator”, SAE Technical Paper
921086, 1992.
[16] Asai, Yasuyoshi, K. Hirata, and T. Ota. “Amplitude Control Method of Linear Resonant
Actuator by Load Estimation From the Back-EMF”, IEEE transactions on magnetics, vol.49,
No.5, 2013, pp. 2253-2256.
[17] H. Lu, J. Deng, Z. Hu and Z. Wu, “Impact of Control Methods on Dynamic Characteristic of
High Speed Solenoid Injectors”, SAE Technical Paper 2014-01-1445, 2014.
[18] S. Domanski, “Effects Contributing to the Temperature Rise of Electromagnetic Actuators”,
SAE Technical Paper 2000-01-0543, 2000.
[19] Araujo, W. Pedro and Richard G. Brereton, “Experimental design II. Optimization”, TrAC
Trends in Analytical Chemistry, vol.15, No. 2, 1996, pp. 63-70.
[20] J. D. Tew, “Using central composite designs in simulation experiments”, Proceedings of the
24th conference on Winter simulation, 1992, pp. 529-538.
[21] B. Huber and H. Ulbrich, “Modeling and experimental validation of the solenoid valve of a
common rail diesel injector”, SAE Technical Paper 2014-01-0195, 2014.
INTERNATIONAL JOURNAL ON SMART SENSING AND INTELLIGENT SYSTEMS VOL. 8, NO. 4, DECEMBER 2015
2285