29
Electron Beam MicroAnalysis- Theory and Application Electron Probe MicroAnalysis - (EPMA) X-ray Production: Ionization and Absorption UofO- Geology 619
Electron Beam MicroAnalysis- Theory and Application
Electron Probe MicroAnalysis -(EPMA)
X-ray Production:
Ionization and Absorption
UofO- Geology 619

Schrödinger Model:
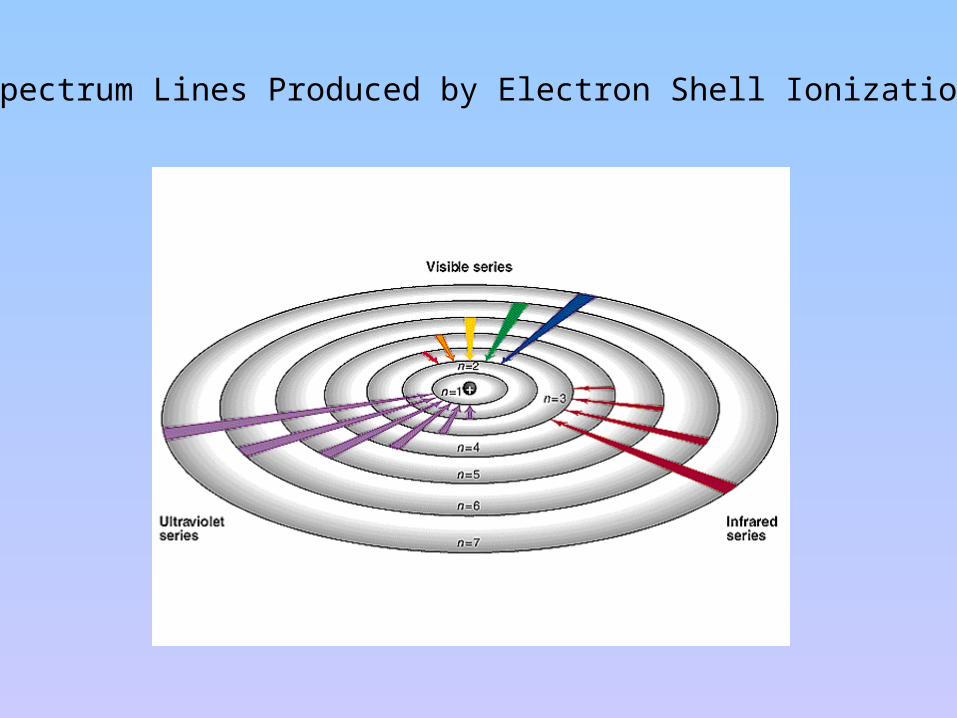
EM Spectrum Lines Produced by Electron Shell Ionization
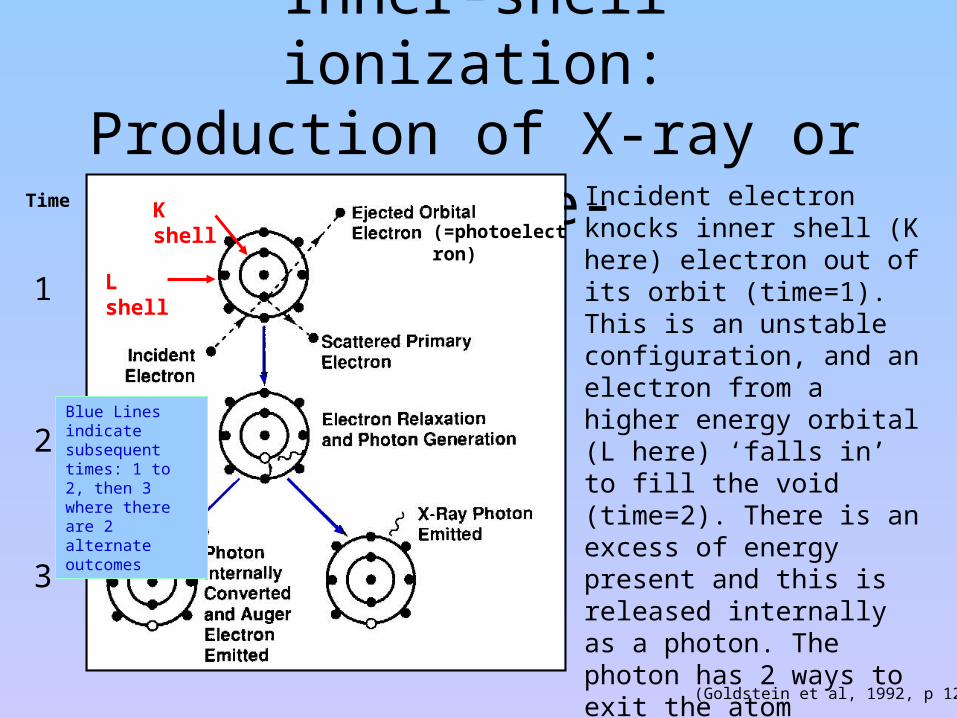
Inner-shell ionization:Production of X-ray or Auger e-
(Goldstein et al, 1992, p 120)
Incident electron knocks inner shell (K here) electron out of its orbit (time=1). This is an unstable configuration, and an electron from a higher energy orbital (L here) ‘falls in’ to fill the void (time=2). There is an excess of energy present and this is released internally as a photon. The photon has 2 ways to exit the atom (time=3), either by ejecting another outer shell electron as an Auger electron (L here, thus a KLL transition), or as X-ray (KL transition).
K shell
L shell
(=photoelectron)
Blue Lines indicate subsequent times: 1 to 2, then 3 where there are 2 alternate outcomes
Time
1
2
3
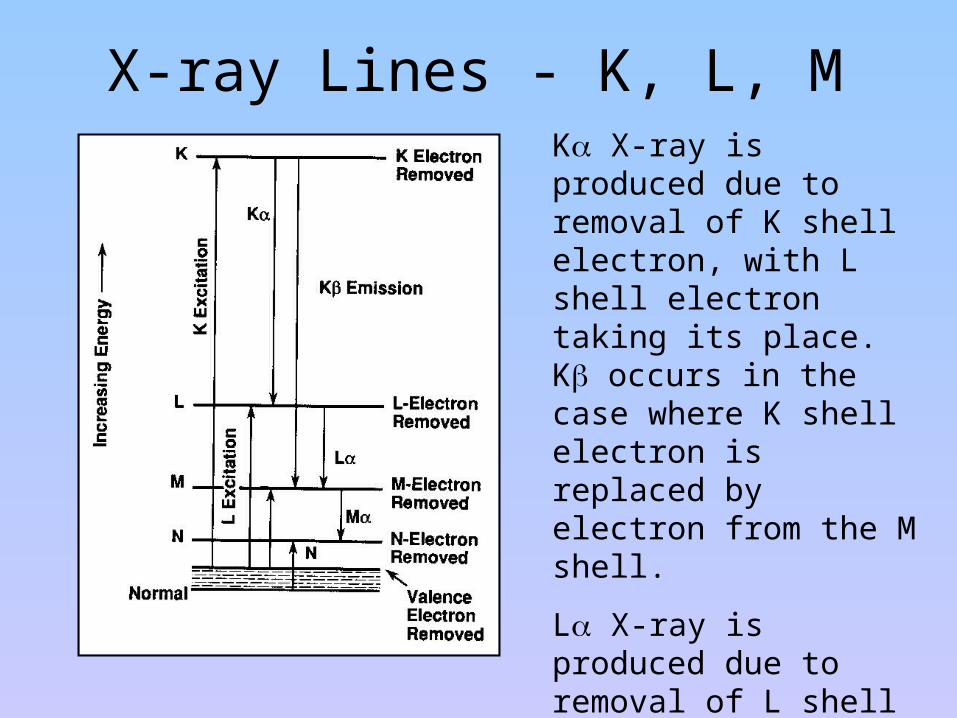
X-ray Lines - K, L, MK X-ray is produced due to removal of K shell electron, with L shell electron taking its place. K occurs in the case where K shell electron is replaced by electron from the M shell.
L X-ray is produced due to removal of L shell electron, replaced by M shell electron.
M X-ray is produced due to removal of M shell electron, replaced by N shell electron.
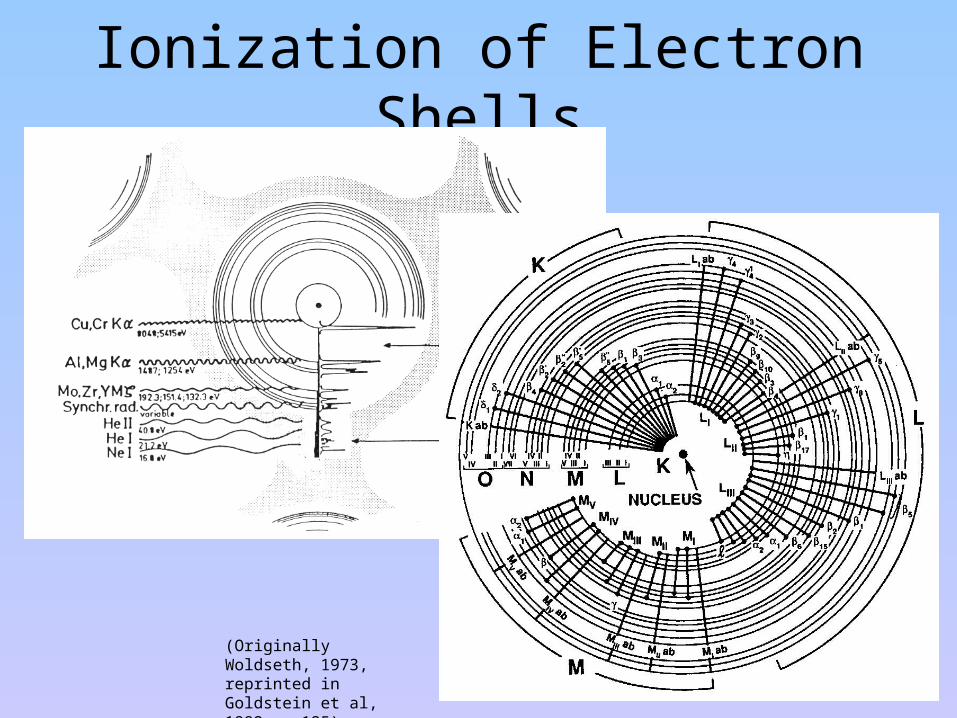
Ionization of Electron Shells
(Originally Woldseth, 1973, reprinted in Goldstein et al, 1992, p 125)
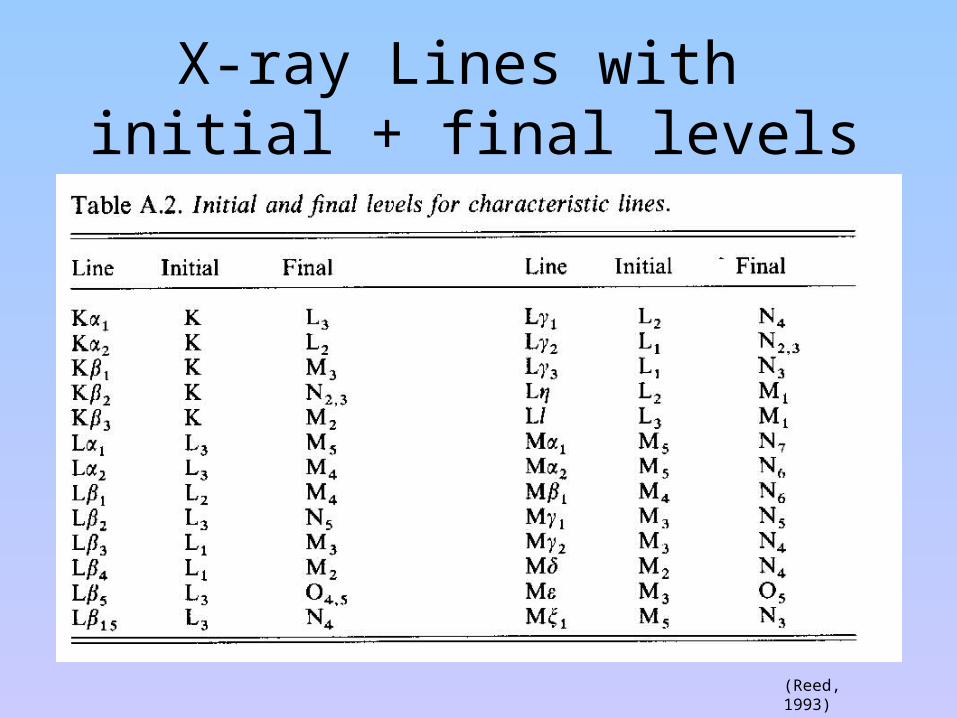
X-ray Lines with initial + final levels
(Reed, 1993)
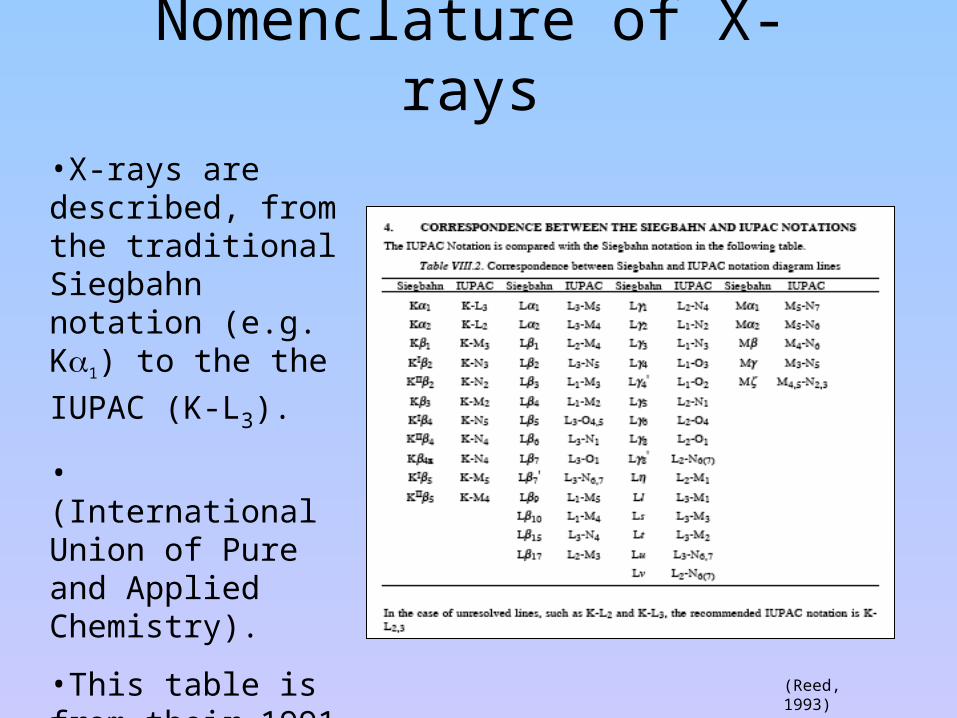
Nomenclature of X-rays
(Reed, 1993)
•X-rays are described, from the traditional Siegbahn notation (e.g. K1) to the the
IUPAC (K-L3).
• (International Union of Pure and Applied Chemistry).
•This table is from their 1991 recommendation.
n l s m j number ofelectrons
Sub shell X-raynotation
1 0 ½ 0 ½ 2 1s K
2 0 ½ 0 ½ 2 2s LI
2 1 LII
2 1 ½ -1, 0, 1 ½ ½ ½
6 2p LIII
3 0 ½ 0 ½ 2 3s MI
3 1 MII
3 1
½ -1, 0, 1 ½ ½ ½
6 3pMIII
3 2 MIV
3 2
½ -2, -1, 0,1, 2
½ ½ ½ ½ ½
10 3dMV
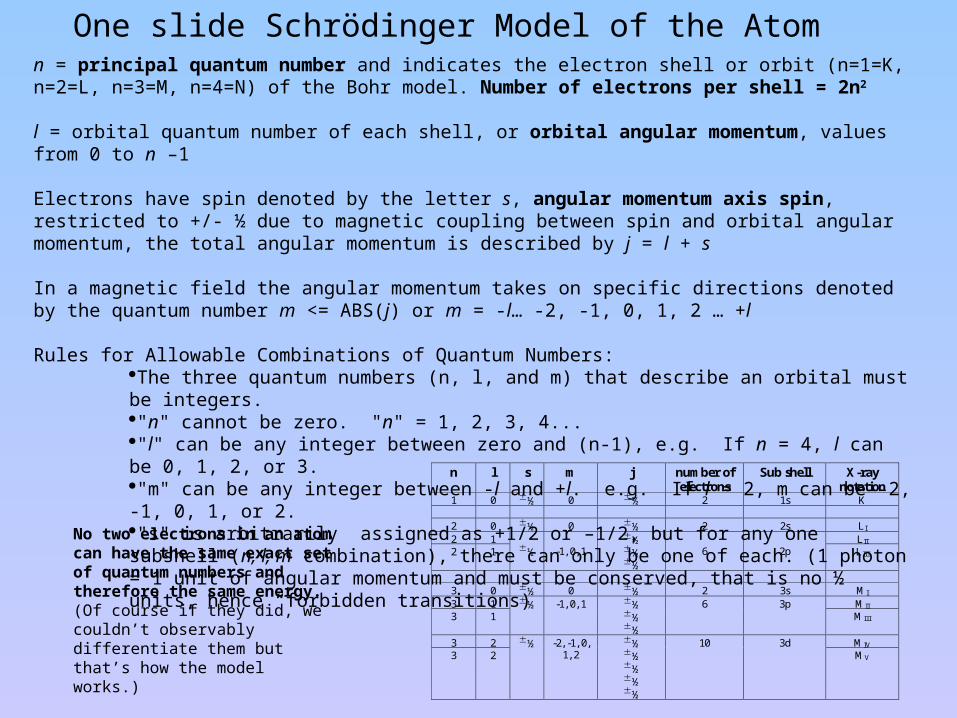
n = principal quantum number and indicates the electron shell or orbit (n=1=K, n=2=L, n=3=M, n=4=N) of the Bohr model. Number of electrons per shell = 2n2
l = orbital quantum number of each shell, or orbital angular momentum, values from 0 to n –1
Electrons have spin denoted by the letter s, angular momentum axis spin, restricted to +/- ½ due to magnetic coupling between spin and orbital angular momentum, the total angular momentum is described by j = l + s
In a magnetic field the angular momentum takes on specific directions denoted by the quantum number m <= ABS(j) or m = -l… -2, -1, 0, 1, 2 … +l
Rules for Allowable Combinations of Quantum Numbers:The three quantum numbers (n, l, and m) that describe an orbital must be integers. "n" cannot be zero. "n" = 1, 2, 3, 4... "l" can be any integer between zero and (n-1), e.g. If n = 4, l can be 0, 1, 2, or 3. "m" can be any integer between -l and +l. e.g. If l = 2, m can be -2, -1, 0, 1, or 2. "s" is arbitrarily assigned as +1/2 or –1/2, but for any one subshell (n, l, m combination), there can only be one of each. (1 photon = 1 unit of angular momentum and must be conserved, that is no ½ units, hence “forbidden transitions)
No two electrons in an atom can have the same exact set of quantum numbers and therefore the same energy. (Of course if they did, we couldn’t observably differentiate them but that’s how the model works.)
One slide Schrödinger Model of the Atom
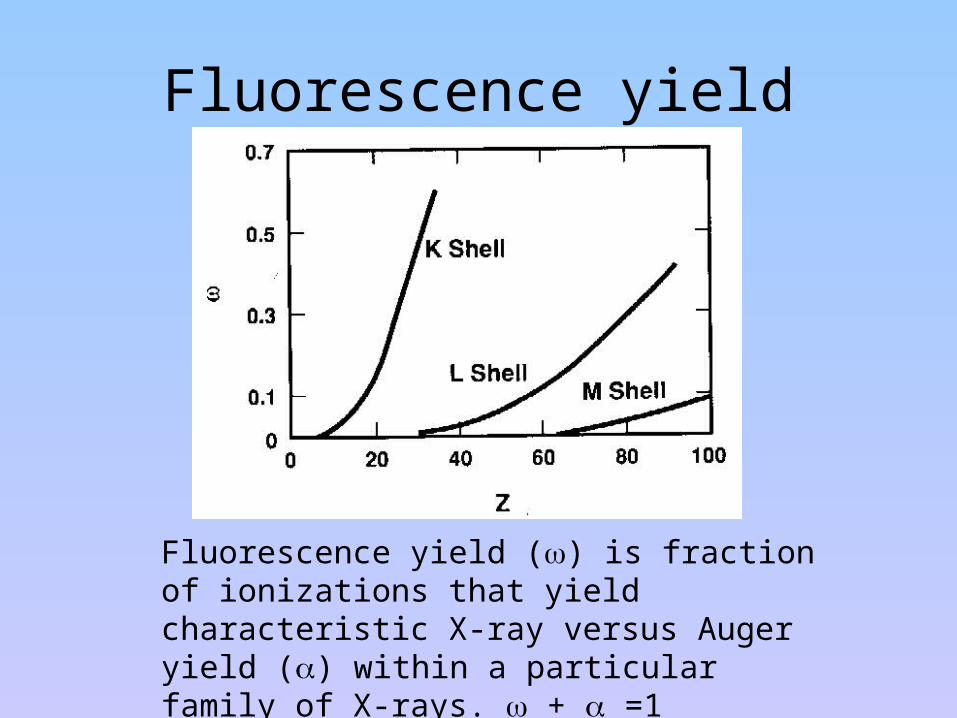
Fluorescence yield
Fluorescence yield () is fraction of ionizations that yield characteristic X-ray versus Auger yield () within a particular family of X-rays. + =1
Absorption Edge Energy
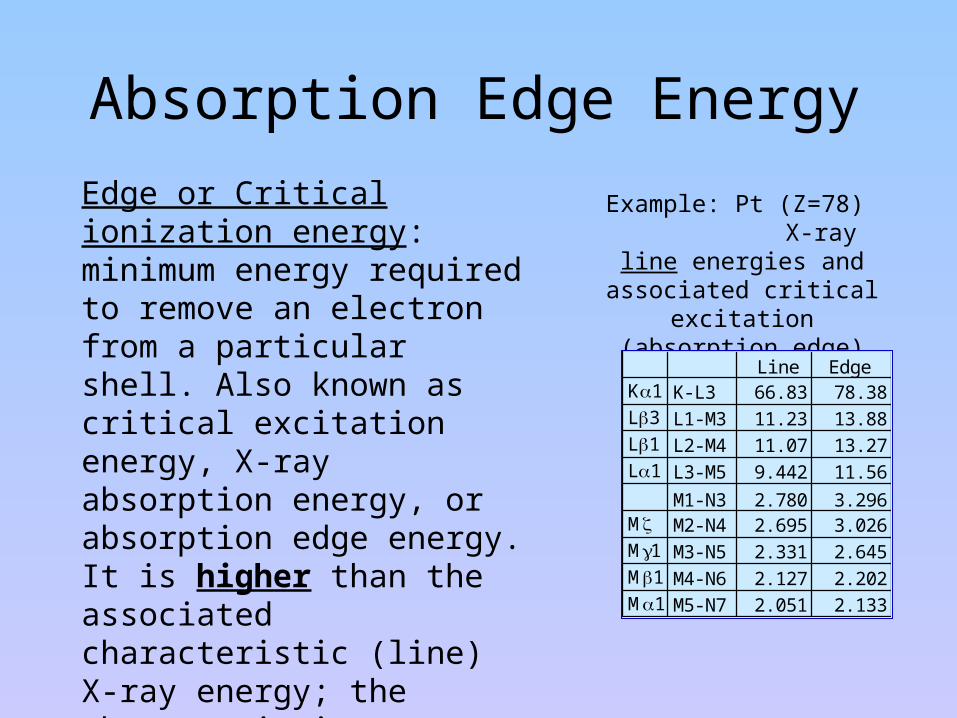
Example: Pt (Z=78) X-ray line energies and
associated critical excitation (absorption edge) energies,
in keV
Edge or Critical ionization energy: minimum energy required to remove an electron from a particular shell. Also known as critical excitation energy, X-ray absorption energy, or absorption edge energy. It is higher than the associated characteristic (line) X-ray energy; the characteristic energy is value measured by our X-ray detector.
Line EdgeK1 K-L3 66.83 78.38L3 L1-M3 11.23 13.88L1 L2-M4 11.07 13.27L1 L3-M5 9.442 11.56
M1-N3 2.780 3.296M M2-N4 2.695 3.026M1 M3-N5 2.331 2.645M1 M4-N6 2.127 2.202M1 M5-N7 2.051 2.133
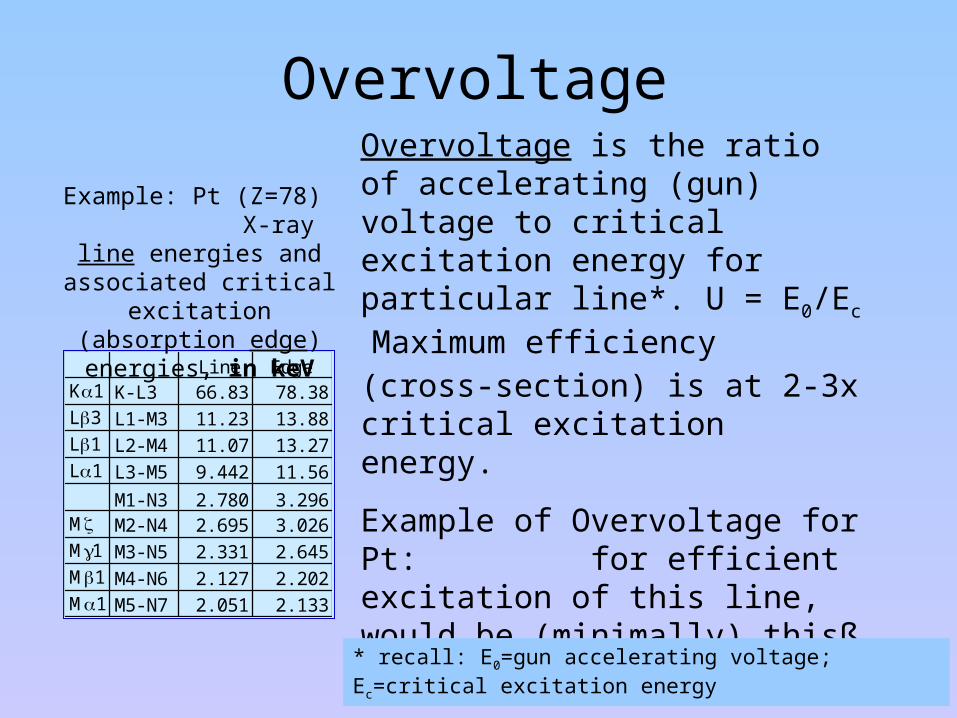
OvervoltageOvervoltage is the ratio of accelerating (gun) voltage to critical excitation energy for particular line*. U = E0/Ec
Maximum efficiency (cross-section) is at 2-3x critical excitation energy.
Example of Overvoltage for Pt: for efficient excitation of this line, would be (minimally) thisß accelerating voltage
• La -- 23 keV
• Ma -- 4 keV
Line EdgeK1 K-L3 66.83 78.38L3 L1-M3 11.23 13.88L1 L2-M4 11.07 13.27L1 L3-M5 9.442 11.56
M1-N3 2.780 3.296M M2-N4 2.695 3.026M1 M3-N5 2.331 2.645M1 M4-N6 2.127 2.202M1 M5-N7 2.051 2.133
Example: Pt (Z=78) X-ray line energies and
associated critical excitation (absorption edge) energies,
in keV
* recall: E0=gun accelerating voltage; Ec=critical excitation energy
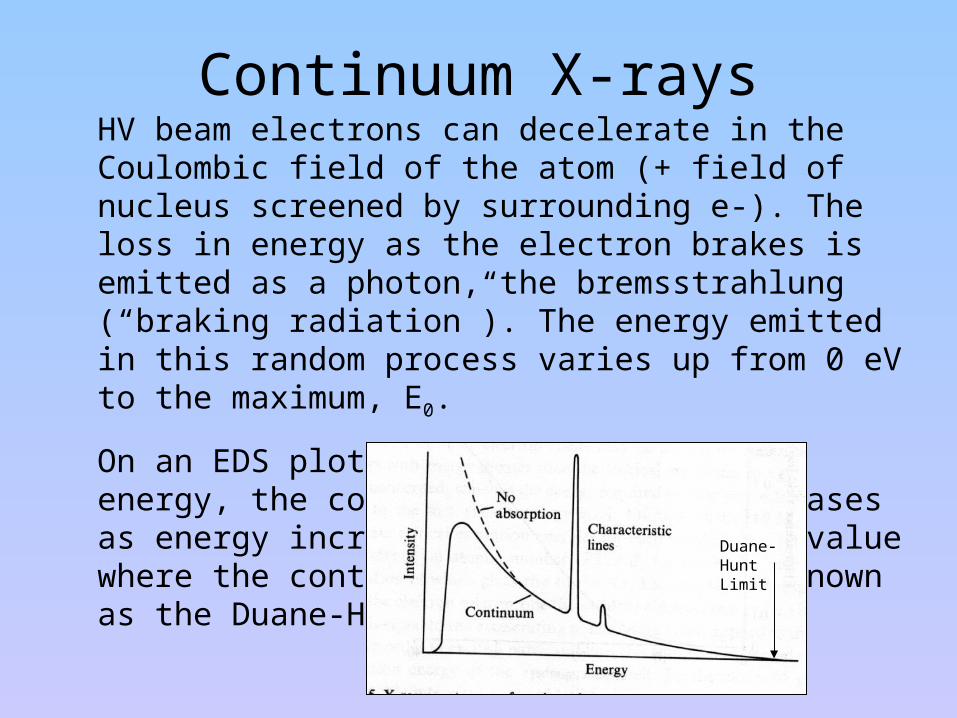
Continuum X-raysHV beam electrons can decelerate in the Coulombic field of the atom (+ field of nucleus screened by surrounding e-). The loss in energy as the electron brakes is emitted as a photon, the bremsstrahlung (“braking radiation”). The energy emitted in this random process varies up from 0 eV to the maximum, E0.
On an EDS plot of X-ray intensity vs energy, the continuum intensity decreases as energy increases. The high energy value where the continuum goes to zero is known as the Duane-Hunt limit.
Duane-Hunt Limit
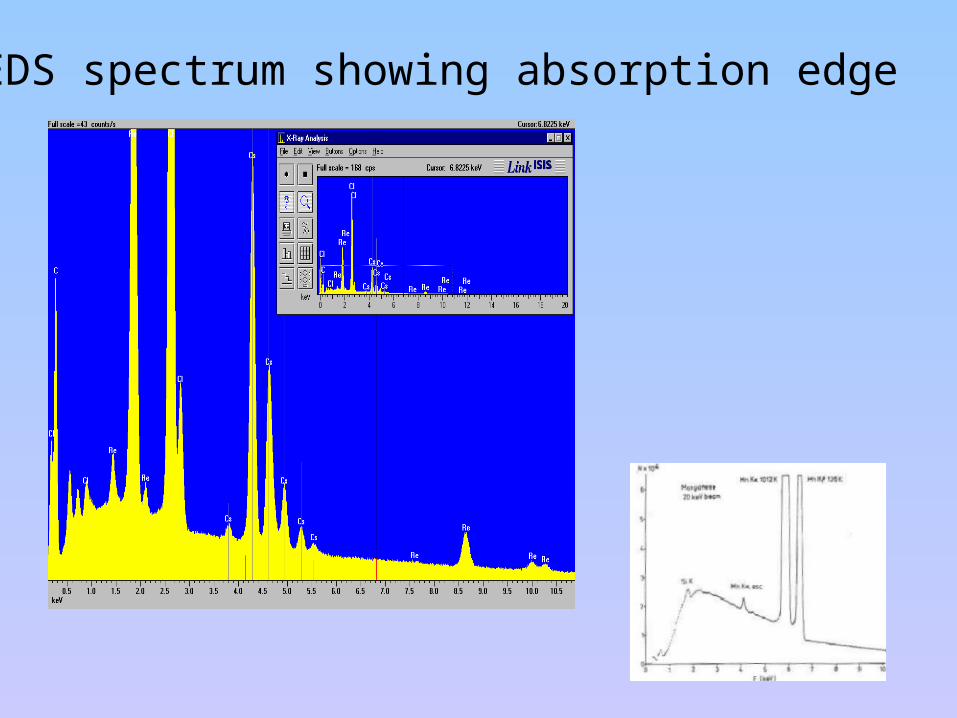
EDS spectrum showing absorption edge
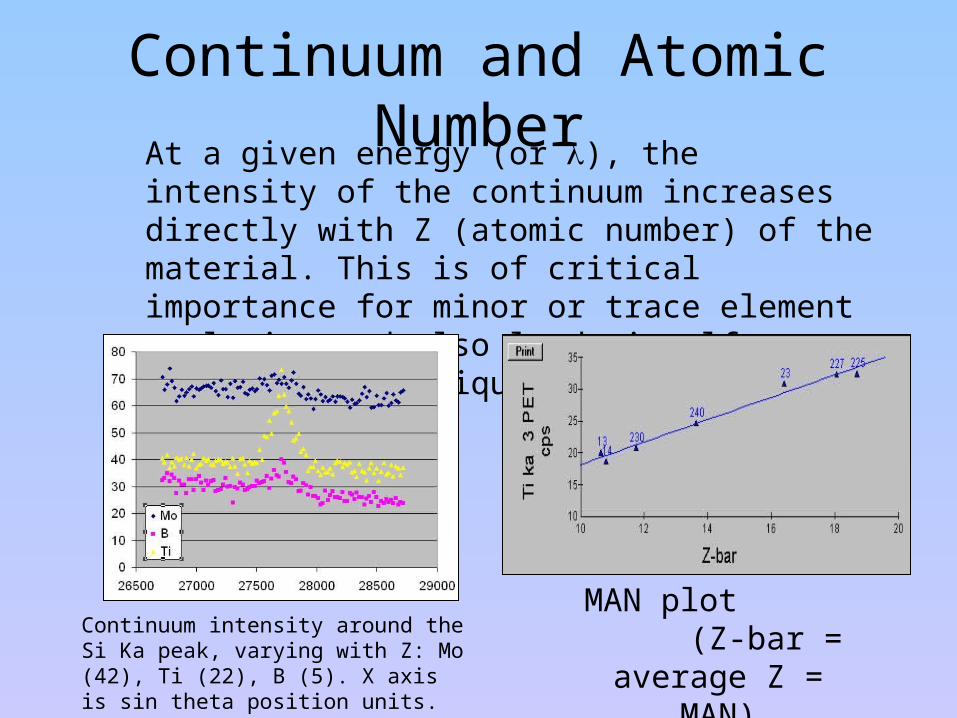
Continuum and Atomic NumberAt a given energy (or ), the intensity of the continuum increases directly with Z (atomic number) of the material. This is of critical importance for minor or trace element analysis, and also lends itself to a timesaving technique (Mean Atomic Number,“MAN”).
MAN plot (Z-bar = average Z
= MAN)
Continuum intensity around the Si Ka peak, varying with Z: Mo (42), Ti (22), B (5). X axis is sin theta position units.
General observations
•Above atomic number 10, the K family splits into K and K pairs•Above atomic number 20, the L family becomes generally observable at about 0.2 keV•Above atomic number 50, the M family of lines begin to appear
When an electron beam has sufficient energy to excite the shell edge (absorption edge), all lines of lower energy for that element will also be excited.
This is an important fact to consider when trying to positively identify the presence of an element in a spectra. Therefore if K lines are present, then L and M lines must also be present at their appropriate energies.
X-ray units: A, keV, sin , mm
= hc/E0 where h=Plancks constant, c=speed of light
= 12.398/E0 where is is in Å and E0 in keV
also, the 2 main EMPs plot up X-ray positions thusly:
Cameca: n = 2d sin so for n=1 and a given 2d, an X-ray line can be given as a sin value (or 105 times sin )
JEOL: distance (L, in mm) between the sample (beam spot) and the diffracting crystal, i.e. L= R/d, where R is Rowland circle radius (X-ray focusing locus of points) and d is interlayer spacing of crystal.
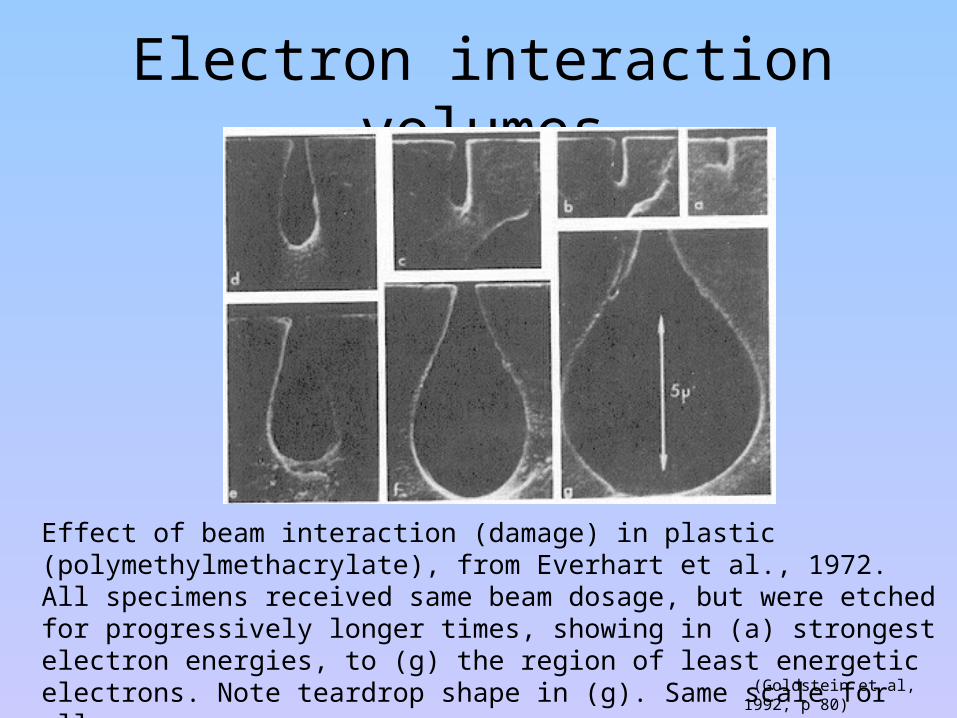
Electron interaction volumes
(Goldstein et al, 1992, p 80)
Effect of beam interaction (damage) in plastic (polymethylmethacrylate), from Everhart et al., 1972. All specimens received same beam dosage, but were etched for progressively longer times, showing in (a) strongest electron energies, to (g) the region of least energetic electrons. Note teardrop shape in (g). Same scale for all.
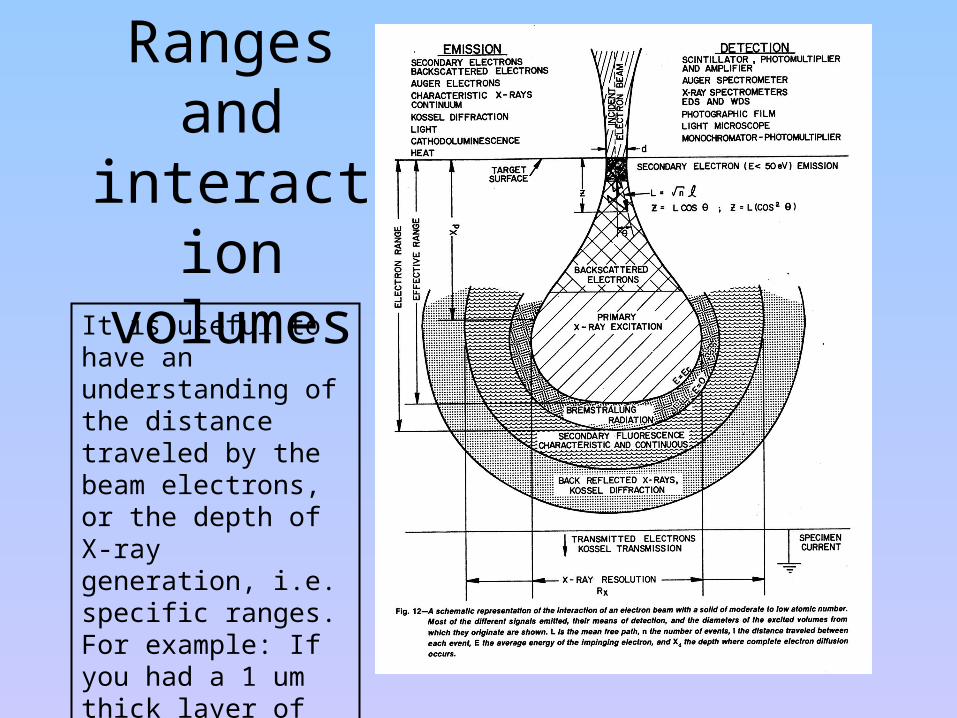
Ranges and interaction volumes
It is useful to have an understanding of the distance traveled by the beam electrons, or the depth of X-ray generation, i.e. specific ranges. For example: If you had a 1 um thick layer of compound AB atop substrate BC, is EPMA of AB possible?
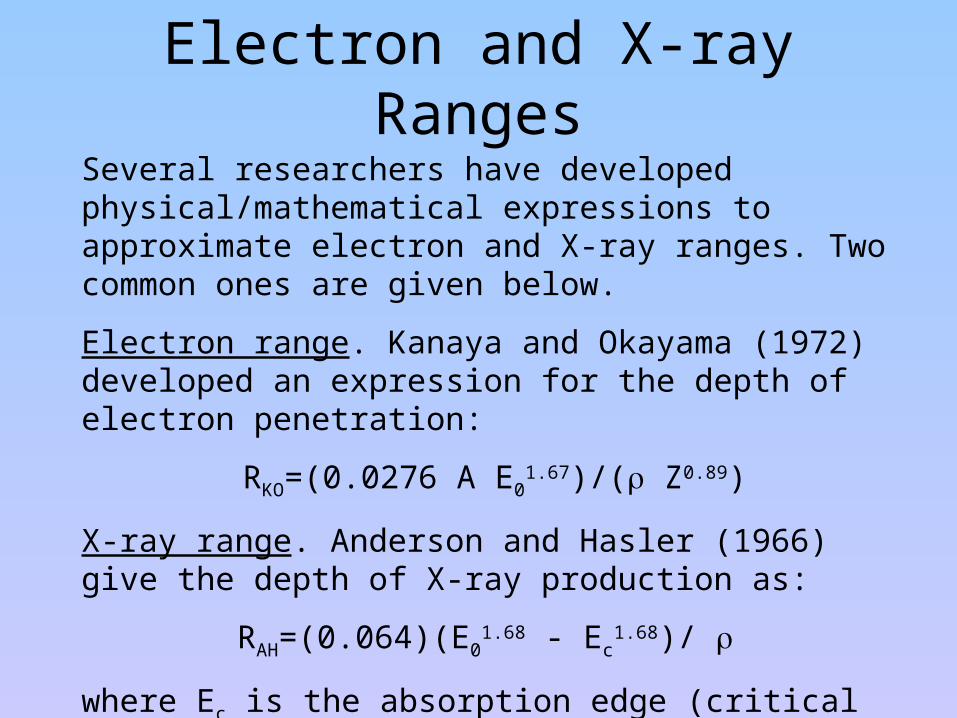
Electron and X-ray Ranges
Several researchers have developed physical/mathematical expressions to approximate electron and X-ray ranges. Two common ones are given below.
Electron range. Kanaya and Okayama (1972) developed an expression for the depth of electron penetration:
RKO=(0.0276 A E01.67)/( Z0.89)
X-ray range. Anderson and Hasler (1966) give the depth of X-ray production as:
RAH=(0.064)(E01.68 - Ec
1.68)/
where Ec is the absorption edge (critical excitation) energy.
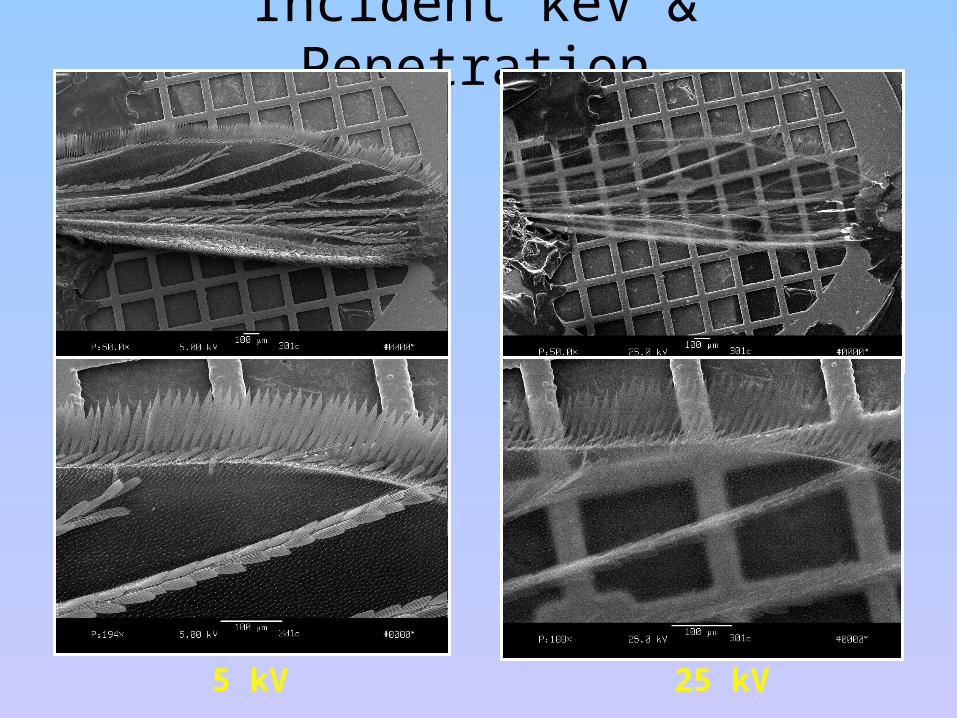
Incident keV & Penetration
5 kV 25 kV
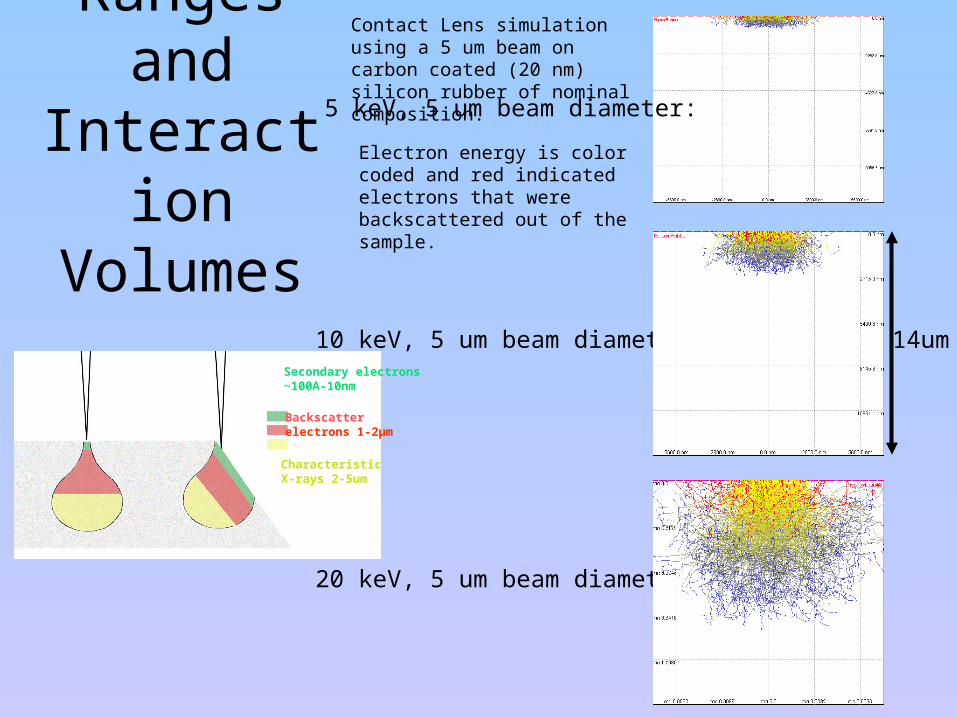
Ranges and Interaction Volumes
5 keV, 5 um beam diameter:
Contact Lens simulation using a 5 um beam on carbon coated (20 nm) silicon rubber of nominal composition.
Electron energy is color coded and red indicated electrons that were backscattered out of the sample.
10 keV, 5 um beam diameter:
20 keV, 5 um beam diameter:
14um
Characteristic X-rays 2-5um
Secondary electrons ~100A-10nm
Backscatter electrons 1-2µm
)(log1051.62
20 UcUE
bnQ se
C
ss
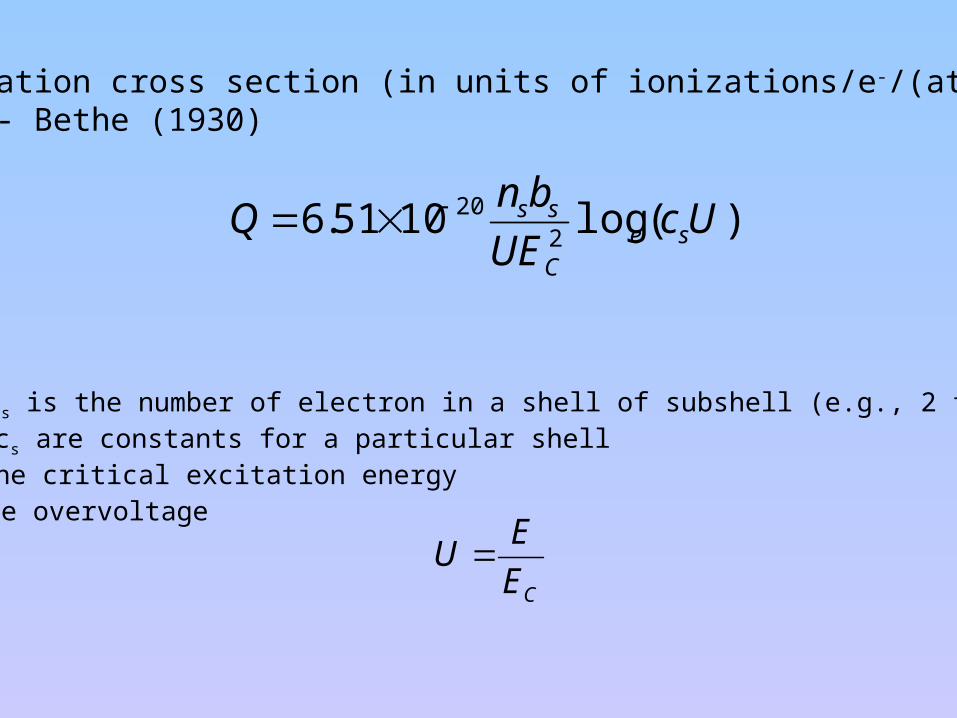
Ionization cross section (in units of ionizations/e-/(atom/cm2)- Bethe (1930)
where: ns is the number of electron in a shell of subshell (e.g., 2 for K shell)bs and cs are constants for a particular shellEc is the critical excitation energyU is the overvoltage
CE
EU
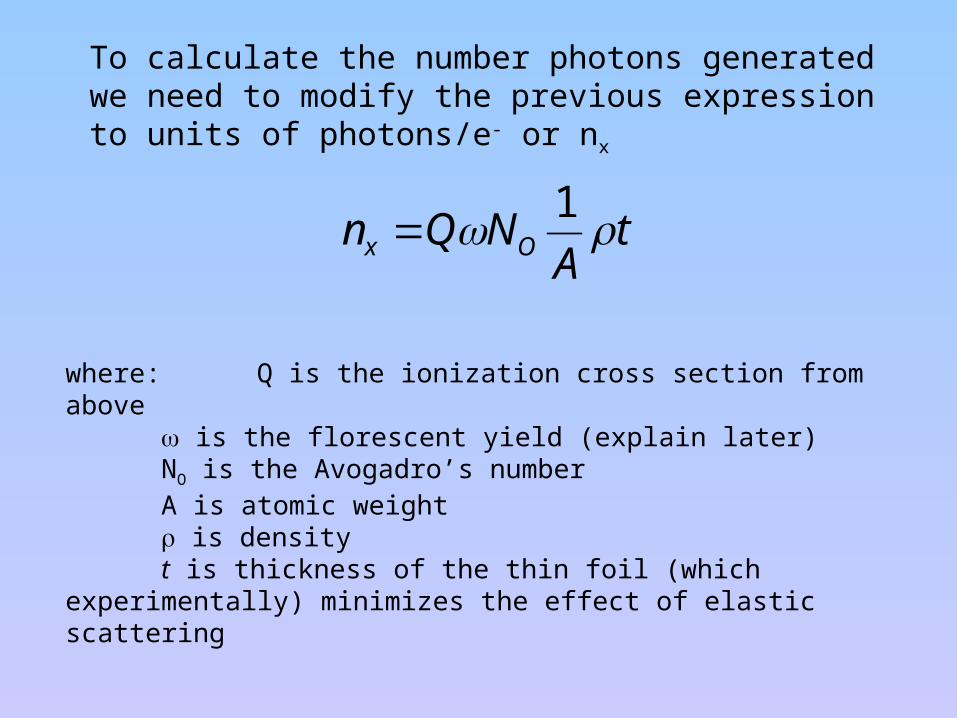
To calculate the number photons generated we need to modify the previous expression to units of photons/e- or nx
tA
NQn Ox 1
where: Q is the ionization cross section from above is the florescent yield (explain later)NO is the Avogadro’s numberA is atomic weight is densityt is thickness of the thin foil (which experimentally) minimizes the
effect of elastic scattering
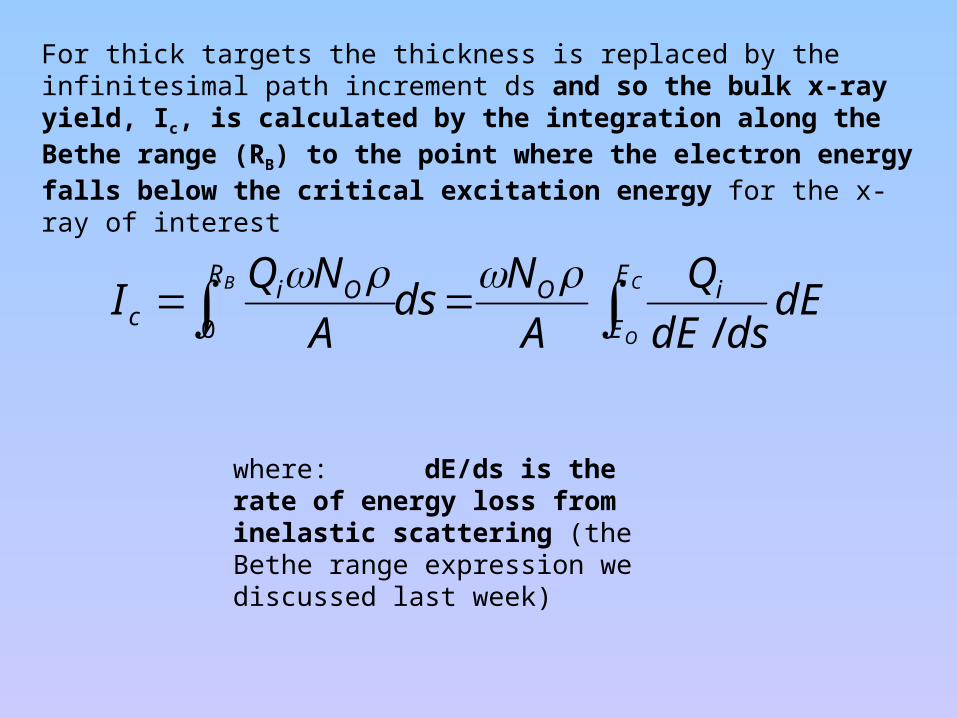
For thick targets the thickness is replaced by the infinitesimal path increment ds and so the bulk x-ray yield, Ic, is calculated by the integration along the Bethe range (RB) to the point where the electron energy falls below the critical excitation energy for the x-ray of interest
C
O
B E
E
iOR
Oic dE
dsdE
Q
A
Nds
A
NQI
/0
where: dE/ds is the rate of energy loss from inelastic scattering (the Bethe range expression we discussed last week)
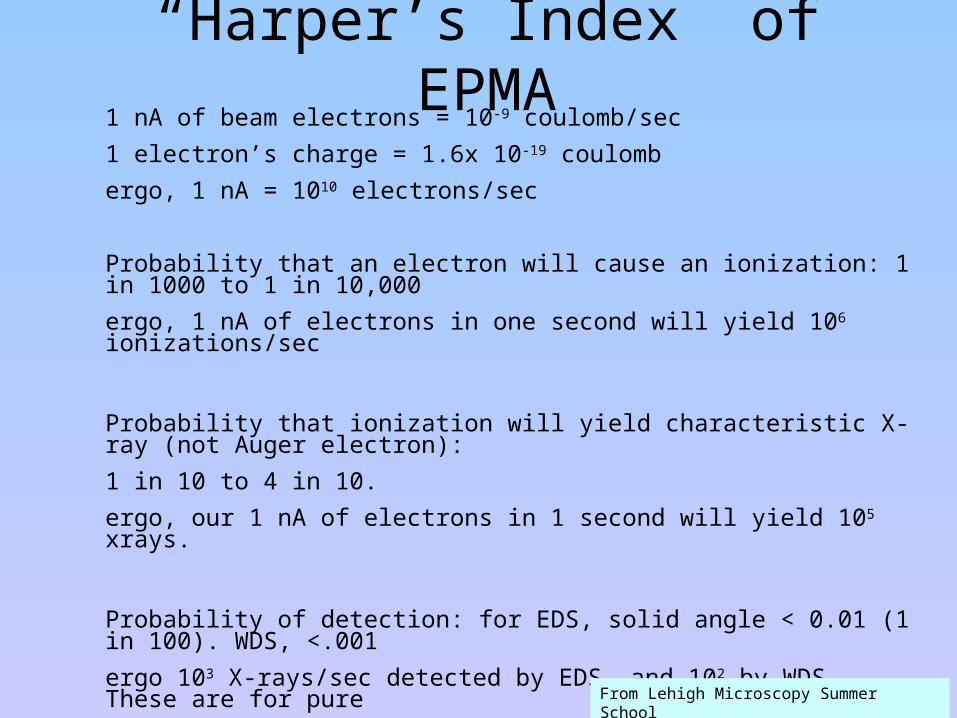
“Harper’s Index” of EPMA1 nA of beam electrons = 10-9 coulomb/sec
1 electron’s charge = 1.6x 10⁻¹⁹ coulomb
ergo, 1 nA = 1010 electrons/sec
Probability that an electron will cause an ionization: 1 in 1000 to 1 in 10,000
ergo, 1 nA of electrons in one second will yield 106 ionizations/sec
Probability that ionization will yield characteristic X-ray (not Auger electron):
1 in 10 to 4 in 10.
ergo, our 1 nA of electrons in 1 second will yield 105 xrays.
Probability of detection: for EDS, solid angle < 0.01 (1 in 100). WDS, <.001
ergo 103 X-rays/sec detected by EDS, and 102 by WDS. These are for pure
elements. For EDS, 10 wt%, 102 X-rays; 1 wt% 10 X-rays; 0.1 wt % 1 X-ray/sec.
ergo, counting statistics are very important, and we need to get as high count rates
as possible within good operating practices.From Lehigh Microscopy Summer School
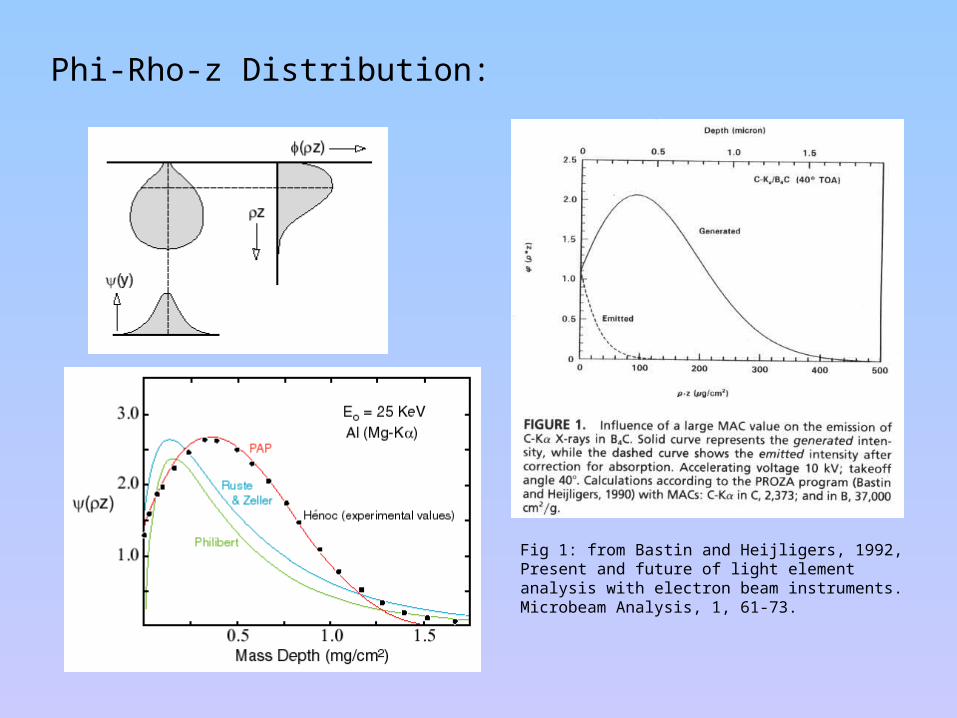
Phi-Rho-z Distribution:
Fig 1: from Bastin and Heijligers, 1992, Present and future of light element analysis with electron beam instruments. Microbeam Analysis, 1, 61-73.
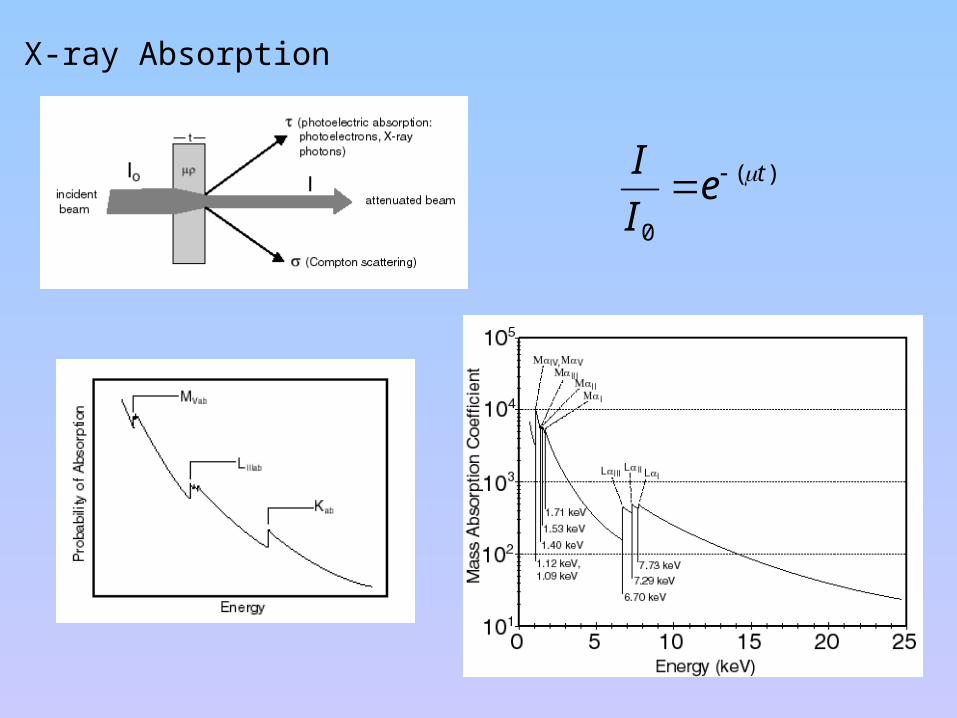
X-ray Absorption
)(
0
teI
I
))(/(
0
teI
I
j j
i
j
i
spec
C
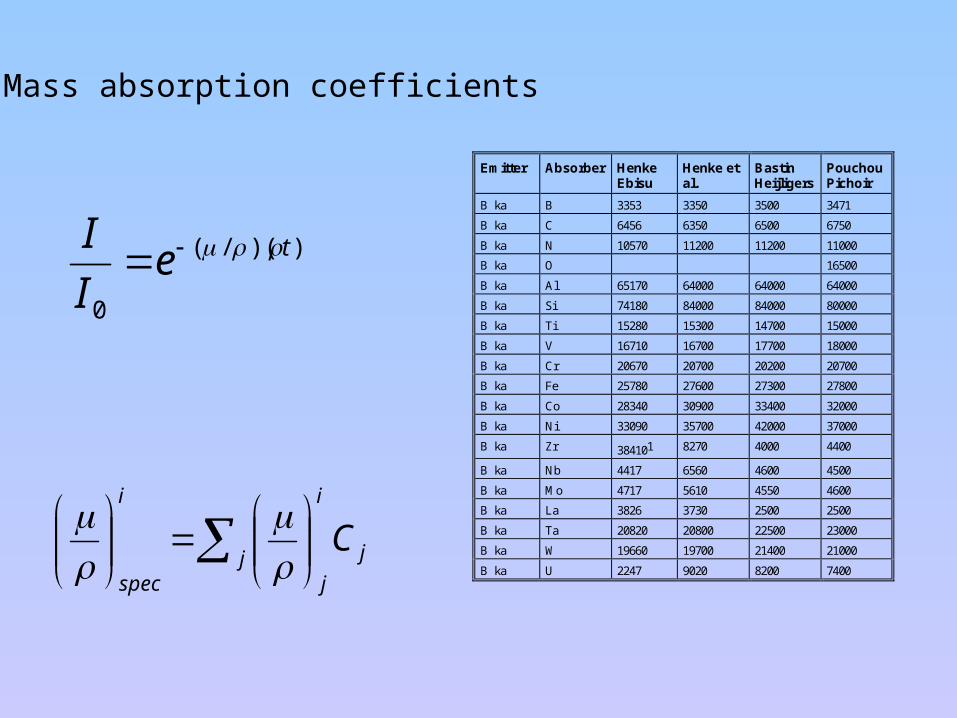
Emitter Absorber HenkeEbisu
Henke etal.
BastinHeijligers
PouchouPichoir
B ka B 3353 3350 3500 3471
B ka C 6456 6350 6500 6750
B ka N 10570 11200 11200 11000
B ka O 16500
B ka Al 65170 64000 64000 64000
B ka Si 74180 84000 84000 80000
B ka Ti 15280 15300 14700 15000
B ka V 16710 16700 17700 18000
B ka Cr 20670 20700 20200 20700
B ka Fe 25780 27600 27300 27800
B ka Co 28340 30900 33400 32000
B ka Ni 33090 35700 42000 37000
B ka Zr 384101 8270 4000 4400
B ka Nb 4417 6560 4600 4500
B ka Mo 4717 5610 4550 4600
B ka La 3826 3730 2500 2500
B ka Ta 20820 20800 22500 23000
B ka W 19660 19700 21400 21000
B ka U 2247 9020 8200 7400
Mass absorption coefficients


