40
LLNL-TR-606312 Electron Beam Welding and Characterization of 21-6-9 Stainless Steel Annealed Plate and Welds J. W. Elmer, D. Hiromoto, C. Evans, J. Florando, I. Golosker December 4, 2012

LLNL-TR-606312
Electron Beam Welding andCharacterization of 21-6-9 Stainless SteelAnnealed Plate and Welds
J. W. Elmer, D. Hiromoto, C. Evans, J. Florando,I. Golosker
December 4, 2012

Disclaimer
This document was prepared as an account of work sponsored by an agency of the United States government. Neither the United States government nor Lawrence Livermore National Security, LLC, nor any of their employees makes any warranty, expressed or implied, or assumes any legal liability or responsibility for the accuracy, completeness, or usefulness of any information, apparatus, product, or process disclosed, or represents that its use would not infringe privately owned rights. Reference herein to any specific commercial product, process, or service by trade name, trademark, manufacturer, or otherwise does not necessarily constitute or imply its endorsement, recommendation, or favoring by the United States government or Lawrence Livermore National Security, LLC. The views and opinions of authors expressed herein do not necessarily state or reflect those of the United States government or Lawrence Livermore National Security, LLC, and shall not be used for advertising or product endorsement purposes.
This work performed under the auspices of the U.S. Department of Energy by Lawrence Livermore National Laboratory under Contract DE-AC52-07NA27344.

LLNL-TR-654513
Page 1
Electron Beam Welding and Characterization of
21-6-9 Stainless Steel Annealed Plate and Welds by:
John W. Elmer, G. Fred Ellsworth, Jeff N. Florando, Dave S. Hiromoto,
Cheryl L. Evans, and Ilya V. Golosker
September 27, 2012
Summary
This report summarizes the electron beam (EB) welding and characterization work performed
on annealed 21-6-9 stainless steel plate during the 2011-2012 time period. The work was
directed at producing legacy autogeneous EB welds with the use of the Enhanced Modified
Faraday Cup (EMFC) EB diagnostic to characterize the beam, and measuring the resulting
tensile and hardness properties of the weld relative to annealed 21-6-9 stainless steel base
metal. Different tensile bar configurations were produced, and the results were analyzed to
determine how well the stress-strain behavior of small tensile samples compares to standard
sized tensile samples for the same material. Additional comparisons were made between
cross-weld tensile samples with and without weld steps to determine how the unwelded
portion of a step joint affects the measured tensile behavior. Base metal tensile data was
further used to calibrate a spherical indentation method to estimate uniaxial tensile behavior
using a nanoindenter. The calibrated method was then used to generate the first engineering
stress-strain curve for EB welded 21-6-9 stainless steel. Additional analysis was performed to
determine Steinberg-Guinan and Johnson-Cook model parameters to represent both the
annealed 21-6-9 SS base metal and the EB weld metal stress-strain behaviors under quasi static
strain rate conditions.
Introduction
Alloy 21-6-9 stainless steel (SS), known as Nitronic 40 and further designated as UNS S21900,
was developed as an improved austenitic stainless steel over traditional 18%Cr-8%Ni 300 series
stainless steel alloys. 21-6-9 SS contains nominally 21%Cr, 6%Ni, 9% Mn, and has improved
corrosion resistance due to its higher Cr content of 21%. In addition, 21-6-9 SS uses N rather

LLNL-TR-654513
Page 2
than C as a strengthener, which reduces the tendency for corrosion sensitization that can occur
during heat treating and welding. Nitrogen can be added up to 0.35%, which improves the
room temperature yield strength of 21-6-9 SS over 300 series stainless steel alloys, while
maintaining good toughness and high ductility (>40%). Manganese is added to 21-6-9 SS to
increase austenite stability, particularly at cryogenic temperatures, while reducing the Ni
content from 8% to 6% as compared to 300 series stainless steels. 21-6-9 SS can be further
strengthened by cold work and can be machined, forged, and welded using the same methods
as 300-series stainless steels. Due to its higher strength, excellent corrosion resistance, and
ease of fabrication, 21-6-9 SS is an ideal material where multiple parts need to be produced and
joined by fusion welding to create the required shape. Since welding can alter the properties of
the base metals being joined, this report discusses the mechanical properties of the 21-6-9 SS
and the effects of welding on quasi-static stress-strain, and hardness behavior of welds relative
to the base metal properties. A review report on characterization of 21-6-9 SS base metal can
be found in Ref [1], and its yield stress over a wide range of strain rates and temperatures can
be found in Ref [2].
Material and Experimental Procedures
Materials
Annealed 21-6-9 SS plate was acquired from LLNL WR certified material storage. The
composition of the plate is summarized in Table 1, where the measured “actual” composition of
this plate is compared to the commercial “specification”, the LLNL “Guarantee”, and the LLNL
desired “Aim” composition range for weldability. The LLNL requirements are from specification
RM254700-000 for electroslag remelted cross rolled plate, which has a stringent requirement
over control of nitrogen for improved electron beam weldability. The alloy falls within the LLNL
guaranteed composition range for all elements except silicon, which is lower than the
guarantee range, but meets the LLNL AIM requirement. The initial plate measured 3 mm thick
and was further machined to the size of 100 x 200 x 1.5 mm for base metal material property
testing. Ferrite measurements were made on the base metal using a Magne-Gage tester and a
number 3 magnet, showing that the base metal had no measurable ferrite. After welding, the
ferrite content was measured on polished cross sections and on the top of the electron beam
weld beads, showing that the welds contained delta ferrite that measured between 0.8 to 1.1%.
However, due to the small weld volume (~1mm deep, 1.5 mm wide), the magnetic
measurements may underestimate the actual ferrite content of the weld by as much as 5X due
to incorporation of the zero percent base metal ferrite into the readings.

LLNL-TR-654513
Page 3
Electron Beam Welding
Samples to be welded were machined to the size of 50 x 200 x 1.5 mm, so that when welded
along their length they would have the same dimensions as the base metal samples. The weld
joint preparation was a step joint configuration, as documented in LLNL drawings AAA10-
502549 and AAA10-502550, which has a step height requiring 1 mm weld penetration. Electron
beam welds were made using LLNL electron beam welder #605 (blue welder) to match legacy
parameters that used a defocused beam. Note that only the penetration pass was made on
these welds, and that no cosmetic passes were made. All welds were made with a 9 inch work
distance, and performed at 4x10⁻⁵ torr vacuum. The LLNL Enhanced Modified Faraday Cup
(EMFC) electron beam diagnostic was used to measure the properties (peak power density, full
width half maximum, beam diameter, and beam aspect ratio) of each beam prior to welding
using the method detailed elsewhere [3, 4].
Tensile Testing
The base metal and welded plates were electro discharge machined (EDM) into two different
sized tensile bars as illustrated in Figure 1. The “standard “ tensile bars measured 4 inch long
per drawing AAA11-501227, Tab-01, and are based on an ASTM E-8 tensile sample with a
length-to width ratio of 4:1. The “mini” tensile samples were 2/5 size and maintained the same
4:1 length to width ratio as illustrated in drawing AAA11-501227, Tab-02. A portion of the 4x8
inch plate was reserved for biaxial bulge testing, but these tests have not been completed.
Tensile bars removed from the welded plate are cross-weld tensile samples, since all-weld,
longitudinal, tensile bars were not able to be prepared due to the small volume of welded
material. The welded tensile samples were further prepared using two methods as illustrated
in Fig. 2. The first method used the tensile bar in the full-thickness (1.5 mm) as welded
condition, i.e., with an unwelded portion of joint directly below the step joint. The second
method prepared the welds by machining the top and bottom surfaces of the welded sample to
a final thickness of 0.75 mm so as to remove any weld reinforcement and undercut on the top
surface and the unwelded portion below the step. Cross sectional areas of the samples were
measured, to calculate the stress, on each sample to account for any variations in machining
that may have occurred.
The Tab-02 “mini” sample tests were performed in an Instron 4444 electromechanical test
machine at room temperature and position control at a rate of 0.020 in/min. A Shepic strain
extensometer with a gage length of 0.225 inch – 50% was used to measure strain for the Tab-02
parent and milled weld mini-tensile samples, while a 0.138 inch gage length was used on the
full thickness mini samples. In all cases the knife edges of the extensometer were located
across the width of the sample and centered over the weld. The Tab-01 “standard sample”
tests were performed in an Instron 5800R/4505 test machine at room temperature and

LLNL-TR-654513
Page 4
position control at a rate of 0.050 in/min. An EIR LE-01 laser extensometer with a 1 inch gage
length was used to measure strain for the Tab-01 standard sized samples, with the gage length
centered over the weld, and with the laser facing the top (weld side) of the sample. The laser
measured the extension of two dimples on the sample that defined the gage length. The
modulus of elasticity was determined by the best fit straight line through the linear portion of
the stress-strain curve, the yield strength was determined using a 0.2% offset method, and the
ultimate tensile strength was determine by the peak load divided by the load bearing area.
Additional details and photographs of the testing setup can be found in [5].
Metallography, Microhardness, and Nanoindentation Testing
Metallographic cross sections of the welds and base metals were performed using standard
preparation procedures in the B231 microstructural characterization laboratory. The samples
were sectioned on a slow speed diamond saw, potted in a clear two-part epoxy, and then
ground on successive silicon carbide papers from 320 to 2400 grit. The samples were polished
first using 3 micron diamond paste, followed by a 1 micron alumina slurry. The samples to be
etched were electrolytically etched in a 5-10% oxalic acid solution at room temperature to bring
out the microstructure. Macrophotographs of the entire weld fusion zone shapes were made
using a Keyence VHX-600E Digital Microscope, while higher magnification micrographs were
made using a Reichert inverted stage metallograph.
Vickers microhardness testing was performed on a calibrated Leco AMH43 microhardness
testing system with load range from 1 to 500 gm. The indentations were made using a 50 gm
load, and were manually measured using a 50x objective to determine the Vickers Hardness
indentation diagonal lengths, which were typically about 20 microns corner to corner.
Nanoindentation hardness testing was done using a spherical indenter to measure load-depth
curves that could be converted into approximate stress-strain material behavior. This method
was particularly useful for estimating the stress-strain behavior of the welds, since the fusion
zones were too small for a standard tensile test method. The 21-6-9 SS samples (polished, but
not etched, base and weld metal) were testing in the B231 G200 Nanoindenter from Agilent. A
50 micron radius spherical diamond tip was used during these tests. The advantages of this
nanoindenter are that it has high load and displacement resolution, on the order of 50 nN and 1
nm respectively, and with the high load option can go up to 10 N of force. Due to the relatively
large diameter of the sphere coupled with the high strength of 21-6-9 SS, the high load option
was used for these tests. In addition, this nanoindenter can apply an oscillating signal on top of
the load signal which permits the stiffness of the material to be measured continuously (CSM)

LLNL-TR-654513
Page 5
as a function of depth. All the tests were run using the high load and CSM options to measure
the stiffness which is used in the calculation of stress and strain.
Electron Beam Welds and Microstructure
Electron beam welds were developed to match the exact heat input, and approximate defocus
of legacy welds. The welds were made using 110 kV, 5.5 mA (605 W) at a weld speed of 60 ipm,
however the amount of defocus was considered a variable since the legacy welds were made
on different electron beam welders with different focusing response. The welds in this study
were made with defocus settings of +35, +40 and +45 mA relative to the sharp focus setting of
725 mA, which bracket the legacy welds by +-5 mA of defocus. The resulting initial welds are
summarized in Fig. 3, which shows the results of the EMFC beam diagnostic alongside the cross
sectional weld pool shape. As predicted, the weld penetration increased with lower defocus
settings as the beam dimensions reduced and the peak power density increased. The only weld
that met the minimum penetration requirement to the bottom of the step was the weld
defocused the least amount at +35 mA. Based on the results of these three welds, a target
parameter range was established for a +35 mA defocused to have a peak power density of 1.5-
1.6 kW/mm2, a beam diameter of 0.90-1.0 mm, and a beam FWHM of 0.50-0.55 mm. These
data became the target data for the remaining welds that were made for tensile testing.
The final set of six welded step joint pairs was made on the same electron beam welder that
was used to make the development welds, with individual pumpdowns for each weld. The
welding parameters were also the same as the development welds, namely, 110kV, 5.5 mA
(605 W) beam, a weld speed of 60 ipm; however, the focus setting was adjusted as required to
maintain the beam parameters within the target value ranges. A typical beam profile that
meets these requirements is shown in Fig. 4. This beam produced a weld that had the desired
penetration and the geometric shape of a typical legacy weld, as shown in Fig. 5, weld 3. Note
that the beam is not circular at this level of defocus on this EB machine, and has an elliptical
shape with an aspect ratio of approximately 1.8:1. The elliptical beam shape is believed to be
the cause of the undercut on one side of the weld.
A summary of the EB welding parameters, weld penetrations, and weld widths is presented in
Table 2. The weld penetrations varied from 0.98 to 1.14 mm, while the weld widths across the
top surface varied from 1.51 to 1.56 mm. Metallographic cross sections of each of the six welds
are shown in Figure 5, indicating that the welds are reasonably uniform in shape, and that all of
the welds met the penetration requirement and were free of pores and cracks. Undercutting
appears on one side of the top surface that measures 52.7±5.4 m. The maximum undercut

LLNL-TR-654513
Page 6
was measured to be 58m, leaving at least 0.800 mm of full weld fusion zone above the step
for removal of the 0.750 mm thick milled tensile samples.
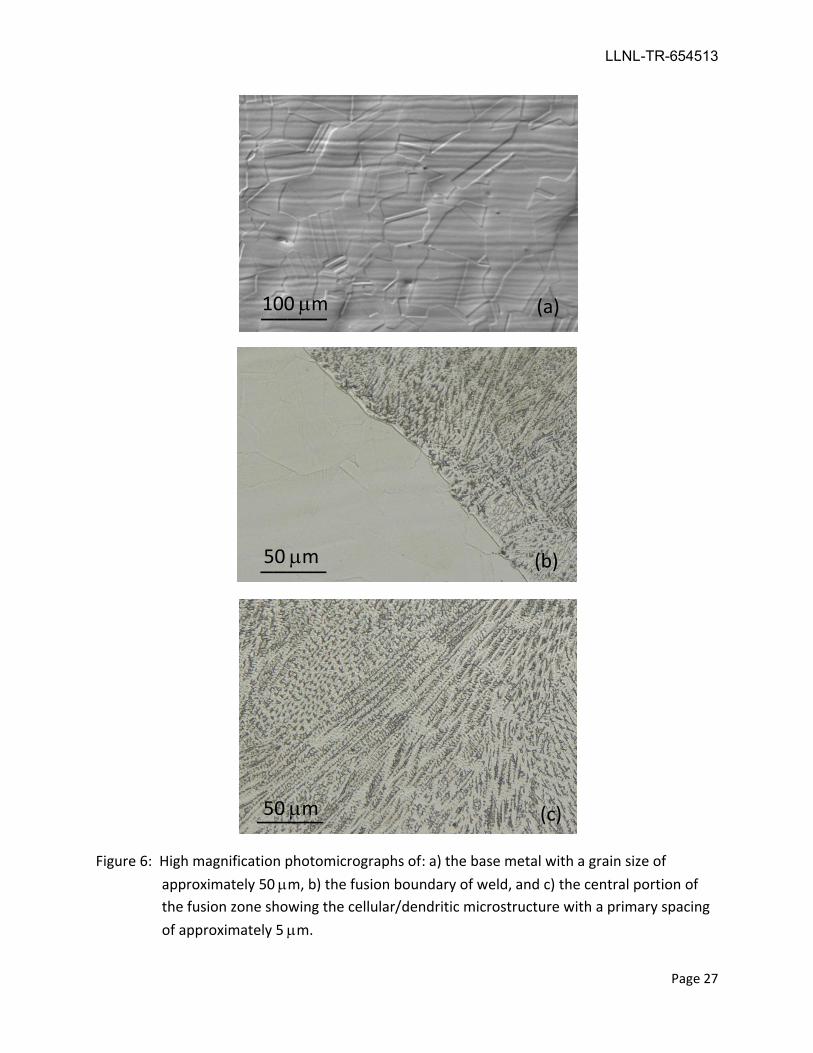
At high magnifications, the 21-6-9 SS weld microstructure was shown to be considerably
different than the base metal microstructure. Fig. 6a shows the base metal microstructure
which has consists of equiaxed grains that have an average grain diameter of approximately 50
m. Annealing twins are present in many of the grains, and small inclusions are randomly
dispersed. The base metal microstructure is banded due to the effects of chemical segregation
during ingot casting and subsequent hot working and rolling. The chemical segregation is
typical of 21-6-9 SS WR plate. No delta ferrite was observed or measured in the base metal
portions of the samples. The weld microstructure is shown at the fusion boundary in Fig. 6b
and in the central portion of the fusion zone in Fig. 6c. The microstructure consists of austenite
(light etching phase) with some remnant delta ferrite (dark etching phase). The majority of the
microstructure appears to have formed by the solidification of primary ferrite with second
phase austenite (FA) mode where the primary ferrite dendrites that form during solidification
partially transform to austenite during cooling [6]. The remaining vermicular/skeletal ferrite is
concentrated at the original cores of the ferrite dendrites, and represents only a small fraction
of the original primary ferrite phase that formed.
Figure 7a shows a higher magnification micrograph of the fusion boundary, where the
remaining ferrite can be seen more clearly, and represents about 3-5% of the fusion zone
microstructure in this location. Epitaxial regrowth of austenite from the base metal (1-2 m) is
followed by a zone (~10 m) that is difficult to interpret and initially may be the AF
solidification mode, which then transitions to the FA mode of solidification deeper into the
fusion zone. Also note the grain boundary ferrite that formed near the heat affected zone
(HAZ) at the upper left portion of the fusion zone. Figure 7b shows a higher magnification
micrograph near the center of the fusion zone, which clearly solidified in the FA mode with
skeletal ferrite present throughout the majority of the microstructure, and lacy ferrite [6]
present in the upper right hand side of the micrograph. The ferrite content appears to vary
between about 5% and 15% depending on the local ferrite morphology. The higher amount of
ferrite observed in the microstructure relative to that measured by the Magne-gage (~1%) is
related to the inherent error of measuring ferrite with the Magne-gage on small weld samples
that incorporate base metal (0% ferrite) into the reading.

LLNL-TR-654513
Page 7
Mechanical Properties of the Base Metal and Welds
Microhardness of the Base Metal and Weld Fusion Zones
Table 3 summarizes the microhardness measurements that were made on the base metal, the
electron beam fusion zone, and the HAZ for each of the 6 welded coupons. A total of 36
hardness measurements were made on the base metal samples, showing that the base metal
had an average hardness of 212.1 ± 10.9 HV. These values correspond to annealed 21-6-9 SS
sheet, which has a handbook value of RB 94 (HV 213) [7]. After welding, the fusion zone
hardness was measured at 254.4 ± 9.7 HV based on 62 measurements made in the 6 welds.
Figure 8 provides additional statistics about the hardness measurements in a quartile plot,
showing that the 20% increase in hardness after welding is statistically significant and clearly
indicates that the weld is strengthened relative to the 21-6-9 SS base metal due to its fine two-
phase solidification structure as described above.
Additional microhardness measurements were made in the HAZ of the welds by placing the
indenter in the base metal at a distance of 1-2 indentation distances (20-40 micron) from the
weld fusion line. The resulting measurements showed HAZ hardness values midway between
the weld fusion zone and the base metal of 232.1 ± 13.9 HV, with statistical outlier data points
as indicated in Fig. 8. The apparent strengthening of the HAZ is more likely due to the
indentation being artificially affected by the nearby harder weld metal than an actual increase
in hardness of the HAZ, based on the belief that there should be no HAZ hardening mechanisms
in the annealed 21-6-9 SS heat affected zone.
Stress-Strain Behavior of Cross-Weld Tensile and Base Metal Samples
The base metal and two different types of cross-weld samples were tensile tested to failure in
both standard (4 inch long) and mini (1 inch long) configuration dog-bone shaped samples.
Figure 9 shows the failure behavior for each of the six different tensile bar configurations. The
parent metal samples for the mini (a) and standard (d) tensile configurations failed
approximately in the middle of the gage length with necking occurring mostly through the
thickness of the bars. The welded samples that were milled to remove the effects of the
unwelded step and weld reinforcement for the mini (b) and standard (e) tensile configurations
failed approximately half-way between the weld and the radius that forms the tensile grips. In
both cases a “lump” of weld metal is left behind where the stronger weld fusion zone deforms
less than the base metal away from the weld. The final failures have a similar necking
appearance to the base metal samples. The welded samples that were pulled in the full-
thickness condition for the mini (c) and standard (f) tensile configurations failed in a completely
different manner. Due to the reduced amount of load bearing material above the step, the

LLNL-TR-654513
Page 8
samples failed in the base metal close to the weld, tearing through the base metal with less
apparent necking and less measured strain to failure than the other samples.
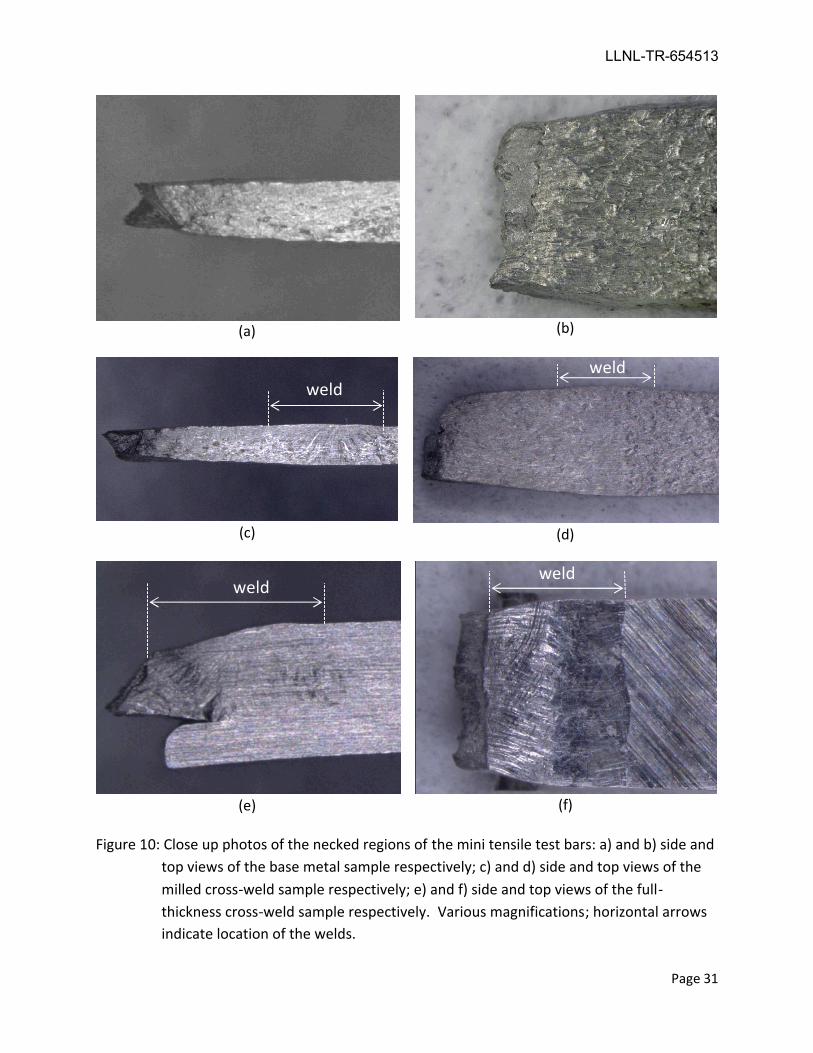
Figure 10 shows close up photos of the necked regions of the broken mini tensile samples. The
parent metal sample is shown in (a) and (b) for the side and top views of the fractured sample
respectively. Thinning of the sample through the thickness and across the width of the sample
is apparent. The failure is ductile in appearance, and final failure occurred with the formation
of a shear lip at approximately 45 degrees to the tensile axis. The milled cross-welded sample is
shown in (c) and (d) for the side and top views of the fractured sample respectively. The weld
location is marked in the figures and it is clear that the fracture occurred well away from the
weld. It can also be seen that the weld region deformed less than the base metal, being wider
and thicker than the adjacent base metal. Just like the base metal sample, the failure is in the
base metal and the final failure occurred with the formation of a shear lip at approximately 45
degrees to the tensile axis. The full-thickness cross-weld sample is shown in (e) and (f) for the
side and top views of the fractured sample respectively. The cross section shows that the
location of the failure is clearly adjacent to the fusion line of the weld in the reduced thickness
portion of the sample. As before the final failure is ductile in appearance, forming a 45 degrees
shear lip relative to the tensile axis. Some localized deformation extends from the base of the
weld and appears to follow a columnar weld grain boundary into the weld fusion zone. The top
view of the failed sample shows narrowing occurring on the side of the weld with the reduced
section thickness, and little to no narrowing on the thick section side of the weld.
This same sample was then polished and etched to show the deformation and failure locations
more clearly. Figure 11a shows the sample lightly polished and etched, indicating that the weld
region above the step is deforming, while the remainder of the weld appears relatively
unstrained. Figure 11b shows the same sample after lapping more deeply below the surface
and then repolishing and etching, showing that the final failure occurred in the base metal
adjacent to the fusion zone. A high magnification photo of the failed region adjacent to the
fusion line is shown in Fig. 11c. The individual base metal grains near the fusion line contain
wavy deformation bands. These bands are likely caused by strain-induced martensite, which
forms during deformation and is known to be the principal strain hardening mechanism in
stainless steels [8] and is also known to form in 21-6-9 SS at high strain rates [9].
Microhardness measurements made in necked region of the failed sample showed that the
hardness is 394.8+12.0 HV for 9 data points, which is considerably harder than the undeformed
base metal (212.2 HV) or the weld (254.4 HV).
Figure 12 plots the uniaxial engineering stress versus engineering strain tensile behavior of the
parent metal samples for both the mini and standard tensile configurations, and the resulting
data are summarized in Table 4. Except for one sample that was pre-strained and showed

LLNL-TR-654513
Page 9
higher yield stress, the parent metal tensile samples showed yield stresses (y) that varied from
50.0 to 53.0 ksi, with the mini tensile bars having yield strengths on the lower end of this range.
All curves show significant strain hardening with ultimate tensile strengths (UTS) varying
between 101.6 to 105.2 ksi, with the mini tensile bars on the upper end of this range. The
elongations at failure varied from 47% to 62% for the parent metal samples using the laser
extensometer with the 1 inch gage length. The mini samples, with the smaller 0.225 inch gage
length, showed elongations from 50% to more than 80%. Note that the extensometer was
removed prior to failure of the mini samples, resulting in the small load drop observed in the
plotted curve. The subsequent stress-strain behavior after the extensometer was removed was
estimated from the load versus crosshead displacement measurements, which is an
approximation that doesn’t match the strain hardening rate measured by the extensometer.
Figure 13 plots the results of the milled weld samples plotted as engineering stress versus
engineering strain. These samples behaved nearly identically to the parent metal samples with
yield strengths varying from 52.8 to 55.7 ksi, and ultimate strengths varying from 103.9 ksi to
105.8 ksi as summarized in Table 4. The elongations to failure for the standard sized samples
were similar to those of the parent metal, varying from 57% to 63%, while those for the mini
samples again displayed higher elongations due to the smaller gage length. Observations of the
tensile samples showed that in all cases, the milled weld cross tensile samples failed in the base
metal due to the higher strength of the weld. Because of this, the yield and ultimate strengths
measured on these samples essentially match those of the parent metal samples.
Figure 14a plots the engineering stress versus engineering strain results of the full thickness
welded samples, where the weld reinforcement and unwelded portion of the step were not
removed. The tensile behavior is quite different than for the milled cross-weld tensile samples.
Yield strengths, based on the area of the sample above the weld step, were considerably higher
than the other samples with values of 76.0 ksi for the standard samples, and values between
67.0 and 75.5 ksi for the mini samples. This data is 25-43% higher than the other samples. The
difference in behavior can be explained with the aid of Fig. 14b that schematically illustrates the
full thickness test sample. In this sample, there is a region of high strain concentration directly
above the unwelded step, which contains a large fraction of welded metal. The higher yield
strengths measured on the full thickness samples are partly based on the fact that the majority
of the high strain region contains higher strength welded metal. However, additional factors
due to the localization of strain caused by the change in cross sectional areas, and sample
bending, may be contributing to the increased yield strength. Note also from the weld cross
sections in Fig. 5, that the fraction of weld metal in the high strained region is not constant, and
may contribute to sample-to-sample variability in the measured yield stress. The measured
elongations were also different than the milled cross-weld samples. The standard sized full-
thickness cross-weld samples all failed with total elongations of only 10%, while the mini
LLNL-TR-654513
Page 10
samples failed between 22% and 27% elongation. The reduced elongations are likely to be the
direct result of the strain localization, and the fact that the extensometers span a much wider
area than the highly strained region. Peak loads were used to calculate the UTS based on the
reduced cross sectional area of the sample above the unwelded portion of the step, showing
values between 102.3 and 110.2 ksi, which are similar to the tensile tests in the other sample
geometries. Note that the measured modulus data for the full thickness samples is not
accurate due to the change in section thickness and possible bending of the samples. This
effect is magnified with the shorter gage length mini sample where a larger fraction of necking
is present in the gage length.
In summary, the tensile test results show that the cross-weld samples failed in the parent metal
portions of the tensile bar, and produced strengths comparable to the all parent metal samples
having a 0.2% offset yield strength of 53.1±1.9 ksi, an ultimate strength of 105.3±2.2 ksi, and a
Young’s modulus of 29.4±0.95 Msi. The engineering strain at failure measured on the standard
sized samples with a 1 inch gage length was approximately 60%, while the mini samples for
both the parent metal and the milled cross-weld configurations, had higher measured
elongations due to the larger fraction of necked region in the 0.225 inch gage length. The full-
thickness cross-weld tensile samples, showed highly localized strain behavior in the reduced
thickness portion of the step welded joint. The associated change in thickness near the weld
resulted in a reduced engineering strain at failure, higher yield strengths (73.4±3.9 ksi), and
similar UTS measurements as the other tensile test samples and configurations.
Nanoindentation Estimation of the Stress-Strain Behavior of the Welds
Uniaxial tension or compression testing is the standard method to obtain stress-strain data.
However, there are times when the specimen or feature size is approaching dimensions that
make it difficult to perform standard tests, as is the case for the small electron beam welds
studied here. An alternate method that can be used to measure the stress-strain behavior of
small welds relies on an indentation technique. During indentation, the hardness of a material,
defined as the load/area, is measured. The stress state during indentation however is much
more complicated than in a uniaxial test and can be influenced by the shape and material of the
indenter [10]. During spherical indentation, the plastic zone develops gradually, allowing for
the elastic-plastic transition to be probed in order to produce an indentation stress-strain
curve. The spherical indentation method is used here to estimate the stress-strain behavior of
the welded region of a 21-6-9 SS part, using the base metal, with known tensile behavior, for
calibration.

LLNL-TR-654513
Page 11
The base metal and electron beam welded samples were metallographically prepared and
tested in the as-polished condition. The loading rate was 50 nm/s for each indent to a depth of
7000 nm, which corresponds to a strain rate of about 1x10⁻⁴/s. These parameters were
selected to match the strain rate of the standard tensile tests from the previous study, and
reach a strain of about 10%. In order to convert the load, displacement, and stiffness data from
the indentation test to indentation stress and strain, the following calculations were used,
which follows the procedure [11]. The contact depth, hc is calculated as:
S
Phch 75.0
(1)
where h is the displacement, P is the load, and S is the contact stiffness, all which is taken
directly from the nanoindenter. From the contact depth, the contact radius, a is
22 cic hRha (2)
where Ri is the radius of the indenter. The indentation strain, , is defined as:
a
hc
4.2
(3)
And the indentation stress is:
2a
Pind
(4)
To relate the indentation stress to the uniaxial stress the Tabor relationship is used where
Tind
uniaxial
(5)
where T is the Tabor factor that can be estimated by correlating the indentation load
displacement curve with a known uniaxial stress-strain curve of the material.
For calibration, the samples were first indentation tested in the base metal and then compared
with the uniaxial tension tests reported here and originally from [5]. The data from the
spherical indentation test was then converted to an indentation stress and indentation strain
using the procedure described above. The correlation factor (Tabor relationship), to relate the
indentation stress to the equivalent uniaxial stress, was then determined by matching to the
uniaxial tests. This correlation factor was then used in calculated the corresponding stress-
strain data for the weld sample. The main assumption is that the correlation factor is roughly
LLNL-TR-654513
Page 12
the same between the base metal and the welded 21-6-9 SS. In addition, estimates of the
elastic modulus were determined from the CSM readings, showing that the base metal had a
modulus of elasticity of 198.2± 1.62 MPa (six samples), and the weld had a modulus of elasticity
of 190.1 ± 1.86 MPa (four samples). The nanoindentation results for the base metal compare
well with the modulus values measured here in uniaxial tension of 202.7±6.6 MPa (12 samples).
However, the modulus of the weld measured by nanoindentation is statistically lower. The
reason for the lower measured modulus of the weld is unclear at this point and will require
additional analysis to determine if this is a real effect or an artifact of the nanoindentation test
results.
Representative indenter-based stress-strain curves for the base metal are shown in Figure 15.
In order to match the data, a Tabor factor of 3.6 was applied. The spherical indentation data
shows an initial overshoot in the stress before comes back down to match the uniaxial data.
This overshoot is most likely due to the fact that we are probing a smaller volume with the
nanoindenter and therefore require a higher stress in the initial part before enough dislocations
are generated to accommodate the strain. The analysis and Tabor factor was then used to
create the indenter-based stress-strain data for the welded region, as shown in Fig. 16, and a
comparison between the base metal and weld region is shown in Fig. 17. The yield stress for
the weld region is clearly higher as a result of its refined microstructure. The strain hardening
rate, however, is the same between the two types of materials, which suggests that the scale
for the hardening mechanisms, such as dislocation interactions, are smaller than the grain size
of the weld region.
To extrapolate the indentation data to larger strains, the Steinberg-Guinan model was used to
fit the indentation data [12]. The Steinberg-Guinan relationship is defined as:
max
),()](1[ Y
G
TPGYY
o
nio (6)
where Yo is the yield stress, is the hardening coefficient, n is the hardening exponent, Go is the
reference shear modulus, G(P,T) is temperature and pressure dependent shear modulus, and
Ymax is the saturation stress representing the upper limit for the flow stress. For the
experiments performed in this study the ratio of the shear moduli was assumed to be 1. Since
the indentation stress-strain curve stops at around 10%, an additional data point was used to
help constrain the fit. The additional data point is based on the Vickers microhardness results
shown in Table 3, where the measured hardness for the base metal is 2.08 GPa
[GPa=9.8*HV/1000] and for the weld metal is 2.49 GPa. Using the standard Tabor factor of 3.6
for a sharp Vickers indent, the flow stress at 8% strain should be around 590 MPa for the base
metal and 700 MPa for the weld.
LLNL-TR-654513
Page 13
As a point of reference, there are published parameters for the Steinberg-Guinan model for 21-
6-9 SS [13]. Since the published values are optimized for higher strain rates and Steinberg-
Guinan is a rate independent model, it is expected that the published 21-6-9 SS parameters [13]
would over predict the strength in comparison to the quasi-static experimental data. Figure 19
shows the over prediction of the stress-strain behavior for the published Steinberg-Guinan data
when compared to one of the experimental uniaxial stress strain curves for the base metal from
this study. Clearly, the Steinberg-Guinan published data need to be reevaluated for quasi-static
strain rates. This was done by both fitting the base metal uniaxial stress-strain curves, and the
nanoindentation results using the MIDAS framework [14]. Fits were made out to 0.45 strain
and passing through the appropriate points at 8% strain and are shown in Fig. 19. The same
approach was used to fit and extrapolate the nanoindentation results for the electron beam
welded material, and these results are plotted on Fig. 19 for comparison, showing the increased
strength of the electron beam welds relative to the annealed 21-6-9 SS base metal. The
Steinberg-Guinan model parameters for the base metal and weld are summarized and are
compared to the published value [13] for 21-6-9 SS in Table 5.
An additional strength model that is commonly used is the Johnson-Cook strength relationship
[15]. While also empirically based, there are additional terms which attempt to take into
account the dependence on the strain rate and temperature, and the Johnson-Cook model has
the following form:
pCTCBAY pm
o
n )1)(ln1)(( *
(7)
and
roommelt
room
TT
TTT
*
(8)
where, A is the effective yield stress at the reference strain rate, 'o (1/s) and temperature
(TRT), B is a strain hardening coefficient, n is the hardening exponent, C is the coefficient for the
strain rate term, m is the exponential for the temperature dependence, and Cp is the pressure
coefficient, and p is the actual pressure. The results of the Johnson-Cook model are compared
to Steinberg-Guinan in Fig. 19, showing that both approaches can be used to represent the
quasi-static uniaxial stress-strain behavior of 21-6-9 SS base metal and EB welds. The fitting
parameters for Steinberg-Guinan and Johnson-Cook are summarized in Table 5 and Table 6
respectively.
In summary, spherical indentation with a nanoindenter can be used to measure the indentation
stress strain behavior of 21-6-9 SS base metal and EB welds. The advantage for this technique
is that the approximate stress-strain behavior can be measured using small amounts of
LLNL-TR-654513
Page 14
material, such as welds. The main assumption in converting the indentation stress-strain
behavior to uniaxial data is knowing the Tabor factor. For the 21-6-9 SS tested here, a Tabor
factor of 3.6 was used, which matches the base metal indentation data to previous uniaxial
tests. In comparing the measured stress-strain behavior between the base metal and the weld
region, the weld shows a higher yield stress, but the strain hardening rates are similar,
suggesting similar hardening mechanisms.
Conclusions
Legacy electron beam welds were made in annealed 21-6-9 SS flat plates that matched the
desired penetration and weld fusion zone geometry. The EMFC electron beam diagnostic was
used to characterize and control the EB parameters for weld consistency within this study, and
for duplication of these parameters in the future. The measured electron beam parameters
suggest that the beams should fall in the target range for peak power density of 1.5-1.6
kW/mm2, beam diameter of 0.90-1.0 mm, and beam FWHM of 0.50-0.55 mm. This beam
produces a 1.04 ± 0.07 mm deep weld in 1.5 mm thick 21-6-9 SS step joints at a welding speed
of 60 ipm.
Metallographic characterization of the welds showed that they solidified with a two-phase
microstructure consisting of austenite plus 5-10% residual delta ferrite. The primary mode of
solidification was ferrite (FA), followed by solid state transformation of the majority of the
ferrite to austenite during cooling. The resulting microstructure is skeletal ferrite with some
lacy ferrite observed near the center of the weld. Magne-gage measurements of the ferrite
content proved to be inaccurate due to the small physical dimensions of the EB welds.
Microhardness measurements were performed in the base metal and in the fusion zone of the
welds, showing that the welds were statistically harder (254.4 ± 9.7 HV) than the annealed base
metal (212.1 ± 10.9 HV). The higher hardness of the weld is due to its fine two-phase
solidification microstructure relative to the equiaxed large grained base metal.
Uniaxial tensile testing was used to measure yield strength, ultimate strength, and elongation
to failure of the base metal, and the same for cross-weld tensile samples. Two different dog-
bone type tensile specimens were used, (1 inch gage length standard, and 0.225 inch gage
length mini), with laser and strain gage extensometers respectively. In addition, two different
type of cross-weld tensile samples were prepared (full thickness with weld step, and milled to
uniform thickness) in order to determine the effects of sample configuration on the measured
properties. The results showed that the mini tensile samples can be used to estimate the
stress-strain behavior of the full sized samples. However, the full thickness weld samples did
not match the results from the milled cross-weld samples. The full thickness samples showed
higher yield strengths than the milled samples due the strain localization in the region above
LLNL-TR-654513
Page 15
the unwelded step, which incorporated a high fraction of weld material in it, even though the
final failure occurred in the adjacent base metal. Measurements of the Young’s modulus from
the load displacement curve of the full thickness samples was shown to not be accurate due to
the change in section thickness and sample bending, however, the laser extensometer on the
standard size sample produced results much closer to the expected value than the strain gage
extensometer on the mini sample.
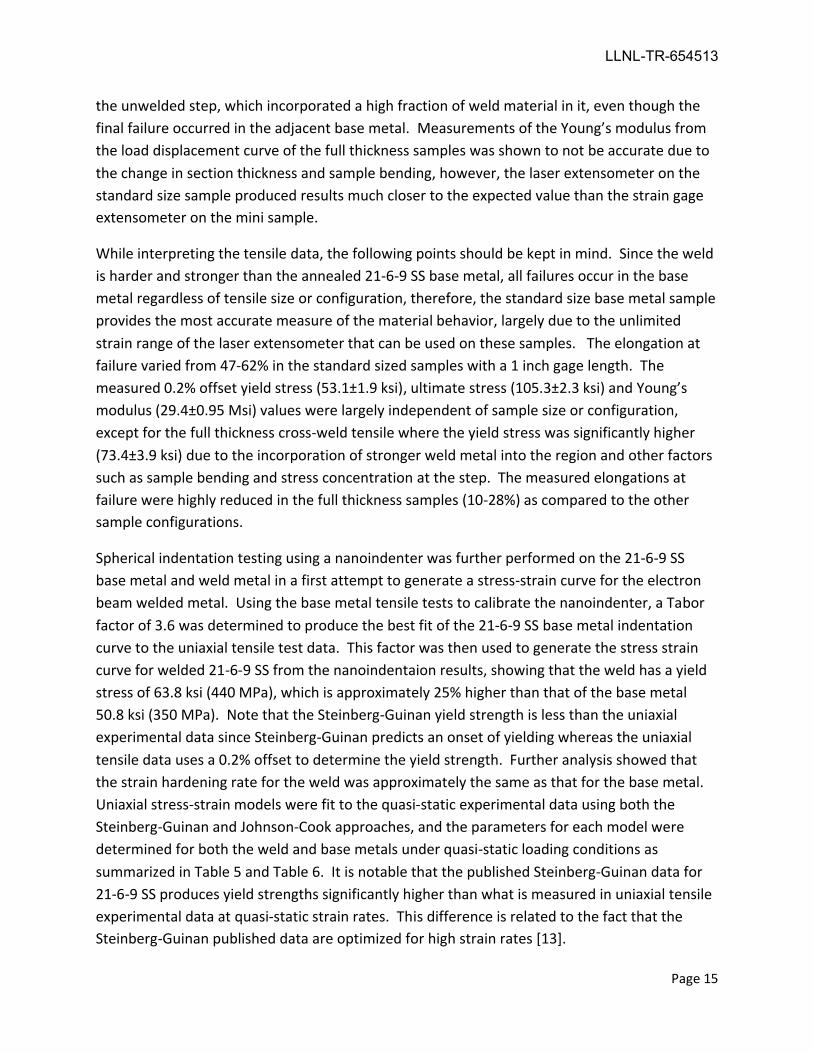
While interpreting the tensile data, the following points should be kept in mind. Since the weld
is harder and stronger than the annealed 21-6-9 SS base metal, all failures occur in the base
metal regardless of tensile size or configuration, therefore, the standard size base metal sample
provides the most accurate measure of the material behavior, largely due to the unlimited
strain range of the laser extensometer that can be used on these samples. The elongation at
failure varied from 47-62% in the standard sized samples with a 1 inch gage length. The
measured 0.2% offset yield stress (53.1±1.9 ksi), ultimate stress (105.3±2.3 ksi) and Young’s
modulus (29.4±0.95 Msi) values were largely independent of sample size or configuration,
except for the full thickness cross-weld tensile where the yield stress was significantly higher
(73.4±3.9 ksi) due to the incorporation of stronger weld metal into the region and other factors
such as sample bending and stress concentration at the step. The measured elongations at
failure were highly reduced in the full thickness samples (10-28%) as compared to the other
sample configurations.
Spherical indentation testing using a nanoindenter was further performed on the 21-6-9 SS
base metal and weld metal in a first attempt to generate a stress-strain curve for the electron
beam welded metal. Using the base metal tensile tests to calibrate the nanoindenter, a Tabor
factor of 3.6 was determined to produce the best fit of the 21-6-9 SS base metal indentation
curve to the uniaxial tensile test data. This factor was then used to generate the stress strain
curve for welded 21-6-9 SS from the nanoindentaion results, showing that the weld has a yield
stress of 63.8 ksi (440 MPa), which is approximately 25% higher than that of the base metal
50.8 ksi (350 MPa). Note that the Steinberg-Guinan yield strength is less than the uniaxial
experimental data since Steinberg-Guinan predicts an onset of yielding whereas the uniaxial
tensile data uses a 0.2% offset to determine the yield strength. Further analysis showed that
the strain hardening rate for the weld was approximately the same as that for the base metal.
Uniaxial stress-strain models were fit to the quasi-static experimental data using both the
Steinberg-Guinan and Johnson-Cook approaches, and the parameters for each model were
determined for both the weld and base metals under quasi-static loading conditions as
summarized in Table 5 and Table 6. It is notable that the published Steinberg-Guinan data for
21-6-9 SS produces yield strengths significantly higher than what is measured in uniaxial tensile
experimental data at quasi-static strain rates. This difference is related to the fact that the
Steinberg-Guinan published data are optimized for high strain rates [13].
LLNL-TR-654513
Page 16
The relative yield strength of the weld to the base metal is an important consideration for
welded joints. The results of the Steinberg-Guinan fits to the nanoindentation data under
quasi-static strain rates indicate that the yield strength of the weld is 1.26x (63.8ksi/50.8ksi)
higher than that of the annealed 21-6-9 SS base metal. Although the uniaxial tests were not
able to confirm this ratio precisely due to the cross weld nature of the tensile samples, an
estimate can be provided by taking the ratio of the measured yield stress for the base metal
(y=53.1ksi) to that of the full thickness weld samples that contained a large fraction of weld
metal in the high strain region (y=73.4 ksi). This ratio (73.4ksi/53.1ksi) of 1.38x is higher than
the Steinberg-Guinan data derived ratio from the nanoindentaion tests. The difference is
believed to be related to bending of the full thickness weld samples during uniaxial tensile
testing, combined with stress concentrations in the highly strained region of the cross weld step
joint samples. The true effects of the weld metal contributions to the stress strain behavior of a
step welded joint will require finite element modeling of the step joint geometry as the next
step in the analysis to take these other factors into account, and by incorporating the stress
strain curves experimentally determined in this study for 21-6-9 SS base and weld metals.
Acknowledgment and Auspices
The authors would like to thank Gilbert Gallegos for supplying the 21-6-9 SS material, Mark
Gauthier for performing the electron beam welding, and Jackson Go for assistance with the
high magnification micrographs of the electron beam welds. This work performed under the
auspices of the U.S. Department of Energy by Lawrence Livermore National Laboratory under
Contract DE-AC52-07NA27344. This document was prepared as an account of work sponsored
by an agency of the United States government. Neither the United States government nor
Lawrence Livermore National Security, LLC, nor any of their employees makes any warranty,
expressed or implied, or assumes any legal liability or responsibility for the accuracy,
completeness, or usefulness of any information, apparatus, product, or process disclosed, or
represents that its use would not infringe privately owned rights. Reference herein to any
specific commercial product, process, or service by trade name, trademark, manufacturer, or
otherwise does not necessarily constitute or imply its endorsement, recommendation, or
favoring by the United States government or Lawrence Livermore National Security, LLC. The
views and opinions of authors expressed herein do not necessarily state or reflect those of the
United States government or Lawrence Livermore National Security, LLC, and shall not be used
for advertising or product endorsement purposes.

LLNL-TR-654513
Page 17
References
1. D. J. Alexander and C. T. Necker, “Characterization of Microstructures and Mechanical
Properties of Current and Legacy 21-6-9 Stainless Steel Components” Los Alamos National
Laboratory Report, LA-UR-11-02857, 2011.
2. M. E. Kassner and R. Breithaup, “The Yield Stress of Type 21-6-9 Stainless Steel Over a Wide range of Strain Rate (10-5 to 104 s-1) and Temperature,” LLNL Report, UCRL-89779, 1983.
3. J. W. Elmer and A. T. Teruya, “An Enhanced Faraday Cup for the Rapid Determination of the Power Density Distribution in Electron Beams,” Welding Journal, 80 (12), p 288s, 2001.
4. J. W. Elmer, “Characterization of Defocused Electron Beams and Welds in Stainless Steel and Refractory Metals using the Enhanced Modified Faraday Cup Diagnostic,” Lawrence Livermore National Laboratory Technical Report, TR-410752, February 17, 2009.
5. D. Hiromoto, “Stainless Steel Weld Studies,” LLNL report ERD11-500089-AA, July 27, 2011.6. J. W. Elmer, S. M. Allen, and T. W. Eagar, "Microstructural Development During
Solidification Of Stainless Steel Alloys," Metall. Trans. A, 20A (10), p 2117, 1989.7. Aerospace Structural Materials Handbook, Vol 1 Ferrous Alloys, Battelle Columbus Division,
1987.8. Handbook of Stainless Steels, Peckner and Bernstein, MGraw Hill, 1977.9. C. Hills and H. Rack, “Effects of shock Deformation on the Residual Strength and
Microstructure of Nitronic 40 Stainless Steel,” Mat. Sci. and Eng., 51, p. 231, 1981.10. The Harndess of Metals, D. Tabor, 1951.11. S.R. Kalidindi and S. Pathak, “Determination of the Effective Zero-Point and the Extraction of
Spherical Nanoindentation Stress-Strain Curves,” Acta Met., V56, p3523, 2008.12. D. J. Steinberg et al, “A Constitutive Model for Metals Applicable at High Strain Rates,” JAP,
51, p1499, 1980.13. D. J. Steinberg, Equation of State and Strength Properties of Selected Materials, UCRL-MA-
106439, February 13, 1991.14. M. Tang, P. Norquist, N. Barton, K. Durrenberger J. Florando, A. Attia, MIDAS (Material
Implementation, Database, and Analysis Source), LLNL-PROC-464065, December 2010.15. G.R. Johnson and W.H. Cook, “A Constitutive Model and Data for Metals Subjected to Large
Strains, High Strain Rates, and High Temperatures,” Proceedings of the 7th International Symposium on Ballistics, The Hague, Netherlands, p 541, 1983.

LLNL-TR-654513
Page 18
Table 1: 21-6-9 stainless steel alloy composition compared to nominal and LLNL aim ranges.
Element Actual
(wt%)
Specification
(wt%)
LLNL Guarantee
(wt%)
LLNL Aim
(wt%)
Carbon 0.02 0.08 Max 0.02-0.04 0.04 max
Chromium 19.96 19.0-21.5 19.0-21.5 20-20.5
Nickel 7.02 5.5-7.5 5.5-7.5 6.0-6.5
Manganese 9.14 8.0-10.0 8.0-10.0 8.5-9.5
Silicon 0.05 1.0 Max 0.3-0.7 0.50 max
Nitrogen 0.23 0.15-0.40 0.20-0.30 0.23-0.25
Phosphorous 0.014 0.06 Max 0.020 Max 0.000
Sulfur <0.005 0.03 Max 0.02 Max 0.000
Oxygen <0.001 ---- 0.007 Max 0.000-0.005
Iron Balance Balance Balance Balance
Table 2: Summary of the electron beam properties for each of the six welds along with the
resulting weld depths and widths across the top surface of the plate.
Weld FocusSetting(mA)
Peak PD
(W/mm2)
FWHM(mm)
Diameter(mm)
WeldDepth(mm)
Weld Width(mm)
1 762 (+32) 1500 0.49 0.98 0.98 1.53
2 760 (+30) 1550 0.51 0.97 1.03 1.52
3 760 (+30) 1510 0.51 0.98 1.11 1.56
4 759 (+29) 1480 0.54 1.00 1.14 1.55
5 759 (+29) 1445 0.52 1.01 1.00 1.53
6 759 (+29) 1470 0.51 0.99 0.99 1.51
Avg. / STD 759.8 / 1.2 1493 / 36.2 0.51 /.02 0.99 /.02 1.04 /.07 1.53 /.02

LLNL-TR-654513
Page 19
Table 3: Vickers microhardness measurements (50 gm load) made on the 21-6-9 base metal,
weld HAZ, and weld fusion zone.
Weld
Base Metal Hardness
Avg/STD (HV)
HAZ Hardness
Avg/STD (HV)
Weld Metal Hardness
Avg/STD (HV)
1 215.8 / 11.2 226.8 / 10.4 258.9 / 10.0
2 212.5 / 6.50 241.1 / 14.3 257.8 / 9.60
3 216.0 / 6.60 225.8 / 8.30 249.6 / 10.1
4 209.5 / 10.0 226.7 / 10.1 258.2 / 10.9
5 201.0 / 7.70 235.5 / 18.0 247.2 / 13.2
6 218.3 / 7.50 237.4 / 12.1 254.9 / 6.60
Avg. / STD 212.1 / 10.9 232.1 / 13.9 254.4 / 9.7
Number of Points 36 49 62

LLNL-TR-654513
Page 20
Table 4: Summary of the tensile test results on the parent metal, milled cross-weld tensile
samples, and full-thickness tensile samples. All samples tested at room temperature.
Specimen ID Condition SizeWidth Thick Area Ext. GL Xhd
Young’sModuls
YieldStrength
0.2% offset
UltimateTensile
Strength
(in) (in) (in2) (in) (in/min) (Msi) (ksi) (ksi)
P_Tab2_1 Parent Mini 0.1011 0.0303 0.0030 0.225 0.02 30.7 64.0* 105.2
P_Tab2_2 Parent Mini 0.1009 0.0302 0.0030 0.225 0.02 29.0 50.0 103.1
P_Tab2_3 Parent Mini 0.101 0.0297 0.0030 0.225 0.02 28.6 50.2 104.4
P_Tab1_1 Parent Std. 0.2492 0.0303 0.0075 1.071 0.05 30.7 53.0 104.3
P_Tab1_2 Parent Std. 0.2491 0.0299 0.0074 1.0928 0.05 30.7 52.0 103.4
P_Tab1_3 Parent Std. 0.2491 0.0290 0.0072 1.0938 0.05 29.6 52.8 101.6
W_Tab2_Plate1_1 Weld, milled Mini 0.1007 0.0299 0.0030 0.225 0.02 28.0 55.7 105.5
W_Tab2_Plate1_2 Weld, milled Mini 0.1007 0.0303 0.0030 0.225 0.02 28.6 55.5 105.8
W_Tab2_Plate1_3 Weld, milled Mini 0.1003 0.0303 0.0030 0.225 0.02 29.6 54.4 105.1
W_Tab1_Plate1_1 Weld, milled Std. 0.2492 0.0306 0.0076 1.0834 0.05 28.6 53.5 104.4
W_Tab1_Plate1_2 Weld, milled Std. 0.2493 0.0301 0.0075 1.0912 0.05 28.6 52.8 103.9
W_Tab1_Plate1_3 Weld, milled Std. 0.2492 0.0302 0.0075 1.0892 0.05 29.6 54.0 105.1
Fweld_Tab2_Plate2_2 Weld, full Mini 0.0998 0.0383 0.0038 0.1394 0.02 21.8** 67.0 102.3
Fweld_Tab2_Plate2_3 Weld, full Mini 0.0998 0.0355 0.0035 0.1381 0.02 18.5** 70.0 110.2
Fweld_Tab2_Plate2_4 Weld, full Mini 0.0998 0.0373 0.0037 0.107 0.02 18.5** 75.5 108.3
Fweld_Tab1_Plate2_1 Weld, full Std. 0.2488 0.0380 0.0094 1.081 0.05 30** 76.0 108.1
Fweld_Tab1_Plate2_2 Weld, full Std. 0.249 0.0358 0.0089 1.069 0.05 30** 76.0 107.2
Fweld_Tab1_Plate 2 Weld, full Std. 0.2481 0.0370 0.0091 1.0638 0.05 30** 76.0 107.3
*Sample unintentionally prestrained prior to testing, creating erroneous high yield strength **Young’s modulus data not accurate due to the change in sample thickness and sample bending

LLNL-TR-654513
Page 21
Table 5: Recommended Steinberg-Guinan parameters for the 21-6-9 SS experimental weld
metal and annealed base metal values under quasi-static strain rate conditions,
compared to the published base metal value at high strain rates.
Steinberg-Guinan
Parameter
Definition Base Metal Published Value
[13](high rate)
Base Metal Experimental
Value(quasi-static)
Weld MetalValue
(quasi-static)
Yo Yield Stress 0.0068 Mbar(680 MPa)
0.0035 Mbar(350 MPa)
0.0044 Mbar(440 MPa)
Hardening Coefficient
35 20 33
n Hardening Exponent
0.23 0.5 0.375
Ymax Saturation Stress
0.025(2.5 GPa)
0.025(2.5 GPa)
0.025(2.5 GPa)
Table 6: Recommended Johnson-Cook strength parameters for the 21-6-9 SS weld metal and
annealed base metal, under quasi-static strain rate conditions.
Johnson- Cook Parameter
Definition Base Metal Value
(quasi-static)
Weld Metal Value
(quasi-static)
AEffective Yield Stress
at o =1/s and T=RT
0.0055 Mbar
(550 MPa)
0.0078 Mbar
(780 MPa)
BHardening
Coefficient
0.0024 Mbar
(240 MPa)
0.0024 Mbar
(240 MPa)
nHardening
Exponent0.65 0.65
C Strain Rate Coefficient 0.044 0.044
m Temperature Exponent 1.0 1.0
Tmelt Melting Temperature 2380 K 2380 K
TroomAmbient Room Temperature
295 K 295 K
o Reference Strain Rate 1/s 1/s
LLNL-TR-654513
Page 22
Standard
Mini
Bulge
Weld
Figure 1: a) Drawings of the standard size (Tab-01) and mini (Tab-02) tensile bars with
dimensions in inches, and b) layout of the 3 mini tensile coupons, 3 standard tensile
coupons, and one bulge coupon per 4x8 inch welded plate.

LLNL-TR-654513
Page 23
(a)
(b)
(c)
Figure 2: a) Illustration of the top and side views of cross-weld tensile bar, where the red
shading indicates the weld location. b) micrograph of the full thickness type 1 weld
coupon with step-joint related change in section thickness, c) cropped photo
illustrating cross section of the type 2 weld coupon after machining to remove the
unwelded material below the step, the weld reinforcement, and the weld undercut.
The large arrows indicate the tensile axis direction relative to the weld.
0.75 mm
1.0 mm
1.5 mm

LLNL-TR-654513
Page 24
Figure 3: EMFC diagnostic measurements and weld cross sections for the first set of coupon welds,
showing the difference in weld pool shape for 35, 40, and 45 mm defocus settings.
Defocused +35 for 605 W beam:
Beam Diameter (1/e2
) = 0.91 mmFWHW = 0.51 mm
Peak PD = 1.83 kW/mm2
Avg. PD = 0.910 kW/mm2
Defocused +40 for 605 W beam:
Beam Diameter(1/e2
) = 1.05 mmFWHW = 0.59 mm
Peak PD = 1.35 kW/mm2
Avg. PD = 0.712 kW/mm2
Defocused +45 for 605 W beam:
Beam Diameter(1/e2
) = 1.17 mmFWHW = 0.65 mm
Peak PD = 1.12 kW/mm2
Avg. PD = 0.553 kW/mm2

LLNL-TR-654513
Page 25
Figure 4: Results of the electron beam diagnostics for weld 3 (see Fig.5): a) the beam diagnostic
summary, b) the overall diagnostic results, and c) a surface plot of the beam power
density distribution.

LLNL-TR-654513
Page 26
Weld #1 Weld #2
Weld #3Weld #4
Weld #5 Weld #6
Figure 5: Micrographs of each of the six electron beam welds made on 21-6-9 SS flat plates for
preparation of mechanical testing specimens. Electron beam diagnostic results and
weld statistics are summarized in Table 2 for each of the welds.
LLNL-TR-654513
Page 27
Figure 6: High magnification photomicrographs of: a) the base metal with a grain size of
approximately 50 m, b) the fusion boundary of weld, and c) the central portion of
the fusion zone showing the cellular/dendritic microstructure with a primary spacing
of approximately 5 m.
100 m (a)_____
(b)_____50 m
(c)_____50 m

LLNL-TR-654513
Page 28
(a)
(b)
Figure 7: High magnification micrograph a) the fusion line of the weld, and b) the center section
of the fusion zone. The dark etching phase is residual delta ferrite. Both photos shot
at 1000x.
20 m________
________20 m

LLNL-TR-654513
Page 29
Figure 8: Statistical summary of the hardness measurements made on the six welded plates for
the base metal, HAZ and weld fusion zone.

LLNL-TR-654513
Page 30
Mini Samples Standard Samples
(a) (d)
(b) (e)
(c) (f)
Figure 9: Photographs of representative tensile bars for each of the six different configurations.
The small divisions in the scale markers in the photographs are 1 mm increments.
LLNL-TR-654513
Page 31
(a) (b)
(c) (d)
(e) (f)
Figure 10: Close up photos of the necked regions of the mini tensile test bars: a) and b) side and
top views of the base metal sample respectively; c) and d) side and top views of the
milled cross-weld sample respectively; e) and f) side and top views of the full-
thickness cross-weld sample respectively. Various magnifications; horizontal arrows
indicate location of the welds.
weldweld
weldweld

LLNL-TR-654513
Page 32
Figure 11: Full thickness mini sample after tensile testing (see Fig 10e before polishing). a)
Sample after light polish of surface, showing deformation in the region directly above
the unwelded portion of the step. b) After lapping the sample to a depth ~1 mm
below the surface to show necking and final failure location in the base metal. C) High
magnification micrograph of the fusion line in the failed portion of the sample,
showing deformation bands in the base metal.
________
25 m
(a)
(b)
(c)
LLNL-TR-654513
Page 33
Figure 12: Base metal stress strain curves for the standard and mini tensile bars.
Figure 13: Milled/lapped cross-weld sample stress strain curves for the standard and mini
tensile bars.

LLNL-TR-654513
Page 34
Figure 14: a) Full thickness cross-weld sample stress strain curves for the standard and mini
tensile bars. b) Schematic drawing of the full thickness weld sample illustrating the
high strain region directly above the unwelded portion of the step.
Tensile axisRegionof highstrain
EB weld
Unweldedstep

LLNL-TR-654513
Page 35
Figure 15: Stress-strain data from the 21-6-9 base metal. The stress-strain data from the
indentation tests are compared to the uniaxial tests from report [5]. A Tabor factor
of 3.6 is used to match the data.
Figure 16: Stress-strain data from indentation tests for the 21-6-9 SS weld metal. The same
Tabor factor of 3.6 is used.
0
0.001
0.002
0.003
0.004
0.005
0.006
0.007
0.008
0 0.02 0.04 0.06 0.08 0.1 0.12 0.14 0.16
Indentation 1Indentation 2Indentation 3Indentation 4Indentation 5Uniaxial test
Str
ess
(Mba
r)
Strain
0
0.001
0.002
0.003
0.004
0.005
0.006
0.007
0.008
0 0.02 0.04 0.06 0.08 0.1 0.12
Weld Indentation 1Weld 2 Indentation 2Weld Indentation 3
Str
ess
(Mbar)
Strain

LLNL-TR-654513
Page 36
Figure 17: Comparison of stress-strain data from indentation tests for the 21-6-9 SS weld and
base metal. The Tabor factor of 3.6 is used.
Figure 18: Comparison of the published Steinberg-Guinan parameters (optimized for high strain
rates) to the experimental data of this study for annealed 21-6-9 SS base metal
measured at quasi-static strain rates.
0
0.001
0.002
0.003
0.004
0.005
0.006
0.007
0.008
0 0.02 0.04 0.06 0.08 0.1 0.12
Weld IndentationBase Metal IndentationS
tre
ss (
Mb
ar)
Strain
Steinberg-Guinan
Experimental Data

LLNL-TR-654513
Page 37
Figure 19: Steinberg-Guinan (S-G) and Johnson-Cook (J-C) stress-strain curve fits for the 21-6-9
SS base metal and weld metal using MIDAS to extrapolate the material behavior to
larger strains. Both fits are superimposed over the spherical indentation
experimental data.
Weld
Base metal
S-GJ-CExp. Data

LLNL-TR-654513
Page 38
Appendix
This appendix derives the relationship between the elastic portion of the stress-strain curve for
a partial penetration step weld joint and Young’s modulus of the material. Figure A1 shows the
step weld configuration. Assuming bending of the sample does not have a measurable effect
on the load-displacement curve, then the stiffness of the partial penetration step joint weld in a
uniaxial tensile test will be less than that of the full thickness welded sample, due to the
reduced thickness of the L2 segment. Further assuming that the modulus of elasticity, E, is
constant for the different portions of the tensile bar then the following relationship can be
derived from Hook’s law (=E, where is the stress and is the strain in the sample):
E = PL1/(A1*L1)= PL2/(A2*L2)= PL3/(A3*L3) , eq. A1
where P is the applied load, Li is the displacement, and Ai is the cross sectional area of the ith
segment. The cross sectional area of the sample is the width of the sample, w, multiplied by
the respective thickness of the sample, i.e., Ai=wti.
A second relationship exists between the total displacement of the sample measured by the
extensometer, L, and the individual displacements for the three segments:
L=L1+L2L3 eq. A2
For a sample with the extensometer positioned over the weld such that L1=L3, the following
relationship can be derived to relate the modulus of the material to the slope of the load-
displacement curve and the step joint geometric configuration:
E= (P/L)*(A1L2+2L1A2)/(A1A2) eq. A3
Tensile axisP
LL1
t2t1 t3
L2 L3
Extensometer
Figure A1: Schematic drawing of a step-weld joint being pulled in uniaxial tension. A region of
high strain exists directly above the unwelded portion of the step with length L2,
and cross sectional area t2*w, where w is the width of the sample.


