1 Electron Bernstein Wave Heating and Emission in the TCV Tokamak A. Mueck 1 , Y. Camenen 1 , S. Coda 1 , L. Curchod 1 , T.P. Goodman 1 , H.P. Laqua 2 , A. Pochelon 1 , L. Porte 1 , V.S. Udintsev 1 , F. Volpe 2 , TCV Team 1 1 Ecole Polytechnique Fédérale de Lausanne EPFL, Centre de Recherches en Physique des Plasmas, Association EURATOM- Confédération Suisse, 1015 Lausanne 2 Max-Planck-Institut für Plasmaphysik, EURATOM Assoziation, D-17491 Greifswald Mail to: [email protected]Fax: 0049-89-3299 1313 Pages: 30 Figures: 16 Tables: none
Transcript
1
Electron Bernstein Wave Heating and Emission
in the TCV Tokamak
A. Mueck 1, Y. Camenen 1, S. Coda 1, L. Curchod 1, T.P. Goodman 1, H.P.
Laqua 2, A. Pochelon 1, L. Porte1, V.S. Udintsev1, F. Volpe2, TCV Team 1
1Ecole Polytechnique Fédérale de Lausanne EPFL, Centre de Recherches en Physique
des Plasmas, Association EURATOM- Confédération Suisse, 1015 Lausanne 2Max-Planck-Institut für Plasmaphysik, EURATOM Assoziation, D-17491 Greifswald
with the density-gradient scale length Ln=ne/(∂ne/∂x), the perpendicular and parallel
refraction indices to the magnetic field N┴, N║ and with Y = ωce/ω where ωce is the
electron cyclotron frequency. Only for the optimum parallel refraction index
N║,opt2=Y/(Y+1), equivalent to an optimum injection angle, the O-mode wave can be
completely converted to X-mode. The fraction of the radiation that is not mode
converted is reflected back towards the plasma edge and either escapes the device or is
absorbed via multi-pass absorption.
Electron Bernstein Wave Heating (EBWH) via this O-X-B double mode conversion
scheme was successfully demonstrated in the stellarator W7-AS [5], in the High
Density High confinement (HDH) mode. Electron Bernstein Emission (EBE)
4
measurements in spherical, low aspect-ratio tokamaks and in reversed field pinches
are reported [6-8]. The work presented here demonstrates electron Bernstein wave
heating for the first time in a classical aspect-ratio tokamak and electron Bernstein
wave emission measurements.
TCV AND THE TARGET PLASMA
In the Tokamak à Configuration Variable (TCV) the main heating source relies on
ECRH at the second harmonic frequency 82.7 GHz, see Figure 1. The power of six
gyrotrons, delivering 500 kW each, is injected through launchers from four upper
lateral and two equatorial ports. The launcher mirrors can be steered in real time in
two dimensions. The resulting beam direction is parameterized by two launcher
angles, which will henceforth be termed the poloidal and toroidal angles. Reflected EC
power, not absorbed by the plasma, is assessed by measuring the EC stray radiation
level via semiconductor diodes, installed in several sectors of TCV. At a standard
TCV magnetic field of B = 1.5 T, the plasma becomes overdense to the second
harmonic X-mode for electron densities of ne ~ 4.2 1019 m-3 and to the O-mode at ne
~ 8.7 1019 m-3.
To achieve a large angular window of the power transmission function, the density
scale length at the plasma cut-off has to be short, requiring a steep density gradient,
see equation 1. This condition is fulfilled in TCV H-modes [9] with central electron
densities of ne ≥ 1 1020 m-3 and magnetohydrodynamic activity like ELMs and
sawteeth. At these densities, the plasma cut-off is placed at ρψ ~ 0.9, at the steep edge
density gradient region of the H-mode. The high densities are achieved in non-
stationary conditions with alternating ELMy and ELM-free phases. In Figure 2, the
temporal evolution of a typical target plasma is shown. The coupled density and
density gradient rise during the ELM-free phases and drop with the onset of an ELMy
phase. To avoid a perturbation of the H-mode, EC power of 500 kW was injected with
a low duty cycle of 6%. The stray radiation level, shown in Figure 2, mainly decreases
with increasing density. The decrease in the stray level, equivalent with an increase of
5
the EC power absorption, and the increase in the density gradient lead to a broader
angular window for the O-X mode conversion, see equation 1. The stray level
increases rapidly just after an ELM, indicating that less EC power is absorbed, due to
the resulting drop in the density and the density gradient induced by the ELMs, shown
in more detail in the Dα time traces in Figure 3.
EXPERIMENTAL DETERMINATION OF OPTIMUM ANGLE
As a first step, single ray simulations with the non-relativistic ART ray tracing code
[10, 11] including O-X-B mode conversion for wave propagation and absorption was
performed for the target plasma conditions, allowing the determination of the optimum
injection angles.
Around this pair of calculated optimum angles, poloidal and toroidal angle scans were
performed to experimentally obtain the optimum injection angles. As shown in Figure
4a and b, clear minima in the stray radiation level are measured, indicating maxima of
power absorption, thus determining the measured optimum angle to a poloidal angle
of about 31° and a toroidal angle of about 112°. A comparable angle dependence in
the stray radiation is found for both upper lateral and equatorial launch in all stray
diode signals, measured at various positions in the torus.
The experimentally determined optimum angles are compared with the results of the
simulation with the ART ray tracing code. In Figure 5, the simulated O-X conversion
efficiency is shown in a contour plot of the poloidal launcher angle over the toroidal
launcher angle. The innermost contour indicates 90% conversion, the outermost
contour 10%. The experimental angles of the poloidal and the toroidal scans for an
equatorial launch are added as violet dots and the extrapolated optimum angle as a
green dot. This experimental optimum angle is in agreement with the simulated angle
within 3°.
This small discrepancy can be explained by the resolution of the scans and the
imprecision of the magnetic equilibrium reconstruction of ~ ±1 cm. When such a
variation is applied to the ART simulation, the optimum angle varies by ~ ±1°.
6
In Figure 6, a comparison between the angular windows of the measured stray level in
percent and of the ART simulation is shown. The simulated percentage of the O-X
conversion is taken from Figure 5 for the same angles as used in the experimental
scans. The discrepancy between the measured and calculated angular window is not
surprising in view of the finite width of the EC beam and the spread in its wave-
number spectrum, which is expected to broaden the width of the conversion efficiency
function as well as to reduce its absolute value. This last point is consistent with the
non-zero measured minimum stray level, indicating that less than 100% of the beam
power are absorbed.
Both the angle dependence and the good agreement of the optimum angles,
determined in the experiments and simulations, strongly indicate a successful O-X-B
mode conversion [12-15].
GLOBAL AND LOCAL BERNSTEIN WAVE HEATING
Heating experiments were performed after the experimental determination of the
optimum angles. The duty cycle was increased to 46% and ~ 500 kW EC power
injected with a modulation frequency of 182 Hz at the optimum angle. The modulation
frequency was chosen between the first harmonic of the sawtooth instability at ~ 110
Hz and its second harmonic.
A basic cross-check of the O-X transmission can be performed simply by comparing
the stray radiation levels when power is injected in the vicinity of the optimum angles
in O- and X-mode. Figure 7 shows the stray radiation levels when injecting
alternatively O- and X-mode in an ELM-free phase with the same EC power of ~ 500
kW. The stray level for O-mode injection is indeed only 40% of the X-mode stray
level, indicating much higher absorption with O-mode than with X-mode.
The overall globally absorbed power can be measured with the diamagnetic loop [16],
measuring the toroidal magnetic flux variation, which is related to the plasma stored
energy. An absorption of typically 60% is observed for O-mode injection, as shown in
Figure 8. In X-mode, the absorption remains below 10%, indicating that the O-mode
can penetrate into the plasma while the X-mode is reflected, as expected for overdense
7
plasmas. A total power absorption measurement cannot conclusively prove the nature
of the absorption mechanism, which can also involve edge absorption of waves
generated by nonlinear wave-wave coupling as well as absorption of waves multiply
reflected on the vacuum vessel. In addition to the angle dependence demonstrated in
the previous section, a determination of the power deposition location is therefore
essential to prove heating via EBW.
The plasma center of the high density target plasma is strongly affected by the
sawtooth instability, which regularly leads to the ejection of the hot plasma core
towards the colder edge region. In the core of the plasma, close to this dominating
instability, the proof of power deposition due to EBWH is very difficult. Therefore,
conditions for a deposition location away from the plasma core, but well inside the
plasma cut-off were chosen. In Figure 9, an ART simulation of such a wave path is
shown in the poloidal and toroidal projections. The O-mode wave propagates to the
plasma cut-off, is converted into X-mode and continues its path back to the upper
hybrid resonance, where it is converted into Bernstein mode. Then the Bernstein wave
propagates towardsthe plasma center and is absorbed at ρψ ~ 0.78, well inside the
plasma cut-off layer at ρψ ~ 0.9 (see Figure 11b)).
The deposition location is determined experimentally by inspecting soft X-ray time
traces, measured by a multi-wire proportional detector, covering the entire plasma
cross section with its 64 lines of sights in the vertical direction [17]. The soft X-ray
emissivity has a monotonically increasing dependence on the electron temperature and
the plasma density. In Figure 10, as the plasma density increases monotonically, the
modulation of the soft X-ray emissivity, visible in the line integrated time traces of
several channels, on both the High Field Side (HFS) and Low Field Side (LFS) can be
attributed to the modulation of the temperature caused by modulated ECRH. To
determine the ECRH power deposition location, an FFT analysis of each of the 64 soft
X-ray chords was performed. The FFT amplitude of the peak at the ECRH modulation
frequency is plotted over the soft X-ray channel number in Figure 11a. Two clear
maxima in the amplitude are visible. These broad spatial peaks correspond to chords
to ρψ ~ 0.65, on both HFS and LFS. The maximum on the HFS is more pronounced
8
due to the effects of line integration and plasma triangularity, causing such an
asymmetry.
Since the soft X-ray chords are line integrated, an integral inversion is necessary to
derive the local emissivity distribution. This is accomplished under the assumption of
a poloidally constant emissivity and by employing a Fisher regularization algorithm.
In Figure 11b, the FFT amplitude of the inverted data at the EC modulation frequency
is represented as a function of the poloidal flux coordinate ρψ. The peak of the FFT
amplitude after the inversion is located at ρψ ~ 0.7. This experimental peak deposition
location is close to the calculated one at ρψ ~ 0.78, within only 10%. The slight
difference may be attributed again to uncertainties in the equilibrium reconstruction
and in the density gradient measurement.
However, the good agreement of the theoretical and experimental deposition locations
together with a deposition of the heating power inside the plasma cut-off constitutes a
strong proof that the O-X-B mechanism is at play and that the plasma is heated by
EBWH.
CENTRAL ELECTRON TEMPERATURE INCREASE BY
ELECTRON BERNSTEIN WAVE HEATING
To be able to observe an increase of the central temperature over several confinement
times, the injected power was increased to 1 MW and the pulse length to 100 ms, as
shown in Figure 12. The magnetic field and the injection angles are chosen such that
both upper lateral and equatorial launchers heat at the same location at ρψ ~ 0.4
(calculated with ART). The central temperature evolution, shown in Figure 12, is
measured via the soft X-ray absorber method. TCV is equipped with 3 soft X-ray
cameras, equipped with different beryllium thicknesses to measure the electron
temperature. All of them show the same behaviour: an increase of the temperature ΔTe
~ 80 eV during the EC pulse. During the heating pulse, the density remains quasi-
constant, which emphasizes that the temperature evolution is essentially the result of
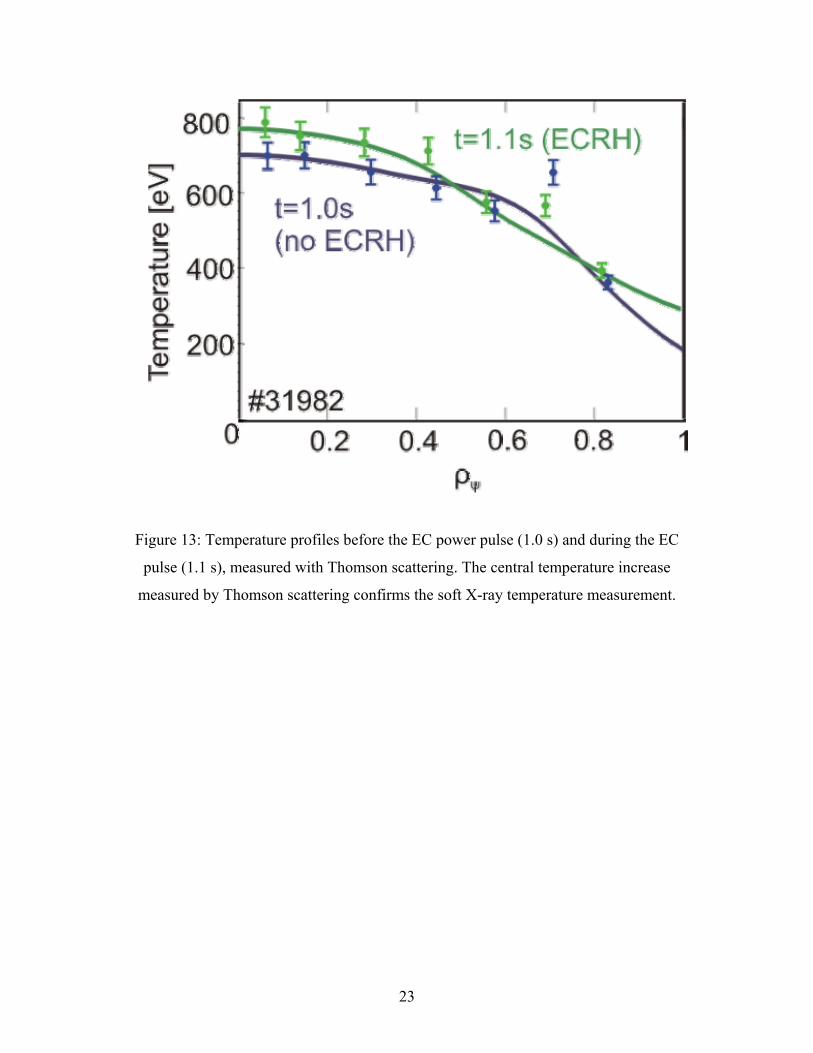
EBWH. The measurement of this temperature increase is supported by Thomson
9
scattering measurements. Figure 13 shows two Thomson temperature profile fits, one
at 1.0 s before the EC pulse and one at 1.1 s during the EC pulse. An increase of the
central temperature is also observed, supporting the temperature measurements with
the soft X-ray absorber method.
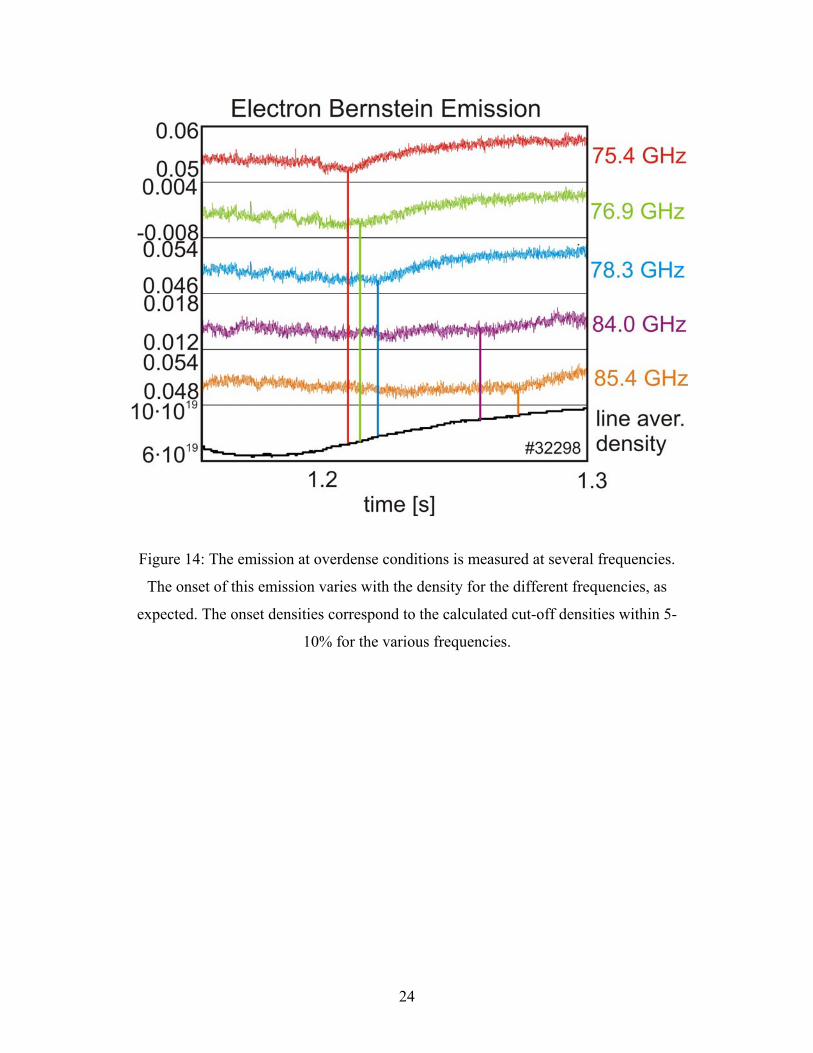
ELECTRON BERNSTEIN WAVE EMISSION MEASUREMENTS
Initial Electron Bernstein Emission measurements were performed in plasmas with
reversed magnetic field and current with a newly installed equatorial launcher with
steerable mirrors. This refurbished launcher is similar in geometry to the other six
launchers connected to the gyrotrons, but is only meant to be used for reception
measurements. It is attached to the LFS ECE system via a several meters long open-
ended over-moded 1 inch diameter waveguide line, connected to a switch at the
radiometer side, after being downtapered and converted to a fundamental waveguide
with a rectangular cross section. The transmission line was optimized to observe
modes with a vertical polarization (approximately X-mode, when viewing
perpendicularly), without additional polarizer. Since the oblique O-mode is quasi-
circularily polarized, the difference in the measurement of horizontal or vertical
(linear) polarization is low.
Via the radiometer, emission with frequencies ranging fom 65 to 110 GHz can be
observed. As in the previously described heating experiments, the optimum angle was
first determined with the ART code. Then, poloidal and toroidal angle scans on a shot
to shot basis were performed to determine experimentally the optimum angle. In
Figure 14, first EBE measurements close to the optimum angle are presented for
several frequencies. A clear emission signal is observed on all channels for an
overdense plasma. The emission signals show also a clear maximum in the reception
angle, comparable to the minimum in the stray signal with modulated EC injection, as
described in the previous sections. The emission signal drops with the appearance of
ELMs in a similar way than the stray signal increases during ELMs, pointing out the
dependence of both processes on the profiles. This indicates that the two mechanisms
are indeed due to EBE and EBWH.
10
For the different frequencies, the onset of the overdense emission signal is dependent
on the density. The onset density increases with the frequency, as expected, and is
comparable to the cut-off density. In Figure 15, the calculated cut-off densities for
various frequencies are compared with a high temporal resolution line-integrated
density measurement (FIR) and the Thomson density on axis. The measured EBE
onset densities are in good agreement with the calculated cut-off densities and differ
only by 5-10%.
The same experiment was performed for horizonal polarization (pure O-mode). As
expected, a similar result was obtained with the emission signal being slightly higher
by 20%.
As shown in polar diagrams of the CMA diagram [1], the O-mode couples to the left
hand circularly polarized mode (L-mode), dependent on the injection angle; meaning
that an oblique O-mode wave is left-hand quasi-circularly polarized. By inserting a
polarizer (circular-linear), a mode with one handiness can be selected. Figure 16
shows two discharges close to the optimum angles with the selection of opposite
handinesses. As expected, the overdense emission is only observed for one handiness,
so it can be concluded, that the mode is quasi-circularly polarized, as expected for
oblique O-mode.
In summary, the emission is dependent on the emission angle and is observed above a
density threshold. The threshold differs for the different frequencies and corresponds
to the cut-off densities. The emission signal is stronger for horizontal O-mode than for
vertical polarization (X-mode) and has a well defined handiness. Therefore, there is
strong evidence that the observed emission is actually Electron Bernstein Emission
(EBE).
CONCLUSIONS AND OUTLOOK
11
In conclusion, the first demonstration of EBW heating by O-X-B double mode
conversion in an overdense conventional aspect-ratio tokamak has been obtained in
the TCV device.
The optimum injection angle for O-X-B conversion was demonstrated experimentally
by 2D angle scans via microwave stray radiation measurements in discharges with
modulated EC wave injection at a low duty cycle. Ray tracing simulations with the
ART code were performed yielding an optimum angle in good agreement with the
measurements.
Higher duty cycle modulated EC waves were injected to perform bulk EBWH.
An average absorbed power fraction of about 60 % was measured with densities well
above the cut-off. The spatial distribution of the power absorption was determined
experimentally by FFT analysis of soft X-ray emissivity from a high spatial resolution
camera. The local deposition was found to be well inside the plasma cut-off and
matches the value predicted by ART within the experimental uncertainties.
To measure a temperature increase, the injection angle and the magnetic field were
adjusted to achieve more central absorption. A central temperature increase was
measured consistently by Thomson scattering and the soft X-ray absorber method.
Initial electron Bernstein wave emission measurements were presented, reproducing
the calculated cut-off density at the EBE onset for several frequencies. The emission is
higher for horizontal than for vertical polarization and has a well defined handiness.
Therefore, there is strong evidence that the observed emission is dominated by
electron Bernstein wave emission.
In summary, localized heating experiments were presented, demonstrating EBWH for
the first time via the O-X-B mode conversion process in a standard aspect-ratio
tokamak.
12
ACKNOWLEDGMENTS
The ART software has been acquired with kind permission of IPP-Garching. This
work is partly funded by the 'Fonds National Suisse pour la recherche scientifique'.
The Author A. Mueck is supported by a EURATOM Fusion fellowship.
13
FIGURES
Figure 1: The ECRH system of TCV heats the plasma at the second harmonic with six
gyrotrons at 82.7 GHz and a power of 500kW each. The waves are injected by four
upper lateral launchers and two equatorial launchers which can be rotated in two
directions.
14
Figure 2: Typical target plasma: high density ELMy H-mode with ELM-free phases.
Modulated EC waves are injected in O-mode. When the plasma becomes overdense,
the stray level is low in the ELM-free phases and increases in the ELMy phases, as
shown in the highlighted region.
15
Figure 3: Normalized stray radiation power (violet) and Dα light emission (green).
ELMs can strongly influence the stray radiation. The stray power, measured during the
short EC pulses, rises from 30% to 80% during an ELMy phase.
16
Figure 4: Normalized stray radiation power vs. a) poloidal angle (with constant
toroidal angle) and b) toroidal angle (with constant toroidal angle). The solid curves
represent polynomial regression fits to the data points, the dashed lines represent 50%
of the maximum stray level. A clear minimum in the stray radiation level is found for
both angle scans.
17
Figure 5: Contour plot of calculated O-X conversion efficiency vs. launching angles.
The innermost contour indicates 90% O-X conversion, the outermost 10%. The
dashed lines denote the minimum and maximum angles of the 50% conversion
window. The superimposed points give the angles of the experimental scans (see
Figure 4). The green point corresponds to the extrapolated optimum experimental
angles and is within 3° of the calculated angles.
18
Figure 6: Comparison of experimental (see Figure 4b) and simulated angular window.
The experimental angular width is significantly broader than the simulated one, but can be explained by the finite width of the EC beam and the spread in its wave number spectrum.
19
Figure 7: Stray radiation for O- (violet) and X-mode (green) injection during an ELM-
free period for identical injection angles and plasma conditions. In O-mode, the stray
level is only about 40% of the stray level in X-mode.
Figure 8: Average deposited power from experiment with modulated EC wave injection, determined with the diamagnetic flux loop diagnostic. The absorbed power
is about 60% of the injected EC power.
20
Figure 9: ART ray tracing calculation of the wave path in the a) poloidal and b)
toroidal projections, including O-X-B double mode conversion.
Figure 10: The injection of modulated EC waves is visible directly on several radial soft X-ray time traces. To determine the deposition location, an FFT of each channel is
performed.
21
Figure 11: a) Normalized FFT amplitude of the line-integrated soft X-ray time traces
at the modulation frequency of the injected EC waves at 182 Hz vs. the chord number
(green). The noise level is shown for reference (violet). b) Local soft X-ray emissivity
oscillation amplitudes at the modulation frequency, derived by integral inversion from
the line-integrated soft X-ray chords (green) and normalized density of the deposited
beam power, calculated with ART. The power is absorbed well inside the cut-off at
ρψ ~ 0.78.
22
Figure 12: The long EC power pulses of 100 ms were injected to be able to show a
temperature increase due to EBWH. A clear increase in the temperature, measured by
the soft X-ray absorber method is shown. The density remains essentially constant,
which allows to attribute the temperature increase to EBWH (POhm = 0.6 MW, PECRH =
1 MW and additional PECRH = 1 MW pulses of 100 ms).
23
Figure 13: Temperature profiles before the EC power pulse (1.0 s) and during the EC
pulse (1.1 s), measured with Thomson scattering. The central temperature increase
measured by Thomson scattering confirms the soft X-ray temperature measurement.
24
Figure 14: The emission at overdense conditions is measured at several frequencies.
The onset of this emission varies with the density for the different frequencies, as
expected. The onset densities correspond to the calculated cut-off densities within 5-
10% for the various frequencies.
25
Figure 15: Comparison between calculated O-mode cut-off densities, the measured density from the FIR high time resolution line averaged density reconstruction and Thomson density measurement on axis for the square of several frequencies. A clear dependence with a deviation of less than 10% is shown.
26
Figure 16: Similar discharge as in Figure 14 but with a polarizer included to differ
between opposite polarisation handinesses. The overdense emission signal is observed for only one handiness in ELM-free phases.
27
REFERENCES
1. T.H. Stix, Waves in Plasmas, Springer Verlag New York, Inc., 1992
2. I. Bernstein, Phys. Rev. Lett. 109, 10 (1958)
3. J. Preinhaelter, V.Kopecky, J. Plasma Physics 10, part 1 (1973), pp 1-12
4. E. Mjølhus, J. Plasma Phys. 31, 7 (1984)
5. H.P. Laqua et al., Phys. Rev. Lett. 78, 3467 (1997)
6. V. Shevchenko et al., 15th Topical Conf. on RF Power in Plasmas, Moran,
2003, edit. C. Forest, AIP 694, 359
7. G. Taylor et al., Phys. Plasmas 12, 052511 (2005)
8. P. Chattopadhyay et al., Phys. Plasmas 9, No. 3 (2002)
9. F. Wagner et al., Phys. Rev. Lett. 49, 1408 (1992)
10. F. Volpe, Electron Bernstein emission diagnostic of electron temperature
profile at W7-AS Stellarator, PhD thesis, IPP Garching and Greifswald, IPP
Report 13/1, March 2003 (124 pages)
11. F. Volpe, H.P.Laqua, Rev. Sci. Instrum. 74, No. 3 (2003), pp. 1409-1413
12. A. Mueck et al., O-X-B Mode Conversion in the TCV Tokamak, Proc. 32nd
EPS Conf. on Plasma Phys. and Contr. Fusion (Tarragona, 2005), P4.110
13. A. Mueck et al., Electron Bernstein Wave Heating in the TCV Tokamak, EC –
14, 14th Joint Workshop on Electron Cyclotron Emission and Electron