103
• • •
Durham E-Theses
Electron spin resonance studies of doped rutile
Eggleston, Harold Simon
How to cite:
Eggleston, Harold Simon (1979) Electron spin resonance studies of doped rutile, Durham theses, DurhamUniversity. Available at Durham E-Theses Online: http://etheses.dur.ac.uk/8943/
Use policy
The full-text may be used and/or reproduced, and given to third parties in any format or medium, without prior permission orcharge, for personal research or study, educational, or not-for-pro�t purposes provided that:
• a full bibliographic reference is made to the original source
• a link is made to the metadata record in Durham E-Theses
• the full-text is not changed in any way
The full-text must not be sold in any format or medium without the formal permission of the copyright holders.
Please consult the full Durham E-Theses policy for further details.
Academic Support O�ce, Durham University, University O�ce, Old Elvet, Durham DH1 3HPe-mail: [email protected] Tel: +44 0191 334 6107
http://etheses.dur.ac.uk
ELECTRON SPIN RESONANCE STUDIES OF DOPED RUTILE
By
HAROLD SIMON EGGLESTON, B.Sc.(DUNELM)
A thesis submitted to the Faculty of Science
of the University of Durham for the
Degree of Master of Science
Department of Applied Physics and Electronics
Science Laboratories, November, 1979. Durham.
The copyright of this thesis rests with the author.
No quotation from it should be published without
his prior written consent and information derived
from it should be acknowledged. ersity
ACKNOWLEDGEMENTS
t would l i k e to express my sincere thanks to Dr. J S Thorp
for h i s constant help and encouragement during t h i s research project.
I am indebted to Professor G G Roberts for allowing me the
use of the f a c i l i t i e s of the department and to the technical s t a f f ,
headed by Mr. F Spence, for t h e i r kind help.
I wish to thank Tioxide International Ltd., Stockton-on-Tees,
for t h e i r award of a Research Studentship and t h e i r helpful cooperation
during the course of t h i s work.
My thanks also go to a l l my friends who, i n various ways, have
contributed to the success of t h i s project ; and, f i n a l l y , to
Mrs. S Mellanby for typing t h i s t h e s i s .
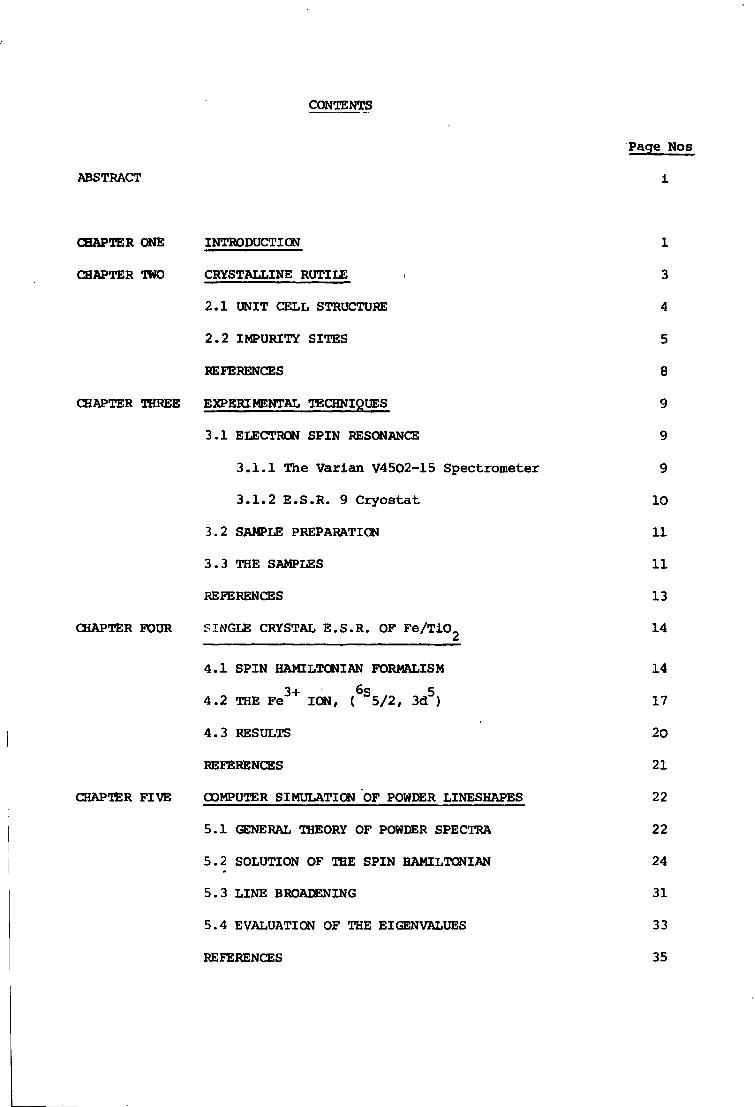
CONTENTS
Page Nos
ABSTRACT i
CHAPTER ONE INTRODUCTION 1
CHAPTER TWO CRYSTALLINE RUTILE 3
2.1 UNIT CELL STRUCTURE 4
2.2 IMPURITY SITES 5
REFERENCES 8
CHAPTER THREE EXPERIMENTAL TECHNIQUES 9
3.1 ELECTRON SPIN RESONANCE 9
3.1.1 The Varian V4502-15 Spectrometer 9
3.1.2 E.S.R. 9 Cryostat 10
3.2 SAMPLE PREPARATION 11
3.3 THE SAMPLES 11
REFERENCES 13
CHAPTER FOUR SINGLE CRYSTAL E.S.R. OF Fe/Ti0 2 14
4.1 SPIN HAMILTONIAN FORMALISM 14
4.2 THE F e 3 + ION, ( 6 S5/2, 3d 5) 17
4.3 RESULTS 20
REFERENCES 21
CHAPTER FIVE COMPUTER SIMULATION OF POWDER LINESHAPES 22
5.1 GENERAL THEORY OF POWDER SPECTRA 22
5.2 SOLUTION OF THE SPIN HAMILTONIAN 24
5.3 LINE BROADENING 31
5.4 EVALUATION OF THE EIGENVALUES 33
REFERENCES 35
Page Nos
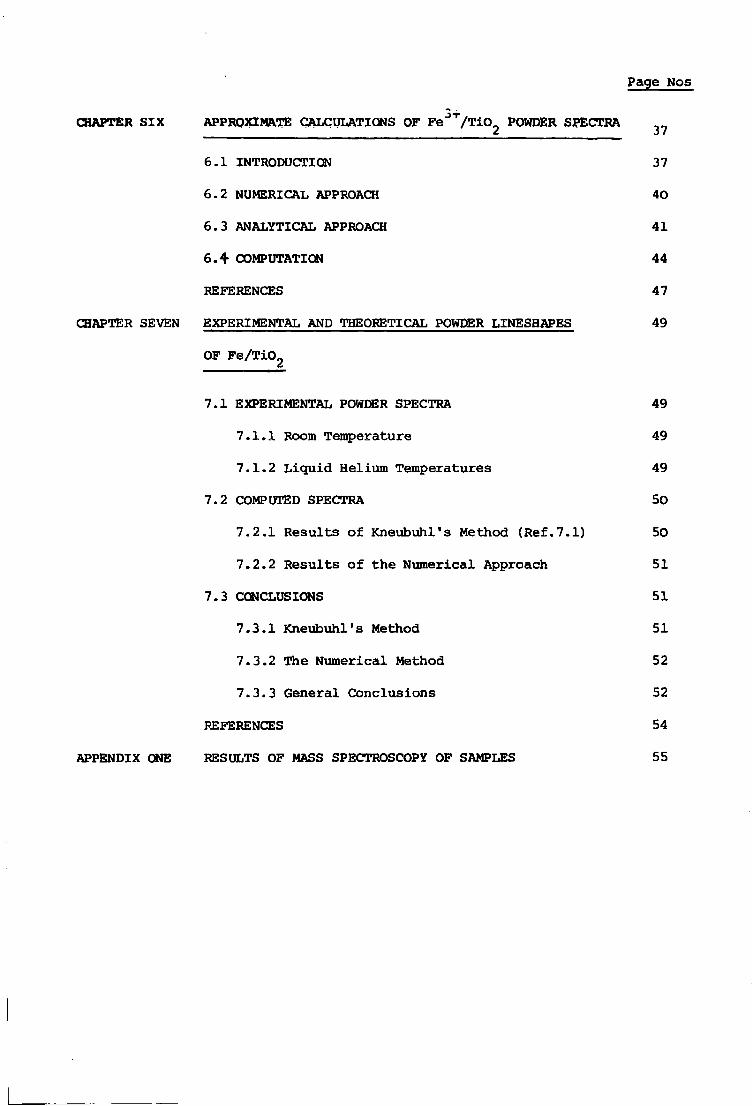
CHAPTER SIX APPROXIMATE CALCULATIONS OF Fe J" r/Ti0 2 POWDER SPECTRA 3 ?
6.1 INTRODUCTION 37
6.2 NUMERICAL APPROACH 40
6.3 ANALYTICAL APPROACH 41
6.+ COMPUTATION 44
REFERENCES 47
CHAPTER SEVEN EXPERIMENTAL AND THEORETICAL POWDER LINESHAPES 49
OF Fe/TiO^
7.1 EXPERIMENTAL POWDER SPECTRA 49
7.1.1 Room Temperature 49
7.1.2 Liquid Helium Temperatures 49
7.2 COMPUTED SPECTRA 50
7.2.1 Results of Kneubuhl's Method (Ref.7.1) 50
7.2.2 Results of the Numerical Approach 51
7.3 CONCLUSIONS 51
7.3.1 Kneubuhl's Method 51
7.3.2 The Numerical Method 52
7.3.3 General Conclusions 52
REFERENCES 54
APPENDIX C«re RESULTS OF MASS SPECTROSCOPY OF SAMPLES 55
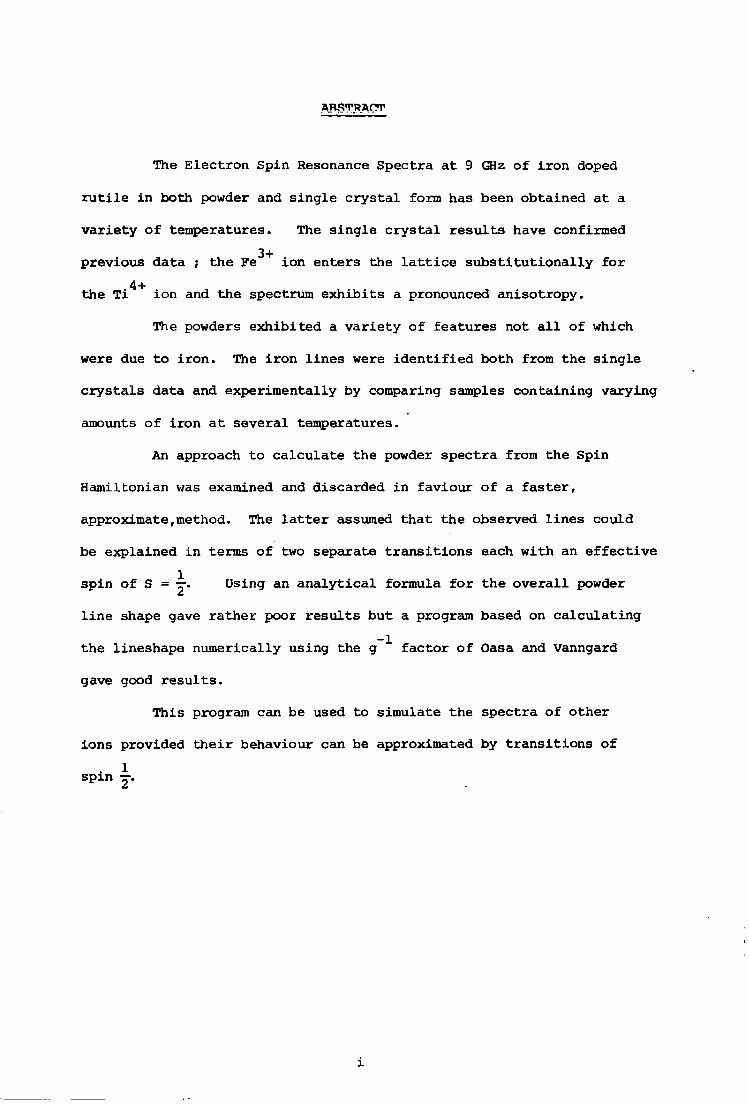
ABSTRACT
The Electron Spin Resonance Spectra at 9 GHz of iron doped
r u t i l e i n both powder and single c r y s t a l form has been obtained at a
variety of temperatures. The single c r y s t a l r e s u l t s have confirmed
previous data ; the F e ^ + ion enters the l a t t i c e s u b s t i t u t i o n a l ^ for 4+
the T i ion and the spectrum exhibits a pronounced anisotropy.
The powders exhibited a variety of features not a l l of which
were due to iron. The iron l i n e s were i d e n t i f i e d both from the single
c r y s t a l s data and experimentally by comparing samples containing varying
amounts of iron at several temperatures.
An approach to calculate the powder spectra from the Spin
Hamiltonian was examined and discarded in faviour of a fas t e r ,
approximate,method. The l a t t e r assumed that the observed l i n e s could
be explained i n terms of two separate t r a n s i t i o n s each with an e f f e c t i v e
spin of S = j . Using an a n a l y t i c a l formula for the o v e r a l l powder
l i n e shape gave rather poor r e s u l t s but a program based on calculating
the lineshape numerically using the g ^ factor of Oasa and Vanngard
gave good r e s u l t s .
This program can be used to simulate the spectra of other ions provided t h e i r behaviour can be approximated by tra n s i t i o n s of
1 spin TT.
i
CHAPTER ONE
INTRODUCTION
Rutile i s widely used as a pigment i n paints. Studies have
related some of i t s technological properties to trapping centres thought
to be due to iron, nickel and a few other impurities. Some previous work
on determining trap depths has been performed i n the Department using
Thermally Stimulated Conduction and Thermally Stimulated Luminescence
as well as Electron Spin Resonance techniques.
In the l a t t e r method, the amplitude of new l i n e s formed a f t e r
o p t i c a l i r r a d i a t i o n was found to be related to the amplitudes of l i n e s 3+ 2+
due to species such as Fe and Ni . By monitoring the decay rates of
these l i n e s following either thermal annealing or further (infra-red)
o p t i c a l a c t i v a t i c n , Hodgskiss (unpublished) showed that trap depths
could be estimated. This method appears to have the advantage over
o p t i c a l methods that not only the trap depth can be found but also the
nature of the trap.
A l l t h i s previous work was with single c r y s t a l samples. I n
practice powders are used and so i t i s desirable to make s i m i l a r studies
of trapping centres d i r e c t l y i n powdered pigments. As a f i r s t step i n
t h i s direction i t i s e s s e n t i a l to be able to correlate single c r y s t a l
and powder E.S.R. spectra.
rpy, I'/ork ccnCw ms Qni^y t i i s Fs^ ion • F i r s t l y whs sd.nCj2.s cirys
F e ^ + spectrum was obtained and compared with published data. Next the
various samples, both powdered single c r y s t a l s and pigments ,were examined
and the i r spectra recorded. A method of simulating the powder spectra
from the observed single c r y s t a l data was required and, after examining
an approach u t i l i z i n g the f u l l spin Hamiltonian, a technique using the
e f f e c t i v e g values for each Kramers doublet was devised. This enabled
CHAPTER ONE
INTRODUCTION
Rutile i s widely used as a pigment i n paints. Studies have
related some of i t s technological properties to trapping centres thought
to be due to iron, n i c k e l and a few other impurities. Some previous work
on determining trap depths has been performed i n the Department using
Thermally Stimulated Conduction and Thermally Stimulated Luminescence
as well as Electron Spin Resonance techniques.
In the l a t t e r method, the amplitude of new l i n e s formed a f t e r
o p t i c a l i r r a d i a t i o n was found to be related to the amplitudes of l i n e s 3+ 2+
due to species such as Fe and Ni . By monitoring the decay rates of
these l i n e s following either thermal annealing or further (infra-red)
o p t i c a l activation, Hodgskiss (unpublished) showed that trap depths
could be estimated. This method appears to have the advantage over
o p t i c a l methods that not only the trap depth can be found but also the
nature of the trap.
A l l t h i s previous work was with single c r y s t a l samples. I n
practice powders are used and so i t i s desirable to make s i m i l a r studies
of trapping centres d i r e c t l y i n powdered pigments. As a f i r s t step i n
t h i s direction i t i s e s s e n t i a l to be able to correlate single c r y s t a l
and powder E.S.R. spectra. rTrHh_c v.'ork concerns only the Fe^^" ion. F i r s t l y the single c r y s t a l
F e ^ + spectrum was obtained and compared with published data. Next the
various samples, both powdered single c r y s t a l s and pigments ,were examined
and t h e i r spectra recorded. A method of simulating the powder spectra
from the observed single c r y s t a l data was required and, af t e r examining
an approach u t i l i z i n g the f u l l spin Hamiltonian, a technique using the
ef f e c t i v e g values for each Kramers doublet was devised. This enabled
1
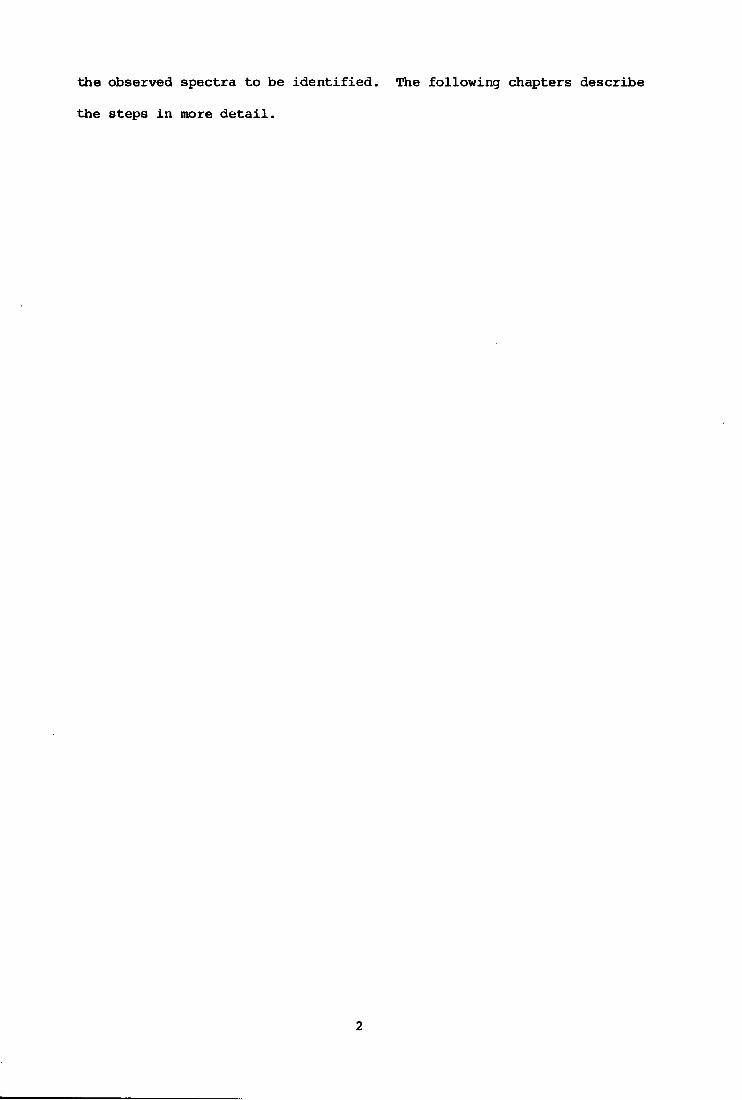
the observed spectra to be i d e n t i f i e d . The following chapters describe
the steps i n more d e t a i l .
2
CHAPTER TWO
CRYSTALLINE RUTILE
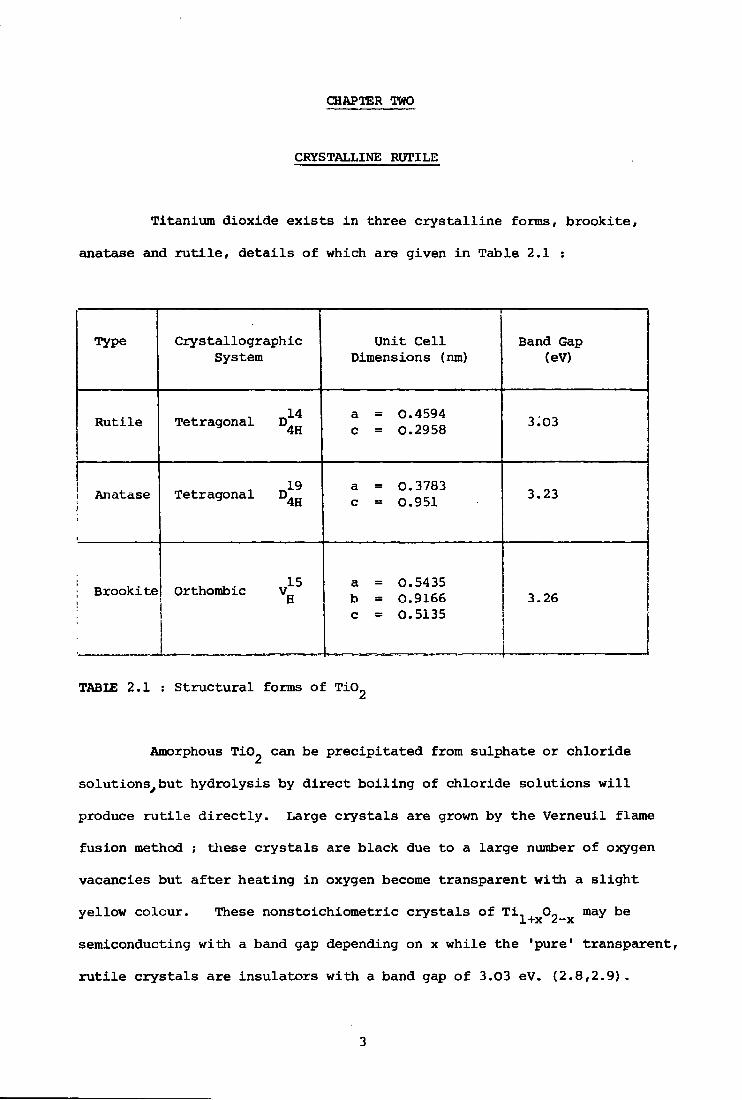
Titanium dioxide e x i s t s i n three c r y s t a l l i n e forms, brookite,
anatase and r u t i l e , d e t a i l s of which are given i n Table 2.1 :
Type Crystallographic System
•
Unit C e l l Dimensions (nm)
Band Gap (eV)
Rutile Tetragonal 4H
a = 0.4594 c = 0.2958 3:03
Anatase
i
a = 0.3783 c = 0.951 3.23
Brookite ^. 15 Orthombic V n a = 0.5435 b = 0.9166 c = 0.5135
3.26
TABLE 2.1 : Structural forms of TH^
Amorphous Ti©2 can be precipitated from sulphate or chloride
solutions^but hydrolysis by d i r e c t boiling of chloride solutions w i l l
produce r u t i l e d i r e c t l y . Large c r y s t a l s are grown by the Verneuil flame
fusion method ; these c r y s t a l s are black due to a large number of oxygen
vacancies but a f t e r heating in oxygen become transparent with a s l i g h t
yellow colour. These nonstoichiometric c r y s t a l s of T ii + x°2-x m a ^ b e
semiconducting with a band gap depending on x while the 'pure' transparent,
r u t i l e c r y s t a l s are insulators with a band gap of 3.03 eV. (2.8,2.9).
3
The work described in t h i s thesis i s concerned with titanium dioxide
occuring i n the r u t i l e s t r u c t u r a l form.
2.1 UNIT CELL STRUCTURE
The tetragonal (OOl) axis i s c a l l e d the 'c' axis and the (010)
and (100) axes are c a l l e d the 'a' axes. The unit c e l l i s shown i n
Fig.2.1 (Ref.2.1).
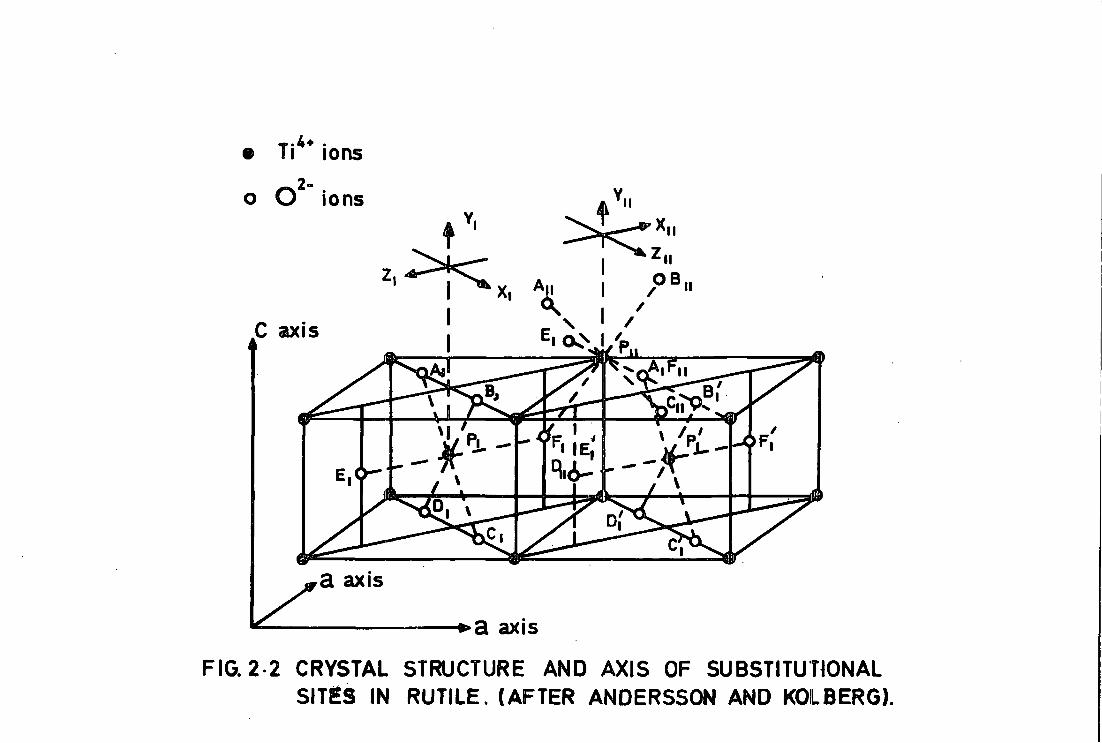
Each titanium atom i s at the centre of a s l i g h t l y distorted
oxygen octahedron with p r i n c i p l e axis i n the (110),(001) and (110)
directions. These provide a more useful axis system for discussing
E.S.R. r e s u l t s and are l a b e l l e d x,y,z respectively. They are shown i n
Fig. 2.2^where i t can be seen that there are two d i f f e r e n t titanium
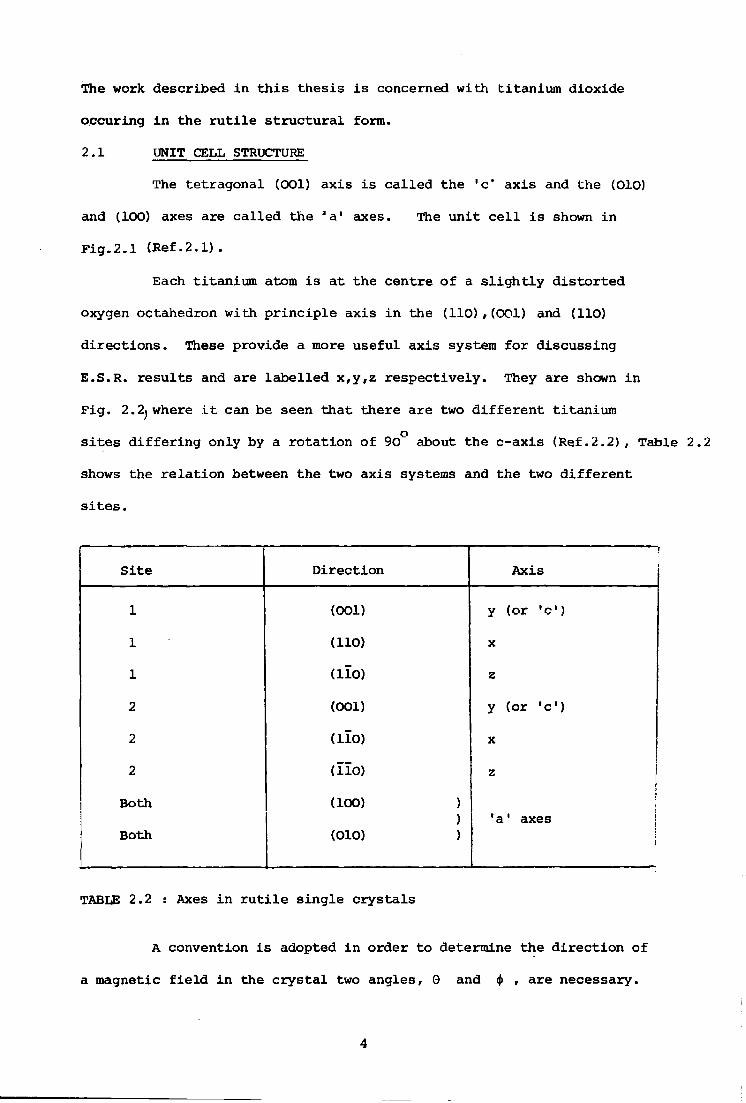
s i t e s d i f f e r i n g only by a rotation of 90° about the c-axis (Ref.2.2), Table 2.2
shows the r e l a t i o n between the two axis systems and the two d i f f e r e n t
s i t e s .
S i t e Direction Axis
1 (001) y (or 'c')
1 (110) X
1 (110) z
2 (001) y (or 'c')
2 ( l l o ) X
2 (110) z
Both (lOO) ) ) 'a 1 axes j
Both (010) ) i
i
TABLE 2.2 : Axes i n r u t i l e single c r y s t a l s
A convention i s adopted i n order to determine the direction of
a magnetic f i e l d i n the c r y s t a l two angles, 0 and <f> , are necessary.
4
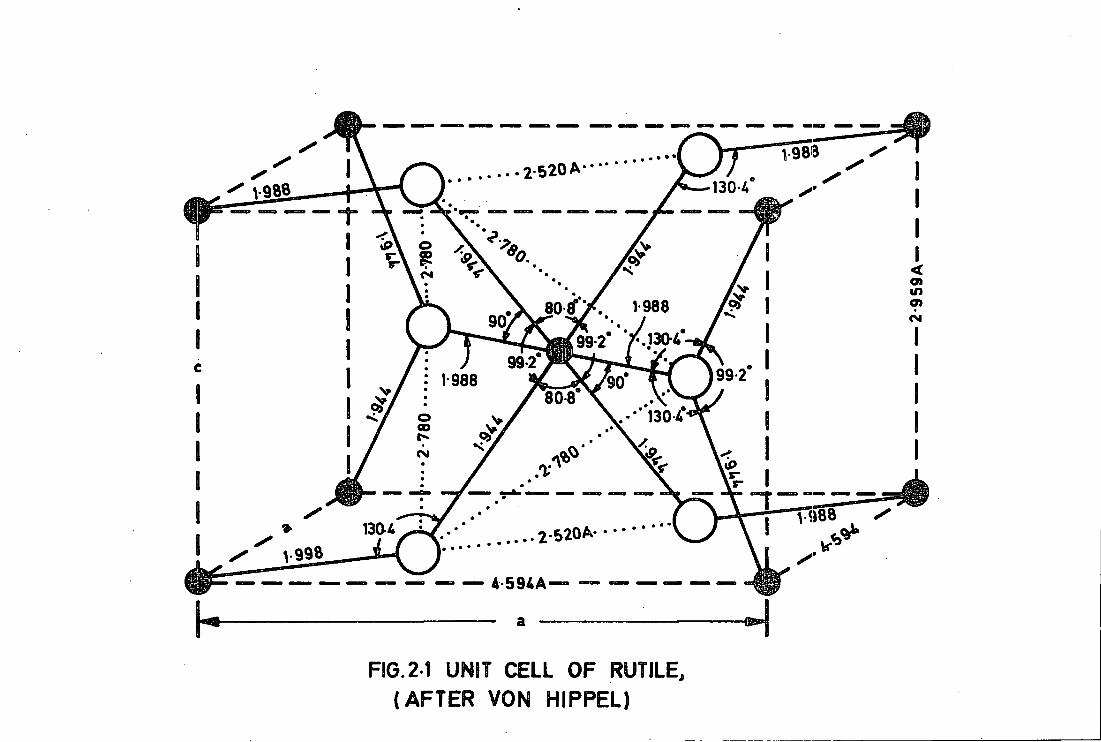
FIG. 2-1 UNIT CELL OF RUTILE, ( A F T E R VON HIPPEL)
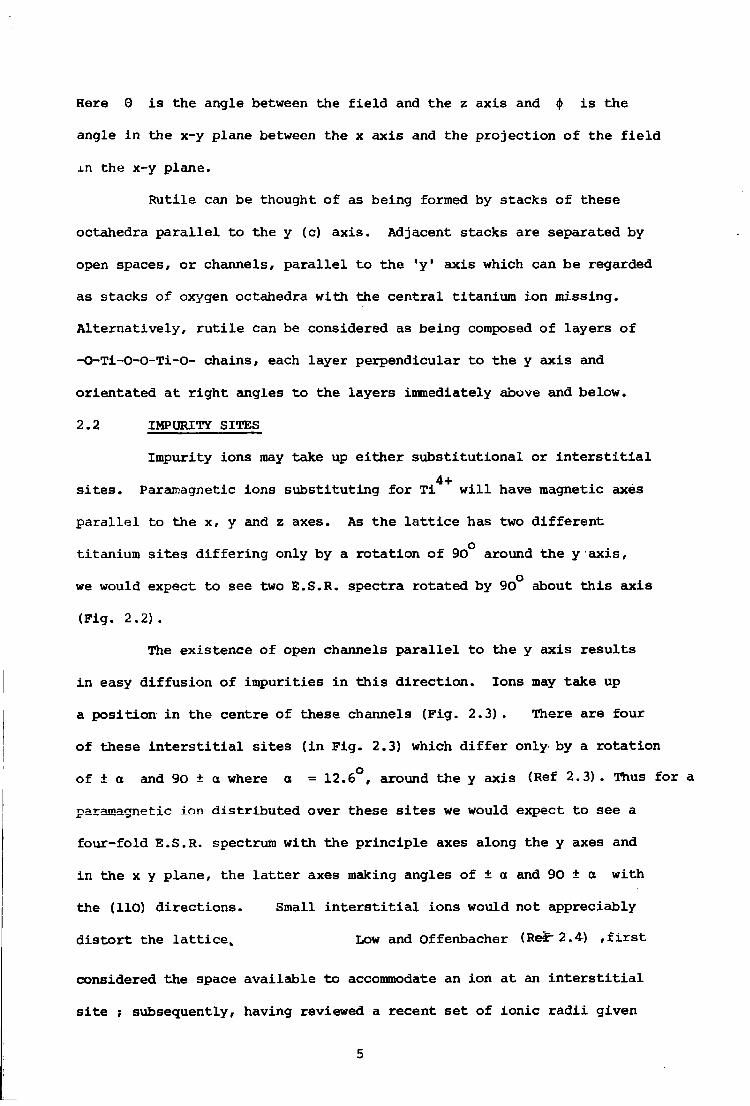
Here 0 i s the angle between the f i e l d and the z axis and <|> i s the
angle in the x-y plane between the x axis and the projection of the f i e l d
in the x-y plane.
Rutile can be thought of as being formed by stacks of these
octahedra p a r a l l e l to the y (c) a x i s . Adjacent stacks are separated by
open spaces, or channels, p a r a l l e l to the 'y' axis which can be regarded
as stacks of oxygen octahedra with the central titanium ion missing.
Alternatively, r u t i l e can be considered as being composed of layers of
-O-Ti-O-O-Ti-0- chains, each layer perpendicular to the y axis and
orientated at right angles to the layers immediately above and below.
2.2 IMPURITY SITES
Impurity ions may take up either substitutional or i n t e r s t i t i a l 4+
s i t e s . Paramagnetic ions substituting for T i w i l l have magnetic axes p a r a l l e l to the x, y and z axes. As the l a t t i c e has two d i f f e r e n t
o titanium s i t e s d i f f e r i n g only by a rotation of 90 around the y a x i s ,
o
we would expect to see two E.S.R. spectra rotated by 90 about t h i s axis
(Fig. 2.2).
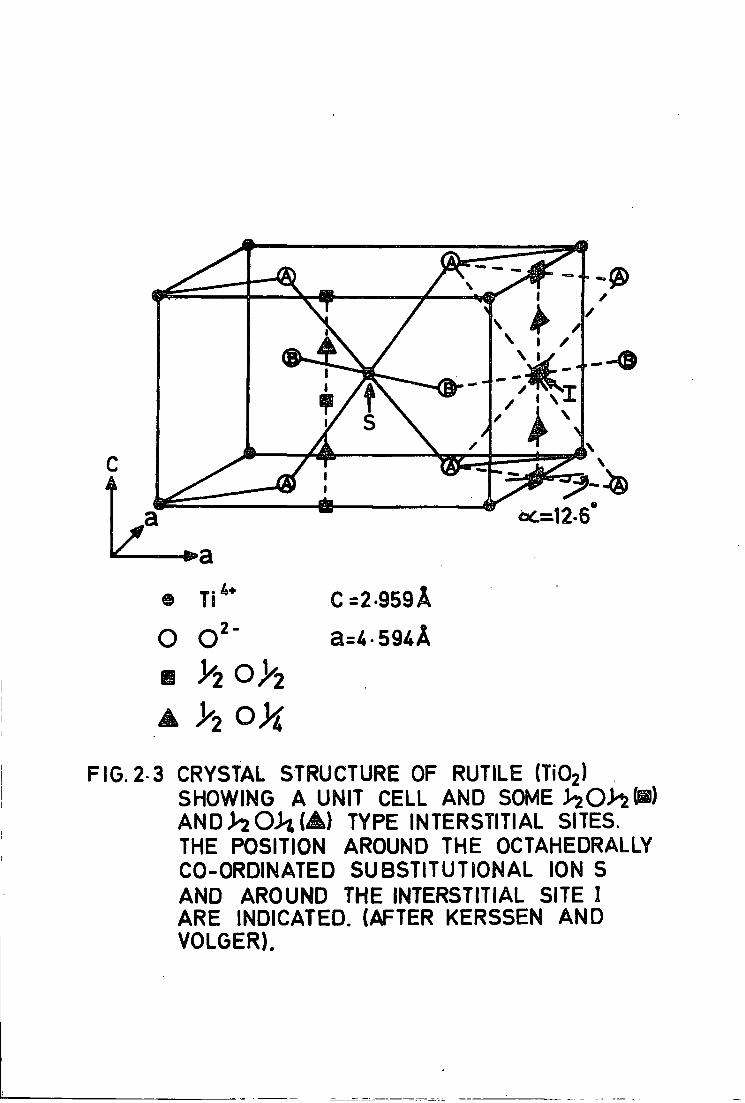
The existence of open channels p a r a l l e l to the y axis r e s u l t s
i n easy diffusion of impurities i n t h i s d i r e c t i o n . Ions may take up
a position i n the centre of these channels (Fig. 2.3). There are four
of these i n t e r s t i t i a l s i t e s ( in F i g . 2.3) which d i f f e r only by a rotation
of ± a and 90 ± a where a = 12.6°, around the y axis (Ref 2.3). Thus for a
paramagnetic ion distributed over these s i t e s we would expect to see a
four-fold E.S.R. spectrum with the p r i n c i p l e axes along the y axes and
in the x y plane, the l a t t e r axes making angles of ± a and 90 ± a with
the (110) directions. Small i n t e r s t i t i a l ions would not appreciably
d i s t o r t the l a t t i c e . Low and Offenbacher (Reir-2.4) , f i r s t
considered the space available to accommodate an ion at an i n t e r s t i t i a l
s i t e ; subsequently, having reviewed a recent set of ionic r a d i i given
5
• Ti ions
o O ions ii I I
I I OB X
_ \
I I Xi
C axis
i 1 n B B
1 ' O
' i
—Or 7T l IE I
R . 4 -
i \
j^a axis
^— »a axis
FIG. 2 2 CRYSTAL STRUCTURE AND AXIS OF SUBSTITUTIONAL S ITES IN RUTILE. (AFTER ANDERSSON AND KOILBERG).
O O 2 '
m > 2 0 > 2
FIG. 2 3 CRYSTAL STRUCTURE OF RUTILE (Ti0 2) SHOWING A UNIT CELL AND SOME h O h W A N D ^ O ^ ( ^ ) TYPE INTERSTITIAL SITES. THE POSITION AROUND THE OCTAHEDRALLY CO-ORDINATED SUBSTITUTIONAL ION S AND AROUND THE INTERSTITIAL SITE I A R E INDICATED. (AFTER K E R S S E N AND VOLGER).
C =2-959 A a=4 594A
by Shannon and Prewitt (Rcf ^.5),Kersen & VoUjer(Rci 2.3)concluded that ions with
r a d i i i n the region of 0.63 - 0.82 % might prefer these i n t e r s t i t i a l
positions.
Huntington and S u l l i v a n (Refs 2.3,2.6)suggested the existence of a
second-class of i n t e r s t i t i a l s i t e s on ^,0,n/4 type positions with n odd
( i . e . points marked A i n Fig 2.3). These s i t e s are surrounded by
four O ions, two at a distance of 1.77 X and two at 1.74 %. Energy
calculations for the two types of s i t e s showed that the difference i n
energy between the occupancy of one type of s i t e or the other i s small
and might depend on the charge and radius of the i n t e r s t i t i a l ion.
A four-fold E.S.R. spectrum could be expected also from ions i n t h i s
type of s i t e with an angle a - 12.6. For a l l impurity positions the
spectra can be uniquely characterized by the g values along the p r i n c i p l e
axes and the angle a , i . e . g ,g ,g and a . For substitutional x y z
ii
ions a = 0.
Rutile shows large variations from stoichiometry. When heated
in a reducing atmosphere (vacuum, hydrogen, CO or titanium powder) r u t i l e
loses oxygen and becomes a n-type semiconductor. (The as-grown c r y s t a l s
need to be heated i n as mentioned above). Two reducing reactions have
been thought possible1-
2+ TiO„ —*• TiO„,, , + x 0„-r + 2 x V + 4 x e (2.1) 2 2(l-x) 2 o
4+ 11U 0 r Vi—A/ I 1 U . T A U -» T A I I T 1 A C \£. * £.)
£ X
where V i s an oxygen vacancy j o T i ^ i s an i n t e r s t i t i a l titanium ion.
(the V or T i can capture one or more el e c t r o n s ) . o I
I n i t i a l l y , i t was thought that the f i r s t reaction dominated 3+
but l a t e r E.S.R. r e s u l t s showed the presence of i n t e r s t i t i a l T i ions.
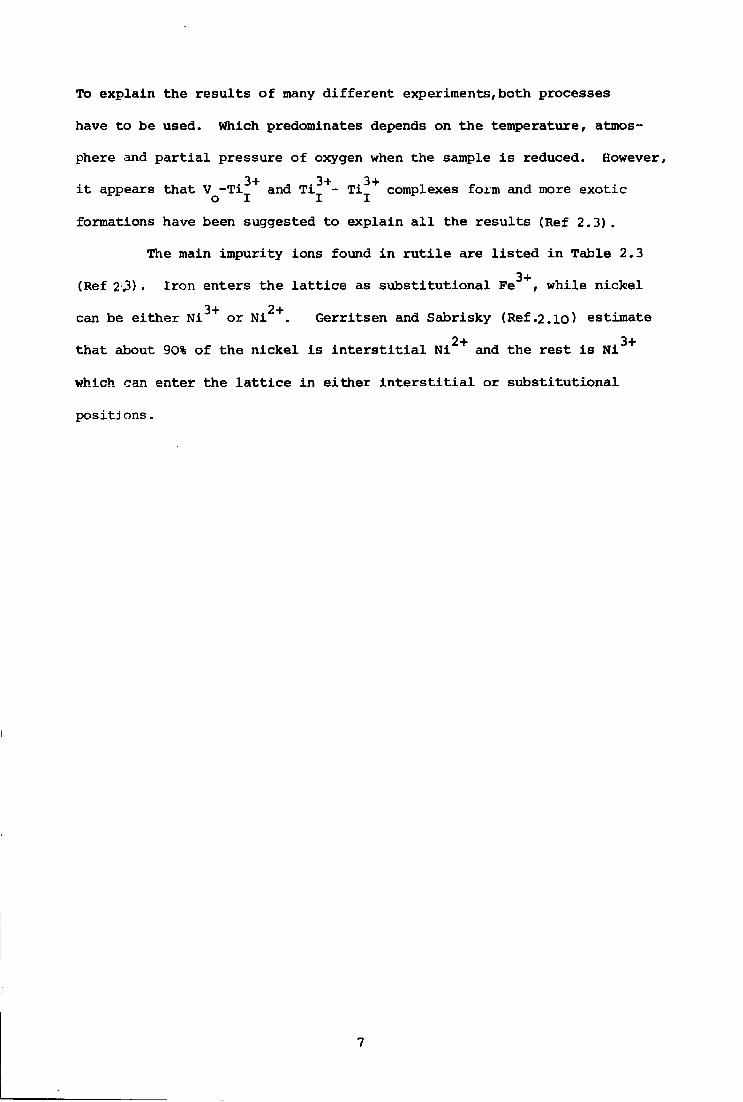
To explain the r e s u l t s of many different experiments, both processes
have to be used. Which predominates depends on the temperature, atmos
phere and p a r t i a l pressure of oxygen when the sample i s reduced. However,
i t appears that V - T i ^ + and T i ^ + - T i ^ + complexes form and more exotic o I I I formations have been suggested to explain a l l the r e s u l t s (Ref 2.3) .
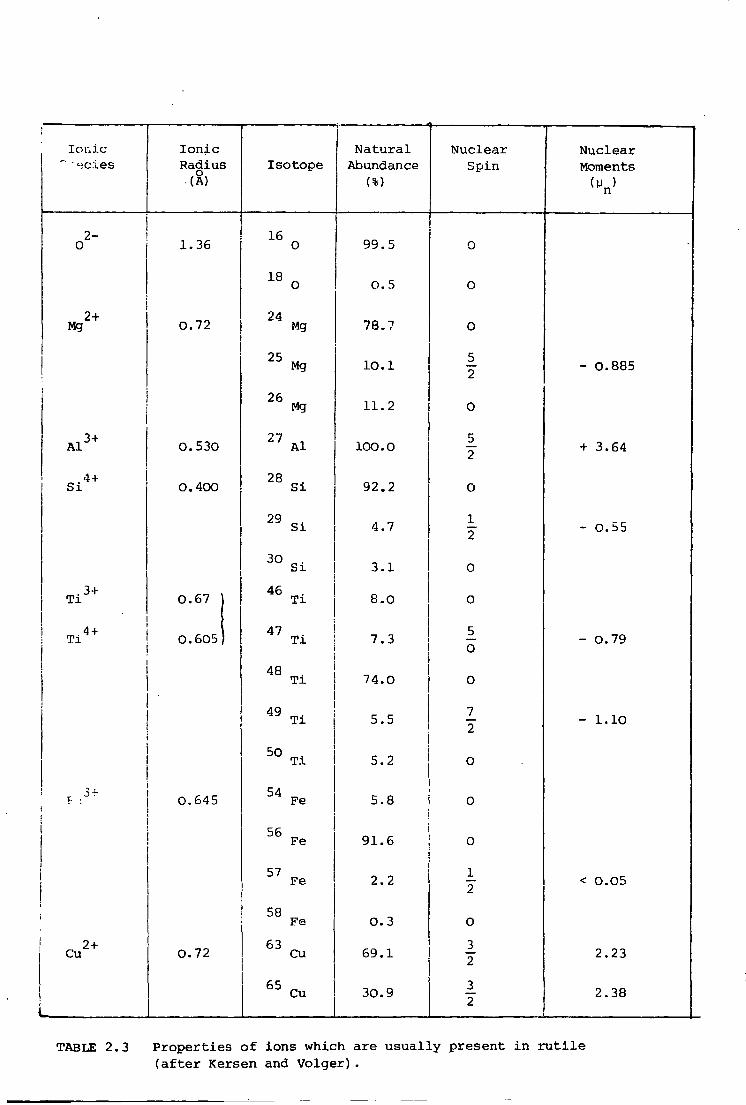
The main impurity ions found i n r u t i l e are l i s t e d i n Table 2.3
(Ref 2v3). Iron enters the l a t t i c e as substitutional Fe^ +, while n i c k e l 3+ 2+
can be either Ni or Ni . Gerritsen and Sabrisky (Ref.2.10) estimate 2+ 3+ that about 90% of the n i c k e l i s i n t e r s t i t i a l Ni and the r e s t i s Ni
which can enter the l a t t i c e in either i n t e r s t i t i a l or substitutional
positj ons.
7
I o n i c I o n i c N a t u r a l ,
Nuclear Nuclear " «cies Radius Isotope Abundance Spin Moments
(A) (%) ("n>
2-0 1.36 16
0
1 8 0
99.5
0.5
0
0
2+ Mg 0.72 24
Mg 78.7 0
2 5 Mg 10.1 5 2 - 0.885
26 , Mg 11.2 0
A l 3 + 0.530 27 , A l 100.0 5 2 + 3.64
4 + S i O.400 28 . S i 92.2 0
S i 4.7 1 2 - 0.55
3 0 «,• S i 3.1 0 . 3+ T i 0.67 T l 8.0 0
T i 4 + 0.605 T l
48 T l
7.3
74.0
_5 0
0
- 0.79
T l 5.5 7 2 - 1.10
T l 5.2 0
1 1 0.645 5 4
w Fe
56 Fe
5.8
91.6
0
0
Fe 2.2 1 2 < 0.05
58 Fe 0.3 0
2+ Cu 0.72 63
Cu 69.1 3 2 2.23
65 ^ Cu 30.9 3 2 2.38
L
3 2
TABLE 2.3 P r o p e r t i e s o f ions which a r e u s u a l l y p r e s e n t i n r u t i l e ( a f t e r Kersen and Volger) .
REFERENCES
CHAPTER TWO
2.1 A Von Hippel, J . K a l n a j o and W.B.Westphal, 'Protons,Dipoles
and Charge C a r r i e r s i n R u t i l e ' , J . Phys.Chem.Solids, 23_ (1962)779.
2.2 P-Olof Andersson, E r i k K o l l b e r g , 'E.P.R. S p e c t r a o f I r o n Doped
R u t i l e ' , Phys.Rev. B 8 (1973) 4956.
2.3 J . K e r s s e n and J.Volger, 'E.P.R. Study of S l i g h t l y Reduced
R u t i l e C r y s t a l s ' , P h y s i c a 69 (1973) 535.
2.4 L. Low and E.L.Offenbacker, 'E.S.R. o f Magnetic Ions i n Complex
Oxides', Review of r e s u l t s i n R u t i l e . . . S o l i d S t a t e Phys.17
(1965) 135.
2.5 Shannon and P r e w i t t , Acta. C r y s t . B 25 (1969) 925.
2.6 M. Huntington and G. S u l l i v a n , Phys. Rev. L e t t . 14_ (1965) 177. 3+
2.7 D. C a r t e r & A. Okaya, 'E.P.R. o f Fe i n T i 0 2 ( R u t i l e ) '
Phys. Rev. 118 (1960) 1485.
2.8 F. A. Grant, ' P r o p e r t i e s o f R u t i l e ( T i O j ) ' i Rev.Mod.Phys. 31_
(1959) 646.
2.9 Cronemeyer, ' P r o p e r t i e s o f R u t i l e S i n g l e C r y s t a l s '
Phys. Rev. 87 (1965)! 876-86.
8
EXPERIMENTAL TECHNIQUES
3.1 ELECTRON SPIN RESONANCE
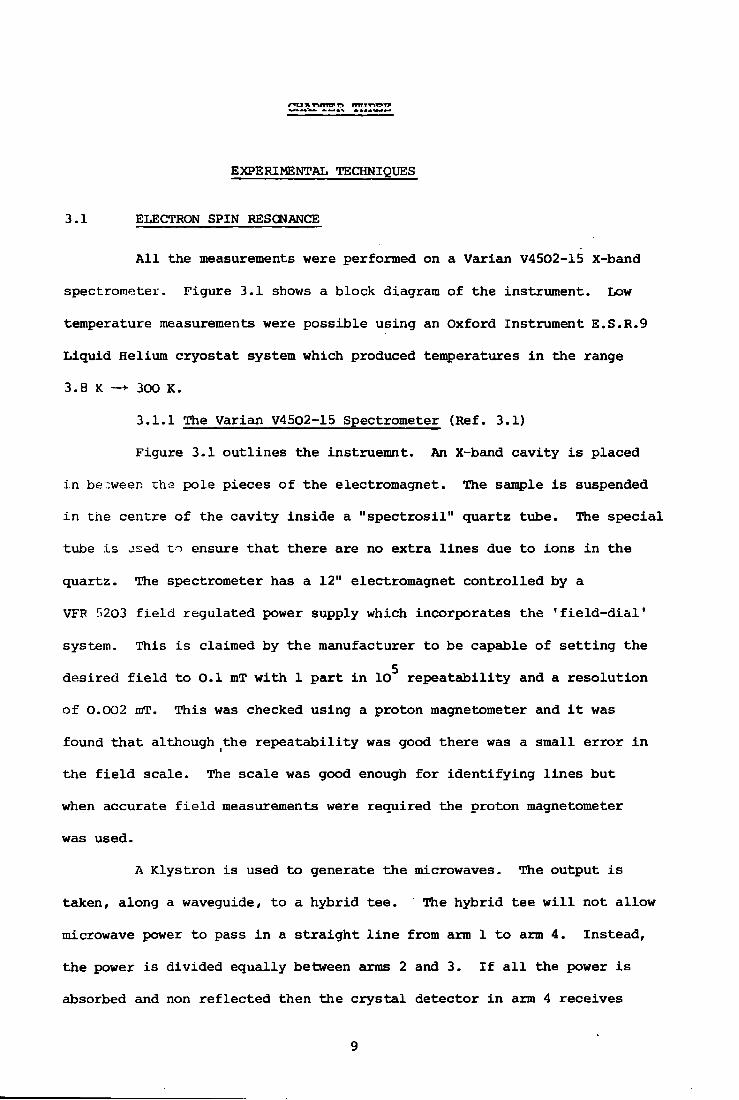
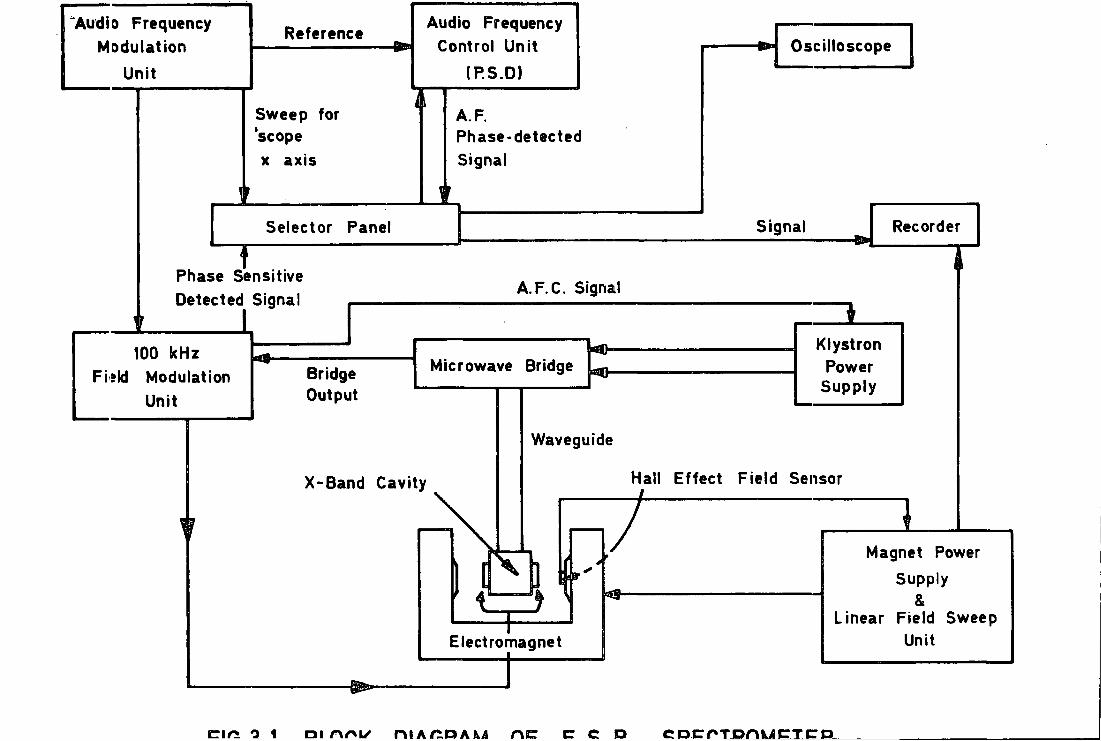
A l l the measurements were performed on a V a r i a n V4502-15 X-band
spectrometer. F i g u r e 3.1 shows a block diagram of the instrument. Low
temperature measurements were p o s s i b l e u s i n g an Oxford Instrument E.S.R.9
L i q u i d Helium c r y o s t a t system which produced temperatures i n the range
3.8 K —*• 300 K.
3.1.1 The V a r i a n V4502-15 Spectrometer (Ref. 3.1)
F i g u r e 3.1 o u t l i n e s the instruemnt. An X-band c a v i t y i s p l a c e d
i n between the pole p i e c e s o f t h e electromagnet. The sample i s suspended
i n the c e n t r e of the c a v i t y i n s i d e a " s p e c t r o s i l " q u a r t z tube. The s p e c i a l
tube i s used to ensure t h a t t h e r e are no e x t r a l i n e s due to i o n s i n the
q u a r t z . The spectrometer has a 12" electromagnet c o n t r o l l e d by a
VFR f>203 f i e l d r e g u l a t e d power supply which i n c o r p o r a t e s the ' f i e l d - d i a l '
system. T h i s i s claimed by the manufacturer to be capable of s e t t i n g the
d e s i r e d f i e l d to 0.1 mT w i t h 1 p a r t i n 10^ r e p e a t a b i l i t y and a r e s o l u t i o n
o f 0.002 mT. T h i s was checked u s i n g a proton magnetometer and i t was
found t h a t although the r e p e a t a b i l i t y was good t h e r e was a s m a l l e r r o r i n
the f i e l d s c a l e . The s c a l e was good enough f o r i d e n t i f y i n g l i n e s but
when a c c u r a t e f i e l d measurements were r e q u i r e d the proton magnetometer
was used.
A K l y s t r o n i s used to generate the microwaves. The output i s
taken, along a waveguide, to a h y b r i d t e e . The h y b r i d t e e w i l l not a l l o w
microwave power to pass i n a s t r a i g h t l i n e from arm 1 t o arm 4. I n s t e a d ,
t h e power i s d i v i d e d e q u a l l y between arms 2 and 3. I f a l l the power i s
absorbed and non r e f l e c t e d then the c r y s t a l d e t e c t o r i n arm 4 r e c e i v e s
9
Audio Frequency Modulation
Unit
Reference Audio Frequency
Control Unit
(P.S.D)
Sweep for 'scope x axis
A.F. Phase-detected Signal
Oscilloscope
Selector Panel Signal
1
Phase Sensitive Detected Signal , —
L
Recorder
T A . F . C . Signal
100 kHz Field Modulation
Unit
Bridge Output
Microwave Bridge
X-Band Cavity
Waveguide
Electromagnet
1 Klystron
Power Supply
Hall Effect Field Sensor
Magnet Power
Supply &
Linear Field Sweep Unit
n o o 1 r»i r\r\L/ r»i I ^ Q A M r\r~ c e o c r»crr»Tn/~\k4cr V t~ o
no power. Thus i t forms a bridge which becomes unbalanced when the
power absorbed i n one arm a l t e r s . Arm 3 i s connected to a r e s i s t i v e load
and arm 2 through an a t t e n u a t o r to the sample c a v i t y . I n p r a c t i c e t h e
c r y s t a l d e t e c t o r used produces l e s s n o i s e i f i t operates with a c o n s t a n t
b i a s so the bridge i s unbalanced, by a d j u s t i n g the load i n arm 3.
An A.F.C. system i s i n c o r p o r a t e d u s i n g a 10 kHz o s c i l l a t o r , w h i c h
modulates the K l y s t r o n power supply and the r e s u l t a n t 10 kHz modulation of
the frequency^ i s d e t e c t e d through a phase s e n s i t i v e d e t e c t o r . The phase
o f the d e t e c t e d s i g n a l depends on whether the K l y s t r o n c e n t r e frequency
i s above or below the absorption frequency of the c a v i t y and so an e r r o r
s i g n a l can be produced to c o r r e c t t h e K l y s t r o n frequency.
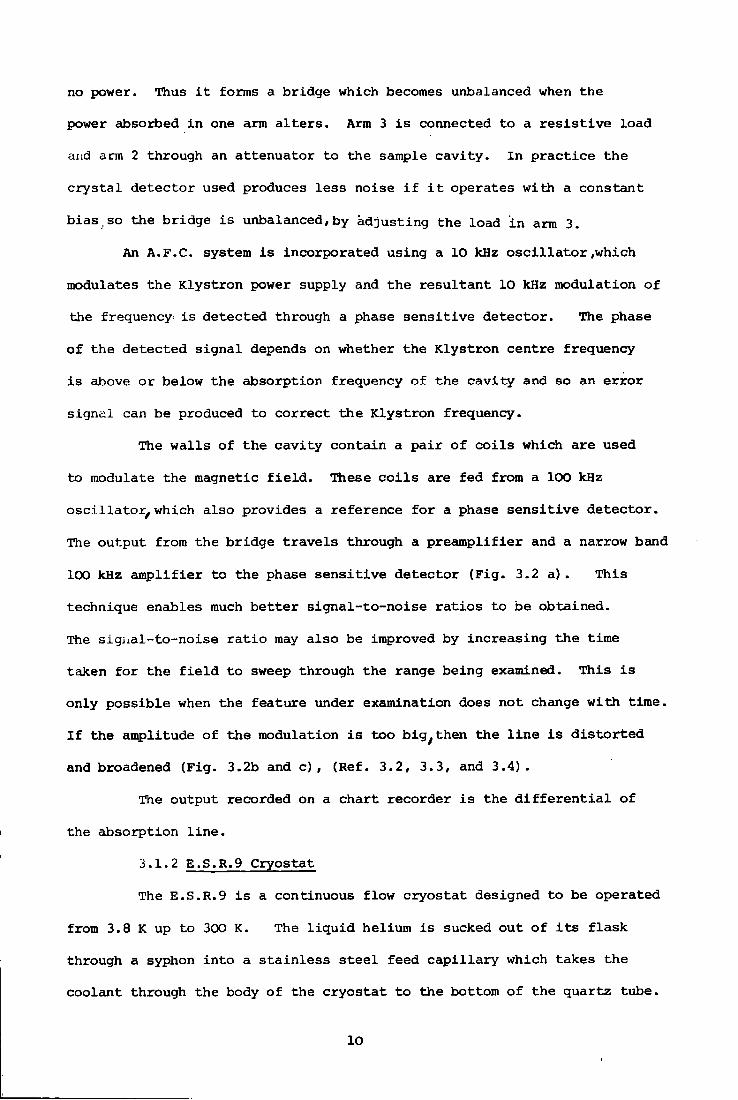
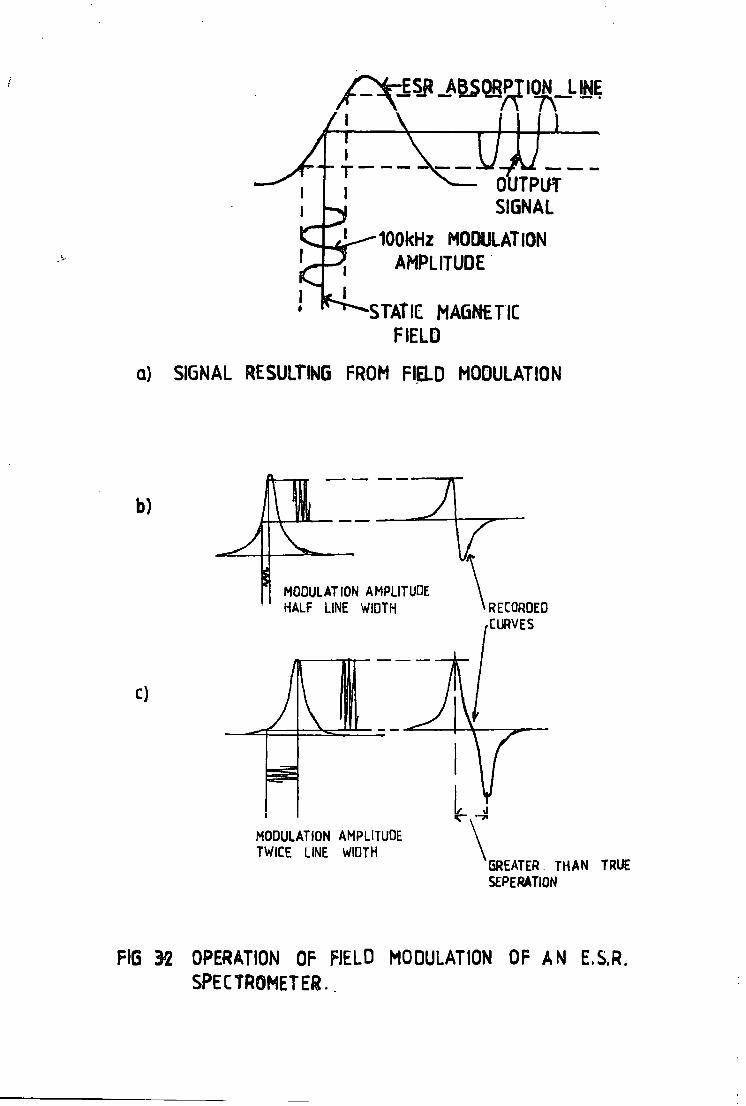
The w a l l s o f t h e c a v i t y c o n t a i n a p a i r o f c o i l s which are used
to modulate the magnetic f i e l d . These c o i l s are f e d from a 100 kHz
o s c i l l a t o r , w h i c h a l s o p r o v i d e s a r e f e r e n c e f o r a phase s e n s i t i v e d e t e c t o r .
The output from the b r i d g e t r a v e l s through a p r e a m p l i f i e r and a narrow band
100 kHz a m p l i f i e r to the phase s e n s i t i v e d e t e c t o r ( F i g . 3.2 a ) . T h i s
technique enables much b e t t e r s i g n a l - t o - n o i s e r a t i o s to be obtained.
The s i g n a l - t o - n o i s e r a t i o may a l s o be improved by i n c r e a s i n g t h e time
taken f o r the f i e l d t o sweep through the range being examined. T h i s i s
only p o s s i b l e when the f e a t u r e under examination does not change w i t h time.
I f the amplitude of the modulation i s too b i g / t h e n the l i n e i s d i s t o r t e d
and broadened ( F i g . 3.2b and c ) , (Ref. 3.2, 3.3, and 3.4).
The output recorded on a c h a r t r e c o r d e r i s the d i f f e r e n t i a l of
the a b s o r p t i o n l i n e .
3.1.2 E.S.R.9 C r y o s t a t
The E.S.R.9 i s a continuous flow c r y o s t a t designed to be operated
from 3.8 K up to 300 K. The l i q u i d helium i s sucked out o f i t s f l a s k
through a syphon i n t o a s t a i n l e s s s t e e l feed c a p i l l a r y which t a k e s the
c o o l a n t through the body of the c r y o s t a t t o the bottom of the q u a r t z tube.
lO
y _ ^ I S R „ABSQRPT IQN LINE 7N
N — OUTP OUTPUT SIGNAL i SIGNAL
100kHz MODULATION U - } AMPLITUDE
I ? J . —STATIC MAGNETIC
FIELD a) SIGNAL RESULTING FROM FIELD MODULATION
b)
MODULATION AMPLITUDE HALF LINE WIDTH
C)
MODULATION AMPLITUDE TWICE LINE WIDTH
RECORDED CURVES
GREATER THAN TRUE SEPERATION
FIG 32 OPERATION OF FIELD MODULATION OF AN E.S.R. SPECTROMETER. .
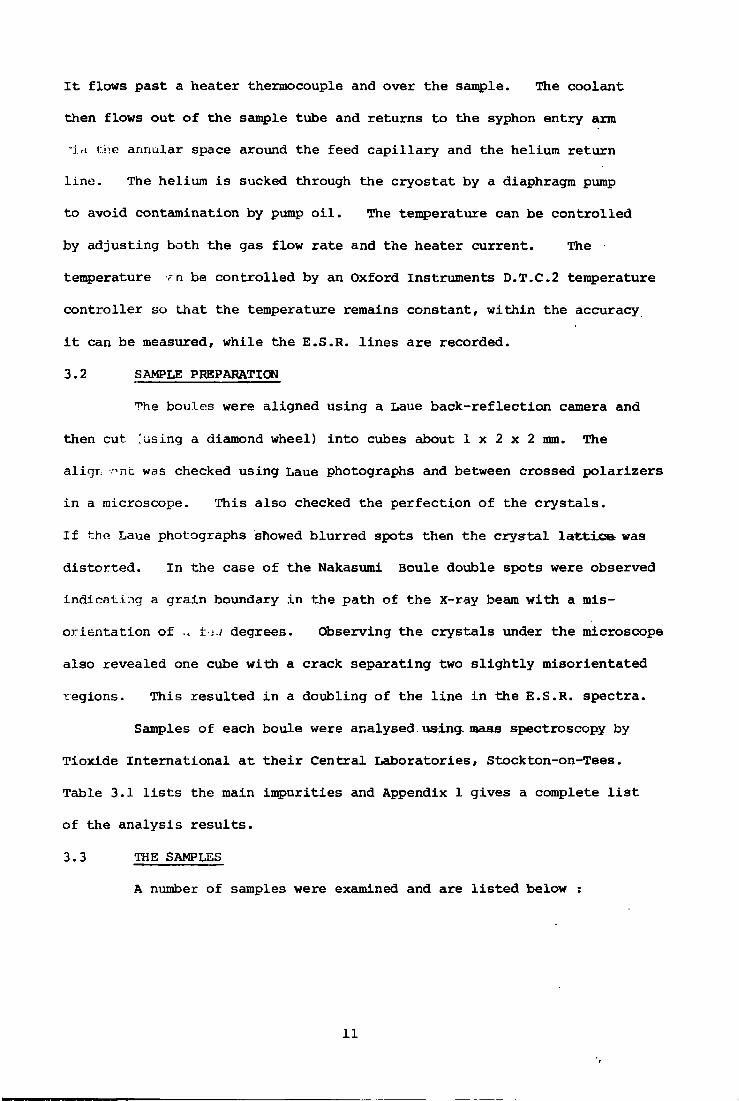
I t flows p a s t a h e a t e r thermocouple and over the sample. The c o o l a n t
then flows out o f the sample tube and r e t u r n s to the syphon e n t r y arm
ifi the annular space around the feed c a p i l l a r y and the helium r e t u r n
l i n e . The helium i s sucked through the c r y o s t a t by a diaphragm pump
to avoid contamination by pump o i l . The temperature can be c o n t r o l l e d
by a d j u s t i n g both the gas flow r a t e and the h e a t e r c u r r e n t . The
temperature m be c o n t r o l l e d by an Oxford Instruments D.T.C.2 temperature
c o n t r o l l e r so t h a t the temperature remains c o n s t a n t , w i t h i n the ac c u r a c y
i t can be measured, w h i l e the E.S.R. l i n e s a r e recorded.
3.2 SAMPLE PREPARATION
The boules were a l i g n e d u s i n g a Laue b a c k - r e f l e c t i o n camera and
then c u t !using a diamond wheel) i n t o cubes about 1 x 2 x 2 mm. The
a l i g n -^nc was checked u s i n g Laue photographs and between c r o s s e d p o l a r i z e r s
i n a microscope. T h i s a l s o checked the p e r f e c t i o n o f the c r y s t a l s .
I f the Laue photographs showed b l u r r e d spots then the c r y s t a l l a t t i c e : was
d i s t o r t e d . I n the ca s e o f the Nakasumi Boule double spots were observed
i n d i c a t i n g a g r a i n boundary i n the path of the X-ray beam w i t h a mis-
o r i e n t a t i o n of t :.i degrees. Observing t h e c r y s t a l s under the microscope
a l s o r e v e a l e d one cube w i t h a c r a c k s e p a r a t i n g two s l i g h t l y m i s o r i e n t a t e d
r e g i o n s . T h i s r e s u l t e d i n a doubling of the l i n e i n the E.S.R. s p e c t r a .
Samples of each boule were a n a l y s e d using, mass spectroscopy by
T i o x i d e I n t e r n a t i o n a l a t t h e i r C e n t r a l L a b o r a t o r i e s , Stockton-on-Tees.
Table 3.1 l i s t s the main i m p u r i t i e s and Appendix 1 g i v e s a complete l i s t
of the a n a l y s i s r e s u l t s .
3.3 THE SAMPLES
A number of samples were examined and are l i s t e d below :
11
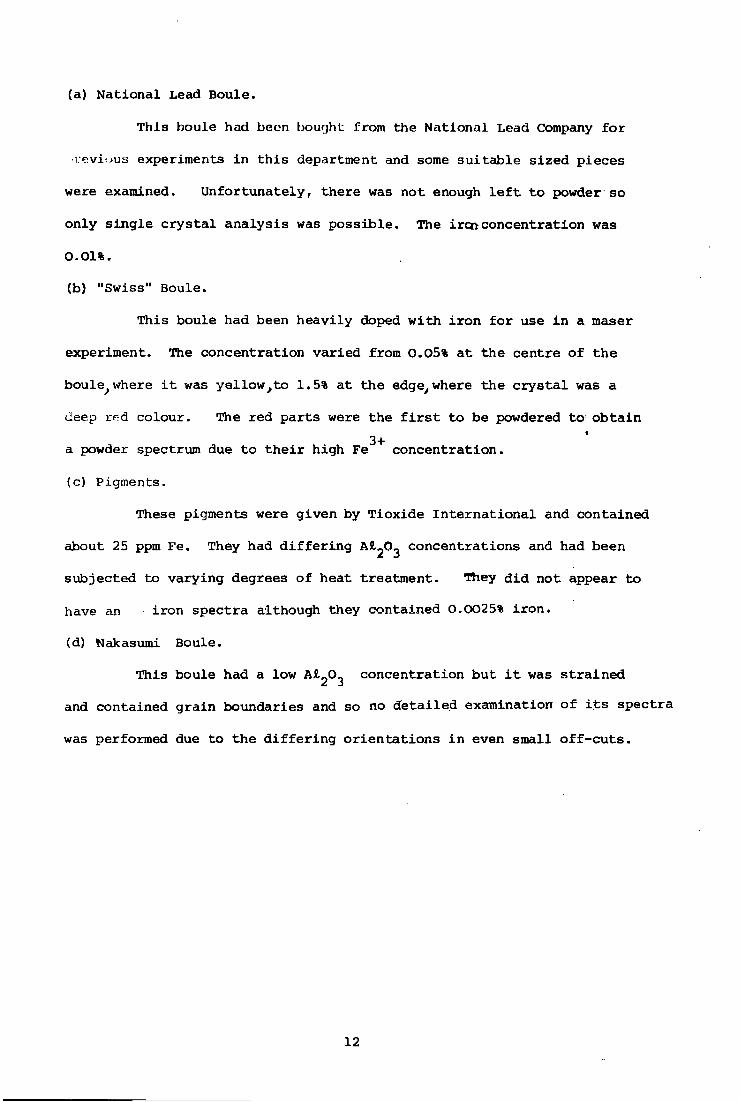
(a) N a t i o n a l Lead Boule.
T h i s boule had been bought from the N a t i o n a l Lead Company f o r
•L'eviuus experiments i n t h i s department and some s u i t a b l e s i z e d p i e c e s
were examined. Un f o r t u n a t e l y , t h e r e was not enough l e f t t o powder so
only s i n g l e c r y s t a l a n a l y s i s was p o s s i b l e . The iron c o n c e n t r a t i o n was
0.01%.
(b) "Swiss" Boule.
T h i s boule had been h e a v i l y doped w i t h i r o n f o r use i n a maser
experiment. The c o n c e n t r a t i o n v a r i e d from 0.05% a t the c e n t r e of t h e
boule^where i t was y e l l o w ^ t o 1.5% a t the edge ywhere the c r y s t a l was a
deep rf:d c o l o u r . The red p a r t s were the f i r s t to be powdered t o o b t a i n
a powder spectrum due t o t h e i r high Fe c o n c e n t r a t i o n .
(c) Pigments.
These pigments were g i v e n by T i o x i d e I n t e r n a t i o n a l and contained
about 25 ppm Fe. They had d i f f e r i n g AS^O^ c o n c e n t r a t i o n s and had been
s u b j e c t e d to v a r y i n g degrees of heat treatment. They d i d not appear to
have an i r o n s p e c t r a although they contained 0.0025% i r o n .
(d) Nakasumi Boule.
T h i s boule had a low A^2°3 c o n c e n t r a t i o n but i t was s t r a i n e d
and contained g r a i n boundaries and so no d e t a i l e d examination o f i t s s p e c t r a
was performed due to the d i f f e r i n g o r i e n t a t i o n s i n even s m a l l o f f - c u t s .
12
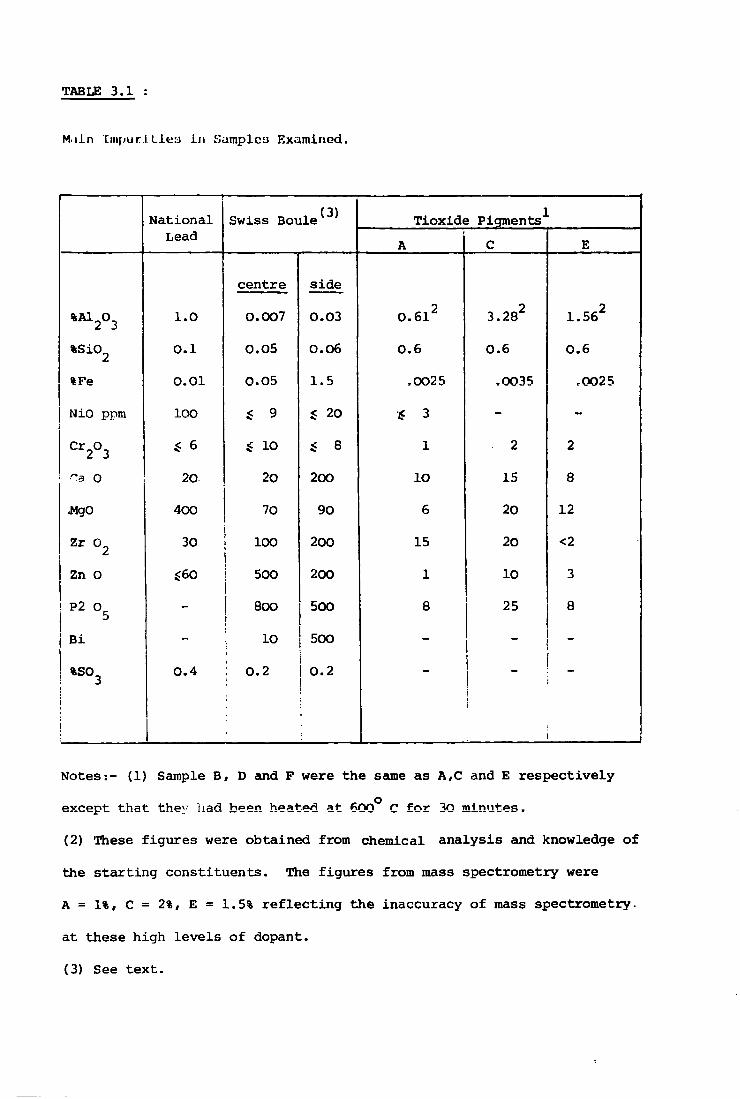
TABLE 3.1 :
M.iln I n i f i u r J .Lieu i n Samples Examined.
N a t i o n a l (3) Swiss Boule T i o x i d e Pigments^
Lead A C E
c e n t r e s i d e
% A1 20 3 1.0 0.007 0.03 0.61 2 3.28 2 1.56 2
% s i o 2 0.1 0.05 0.06 0.6 0.6 0.6
%Fe 0.01 0.05 1.5 .0025 .0035 .0025
NiO ppm loo $ 9 $ 20 $ 3 - -Cr O 2 3 $ 6 $ io i 8 1 2 2
"a 0 20 20 200 lO 15 8
MgO 400 70 90 6 20 12
z r 0 2 30 > 100 i
200 15 20 <2
Zn 0 $60 I | 500 |
200 1 10 3
! P2 0 5 - 1 | BOO 500 8 25 8
B i - io 500 - - -% s o 3
i i
0.4 0.2 i 0.2 l
t
i
i
Notes:- (1) Sample B, D and F were the same as A,C and E r e s p e c t i v e l y
except t h a t t h e v itad been heated a t 600^ C f o r 30 minutes.
(2) These f i g u r e s were obtained from chemical a n a l y s i s and knowledge of
the s t a r t i n g c o n s t i t u e n t s . The f i g u r e s from mass spectrometry were
A = 1%, C = 2%, E = 1.5% r e f l e c t i n g the i n a c c u r a c y o f mass spectrometry,
a t t h e s e high l e v e l s o f dopant.
(3) See t e x t .
REFERENCES
CHAPTER THREE
3.1 V a r i a n V4502 E.P.R. Spectrometer Manual.
3.2 Spectroscopy a t Microwave and Radio F r e q u e n c i e s .
D. Ingram, pub. Butterworths.
3.3 E l e c t r o n S p i n Resonance, Poole, I n t e r s c i e n c e 1977.
3.4 H.M. Assenheim, I n t r o d u c t i o n t o E.S.R.
Adam-Hilger 1966.
13
SINGLE CRYSTAL E.S.R. OF Fe/TiO
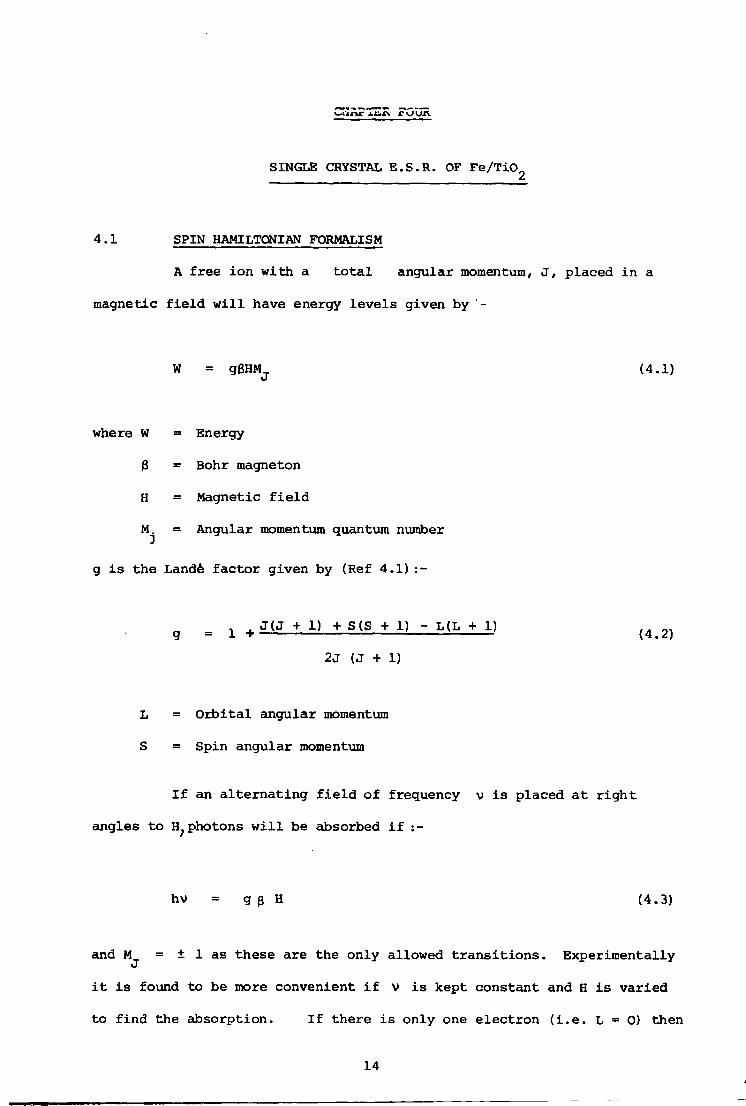
4.1 SPIN HAMILTONIAN FORMALISM
A f r e e i o n w i t h a t o t a l angular momentum, J , p l a c e d i n a
magnetic f i e l d w i l l have energy l e v e l s given by -
W = gfJHM (4.1)
where W = Energy
3 = Bohr magneton
H = Magnetic f i e l d
M_. = Angular momentum quantum number
g i s the Lande f a c t o r given by (Ref 4 . 1 ) : -
g = 1 , J ( J + 1) + S ( S + 1) - L ( L + 1)
2 j ( J + 1)
L = O r b i t a l angular momentum
S = Spin angular momentum
I f an a l t e r n a t i n g f i e l d o f frequency v i s p l a c e d a t r i g h t
angles to H ; photons w i l l be absorbed i f :-
hv = g 3 H (4.3)
and M = + 1 as t h e s e a r e the only allowed t r a n s i t i o n s . E x p e r i m e n t a l l y J
i t i s found to be more convenient i f v i s kept c o n s t a n t and H i s v a r i e d
to f i n d the abs o r p t i o n . I f t h e r e i s only one e l e c t r o n ( i . e . L = 0) then
14
g = 2.00229. The d i f f e r e n c e from 2 i s due to s m a l l c o r r e c t i o n s which
can be c a l c u l a t e d u s i n g quantum el e c t r o d y n a m i c s .
When a paramagnetic i o n i s p l a c e d i n a s o l i d i t w i l l i n t e r a c t
w i t h neighbouring i o n s i n one, or both, of two ways :
(a) I n t e r a c t i o n s between the magnetic d i p o l e s
(b) I n t e r a c t i o n s between the paramagnetic ion and neighbouring
diamagnetic i o n s .
I n doped r u t i l e the d i s t a n c e s between the paramagnetic ions
w i l l , i n g e n e r a l , be c o n s i d e r a b l y l a r g e r than t h e d i s t a n c e between
paramagnetic ions and diamagnetic i o n s . Thus the predominant i n t e r
a c t i o n i s t h e second. The charge of the diamagnetic i o n s e t s up s t r o n g
i n t e r n a l f i e l d s which, to a good approximation, can be c o n s i d e r e d to be
s t a t i c . T h i s i n t e r n a l f i e l d i s c a l l e d the c r y s t a l or l i g a n d f i e l d .
The c r y s t a l f i e l d has a l a r g e - e f f e c t on the i o n s . F i r s t l y , i t
l i f t s the degeneracy of the ground s t a t e forming a number of new l e v e l s .
T h i s i s c a l l e d the z e r o - f i e l d s p l i t t i n g . The s p l i t t i n g , and number of
components, depends on the symmetry and s t r e n g t h of the c r y s t a l f i e l d .
I n the 3d, o r i r o n group, the c r y s t a l f i e l d i s of moderate s t r e n g t h
being l a r g e r than the s p i n - o r b i t coupling but s m a l l e r than t h e Coulomb
i n t e r a c t i o n . The c r y s t a l f i e l d changes the resonance c o n d i t i o n and
absorption can take p l a c e a t s e v e r a l v a l u e s of f i e l d . T h i s i s c a l l e d
the f i n e s t r u c t u r e . Other i n t e r a c t i o n s which can e f f e c t t h e energy
l e v e l s i n c l u d e t h e h v p e r f i n e s t r u c t u r e which i s due to i n t e r a c t i o n s
between the e l e c t r o n s and the nucleus w i t h a non-zero n u c l e a r s p i n .
A 'g* v a l u e can be d e f i n e d by eqn. 4.3. I n g e n e r a l t h i s 'g '
value w i l l be d i f f e r e n t from th e Lande s p l i t t i n g f a c t o r and to minimize
confusion i s c a l l e d t h e s p e c t r o s c o p i c s p l i t t i n g f a c t o r . As the c r y s t a l
f i e l d has a c u r t a i n symmetry,the 'g' v a l u e w i l l -not be i s o t r o p i c and
i n the most g e n e r a l c a s e "g" can be r e p r e s e n t e d by g ^ ^ w h i c h can be
15
c a l l e d , r a t h e r l o o s e l y , a t e n s o r .
The behaviour o f the energy l e v e l s i s c o n v e n t i o n a l l y r e p r e s e n t e d
by a Spin Hamiltonian," t h i s i n c l u d e s terms which a re s p i n dependent
s i n c e we a r e only i n t e r e s t e d i n the d i f f e r e n c e s between the l e v e l s .
A Spin Hamiltonian can be d e r i v e d by c o n s i d e r i n g the d i f f e r e n t
i n t e r a c t i o n s and summing v a r i o u s c o n t r i b u t i o n s . These i n t e r a c t i o n s
are)—Coulombic f o r c e s between both e l e c t r o n s and e l e c t r o n s and the
n u c l e u s , a l s o between e l e c t r o n s w i t h the c r y s t a l f i e l d , s p i n - o r b i t and
s p i n - s p i n i n t e r a c t i o n s , the Zeeman term which i s r e s p o n s i b l e f o r p a r a
magnetism, e l e c t r o n n u c l e a r f o r c e s , a n u c l e a r c o n t r i b u t i o n and a term
due to diamagnetism (Ref 4.2)The Coulombic f o r c e s a r e independent o f
f i e l d and can be n e g l e c t e d , the Zeeman term i s the dominant one which
concerns us. The c r y s t a l f i e l d g i v e s r i s e to the f i n e s t r u c t u r e and i s
a l s o very important i n r u t i l e . The other terms r e p r e s e n t ^mdll c o r r e c
t i o n s and - can .be ignored-. The n u c l e a r spin,.of- i r o n i s 0 (TdLle 2.3},
and so there a r e no hyperfrne- conteUniifcxcmsr. A reasonably
g e n e r a l Spin Hamiltonian, which r e p r e s e n t s the observed energy l e v e l s ,
i s (Refs 4.2,4.3).
but n e g l e c t s those which only add a cons t a n t to the energy o f the l e v e l s ,
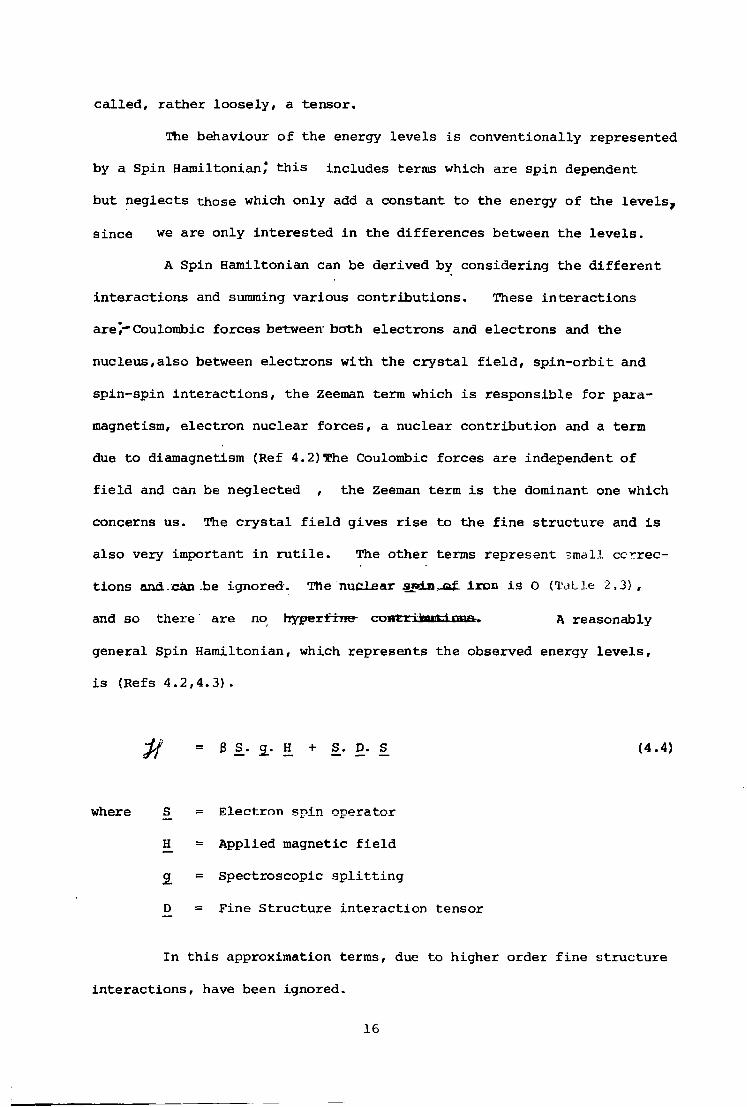
3 S. g. H + S. D. S (4.4)
where S E l e c t r o n s p i n operator
H = A p p l i e d magnetic f i e l d
g_ = S p e c t r o s c o p i c s p l i t t i n g
D = F i n e S t r u c t u r e i n t e r a c t i o n t e n s o r
I n t h i s approximation terms, due to hi g h e r order f i n e s t r u c t u r e
i n t e r a c t i o n s , have been ignored.
16
4.2 THE F e 3 + ION, ( S5/2 , 3d 5)
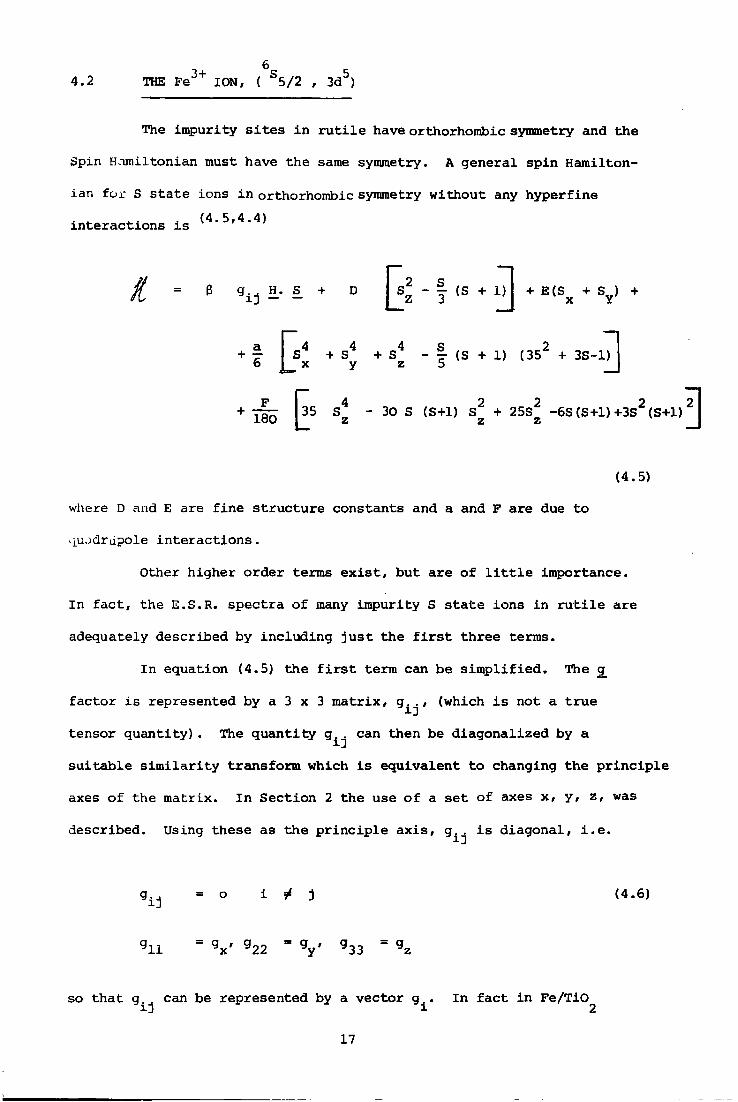
The i m p u r i t y s i t e s i n r u t i l e have orthorhombic symmetry and the
Spin Hamiltonian must have the same symmetry. A g e n e r a l s p i n Hamilton-
ia n f o r S s t a t e ions i n orthorhombic symmetry without any h y p e r f i n e (4.5,4.4)
i n t e r a c t i o n s i s
& ^ i j »• £ + D J^S2 - | (S + 1)J + E ( S x + S y ) +
[4 4 4 <5 2 I S + S + S - §- (S + 1) (35 + 3S-1) x y z 5 _ J
+ l _j_ r 180 £
4 2 2 2 35 S - 30 S (S+l) S + 25S -6S(S+1)+3S (S+l) z z z
(4.5)
where D and E are f i n e s t r u c t u r e c o n s t a n t s and a and F a r e due to
^ujdrupole i n t e r a c t i o n s .
Other h i g h e r o r d e r terms e x i s t , but a r e of l i t t l e importance.
I n f a c t , the E.S.R. s p e c t r a of many impurity S s t a t e i o n s i n r u t i l e a r e
adequately d e s c r i b e d by i n c l u d i n g j u s t the f i r s t t h r e e terms.
I n equation (4.5) t h e f i r s t term can be s i m p l i f i e d . The g_
f a c t o r i s represented by a 3 x 3 m a t r i x , g^ , (which i s not a t r u e
t e n s o r q u a n t i t y ) . The q u a n t i t y g ^ can then be d i a g o n a l i z e d by a
s u i t a b l e s i m i l a r i t y t r a n s f o r m which i s e q u i v a l e n t t o changing the p r i n c i p l e
axes o f the matrix. I n S e c t i o n 2 the use o f a s e t of axes x, y, z, was
d e s c r i b e d . Using t h e s e as t h e p r i n c i p l e a x i s , g _. i s d i a g o n a l , i . e .
g ± j = o i ? j (4.6)
g l l = V 9 2 2 = V 9 3 3 = gz
so t h a t g.. can be r e p r e s e n t e d by a v e c t o r g.. I n f a c t i n Fe/TiO ID i 2
17
g = g = g so t h a t g. can become a numerical c o n s t a n t (Ref.. 4.6) . x v z 1
E x a c t d i a g o n a l i z a t i o n of (4.5) would be very d i f f i c u l t t o
(irform. To determine the angular v a r i a t i o n of the l e v e l s computer
methods a r e used.
4+
I r o n , i n a t r a v a l e n t s t a t e , s u b s t i t u t e s f o r T i as shown i n
F i g 2.3. As t h e r e are two s i t e s d i f f e r i n g only by a r o t a t i o n of 90°
about the y a x i s , the E.S.R. s p e c t r a e x h i b i t s , i n g e n e r a l , two l i n e s f o r
each t r a n s i t i o n .
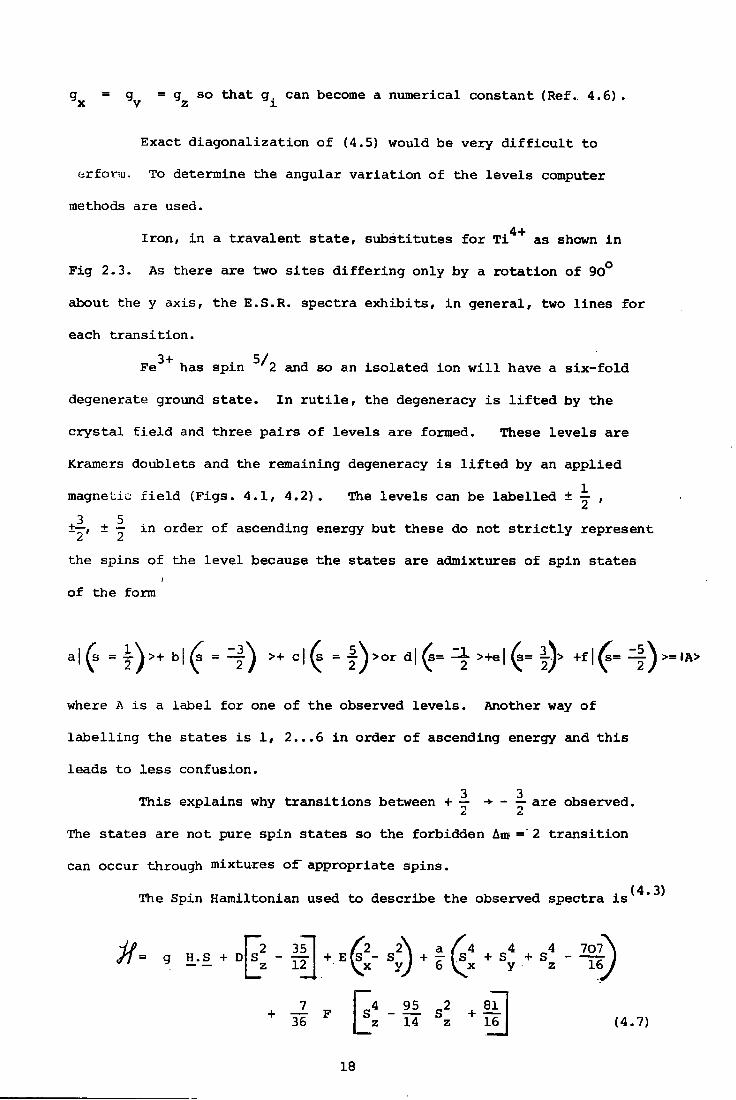
F e ^ + has s p i n 5^2 and so an i s o l a t e d i o n w i l l have a s i x - f o l d
degenerate ground s t a t e . I n r u t i l e , the degeneracy i s l i f t e d by the
c r y s t a l f i e l d and t h r e e p a i r s o f l e v e l s a r e formed. These l e v e l s a r e
Kramers doublets and the remaining degeneracy i s l i f t e d by an a p p l i e d
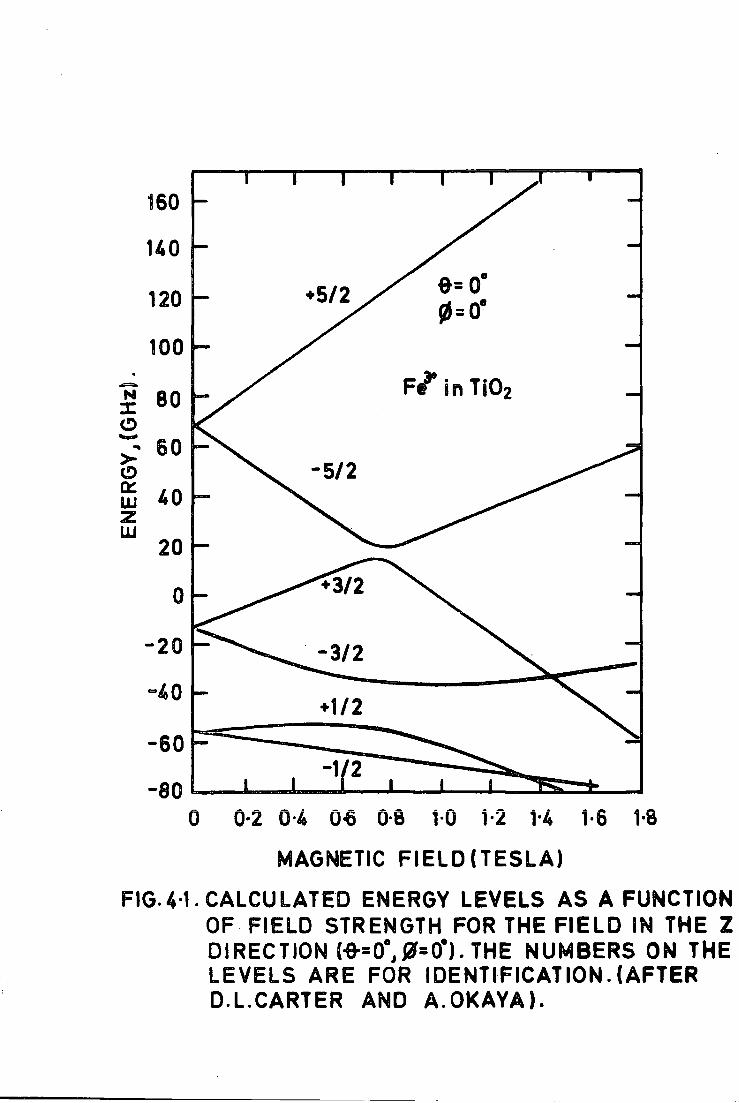
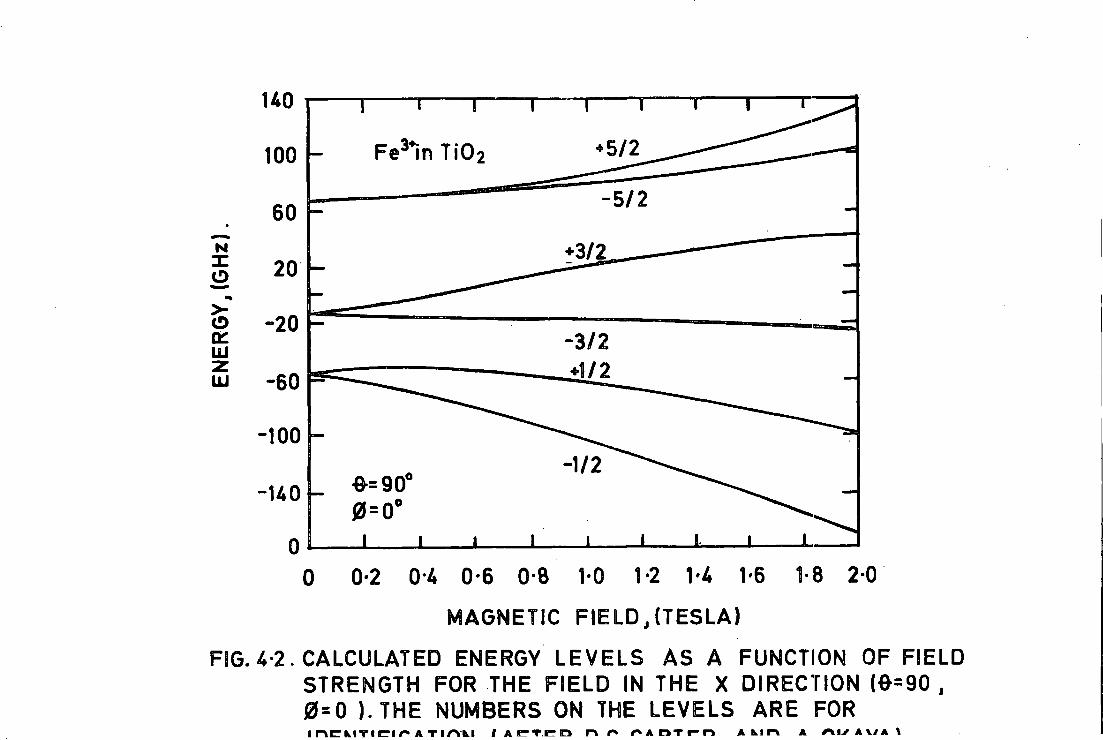
magnetic f i e l d ( F i g s . 4.1, 4.2). The l e v e l s can be l a b e l l e d ± -|- ,
±^ t ± - j i n order of ascending energy but these do not s t r i c t l y r e p r e s e n t
the s p i n s of the l e v e l because t h e s t a t e s a r e admixtures of s p i n s t a t e s
of the form
a | ( s - £ ) > + b | ( a > + c | ( s = f ) > o r d | ( s = ^ > + e | ( s = | ) > = % ) >
where A i s a l a b e l f o r one of the observed l e v e l s . Another way of
l a b e l l i n g the s t a t e s i s 1, 2...6 i n order o f ascending energy and t h i s
l e a d s to l e s s c o n fusion. 3 3
T h i s e x p l a i n s why t r a n s i t i o n s between + — -»• - — a r e observed.
The s t a t e s a re not pure s p i n s t a t e s so the forbidden Am ='2 t r a n s i t i o n
can occur through mixtures o f appropriate s p i n s . (4 3)
The Spin Hamiltonian used to d e s c r i b e the observed s p e c t r a i s
q 2 f*k z + 16 (4.7)
18
I 1
160
U 0
0= 0 +5/2 120 0 = 0
100
Fe in T i0 2 K 80
60 5/2
a: w 40
20
3/2
40 •1/2
60 1/2
80 0 0-2 0-4 0-6 0-8 10 1-2 K 1-6 1-8
MAGNETIC F I E L D ( T E S L A )
FIG.4-1. CALCULATED ENERGY L E V E L S AS A FUNCTION OF FIELD STRENGTH FOR THE F I E L D IN THE Z DIRECTION {•6-=0°J0=0°). THE NUMBERS ON THE L E V E L S A R E FOR IDENTIFICATION.(AFTER D.L.CARTER AND A.OKAYA) .
uo •5/2 F e J i n T 1 O 2 100
5/2 60
•3/2 N 20
20 3/2 H I
60 UJ
100 1/2
0=90° UO 0=0°
0 I 0 » 1 ' 1 L 1 I L 1 1 — _ J 0 0-2 OA 0-6 0-8 1-0 1-2 1-4 1-6 1-8 20
MAGNETIC FIELD j (TESLA)
FIG. 4-2. CALCULATED ENERGY L E V E L S AS A FUNCTION OF FIELD STRENGTH FOR THE F IELD IN THE X DIRECTION (0=90, 0=0 ). THE NUMBERS ON THE L E V E L S ARE FOR inckiTiei/* A T I A I I « APT.ro rv ^ A r» v r- i-» A un A A I / AV;A \
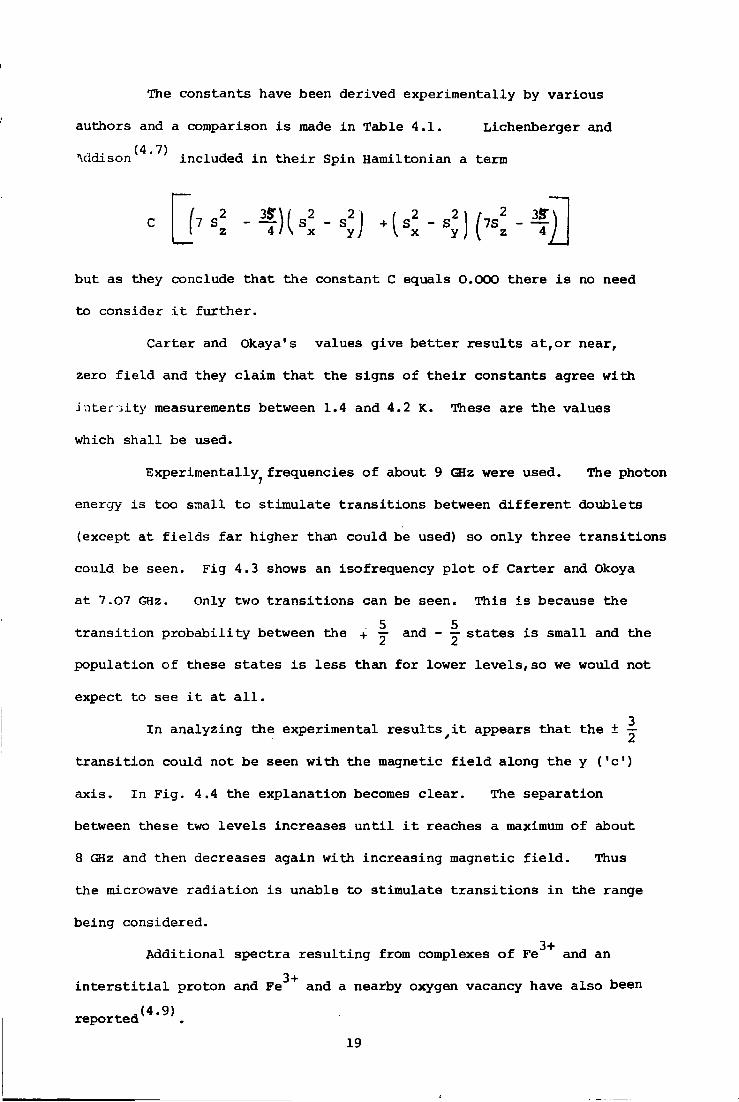
The constants have been derived experimentally by various
authors and a comparison i s made i n Table 4.1. Lichenberger and (4.7)
Vidison ' included i n t h e i r Spin Hamiltonian a term
but as they conclude t h a t t h e constant C equals 0.000 there i s no need
t o consider i t f u r t h e r .
Carter and Okaya's values g i v e b e t t e r r e s u l t s a t , o r near,
zero f i e l d and they c l a i m t h a t the signs o f t h e i r constants agree w i t h
• i n t e r c i t y measurements between 1.4 and 4.2 K. These are t h e values
which s h a l l be used.
Experimentally^ frequencies o f about 9 GHz were used. The photon
energy i s too small t o s t i m u l a t e t r a n s i t i o n s between d i f f e r e n t doublets
(except a t f i e l d s f a r higher than could be used) so only t h r e e t r a n s i t i o n s
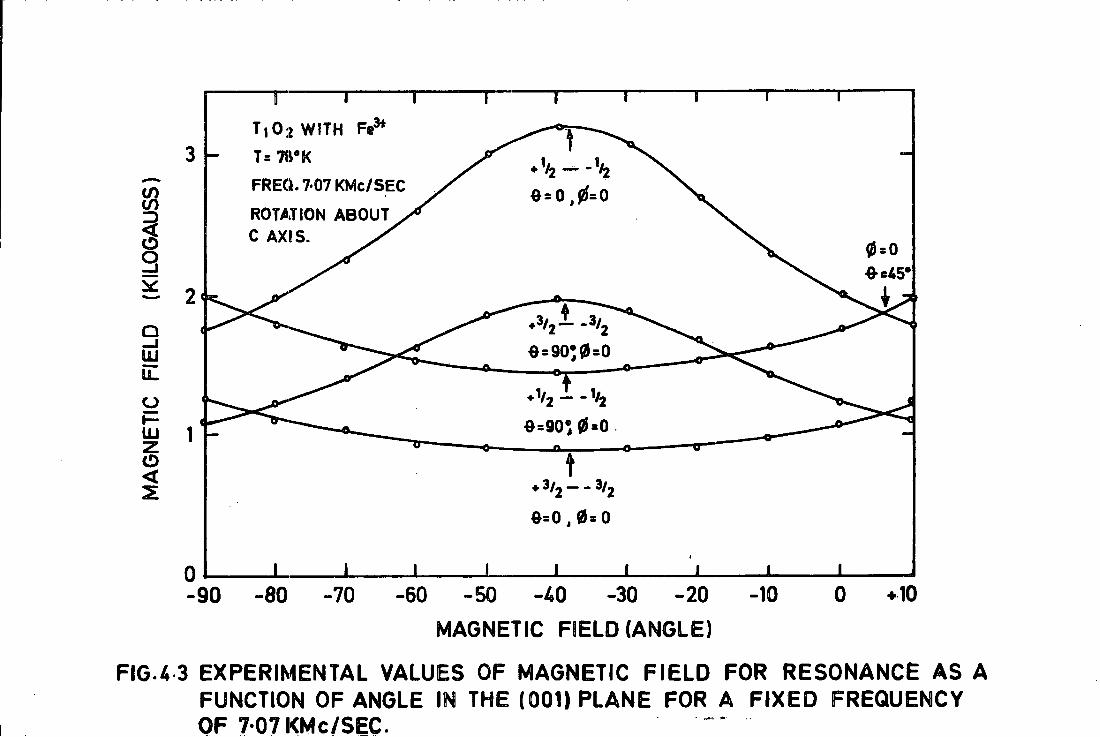
could be seen. Fig 4.3 shows an isofrequency p l o t o f Carter and Okoya
a t 7.07 GHz, Only two t r a n s i t i o n s can be seen. This i s because the
t r a n s i t i o n p r o b a b i l i t y between the + y and - ^ s t a t e s i s small and the
p o p u l a t i o n o f these s t a t e s i s less than f o r lower l e v e l s , so we would not
expect t o see i t a t a l l . 3
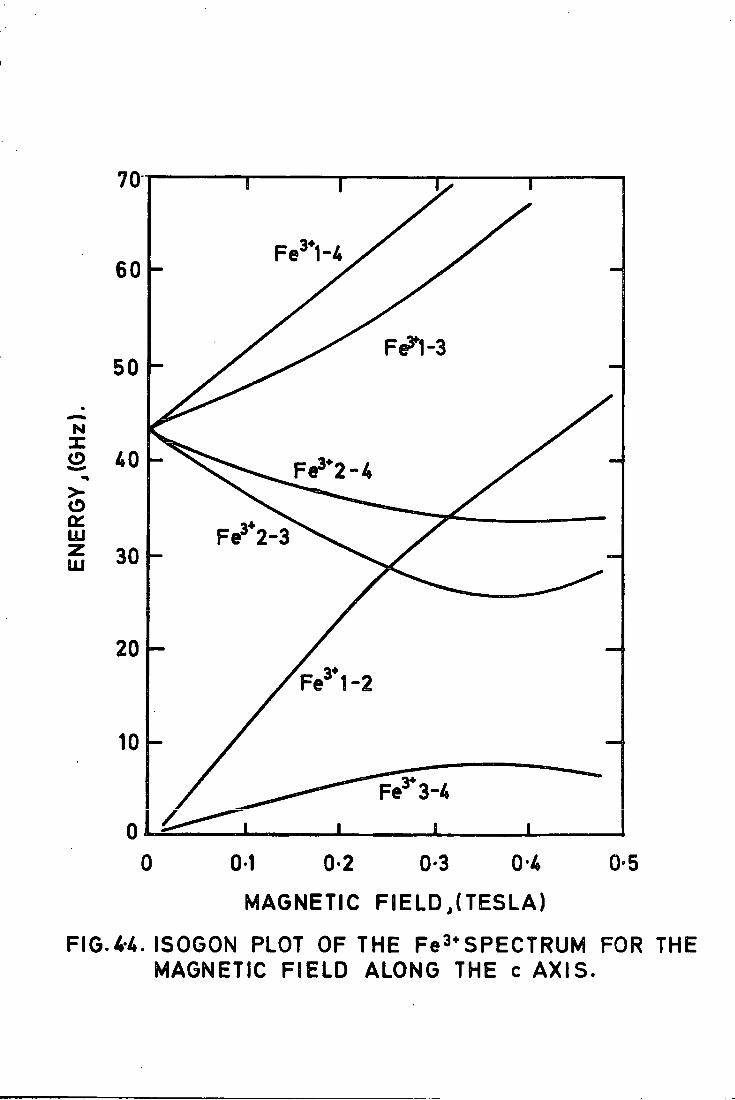
I n analyzing the experimental r e s u l t s y i t appears t h a t the ± —
t r a n s i t i o n could not be seen w i t h the magnetic f i e l d along t h e y ('c')
a x i s . I n F i g . 4.4 the explanation becomes c l e a r . The separation
between these two l e v e l s increases u n t i l i t reaches a maximum o f about
8 GHz and then decreases again w i t h i n c r e a s i n g magnetic f i e l d . Thus
the microwave r a d i a t i o n i s unable t o s t i m u l a t e t r a n s i t i o n s i n the range
being considered.
A d d i t i o n a l spectra r e s u l t i n g from complexes o f Fe"*+ and an
i n t e r s t i t i a l proton and Fe^ + and a nearby oxygen vacancy have also been reported
19
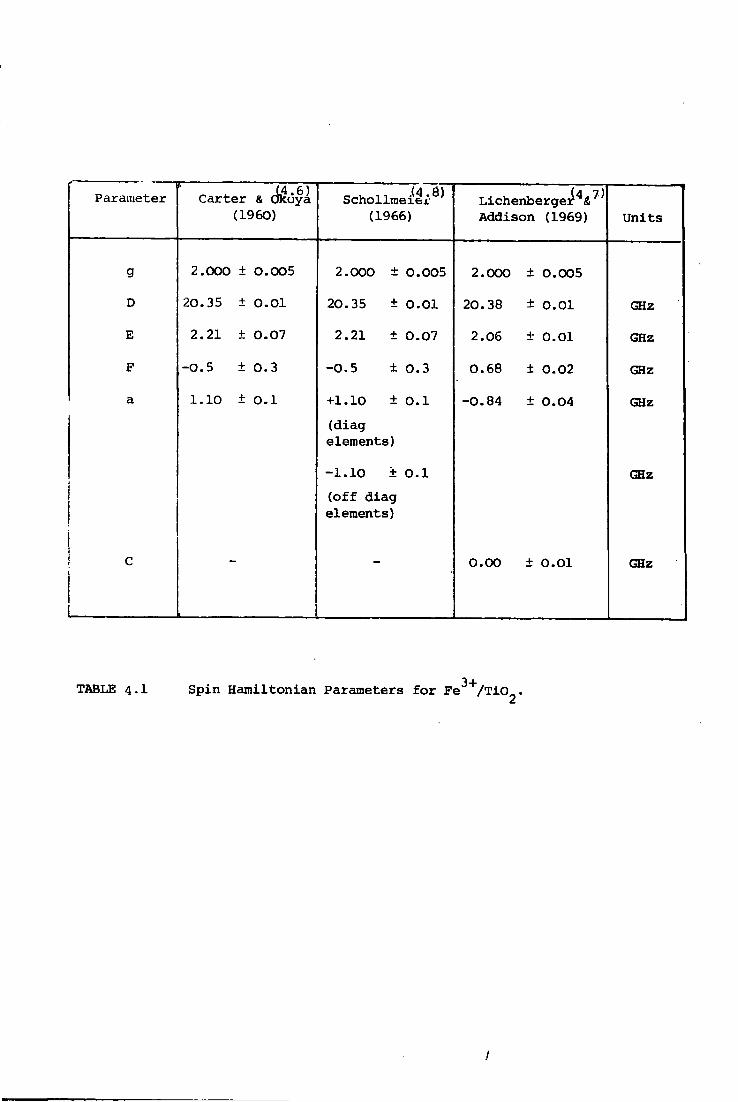
Parameter Carter & cfituya (1960)
„ , .(4.8) Schollmeier (1966)
(4 7) Lichenberger & Addison (1969) Units
g 2.000 ± 0.005 2.000 ± 0.005 2.000 ± 0.005
D 20.35 ± 0.01 20.35 ± O.Ol 20.38 ± 0.01 GHz
E 2.21 ± 0.07 2.21 ± 0.07 2.06 ± 0.01 GHz
F -0.5 ±0.3 -0.5 ± 0.3 0.68 ± 0.02 GHz
a 1.10 ± 0.1 +1.10 ± 0.1 -0.84 ± 0.04 GHz (dlag elements)
-1.10 ± 0.1 GHz ( o f f dlag elements)
C - - 0.00 ± 0.01 GHz
TABLE 4.1 Spin Hamiltonian Parameters f o r Fe /TiO
34 T , 0 2 WITH Fe
T= 78° K 1 FREQ.7-07 KMc/SEC t o ROTATION ABOUT C AXIS.
0 = 0 ^45° * X 3/
e=9O"0=o
O=90e. 0=0 UJ a —
t 3/ • 3/
0 = 0 , 0=0
•10 40 30 20 10 80 60 50 90 70 MAGNETIC FIELD (ANGLE)
FIG.4 3 EXPERIMENTAL VALUES OF MAGNETIC F I E L D FOR RESONANCE AS A FUNCTION OF ANGLE IN THE (001) PLANE FOR A F IXED FREQUENCY OF 7 07 KMc/SEC.
70
3* Fe* -4 60
FeH-3 50
N
o 40 F e J T 2 - 4
Fe" 2-3 LU 30 LJJ
i
20 Fe" 1 -2
10
Fe J 3-4 I
01 0-4 0-3
MAGNETIC F I E L D . (TESLA)
FIG.4-4. ISOGON PLOT OF THE F e 3 + S P E C T R U M FOR THE MAGNETIC F I E L D ALONG THE c A X I S .
4 . 3 RESULTS
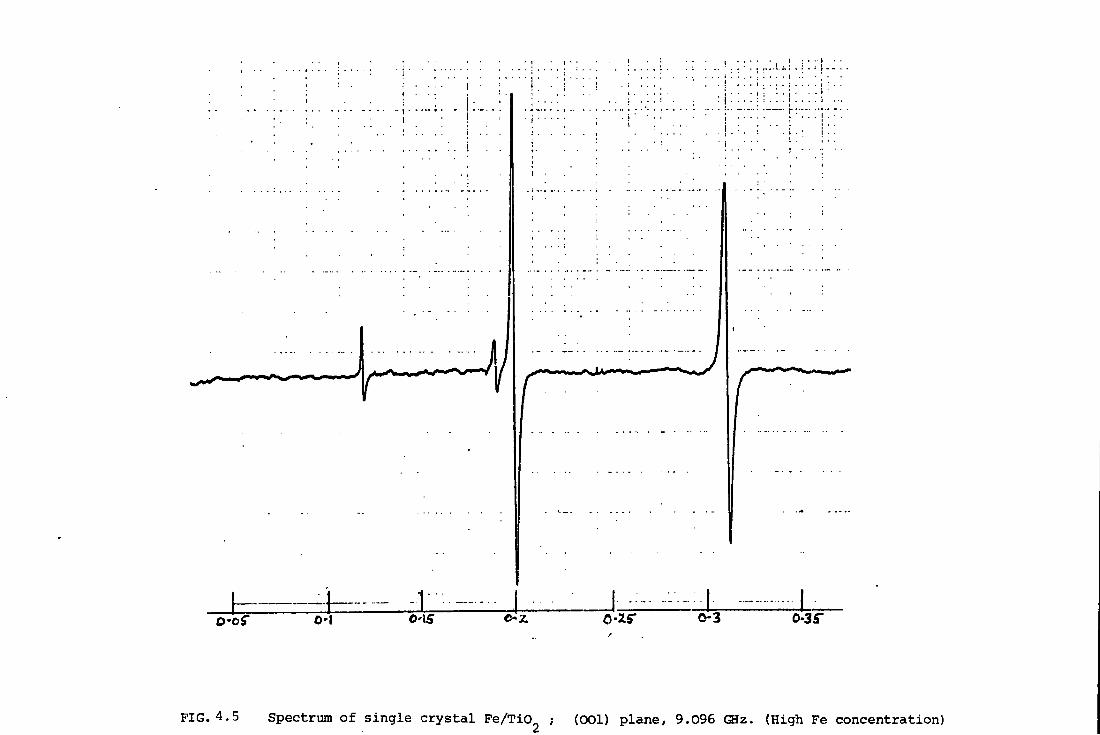
Several s i n g l e c r y s t a l specimens were examined and the r e s u l t i n e r
spectra i n v e s t i g a t e d . Figures 4.5 and 4.6 are from the same c r y s t a l
w i t h the magnetic f i e l d a t r i g h t angles. This sample, the Swiss Boule,
had a l a r g e i r o n c o n c e n t r a t i o n o f the order o f a few per cent. I n
Figure 4.5 the f o u r l i n e s can be c l e a r l y seen, the two l a r g e r l i n e s are 1 3
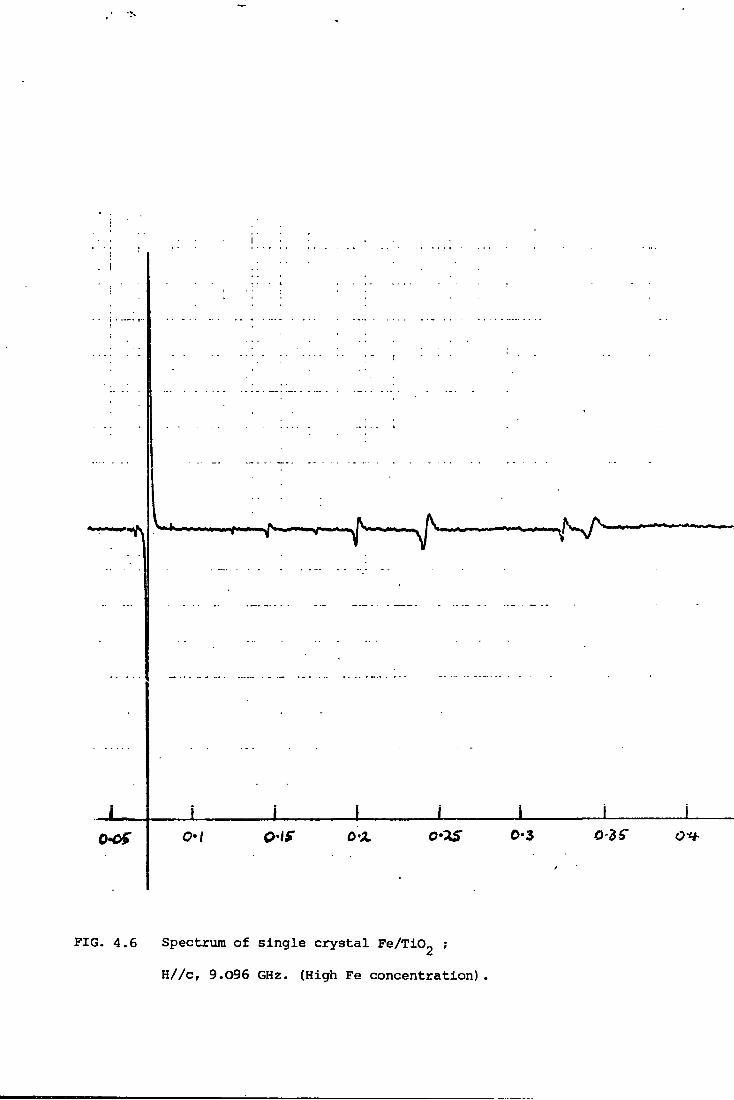
from the ± — t r a n s i t i o n and t h e two smaller ones from t h e ± j t r a n s i t i o n . Figure 4.6 has one l a r g e l i n e due t o the ± j t r a n s i t i o n as the
si g n a l s from the two s i t e s c o i n c i d e w i t h the magnetic f i e l d p a r a l l e l t o 3
the c' a x i s . The reason no ± — t r a n s i t i o n i s seen i s explained i n
Section 4.2. I n Figure 4.6 several smaller s i g n a l s can be seen,
liese could not be i n v e s t i g a t e d completely (due t o t h e i r small amplitude)
but comparison between t h e i r behaviour i n the x-y plane and the i s o -
frequency p l o t s published by Anderssonand Kollberg,suggest t h a t the three
l i n e s occuring w i t h the f i e l d g r e a t e r than 0.2 Tesla are due t o a sub-
s i t i t u t i o n a l i r o n i o n perturbed by a nearby i n t e r s t i t i a l p r o t o n and the 3+ 4+
f o u r t h l i n e o f comparable s i z e i s due t o a Fe i o n w i t h a nearby T i
i n t e r s t i t i a l i o n .
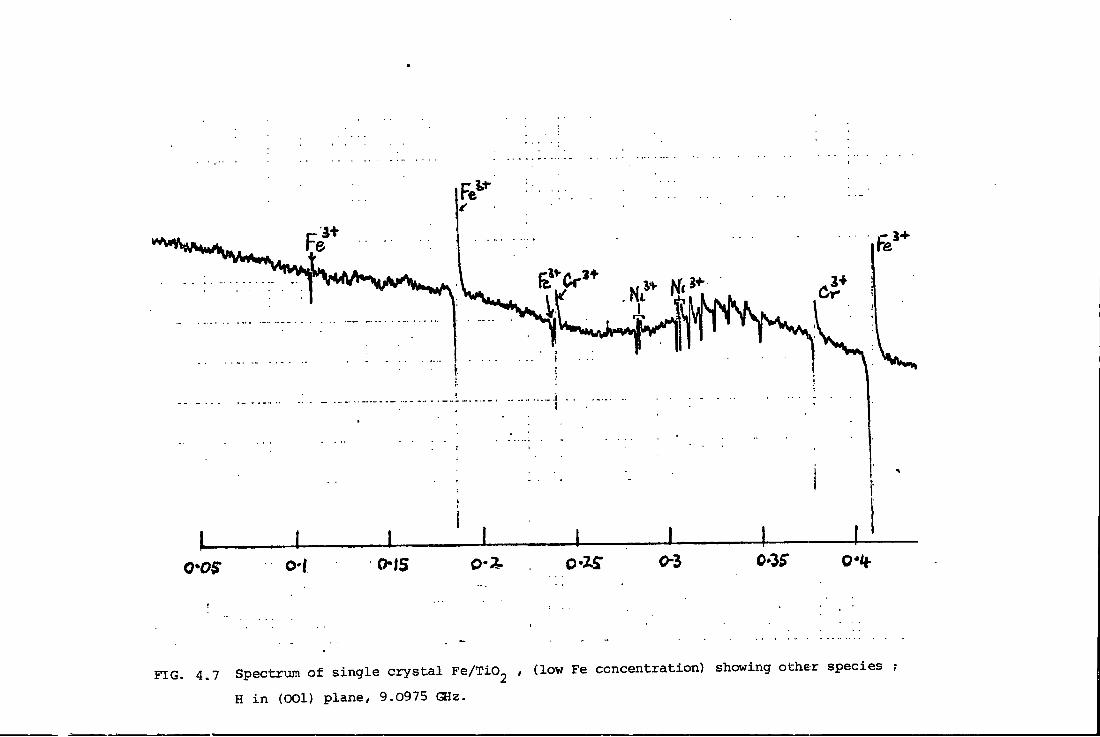
Figure 4.7 shows the observed spectrum o f a c r y s t a l w i t h about
0.01% i r o n . (This f i g u r e was obtained from a mass spectroscopy performed
on a sample o f the same boule by B.T.P. a t t h e i r l a b o r a t o r i e s i n Stockton).
The g a i n was about 100 times g r e a t e r and several o t h e r elements gave l a r g e
l i n e s . The spectra due t o Cr"*+ and N i ^ + were i d e n t i f i e d . There appeared
u be a very wide f e a t u r e a t about 0.3 Tesla. This was present i n a l l
the samples, even the swiss boule where i t could be seen a t high g a i n .
I t s magnitude appears t o be independent o f dopants and i t i s e n t i r e l y
i s o t r o p i c . I t was also seen i n powder samples. Andersson and Kolberg
r e p o r t a s i m i l a r f e a t u r e and suggest t h a t i t i s r e l a t e d t o trapped
e l e c t r o n s . An experimental isofrequency p l o t i s shown i n Figure 6.1. 20
O'l 0'\s 0-25* 0-3 0-35"
FIG. 4.5 Spectrum o f s i n g l e c r y s t a l Fe/TiO ; (001) plane, 9.096 GHz. (High Fe concentration)
^ JV^
FIG. 4.6 Spectrum o f s i n g l e c r y s t a l Fe/TiC^ ;
H//c, 9.096 GHz. (High Fe c o n c e n t r a t i o n ) .
3.1-
4+ 3 + Ye
3+ 3 +
0 * S " CMS Q%OS
(low Fe concentration) showing other species FIG. 4.7 Spectrum o f s i n g l e c r y s t a l Fe/TiO H i n (OOl) plane, 9.0975 GHz
REFERENCES
CHAPTER FOUR
4.1 A. Abragam and B. Bleaney, "E.P.R. o f T r a n s i t i o n Ions"
Clarendon Press (1970).
4.2 P. C. Taylor, J.F. Bougher, H.M. K r i t z , "Magnetic Resonance
i n P o l y c r y s t a l l i n e S o l i d s " , Chem. Rev. 75_ (1975) 203.
4.3 H. M. Assenheim, " I n t r o d u c t i o n t o E.S.R", Adam H i l g e r (1966).
4.4 Bleaney and Trenham,
Proc. Roy. Soc (London) A205 (1951) 135.
1-5 B. Bleaney and K. W. Stevens, "Paramagnetic Resonance",
Rep. Prog. Phys. 16 (1953) 108.
4.6 D. Carter and Okaya, "E.P.R. o f F e 3 + i n T i 0 2 ( R u t i l e ) " ,
Phys. Rev. 118 (1960) 1405.
4.7 Lichenberger and Addison, "F-and X-band spectroscopy on
F e 3 + i n R u t i l e " , Phys. Rev. 184 (1964) 381.
4.8 S c h o l l e n e i e r , Proc. IEEE, 54_ (1966) 1485.
4.9 Per-Olof Andersson and E. Kolberg, "Extra E.P.R. Spectra o f
I r o n Doped R u t i l e " , Phys. Rev. B8_ (1979) 4956.
4.10 W.E.Hughes, C.C.Johnson, and L.E.Rouger, "Eigenvalues f o r t h e
Spin Hamiltonian f o r F e 3 + i n T i 0 2 " , NASA Report TMX 63359,
(August 1968).
21
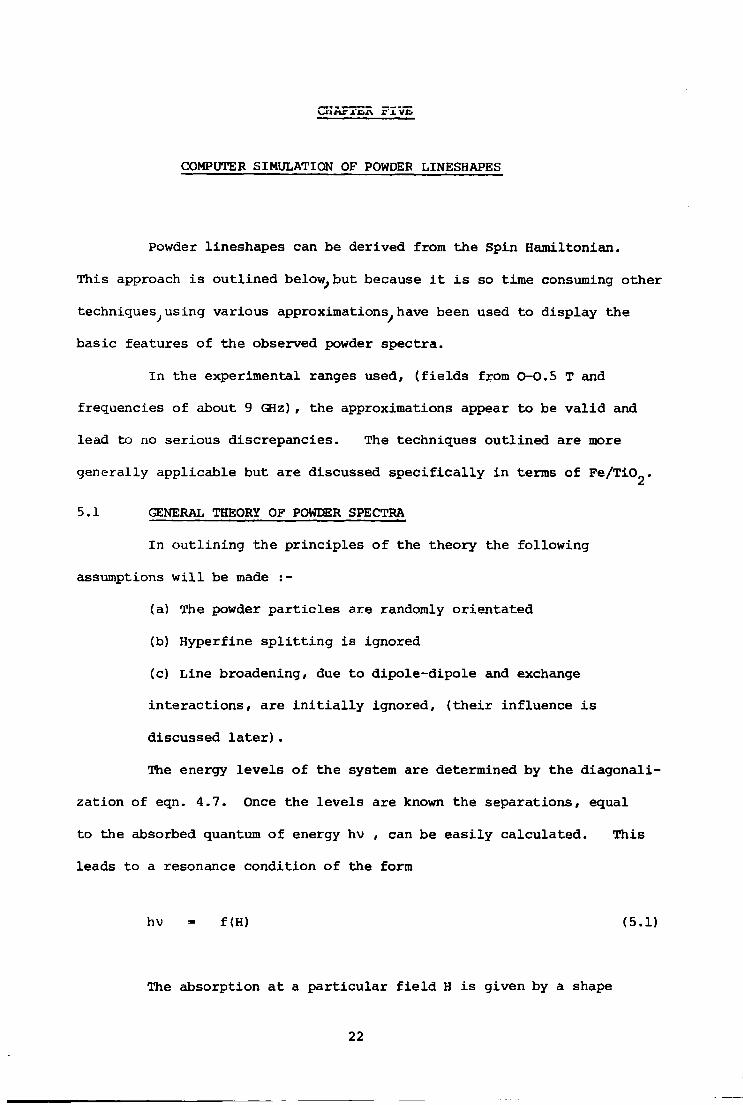
COMPUTER SIMULATION OF POWDER LINESHAPES
Powder lineshapes can be derived from the Spin Hamiltonian.
This approach i s o u t l i n e d below^but because i t i s so time consuming ot h e r
techniques^using various approximations^ have been used t o d i s p l a y the
basic features o f the observed powder spectra.
I n t h e experimental ranges used, ( f i e l d s from 0-0.5 T and
frequencies o f about 9 GHz), the approximations appear t o be v a l i d and
lead t o no serious discrepancies. The techniques o u t l i n e d are more
ge n e r a l l y a p p l i c a b l e but are discussed s p e c i f i c a l l y i n terms o f Fe/Ti02^
5.1 GENERAL THEORY OF POWDER SPECTRA
I n o u t l i n i n g the p r i n c i p l e s o f the theory the f o l l o w i n g
assumptions w i l l be made :-
(a) The powder p a r t i c l e s are randomly o r i e n t a t e d
(b) Hyperfine s p l i t t i n g i s ignored
(c) Line broadening, due t o d i p o l e - d i p o l e and exchange
i n t e r a c t i o n s , are i n i t i a l l y ignored, ( t h e i r i n f l u e n c e i s
discussed l a t e r ) .
The energy l e v e l s o f the system are determined by the d i a g o n a l i -
z a t i o n o f eqn. 4.7. Once the l e v e l s are known the separations, equal
to the absorbed quantum o f energy hv , can be e a s i l y c a l c u l a t e d . This
leads t o a resonance c o n d i t i o n o f the form
hv = f(H) (5.1)
The absorption a t a p a r t i c u l a r f i e l d H i s given by a shape
22
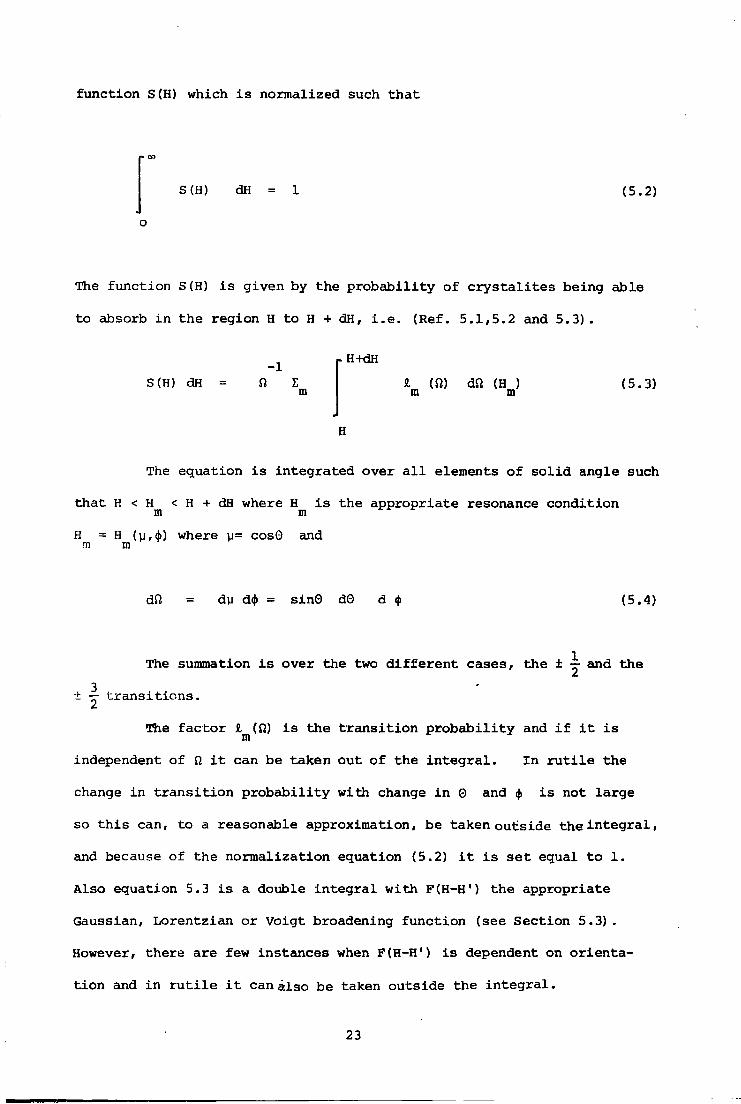
f u n c t i o n S(H) which i s normalized such t h a t
S(H) dH = 1 (5.2)
The f u n c t i o n S(H) i s given by the p r o b a b i l i t y o f c r y s t a l i t e s being able
t o absorb i n t h e reg i o n H t o H + dH, i . e . (Ref. 5.1,5.2 and 5.3).
_ 1 H+dH S(H) dH = fi £
m 4 (fi) dfJ (H ) (5.3) m m
The equation i s i n t e g r a t e d over a l l elements o f s o l i d angle such
t h a t H < H < H + dH where H i s the ap p r o p r i a t e resonance c o n d i t i o n m m H = H (y,<j>) where y= cos© and m m
dft = du dijt = sinG dG d <f> (5.4)
The summation i s over the two d i f f e r e n t cases, the ± and the
± ~ t r a n s i t i o n s .
The f a c t o r £ (fj) i s the t r a n s i t i o n p r o b a b i l i t y and i f i t i s m independent of fi i t can be taken out o f the i n t e g r a l . I n r u t i l e the
change i n t r a n s i t i o n p r o b a b i l i t y w i t h change i n 0 and <j> i s not l a r g e
so t h i s can, t o a reasonable approximation, be taken o u t s i d e the i n t e g r a l ,
and because o f the n o r m a l i z a t i o n equation (5.2) i t i s s e t equal t o 1.
Also equation 5.3 i s a double i n t e g r a l w i t h F(H-H') the appropriate
Gaussian, Lorentzian or Voigt broadening f u n c t i o n (see Section 5.3).
However, there are few instances when F(H-H') i s dependent on o r i e n t a
t i o n and i n r u t i l e i t can also be taken outside the i n t e g r a l .
23
Bach t r a n s i t i o n can be evaluated separately and the two r e s u l t
i n g shape f u n c t i o n s summed t o give the f i n a l shape f u n c t i o n S'(H). This
:'.s th^.n convoluted w i t h the appropriate l i n e broadening equation t o give
the observed spectra.
We can now r e w r i t e equation (5.3) as :
• H+dH
d SI (5.5) S(H) = fi"1 (dH) 1
H
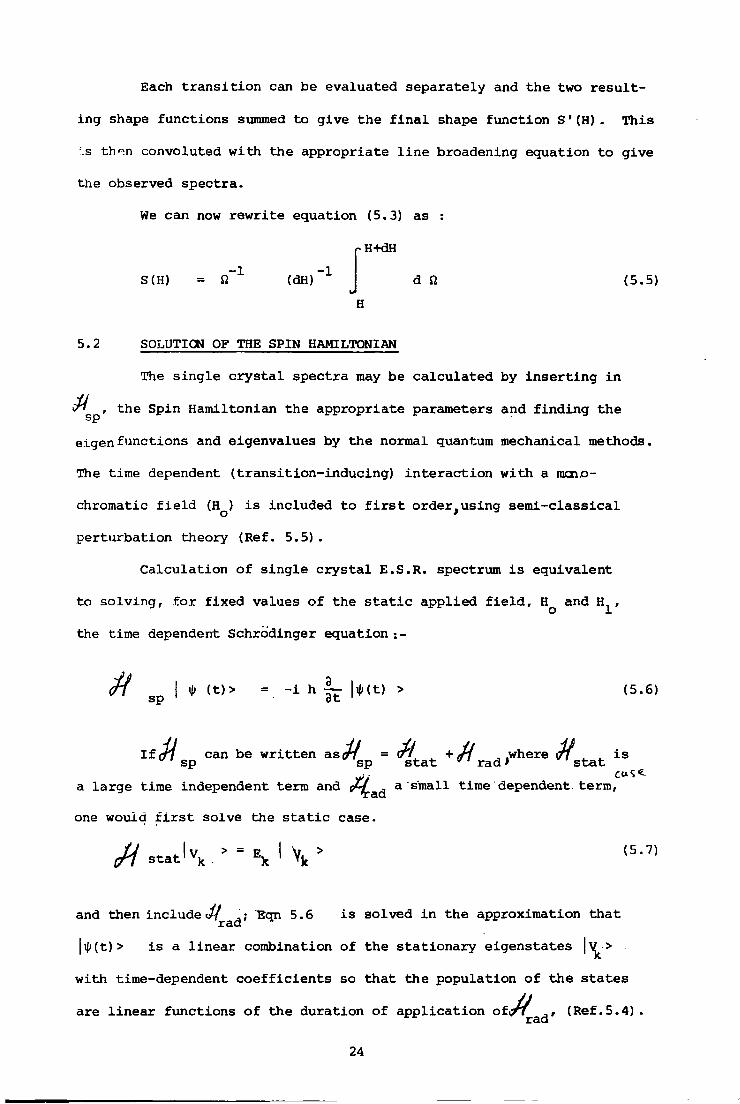
5.2 SOLUTION OF THE SPIN HAMILTONIAN
The s i n g l e c r y s t a l spectra may be c a l c u l a t e d by i n s e r t i n g i n
s p the Spin Hamiltonian the a p p r o p r i a t e parameters and f i n d i n g t h e sp ei g e n f u n c t i o n s and eigenvalues by the normal quantum mechanical methods. The time dependent ( t r a n s i t i o n - i n d u c i n g ) i n t e r a c t ion w i t h a monochromatic f i e l d (H ) i s included t o f i r s t order,using s e m i - c l a s s i c a l
o * p e r t u r b a t i o n theory (Ref. 5.5).
C a l c u l a t i o n o f s i n g l e c r y s t a l E.S.R. spectrum i s e q u i v a l e n t
t o s o l v i n g , f o r f i x e d values o f the s t a t i c a p p l i e d f i e l d , H q and H^,
the time dependent Schrcidinger equation :-
<fif | i|> ( t ) > - - i h | r | * ( t ) > (5.6) sp • dt
liffi can be w r i t t e n a s i n = vf/ ^ +/f{ , .where <n ^ ^ i s sp sp s t a t " r a d ' s t a t <:*<;«.
a l a r g e time independent term and r^L^ a small time dependent term,
one would f i r s t solve the s t a t i c case.
and then i n c l u d e ^ r a d ;
T?qn 5.6 i s solved i n the approximation t h a t
| ^ ( t ) > i s a l i n e a r combination o f the s t a t i o n a r y eigenstates |^>
w i t h time-dependent c o e f f i c i e n t s so t h a t the p o p u l a t i o n o f the s t a t e s are l i n e a r f u n c t i o n s o f the d u r a t i o n o f a p p l i c a t i o n ° f^^ a (j' (Ref.5.4)
24
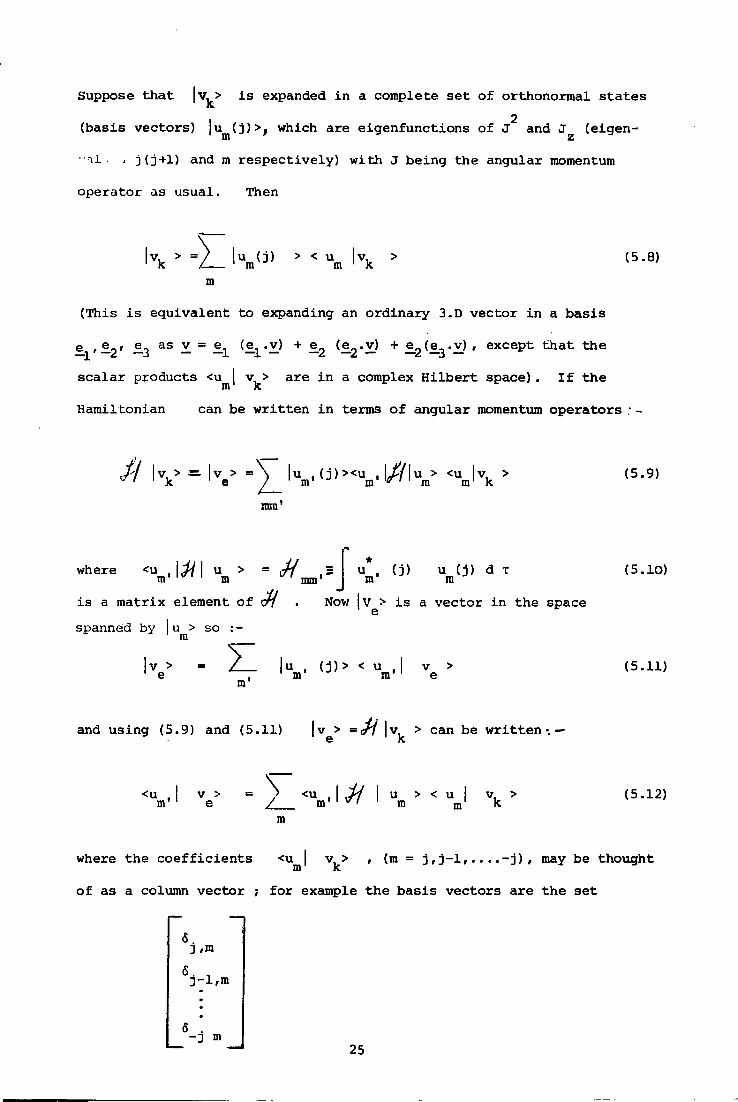
Suppose that i s expanded i n a complete set of orthonormal states
(basis vectors) |u ( j ) > , which are eigenfunctions of J and J (eigen-m z • nl . , j ( j + l ) and m respectively) with J being the angular momentum
operator as usual. Then
(5.8) l \ * =Z_ l V j ) > < Um ' Vk >
m
(This i s equivalent to expanding an ordinary 3.D vector i n a basis
e_ , £ 2 ' --3 a s — = — l ^ — i * — ^ + —2 ^—2"— + ^-2^—3"— ' e x c e P f c 0 1 a t t h e
s c a l a r products <um| v^> are i n a complex Hilbert space). I f the
Hamiltonian can be written i n terms of angular momentum operators
-H l v u > — K > = \ |u ,(j)><u , l / / | u > <u |v. > - ' 1 k 1 e / m' m > r' 1 m m1 k (5.9)
mm
where <u ,|#| u > = S m m ' mm'
i s a matrix element of S{ .
spanned by |u > so : -
m m Now |V > i s a vector i n the space
m
I V m'
m . ( j ) > < vi | v > m m e
(5.10)
(5.11)
and using (5.9) and (5.11) l ve
> = <$ l vK > c a n ^ e written-.—
<u,| v > = N <u , I i / I u > < u I v. > m' 1 e Z. n» 1 V l ' m m k m
(5.12)
where the co e f f i c i e n t s <u v > , (m = j , j - 1 , . . . . - j ) , may be thought m k
of as a column vector ; for example the basis vectors are the set
j-l,m
25
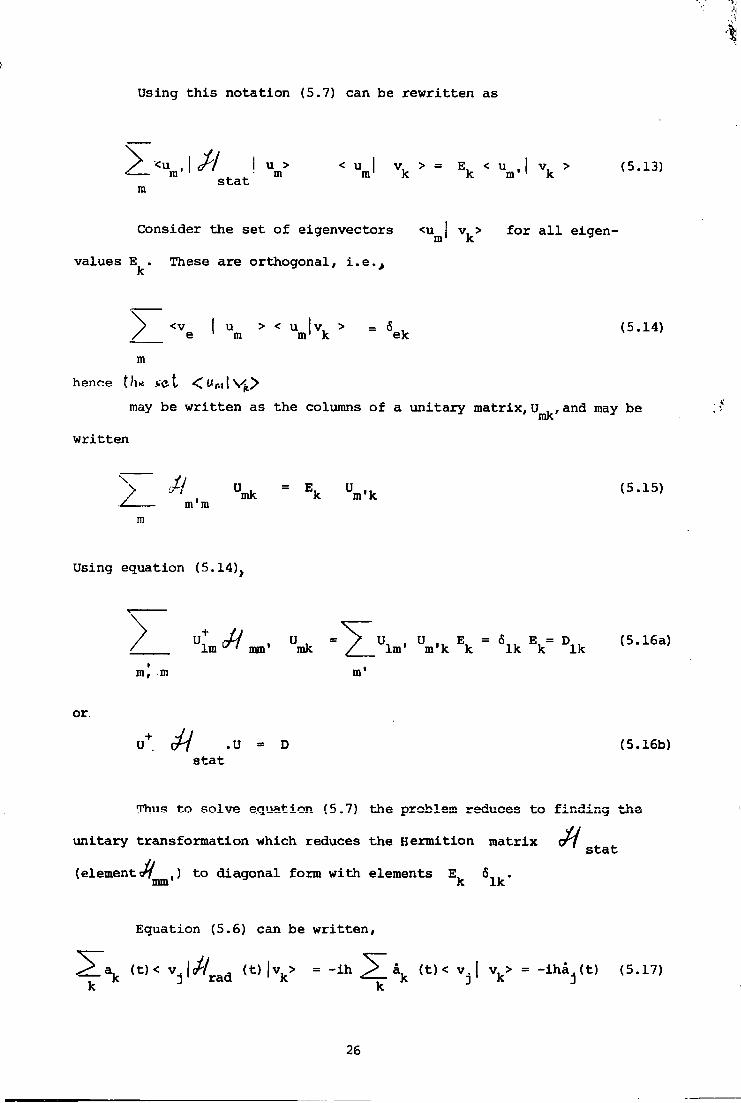
Using t h i s n o t a t i o n (5.7) can be r e w r i t t e n as
y < u , \ < f i / I u > < u | — m' 1 m m1 - , • - . - < u v > = E < u , v > (5.13) m'' ^ . 4 . 01 m ' k k m' 1 k s t a t m
Consider the set o f eigenvectors <u m| v^> f o r a l l eigen
values E . These are orthogonal, i . e . , K.
y <v I u > < u lv > = 5 , (5.14) / e 1 m m1 k ek m
hence th« *'ftt O / i i l V j ^ may be w r i t t e n as the columns o f a u n i t a r y matrix, U^, and may be
w r i t t e n
> -Pt U . = E U ,. (5.15) / ' mk k m'k t- mm
Using equation (5.14) >
K cH . u t, = / u, . u .u E, = E, = *>,, (5.16a) lm v ' mm' ink ^/ lm' m'k k l k k l k m, m m
or.
U+. dV .U = D (5.16b) s t a t
Thus t o solve equation (5.7) the problem reduces t o f i n d i n g the
u n i t a r y t r a n s f o r m a t i o n which reduces the H e r m i t i o n m a t r i x s t a t ( e l e m e n t . ) t o diagonal form w i t h elements E, 6„, .
mm' 3 k l k
Equation (5.6) can be w r i t t e n ,
,a k ( t ) < v . | / / r a d ( t ) | v k > = - i h a k ( t ) < v.| v k> = - i h a . ( t ) (5.17)
26
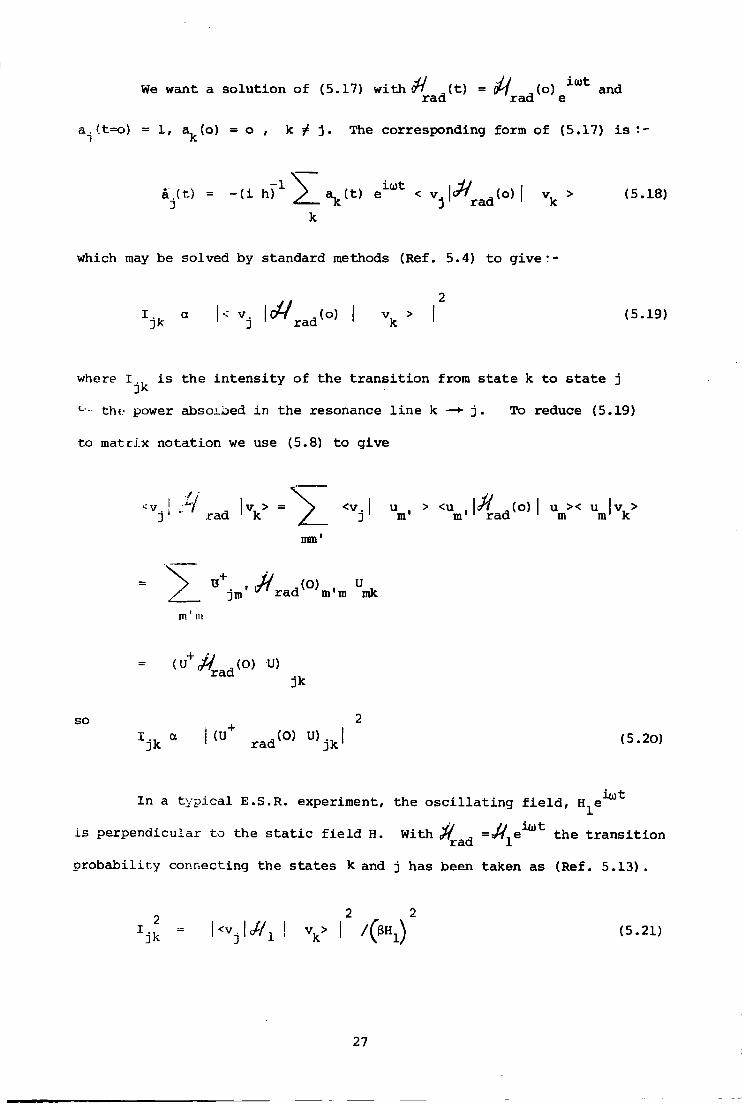
We want a solution of (5.17) with t^/ ,(t) = M ,(o) *"tot and rad rad e
a.. (t=o) = 1, a^(o) = o , k ^ j . The corresponding form of (5.17) i s
a.(t) = - ( i h ) T 1 ^ _ a k ( t ) e 1 U t < v j | ^ r a d ( o ) | V ] c > (5.18)
which may be solved by standard methods (Ref. 5.4) t o g i v e : -
V a \ < V j '°^rad ( o ) I V k > I ' ( 5 - 1 9 )
where I i s the intens i t y of the t r a n s i t i o n from state k to state j
°- the? power absoioed in the resonance l i n e k —*• j . To reduce (5.19)
t o matrix notation we use (5.8) to give
: v - I , |v> = ) <v. I u > <u . \ ji ,(o) I u >< u I V > j rad 1 k / j 1 m m rad 1 m m k mm
y> ° V ^ r a d ( 0 )m . m V
= ( u + . ^ r a d ( 0 ) u) jk
so 2 ^ k " l ( U r a d ( 0 ) U )
j k ! <5'2°>
I n a t y p i c a l E.S.R. experiment, the o s c i l l a t i n g f i e l d , H,e l w t
i s perpendicular t o the s t a t i c f i e l d H. With $ , the t r a n s i t i o n rad 1
probabilir.y connecting the s t a t e s k and j has been taken as (Ref. 5.13) .
z j t = l < v j l ^ i I V 1 /K) (5-2l)
27
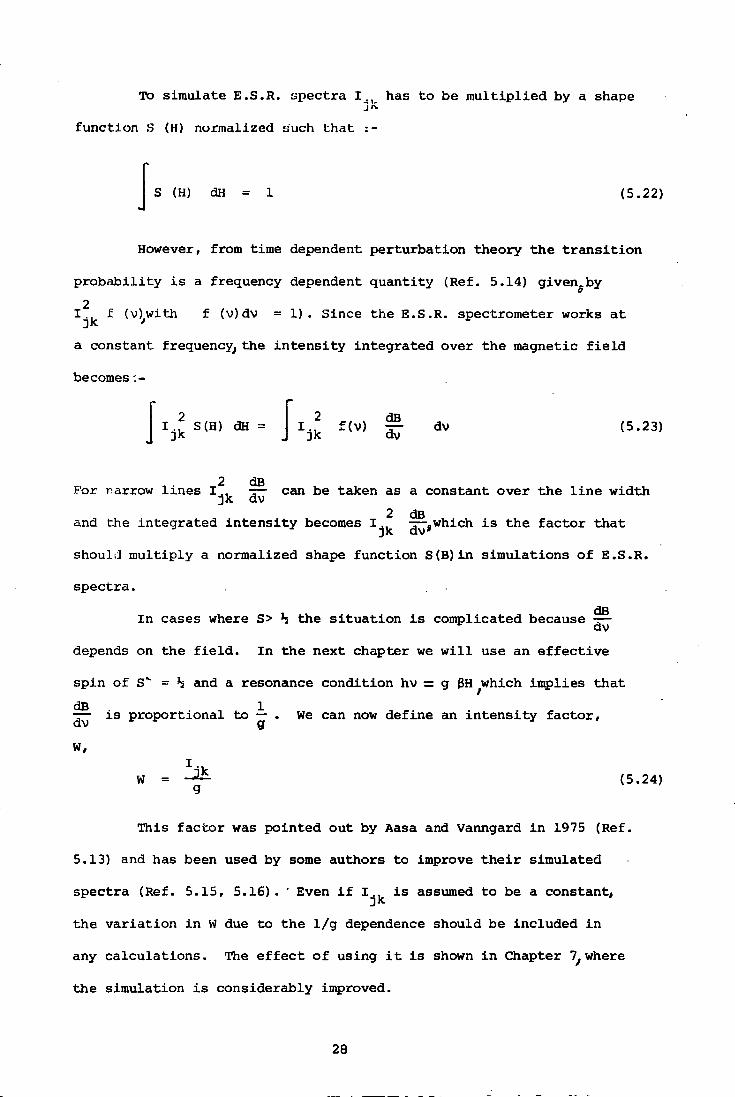
To simulate E.S.R. spectra I . , has to be multiplied by a shape
function S (H) normalized such that :-
S (H) dH = 1 (5.22)
However, from time dependent perturbation theory the t r a n s i t i o n
probability i s a frequency dependent quantity (Ref. 5.14) given^by 2
f (v^with f (v)dv = 1 ) . Since the E.S.R. spectrometer works at
a constant frequency^ the i n t e n s i t y integrated over the magnetic f i e l d
becomes 2 dB
J 1 * f M * r I £ S(H) dH = | r , . f(v) i r 1 dv (5.23)
2 dB For narrow l i n e s I . , — can be taken as a constant over the l i n e width jk dv 2 dB
and the integrated i n t e n s i t y becomes I rj^which i s the factor that
should multiply a normalized shape function S(B)in simulations of E.S.R.
spectra. i , dB In cases where S> *j the si t u a t i o n i s complicated because —
depends on the f i e l d . In the next chapter we w i l l use an ef f e c t i v e
spin of S" = h and a resonance condition hv = g f$H which implies that dB 1
— i s proportional to — . We can now define an i n t e n s i t y factor,
W,
W = — ( 5 . 2 4 ) g
This factor was pointed out by Aasa and Vanngard i n 1975 (Ref.
5.13) and has been used by some authors to improve t h e i r simulated
spectra (Ref. 5.15, 5.16). ' Even i f I i s assumed to be a constant,
the variation i n W due to the 1/g dependence should be included i n
any calculations. The e f f e c t of using i t i s shown i n Chapter 7^where
the simulation i s considerably improved.
28
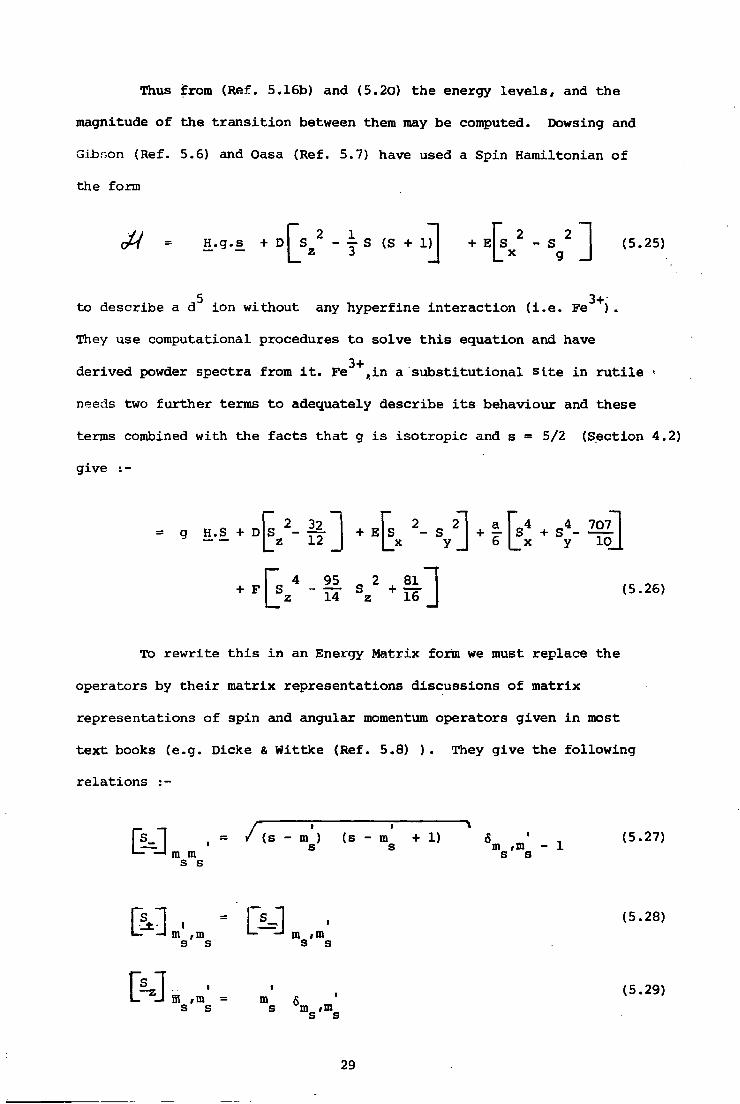
Thus from (Ref. 5.16b) and (5.2o) the energy l e v e l s , and the
magnitude of the t r a n s i t i o n between them may be computed. Dowsing and
Gibson (Ref. 5.6) and Oasa (Ref. 5.7) have used a Spin Hamiltonian of
the form
0^/ = H.g.s + D ^ S z2 - y S (S + l ) j + - S^ 2 (5.25)
to describe a d^ ion without any hyperfine interaction ( i . e . F e ^ + ) .
They use computational procedures to solve t h i s equation and have
derived powder spectra from i t . F e ^ + , i n a substitutional s i t e i n r u t i l e •
needs two further terms to adequately describe i t s behaviour and these
terms combined with the facts that g i s isotropic and s = 5/2 (Section 4.2)
give :-
= g H.S + D
• ' | y - s « . 2 * § j
To rewrite t h i s i n an Energy Matrix form we must replace the
operators by t h e i r matrix representations discussions of matrix
representations of spin and angular momentum operators given i n most
text books (e.g. Dicke & Wittke (Ref. 5.8) ) . They give the following
relati o n s :-
[S_ 1 , = / (s - m'] I— —i m m
i \ _ ) (s - m + 1) 6 ' (5.27) s s m ,m - 1 mm s s
s s
& 1 • • L - s J • ( 5 * 2 8 )
*— ~* m ,m -* m »m s s s s
1 ' 1 , (5.29) L " J BJ ,m = m s s" s s m #m s s
29
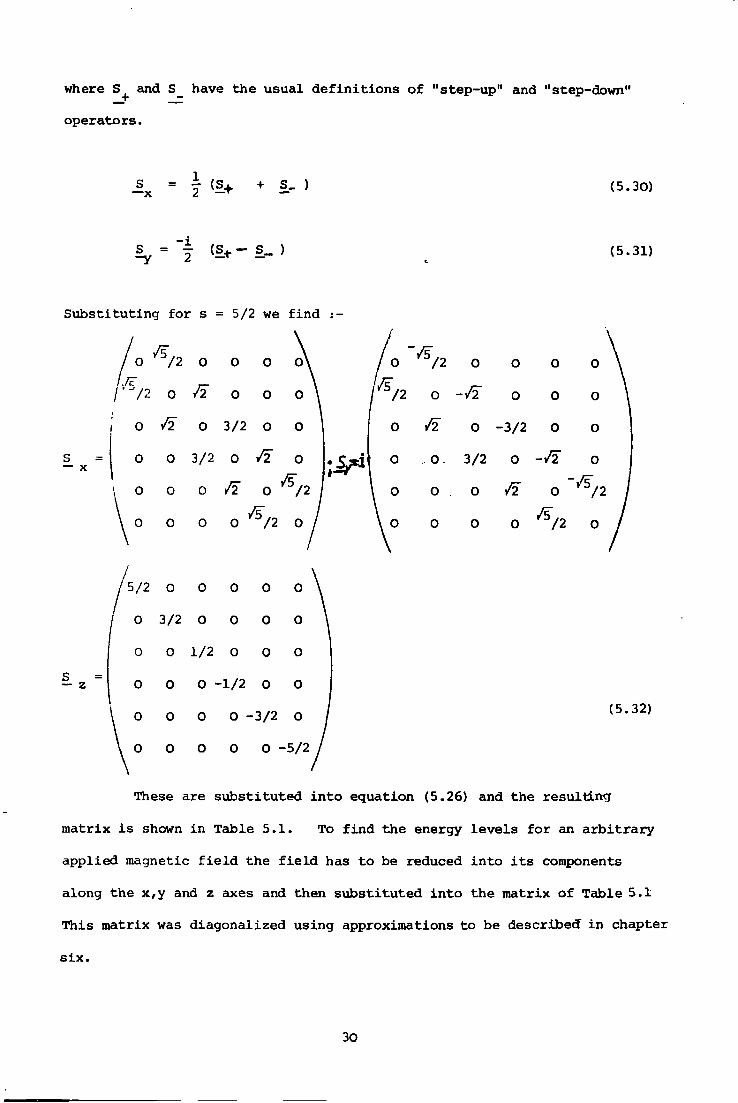
where S + and S have the usual definitions of "step-up" and "step-down"
operators.
+ S_ ) (5.30)
S -y
2 <£+-§._) (5.31)
Substituting for s = 5/2 we find :-
/5
0 3/2 0
o / 2 0 ™/2
2 0
f 5/2 0
3/2 O
O 1/2 O
O -1/2 O
O -3/2 O
O O -5/2
(5.32)
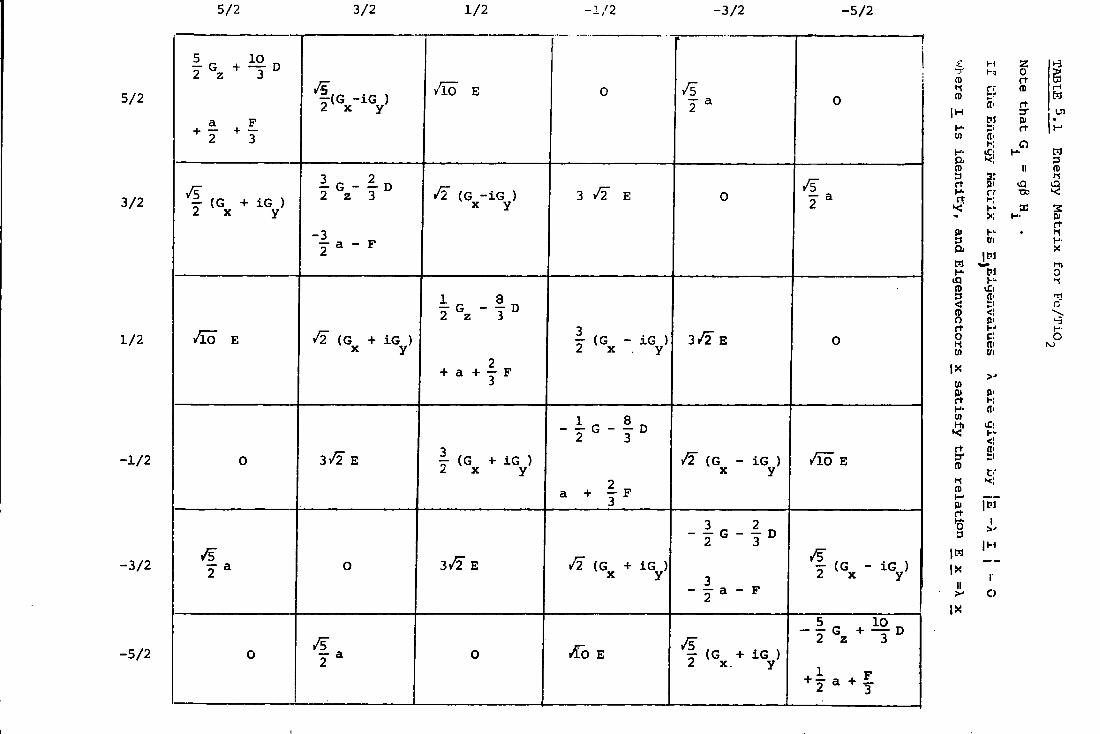
These are substituted into equation (5.26) and the resulting
matrix i s shown i n Table 5.1. To find the energy l e v e l s for an a r b i t r a r y
applied magnetic f i e l d the f i e l d has to be reduced into i t s components
along the x,y and z axes and then substituted into the matrix of Table 5.1
This matrix was diagonalized using approximations to be described i n chapter
s i x .
30
5/2 3/2 1/2 •1/2 -3/2 -5/2
5/2
3/2
1/2
-1/2
-3/2
-5/2
a F + I + 3
/5 f ( G -iG ) 2 x y vTo E 0
2 3 0
^5 |- (G + iG ) 2 x y
3 o 2 ^ — G - — D 2 z 3
- f a - F
/2 (G -iG ) x y 3 J2 E 0 /s 2 a
/LO E (G + iG ) x y
K - ! °
2 + a + j F
|- (G - iG ) 2 x y 3^" E 0
0 3v 2 E ^ (G + iG ) 2 x y
1 „ 8 „ ~ 2" T
2 „ a + j F
r/2 (G - iG ) x y /LO E
2 a O 3/2 E /2 (G + iG ) x y & . G - iG 2 x y
0 2 a 0 *fo E r f (G + iG ) 2 x. y 4 - 1 F 2" a + J
m i - . i
No
i-3 g
(D r t 6 H r r 1-1
W CD
l H lie
tn
1-1 W
frl El
pj I - 1 -
frl El r t
W cr O
M H - H- M & *<! 3 CD II ro 3 s; « r t pi iQ H - r.- •00 •< r r h{
I - ' - OB 3 X
at
in I - ' - • n 3 01 &
|C1 X &
|C1 M
|C1 H i
H - fi 0 y~ H
to <£! 3 (I> T1 < Si 0' ro <: \ O p> i-5 r t 1— 0 c: O n a* to 0.1
I* CO (II r t H -en H i f t 3* ro
H ro H PJ rt 3
| M
IX II >-
h!
<! CI'
1 >•>
I
C)
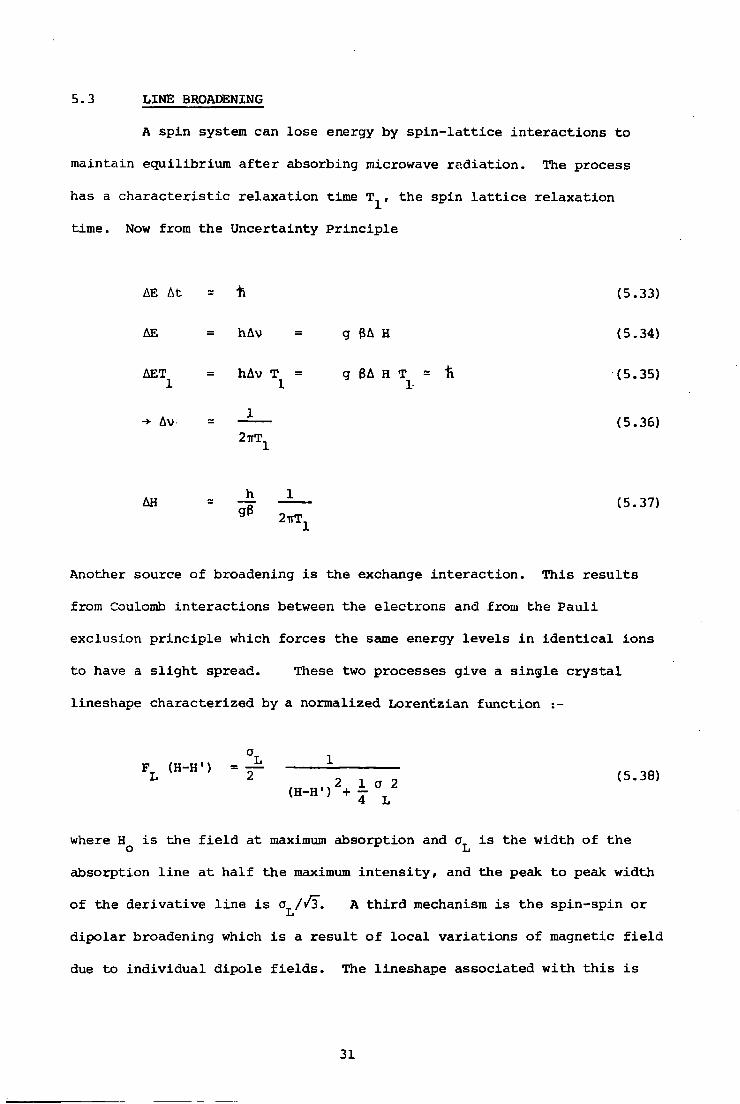
5.3 LINE BROADENING
A spin system can lose energy by s p i n - l a t t i c e interactions to
maintain equilibrium a f t e r absorbing microwave radiation. The process
has a c h a r a c t e r i s t i c relaxation time T^, the spin l a t t i c e relaxation
time. Now from the Uncertainty P r i n c i p l e
AE At = "h (5.33)
AE = hAv = g 8A H (5.34)
AET = hAv T = g PA H T - "ft (5.35) 1 1 1
-+ Av = — — (5.36) 27rTx
AH = ~ — — (5.37) g P 2 ^
Another source of broadening i s the exchange interaction. This r e s u l t s
from Coulomb interactions between the electrons and from the Pau l i
exclusion p r i n c i p l e which forces the same energy l e v e l s i n i d e n t i c a l ions
to have a s l i g h t spread. These two processes give a single c r y s t a l
lineshape characterized by a normalized Lorentzian function :-
a (H-H'l = f- (5.38)
where H i s the f i e l d at maximum absorption and o, i s the width of the o L absorption l i n e at half the maximum in t e n s i t y , and the peak to peak width
of the derivative l i n e i s o A t h i r d mechanism i s the spin-spin or L
dipolar broadening which i s a r e s u l t of l o c a l variations of magnetic f i e l d
due to individual dipole f i e l d s . The lineshape associated with t h i s i s
31
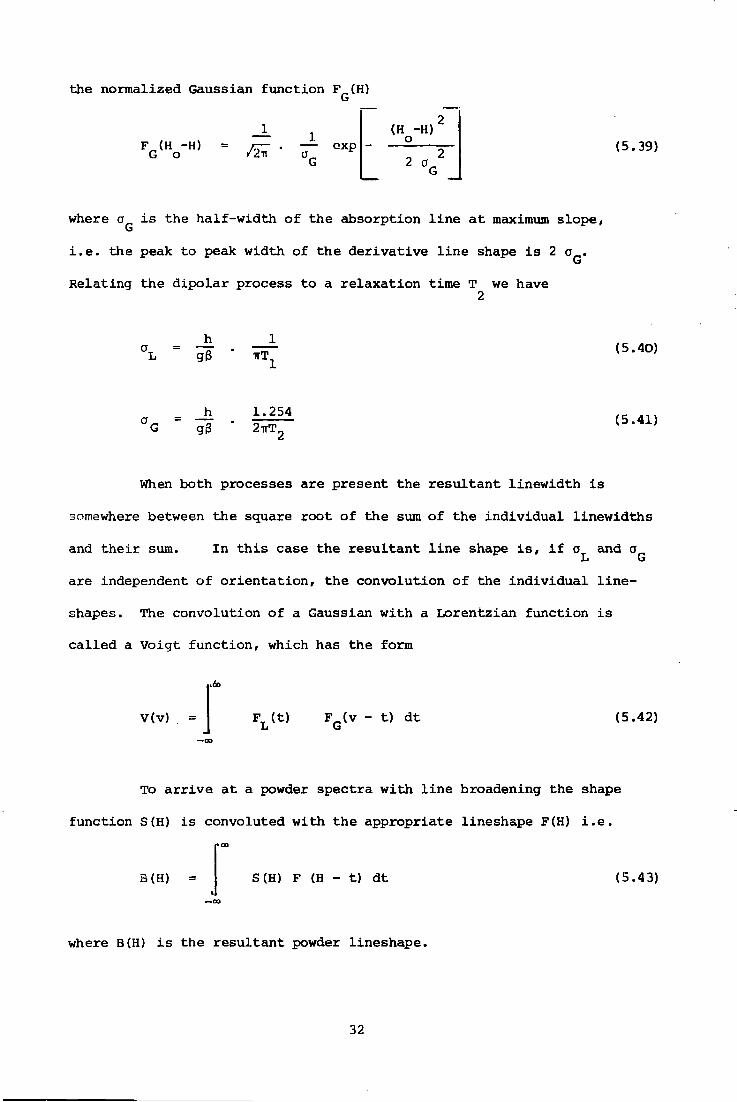
the normalized Gaussian function F (H) G
F (H -H) = G o 1
/2TT 1
GXD (H -H) o
2 a. (5.39)
where a i s the half-width of the absorption l i n e a t maximum slope, G i . e . the peak to peak width of the derivative l i n e shape i s 2 a_.
G Relating the dipolar process to a relaxation time T we have
2
h ITT (5.40)
_h gS
1.254 2TTT„ (5.41)
When both processes are present the resultant linewidth i s
somewhere between the square root of the sum of the individual linewidths
and their sum. In t h i s case the resultant l i n e shape i s , i f o and a L G
are independent of orientation, the convolution of the individual l i n e -
shapes. The convolution of a Gaussian with a Lorentzian function i s
ca l l e d a Voigt function, which has the form
V(v) = F T (t) F_(v - t) dt L i V»
(5.42)
To a r r i v e at a powder spectra with l i n e broadening the shape
function S(H) i s convoluted with the appropriate lineshape F(H) i . e .
3(H) = S(H) F (H - t) dt (5.43)
where B(H) i s the resultant powder lineshape.
32
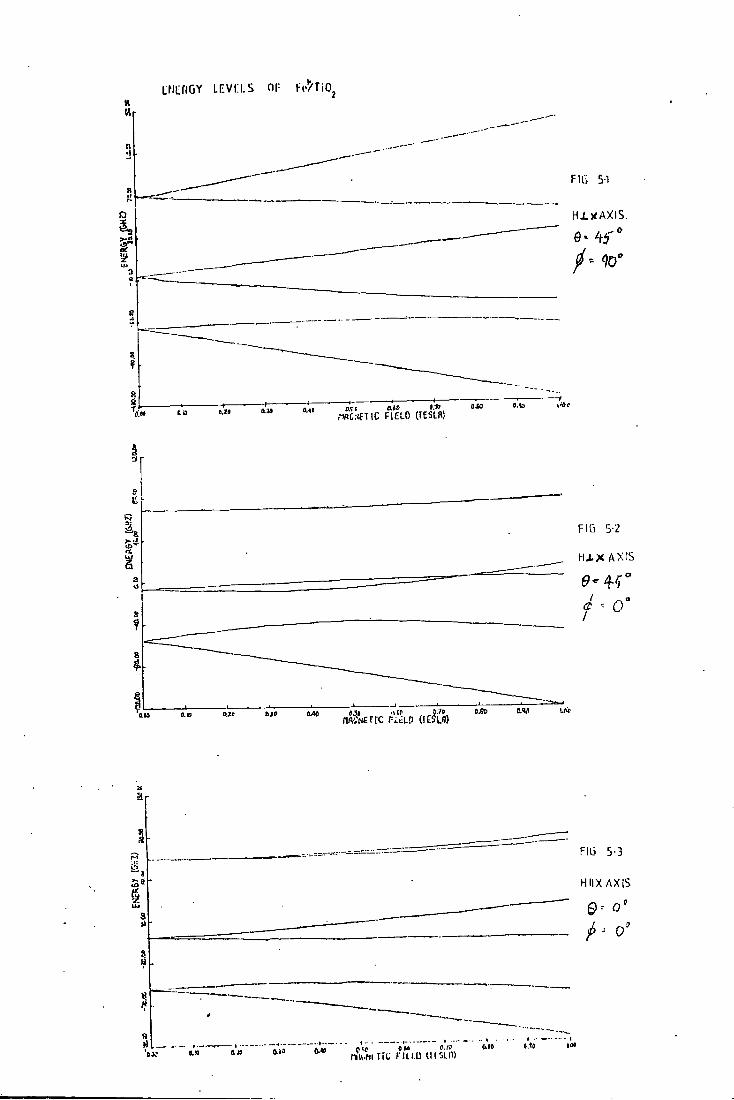
L N L R G Y L E V P . I . S OP F e / T i O
n t F I G 5-1
A X I S Q 0- 4 f >-«!
II
0.30 t.za fMCSETIC FIELD (IESLA)
F I G 5
> U X A X I S in a
9 '• O
8
i LAP ISO 0.7& UP «J1 tie 010 0.13 rtflffNErrC FiELP ( I tSLf l )
I F i b 5-3
HNX A X I S
0 - 0 3 0
1« OilO (via mVii T i i ; ULI.D u i s i m
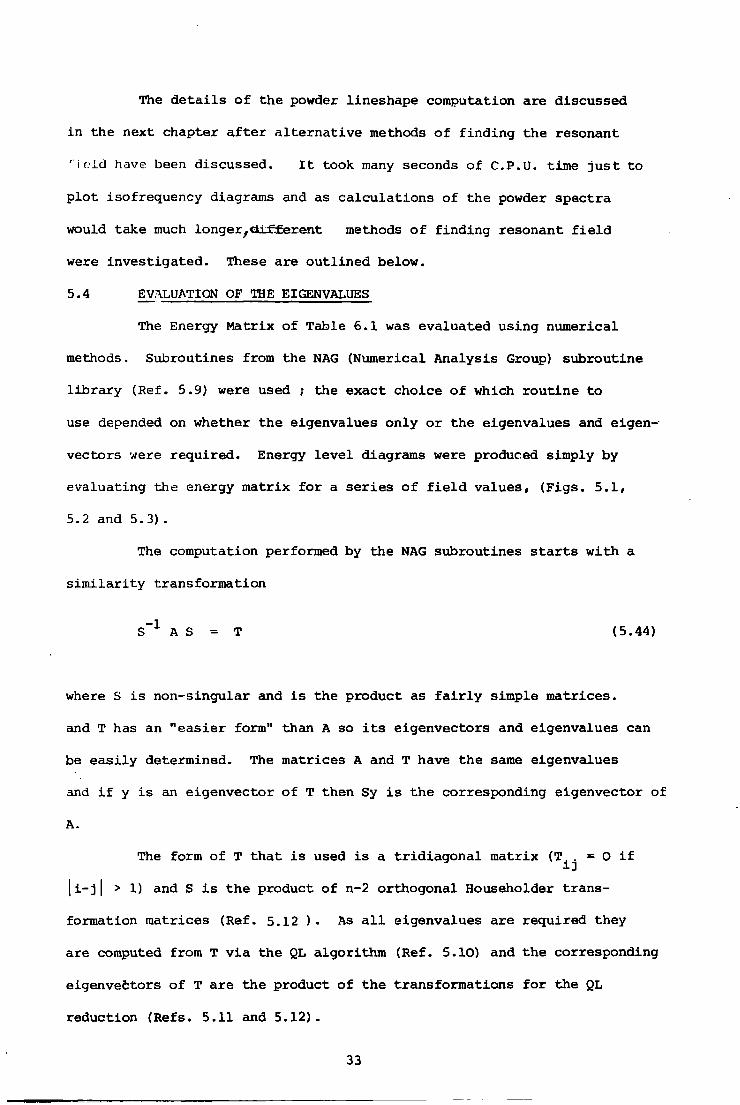
The d e t a i l s of the powder lineshape computation are discussed
in the next chapter af t e r alternative methods of finding the resonant
' iold have been discussed. I t took many seconds of C.P.U. time j u s t to
plot isofrequency diagrams and as calculations of the powder spectra
would take much longer,<*i££erent methods of finding resonant f i e l d
were investigated. These are outlined below.
5.4 EVALUATION OF THE EIGENVALUES
The Energy Matrix of Table 6.1 was evaluated using numerical
methods. Subroutines from the NAG (Numerical Analysis Group) subroutine
l i b r a r y (Ref. 5.9) were used ; the exact choice of which routine to
use depended on whether the eigenvalues only or the eigenvalues and eigen
vectors were required. Energy l e v e l diagrams were produced simply by
evaluating the energy matrix for a s e r i e s of f i e l d values, (Figs. 5.1,
5. 2 and 5.3).
The computation performed by the NAG subroutines s t a r t s with a
s i m i l a r i t y transformation
S _ 1 A S = T (5.44)
where S i s non-singular and i s the product as f a i r l y simple matrices.
and T has an "easier form" than A so i t s eigenvectors and eigenvalues can
be e a s i l y determined. The matrices A and T have the same eigenvalues
and i f y i s an eigenvector of T then Sy i s the corresponding eigenvector of
A.
The form of T that i s used i s a tridiagonal matrix = 0 i f
| i - j | > 1) and S i s the product of n-2 orthogonal Householder trans
formation matrices (Ref. 5.12 ) . As a l l eigenvalues are required they
are computed from T v i a the QL algorithm (Ref. 5.10) and the corresponding
eigenvectors of T are the product of the transformations for the QL
reduction (Refs. 5.11 and 5.12).
33
To find the value of the resonant f i e l d with the f i e l d i n a
par t i c u l a r direction with respect to the crystallographic axes an
i.''vr.)Mvo procedure was devised. However, t h i s took a large amount
of time for even a few points and so the methods detailed i n the next
chapter were devised.
34
REFERENCES
CHAPTER 5 -
.1 P.C.Taylor, J.F.Baugher and H.M.Kriz, 'Magnetic Resonance in
Po l y c r y s t a l l i n e Solids', Chem.Rev. 75_ (1975) 2o3.
5.2 F.K.Kneubuhl, 'Lineshapes of E.P.R. Signals Produced by
Powders, Glasses and Viscose Liquids', J . Chem.Phys. 33^ (1960),1074.
5.3 J.S.Thorp and W.Hutton, 'Interim Report on Computer Simulation
of E.S.R. Spectra', University of Durham (unpublished).
5.4 L . I . S c h i f f , 'Quantum Mechanics', (McGraw-Hill Book Co.N.Y. 1955)
Ch. VI and V I I I .
5.5 J.H.Mackey, M.Kopp, E.C.Tyman, Teh Fu Yen, 'Computer Synthesis
QJ Electron Paramagnetic Resonances Spectra from a Parametric
(Spin) Hamiltonian', Electron Spin Resonance of Metal Complexes,
ed. Tek Fu Yen.
5.6 R.D.Dowsing and J.F.Gibson, 'E.S.R. of High Spin d 5 Systems'
J.Chem. Phys. 50 (1969) 294.
5.7 R. Aasa, 'Powder Lineshapes i n the E.P.R. Spectra of High Spin
F e r r i c Complexes', J.Chem. Phys. 52 (1970) 3919.
5.8 R.H.Dicke and J.P. Wittke, 'Introduction to Quantum Mechanics'
(1961) Addison Wesley.
5.9 N.A.G. Fortran Manual Mark. 7. (1979*
5.10 G. Peters, 'NPL Algorithms Library' Document No.Fl/04/A. C 1 1 T IT r . i J l l r i * n « A n ~ . n * q n ~ « I TJ -~ ~* ~~ N 1- f n w n . - 4 - 4 - i _ ~ i - n n •J . J. J- u . i i . MJ. i . j v J . H 9 u n m i i ^ i \~ . x \ c x i i o \ f i i , u a n u u u u j \ x.\jx. n u k . u u i c i u x u u / i u p u u a u i u n
Vol. I I Linear Algebra', pub. Springer-Verlag (1971).
5.12 J.H.Wilkinson, 'The Algebraic Eigenvalue Problem'
Pub. Clarendon Press, (1965).
5.13 R. Aasa, T. Vanngard, 'E.P.R. Signal In t e n s i t y and Powder
Shapes , A Re-examination*, J . Magn. Reson. 19_ (1975) 308.
5.14 A. Abraham, B. Bleaney, 'Electron Spin Resonance of Transition
Metal Ions', Clarendon Press (1970).
35
5.15 J.C. Conesa, J . Sarice, 'Lineshapes of Powder EPR Spectra
with large anisotropy : Ca I I ions i n Y Zeolite'
J . Magn. Reson. 33. (1979) 295.
5.16 J.R. Polbrow, 'Effective g Values for S = and S = j '
J . Magn, Reson. 31 (1978) 479.
36
CHAPTER SIX
3+ , APPROXIMATE CALCULATIONS OF Fe / T l 0 2 POWDER SPECTRA
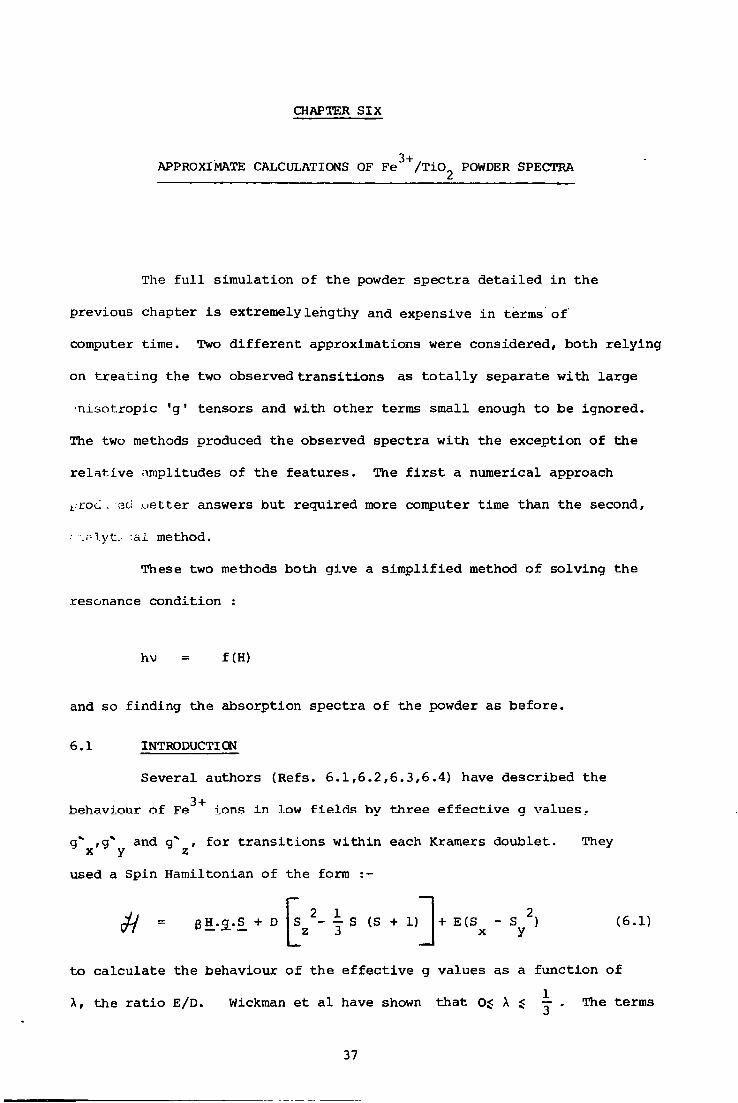
The f u l l simulation of the powder spectra detailed i n the
previous chapter i s extremely lengthy and expensive in terms of
computer time. Two d i f f e r e n t approximations were considered, both relying
on treating the two observed transitions as t o t a l l y separate with large
•nisotropic 'g' tensors and with other terms small enough to be ignored.
The two methods produced the observed spectra with the exception of the
r e l a t i v e amplitudes of the features. The f i r s t a numerical approach
t-rod. sc.! u e t t e r answers but required more computer time than the second,
l.yt.i :ai method.
These two methods both give a s i m p l i f i e d method of solving the
resonance condition :
hv = f(H)
and so finding the absorption spectra of the powder as before.
6.1 INTRODUCTION
Several authors (Refs. 6.1,6.2,6.3,6.4) have described the
behaviour o f Fe"^ + ions in low f i e l d s hy three e f f e c t i v e g values.
q" ,q* and a" , for t r a n s i t i o n s within each Kramers doublet. They x y z used a Spin Hamiltonian of the form :-
S 2- S (S + 1) + E(S - S 2 ) (6.1) z 3 x y
to calculate the behaviour of the e f f e c t i v e g values as a function of
A, the r a t i o E/D. Wickman et a l have shown that o$ \ i j . The terms
37
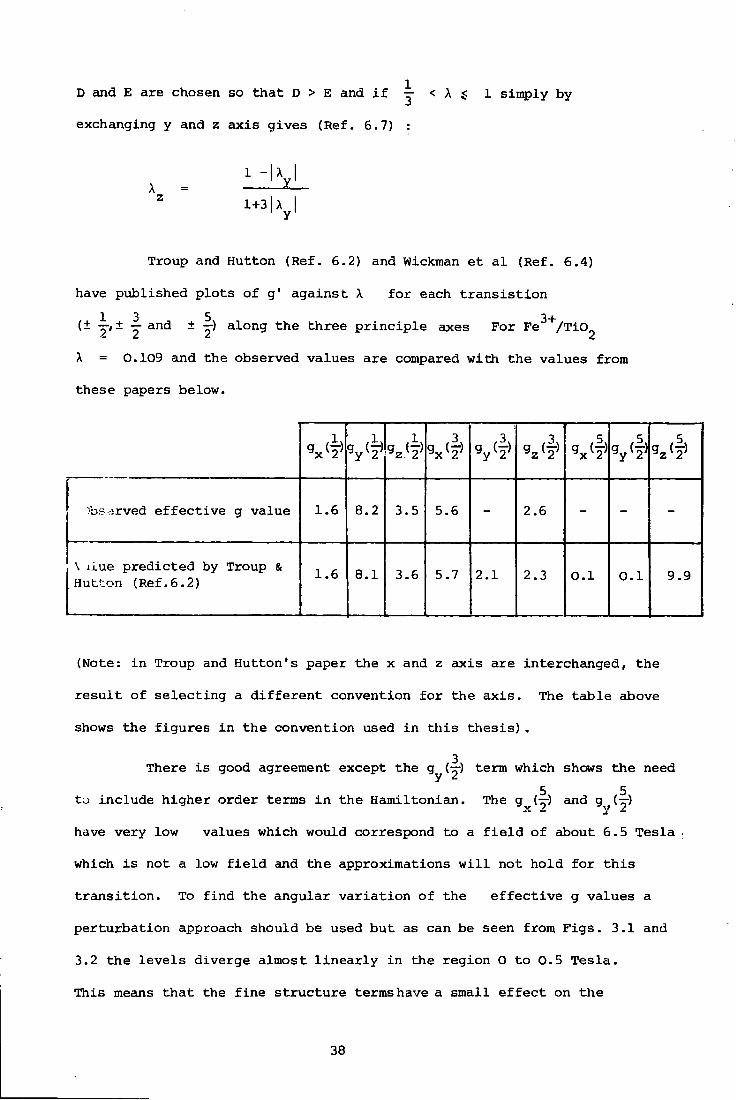
D and E are chosen so that D > E and i f — < X $ 1 simply by
exchanging y and z axis gives (Ref. 6.7) :
1 -U
1+3I A I I yl
Troup and Hutton (Ref. 6.2) and Wickman et a l (Ref. 6.4)
have published plots of g' against A for each t r a n s i s t i o n
(± y,± y and ± y) along the three p r i n c i p l e axes For F e ^ / T i c ^
A = 0.109 and the observed values are compared with the values from
these papers below.
*A V2> *A *A Vos.irved effective g value 1.6 8.2 3.5 5.6 - 2.6 - -
\ iiue predicted by Troup & Hutton (Ref.6.2) 1.6 8.1 3.6 5.7 2.1 2.3 0.1 0.1 9.9
(Note: i n Troup and Hutton's paper the x and z axis are interchanged, the
r e s u l t of selecting a different convention for the a x i s . The table above
shows the figures i n the convention used in t h i s t h e s i s ) .
3 There i s good agreement except the g (TJO term which shows the need
5 5 to include higher order terms i n the Hamiltonian. The g {TT) and g (-r-)
~ JL —
have very low values which would correspond to a f i e l d of about 6.5 Tesla
which i s not a low f i e l d and the approximations w i l l not hold for t h i s
t r a n s i t i o n . To find the angular variation of the e f f e c t i v e g values a
perturbation approach should be used but as can be seen from Fi g s . 3.1 and
3.2 the l e v e l s diverge almost l i n e a r l y in the region O to 0.5 Tesla.
This means that the fine structure terms have a small e f f e c t on the
38
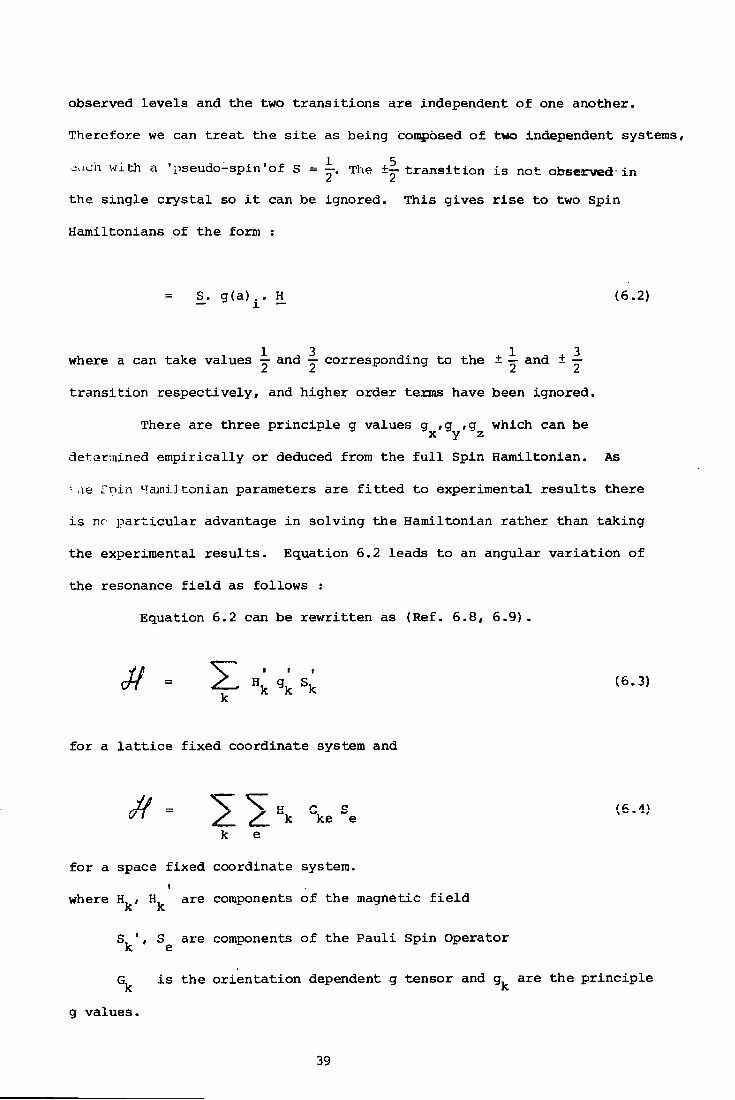
observed l e v e l s and the two tr a n s i t i o n s are independent of one another.
T h e r e f o r e we can treat the s i t e a s being composed of two independent systems,
j . i c h w i t h a 'pseudo-spin'of s = j . The ±~ t r a n s i t i o n i s n o t observed-in
t h e single c r y s t a l so i t can be ignored. This gives r i s e to two Spin
Hamiltonians of the form :
S_. g(a) . H (6.2)
1 3 1 3 where a can take values — and — corresponding to the ± — and ± —
tra n s i t i o n respectively, and higher order terms have been ignored.
There are three p r i n c i p l e g values g , g ,g which can be x y z
d e t e r m i n e d empirically or deduced from the f u l l Spin Hamiltonian. As
' ae f n i n Haini] t o n i a n parameters are f i t t e d to experimental r e s u l t s there
i s n r p a r t i c u l a r advantage i n solving the Hamiltonian rather than taking
the experimental r e s u l t s . Equation 6.2 leads to an angular variation of
the resonance f i e l d as follows :
Equation 6.2 can be rewritten as (Ref. 6.8, 6.9).
o f / = S H' g" s/ ( 6 ' 3 )
for a l a t t i c e fixed coordinate system and
I f _ \ V „ n c
ui - -^_ <S_ "k "ke e
k e
for a space fixed coordinate system.
where H , H are components of the magnetic f i e l d S^', S g are components of the Pauli Spin Operator
G i s the orientation dependent g tensor and g are the p r i n c i p l e k k g values.
39
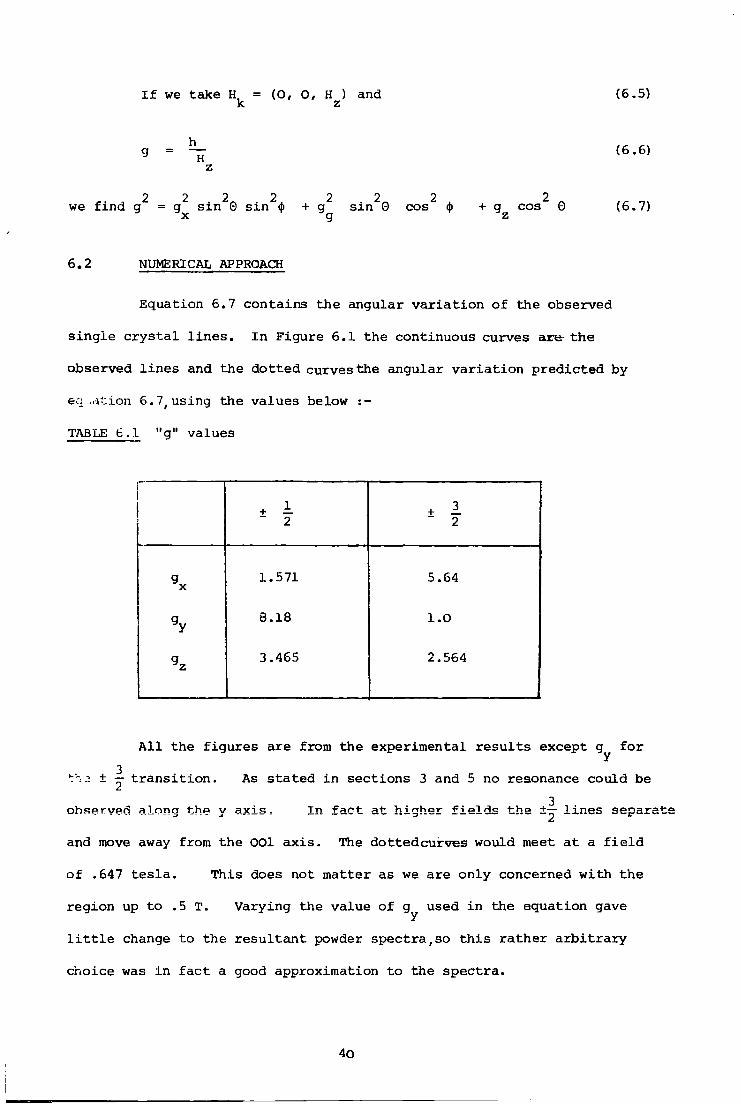
I f we take H, = (O, O, H ) and k z (6.5)
(6.6)
2 2 2 2 2 2 2 2 we find g = g s i n 0 s i n d) + g s i n 0 cos d> + g cos 0 x g z (6.7)
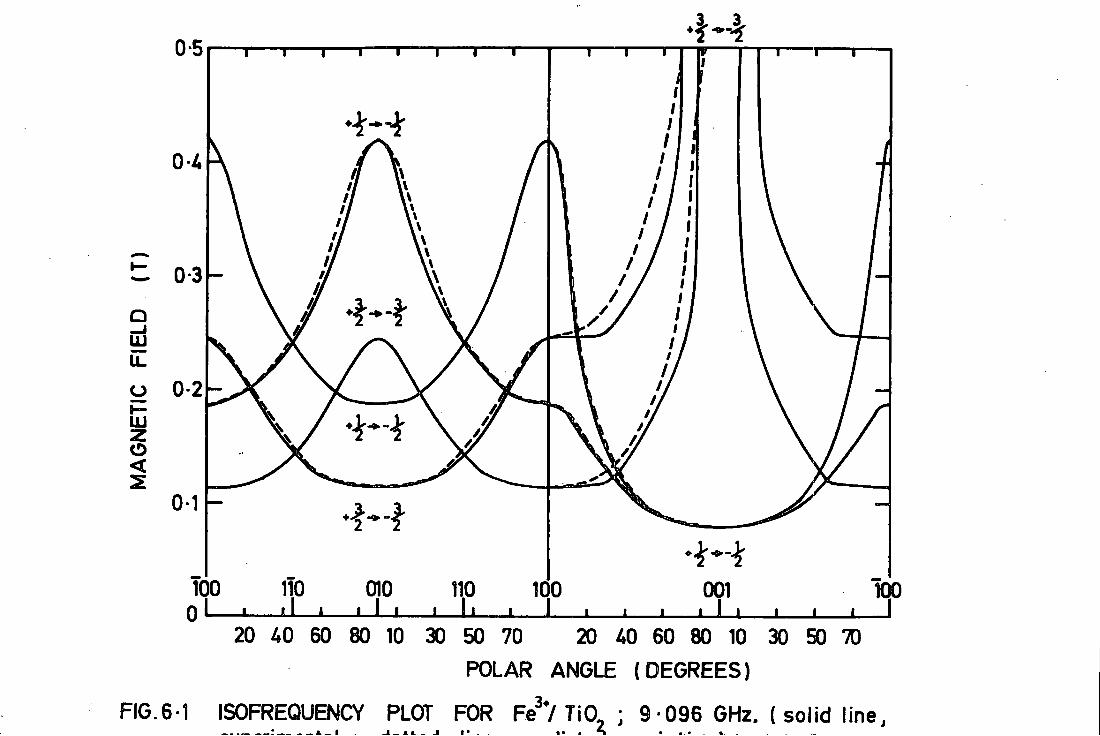
6.2 NUMERICAL APPROACH
Equation 6.7 contains the angular v a r i a t i o n of the observed
single c r y s t a l l i n e s . I n Figure 6.1 the continuous curves are- the
observed l i n e s and the dotted curves the angular variation predicted by
eq ..rition 6.7 using the values below :-
TABLE 6.1 "g" values
+ 1 ~ 2 + A
~ 2
g 1.571 5.64 X
g.. 8.18 l.O y
g 3.465 2.564 z
A l l the figures are from the experimental r e s u l t s except g^ for
":h 3 ± •— t r a n s i t i o n . As stated i n sections 3 and 5 no resonance could be 3
observed along the y axis = I n fact at higher f i e l d s the ±— l i n e s separa
and move away from the OOl ax i s . The dottedcurves would meet at a f i e l d
of .647 t e s l a . This does not matter as we are only concerned with the
region up to .5 T. Varying the value of g^ used i n the equation gave
l i t t l e change to the resultant powder spectra,so t h i s rather arbitrary
choice was in fa c t a good approximation to the spectra.
4o
*
C 0-3h
Q _ j LLJ L L
O t— LU Z o <
20 40 60 80 10 30 50 70 20 40 60 80 10 30 EK) 70 POLAR ANGLE ( D E G R E E S )
FIG. 6-1 3*. ISOFREQUENCY PLOT FOR Fe 7 TiO ; 9-096 GHz. (sol id line,
1 _ J. a I
6.3 ANALYTICAL APPROACH
(due to Kneubuhl, Ref. 6.8 - also Ref. 6.9)
Starting with equation (5.5) :_
S (H) = n" 1 (dH) 1
we can write. _
H + dH z z dfi ( 6 . 8 )
H-z
S (H) = tt -1 dn |grad n H|
( 6 . 9 )
where J2v i s £2 reduced by the condition H = constant. As dfi = dyd<|>
ti-i^s becomes —
S (H) = n -1 grad H dy d<j) ( 6 . 1 0 )
= ft -1 ( 6 . 1 1 )
2 it
-1
£r sinG dG 3H 3<|> ( 6 . 1 2 )
Due to the symmetry of g (eqn. 6.7) we need only consider an element of
0, = IT/2. NOW from equations 6.6 and 6.7 we can write : —
hv , 2 . 2n . 2 A 2 . 2 R T 2 A 2 2 „ 4 H = — (g s i n 0 s i n <j> + g„ s i n 0 cos <(> + g., cos 0) p i /. J
where the condition g^ > g^> g^ must be imposed. ( 6 . 1 3 )
41
and writing H etc.
we get -2 2 2 -2 2 2 -2 2 H = (1^ s i n Osin <f> + H 2 s i n Gcos <j>+ H 3 cos 0 ) (6.14)
and substituting into (6.31)
S(H) = - 3 -2 2 2 —2 2 2 —2 2 •gg- (H^ s i n Gsin $ + s i- n Qcos (|> + cos 0) -1
sin0d0
J
0' (6.15)
2 IT
-2 2 2 -2 2 2 -2 2 (H. s i n 0sin ((> +H2 s i n 0cos cos 0)
-2 -2 (H^ - ) sin0sin(|>cos<|>
3/2
d0 (6.16)
Evaluating the integral we find that
V H < H2
S(H) = -H 1 H 2 H 3 H
-2
(H^-H 2,* ( H ^ V K(k) (6.17)
H 3 >H> H 2
S(H) = 7_ i r
H 1 H 2 H 3 H
-2
2 2 ^ 2 (H -H2 ) (H-H3 ) K(l/k) (6.18)
a l l other H S(H) = O (6.19)
where k = 2 2 2 2
( H2 - H/) (H - H 3
2 ) 2 2 2 2 (H x - H ) (H 2 - H 3 )
(6.20)
42
and K(k) i s an e l i p t i c a l integral of the f i r s t kind ;
ir/2
(1-k s i n b)
(6.21)
and K(oj = TT/2
r.(i) = »
Inspection of 6.17, 6.18 and 6.19 shows that the spectra w i l l have
s i n g u l a r i t i e s at H = H and H = H . From (6.20) H = H impii'es'that k = 1
rrom 6.21 K(k)= ~, i. e.S(H) .= °° , so a t h i r d s i n g u l a r i t y at H = i s
expected. The and s i n g u l a r i t i e s correspond to a step and that
at H.3 to a peak (Fig. 6.2a). The function S(H) can be convoluted with
a li.ieshape function for each t r a n s i t i o n i n Fe/Ti02 and the resultant
Lineshape function S K (H) i s the sum of the individual S(H) 1 s.
S (H) = a S (H) + S 3 (H) 2 2
where a i s a constant to simulate the e f f e c t of d i f f e r e n t amounts of
absorption for each t r a n s i t i o n . This assumes that the t r a n s i t i o n
probability i s independent of the orientation of the applied magnetic
f i e l d . This method has been improved to take account of varying
t r a n s i t i o n probability r to obtain a s i m i l a r formula^ but with extra
terms containing e l i p t i c a l integrals of the f i r s t and second kind
(Ref. 6.11).
43
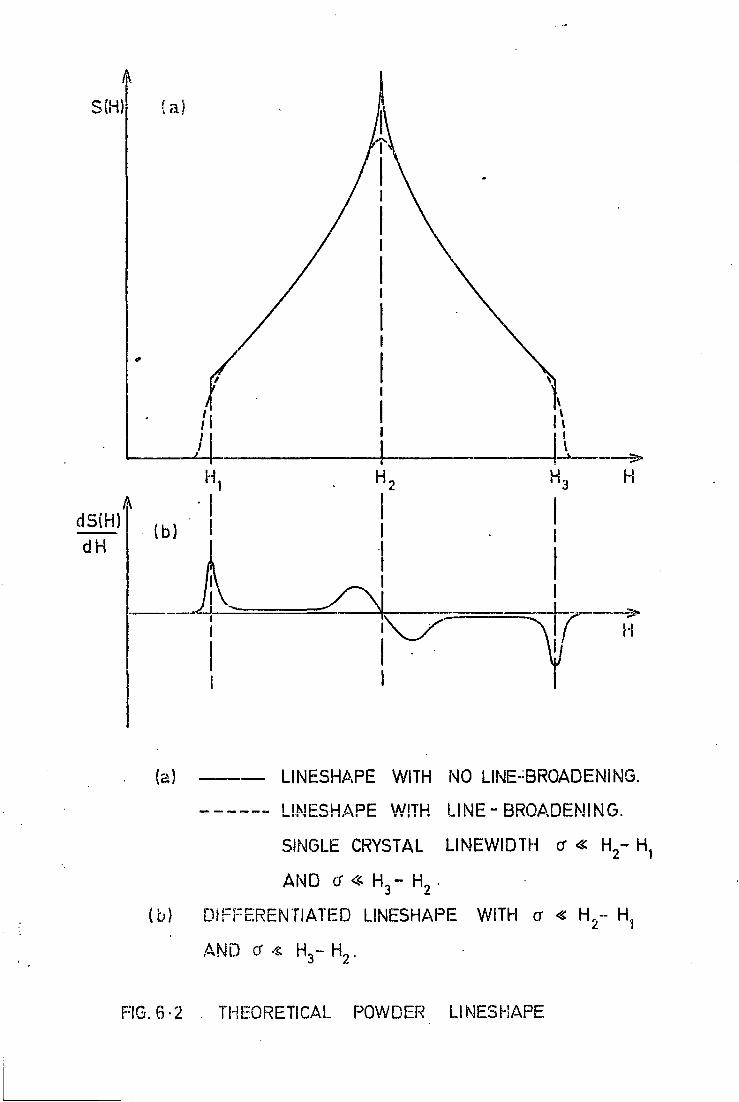
SiH)
(a) LINESHAPE WITH NO LINE-BROADENING.
I I M P Q . H A P P W I T H I IMP - R P H A n P M I M f ; t r i l l i • i i
(b)
SINGLE CRYSTAL LINEWIDTH cr « H 2 ~ H,
AND C « H 3 » H 2 •
DIFFERENTIATED LINESHAPE WITH cr « H 2 - H.(
AND cr * H 3 - H 2 .
FIG. 6-2 THEORETICAL POWDER LINESHAPE
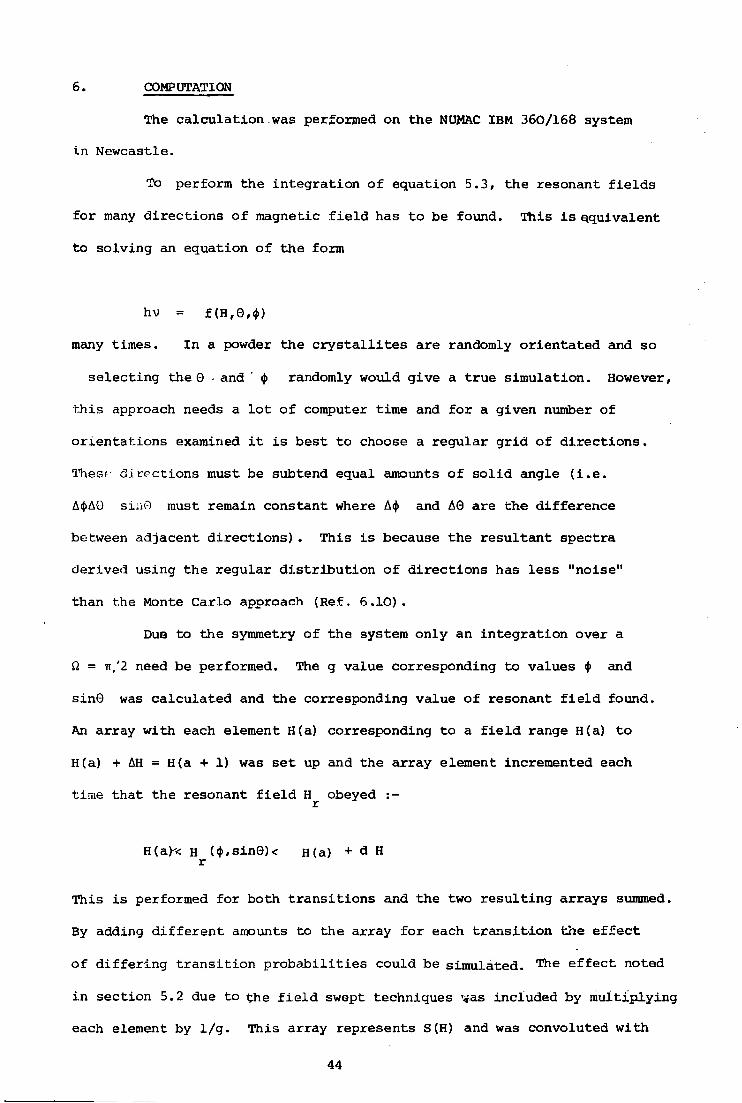
6. COMPUTATION
The calculation was performed on the NUMAC IBM 360/168 system
in Newcastle.
To perform the integration of equation 5.3, the resonant f i e l d s
for many directions of magnetic f i e l d has to be found. This i s equivalent
to solving an equation of the form
hv = f(H,0,(|>)
many times. In a powder the c r y s t a l l i t e s are randomly orientated and so
selecting the 0 - and ' $ randomly would give a true simulation. However,
thi s approach needs a l o t of computer time and for a given number of
orientations examined i t i s best to choose a regular grid of d i r e c t i o n s .
Thesf directions must be subtend equal amounts of s o l i d angle ( i . e .
A<J>AO sinfl must remain constant where A<|i and A0 are the difference
between adjacent d i r e c t i o n s ) . This i s because the resultant spectra
derived using the regular d i s t r i b u t i o n of directions has l e s s "noise"
than the Monte Carlo approach (Ref, 6.10),
Due to the symmetry of the system only an integration over a
0, = it,'2 need be performed. The g value corresponding to values <|> and
sinQ was calculated and the corresponding value of resonant f i e l d found.
An array with each element H(a) corresponding to a f i e l d range H(a) to
H(a) + AH = H(a + 1) was set up and the array element incremented each
time that the resonant f i e l d H obeyed :-r
H(a)-< H (<J>,sin0)< H ( a ) + d H r
This i s performed for both t r a n s i t i o n s and the two r e s u l t i n g arrays summed.
By adding di f f e r e n t amounts to the array for each t r a n s i t i o n the e f f e c t
of d i f f e r i n g t r a n s i t i o n p r o b a b i l i t i e s could be simulated. ^ e e f f e c t noted
in section 5.2 due to the f i e l d swept techniques was included by multiplying
each element by 1/g. This array represents S(H) and was convoluted with
44
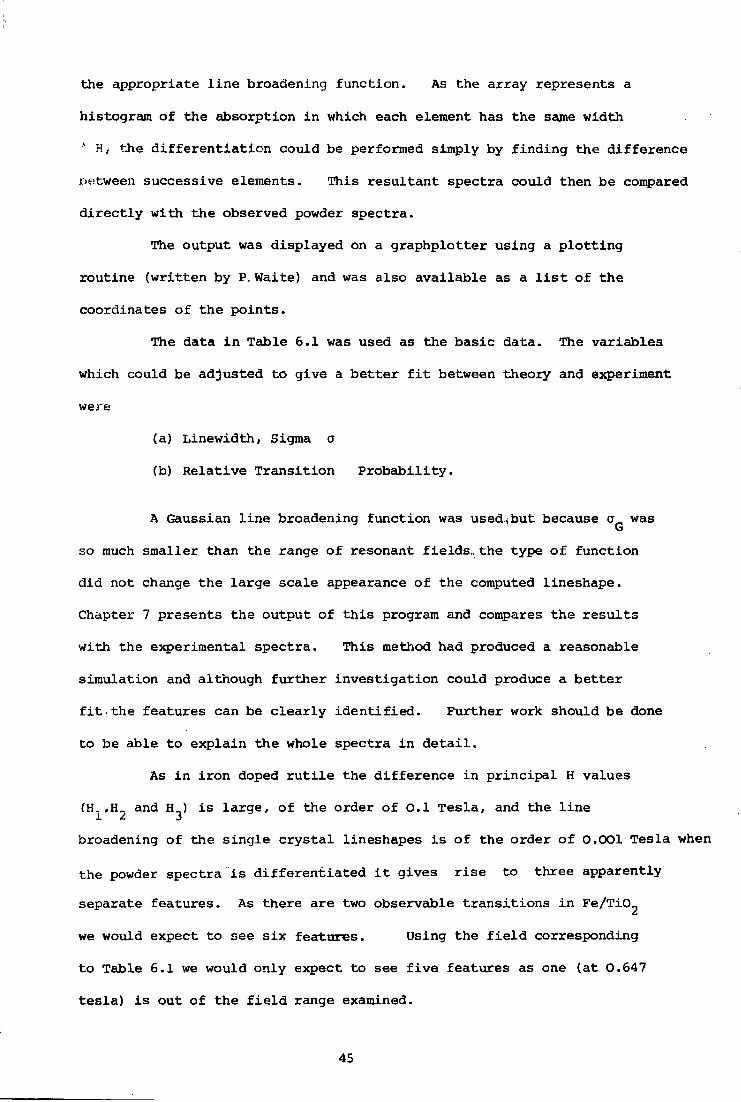
the appropriate l i n e broadening function. As the array represents a
histogram of the absorption i n which each element has the same width
* H, the d i f f e r e n t i a t i o n could be performed simply by finding the difference
between successive elements. This resultant spectra could then be compared
d i r e c t l y with the observed powder spectra.
The output was displayed on a graphplotter using a plotting
routine (written by P. Waite) and was also available as a l i s t of the
coordinates of the points.
The data i n Table 6.1 was used as the basic data. The variables
which could be adjusted to give a better f i t between theory and experiment
were
(a) Linewidth, Sigma a
(b) Relative Transition Probability.
A Gaussian l i n e broadening function was used sbut because a was G
so much smaller than the range of resonant fields., the type of function
did not change the large scale appearance of the computed lineshape.
Chapter 7 presents the output of t h i s program and compares the r e s u l t s
with the experimental spectra. This method had produced a reasonable
simulation and although further investigation could produce a better
f i t . t h e features can be c l e a r l y i d e n t i f i e d . Further work should be done
to be able to explain the whole spectra i n d e t a i l .
As i n iron doped r u t i l e the difference in principal H values
(H.»H_ and H_) i s larqe, of the order of 0.1 Tesla, and the l i n e
broadening of the single c r y s t a l lineshapes i s of the order of 0.0O1 Tesla when
the powder spectra i s differentiated i t gives r i s e to three apparently
separate features. As there are two observable t r a n s i t i o n s i n Fe/TiC^
we would expect to see s i x features. Using the f i e l d corresponding
to Table 6.1 we would only expect to see f i v e features as one (at 0.647
tesla) i s out of the f i e l d range examined.
45
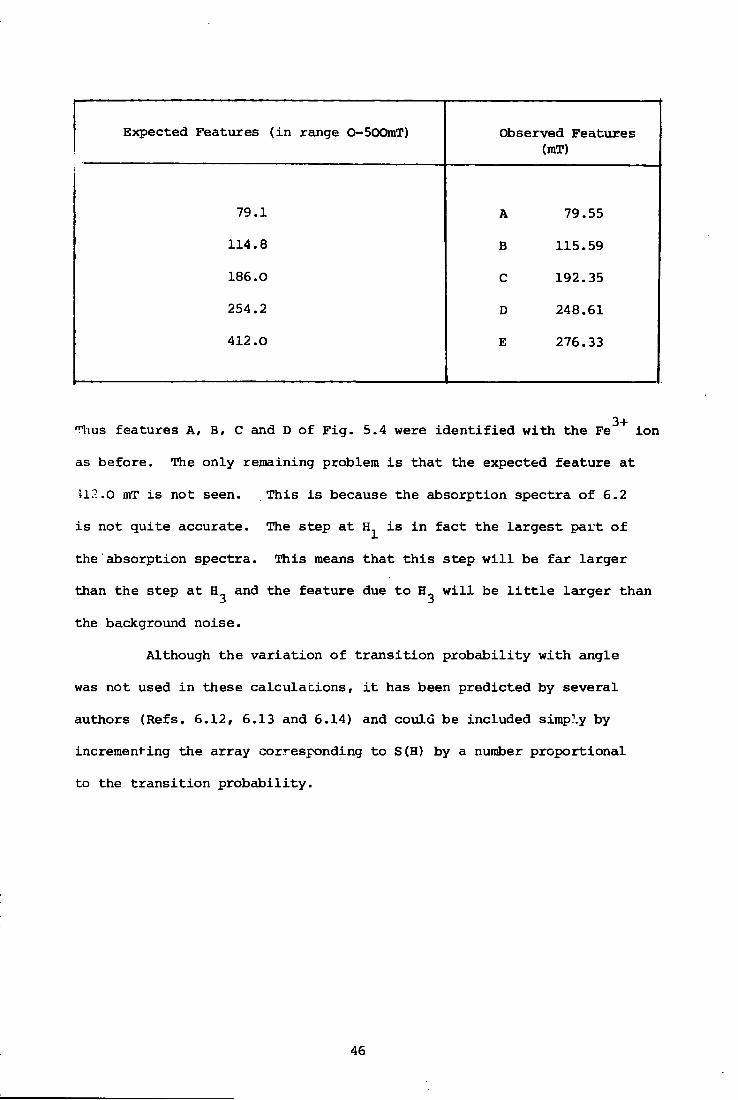
Expected Features (in range 0-500mT) Observed Features (mT)
79.1 A 79. 55
114.8 B 115. 59
186.0 C 192. 35
254.2 D 248. 61
412.0 E 276. 33
TTius features A, B, C and D of F i g . 5.4 were i d e n t i f i e d with the Fe ion
as before. The only remaining problem i s that the expected feature at
UP. .0 mT i s not seen. This i s because the absorption spectra of 6.2
i s not quite accurate. The step at i s i n fact the larg e s t part of
the absorption spectra. This means that t h i s step w i l l be f a r larger
than the step at and the feature due to w i l l be l i t t l e larger than
the background noise.
Although the variation of t r a n s i t i o n probability with angle
was not used i n these calculations, i t has been predicted by several
authors (Refs. 6.12, 6.13 and 6.14) and could be included simp.\y by
incrementing the array corresponding to S(H) by a number proportional
to the t r a n s i t i o n probability.
46
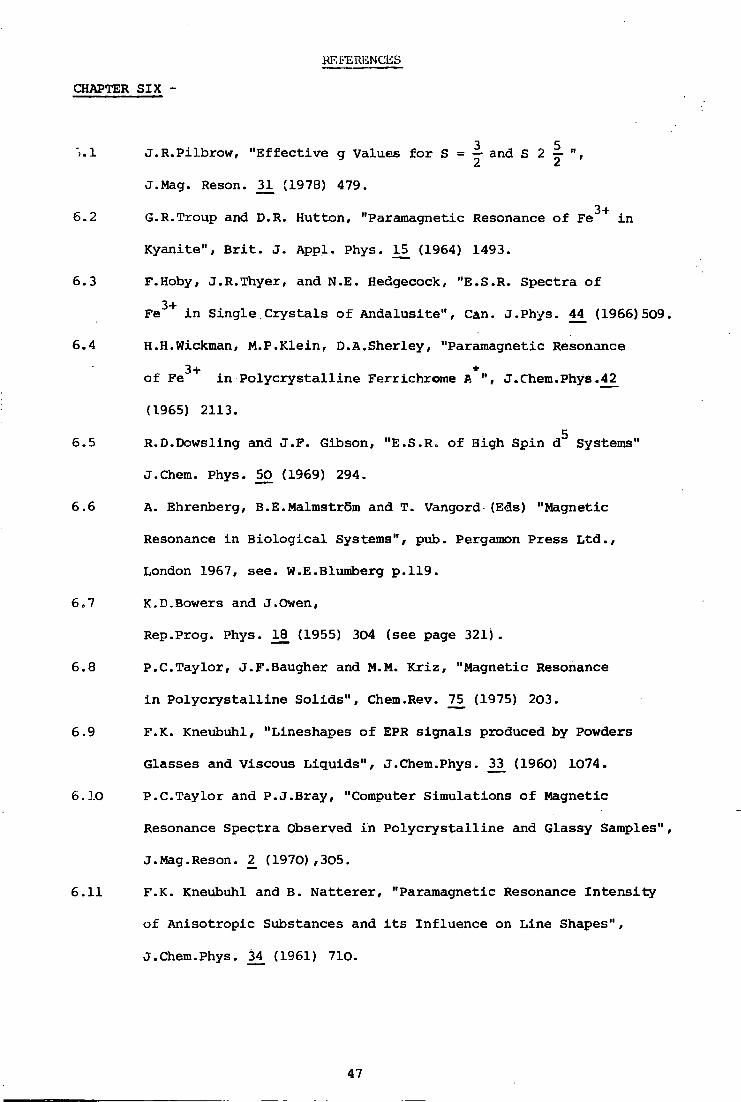
REFERENCES
CHAPTER SIX -
3 5 J.R.Pilbrow, "E f f e c t i v e g Values for S = — and S 2 ^ ",
2 2
J.Mag. Reson. 3_1 (1978) 479.
6.2 G.R.Troup and D.R. Hutton, "Paramagnetic Resonance of F e ^ + i n
Kyanite", B r i t . J . Appl. Phys. 15_ (1964) 1493.
6.3 F.Hoby, J.R.Thyer, and N.E. Hedgecock, "E.S.R. Spectra of
F e 3 + i n Single Crystals of Andalusite", Can. J.Phys. 4£ (1966)509
6.4 H.H.Wickman, M.P.Klein, D.A.Sherley, "Paramagnetic Resonance 3+ * of Fe i n P o l y c r y s t a l l i n e Ferrichrome A ", J.Chem.Phys.42
(1965) 2113.
6.5 R.D.Dowsling and J.F. Gibson, "E.S.R. of High Spin d^ Systems"
J.Chem. Phys. 50 (1969) 294.
6.6 A. Ehrenberg, B.E.Malmstr5m and T. Vangord (Eds) "Magnetic
Resonance in Biological Systems", pub. Pergamon Press Ltd.,
London 1967, see. W.E.Blumberg p.119.
6.7 K.D.Bowers and J.Owen,
Rep.Prog. Phys. Ij3 (1955) 304 (see page 321).
6.8 P.C.Taylor, J.F.Baugher and M.M. K r i z , "Magnetic Resonance
i n P o l y c r y s t a l l i n e Solids", Chem.Rev. 75 (1975) 203.
6.9 F.K. Kneubuhl, "Lineshapes of EPR signals produced by Powders
Glasses and Viscous Liquids", J.Chem.Phys. 33 (1960) 1074.
6.10 P.C.Taylor and P.J.Bray, "Computer Simulations of Magnetic
Resonance Spectra Observed in P o l y c r y s t a l l i n e and Glassy Samples"
J.Mag.Reson. 2_ (1970) ,305.
6.11 F.K. Kneubuhl and B. Natterer, "Paramagnetic Resonance I n t e n s i t y
of Anisotropic Substances and i t s Influence on Line Shapes",
J.Chem.Phys. 34 (1961) 710.
47
6.12 G.J.Troup and D.R.Hutton, "Paramagnetic Resonance of Fe
in Kyanite", Brit.J.Appl.Phys. lj j (1964) 1493.
0.13 H.H.Wickman, M.P.Klein, and D.A. Shirl e y , "Paramagnetic 3+ * Resonance of Fe i n P o l y c r y s t a l l i n e Ferrichrorae A ", J.Chem.
J.Chem Phys. 42 (1965) 2113.
6.14 F.Hpbey, "The Spin Hamiltonian and I n t e n s i t i e s of the ESR
Spectra Originating from Large Zero F i e l d E f f e c t s of
States", Can.J.Phys. 44 (1966) 503.
48
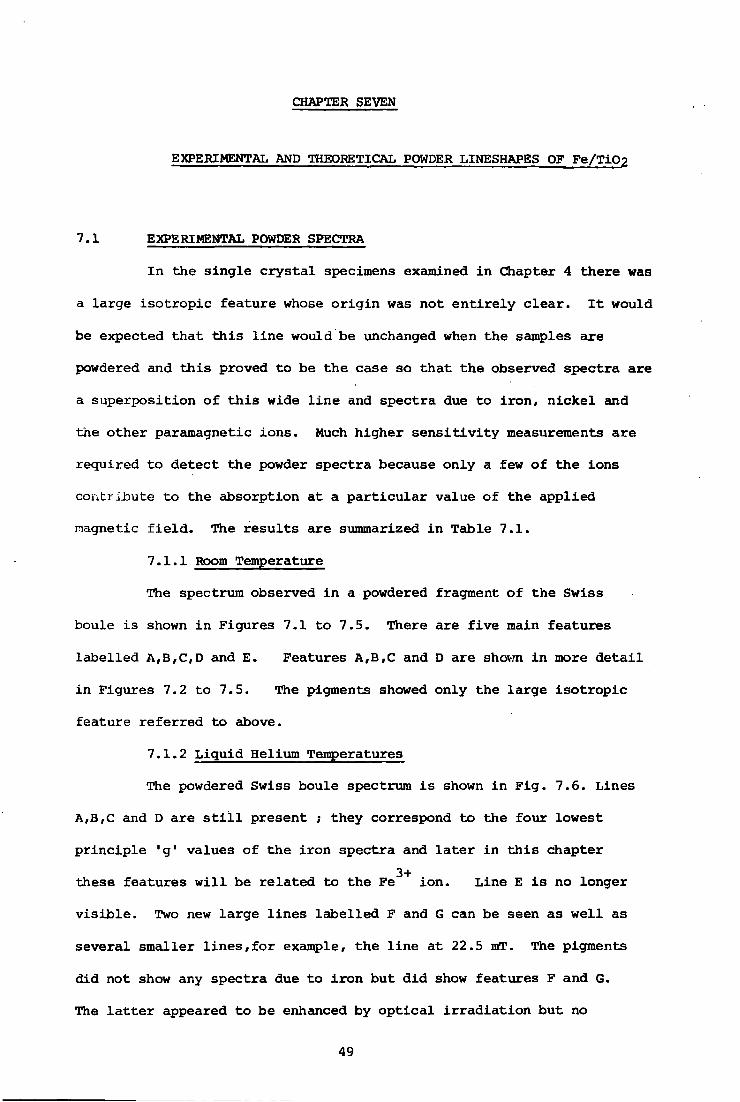
CHAPTER SEVEN
EXPERIMENTAL AND THEORETICAL POWDER LINESHAPES OF Fe/TiO?
7.1 EXPERIMENTAL POWDER SPECTRA
In the single c r y s t a l specimens examined i n Chapter 4 there was
a large i s o t r o p i c feature whose o r i g i n was not e n t i r e l y c l e a r . I t would
be expected that t h i s l i n e would be unchanged when the samples are
powdered and t h i s proved to be the case so that the observed spectra are
a superposition of t h i s wide l i n e and spectra due to iron, n i c k e l and
the other paramagnetic ions. Much higher s e n s i t i v i t y measurements are
required to detect the powder spectra because only a few of the ions
contribute to the absorption at a p a r t i c u l a r value of the applied
magnetic f i e l d . The r e s u l t s are summarized i n Table 7.1.
7.1.1 Room Temperature
The spectrum observed i n a powdered fragment of the Swiss
boule i s shown i n Figures 7.1 to 7.5. There are f i v e main features
labelled A,B,C,D and E. Features A,B,C and D are shown i n more d e t a i l
i n Figures 7.2 to 7.5. The pigments showed only the large i s o t r o p i c
feature referred to above.
7.1.2 Liquid Helium Temperatures
The powdered Swiss boule spectrum i s shown in F i g . 7.6. Lines
A,B,C and D are s t i l l present ; they correspond to the four lowest
princ i p l e 1 g" values of the iron spectra and l a t e r i n t h i s chapter 3+
these features w i l l be related to the Fe ion. Line E i s no longer
v i s i b l e . Two new large l i n e s l abelled F and G can be seen as well as
several smaller l i n e s , f o r example, the l i n e at 22.5 mT. The pigments
did not show any spectra due to iron but did show features F and G.
The l a t t e r appeared to be enhanced by o p t i c a l i r r a d i a t i o n but no 49
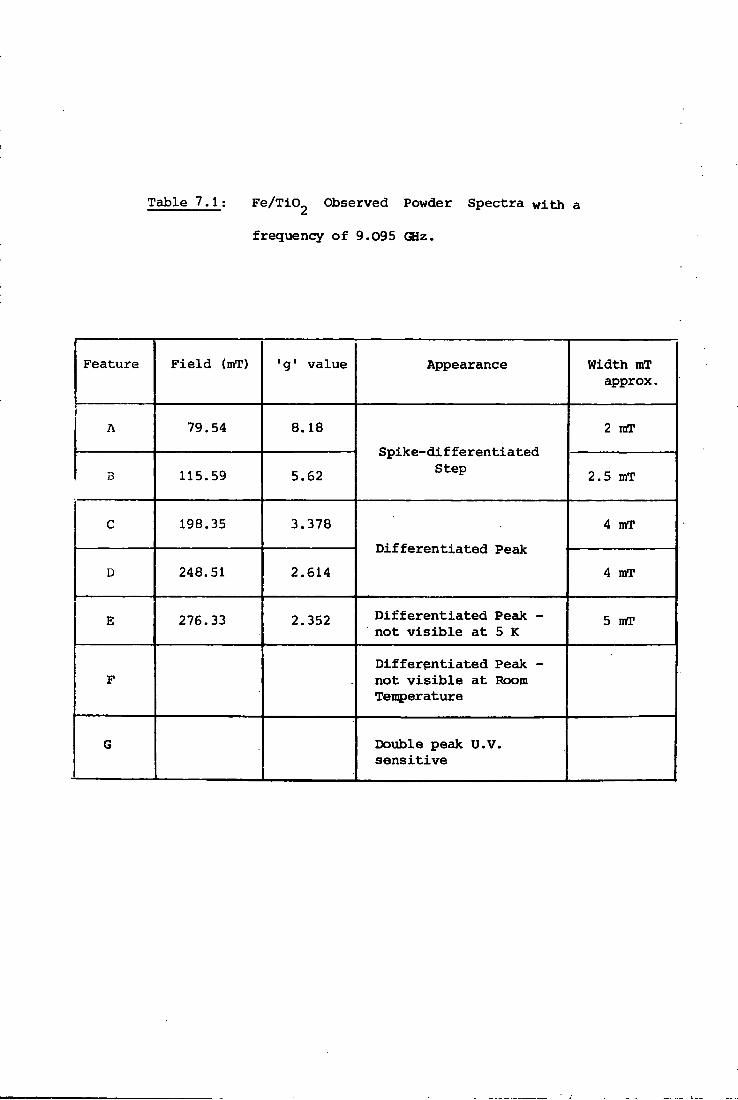
Table 7.1: Fe/TiC^ Observed Powder Spectra with a
frequency of 9.095 GHz.
Feature F i e l d (mT) 1g' value Appearance Width mT approx.
A 79.54 8.18
Spike-differentiated Step
2 mT
B 115.59 5.62
Spike-differentiated Step 2.5 mT
C 198.35 3.378
Differentiated Peak 4 mT
D 248.51 2.614
Differentiated Peak 4 mT
E 276.33 2.352 Differentiated Peak -not v i s i b l e at 5 K 5 mT
F Differentiated Peak -not v i s i b l e at Room Temperature
G Double peak U.V. s e n s i t i v e
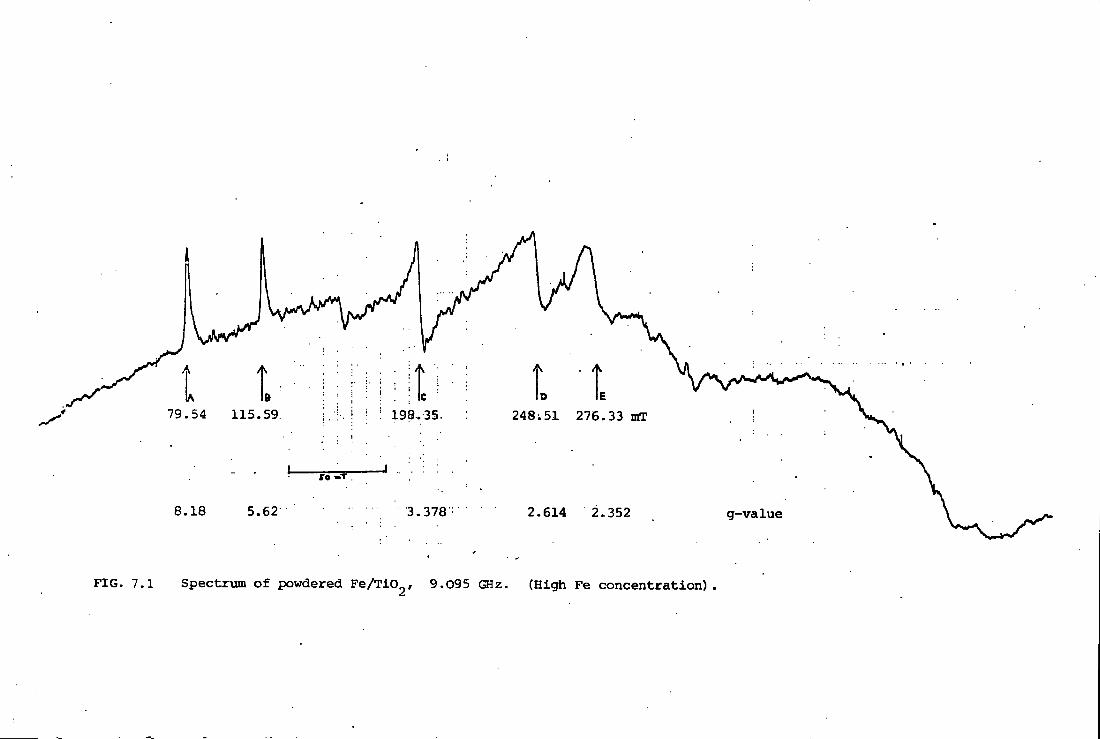
E A C
A
A 9 79.54 115.59. 1 9 8 , 3 5 248;51 2 7 6 . 3 3 mT
SO -T
8.18 5.62 3.378 2.614 2.352 g-value
Spectrum of powdered Fe/TiO FIG. 7.1 9.095 GHz (High Fe concentration)
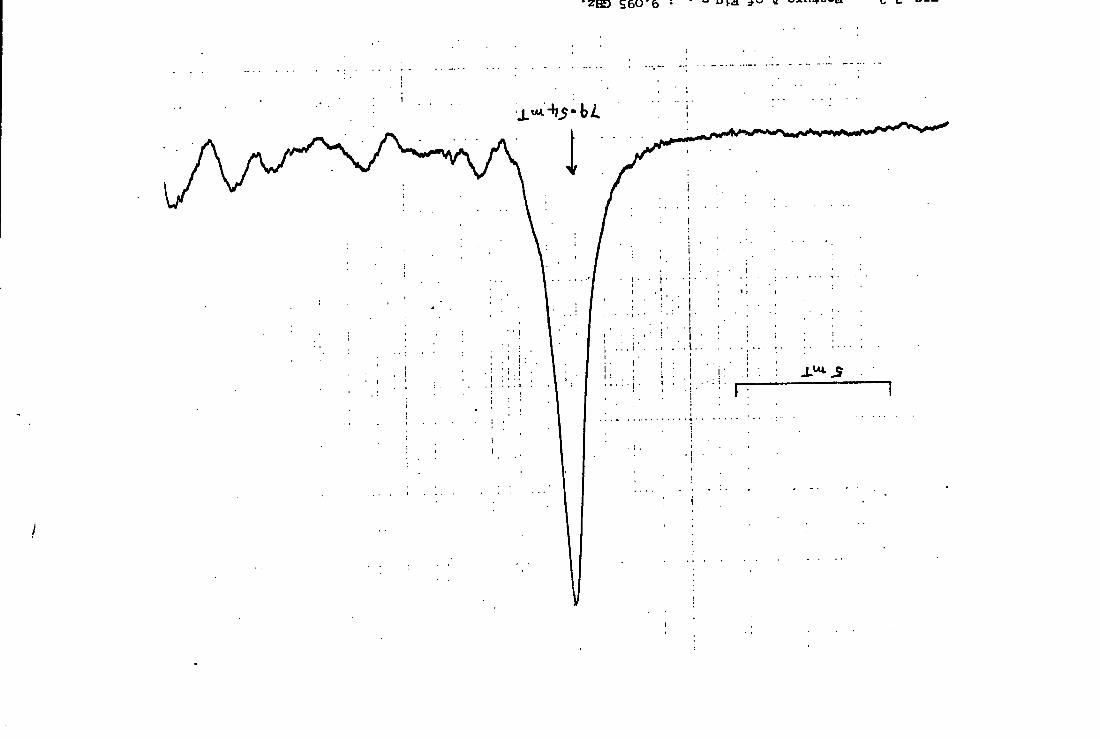
i
I
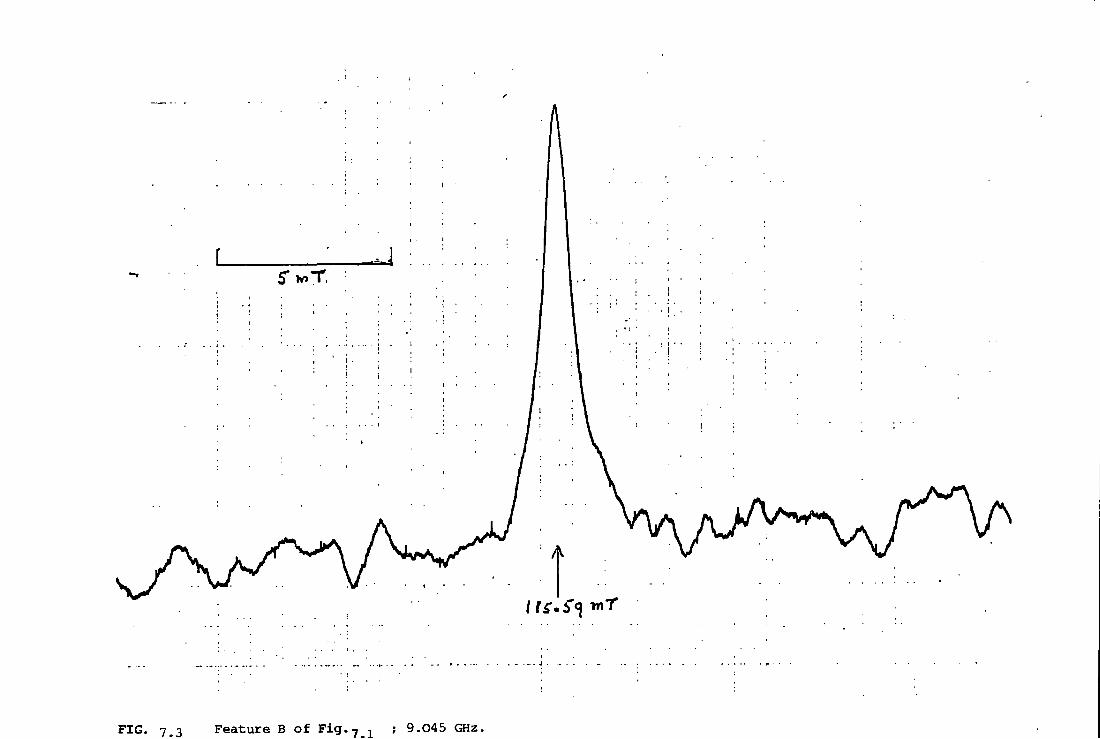
FIG. 7.3 Feature B of F i g . 7 , ; 9.045 GHz.
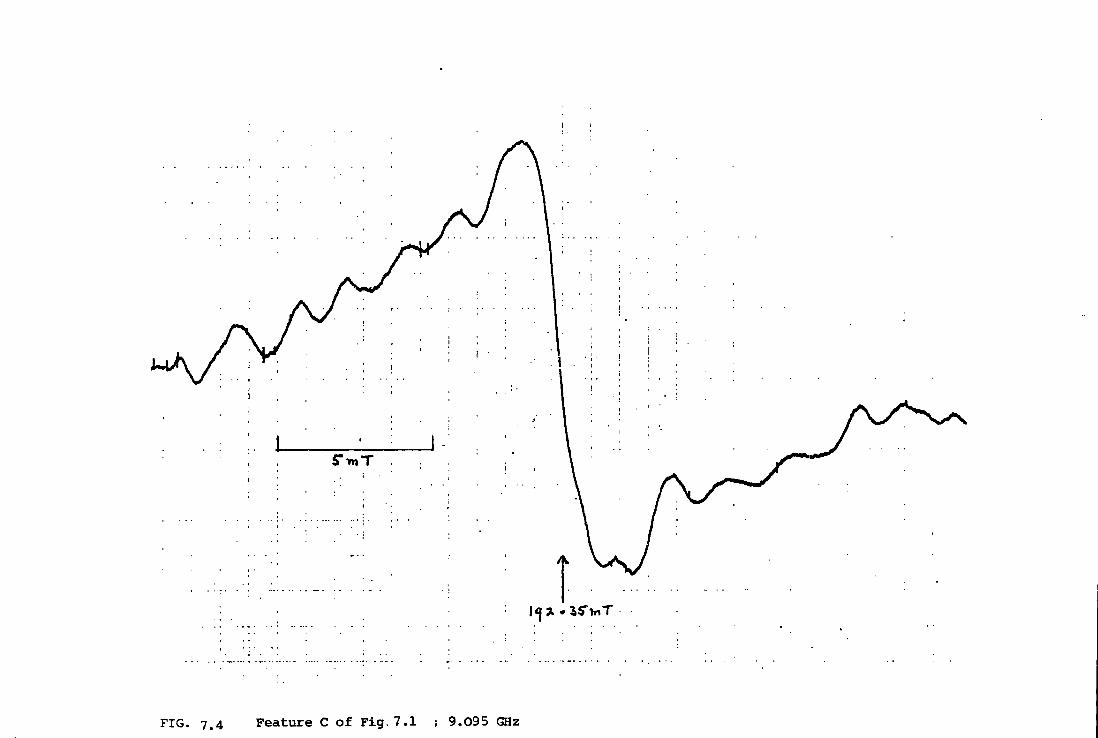
r > n T
1 F I G . 7.4 Feature C of Fig.7.1 ; 9.095 GHz
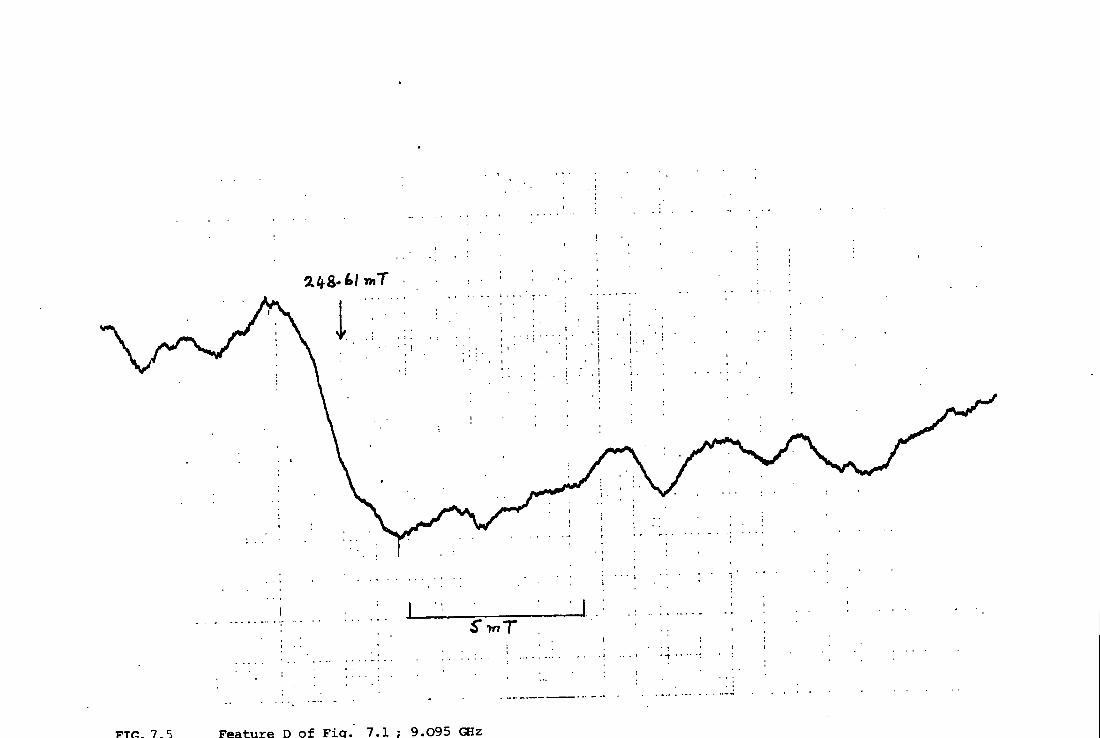
P T f : . 7.5 Feature D of Fiq. 7.1 ; 9.095 GHz
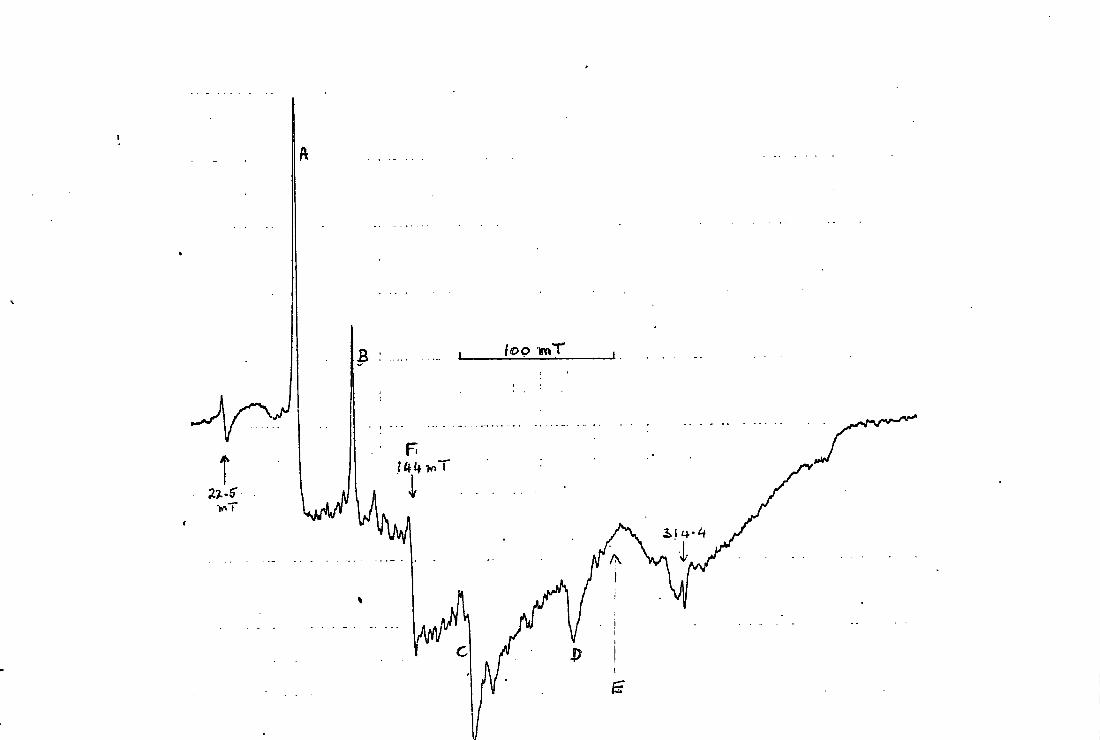
1
ioo vnT B
-An £1 i
i
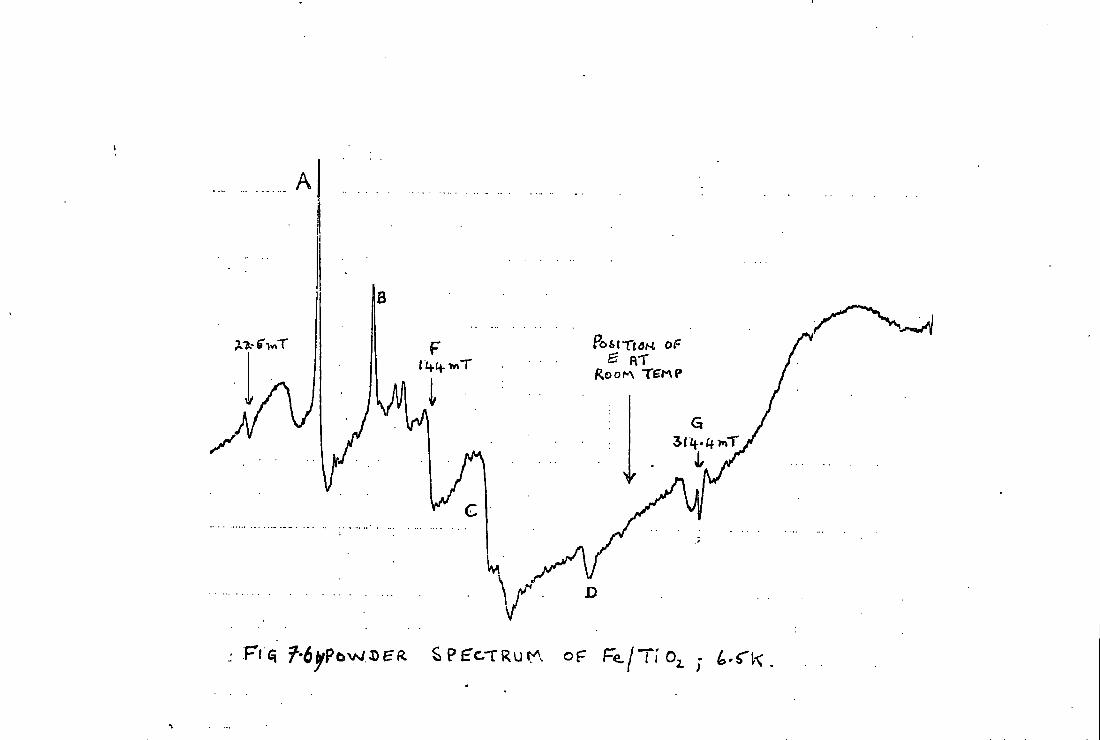
A
3
>6>« i B AT
7 1
3( 0-. £f >nT
\ y . D V
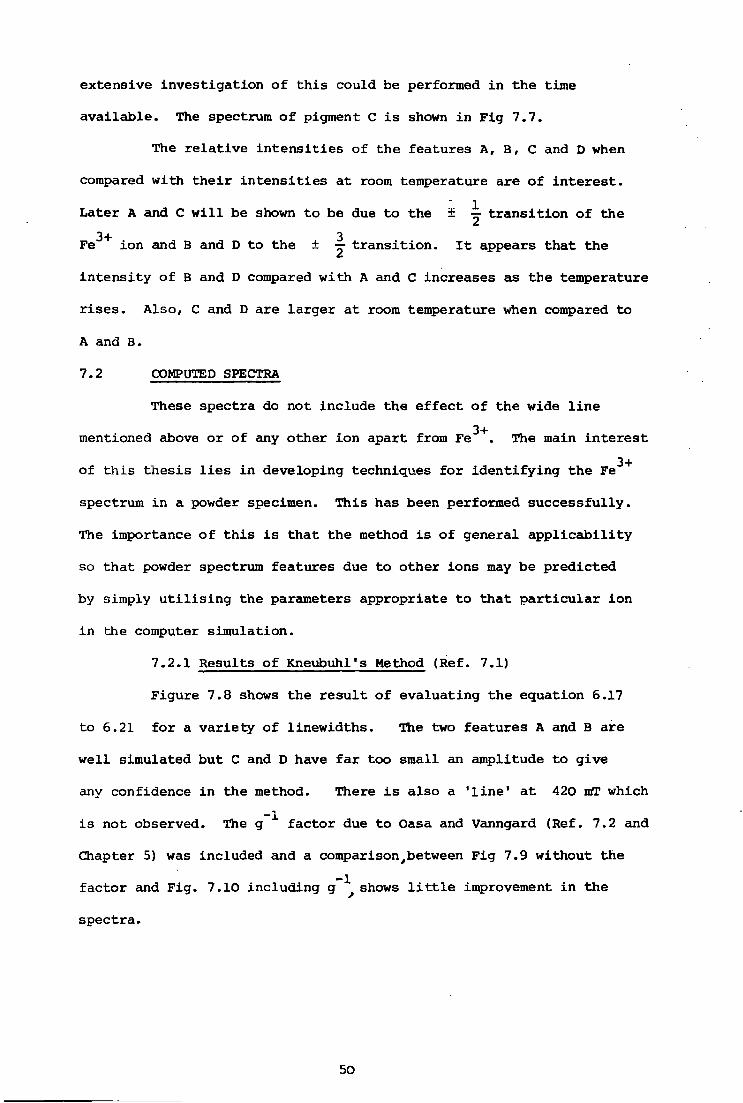
extensive investigation of t h i s could be performed i n the time
ava i l a b l e . The spectrum of pigment C i s shown i n Fig 7.7.
The r e l a t i v e i n t e n s i t i e s of the features A, B, C and D when
compared with t h e i r i n t e n s i t i e s at room temperature are of i n t e r e s t .
Later A and C w i l l be shown to be due to the i ^ t r a n s i t i o n of the 3+ 3 Fe ion and B and D to the ± — t r a n s i t i o n . I t appears that the
in t e n s i t y of B and D compared with A and C increases as the temperature
r i s e s . Also, C and D are larger at room temperature when compared to
A and B.
7.2 COMPUTED SPECTRA
These spectra do not include the e f f e c t of the wide l i n e
mentioned above or of any other ion apart from Fe^ +. The main i n t e r e s t
of t h i s t h e s i s l i e s i n developing techniques for identifying the F e ^ +
spectrum i n a powder specimen. This has been performed s u c c e s s f u l l y .
The importance of t h i s i s that the method i s of general a p p l i c a b i l i t y
so that powder spectrum features due to other ions may be predicted
by simply u t i l i s i n g the parameters appropriate to that p a r t i c u l a r ion
i n the computer simulation.
7.2.1 Results of Kneubuhl's Method (Ref. 7.1)
Figure 7.8 shows the r e s u l t of evaluating the equation 6.17
to 6.21 for a variety of linewidths. The two features A and B are
well simulated but C and D have f a r too small an amplitude to give
any confidence i n the method. There i s also a ' l i n e ' at 420 mT which
i s not observed. The g A factor due to Oasa and Vanngard (Ref. 7.2 and
Chapter 5) was included and a comparison,between Fig 7.9 without the
factor and Fig. 7.10 including g ^ shows l i t t l e improvement i n the
spectra.
50
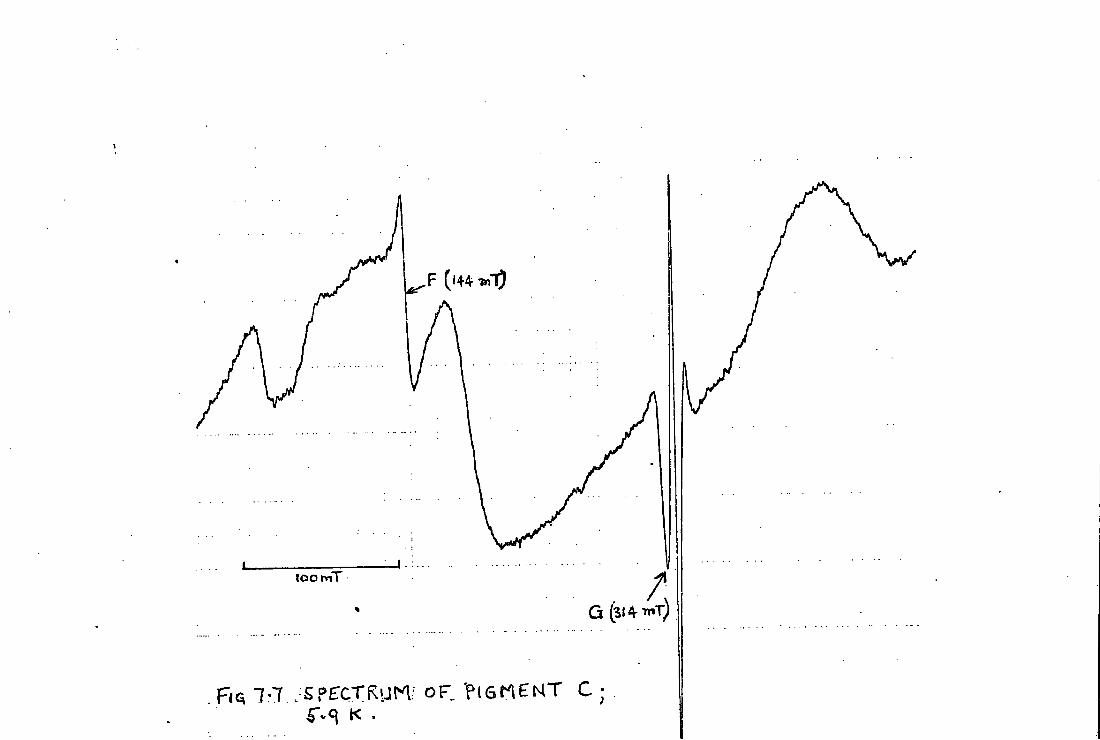
\ f (14*
loomT
/SPECTRUM/ O F 'ptGt^EMT C ;
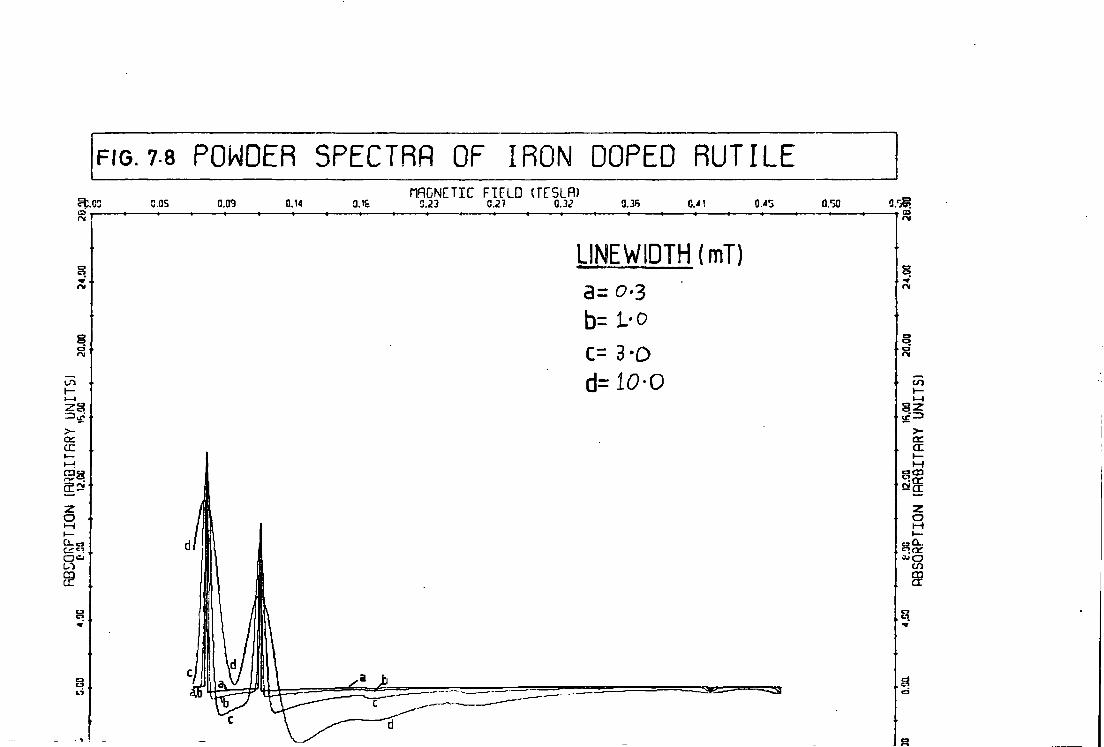
FIG. 7-8 POWDER SPECTRA OF IRON DOPED RUTILE COS (1RCNETIC F I f L D (TTSLR)
0.03 0.14 3.1£ S.i3 C.27 0.32 0.3ft 0.*5 0.50
>-
£2!
LINE WIDTH (mT)
a = o-3 b = l-o C = 3 - D
d = l o - o
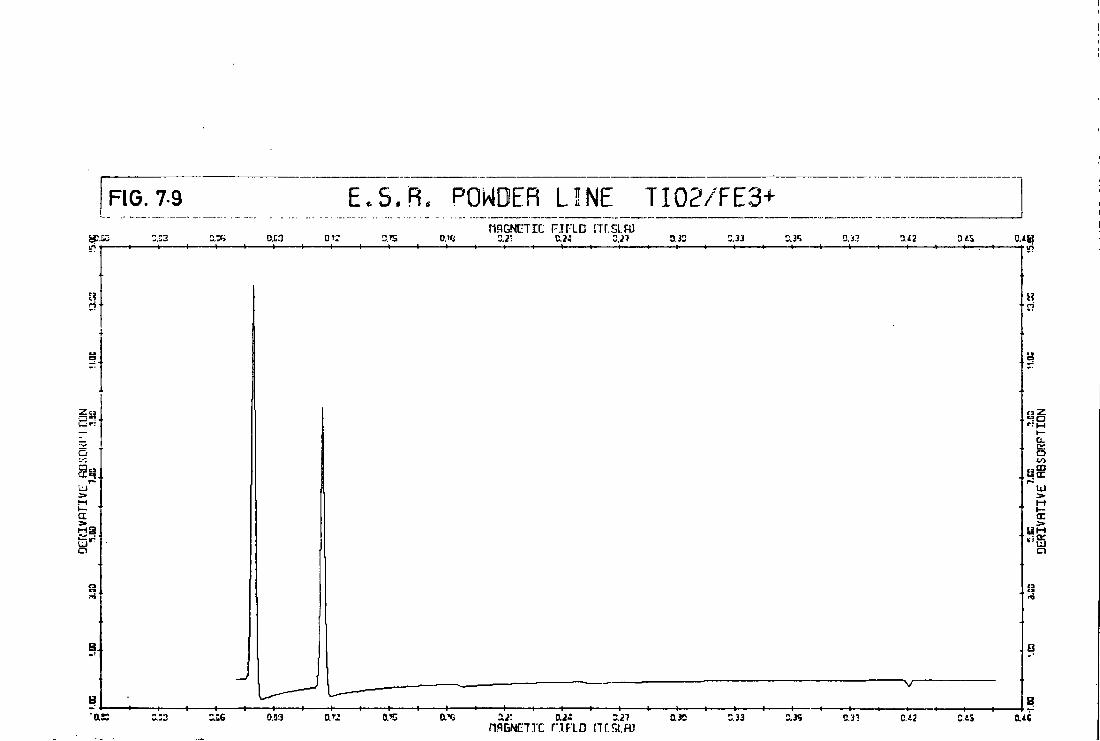
FIG. 7-9 E . S . R . POWDER LINE T I02 /FE3+ DX3
riflGNCTirj FT [ID STr.SLR) :.2i c.2," z.n D.i.2 3
i t f 0.2J 3.27 MAGNETIC ru- iD nr.5i.ro
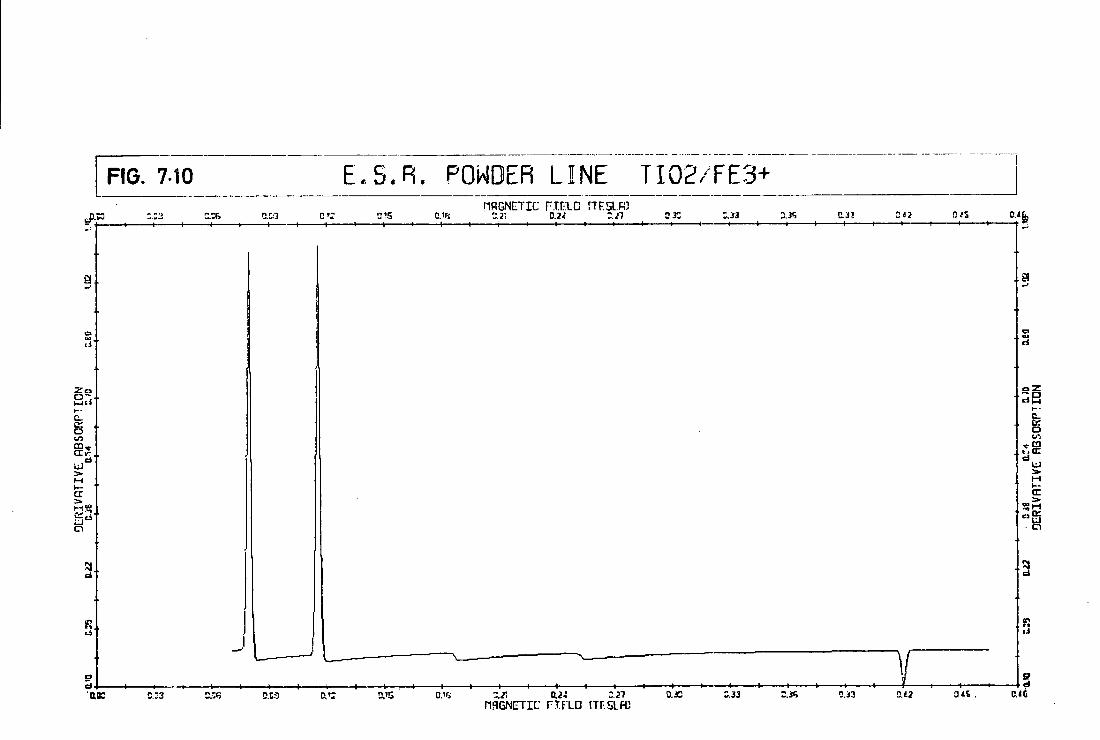
FIG. 710 E . S . R . POWDER LINE T I02 /FE3+ cP-p :.zn
nRGNETIC FIELD !T£5L.R3 G.lfi C.24 Z.il 3.3C ;.33 CL33 H 2
ass ax C.C3 C."l 1.X B.H 2.21 mrnLTIV F I E L D ITF.SI.H3
33
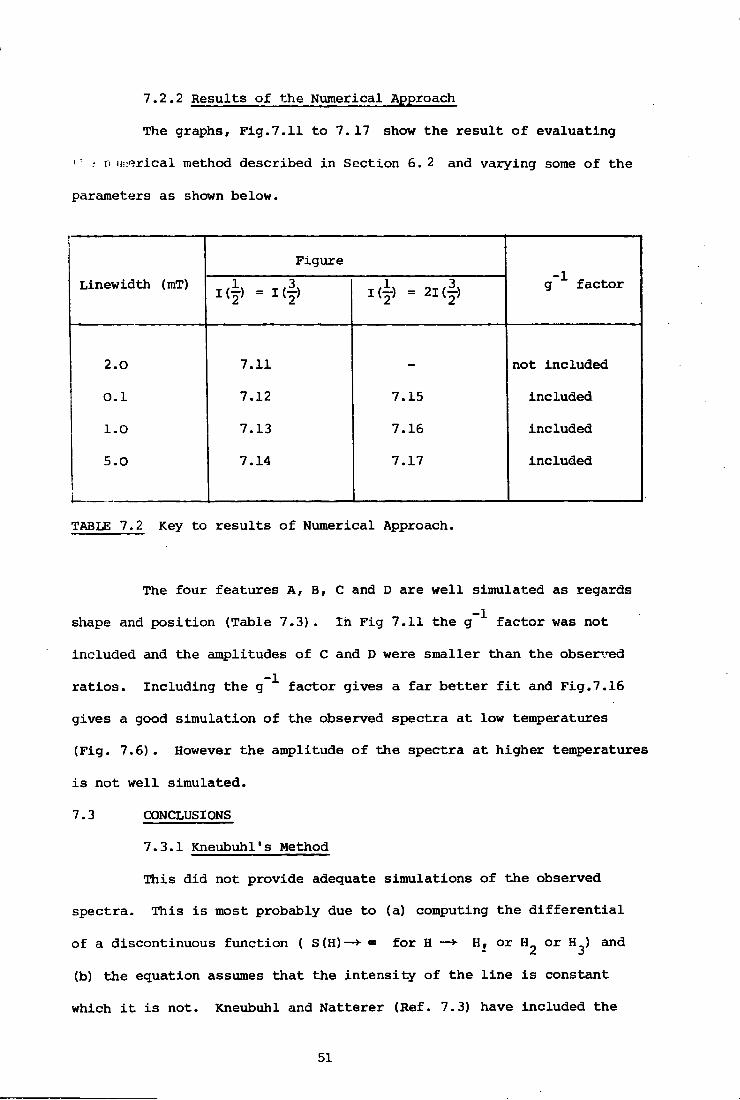
7.2.2 Results of the Numerical Approach
The graphs, Fig.7.11 to 7. 17 show the r e s u l t of evaluating
<'• • n u ^ r i c a l method described in Section 6.2 and varying some of the
parameters as shown below.
Linewidth (mT) Figure
g ^ factor Linewidth (mT) 1 ( f ) = 1 ( f ) 1 ( f ) = 2 1 ( f ) g ^ factor
2.0 7.11 _ not included
O.l 7.12 7.15 included
1.0 7.13 7.16 included
5.0
L.
7.14 7.17 included
TABLE 7.2 Key to r e s u l t s of Numerical Approach.
The four features A, B, C and D are well simulated as regards
shape and position (Table 7.3). I n Fig 7.11 the g 1 factor was not
included and the amplitudes of C and D were smaller than the observed
r a t i o s . Including the g ^ factor gives a far better f i t and Fig.7.16
gives a good simulation of the observed spectra at low temperatures
(Fig. 7.6) . However the amplitude of the spectra at higher temperatures
i s not well simulated.
7.3 CONCLUSIONS
7.3.1 Kneubuhl's Method
This did not provide adequate simulations of the observed
spectra. This i s most probably due to (a) computing the d i f f e r e n t i a l
of a discontinuous function ( S(H)—*- « for H —*• H, or H 2 or H. ) and
(b) the equation assumes that the intensity of the l i n e i s constant
which i t i s not. Kneubuhl and Natterer (Ref. 7.3) have included the
51
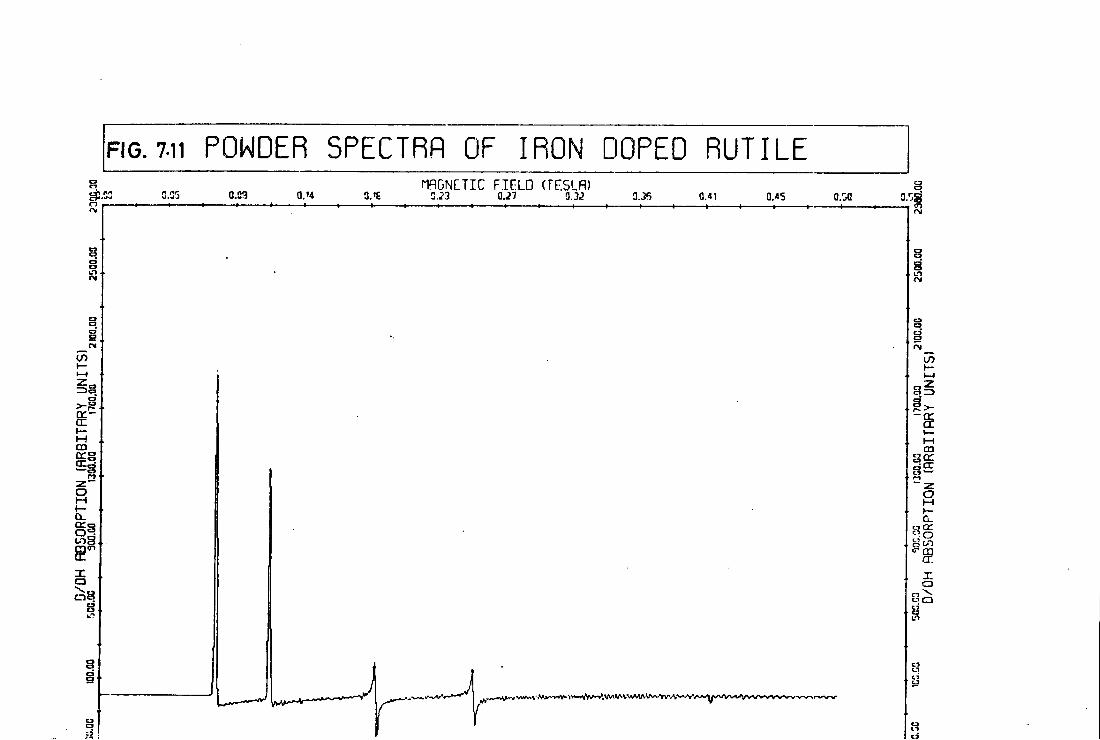
FIG. 7-ii POWDER SPECTRA OF IRON DOPED RUTILE B nRGNETIC FIELD (FESLR) § g£.SS C.C5 0.33 O.M 3.<£ C.23 C.27 0.3,2 5JS 0.41 0.45 0.50 3. 8' S
C3 1.1 rM
fM C O 1/5
3 r-.
»— 03
" r r
L O S
S C I S
J CI
r C3
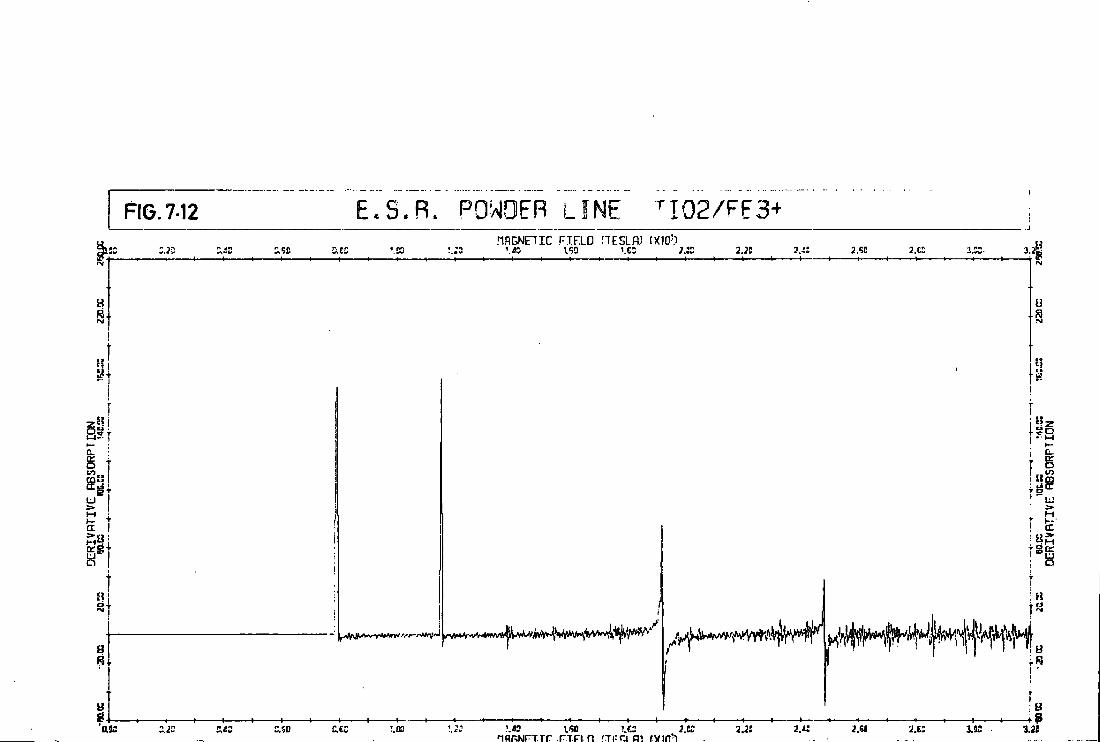
FIG.7-12 E . S . R . POWOFR LINE T I 0 2 / F E 3 + .1RGNETIC FT.FLD ITESLR3 M O O
3s 2.2i 2.a 2M ft* n i n ' C3
I
C3
I 13 2 I
i CD r j I <>co & LCI
M Kg ID a
9
8 2M 3.21 HIS 2.IS 3.32 ME I f l R N F T T r r i F I H 'TFGKH fVin1!
FIG 7-13 E . S . R . POWDER LINE T I02 /FE3+ LM Z.2Z Zf-Z D.5D
HflGNETIC FIELD ITCSLFD 1X10') C.CC !.CC V20 l . iS 1 1 0 ' . € 0 <!.23 1.2S 2.iZ 2.50 2 . e : 3, CD 3.
M O l . S S ! .C2 2.H3
PlflGNETIC FIELD (TESLfl) (X101)
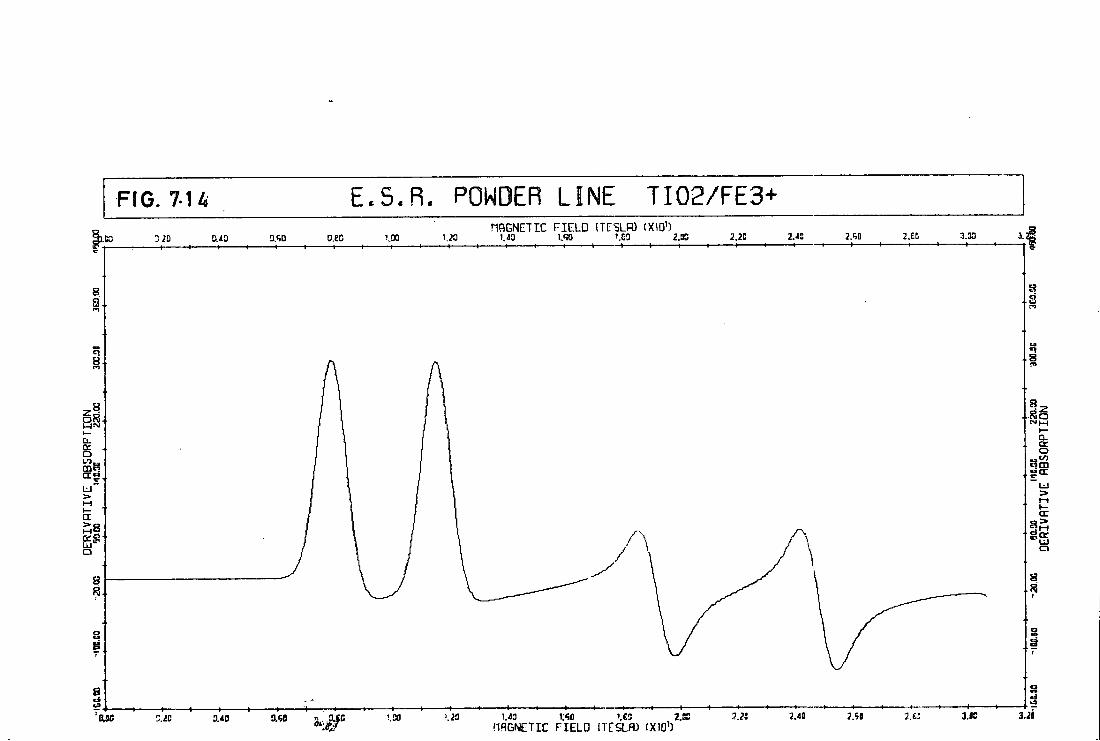
E . S . R . POWDER LINE T I02 /FE3+ FIG. 7 U F1AGNE7IC FIELD ITESLF1) <XIO')
3. uu 2.50 ' S O 1.20 M O o.ec '..00 • ID 20
8 a
8 8 rn
So
CO
a L J LJ /
C3 8 3.211 3.1C '2.41 2.91 l .€3 2.82 U 3 ass ' 2 3 V00 3.50 3.40 (to nflGNETIC FIELD ITCSLfB fXlOO
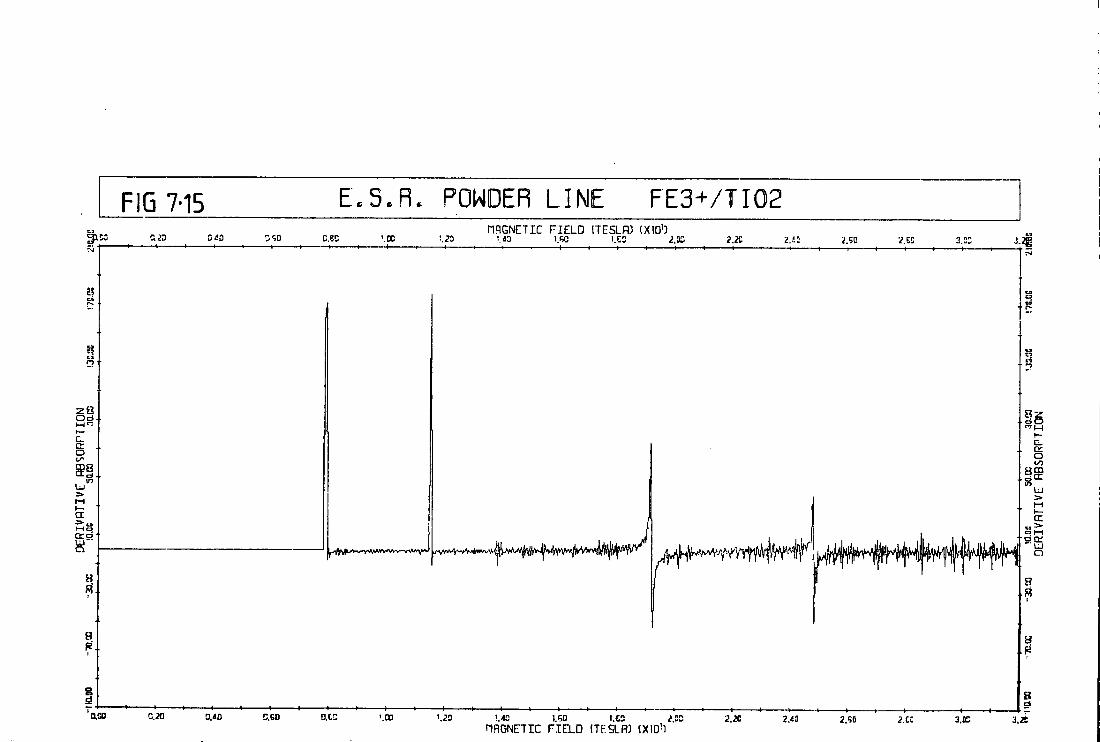
FIG 7-15 E . S . R . POWDER LINE FE3+ /T I02 CO 0.23 C * 3
HRGNETIC FIELD ITESLfl) (XIO1) C E D '.00 ' . 23 ' . JO l.RC I .E3 2.33 2.2C 2.12 J.5C '2.ED 2.23 i.
CC o to yep in
LJ ;» M
O S LJ
'"•so c.20 a«o CSD n.cc \oo 1.22 \./a 1.50 t.cs 2.'cs ' Tie * 2*0 ' T?o ' 2 c: 30E 3 2i HRGNETIC FIELD ITESLRJ (XIO'l
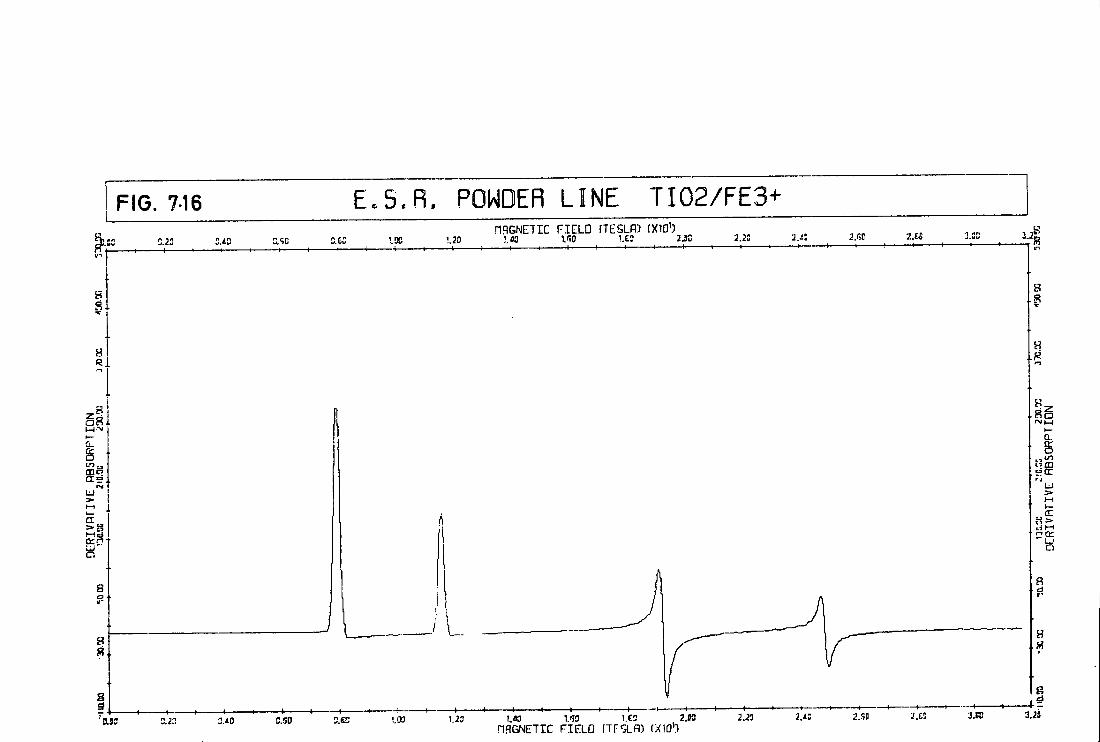
FIG. 716 E . S . R . POWDER LINE T I 0 2 / F E 3 + a 2.23 3.40 S.SD
MAGNETIC FIELD f'TESLfl) (XID'3 3 t C ' 0 0 1 2 0 !.« WO U 3 2.5C 2 . 2 ! 2.^5
', i i 1 i 1 1 1 1 1 1 1 1 1 • 1 1 2.GC 2.£C J - 33 3.2
n or
1.40 1.50 ! .€3 2.03
MAGNETIC FIELD FT FSLflJ fXlQ') 2AZ a.so
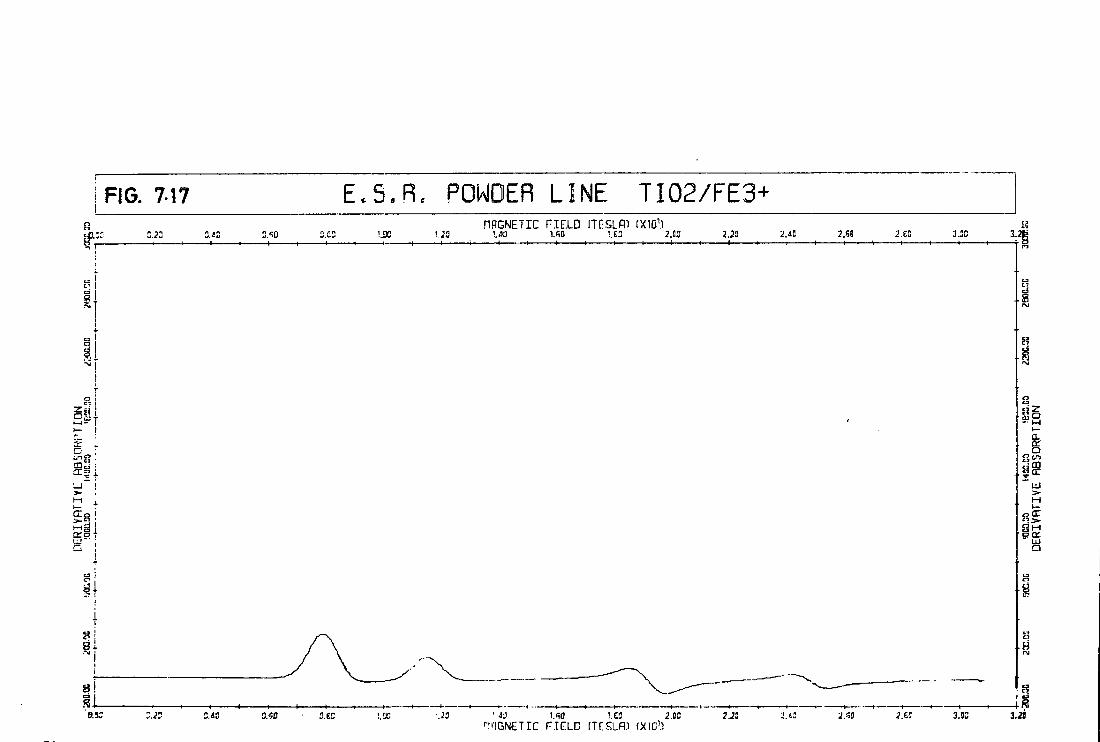
FIG. 717 E . 3 . R . POWDER LINE T I02 /FE3+ .MAGNETIC FIELD ITCSLfl) (X1011 HflGNETIC FIELD ITCSLfl) (XlO'l
2.EC 2 GC 2.SD 33 .SB if-3 I
s ."M
S
C3 C3 C I CI
CL
<t LTi CI C3
• r a
3 I
£7
8 H
^ 1
Si 0.35 S.<50 IX \20 1 JJ !.£2 2.BC 2.23 2.*: 2.SO 2.£C 3.3C 3.20
rl'-lGNE7IC FIELD rT fSL f l J (XIC'3
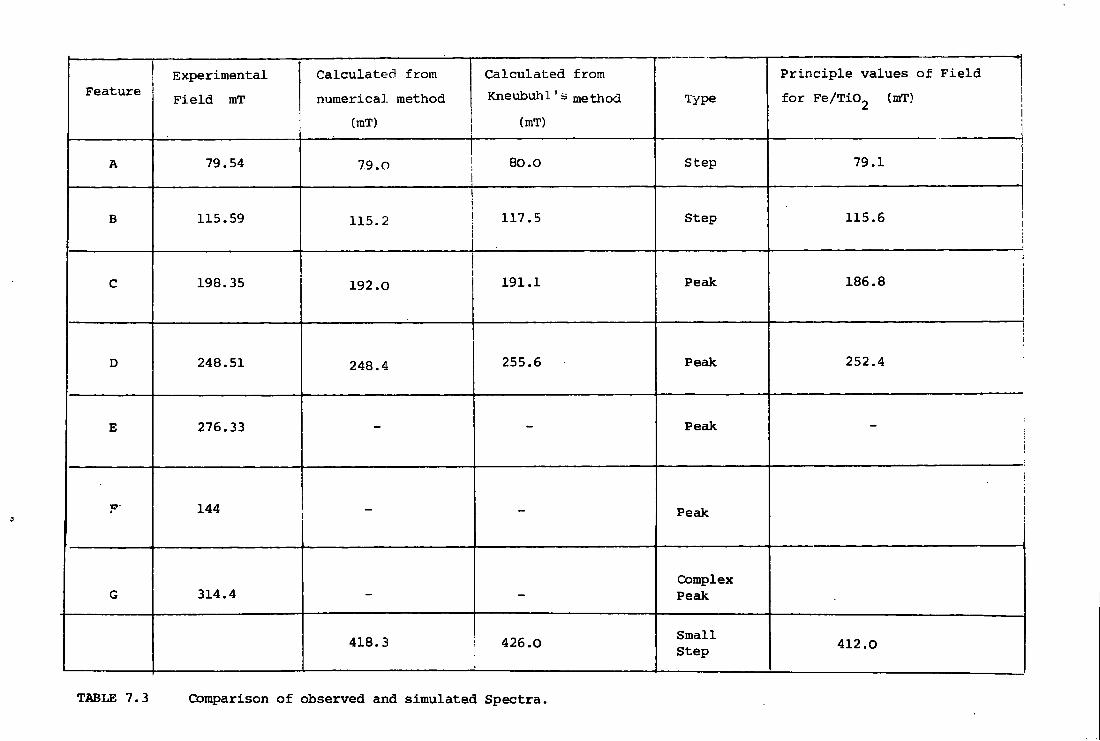
Feature Experimental F i e l d mT
Calculated from numerical method
(mT)
Calculated from Kneubuhl 'a method
(mT) Type
Pr i n c i p l e values of F i e l d for Fe/Ti02 (mT)
i
A 79.54 7.9.0 80.0 Step 79.1
B 115.59 115.2 117.5 Step 115.6 i
C 198.35 192.0 191.1 Peak 186.8 i i i i
D 248.51 248.4 255.6 Peak
1
252.4
E 276.33 - - Peak ;
y 144 - - Peak
i
! i j
G 314.4 - -Complex Peak
418.3 426.0 Small Step 412.0
TABLE 7.3 Comparison of observed and simulated Spectra.
e f f e c t of v a r y i n g l i n e i n t e n s i t i e s i n more complex e q u a t i o n s .
7.3.2 The Numerical Method
T h i s gave reasonable agreement w i t h experiments when t h e g _ 1
f a c t o r was i n c l u d e d . No attempt was made t o i n c l u d e a v a r i a t i o n i n
the l i n e i n t e n s i t y expected because the e f f e c t i v e 'g' v a l u e s o f
F e / T i C ^ a r e very a n i s o t r o p i c because adequate s i m u l a t i o n s c o u l d be
made without t h i s c o m p l i c a t i o n . S e v e r a l authors (7.4,7.5, 7.6) have
c a l c u l a t e d the expected v a r i a t i o n i n i n t e n s i t y and t h i s refinement
c o u l d e a s i l y be i n c l u d e d i f d e s i r e d .
7.3.3 General C o n c l u s i o n s
The work shows t h a t the ESR powder s p e c t r a i n the f i e l d range
0 t o 0.5 T e s l a a t X band o f F e / T i t ^ can be t r e a t e d as two independent
t r a n s i t i o n s o f e f f e c t i v e s p i n y . At low temperatures (about 5K) the
i n t e n s i t y o f the t r a n s i t i o n s appears to va r y as g ^ but a t h i g h e r
temperatures t h e r e appears to be a d i f f e r e n t behaviour. The f e a t u r e s
1 3 A and C are due to the ± — t r a n s i t i o n and B and D to the ± — 2 2
t r a n s i t i o n . The expected f e a t u r e a t .420 mT was not seen but as i t was
so s m a l l i n the s i m u l a t i o n s i t could w e l l be too s m a l l t o be observed.
The S p i n Hamiltonian c o u l d be d i a g o n a l i z e d f o r each o r i e n t a t i o n i n t h e
powder but t h i s i s not n e c e s s a r y i n the r e g i o n examined.
Work i s c o n t i n u i n g to understand the d e t a i l s o f the v a r i a t i o n
i n i n t e n s i t y o f the l i n e s w i t h temperature and a l s o to s i m u l a t e the
powder s p e c t r a of othe r i o n s u s i n g t h e same method.
I n c o n c l u s i o n i t may be s a i d t h a t the p r e s e n t work has shown
t h a t the s i m u l a t i o n methods d e s c r i b e d do provide a s a t i s f a c t o r y e x p l a n a
t i o n o f the main f e a t u r e s o f the ESR spectrum o f powdered Fe/ T i O ^ t
although some problems remain i n accounting f o r the d e t a i l e d temperature
v a r i a t i o n of l i n e i n t e n s i t y . As regards f u t u r e work an immediate t a s k
would be t o compute the powder s p e c t r a o f other dopants i n r u t i l e ; here
52
the same method could be adopted simply u s i n g the parameters a p p r o p r i a t e
to the i o n i n v o l v e d . The importance o f thus b u i l d i n g up a l i b r a r y o f
known powder s p e c t r a l i e s i n t h e f a c t t h a t the i n d u s t r i a l pigments v e r y
i.arely c o n t a i n only one s p e c i e s o f dopant. I n the longer term a major
q u e s t i o n posed by the p r e s e n t work i s t h a t o f the e x t e n t to which the
i n t e n s i t y o f a given f e a t u r e i n an ESR powder spectrum may be taken as
r e p r e s e n t i n g the c o n c e n t r a t i o n o f the s p e c i e s r e s p o n s i b l e f o r t h a t
f e a t u r e . Time l i m i t a t i o n s have precluded examination o f th e s e t o p i c s .
53
REFERENCES
CHAPTER SEVEN -
7.1 F.K. Kneubuhl, 'Lineshapes o f EPR S i g n a l s produced by Powders,
G l a s s e s and Viscous L i q u i d s ' , J.Chera.Phys. J53 (1960) 1074.
7.2 R. Oasa and T. Vanngard, 'EPR S i g n a l I n t e n s i t y and Powder
Shapes : A Re-examination", J.Magn.Reson. 19 (1975) 308.
7.3 F.K.Kneubuhl and B. N a t t e r e r , "Paramagnetic Resonance I n t e n s i t y
of A n i s o t r o p i c Substances and i t s I n f l u e n c e on L i n e Shapes'.
Helv.Phys. Octa 3£ (1961) 710.
7.4 J.R.Pelbrow, " A n i s o t r o p i c T r a n s i t i o n P r o b a b i l i t y F a c t o r i n ESR'
Mol. Phys. 16 (1964) 307.
7.5 F. Holey, "The Spin Hamiltonian and I n t e n s i t i e s o f the ESR S p e c t r a
O r i g i n a t i n g from Large Zero F i e l d E f f e c t s on S t a t e s 1
Cam.J.Phys. 44_ (1965) 503.
7.6 A. Isomoto, H.Watare, M.Kotani, "Dependence of EPR T r a n s i t i o n
P r o b a b i l i t y on Magnetic F i e l d ' , J.Phys.Soc. Japan, 29 (1970) 1571.
54
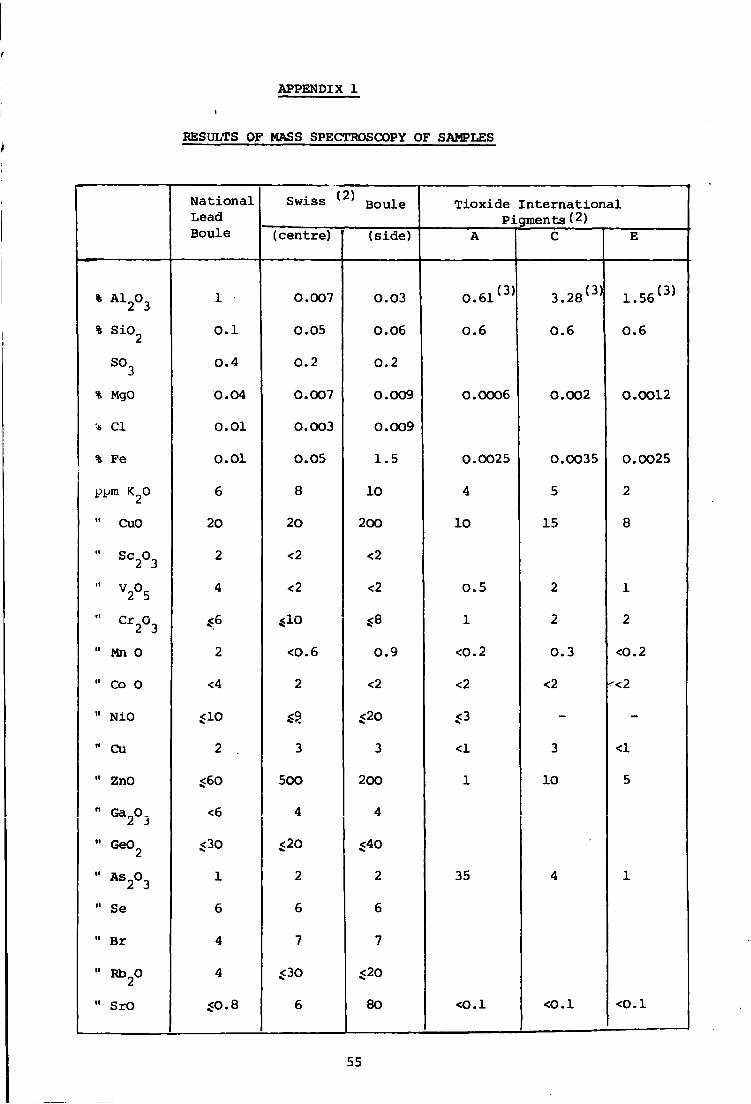
APPENDIX 1
t
RESULTS OF MASS SPECTROSCOPY OF SAMPLES
N a t i o n a l Lead
Swxss v* ; Boule T i o x i d e I n t e r n a t i o n a l Pigments(2)
Boule (centre) ( s i d e ) A C E
% A 1 2 0 3 1 0.007 0.03 0 . 6 1 ( 3 ) 3 . 2 8 ( 3 ) 1 . 5 6 ( 3 )
% s i o 2 0.1 0.05 0.06 0.6 0.6 0.6
s o 3 0.4 0.2 0.2
% MgO 0.04 0.007 0.009 0.0006 0.002 0.0012
•* C I 0.01 0.003 0.009
% Fe 0.01 0.05 1.5 0.0025 O.0O35 0.0025
pym K20 6 8 10 4 5 2
" CuO 20 20 200 10 15 8
" Sc„0„ 2 3 2 <2 <2
" V 0 2 5 4 <2 <2 0.5 2 1
" Cr 0 2 3 $10 *8 1 2 2
" Mn 0 2 <0.6 0.9 <0.2 0.3 <0.2
" Co 0 <4 2 <2 <2 <2 «2
" NiO $10 & $20 *3 - -" Cu 2 3 3 <1 3 <1
" ZnO $60 500 200 1 10 5
" Ga.O.
" Ge0 2
<6
$30
4
$20
4
$40
" A S 2 ° 3 1 2 2 35 4 1
" Se 6 6 6
" Br 4 7 7
" Rb 20 4 $30 $20
" SrO $0.8 6 80 <o.i <0.1 <0.1
55
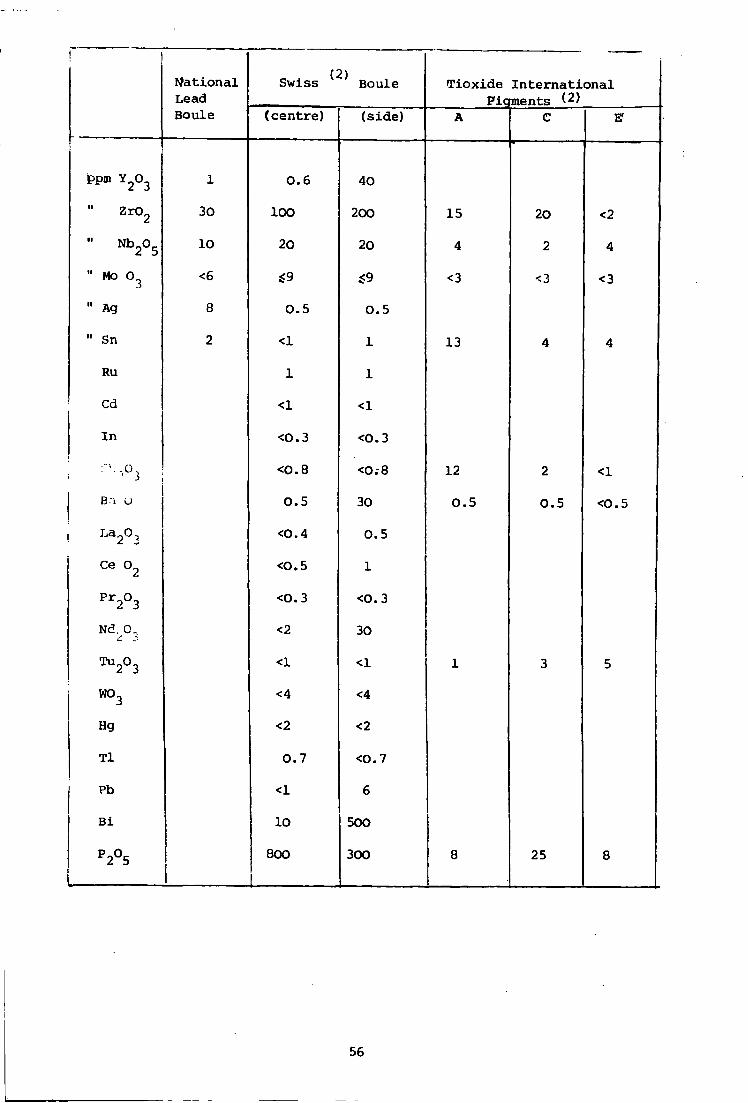
N a t i o n a l (2) Swiss Boule T i o x i d e I n t e r n a t i o n a l
Lead F i q ments (2) Boule ( c e n t r e ) ( s i d e ) A C
ppm Y 2 0 3 1 0.6 40
" Z r 0 2 30 100 200 15 20 <2
" N b 2 ° 5 10 20 20 4 2 4
" Mo <6 $9 *9 <3 <3 <3
" Ag 8 0.5 0.5
" Sn 2 <1 1 13 4 4
Ru 1 1
Cd <1 <1
I n <0.3 <0.3
••" -°3 <0.8 <0;8 12 2 <1
B - i U 0.5 30 0.5 0.5 <0.5
L a 2 ° 3 <0.4 0.5
Ce Q 2 <0.5 1
P r 2 ° 3 <0.3 <0.3
Nd. 0, <2 30
T U 2 ° 3 <1 <1 1 3 5
wo 3 <4 <4
Hg <2 <2
T l 0.7 <0.7
Pb <1 6
B i 10 500
P2°5 i 1
800
1 300 8 25 8
56
(1) See s e c t i o n 3.3(b) For e x p l a n a t i o n .
(2) Pigments B,D and F are the same as A,C,E except t h a t they have been o
heated a t 600 C f o r 30 minutes.
(3) These f i g u r e s were obtained by chemical a n a l y s i s and knowledge o f
the s t a r t i n g composition of the pigments. The r e s u l t s o f t h e mass
spectroscopy are
A 1% Al 2°3
C 2% A l 2 0 3
E 1.5% A 1 2 0 3
The d i f f e r e n c e r e f l e c t s the i n h e r e n t i n a c c u r a c i e s of mass
spectroscopy e s p e c i a l l y a t these r e l a t i v e l y high c o n c e n t r a t i o n s .
SECTION


