6 Electron Transfer HARRY B. GRAY Beckman Institute California Institute of Technology WALTHER R. ELLIS, JR. Department of Chemistry University of Utah I. ELECTRON TRANSFERS IN BIOLOGY A. Biological Redox Components Three types of oxidation-reduction (redox) centers are found in biology: protein side chains, small molecules, and redox cofactors. The first class is frequently overlooked by mechanistic enzymologists. The sulfhydryl group of cysteine is easily oxidized to produce a dimer, known as cystine: -2e 2R-SH ---J> R-S-S-R -2H + (6.1) This type of interconversion is known to occur in several redox proteins, includ- ing xanthine oxidase, mercuric ion reductase, and thioredoxin. Other enzyme systems display spectral evidence pointing to the presence of a protein-based radical in at least one intermediate. EPR spectroscopy provides a powerful tool in studying such systems; the observation of a g = 2.0 signal that cannot be attributed to impurities or an organic redox cofactor is generally taken to be evidence for a protein-based radical. Radicals localized on tyrosine (e.g., in photosystem II and the B2 subunit of ribonucleotide reductase 1) and tryptophan (e.g., in yeast cytochrome c peroxidase 2 ) have been unambiguously identified using EPR techniques together with protein samples containing isotopically la- beled amino acids (e.g., perdeuterated Tyr) or single amino-acid mutations (e.g., Trp Phe). A variety of small molecules, both organic and inorganic, can function as redox reagents in biological systems. Of these, only the nicotinamide and qui- 315
Transcript
6Electron Transfer
HARRY B. GRAYBeckman Institute
California Institute of Technology
WALTHER R. ELLIS, JR.Department of Chemistry
University of Utah
I. ELECTRON TRANSFERS IN BIOLOGY
A. Biological Redox Components
Three types of oxidation-reduction (redox) centers are found in biology: proteinside chains, small molecules, and redox cofactors. The first class is frequentlyoverlooked by mechanistic enzymologists. The sulfhydryl group of cysteine iseasily oxidized to produce a dimer, known as cystine:
-2e2R-SH ---J> R-S-S-R
-2H +(6.1)
This type of interconversion is known to occur in several redox proteins, including xanthine oxidase, mercuric ion reductase, and thioredoxin. Other enzymesystems display spectral evidence pointing to the presence of a protein-basedradical in at least one intermediate. EPR spectroscopy provides a powerful toolin studying such systems; the observation of a g = 2.0 signal that cannot beattributed to impurities or an organic redox cofactor is generally taken to beevidence for a protein-based radical. Radicals localized on tyrosine (e.g., inphotosystem II and the B2 subunit of ribonucleotide reductase 1) and tryptophan(e.g., in yeast cytochrome c peroxidase 2
) have been unambiguously identifiedusing EPR techniques together with protein samples containing isotopically labeled amino acids (e.g., perdeuterated Tyr) or single amino-acid mutations (e.g.,Trp ~ Phe).
A variety of small molecules, both organic and inorganic, can function asredox reagents in biological systems. Of these, only the nicotinamide and qui- 315
316
Figure 6.1Reduction of NAD + to NADH.
none coenzymes are found throughout the biosphere. Nicotinamide adenine dinucleotide (NAD) and nicotinamide adenine dinucleotide phosphate (NADP)participate in a wide variety of biological redox reactions. The 4-position of thepyridine ring is the reactive portion of both molecules (Figure 6.1). Both typically function as 2-electron redox reagents.
In contrast, quinones may function as either 1- or 2-electron carriers:
e-- HT e- H+Q ( , ) QH' ( , ) QH
2(6.2)
Free-radical semiquinone (QH') intermediates have been detected by EPR spectroscopy in some electron transfers. Coenzyme Q, also called ubiquinone because it occurs in virtually all cells, contains a long isoprenoid tail that enablesit to diffuse through membranes rapidly. This quinone derivative, which occursin both free and protein-bound forms, is called ubiquinol when reduced (Figure6.2). Other types of quinones are less frequently found in cells.
o
H3C0x)CH
3I I CH3
H3CO [CH2 - CH = 6- CH2 -t,; H
o n=6-10
Figure 6.2Reduction of coenzyme Q (ubiquinone) to ubiquinol.
I. ELECTRON TRANSFERS IN BIOLOGY 317
Metalloproteins containing a single type of redox cofactor can be dividedinto two general classes: electron carriers and proteins involved in the transportor activation of small molecules. Adman 3 has identified some of the factors thatseem to be characteristic of electron-transfer proteins (these proteins are sometimes called "electron transferases"): (a) possession of a suitable cofactor toact as an electron sink; (b) placement of the cofactor close enough to the proteinsurface to allow electrons to move in and out; (c) existence of a hydrophobicshell adjacent to, but not always entirely surrounding, the cofactor; (d) smallstructural changes accompanying electron transfer; and (e) an architecture thatpermits slight expansion or contraction in preferred directions upon electrontransfer.
Proteins that function as electron transferases typically place their prostheticgroups in a hydrophobic environment and may provide hydrogen bonds (in addition to ligands) to assist in stabilizing both the oxidized and the reduced formsof the cofactor. Metal-ligand bonds remain intact upon electron transfer to minimize inner-sphere reorganization 4 (discussed in Section III). Many of the complex multisite metalloenzymes (e.g., cytochrome c oxidase, xanthine oxidase,the nitrogenase FeMo protein) contain redox centers that function as intramolecular electron transferases, shuttling electrons to/from other metal centers thatbind exogenous ligands during enzymatic turnover.
There are four classes 3,5 of electron transferases, each of which contains
many members that exhibit important structural differences: flavodoxins, bluecopper proteins, iron-sulfur proteins, and cytochromes.
The flavodoxins 6 are atypical in that they contain an organic redox cofactor,flavin mononucleotide (FMN; see Figure 6.3). These proteins have molecular
Figure 6.3Reduction of FMN,
weights in the 8-13 kDa range, and are found in many species of bacteria andalgae. The FMN cofactor is found at one end of the protein, near the molecularsurface, but only the dimethylbenzene portion of FMN is significantly exposedto the solvent (Figure 6.4). FMN can act as either a 1- or a 2-electron redoxcenter. In solution, the semiquinone form of free FMN is unstable, and disproportionates to the quinone (oxidized) and hydroquinone (reduced) forms. Hence,free FMN functions in effect as a 2-electron reagent. FMN in flavodoxins, onthe other hand, can function as a single-electron carrier. This is easily discerned
318
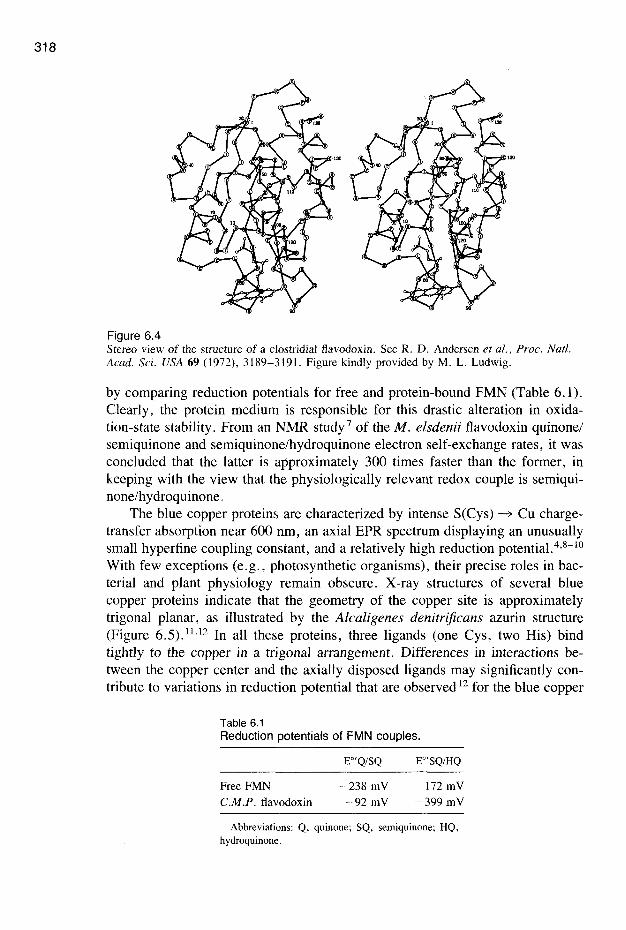
Figure 6.4Stereo view of the structure of a clostridial f1avodoxin. See R. D. Andersen et al., Proc. Natl.Acad. Sci. USA 69 (1972),3189-3191. Figure kindly provided by M. L. Ludwig.
by comparing reduction potentials for free and protein-bound FMN (Table 6.1).Clearly, the protein medium is responsible for this drastic alteration in oxidation-state stability. From an NMR study 7 of the M. elsdenii flavodoxin quinone/semiquinone and semiquinone/hydroquinone electron self-exchange rates, it wasconcluded that the latter is approximately 300 times faster than the former, inkeeping with the view that the physiologically relevant redox couple is semiquinone/hydroquinone.
The blue copper proteins are characterized by intense S(Cys) .......,. Cu chargetransfer absorption near 600 nm, an axial EPR spectrum displaying an unusuallysmall hyperfine coupling constant, and a relatively high reduction potentia1.4 ,8-10
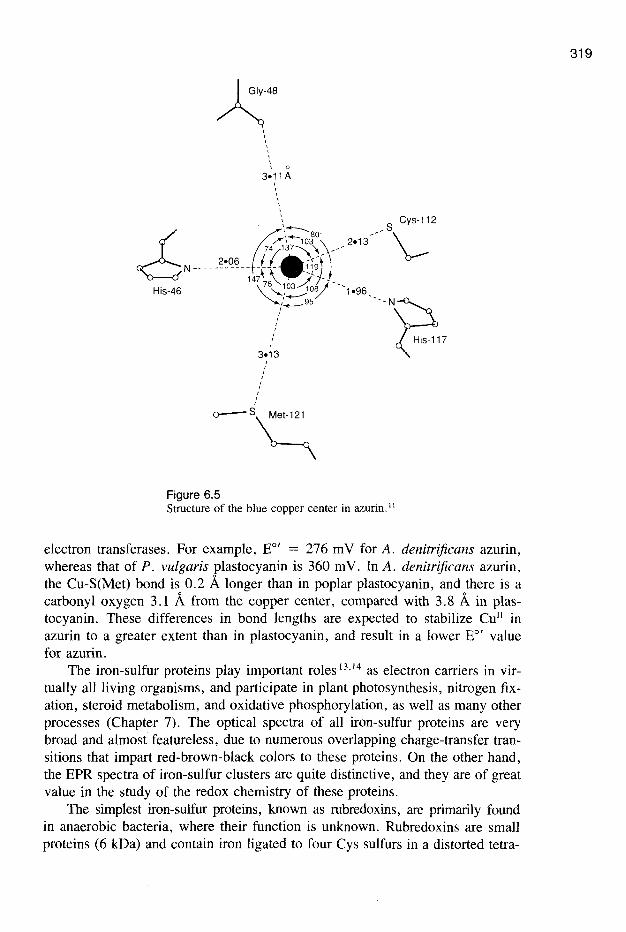
With few exceptions (e.g., photosynthetic organisms), their precise roles in bacterial and plant physiology remain obscure. X-ray structures of several bluecopper proteins indicate that the geometry of the copper site is approximatelytrigonal planar, as illustrated by the Alcaligenes denitrijicans azurin structure(Figure 6.5).11,12 In all these proteins, three ligands (one Cys, two His) bindtightly to the copper in a trigonal arrangement. Differences in interactions between the copper center and the axially disposed ligands may significantly contribute to variations in reduction potential that are observed 12 for the blue copper
Table 6.1Reduction potentials of FMN couples.
Free FMNC.M.P. f1avodoxin
238 mY92 mY
-172 mY-399 mY
Abbreviations: Q, quinone; SQ, semiquinone; HQ,hydroquinone.
Figure 6.5Structure of the blue copper center in azurin. 11
electron transferases. For example, EO' = 276 mV for A. denitrijicans azurin,whereas that of P. vulgaris plastocyanin is 360 mY. In A. denitrijicans azurin,the Cu-S(Met) bond is 0.2 Alonger than in poplar plastocyanin, and there is acarbonyl oxygen 3.1 A from the copper center, compared with 3.8 A in plastocyanin. These differences in bond lengths are expected to stabilize CUll inazurin to a greater extent than in plastocyanin, and result in a lower EO' valuefor azurin.
The iron-sulfur proteins play important roles 13.14 as electron carriers in virtually all living organisms, and participate in plant photosynthesis, nitrogen fixation, steroid metabolism, and oxidative phosphorylation, as well as many otherprocesses (Chapter 7). The optical spectra of all iron-sulfur proteins are verybroad and almost featureless, due to numerous overlapping charge-transfer transitions that impart red-brown-black colors to these proteins. On the other hand,the EPR spectra of iron-sulfur clusters are quite distinctive, and they are of greatvalue in the study of the redox chemistry of these proteins.
The simplest iron-sulfur proteins, known as rubredoxins, are primarily foundin anaerobic bacteria, where their function is unknown. Rubredoxins are smallproteins (6 kDa) and contain iron ligated to four Cys sulfurs in a distorted tetra-
319
320 6 / ELECTRON TRANSFER
hedral arrangement. The EO I value for the FeIII/I1 couple in water is 770 mY;that of C. pasteurianum rubredoxin is - 57 mV. The reduction potentials ofiron-sulfur proteins are typically quite negative, indicating a stabilization of theoxidized form of the redox couple as a result of negatively charged sulfur ligands.
The [2Fe-2S] ferredoxins (10-20 kDa) are found in plant chloroplasts andmammalian tissue. The structure of Spirulina platensis ferredoxin 15 confirmedearlier suggestions, based on EPR and Mossbauer studies, that the iron atomsare present in a spin-coupled [2Fe-2S] cluster structure. One-electron reduction(EO I
~ -420 mY) of the protein results in a mixed-valence dimer (Equation6.3):
+8'-
[Fe2S2(SR)41 2- ( '[Fe2S2(SR)4P--e-
Fd"dFe(II) + Fe(III)
(6.3)
The additional electron in Fdred is associated with only one of the iron sites,resulting in a so-called trapped-valence structure. 16 The [Fe2S2(SR)4] 4- clusteroxidation state, containing two ferrous ions, can be produced in v itro whenstrong reductants are used.
Four-iron clusters [4Fe-4S] are found in many strains of bacteria. In mostof these bacterial iron-sulfur proteins, also termed ferredoxins, two such clustersare present in the protein. These proteins have reduction potentials in the- 400 mV range and are rather small (6-10 kDa). Each of the clusters containsfour iron centers and four sulfides at alternate comers of a distorted cube. Eachiron is coordinated to three sulfides and one cysteine thiolate. The irons arestrongly exchange-coupled, and the [4Fe-4S] cluster in bacterial ferredoxins isparamagnetic when reduced by one electron. The so-called "high-potential ironsulfur proteins" (HiPIPs) are found in photosynthetic bacteria, and exhibitanomalously high (~350 mY) reduction potentials. The C. vinosum HiPIP (10kDa) structure demonstrates that HiPIPs are distinct from the [4Fe-4S] ferredoxins, and that the reduced HiPIP cluster structure is significantly distorted, as isalso observed for the structure of the oxidized P. aerogenes ferredoxin. In addition, oxidized HiPIP is paramagnetic, whereas the reduced protein is EPRsilent.
This bewildering set of experimental observations can be rationalized interms of a "three-state" hypothesis (Le., [4Fe-4S(SR)4] n - clusters exist in threephysiological oxidation states). 17 This hypothesis nicely explains the differencesin magnetic behavior and redox properties observed for these iron-sulfur proteins (Equation 6.4):
The bacterial ferredoxins and HiPIPs all possess tetracubane clusters containingthiolate ligands, yet the former utilize the - 2/ - 3 cluster redox couple, whereasthe latter utilize the - II - 2 cluster redox couple.
The protein environment thus exerts a powerful influence over the clusterreduction potentials. This observation applies to all classes of electron transferases-the factors that are critical determinants of cofactor reduction potentialsare poorly understood at present but are thought t8 to include the low dielectricconstants of protein interiors (~4 for proteins vs. ~78 for H20), electrostaticeffects due to nearby charged amino-acid residues, hydrogen bonding, and geometric constraints imposed by the protein.
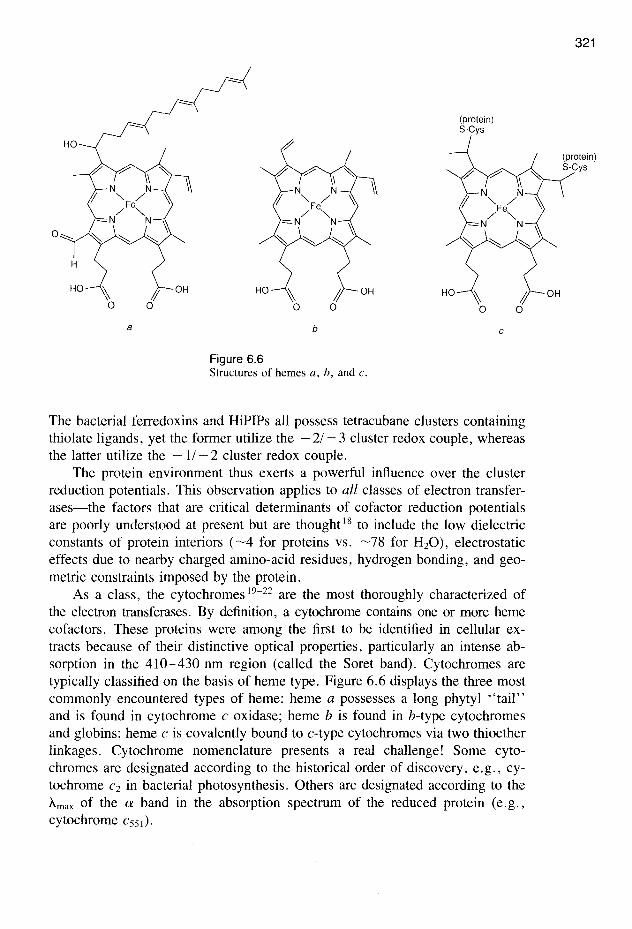
As a class, the cytochromes t9-22 are the most thoroughly characterized ofthe electron transferases. By definition, a cytochrome contains one or more hemecofactors. These proteins were among the first to be identified in cellular extracts because of their distinctive optical properties, particularly an intense absorption in the 410-430 nm region (called the Soret band). Cytochromes aretypically classified on the basis of heme type. Figure 6.6 displays the three mostcommonly encountered types of heme: heme a possesses a long phytyl "tail"and is found in cytochrome c oxidase; heme b is found in b-type cytochromesand globins; heme c is covalently bound to c-type cytochromes via two thioetherlinkages. Cytochrome nomenclature presents a real challenge! Some cytochromes are designated according to the historical order of discovery, e.g., cytochrome C2 in bacterial photosynthesis. Others are designated according to theAmax of the a band in the absorption spectrum of the reduced protein (e.g.,cytochrome C55]).
322
Figure 6.7Structure of tuna cytochrome c.
Cytochromes c are widespread in nature. Ambler 23 divided these electroncarriers into three classes on structural grounds. The Class I cytochromes ccontain axial His and Met ligands, with the heme located near the N-terrninusof the protein. These proteins are globular, as indicated by the ribbon drawingof tuna cytochrome c (Figure 6.7). X-ray structures of Class I cytochromes cfrom a variety of eukaryotes and prokaryotes clearly show an evolutionarilyconserved "cytochrome fold," with the edge of the heme solvent-exposed. Thereduction potentials of these cytochromes are quite positive (200 to 320 mV).Mammalian cytochrome c, because of its distinctive role in the mitochondrialelectron-transfer chain, will be discussed later.
Class II cytochromes c (EO I~ - 100 mV) are found in photosynthetic bac
teria, where they serve an unknown function. Unlike their Class I cousins, thesec-type cytochromes are high-spin: the iron is five-coordinate, with an axial Hisligand. These proteins, generally referred to as cytochromes c' , are four-ex-helixbundles (Figure 6.8). The vacant axial coordination site is buried in the proteininterior.
Finally, Class III cytochromes c, also called cytochromes C3, contain fourhemes, each ligated by two axial histidines. These proteins are found in a restricted class of sulfate-reducing bacteria and may be associated with the cytoplasmic membrane. The low molecular weights of cytochromes C3 (~14.7 kDa)require that the four hemes be much more exposed to the solvent than the hemesof other cytochromes (see Figure 6.9), which may be in part responsible fortheir unusually negative ( - 200 to - 350 mV) reduction potentials. These proteins possess many aromatic residues and short heme-heme distances, two properties that could be responsible for their anomalously large solid-state electricalconductivity. 24
Figure 6.8Structure of cytochrome c' .
323
Figure 6.9Structure of cytochrome C3'
324 6 / ELECTRON TRANSFER
B. Energy Storage and Release
Electron-transfer reactions play key roles in a great many biological processes,including collagen synthesis, steroid metabolism, the immune response, drugactivation, neurotransmitter metabolism, nitrogen fixation, respiration, and photosynthesis. The latter two processes are of fundamental significance-they provide most of the energy that is required for the maintenance of life. From thepoint of view of global bioenergetics, aerobic respiration and photosynthesis arecomplementary processes (Figure 6.10). The oxygen that is evolved by photosynthetic organisms is consumed by aerobic microbes and animals. Similarly,the end products of aerobic respiratory metabolism (C02 and H20) are the majornutritional requirements of photosynthetic organisms. The global C, H, and 0cycles are thus largely due to aerobic respiration and photosynthesis.
The extraction of energy from organic compounds, carried out by severalcatabolic pathways (e.g., the citric-acid cycle), involves the oxidation of thesecompounds to CO2 and H20 with the concomitant production of water-solublereductants (NADH and succinate). These reductants donate electrons to components of the mitochondrial electron-transfer chain, resulting in the reductionof oxygen to water:
(6.5)
In aerobic organisms, the terminal oxidant is, of course, oxygen. However,some species of bacteria respire anaerobically and are able to use inorganicoxyanions (nitrate or sulfate) as terminal oxidants. The translocation of protonsacross the inner mitochondrial membrane accompanies the electron transfers that
2
anaboliccycles
icnds
photosynthesisADP
+ hv ATPP; -
2Hp ----
CO
rganmpou
cataboliccycles
0co
aerobicrespiration
ADPATP +- P;
r' 2Hp
Figure 6.10Aerobic respiration and photosynthesis.
NADH
succinate
mitochondrial innermatrix mitochondrial
membrane
Figure 6.11Redox components in mitochondria.
ultimately lead to the reduction of O2; these protons, in turn, activate ATPsynthase, which catalyzes the phosphorylation of ADP to ATP (a process knownas oxidative phosphorylation). Because the hydrolysis of ATP is very exoergonic (i.e., ;)..G < 0), the newly synthesized ATP is used as a molecular energysource to drive thermodynamically unfavorable reactions to completion.
The rediscovery of cytochromes by Keilin 25 in 1925 led him to propose thatthe reduction of O2 is linked to the oxidation of reduced substrates by a seriesof redox reactions, carried out by cellular components collectively referred to asthe respiratory electron-transport chain. Progress toward a molecular understanding of these redox reactions has been painfully slow. Most of the components are multisubunit proteins that reside in the inner mitochondrial membrane(Figure 6.11). These proteins (Complexes I-IV) are quite difficult to purify withretention of in vivo properties, and they do not crystallize well.
The components 26-28 of the respiratory chain contain a variety of redoxcofactors. Complex I (NADH-Q reductase; > 600 kDa) contains five iron-sulfurclusters and FMN. Complex II (succinate-Q reductase; 150 kDa) contains sev-
325
0.0 -
0.3 -
326
WIZui>
:::.oill
-0.3 f- NADH - EFMN }
\ -12.4Kffi
CoQ~ cytb }
\ -10.1 Kcal
cyt c1 ""'- cyt c ""'-cyt a
0.6 -
0.9 -
-24.4Kcal
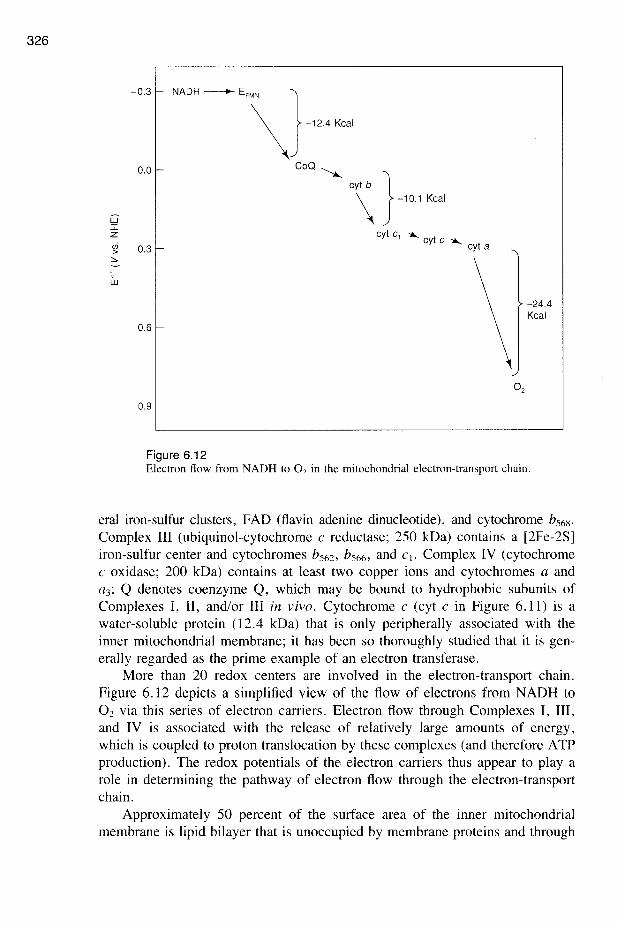
Figure 6.12Electron flow from NADH to O2 in the mitochondrial electron-transport chain.
Complex III (ubiquinol-cytochrome C reductase; 250 kDa) contains a [2Fe-2S]iron-sulfur center and cytochromes bS62 ' bS66 ' and Ct. Complex IV (cytochromeC oxidase; 200 kDa) contains at least two copper ions and cytochromes a anda3; Q denotes coenzyme Q, which may be bound to hydrophobic subunits ofComplexes I, II, and/or III in vivo. Cytochrome c (cyt c in Figure 6.11) is awater-soluble protein (12.4 kDa) that is only peripherally associated with theinner mitochondrial membrane; it has been so thoroughly studied that it is generally regarded as the prime example of an electron transferase.
More than 20 redox centers are involved in the electron-transport chain.Figure 6.12 depicts a simplified view of the flow of electrons from NADH toO2 via this series of electron carriers. Electron flow through Complexes I, III,and IV is associated with the release of relatively large amounts of energy,which is coupled to proton translocation by these complexes (and therefore ATPproduction). The redox potentials of the electron carriers thus appear to playarole in determining the pathway of electron flow through the electron-transportchain.
Approximately 50 percent of the surface area of the inner mitochondrialmembrane is lipid bilayer that is unoccupied by membrane proteins and through
L ELECTRON TRANSFERS IN BIOLOGY 327
which these proteins, in principle, are free to diffuse laterally. Kinetic (laserphotobleaching and fluorescence recovery) and ultrastructural (freeze-fractureelectron microscopy) studies 29
,30 indicate that Complexes I-IV diffuse independently and laterally over the inner membrane, whereas cytochrome c diffuses inthree dimensions (i.e., through the intramembrane space). Respiratory electrontransport has been shown to be a diffusion-coupled kinetic process. 29,30 Theterm "electron-transport chain" is thus somewhat misleading, because it impliesa degree of structural order that does not exist beyond the level of a givenprotein complex.
In view of these observations, why are all of the electron transfers associated with mitochondrial respiration required? For example, why is cytochromec needed to shuttle electrons in Figures 6.11 and 6.12 when the cofactor reduction potentials of Complex III are more negative than those of Complex IV?Evidently, factors other than b..Go are of importance-these will be discussed inSections III and IV.
Photosynthesis could be viewed as the most fundamental bioenergetic process. Biological reactions are driven by an energy flux, with sunlight serving asthe energy source. Photosynthesis 31-36 is the process by which radiant solarenergy is converted into chemical energy in the form of ATP and NADPH,which are then used in a series of enzymatic reactions to convert CO2 intoorganic compounds. The photosynthetic algae that appeared on Earth two million years ago released oxygen into the atmosphere and changed the environment from a reducing to an oxidizing one, setting the stage for the appearanceof aerobically respiring organisms.
Photosynthesis is initiated by the capture of solar energy, usually referredto as "light harvesting." A large number of organic pigments, including chlorophylls, carotenoids, phycoerythrin, and phycocyanin (in green plants and algae) are clustered together in pigment-protein complexes called photosystems.These pigments collectively absorb most of the sunlight reaching the Earththeir absorption spectra are displayed in Figure 6.13. Light is transformed intochemical energy in pigment-protein complexes called reaction centers. The concentration of reaction centers within a photosynthetic cell is too small to offer asuitable absorption cross section for sunlight. Hence, hundreds of these lightharvesting pigments function as molecular antennas; an x-ray structure 35 of onesubunit of a bacteriochlorophyll-protein complex is displayed in Figure 6.14.
Absorption of a photon by an antenna pigment promotes the pigment intoan electronically excited state, which can return to the ground state by a varietyof relaxation processes, including fluorescence or resonance transfer of excitation energy to a nearby pigment at picosecond rates. As much as 100 ps mayelapse between the photon absorption and the arrival of the light energy at areaction center. During this time, the energy may "migrate" in a random-walkfashion among hundreds of pigments.
The energy of the excited state is converted into electrochemical potentialenergy at the reaction center, which contains a primary electron donor P thattransfers an electron to a nearby acceptor Al within the same protein (and P
328
tco-aoIf).nro
400 500
wavelength (nm)
600 700
Figure 6.13Absorption spectra of the photosystem pigments.
Figure 6.14Structure of a subunit of a bacteriochlorophyll-protein complex. Reproduced with permissionfrom Reference 35.
I. ELECTRON TRANSFERS IN BIOLOGY 329
becomes oxidized to P+):
(6.5)
This charge separation is of paramount importance. The key problem is maintaining the charge separation, which involves minimization of the energy-wasting back reaction. Reaction centers contain an ordered array of secondary electron acceptors (AI, Az, A3 "') that optimize the ilGo that occurs at each step:
(6.6)
Thus, the back reaction is circumvented by optimizing forward electron transfersthat rapidly remove electrons from A I -. As the acceptors are separated by greaterand greater distances from P +, the probability of the back electron transfer toP + decreases. Put another way, the overlap of P + and each acceptor orbitaldecreases in the order P + fA I > P + fA z - > P + fA 3 - .
Photosynthetic bacteria contain only one type of reaction center (l00 kDa).The solution of the x-ray structure (at 2.9 A resolution) of the Rps. viridis reaction center was reported 36 in 1984, providing conclusive proof that electronscan "tunnel" over 10-20 A distances through protein interiors. The reactioncenter protein contains many cofactors (Figure 6.15): two bacteriochlorophylls(BChl) in close proximity (the so-called "special pair"), two further bacteriochlorophylls that are spectroscopically identical, two bacteriopheophytins (BPh),two quinones (QA and QB), and one iron center. (QB was lost during isolationof the Rps. viridis reaction center and thus does not appear in Figure 6.15.) Thereaction center contains an approximate two-fold rotation axis. Despite thisstrikingly high symmetry in the reaction center, one pathway of electron flowpredominates, as the cartoon in Figure 6.16 indicates.
C. Coupling Electron Transfers and Substrate Activation
Electron transfers are key steps in many enzymatic reactions involving the oxidation or reduction of a bound substrate. Relevant examples include cytochromec oxidase (Oz ~ 2HzO) and nitrogenase (Nz~ 2NH3). To reinforce the claimthat electron-transfer steps are of widespread importance, several other redoxsystems, representative of diverse metabolic processes, will be mentioned here.
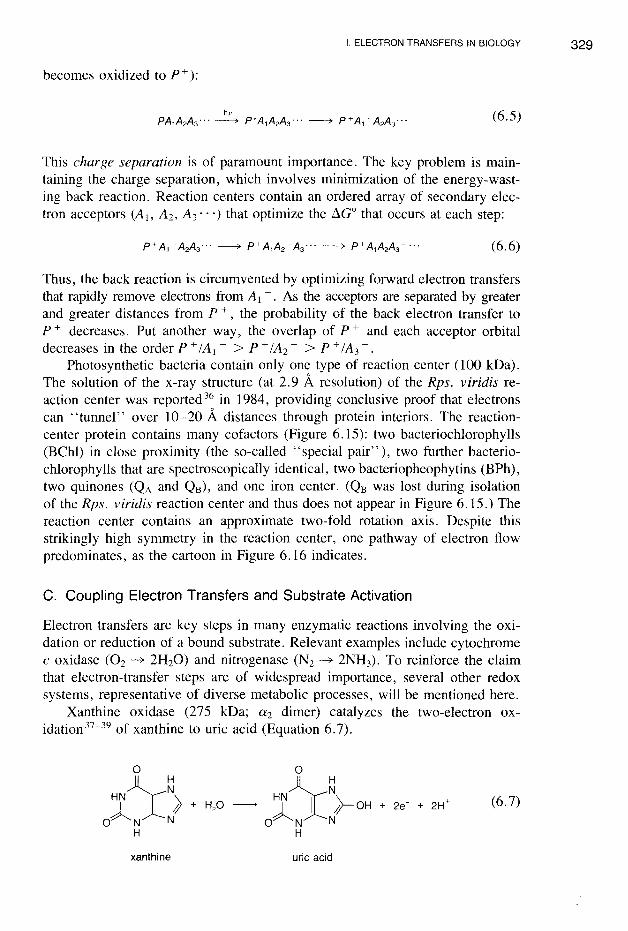
Xanthine oxidase (275 kDa; <Xz dimer) catalyzes the two-electron oxidation 37-39 of xanthine to uric acid (Equation 6.7).
xanthine
+ H20
o
~H
HN N~ I }-OH
o N NH
uric acid
(6.7)
330
o
Fe- Fe: 14A
o
Fe- Fe: 16A
o
Fe- Fe: 14A
o
Fe - (Mg)2 : 21 A
o· • • • • • • • • • • • • •
o
Mg - Mg : 7A in dimero
Mg - Mg : 13A from (BChl)2 to BChl
o
BChl - BPh centers: 11 A
o
Fe - Q center: 7 A
• • • • • • • • • • • • • •
Figure 6.15Structure of the Rps. viridis photosynthetic reaction-center cofactors. The black dots delineatethe outward (0)- and inward (I)-facing portions of the membrane. Adapted from Reference 36.
QAFe
~ Qs
+BPh BPh
+BChl
"(BChl)2
Q-poole- and
cyt be,complex
Figure 6.16Electron flow in the bacterial photosynthetic reaction center.
[2Fe-2S1 11
o~14 ± 4A
[2Fe-2S],
331
XH + Hp
o11 ± 3A
MaCa
X-OH + 2W
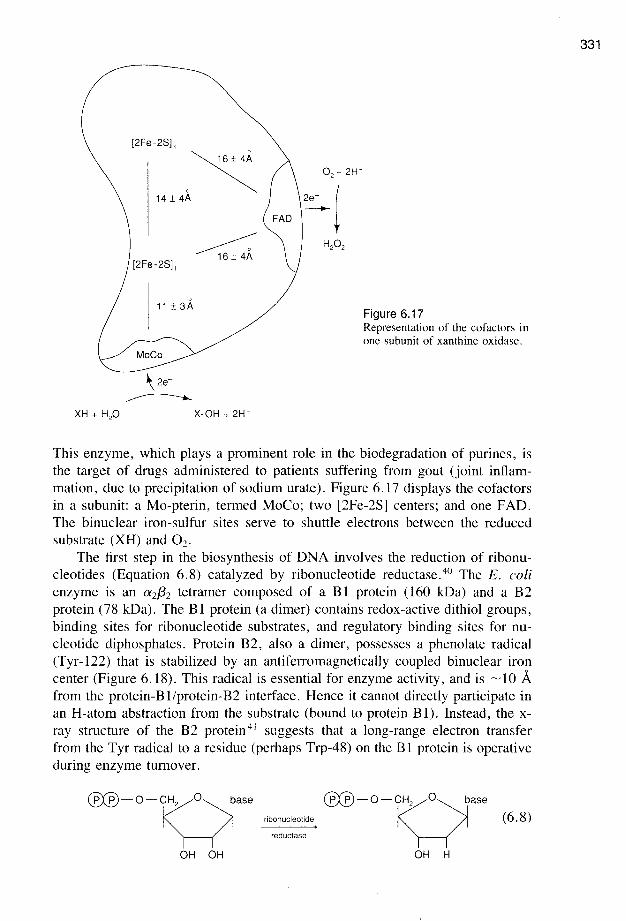
Figure 6.17Representation of the cofactors inone subunit of xanthine oxidase.
This enzyme, which plays a prominent role in the biodegradation of purines, isthe target of drugs administered to patients suffering from gout (joint inflammation, due to precipitation of sodium urate). Figure 6.17 displays the cofactorsin a subunit: a Mo-pterin, termed MoCo; two [2Fe-2S] centers; and one FAD.The binuclear iron-sulfur sites serve to shuttle electrons between the reducedsubstrate (XH) and O2 ,
The first step in the biosynthesis of DNA involves the reduction of ribonucleotides (Equation 6.8) catalyzed by ribonucleotide reductase. 4o The E. colienzyme is an (X2{32 tetramer composed of a B1 protein (160 kDa) and a B2protein (78 kDa). The BI protein (a dimer) contains redox-active dithiol groups,binding sites for ribonucleotide substrates, and regulatory binding sites for nucleotide diphosphates. Protein B2, also a dimer, possesses a phenolate radical(Tyr-122) that is stabilized by an antiferromagnetically coupled binuclear ironcenter (Figure 6.18). This radical is essential for enzyme activity, and is ~10 Afrom the protein-B lIprotein-B2 interface. Hence it cannot directly participate inan H-atom abstraction from the substrate (bound to protein B1). Instead, the xray structure of the B2 protein 41 suggests that a long-range electron transferfrom the Tyr radical to a residue (perhaps Trp-48) on the B1 protein is operativeduring enzyme turnover.
®:v-a-v""OH OH
___--. ®:V-O-CQH20 base
ribonucleotide
•reductase
OH H
(6.8)
332
-0-0 0--(Glu-238
TY'::84_<~O~OYON1 oyoqN GI"~204
HiS-118-C""-, (YHiS-241
/ Glu-115N NI IH H
Figure 6.18Schematic of the binuclear iron center and Tyr-122 radical inthe B2 protein of E. coli ribonucleotide reductase. 41
Most of the presently known metal-containing mono- and dioxygenases aremulticomponent, requiring the involvement of additional proteins (electrontransferases) to shuttle electrons from a common biological reductant (usuallyNADH or NADPH) to the metallooxygenase. Cytochrome P-450, whose substrate oxidation chemistry was discussed in detail in Chapter 5, serves as anexcellent example. Figure 5.10 presented a catalytic cycle for cytochromeP-450-dependent hydroxylations 42 that begins with substrate (RH) binding to theferric enzyme (RH is camphor for Pseudomonas putida cytochrome P-450). Tohydroxylate the camphor substrate, the monooxygenase must be reduced via theelectron-transport chain in Equation (6.9).
NADH) 0(OX)~ €(red)~+H+
[FAD] [2Fe-2S]Ferredoxin P t"d d "reductase U I are oXln
NAD+ (red) (ox)
(
(OX)) (R-OH,HP
[Heme] (6.9)P-450
(red) RH, O2
The ferredoxin reductase receives two electrons from NADH and passes themon, one at at time, to putidaredoxin, a [2Fe-2S] iron-sulfur protein. Thus, twosingle-electron-transfer steps from reduced putidaredoxin to cytochrome P-450are required to complete one enzyme turnover.
The activity of the enzyme appears to be regulated at the first reductionstep.43 In a 1: 1 putidaredoxin-cytochrome P-450 complex, the reduction potential of putidaredoxin is - 196 mV, but that of cytochrome P-450 is - 340 mVin the absence of camphor; reduction of the cytochrome P-450 is thus thermodynamically unfavorable (k ~ 0.22 s ~ I). Upon binding camphor, the reduction
L ELECTRON TRANSFERS IN BIOLOGY 333
potential of cytochrome P-4S0 shifts to - 173 mV, and the electron-transfer ratein the protein complex accordingly increases to 41 s -1. "Costly" reducingequivalents are not wasted, and there are no appreciable amounts of noxiousoxygen-reduction products when substrate is not present.
In the third step, molecular oxygen binds to the camphor adduct of ferrouscytochrome P-4S0. This species, in the presence of reduced putidaredoxin, accepts a second electron, and catalyzes the hydroxylation of the bound camphorsubstrate. The turnover rate for the entire catalytic cycle is 10-20 s -I, and thesecond electron-transfer step appears to be rate-determining. 44
The bulk of the interest in electron-transfer reactions of redox proteins hasbeen directed toward questions dealing with long-range electron transfer and thenature of protein-protein complexes whose structures are optimized for rapidintramolecular electron transfer. Before we undertake a discussion of these issues, it is worth noting that studies of the reactions of redox proteins at electrodes are attracting increasing attention. 45
-47 Direct electron transfer between a
variety of redox proteins and electrode surfaces has been achieved. Potentialapplications include the design of substrate-specific biosensors, the developmentof biofuel cells, and electrochemical syntheses. An interesting application ofbioelectrochemical technology is the oxidation of p-cresol to p-hydroxybenzaldehyde (Figure 6.19).48
CHO
¢OH
electrodesurface
AZax ENZax
QOH
Figure 6.19Enzyme-catalyzed electrochemical oxidation of p-cresol to p-hydroxybenzaldehyde.AZ is azurin, and ENZ is p-cresol methylhydroxylase.48
334 6 I ELECTRON TRANSFER
II. ELECTRON-TRANSFER RATES
A. Overview
Measurements of the rates of oxidation-reduction reactions began in the late1940s. A great deal of the early experimental work was carried out by inorganicchemists, and by the 1970s the reactivity patterns of many complexes had beenuncovered. 49- 51 Chemists studying the mechanisms of metalloprotein electrontransfer reactions frequently seek parallels with the redox behavior of less-complicated inorganic complexes.
In examining biological electron transfers, it is important to remember thatmetalloproteins are more than just metal ions in disguise. Virtually every property of a protein (excluding its amino-acid sequence) depends on the solutionpH. Redox proteins are very large polyelectrolytes whose redox prosthetic groupsare typically buried in the protein interior. One important distinction betweenredox reactions of proteins and redox reactions of small transition-metal complexes is the magnitude of the electron donor-to-acceptor distance. The relevantdistance for small molecules, unlike redox proteins, is generally taken to be vander Waals contact. Within the last ten years, it has been convincingly demonstrated that electrons can "tunnel" at significant rates across distances of 15 Aor more in protein interiors. 52-58
Experimental investigation of the factors that control the rates of biologicalredox reactions has not come as far as the study of the electron transfers ofmetal complexes, because many more variables must be dealt with (e.g., asymmetric surface charge, nonspherical shape, uncertain details of structures of proteins complexed with small molecules or other proteins). Many experimentalapproaches have been pursued, including the covalent attachment of redox reagents to the surfaces of metalloproteins.
B. Self-Exchange and Cross Reactions
The simplest reactions in solution chemistry are electron self-exchange reactions(Equation 6.10), in which the reactants and products are the same (the asteriskis used to identify a specific isotope). The only
*Aox + Ared~ *Ared + Aox (6.10)
way to establish chemically that a reaction has taken place is to introduce anisotopic label. There is no change in the free energy (LlGo = 0) for this type ofreaction. As will become evident later on, the reason why these types of reactions are studied is because self-exchange rates and activation parameters areneeded to interpret redox reactions in which a net chemical change occurs. Theexperimental measurement 58 of self-exchange rates is tedious and usually onlyresults in an order-of-magnitude estimate of the rate constant (as inferred from
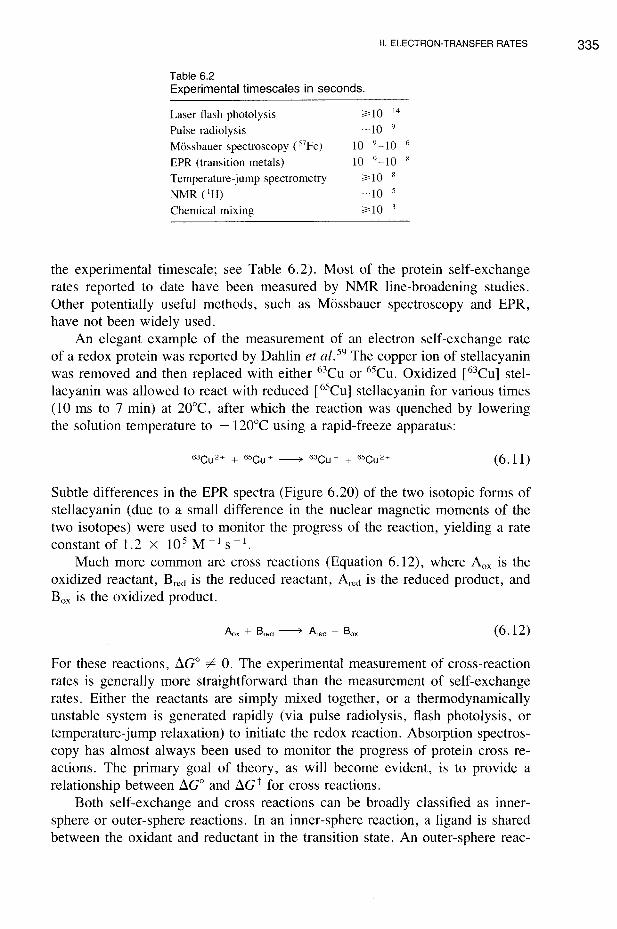
the experimental timescale; see Table 6.2). Most of the protein self-exchangerates reported to date have been measured by NMR line-broadening studies.Other potentially useful methods, such as Mossbauer spectroscopy and EPR,have not been widely used.
An elegant example of the measurement of an electron self-exchange rateof a redox protein was reported by Dahlin et ai. 59 The copper ion of stellacyaninwas removed and then replaced with either 63CU or 65CU. Oxidized [63CU] stellacyanin was allowed to react with reduced [65CU] stellacyanin for various times(10 ms to 7 min) at 20°C, after which the reaction was quenched by loweringthe solution temperature to - 120°C using a rapid-freeze apparatus:
(6.11)
Subtle differences in the EPR spectra (Figure 6.20) of the two isotopic forms ofstellacyanin (due to a small difference in the nuclear magnetic moments of thetwo isotopes) were used to monitor the progress of the reaction, yielding a rateconstant of 1.2 x 10 5 M - 1 S - I .
Much more common are cross reactions (Equation 6.12), where Aox is theoxidized reactant, Bred is the reduced reactant, Ared is the reduced product, andBox is the oxidized product.
(6.12)
For these reactions, fiGo 7"=- O. The experimental measurement of cross-reactionrates is generally more straightforward than the measurement of self-exchangerates. Either the reactants are simply mixed together, or a thermodynamicallyunstable system is generated rapidly (via pulse radiolysis, flash photolysis, ortemperature-jump relaxation) to initiate the redox reaction. Absorption spectroscopy has almost always been used to monitor the progress of protein cross reactions. The primary goal of theory, as will become evident, is to provide arelationship between fiGo and fiG+ for cross reactions.
Both self-exchange and cross reactions can be broadly classified as innersphere or outer-sphere reactions. In an inner-sphere reaction, a ligand is sharedbetween the oxidant and reductant in the transition state. An outer-sphere reac-
tion, on the other hand, is one in which the inner coordination shells of boththe oxidant and the reductant remain intact in the transition state. There is nobond breaking or bond making, and no shared ligands between redox centers.Long-range electron transfers in biology are all of the outer-sphere type.
III. ELECTRON-TRANSFER THEORY
A. Basic Concepts
The simplest electron transfer occurs in an outer-sphere reaction. The changesin oxidation states of the donor and acceptor centers result in a change in theirequilibrium nuclear configurations. This process involves geometric changes,the magnitudes of which vary from system to system. In addition, changes inthe interactions of the donor and acceptor with the surrounding solvent molecules will occur. The Franck-Condon principle governs the coupling of the electron transfer to these changes in nuclear geometry: during an electronic transition, the electronic motion is so rapid that the nuclei (including metal ligandsand solvent molecules) do not have time to move. Hence, electron transfer occurs at a fixed nuclear configuration. In a self-exchange reaction, the energiesof the donor and acceptor orbitals (hence, the bond lengths and bond angles of
III. ELECTRON-TRANSFER THEORY 337
the donor and acceptor) must be the same before efficient electron transfer cantake place.
The incorporation of the Franck-Condon restriction leads to the partitioning 60-65 of an electron-transfer reaction into reactant (precursor complex)and product (successor complex) configurations. The steps in Equations (6.13)to (6.15) go from reactants to products: K is the equilibrium constant for theformation of the precursor complex [Aox , Bred], and ket is the forward electrontransfer rate to produce the successor complex [Ared , Boxl.
Aox + Bred ( K ) lAox, Bred]
IAox, Bred]~ IAred. Box]
(6.13)
(6.14)
(6.15)
Marcus pioneered the use of potential energy diagrams as an aid in describing electron-transfer processes. 60 For the sake of simplicity, the donor and acceptor are assumed to behave like collections of harmonic oscillators. Instead oftwo separate potential energy surfaces being used for the reactants, they arecombined into a single surface that describes the potential energy of the precursor complex as a function of its nuclear configuration (i.e., the sum of thetranslational, rotational, and vibrational degrees of freedom of the reactant molecules and the molecules in the surrounding solvent-3N coordinates, where N isthe number of nuclei present). Similarly, a single potential energy (3N-dimensional) surface is used to describe the potential energy of the successor complexas a function of its nuclear configuration. It has become conventional to simplifysuch potential energy diagrams by using one-dimensional slices through the reactantand product surfaces in order to visualize the progress of a reaction, as illustrated in Figure 6.21.
>.e'(])c(])
Cii"-E(])
oQ.
nuclear configuration
(A)
>.e'(])c(])
Cii"-E(])
oQ.
nuclear configuration
(8)
Figure 6.21Potential energy diagrams: (A) self-exchange reaction; (B) cross reaction. Point S represents theactivated complex. ER and Ep are the reactant and product surfaces, respectively.
338 6 / ELECTRON TRANSFER
The intersection of the reactant and product surfaces (point S) represents thetransition state (or "activated complex"), and is characterized by a loss of onedegree of freedom relative to the reactants or products. The actual electrontransfer event occurs when the reactants reach the transition-state geometry. Forbimolecular reactions, the reactants must diffuse through the solvent, collide,and form a precursor complex prior to electron transfer. Hence, disentanglingthe effects of precursor complex formation from the observed reaction rate canpose a serious challenge to the experimentalist; unless this is gone, the factorsthat determine the kinetic activation barrier for the electron-transfer step cannotbe identified with certainty.
The surfaces depicted in Figure 6.21 presume that the electrons remain localized on the donor and acceptor; as long as this situation prevails, no electrontransfer is possible. Thus some degree of electronic interaction, or coupling, isrequired if the redox system is to pass from the precursor to the successor complex. This coupling removes the degeneracy of the reactant and product statesat the intersection of their respective zero-order surfaces (points S in Figure6.21) and leads to a splitting in the region of the intersection of the reactant andproduct surfaces (Figure 6.22). If the degree of electronic interaction is sufficiently small, first-order perturbation theory can be used to obtain the energiesof the new first-order surfaces, which do not cross. The splitting at the intersection is equal to 2HAB , where HAB is the electronic-coupling matrix element.
The magnitude of HAB determines the behavior of the reactants once theintersection region is reached. Two cases can be distinguished. First, HAB isvery small; for these so-called "nonadiabatic" reactions, there is a high probability that the reactants will "jump" to the upper first-order potential energysurface, leading to very little product formation. If the electronic interaction issufficiently large, as it is for "adiabatic" reactions, the reactants will remain onthe lower first-order potential energy surface upon passage through the transition-state region.
>- E R E R E R E Ri'?Q)cQ)
ca.~
Q)
00..
nuclear coordinate
(A) (B) (C)
Figure 6.22Potential energy diagrams: (A) RAB = 0, K = °(no transfer); (B) RAB small, K « 1 (nonadiabatic transfer); (C) RAB large, K = 1 (adiabatic transfer). The arrows indicate the relative probability of crossing to the product surface (ER to Ep).
III. ELECTRON-TRANSFER THEORY 339
The tenn adiabatic (Greek: a-dia-bainein, not able to go through) is used inboth thermodynamics and quantum mechanics, and the uses are analogous. Inthe former, it indicates that there is no heat flow in or out of the system. In thelatter, it indicates that a change occurs such that the system makes no transitionto other states. Hence, for an adiabatic reaction, the system remains on the same(i.e., lower) first-order electronic surface for the entire reaction. The probabilityof electron transfer occurring when the reactants reach the transition state isunity. The degree of adiabaticity of the reaction is given by a transmissioncoefficient, K, whose value ranges from zero to one. For systems whose H AB issufficiently large (>kBT, where k B is the Boltzmann constant), K = l. Thissituation occurs when the reacting centers are close together, the orbital symmetries are favorable, and no substantial changes in geometry are involved. Thetransmission coefficient is generally very small (K < 1) for electron-transfer reactions of metalloproteins, owing to the long distances involved.
B. Marcus Theory
In classical transition-state theory, the expression for the rate constant of a bimolecular reaction in solution is
k = KlJn exp ( - dG*IRT ), (6.16)
where lJ", the nuclear frequency factor, is approximately 10 11 M - I S - 1 for smallmolecules, and dG* is the Gibbs-free-energy difference between the activatedcomplex and the precursor complex. This theoretical framework provides thestarting point for classical electron-transfer theory. Usually the transmissioncoefficient K is initially assumed to be unity. Thus, the problem of calculatingthe rate constant involves the calculation of dG*, which Marcus partitioned intoseveral parameters:
(6.17)
(6.18)
Here w r is the electrostatic work involved in bringing the reactants to the meanreactant separation distance in the activated complex, and wP is the analogouswork term for dissociation of the products. These terms vanish in situationswhere one of the reactants (or products) is uncharged. dGo is the Gibbs-freeenergy change when the two reactants and products are an infinite distance apart,and dGo i is the free energy of the reaction when the reactants are a distance rapart in the medium; dGo is the standard free energy of the reaction, obtainablefrom electrochemical measurements (the quantity - dGo is called the drivingforce of the reaction).
The reorganization energy A is a parameter that contains both inner-sphere(Ai) and outer-sphere (A o) components; A = Ai + Ao . The inner-sphere reorga-
340 6 / ELECTRON TRANSFER
nization energy is the free-energy change associated with changes in the bondlengths and angles of the reactants. The Ai term can be evaluated within thesimple harmonic-oscillator approximation:
Ai = m2:kj (Lli)2,J
(6.19)
where kj values are normal-mode force constants, and the Lll:j values are differences in equilibrium bond lengths between the reduced and oxidized forms of aredox center.
The outer-sphere reorganization energy reflects changes in the polarizationof solvent molecules during electron transfer:
(6.20)
d is the distance between centers in the activated complex, generally taken tobe the sum of the reactant radii rA and rB; Dop is the optical dielectric constantof the medium (or, equivalently, the square of the refractive index); and Ds isthe static dielectric constant. This simple model for the effect of solvent reorganization assumes that the reactants are spherical, and that the solvent behavesas a dielectric continuum. (Sometimes the latter approximation is so rough thatthere is no correspondence between theory and experiment.)
Variations in A can have enormous effects on electron-transfer rates, Someof the possible variations are apparent from inspection of Equation (6.20). First,Ao decreases with increasing reactant size. Second, the dependence of the reaction rate on separation distance attributable to Ao occurs via the lid term. Third,Ao decreases markedly as the solvent polarity decreases. For nonpolar solvents,Ds = Dop = 1.5 to 4.0. It is significant to note that protein interiors are estimated to have Ds = 4, whereas, Ds = 78 for water. An important conclusionis that metalloproteins that contain buried redox cofactors need not experiencelarge outer-sphere reorganization energies.
The key result of Marcus theory is that the free energy of activation displaysa quadratic dependence on LlGo and A (ignoring work terms). Hence, the reaction rate may be written as
(6.21)
For intramolecular re<j.ctions, the nuclear frequency factor (vn) is ~10 13 S - 1.
One of the most striking predictions of Marcus theory follows from this equation: as the driving force of the reaction increases, the reaction rate increases,reaching a maximum at - LlGo = A; when - LlGo is greater than A, the ratedecreases as the driving force increases (Figure 6.23). Two free-energy regions,depending on the relative magnitudes of - LlGo and A, are thus distinguished.The normal free-energy region is defined by - LlGo < A. In this region, LlG*decreases if - LlGo increases or if A decreases. If - LlGo = A, there is no free-
341
IIII k
UniII
-----T------III
Figure 6.23Plot of log ket as a function of increasing driving force (- LlGO). Three LlGoregions are indicated: nonnal ( - LlGo < ~); activationless ( - LlGo = A);and inverted (- LlGo > ~). The corresponding two-well (ER , Ep ), diagramsalso are shown. The dashed curve (kdiff) is for a bimolecular reaction. Thepredicted behavior of a unimolecular reaction (kun;) is given by the solidcurve; here the rate could be as high as 10 13 S ~ I, because it is not maskedby diffusional processes.
energy barrier to the reaction. In the inverted region, defined by -IlGo > A,IlG* increases if A decreases or if -IlGo increases.
Another widely used result of Marcus theory deals with the extraction ofuseful kinetic relationships for cross reactions from parameters for self-exchangereactions. Consider the cross reaction, Equation (6.22), for which the rate
(6.22)
and equilibrium constants are k12 and K 12 , respectively. Two self-exchange reactions are pertinent here:
A,(ox) + A,(red)~ A, (red) + A,(ox),
A2(ox) + A2(red)~ Adred) + A2(ox).
(6.23a)
(6.23b)
These reactions are characterized by rate constants k 11 and kn , respectively.The reorganization energy (Ad for the cross reaction can be approximated asthe mean of the reorganization energies for the relevant self-exchange reactions:
(6.24)
Substitution of Equation (6.24) into Equation (6.17) leads to the relation
(6.25a)
342 6 / ELECTRON TRANSFER
where
(6.25b)
When the self-exchange rates k11 are corrected for work terms or when the latternearly cancel, the cross-reaction rate kl2 is given by the Marcus cross relation,
(6.26a)
where
(6.26b)
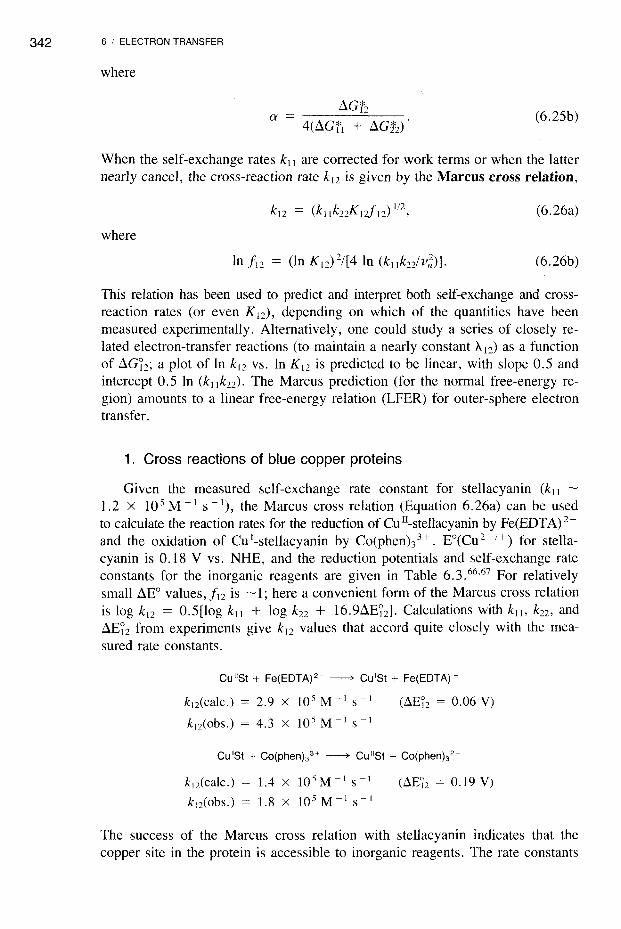
This relation has been used to predict and interpret both self-exchange and crossreaction rates (or even Kd, depending on which of the quantities have beenmeasured experimentally. Alternatively, one could study a series of closely related electron-transfer reactions (to maintain a nearly constant A12) as a functionof ~G12; a plot of In kl2 vs. In K12 is predicted to be linear, with slope 0.5 andintercept 0.5 In (k ll k22). The Marcus prediction (for the normal free-energy region) amounts to a linear free-energy relation (LFER) for outer-sphere electrontransfer.
1. Cross reactions of blue copper proteins
Given the measured self-exchange rate constant for stellacyanin (kll ~1.2 X 10 5 M -I S -I), the Marcus cross relation (Equation 6.26a) can be usedto calculate the reaction rates for the reduction of euII-stellacyanin by Fe(EDTA) 2and the oxidation of Cul-stellacyanin by Co(phenh3+. EO(Cu 2 +/+) for stellacyanin is 0.18 V vs. NHE, and the reduction potentials and self-exchange rateconstants for the inorganic reagents are given in Table 6.3. 66
,67 For relativelysmall ~Eo values, 112 is ~1; here a convenient form of the Marcus cross relationis log k12 = 0.5[log kll + log k22 + 16.9~E12]' Calculations with kll , k22 , and~E12 from experiments give k12 values that accord quite closely with the measured rate constants.
Cu"S! + Fe(EDTA)2-~ CUIS! + Fe(EDTA)-
kdcalc.) = 2.9 x 10 5 M -I s-I
kdobs.) = 4.3 x 10⁵ M -1 s-I
(~ET2 = 0.06 V)
CUIS! + Co(phenh 3 +~ Cu"S! + Co(phenh2+
k12(calc.)
kdobs.)
1.4 X lOsM- 1 S-l
1.8 x 10⁵ M- 1 s-I
(~ET2 = 0.19 V)
The success of the Marcus cross relation with stellacyanin indicates that thecopper site in the protein is accessible to inorganic reagents. The rate constants
IV. LONG-RANGE ELECTRON TRANSFER IN PROTEINS 343
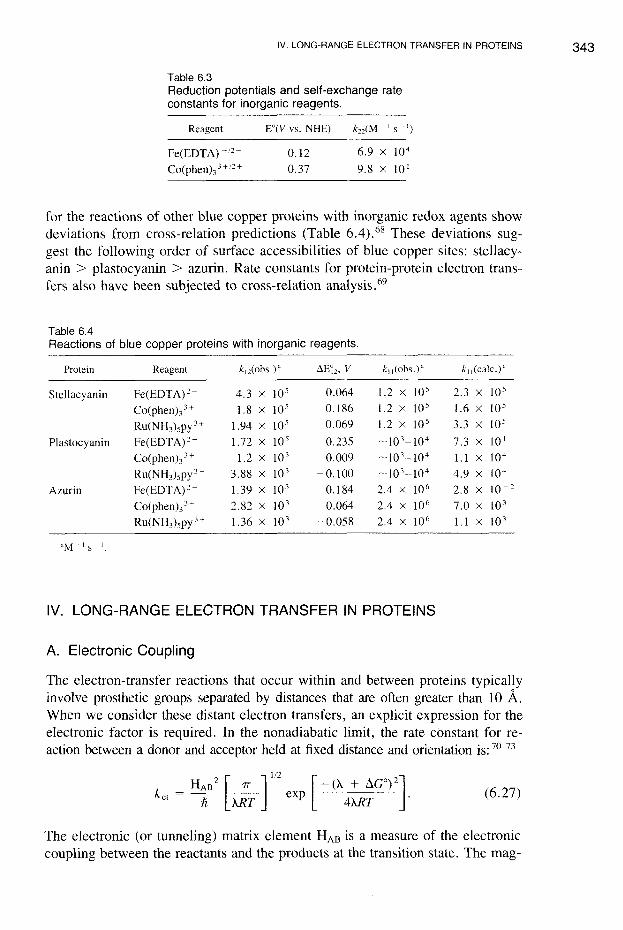
Table 6.3Reduction potentials and self-exchange rateconstants for inorganic reagents.
Reagent
Fe(EDTA) -!2~
Co(phenh3+!2+
0.120.37
6.9 X 10 4
9.8 X 10 1
for the reactions of other blue copper proteins with inorganic redox agents showdeviations from cross-relation predictions (Table 6.4).68 These deviations suggest the following order of surface accessibilities of blue copper sites: stellacyanin > plastocyanin > azurin. Rate constants for protein-protein electron transfers also have been subjected to cross-relation analysis. 69
Table 6.4Reactions of blue copper proteins with inorganic reagents.
Protein Reagent k,2(obs.)" ~E~2' V kll(obs.)" kll(calc.)"
Stellacyanin Fe(EDTA)2- 4.3 X 10 5 0.064 1.2 X 10 5 2.3 X 10⁵
Co(phenh3+ 1.8 X 10 5 0.186 1.2 X 10 5 1.6 X 10 5
Ru(NH3)sPy 3+ 1.94 X 10 5 0.069 1.2 X 10 5 3.3 X 10 5
Plastocyanin Fe(EDTA)2- 1.72 X 10⁵ 0.235 -10 3_10 4 7.3 X 10 1
Co(phen)33 + 1.2 X 10 3 0.009 -10 3_10 4 1.1 X 10⁴
Ru(NH3)spy 3 + 3.88 X 10 3 -0.100 -10 3 _10 4 4.9 X 10 4
Azurin Fe(EDTA)2- 1.39 X 10 3 0.184 2.4 X 10⁶ 2.8 X 10 -2
Co(phenh H 2.82 X 10 3 0.064 2.4 X 10⁶ 7.0 X 10 3
Ru(NH3)spy 3+ 1.36 X 10 3 0.058 2.4 X 10⁶ l.1x 10 3
aM I S -I.
IV. LONG-RANGE ELECTRON TRANSFER IN PROTEINS
A. Electronic Coupling
The electron-transfer reactions that occur within and between proteins typicallyinvolve prosthetic groups separated by distances that are often greater than 10 A.When we consider these distant electron transfers, an explicit expression for theelectronic factor is required. In the nonadiabatic limit, the rate constant for reaction between a donor and acceptor held at fixed distance and orientation is: 70-73
(6.27)
The electronic (or tunneling) matrix element HAB is a measure of the electroniccoupling between the reactants and the products at the transition state. The mag-
344 6 / ELECTRON TRANSFER
nitude of RAB depends upon donor-acceptor separation, orientation, and the nature of the intervening medium. Various approaches have been used to test thevalidity of Equation (6.27) and to extract the parameters RAB and A. Drivingforce studies have proven to be a reliable approach, and such studies have beenemphasized by many workers. 73,74
In the nonadiabatic limit, the probability is quite low that reactants willcross over to products at the transition-state configuration. 72 This probabilitydepends upon the electronic hopping frequency (determined by RAB ) and uponthe frequency of motion along the reaction coordinate. 75 In simple models, theelectronic-coupling strength is predicted to decay exponentially with increasingdonor-acceptor separation (Equation 6.28): 72,76
o [-13 0]HAB = HAB exp "2 (d-d ) (6.28)
In Equation (6.28), R~B is the electronic coupling at close contact (dO), and {3is the rate of decay of coupling with distance (d). Studies of the distance dependence of electron-transfer rates in donor-acceptor complexes, and of randomlyoriented donors and acceptors in rigid matrices, have suggested 0.8:s{3:s 1.2 A-1.73,74,77,78
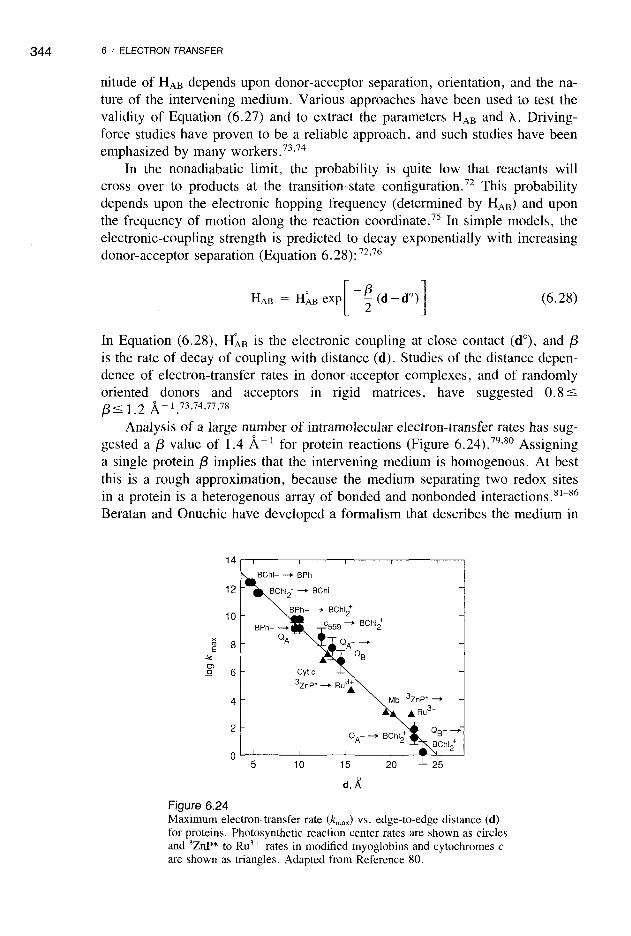
Analysis of a large number of intramolecular electron-transfer rates has suggested a {3 value of 1.4 A-1 for protein reactions (Figure 6.24).79,80 Assigninga single protein {3 implies that the intervening medium is homogenous. At bestthis is a rough approximation, because the medium separating two redox sitesin a protein is a heterogenous array of bonded and nonbonded interactions. 81- 86
Beratan and Onuchic have developed a formalism that describes the medium in
2015
d,A10
BChl- -+ BPh
BChl2' -+ BChl
BPh- -+ BChI2+
c559
-+ BChI2+
14
12
10
x8'"E
->c01g 6
4
2
05
Figure 6.24Maximum electron-transfer rate (kmax ) vs. edge-to-edge distance (d)for proteins. Photosynthetic reaction center rates are shown as circlesand 3ZnP* to Ru3 + rates in modified myoglobins and cytochromes care shown as triangles. Adapted from Reference 80.
9
10
A
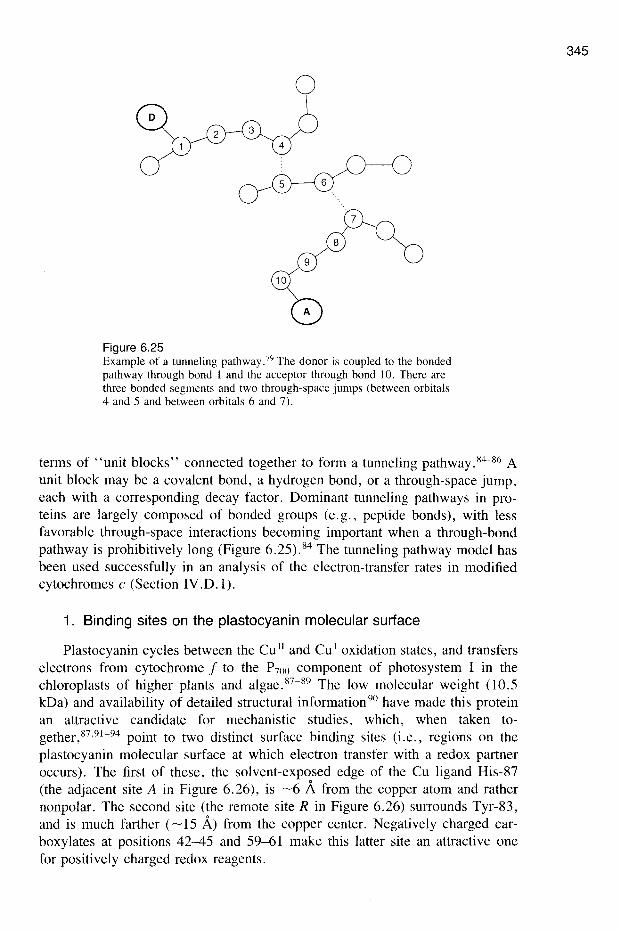
Figure 6.25Example of a tunneling pathway. 79 The donor is coupled to the bondedpathway through bond I and the acceptor through bond 10. There arethree bonded segments and two through-space jumps (between orbitals4 and 5 and between orbitals 6 and 7).
terms of "unit blocks" connected together to form a tunneling pathway. 84-86 Aunit block may be a covalent bond, a hydrogen bond, or a through-space jump,each with a corresponding decay factor. Dominant tunneling pathways in proteins are largely composed of bonded groups (e.g., peptide bonds), with lessfavorable through-space interactions becoming important when a through-bondpathway is prohibitively long (Figure 6.25).84 The tunneling pathway model hasbeen used successfully in an analysis of the electron-transfer rates in modifiedcytochromes c (Section IV.D.I).
1. Binding sites on the plastocyanin molecular surface
Plastocyanin cycles between the Cu II and Cu I oxidation states, and transferselectrons from cytochrome f to the P700 component of photosystem I in thechloroplasts of higher plants and algae. 87- 89 The low molecular weight (l0.5kDa) and availability of detailed structural information 90 have made this proteinan attractive candidate for mechanistic studies, which, when taken together,87,91-94 point to two distinct surface binding sites (i.e" regions on theplastocyanin molecular surface at which electron transfer with a redox partneroccurs). The first of these, the solvent-exposed edge of the Cu ligand His-87(the adjacent site A in Figure 6.26), is ~6 A from the copper atom and rathernonpolar. The second site (the remote site R in Figure 6.26) surrounds Tyr-83,and is much farther (~15 A) from the copper center. Negatively charged carboxylates at positions 42-45 and 59-61 make this latter site an attractive onefor positively charged redox reagents.
345
346
Figure 6.26Structure of poplar plastocyanin illustrating the adjacent(A) and remote (R) surface binding sites.
Bimolecular electron-transfer reactions are typically run under pseudo-firstorder conditions (e.g., with an inorganic redox reagent present in ~ IS-fold excess):
For some reactions [e.g., Co(phenh 3 + oxidation of plastocyanin (CUI)] the expected linear plot of kobs vs. [complex] is not observed. Instead, the rate isobserved to saturate (Figure 6.27).95 A "minimal" model used to explain thisbehavior involves the two pathways for electron transfer shown in Equation(6.30).
(6.30)
347
103[Co(phen)~+], (M)
Figure 6.27Dependence of first-order rate constants kobs (25°C) on [Co(phenh3+]for the oxidation of plastocyanin PCut at pH 7.5. Key: ., spinach;and A, parsley.95
Surprisingly, the rate ratio kremotelkadjacent is 7.Calculations 81 indicate that, despite the significant differences in distances,
HAB for the remote site is ~15 percent of HAB for the adjacent site. This figureis much higher than would be expected from distance alone, suggesting that thevalue of the decay parameter f3 in Equation (6.28) depends strongly on thestructure of the intervening medium.
B. Modified Metalloproteins
Chemical modification of structurally characterized metalloproteins by transition-metal redox reagents has been employed 52,53,96-98 to investigate the factorsthat control long-range electron-transfer reactions. In these semisynthetic multisite redox systems, the distance is fixed, and tunneling pathways between thedonor and acceptor sites can be examined.
1. Ruthenium-modified myoglobin
Sperm-whale myoglobin can be reacted with (NH3)5Ru(OH2)2+ and thenoxidized to produce a variety of ruthenated products,52,99-101 including a His-48derivative whose Ru ~ Fe tunneling pathway is depicted in Figure 6.28. Electrochemical data (Table 6.5) indicate that the (NH3)sRu 3+ group does not significantly perturb the heme center, and that equilibrium (i.e., k obs = k l + L 1)
should be approached when a mixed-valent intermediate is produced by flash-
348 6 I ELECTRON TRANSFER
His-48
Figure 6.28Electron-tunneling pathway for myoglobin modified at His-48.The pathway moves along the protein backbone from His-48 toArg-45, and then to the heme via an H-bond (=) to the hemepropionate. The His-48 to heme edge-edge distance is 12.7 A. 101
This kinetic behavior was observed,52 and both the forward (k l ) and reverse(k _I) reactions were found to be markedly temperature-dependent: k) =0.019 S -I (25°C), Mit = 7.4 kcallmol, L 1 = 0.041 s -) (25°C), Mit =19.5 kcallmol. X-ray crystallographic studies 102 indicate that the axial waterligand dissociates upon reduction of the protein. This conformational changedoes not control the rates, since identical results were obtained when a secondflash-photolysis technique 99 was used to generate (NH3)5Ru3+ -Mb(Fe 2+) in order to approach the equilibrium from the other direction.
Cyanogen bromide has been used 103 to modify the six-coordinate metmyoglobin heme site, causing the coordinated water ligand to dissociate. The CNBr-
Table 6.5Thermodynamic parameters for the reduction of (NH3)sRu 3 + and the hemesite in native and modified myoglobin (Mb).a
Modified Mb
Thennodynamic parameter
EO, mY vs. NHE (25°C)!:leo, kcal mol - 1 (25°C)!:lSo, e.u.Mio, kcal mol - 1 (25°C)
Native MbFe3-+/2+
58.8 ± 2-1.26 ± 0.05-39.2 ± 1.2- 13.0 ± 0.4
Fe 3 +!2+
65.4 ± 21.51 ± 0.05
-37.6 ± 1.2-12.7 ± 0.4
85.8 ± 2- 1.98 ± 0.05
4.2 ± 1.2-0.7 ± 0.4
a pH 7.0, /h = O. J M phosphate buffer.
IV, LONG-RANGE ELECTRON TRANSFER IN PROTEINS 349
modified myoglobin heme site is thus five-coordinate in both oxidation states.As expected, the self-exchange rate increased from ~ I M ~ I S ~ I to~104 M ~I S ~I.
Recent efforts in modeling biological electron transfers using chemicallymodified redox proteins 104--106 point the way toward the design of semisyntheticredox enzymes for catalytic applications. An intriguing example, termed flavohemoglobin, was produced by reaction of hemoglobin with a flavin reagent designed to react with Cys-93 of the ,B-chain (i.e., the hemoglobin molecule wasmodified by two flavin moieties).107 The resulting derivative, unlike nativehemoglobin, accepts electrons directly from NADPH and catalyzes the parahydroxylation of aniline in the presence of O2 and NADPH.
C. Protein-Protein Complexes
In physiologically relevant precursor complexes, both redox centers are frequently buried in protein matrices. Characterization of such protein-protein complexes is clearly important, and several issues figure prominently:
(1) What are the "rules" that govern complex formation? How importantare protein-dipole/protein-dipole interactions, intermolecular hydrogenbonding, and hydrophobic interactions?
(2) Are the water (and small solute) molecules associated with protein surfaces "squeezed" out of the interfacial region upon complex formation?
(3) Within a given complex, is there a high degree of structural order, ordo the proteins retain some independent mobility?
Most of our knowledge about the structures of protein-protein complexescomes from crystallographic studies 108-110 of antigen-antibody complexes andmultisubunit proteins; such systems generally exhibit a high degree of thermodynamic stability. On the other hand, complexes formed as a result of bimolecular collisions generally are much less stable, and tend to resist attempts to growx-ray-quality crystals; the high salt conditions typically used in protein crystallizations often lead to dissociation of such complexes.
1. Cytochrome b5-cytochrome c
One of the most widely studied protein-protein complexes is that formedbetween mammalian cytochrome bs and cytochrome c. Using the known x-raystructures of both proteins, Salemme III generated a static computer graphicsmodel of this electron-transfer complex by docking the x-ray structures of theindividual proteins. Two features of this model and its revision 112 by moleculardynamics simulations (Figure 6.29 See color plate section, page C-12.) arenoteworthy: (1) several Lys residues on cytochrome c and carboxylate-containing groups on cytochrome bs form "salt bridges" (i.e., intermolecular hydrogen
350 6 / ELECTRON TRANSFER
0.020
0.016
<0
<{"' 0.012<l
0
0.008
0.004
o
mole fraction bs
Figure 6.30Job plot of the ehange in absorbance at 416 nm due to complex formationbetween cytochrome bs and cytochrome c (25°C, pH 7.0 (phosphate),f.L = 1 mM, 10.54 f.LM total protein concentration).114
bonds); and (2) the hemes are nearly coplanar and are ~17 A (Fe-Fe) apart.This distance was confirmed by an energy-transfer experiment 113 in which thefluorescence of Zn-substituted cytochrome c was quenched by cytochrome b5 .
Spectroscopic studies 114.115 have verified the suggestion that these proteins forma I: I complex at low ionic strength (Figure 6.30). In addition, chemicalmodification 116 and spectroscopic analyses 117-119 are all in agreement with thesuggestion Ill, 112 that the complex is primarily stabilized by electrostatic interactions of the (-NH3+ ... -02C-) type. The effect of ionic strength on thereduction of cytochrome c by cytochrome b5 is also in accord with this picture: 120 lowering the ionic strength increases the reaction rate, as expected foroppositely charged molecules.
2. Hybrid hemoglobins
A common 52,55,57,121,122 experimental strategy for studying electron transfersbetween proteins uses a metal-substituted heme protein as one of the reactants.In particular, the substitution of zinc for iron in one of the porphyrin redoxcenters allows facile initiation of electron transfer through photoexcitation of thezinc porphyrin (ZnP). The excited zinc porphyrin, 3ZnP* in Equation (6.32),may decay back (kd ~ ]02 S -I) to the ground state or transfer an electron to anacceptor.
(6.32)
[ZnP, Acceptoroxl
Figure 6.31Structure of the 0'1 and /32 subunits of hemoglobin.The edge-edge separation of the two hemes is 20 A.
The ZnP + cation radical produced in the kf step is a powerful oxidant; backelectron transfer (kb) will thus occur and regenerate the starting material.
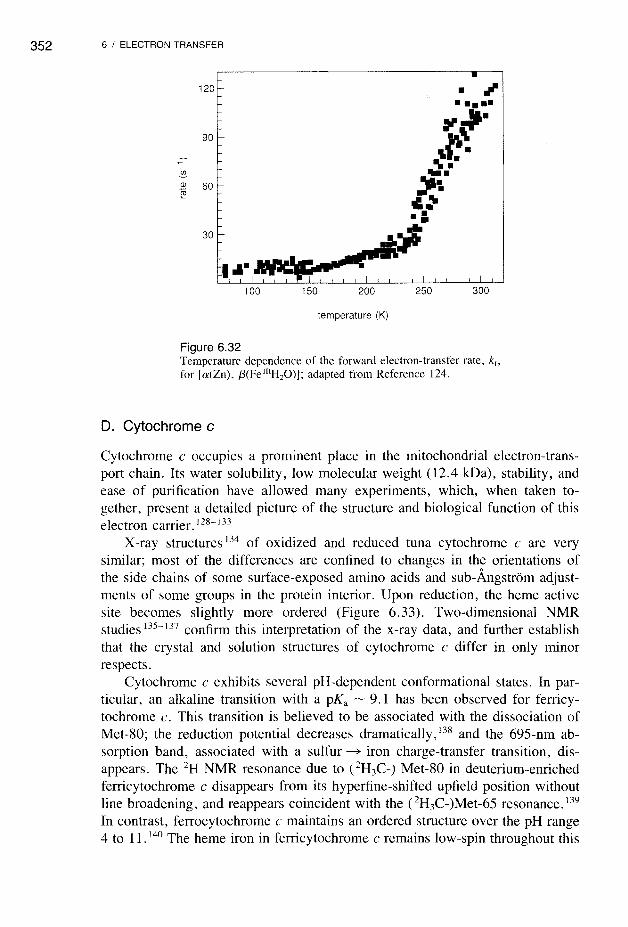
The reactions shown in Equation (6.32) have been investigated in mixedmetal [Zn, Fe] hemoglobins. 123- 125 A hemoglobin molecule can be viewed astwo independent electron-transfer complexes, each consisting of an al-f32 subunit pair (Figure 6.31), since the al-a2, f31-f32, and al-f31 distances are prohibitively long (> 30 A).
Both [a(Zn), f3(Fe)] and [a(Fe), f3(Zn)] hybrids have been studied. The ZnPand FeP are nearly parallel, as in the cytochrome b5-cytochrome c model complex. Long-range electron transfer eZnP* ~ Fe3+) between the al and f32 subunits has been observed (the heme-edge/heme-edge distance is ~20 A). Thedriving force for the forward electron-transfer step is ~0.8 eV, and kf (seeEquation 6.32) is ~100 S -I at room temperature, but decreases to ~9 s -I inthe low-temperature region (Figure 6.32). Below 140-160 K the vibrations thatinduce electron transfer "freeze out"; nuclear tunneling is usually associatedwith such slow, temperature-independent rates. A complete analysis of the fulltemperature dependence of the rate requires a quantum-mechanical treatment 126,127of A.i rather than that employed in the Marcus theory. It is interesting to notethat the heme b vinyl groups (see Figure 6.6) for a given [al(Fe), f3iZn)]hybrid point toward each other and appear 125 to facilitate electron transfer.
351
.• ,jI•••••~~.
~~-.
~.......~,
C~·1..
~~
352 6 I ELECTRON TRANSFER
120 c-
90 c-
'I!:!'.-CD 60 c-1§
30 c-
I ~·1Ii•
I ""Ii",100 150
-I
200
temperature (K)
I
250I
300
Figure 6.32Temperature dependence of the forward electron-transfer rate, kf ,
for [a(Zn), I3(Fe lllHzO»); adapted from Reference 124.
D. Cytochrome c
Cytochrome c occupies a prominent place in the mitochondrial electron-transport chain. Its water solubility, low molecular weight (12.4 kDa), stability, andease of purification have allowed many experiments, which, when taken together, present a detailed picture of the structure and biological function of thiselectron carrier. 128-133
X-ray structures 134 of oxidized and reduced tuna cytochrome c are verysimilar; most of the differences are confined to changes in the orientations ofthe side chains of some surface-exposed amino acids and sub-Angstrom adjustments of some groups in the protein interior. Upon reduction, the heme activesite becomes slightly more ordered (Figure 6.33). Two-dimensional NMRstudies 135-137 confirm this interpretation of the x-ray data, and further establishthat the crystal and solution structures of cytochrome c differ in only minorrespects.
Cytochrome c exhibits several pH-dependent conformational states. In particular, an alkaline transition with a pKa ~ 9.1 has been observed for ferricytochrome c. This transition is believed to be associated with the dissociation ofMet-80; the reduction potential decreases dramatically, 138 and the 695-nm absorption band, associated with a sulfur......,. iron charge-transfer transition, disappears. The 2H NMR resonance due to CZH3C-) Met-80 in deuterium-enrichedferricytochrome c disappears from its hyperfine-shifted upfield position withoutline broadening, and reappears coincident with the CZH3C-)Met-65 resonance. 139In contrast, ferrocytochrome c maintains an ordered structure over the pH range4 to 11. 140 The heme iron in ferricytochrome c remains low-spin throughout this
Figure 6.33Side-chain motion in the vicinity of the heme of cytochrome c. Heavy linesindicate the reduced molecule, and light lines the oxidized molecule. 134
transition, and a new strong-field ligand must therefore replace Met-80. It hasbeen suggested that an e-amino nitrogen of a nearby Lys provides the new donoratom, but this has not been confirmed. However, it is clear that reduction offerricytochrome c at alkaline pH values below 11 causes a drastic conformational change at the heme site. The unknown sixth ligand must be displaced byMet-80 in order for the reduced protein to assume a structure similar to the oneat neutral pH. This structural change is accompanied by a decrease in the rateof reduction of ferricytochrome c by hydrated electrons,141 as expected.
How does the protein control the reduction potential of the iron center incytochrome c? Factors that appear to play a role include the nature of the axialligands, the stability and solvent accessibility of the heme crevice, and the hydrophobicities of the amino acids that line the heme crevice. These issues havebeen addressed theoretically 142,143 and experimentally 144-149 using cytochrome cvariants engineered by protein semisynthesis or site-directed mutagenesis. Results for horse heart cytochrome c are set out in Table 6.6. Point mutations ateither of positions 78 or 83 do not significantly alter E0
1; however, the double
mutant (Thr-78 ~ Asn-78; Tyr-83 ~ Phe-83) exhibits a substantially lower redox potential. Evidently, the results of such changes are not necessarily additive; great care must be taken in drawing conclusions about structure-functionrelations in engineered proteins. Finally, the ~ 310mV difference between thevalues for the heme octapeptide and the native protein (the axial ligands are thesame in both) provides a dramatic illustration of protein environmental effectson the redox potential: shielding the heme from the solvent is expected to stabilize Fell and therefore result in an increase in E0
1•
353
354 6 / ELECTRON TRANSFER
Table 6.6Reduction potentials a of horse heart cytochrome c.
Cytochrome
Native
Met-80 ~ His-80
Tyr-67 ~ Phe-67
Thr-78 ~ Asn-78
Tyr-83 ~ Pro-83
Thr-78, Tyr-83 ~ Asn-78, Pro-83Heme octapeptide b
" pH 7.0, 25°C.b In 2M N-acetyl-DL-methionine.
EO'(mV vs. NHE)
262
41225
264
266
235-50
Reference
138144145145145145146
During the last fifteen years, much has been learned about the interaction ofcytochrome c with its redox partners. 128- 133 Cytochrome c is a highly basicprotein (pI = 10.05); lysine residues constitute most of the cationic amino acids.Despite the indication from the x-ray structures that only ~1 percent of theheme surface is solvent-exposed, the asymmetric distribution of surface charges,particularly a highly conserved ring of Lys residues surrounding the exposededge of the heme crevice, led to the suggestion that electron-transfer reactionsof cytochrome c (and other Class I cytochromes as well) occur via the exposedheme edge.
Chemical modification of the surface Lys residues of cytochrome c has afforded opportunities to alter the properties of the surface E-amino groups suspected to be involved in precursor complex formation. Margoliash andcoworkers 133,150,151 used a 4-carboxy-2,6-dinitrophenol (CDNP) modification ofthe Lys residues to map out the cytochrome c interaction domains with varioustransition-metal redox reagents and proteins. These experiments have shown thatcytochrome c interacts with inorganic redox partners near the exposed hemeedge.
Numerous studies 129,152,153 of cytochrome c with physiological reaction partners are in accord with electrostatic interactions featured in the model cytochrome c/cytochrome b5 complex discussed earlier. Similar types of interactionshave been proposed for cytochrome c/flavodoxin 154 and cytochrome c/cytochrome c peroxidase complexes. 155 (Recent x-ray crystal structure work 155b hasshed new light on this problem.) Theoretical work 156 additionally suggests thatelectrostatic forces exert torques on diffusing protein reactants that "steer" theproteins into a favorable docking geometry. However, the domains on cytochrome c for interaction with physiological redox partners are not identical, asFigure 6.34 illustrates.
Reactions between cytochrome c and its physiological redox partners at lowionic strength generally are very fast, ~10 8 M -I S 1, even though the thermodynamic driving force may be as low as 20 mV, as it is for the reduction of
355
2225
22
39 39
cytochrome c reductase cytochrome c oxidase
2522
39~su Ifite oxidase cytochrome c peroxidase
Figure 6.34Domains on cytochrome c for interaction with physiological redox partners. The heme edge isrepresented by the shaded rectangle. The number of circles around a given Lys residue is proportional to the percentage of the observed inhibition in redox assays when the correspondingCDNP-modified cytochrome c is used. 151
cytochrome a in cytochrome c oxidase. Such rates are probably at the diffusioncontrolled limit for such protein-protein reactions. 157.158 A more detailed understanding of these reactions will require studies that focus on the dynamical (ratherthan static) features of complexes of cytochrome c with other proteins. For example, there is evidence 159 that a cytochrome c conformational change in thevicinity of the heme edge accompanies the formation of the complex with cytochrome c oxidase. Studies of the influence of geometry changes on activationenergies 52,60, 160 are of particular importance in elucidating the mechanisms ofprotein-protein reactions.
356 6 / ELECTRON TRANSFER
1. Ruthenium-modified cytochrome c
Intramolecular electron transfer in cytochrome c has been investigated byattaching photoactive Ru complexes to the protein surface. 98 ,161 Ru(bpyh(C03)(bpy = 2,2' -bipyridine) has been shown to react with surface His residues toyield, after addition of excess imidazole (im), Ru(bpyh(im)(His)2+. The protein-bound Ru complexes are luminescent, but the excited states (*Ru2+) arerather short lived (1":5 100 ns). When direct electron transfer from *Ru2+ tothe heme cannot compete with excited-state decay, electron-transfer quenchers(e.g., Ru(NH3)63+) are added to the solution to intercept a small fraction(I-I0%) of the excited molecules, yielding (with oxidative quenchers) Ru3+.If, before laser excitation of the Ru site, the heme is reduced, then the Fe2+ toRu3+ reaction (ket ) can be monitored by transient absorption spectroscopy. Theket values for five different modified cytochromes have been reported: (Ru(His33), 2.6(3) x 106; Ru(His-39), 3.2(4) x 106; Ru(His-62), 1.0(2) x 104; Ru(His72),9.0(3) x 105; and Ru(His-79), > 108 S-I).162,163
According to Equation (6.27), rates become activationless when the reactiondriving force (- ~GO) equals the reorganization energy (A), The driving force(0.74 eV) is approximately equal to the reorganization energy (0.8 eV) estimated for the Ru(bpyh(im)(His)-cyt c reactions. 161 The activationless (maximum) rates (kmax) are limited by Hh, where HAB is the electronic matrix element that couples the reactants and products at the transition state. Values ofkmax and HAB for the Fe2+ to Ru3+ reactions are given in Table 6.7.
Calculations that explicitly include the structure of the intervening medium 8186,164-169 have been particularly helpful in developing an understanding of distantelectronic couplings. As discussed in Section IV.A, the couplings in proteinscan be interpreted in terms of pathways comprised of covalent, H-bond, andthrough-space contacts. An algorithm has been developed 85,170 that searches a
Table 6.7Electron-transfer parameters163 for Ru(bpYb(im)(His-X)-cytochromes c.
79 > 1.0 x 10⁸ >0.6 4.5 8 (8C) 11.239 3.3 x 10⁶ 0.11 12.3 14.0 (l1C) 19.6
(lH)
33 2.7 x 10⁶ 0.097 11.1 13.9 (11C) 19.5(lH)
72 9,4x 10⁵ 0.057 8,4 17.6 (7C) 24.6(lS)
62 1.0 x 10⁴ 0.006 14.8 20.6 (l6C) 28.8(2H)
ac covalent bond, H hydrogen bond, S = space jump.
357
33~
,
(A)
62 \-e72
(B)
b
10
x 179 7J'"E 39 39-'<: 33_- 330>
72- -72.Q
5
62- 62
5 10
(d-3), A15 40
Figure 6.35(A) Electronic coupling pathways to the heme from Ru-modified residues in native (His-33 horseheart, His-39 yeast), genetically engineered (His-62 yeast), and semisynthetic (His-n, His-79horse heart) cytochromes c. Solid lines are covalent bonds; dashed lines are hydrogen bonds;and the dotted line (His-n pathway) is a space jump. (B) The left half of the diagram (a) showsmaximum electron-transfer rate vs. d minus 3 A(van der Waals contact). Exponential-decayline with I x 1013 S - 1 intercept and 1.4 A-I slope. The right half of the diagram (b) showsmaximum rate vs. al: 0.71 A-I slope; 3 x 10¹² S -1 intercept. Adapted from References 162 and163.
protein structure for the best pathways coupling two redox sites (the pathwaysbetween the histidines (33, 39, 62, 72, 79) and the heme are shown in Figure6.35). A given coupling pathway consisting of covalent bonds, H-bonds, andthrough-space jumps can be described in terms of an equivalent covalent pathway with an effective number of covalent bonds (neff)' Multiplying the effectivenumber of bonds by 1.4 A/bond gives a-tunneling lengths (al) for the fivepathways (Table 6.7) that correlate well with the maximum rates (one-bond
358 6 / ELECTRON TRANSFER
limit set at 3 x 10¹² S -I; slope of 0.71 A-I) (Figure 6.35). The 0.71 A-I decayaccords closely with related distance dependences for covalently coupled donoracceptor molecules. 73,77
E. Bacterial Photosynthetic Reaction Centers
Photosynthetic bacteria produce only one type of reaction center, unlike greenplants (which produce two different kinds linked together in series), and aretherefore the organisms of choice in photosynthetic electon-transfer research. 171
176 As indicated in Section LB, the original reaction center structure (Figure6.15) lacked a quinone (QB)' Subsequent structures for reaction centers fromother photosynthetic bacteria 177,178 contain this quinone (Figure 6.36 See colorplate section, page C-13.). The Rps. sphaeroides reaction center contains tencofactors and three protein subunits. (Note that the Rps. viridis structure contains a cytochrome subunit as well.) The cofactors are arrayed so that theynearly span the 40-A-thick membrane (Figure 6.37 See color plate section, pageC-13.). The iron atom is indicated by the red dot near the cytoplasmic side ofthe membrane (bottom). In spite of the near two-fold axis of symmetry, electrontransfer proceeds along a pathway that is determined by the A branch. In particular, BChlB and BPheB do not appear to play an important role in the electrontransfers.
It was demonstrated long ago that (BChlh is the primary electron donor andthat ubiquinone (or metaquinone) is the ultimate electron acceptor. Transientflash photolysis experiments indicate that several electron-transfer steps occur inorder to translocate the charge across the membrane (Figure 6.38). Curiously,the high-spin ferrous iron appears to play no functional role in the QA to QBelectron transfer. 179 In addition, the part played by BChlA is not understood-itmay act to promote reduction of BPheA via a superexchange mechanism. 180,181
Cytochromes supply the reducing equivalents to reduce the special pair (BChlh + .
Estimated rate constants for the various electron-transfer steps, together withapproximate reduction potentials, are displayed in Figure 6.39. For each step,the forward rate is orders of magnitude faster than the reverse reaction. Therapid rates suggest that attempts to obtain x-ray structures of intermediates (especially the early ones!) will not be successful. However, molecular dynamicsmethods are being explored in computer simulations of the structures of variousintermediates. 182,183 Within a few years we may begin to understand why theinitial steps are so fast.
y'BChl),B?h"a,a,~
(BChl)2BPheA0A (BChl)2+BPheA-OAOsa,H'1
(BChl)2BPheA0A-0S-
,-\ ,BChl),B?h',a,a,-(BChl)2+BPheAOA-OS- /
~ /hU(BChl)2+BPheA-OAOS-
Figure 6.38Forward electron transfer through the reaction center. Note that two charge translocations mustoccur in order for the (labile) quinol QBH2 to be produced. Once QBHz dissociates from the RCand is replaced by another, oxidized, QB, the cycle can begin anew.
~ -0.4ca"EOJ(5Cl.C0
t5::l
"0 0OJa:
Figure 6.39Electron-transfer rates (for forward and reverse reactions) and reductionpotentials for RC intermediates.
359
360 6 I ELECTRON TRANSFER
V. REFERENCES
1. R. C. Prince, Trends Biochem. Sci. 13 (1988),286-288.2. R. C. Prince and G. N. George, Trends Biochem. Sci. 15 (1990), 170-172.3. E. T. Adman, Biochim. Biophys. Acta 549 (1979), 107-144.4. H. B. Gray and B. G. Malmstrom, Comments Inorg. Chem. 2 (1983), 203-209.5. T. E. Meyer and M. A. Cusanovich, Biochim. Biophys. Acta 975 (1989), 1-28.6. R. P. Simondsen and G. Tollin, Mol. Cellular Biochem. 33 (1980), 13-24.7. C. T. W. Moonen and F. Muller, Biochemistry 21 (1982), 408-414.8. H. B. Gray and E. 1. Solomon, in T. G. Spiro, ed., Copper Proteins, Wiley, 1981, pp. 1-39.9. E. T. Adman, in P. Harrison, ed., Metalloproteins, Macmillan, 1985, Part I, pp. 1-42.
10. O. Farver and 1. Pecht, in R. Lontie, ed., Copper Proteins and Copper Enzymes, CRC Press, 1984,vol. I, pp. 183-214.
11. G. E. Norris, B. F. Anderson, and E. N. Baker, J. Am. Chem. Soc. 108 (1986), 2784-2785.12. E. W. Ainscough et al., Biochemistry 26 (1987), 71-82.13. W. Lovenberg, ed., Iron-Sulfur Proteins, Academic Press, 1973-1977,3 vo1s.14. T. G. Spiro, ed., Iron-Sulfur Proteins, Wiley, 1982.15. K. Fukuyama et al., Nature 286 (1980),522-524.16. J. Rawlings, O. Siiman, and H. B. Gray, Proc. Natl. Acad. Sci. USA 71 (1974), 125-127.17. C. W. Carter et al., Proc. Nat!. Acad. Sci. USA 69 (1972),3526-3529.18. G. R. Moore, G. W. Pettigrew, and N. K. Rogers, Proc. Natl. Acad. Sci. USA 83 (1986), 4998-4999.19. T. E. Meyer and M. D. Kamen, Adv. Protein Chem. 35 (1982), 105-212.20. G. R. Moore and G. W. Pettigrew, Cytochromes c, Springer-Verlag, 1984.21. R. E. Dickerson, Sci. Amer. 242 (1980),137-153.22. F. S. Mathews, Prog. Biophys. Mol. Bioi. 45 (1985), 1-56.23. R. P. Ambler, in A. B. Robinson and N. D. Kaplan, eds., From Cyclotrons to Cytochromes, Academic
Press, 1980, pp. 263-279.24. K. Kimura et al., 1. Chem. Phys. 70 (1979),3317-3323.25. D. Keilin, Proc. Roy. Soc. (London) 898 (1925), 312-339.26. Y. Hatefi, Annu. Rev. Biochem. 54 (1985), 1015-1069.27. B. P. S. N. Dixit and J. M. Vanderkooi, Curro Top. Bioenergetics 13 (1984), 159-202.28. C. W. Jones, Biological Energy Conservation, Chapman and Hall, 2d ed., 1981.29. C. R. Hackenbrock, Trends Biochem. Sci. 6 (1981), 151-154.30. S. Gupte et al., Proc. Natl. Acad. Sci. USA 81 (1984), 2606-2610.31. R. K. Clayton, Photosynthesis: Physical Mechanisms and Chemical Patterns, Cambridge Univ. Press,
1980.32. F. K. Fong, ed., Light Reaction Path (if Photosynthesis, Springer-Verlag, 1982.33. R. K. Clayton and W. R. Sistrom, eds., The Photosynthetic Bacteria, Plenum, 1978.34. Photosynthesis, Vol. I: Energy Conversion by Plants and Bacteria, Academic Press, 1982.35. B. W. Matthews and R. E. Fenna, Ace. Chem. Res. 13 (1980), 309-317.36. J. Deisenhofer et al., J. Mol. Bioi. 180 (1984),385-398.37. R. Hille and V. Massey, in T. G. Spiro, ed., Molybdenum Enzymes, Wiley, 1985, pp. 443-518.38. R. Hille, W. R. Hagen, and W. R. Dunham, 1. Bioi. Chem. 260 (1985), 10569-10575.39. A. Bhattacharyya et al., Biochemistry 22 (1983), 5270-5279.40. J. Stubbe, Adv. Enzymology 63 (1990), 349--419.41. P. Nordlund, B.-M. Sjoberg, and H. Eklund, Nature 345 (1990),593-598.42. R. E. White and M. J. Coon, Annu. Rev. Biochem. 49 (1980), 315-356.43. S. G. Sligar and R. 1. Murray, in P. R. Ortiz de Montellano, ed., Cytochrome P-450: Structure,
Mechanism, and Biochemistry, Plenum, 1986, pp. 429-503.44. C. B. Brewer and J. A. Peterson, J. Bioi. Chem. 263 (1988), 791-798.45. F. A. Annstrong, H. A. O. Hill, and N. J. Walton, Quart. Rev. Biophys. 18 (1986), 261-322.46. G. D. Hitchens, Trends Biochem. Sci. 14 (1989), 152-155.47. F. A. Annstrong, Structure and Bonding 72 (1989), 137-221; A. Heller, J. Phys. Chem. 96 (1992),
3579-3587.48. H. A. O. Hill et al., 1. Chem. Soc. Chem. Commun. (1985), 1469-1471.49. H. Taube, Angew. Chem. Int. Ed. Engl. 23 (1984), 329-334.50. R. D. Cannon, Electron-Transfer Reactions, Butterworths, 1980.
V.REFERENCES 361
51. Prog. Inorg. Chem. 30 (1983).52. S. L. Mayo et al., Science 233 (1986), 948-952.53. A. G. Sykes, Chem. Brit. 24 (1988),551-554.54. M. Faraggi, M. R. De Felippis, and M. H. Klapper, 1. Am. Chem. Soc. 111 (1989), 5141-5145.55. G. McLendon, Acc. Chem. Res. 21 (1988), 160-167.56. O. Farver and I. Pecht, Proc. Natl. Acad. Sci. USA 86 (1989),6968-6972.57. S. E. Peterson-Kennedy et al., Coord. Chem. Rev. 64 (1985), 125-133.58. D. E. Richardson, Comments Inorg. Chem. 3 (1985),367-384.59. S. Dahlin, B. Reinhammar, and M. T. Wilson, Biochem. J. 218 (1984),609-614.60. R. A. Marcus, Annu. Rev. Phys. Chem. 15 (1964), 155-196.61. W. L. Reynolds and R. W. Lumry, Mechanisms of Electron Transfer, Ronald Press, 1966.62. J. Ulstrup, Charge Transfer Process in Condensed Media, Springer-Verlag, 1979.63. N. Sutin, Acc. Chem. Res. 15 (1982), 275-282.64. M. D. Newton and N. Sutin, Annu. Rev. Phys. Chem. 35 (1984), 437-480.65. P. Bertrand, Biochimie 68 (1986),619-628.66. J. V. McArdle et al., J. Am. Chem. Soc. 99 (1977),2483-2489.67. S. Wherland et al., 1. Am. Chem. Soc. 97 (1975),5260-5262.68. A. G. Mauk, R. A. Scott, and H. B. Gray, 1. Am. Chem. Soc. 102 (1980), 4360-4363.69. S. Wherland and I. Pecht, Biochemistry 17 (1978), 2585-2591.70. B. S. Brunschwig and N. Sutin, Comments Inorg. Chem. 6 (1987),209-235.71. N. Sutin, in J. J. Zuckerman, ed., Inorganic Reactions and Methods, VCH Publishers, 1986, XV, 23-
24.72. R. A. Marcus and N. Sutin, Biochim. Biophys. Acta 811 (1985), 265-322.73. J. R. Winkler and H. B. Gray, Chem. Rev. 92 (1992), 369-379.74. H. B. Gray and J. R. Winkler, Pure Appl. Chem. 64 (1992), 1257-1262.75. J. Jortner and M. Bixon, 1. Chem. Phys. 88 (1988), 167-170.76. J. J. Hopfield, Proc. Natl. Acad. Sci. USA 71 (1974), 3640-3644.77. G. L. Closs and J. R. Miller, Science 240 (1988), 440-447.78. H. Oevering et al., J. Am. Chem. Soc. 109 (1987), 3258-3269.79. C. C. Moser et al., Nature 355 (1992), 796-802.80. C. C. Moser and P. L. Dutton, Biochim. Biophys. Acta 1101 (1992), 171-176.81. H. E. M. Christensen et al., Inorg. Chem. 29 (1990),2808-2816.82. M. A. Ratner, J. Phys. Chem. 94 (1990), 4877-4883.83. S. Larsson, Chem. Scripta 28A (1988), 15-20.84. D. N. Beratan and J. N. Onuchic, Photosynthesis Res. 22 (1989), 173-186.85. D. N. Beratan et al., J. Am. Chem. Soc. 112 (1990), 7915-7921.86. J. N. Onuchic et al., Annu. Rev. Biophys. Biomol. Struct. 21 (1992), 349-377.87. A. G. Sykes, Chem. Soc. Rev. 14 (1985),283-315.88. H. C. Freeman, in J. L. Laurent, ed., Coordination Chemistry-21, Pergamon Press, 1981, pp. 29-51.89. D. Boulter et al., in D. H. Northcote, ed., Plant Biochemistry, Univ. Park Press, 1977, n, 1-40.90. J. M. Guss et al., J. Mol. Bioi. 192 (1986), 361-387.91. J. McGinnis et al., Inorg. Chem. 27 (1988),2306-2312.92. O. Farver and I. Pecht, Proc. Natl. Acad. Sci. USA 78 (1981), 4190-4193.93. O. Farver, Y. Shahak, and I. Pecht, Biochemistry 21 (1982), 1885-1890.94. B. S. Brunschwig et al., Inorg. Chem. 24 (1985), 3743-3749.95. S. K. Chapman et al., in M. Chisholm, ed., Inorganic Chemistry: Toward the Twenty-first Century,
American Chemical Society, 1983, pp. 177-197.96. H. B. Gray, Chem. Soc. Rev. 15 (1986), 17-30.97. D. W. Conrad and R. A. Scott, J. Am. Chem. Soc. 111 (1989), 3461-3463.98. L. P. Pan et al., Biochemistry 27 (1988),7180-7184.99. C. M. Lieber, J. L. Karas, and H. B. Gray, 1. Am. Chem. Soc. 109 (1987),3778-3779.
100. J. L. Karas, C. M. Lieber, and H. B. Gray, J. Am. Chem. Soc. 110 (1988),599-600.101. J. A. Cowan et al., Ann. N.Y. Acad. Sci. 550 (1988), 68-84.102. T. Takano, J. Mol. Bioi. no (1977), 537-568 and 559-584.103. K. Tsukahara, J. Am. Chem. Soc. 111 (1989), 2040-2044.104. E. T. Kaiser and D. S. Lawrence, Science 226 (1984), 505-511.105. R. E. Offord, Protein Eng. 1 (1987), 151-157.106. E. T. Kaiser, Angew. Chem. Int. Ed. Engl. 27 (1988), 913-922.
362 6 I ELECTRON TRANSFER
107. T. Kokubo, S. Sassa, and E. T. Kaiser, J. Am. Chem. Soc. 109 (1987),606-607; J. Kuriyan et al., J.Am. Chem. Soc. 110 (1988),6261-6263.
108. C. Chothia and J. Janin, Nature 256 (1975), 705-708.109. A. G. Amit et al., Science 233 (1986),747-753.110. H. M. Geysen et al., Science 235 (1987), 1184-1190.111. F. R. Salemme, J. Mol. Bioi. 102 (1976),563-568.112. J. J. Wendoloski et al., Science 238 (1987), 794-797.113. G. L. McLendon et al., J. Am. Chem. Soc. 107 (1985),739-740.114. M. R. Mauk, L. S. Reid, and A. G. Mauk, Biochemistry 21 (1982),1843-1846.115. J. A. Komb1att et al., 1. Am. Chem. Soc. 110 (1988),5909-5911.116. S. Ng et al., Biochemistry 16 (1977),4975-4978.117. M. R. Mauk et al., Biochemistry 25 (1986),7085-7091.118. P. W. Holloway and H. H. Mantsch, Biochemistry 27 (1988), 7991-7993.119. A. M. Burch et al., Science 247 (1990),831-833; K. K. Rodgers and S. G. Sligar, J. Mol. Bioi. 221
(1991), 1453-1460.120. J. Stonehuemer, J. B. Williams, and F. Millett, Biochemistry 18 (1979), 5422-5427; L. D. Eltis et al.,
Biochemistry 30 (1991), 3663-3674.121. K. T. Conklin and G. McLendon, Inorg. Chem. 25 (1986), 4806-4807.122. N. Liang et al., Science 240 (1988) 311-313.123. J. L. McGourty et al., Biochemistry 26 (1987),8302-8312.124. S. E. Peterson-Kennedy et al., 1. Am. Chem. Soc. 108 (1986), 1739-1746.125. D. J. Gingrich et al., J. Am. Chem. Soc. 109 (1987),7533-7534.126. J. Jortner, J. Chem. Phys. 64 (1976), 4860-4867.127. P. Siders and R. A. Marcus, J. Am. Chem. Soc. 103 (1981), 741-747.128. F. R. Salemme, Annu. Rev. Biochem. 46 (1977), 299-329.129. S. Ferguson-Miller, D. L. Brautigan, and E. Margoliash, in D. Dolphin, ed., The Porphyrins, Academic
Press, 1979, VII, 149-240.130. R. Timkovich, in Reference 129, pp. 241-294.131. G. Williams, G. R. Moore, and R. J. P. Williams, Comments Inorg. Chem. 4 (1985), 55-98.132. G. R. Moore, C. G. S. Eley, and G. Williams, Adv. Inorg. and Bioinorg. Mech. 3 (1984), 1-96.133. E. Margoliash and H. R. Bosshard, Trends Biochem. Sci. 8 (1983), 316-320.134. T. Takano and R. E. Dickerson, J. Mol. Bioi. 153 (1981),79-94 and 95-115.135. G. Williams et al., J. Mol. Bioi. 183 (1985), 447-460.136. Y. Feng, H. Roder, and S. W. Englander, Biochemistry 29 (1990), 3494-3504.137. Y. Feng and S. W. Englander, Biochemistry 29 (1990),3505-3509.138. F. K. Rodkey and E. G. Ball, 1. Bioi. Chem. 182 (1950), 17-20.139. J. B. Wooten et al., Biochemistry 20 (1981),5394-5402.140. G. R. Moore and R. J. P. Williams, Eur. 1. Biochem. 103 (1980),513-521.141. 1. Pecht and M. Faraggi, Proc. Natl. Acad. Sci. USA 69 (1972), 902-906.142. R. J. Kassner, Proc. Natl. Acad. Sci. USA 69 (1972),2263-2267.143. A. K. Churg and A. Warshel, Biochemistry 25 (1986),1675-1681.144. A. L. Raphael and H. B. Gray, Proteins 6 (1989),338-340.145. C. J. A. Wallace et al., 1. Bioi. Chem. 264 (1989),15199-15209.146. H. A. Harbury et al., Proc. Natl. Acad. Sci. USA 54 (1965), 1658-1664.147. T. N. Sorrell, P. K. Martin, and E. F. Bowden, J. Am. Chem. Soc. 111 (1989), 766-767.148. R. L. Cutler et al., Biochemistry 28 (1989), 3188-3197.149. A. L. Raphael and H. B. Gray, 1. Am. Chem. Soc. 113 (1991), 1038-1040.150. J. Butler et al., 1. Am. Chem. Soc. 103 (1981), 469-471.151. G. D. Armstrong et al., Biochemistry 25 (1986), 6947-6951.152. W. H. Koppenol and E. Margoliash, 1. Bioi. Chem. 257 (1982), 4426-4437.153. P. Nicholls, Biochim. Biophys. Acta 346 (1974), 261-310.154. P. C. Weber and G. Tollin, 1. Bioi. Chem. 260 (1985), 5568-5573.155. (a) T. L. Poulos and J. Kraut, J. Bioi. Chem. 255 (1980), 10322-10330; (b) H. Pelletier and J. Kraut,
Science 258 (1992),1748-1755; D. N. Beratan et al., Science 258 (1992),1740-1741.156. S. H. Northrup et al., J. Am. Chem. Soc. 108 (1986), 8162-8170.157. B. W. Konig et al., FEBS Lett. 111 (1980), 395-398.158. K. S. Schmitz and J. M. Schurr, J. Phys. Chem. 76 (1972),534-545.159. B. Michel et al., Biochemistry 28 (1989), 456-462.
V. REFERENCES 363
160. A. K. Churg et at., 1. Phys. Chem. 87 (1983), 1683-1694.161. I.-J. Chang, H. B. Gray, and J. R. Winkler, J. Am. Chem. Soc. 113 (1991),7056-7057.162. D. S. Wuttke et al., Science 256 (1992),1007-1009.163. D. S. Wuttke et aI., Biochim, Biophys. Acta 1101 (1992),168-170.164. A. Kuki, Structure and Bonding 75 (1991), 49-83.165. P. Siddarth and R. A. Marcus, 1. Phys. Chem. 94 (1990), 8430-8434; 96 (1992),3213-3217.166. A. Brao and S. Larsson, 1. Phys. Chem. 95 (1991), 4925-4928.167. C. Liang and M. D. Newton, 1. Phys. Chem. 96 (1992),2855-2866.168. H. Sigel and A. Sigel, eds., Metal/ons in Biological Systems, Dekker, 1991, voL 27.169. D. N. Beratan, J. N. Betts, and J. N. Onuchic, 1. Phys. Chem. 96 (1992), 2852-2855; Science 252
(1991), 1285-1288.170. J. N. Betts, D. N. Beratan, and J. N. Onuchic, 1. Am. Chem. Soc. 114 (1992), 4043-4046.171. J. R. Norris and M. Schiffer, Chem. Eng. News 68 (July 30, 1990),22-35.172. G. Feher et at., Nature 339 (1989), 111-116.173. J. Deisenhofer and H. Michel, Annu. Rev. Biophys. Biophys. Chem 20 (1991),247-266.174. S. Kartha, R. Das, and J. R. Norris, Metal/ons Bioi. Syst. 27 (1991),323-359.175. M. R. Wasielewski, Metal/ons BioI. Syst. 27 (1991), 361-430.176. S. G. Boxer, Annu. Rev. Biophys. Biophys. Chem. 19 (1990), 267-299.177. J. P. Allen et al., Proc. Natl. Acad. Sci. USA 84 (1987),5730-5734 and 6162-6166.178. T. O. Yeates et al., Proc. Natl. Acad. Sci. USA 84 (1987), 6438-6442.179. R. J. Debus, G. Feher, and M. Y. Okamura, Biochemistry 25 (1986), 2276-2287.180. S. G. Boxer et aI., 1. Phys. Chem. 93 (1989),8280-8294.181. C.-K. Chan et al., Proc. Natl. Acad. Sci. USA 88 (1991), 11202-11206.182. M. Nonella and K. Schulten, 1. Phys. Chem. 95 (1991),2059-2067.183. K. Schulten and M. Tesch, Chem. Phys. 158 (1991), 421-446.184. The authors thank Deborah Wuttke for invaluable assistance with the preparation of the final draft of
the manuscript and for many helpful discussions. We acknowledge the National Science Foundation,the National Institutes of Health, and the Arnold and Mabel Beckman Foundation for support of ourwork on biological electron-transfer reactions.