May 12, 2009 Electronic Filing Ms. Marlene H. Dortch, Secretary Federal Communications Commission 445 12th Street, SW 12th Street Lobby, TW-A325 Washington, D.C. 20554 Re: Written Ex Parte Communication, RM-11361; GN Docket No. 09-51; WC Docket No. 07-52 Dear Ms. Dortch: Former Vice President Al Gore has said that the United States has “the most competitive wireless industry of any nation in the world” with less consolidation and more competition, and that “because of competition, we are seeing a continued pulse of investment to expand the capacity of broadband networks.” In this ex parte, CTIA presents numerous facts that detail for the Commission the unparalleled value that U.S. consumers enjoy, driven by the competition and innovation in the industry. The facts show that the United States has the lowest cost per minute, the highest minutes of use, and the lowest HHI of the 26 Organisation for Economic Co-operation and Development (“OECD”) countries measured by an independent third party. Additionally, the ex parte details the expansion of broadband services to wireless consumers, including access to 40,000 different wireless applications (soon to increase to over 60,000 applications). Specifically, the first section on “Value” compares the cost, reflected in revenue per minute, that U.S. customers pay as compared to the 25 other OECD countries. It also compares minutes of use. In both categories, the United States is ranked first. In fact, in terms of per minute cost, the United States is 60% lower than the average of the other 25 countries. In terms of minute of use, the United States wireless consumer not only uses more minutes than consumers in the 25 other OECD countries, but actually uses more than twice as many minutes than 24 of the 25 countries. The second section tracks the competitive state of the U.S. as compared to the same 25 other OECD countries. The statistics show that the U.S is the least concentrated and most competitive market of the 26 countries reviewed. It is one of only three countries with more than four providers. The charts also show that the U.S. has the lowest Herfindahl-Hirschman Index (“HHI”). The third section provides information on the stunning innovation in the industry. In the last year, at least six application stores have launched, with over 40,000 apps made available to consumers. There are over 630 handsets sold in the United States, manufactured by 33 companies. We expect this innovation to continue to accelerate, as the networks evolve to support new handsets and applications (and vice versa), and as the number of wireless-related patents continues to grow as they have uninterrupted over the last 10 years. American consumers would be harmed considerably if the United States moved away from the vibrant, competitive model that has made it such a success and toward the regulatory model embraced by European markets. The end result of this competition and innovation is that Americans derive far
Transcript
May 12, 2009
Electronic Filing Ms. Marlene H. Dortch, Secretary Federal Communications Commission 445 12th Street, SW 12th Street Lobby, TW-A325 Washington, D.C. 20554
Re: Written Ex Parte Communication, RM-11361; GN Docket No. 09-51; WC Docket No. 07-52
Dear Ms. Dortch: Former Vice President Al Gore has said that the United States has “the most competitive
wireless industry of any nation in the world” with less consolidation and more competition, and that “because of competition, we are seeing a continued pulse of investment to expand the capacity of broadband networks.” In this ex parte, CTIA presents numerous facts that detail for the Commission the unparalleled value that U.S. consumers enjoy, driven by the competition and innovation in the industry. The facts show that the United States has the lowest cost per minute, the highest minutes of use, and the lowest HHI of the 26 Organisation for Economic Co-operation and Development (“OECD”) countries measured by an independent third party. Additionally, the ex parte details the expansion of broadband services to wireless consumers, including access to 40,000 different wireless applications (soon to increase to over 60,000 applications).
Specifically, the first section on “Value” compares the cost, reflected in revenue per minute, that
U.S. customers pay as compared to the 25 other OECD countries. It also compares minutes of use. In both categories, the United States is ranked first. In fact, in terms of per minute cost, the United States is 60% lower than the average of the other 25 countries. In terms of minute of use, the United States wireless consumer not only uses more minutes than consumers in the 25 other OECD countries, but actually uses more than twice as many minutes than 24 of the 25 countries.
The second section tracks the competitive state of the U.S. as compared to the same 25 other
OECD countries. The statistics show that the U.S is the least concentrated and most competitive market of the 26 countries reviewed. It is one of only three countries with more than four providers. The charts also show that the U.S. has the lowest Herfindahl-Hirschman Index (“HHI”).
The third section provides information on the stunning innovation in the industry. In the last
year, at least six application stores have launched, with over 40,000 apps made available to consumers. There are over 630 handsets sold in the United States, manufactured by 33 companies. We expect this innovation to continue to accelerate, as the networks evolve to support new handsets and applications (and vice versa), and as the number of wireless-related patents continues to grow as they have uninterrupted over the last 10 years.
American consumers would be harmed considerably if the United States moved away from the
vibrant, competitive model that has made it such a success and toward the regulatory model embraced by European markets. The end result of this competition and innovation is that Americans derive far
2
more benefit for far fewer of their telecommunications dollars. Some of the specific facts from the filing include:
• The price per minute of service in the United States is the lowest of the 26 OECD countries
tracked by Merrill Lynch. • Consumers in the United States have the highest minutes of use per month of the 26 OECD
countries tracked by Merrill Lynch. • The United States has the lowest HHI of the 26 OECD countries tracked by Merrill Lynch. • In the United States, the top four carriers represent 86% of the market, making it the most
competitive market of the 26 OECD countries reviewed. The top four U.S. carriers represent 86% of the market. In 23 of the 26 OECD countries the top four carriers have 100% of the market. In 13 of the 26 OECD countries the top three carriers have 100% of the market.
• At least 33 companies manufacture wireless devices for the U.S. market. • Over 630 different handset are sold in the United States. • Consumers have access to over 40,000 applications sold through four newly created app stores –
with three more stores and more than 20,000 additional applications planned to launch this year. • U.S. consumers enjoy access to 29 different Wi-Fi enabled handsets. • Since 2005, mobile wireless providers have been the fastest-growing providers of both
high-speed lines (over 200 kbps in at least one direction) and advanced service lines (over 200 kbps in both directions). Subscriber counts for high-speed lines more than doubled and advanced service lines more
than tripled in the last year that the FCC measured – 2007. The United States has a higher percentage of consumers actively using mobile Internet
capabilities than any country measured by Nielsen. If you have any questions, please do not hesitate to contact me. Sincerely,
/s/ Christopher Guttman-McCabe Christopher Guttman-McCabe Vice President, Regulatory Affairs CTIA – The Wireless Association®
THE UNITED STATES AND WORLD WIRELESS MARKETS:
Competition and Innovation are Driving Wireless Value in the U.S.
May 2009
2
VALUE
3
As CTIA has detailed for the Commission before, American consumers enjoy unparalleled value when compared to our foreign counterparts. As the following charts details, the low price per minute and high minutes of use result in a value calculation that is unmatched around the world.
• The United States has the lowest revenue per minute of all 26 OECD countries tracked by Merrill Lynch, it is 60 % lower than the average of the other 25.
Comparative Revenue Per Minute in 26 OECD Countries, 4Q08
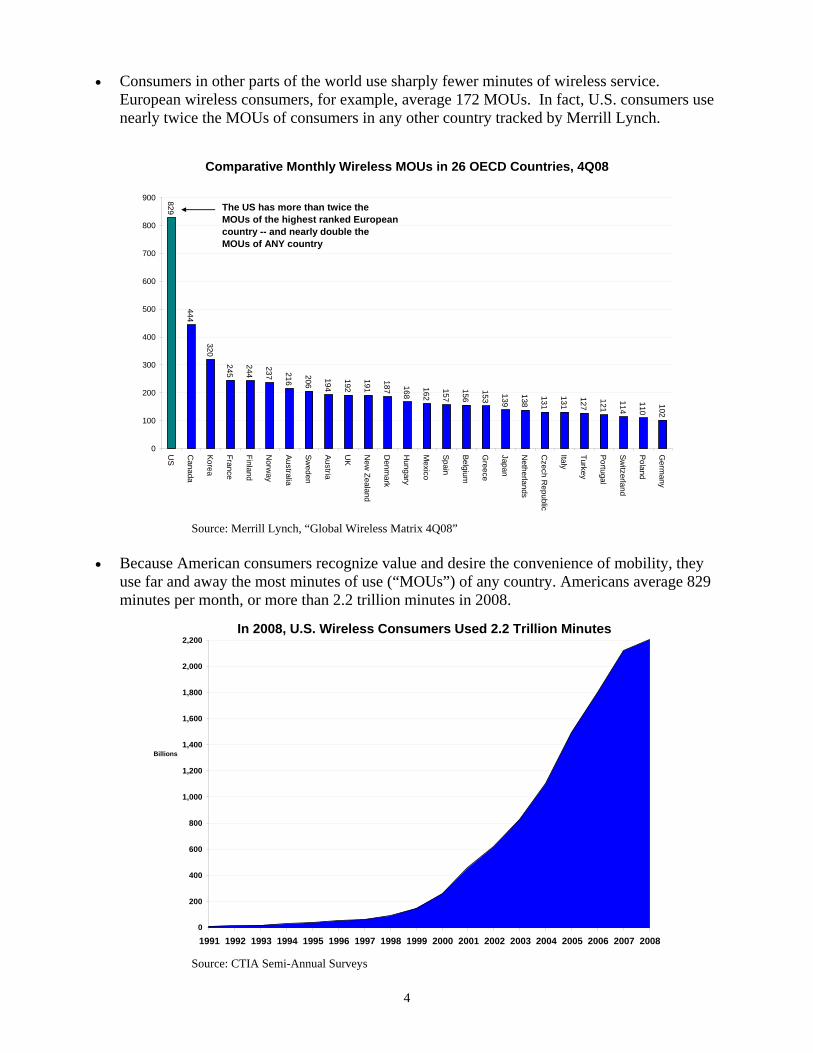
• Consumers in other parts of the world use sharply fewer minutes of wireless service. European wireless consumers, for example, average 172 MOUs. In fact, U.S. consumers use nearly twice the MOUs of consumers in any other country tracked by Merrill Lynch.
Comparative Monthly Wireless MOUs in 26 OECD Countries, 4Q08
444
320
245
244
237 216
206
194
192
191
187 168
162
157
156
153 139
138
131
131
127
121
114
110
102
829
0
100
200
300
400
500
600
700
800
900
US
Canada
Korea
France
Finland
Norw
ay
Australia
Sweden
Austria
UK
New
Zealand
Denm
ark
Hungary
Mexico
Spain
Belgium
Greece
Japan
Netherlands
Czech R
epublic
Italy
Turkey
Portugal
Switzerland
Poland
Germ
any
The US has more than twice the MOUs of the highest ranked European country -- and nearly double the MOUs of ANY country
In 2008, U.S. Wireless Consumers Used 2.2 Trillion Minutes
5
COMPETITION
6
Not long ago, the U.S. wireless industry was denounced as an oligopoly, while praising the competitiveness of the European wireless market.1 As CTIA has demonstrated for the Commission before, this description of the state of the U.S. market as compared to the world market for wireless couldn’t be further from the truth. The reality is that American consumers have more choices than consumers in nearly every developed country in the world. A review of Merrill Lynch’s Global Wireless Matrix 4Q08 reveals the truth – American consumers have the kind of choices and value that consumers around the world strive for. • Merrill Lynch data on the majority of the countries that make up the OECD show that the
U.S. has the most competitive wireless market.
Wireless Mobile Competition in OECD Countries, 4Q08 Mobile Operator Market Share by Subscribership (%)
Number of Operators 1 2 3 4 Others Australia 40.7 32.6 18 8.7 Austria 42.6 32.2 19.5 5.8 Belgium 44.7 30.9 24.4 Canada 36.8 30.6 28.4 2 2.2 Czech Republic 39.9 38.7 21.3 Denmark 46.2 26.5 21.8 5.6 Finland 39.5 37.5 23.1 France 47.1 36.2 16.7 Germany 36.5 33.7 16.6 13.2 Greece 41.2 30.9 27.9 Hungary 43.9 35.1 21.9 Italy 38.5 33.2 18.7 9.7 Japan 49.6 28 18.3 4.2 Korea 50.5 31.5 18 Mexico 72.3 19.7 4.5 3.5 Netherlands 49.8 27 23.1 New Zealand 52.7 47.3 Norway 55.4 44.6 Poland 32.9 32.3 30.2 4.6 Portugal 44.2 35.5 20.3 Spain 45.0 31.5 21.7 1.8 Sweden 46.6 29.3 16.6 7.4 Switzerland 61.9 20.4 17.8 Turkey 55.7 25.2 19.1 United Kingdom 25.5 25.1 22 20.9 6.5 United States 28.5 26.7 18.2 12.1 14.5 * The figure for the third U.S. carrier was increased to account for their wholly‐owned MVNO subsidiary.
1 Statement of Tim Wu, Professor, Columbia Law School, Before the U.S. House of Representatives Subcommittee on Telecommunications and the Internet, Committee on Energy and Commerce, at 3, 110th Cong. (July 11, 2007).
7
• Using the Herfindahl-Hischman Index (“HHI”), a commonly accepted measure of market concentration, the HHI of the United States is the lowest of the OECD markets tracked by Merrill Lynch.
Wireless Mobile Competition in OECD Countries, 4Q08
HHI Values Operators 1 2 3 4 Others HHI Sum Australia 1,656.49 1,062.76 324.00 75.69 0.00 3,118.94 Austria 1,814.76 1,036.84 380.25 33.64 0.00 3,265.49 Belgium 1,998.09 954.81 595.36 0.00 0.00 3,548.26 Canada 1,354.24 936.36 806.56 4.00 4.84 3,106.00 Czech Republic 1,592.01 1,497.69 453.69 0.00 0.00 3,543.39 Denmark 2,134.44 702.25 475.24 31.36 0.00 3,343.29 Finland 1,560.25 1,406.25 533.61 0.00 0.00 3,500.11 France 2,218.41 1,310.44 278.89 0.00 0.00 3,807.74 Germany 1,332.25 1,135.69 275.56 174.24 0.00 2,917.74 Greece 1,697.44 954.81 778.41 0.00 0.00 3,430.66 Hungary 1,927.21 1,232.01 479.61 0.00 0.00 3,638.83 Italy 1,482.25 1,102.24 349.69 94.09 0.00 3,028.27 Japan 2,460.16 784.00 334.89 17.64 0.00 3,596.69 Korea 2,550.25 992.25 324.00 0.00 0.00 3,866.50 Mexico 5,227.29 388.09 20.25 12.25 0.00 5,647.88 Netherlands 2,480.04 729.00 533.61 0.00 0.00 3,742.65 New Zealand 2,777.29 2,237.29 0.00 0.00 0.00 5,014.58 Norway 3,069.16 1,989.16 0.00 0.00 0.00 5,058.32 Poland 1,082.41 1,043.29 912.04 21.16 0.00 3,058.90 Portugal 1,953.64 1,260.25 412.09 0.00 0.00 3,625.98 Spain 2,025.00 992.25 470.89 3.24 0.00 3,491.38 Sweden 2,171.56 858.49 275.56 54.76 0.00 3,360.37 Switzerland 3,831.61 416.16 316.84 0.00 0.00 4,564.61 Turkey 3,102.49 635.04 364.81 0.00 0.00 4,102.34 United Kingdom 650.25 630.01 484.00 436.81 42.25 2,243.32 United States* 812.25 712.89 331.24 146.41 210.25 2,213.04 Note that this calculation actually overstates the YE2008 HHI for the US, as it counts all "others" as a single operator with a 14.5% market share, instead of as 145 separate operators, with market shares ranging from 5% to less than 0.001%. Also note that when the United State numbers are adjusted to account for the Verizon Wireless – Alltel transaction (which took place in 1Q09) the overstated U.S. HHI still rises to only 2280. Source: Merrill Lynch, “Global Wireless Matrix 4Q08”
8
Additionally, even when the analysis is confined to the two largest carriers in a country, the United States is still one of the most competitive markets. • The combined market share of the top two U.S. carriers is less than that of the top two
providers in all but one of the 26 OECD countries tracked by Merrill Lynch (the U.K is the other country).
The top four U.S. carriers represent 86% of the market. In 23 of the 26 OECD countries the top four carriers have 100% of the market. In 13 of the 26 OECD countries the top three carriers have 100% of the
market.
Top Two Providers' Combined Market Share for 26 OECD Countries, 4Q08
CTIA’s own research on the mobile wireless markets in the top ten OECD countries by GDP confirm what Merrill Lynch and others’ reports detail, that U.S. wireless companies provide consumers with more service for their telecommunications dollar, while maintaining the most spectrally efficient networks in the world.
92.0%82.0%76.5%67.4%71.7%78.1%50.6%70.2%77.6%55.2%Top Two Carriers Percentage of the
*Figure includes AWS-1, 700 MHz spectrum not yet in use and 55.5 MHz of spectrum at 2.5 GHz.
** Glen Campbell, et al., “Global Wireless Matrix 4Q08,” Merrill Lynch, April 13, 2009, at Table 1. Finally, the Commission’s own annual CMRS Competition Reports continually show that there is competition in the wireless industry.2 It is this sound regulatory and economic policy of permitting mobile wireless broadband providers to differentiate themselves that has enabled the world of innovation and innovative service offerings that have been hallmarks of the U.S. mobile wireless industry. 2 See, e.g. In re Implementation of Section 6002(b) of the Omnibus Budget Reconciliation Act of 1993, Annual Report and Analysis of Competitive Market Conditions With Respect to Commercial Mobile Services, Thirteenth Report, WT Docket No. 08-27, DA 09-54, at ¶ 1 (Jan. 16, 2009).
10
INNOVATION
11
Handset Innovation
While there is an ongoing debate about exclusive handset arrangements, this is not intended to impact that discussion. Rather, this information shows that manufacturers develop and market an extraordinarily large number of handsets in the U.S. market. American consumers enjoy a wide variety of wireless devices from which they can choose the device that best fits their wireless needs. From simple, voice-only devices to complex smartphones that more closely resemble a handheld computer than a telephone, the breadth and depth of devices manufactured and sold to American consumers far eclipses that in other developed countries. • According to our research, there are more handsets available in the United States than in any
other country in the world, and likely more than are available in any other region in the world.
o There are more than 630 different wireless handsets and devices available in the U.S. o By contrast, in the U.K., there are only 147 different handsets available to
consumers.3
HANDSET MANUFACTURERS PRODUCING/SELLING IN THE UNITED STATES Alcatel Apple ASUS Axxesstel BandRich BenQ Cal-Comp Casio Firefly HP
HTC Huawei Jitterbug Kyocera LG Motorola Nokia Novatel Wireless Option Palm Pantech & Curitel
PCD Research in Motion Samsung Sanyo Sharp Siemens Sierra Wireless Sony Ericsson Uniden Waxess USA ZTE
Part of the mobile wireless broadband experience has been the increased functionality
that smartphones and other advanced wireless devices have brought to consumers. Handsets are becoming tools of productivity and gateways to information in ways that are evolving every day. The smartphone market expanded in a major way in 2008, enabling consumers to get their hands on mobile technology that had previously only seen major penetration in the business marketplace. According to NPD Group, 23 percent of the wireless handsets sold in the U.S. in the fourth quarter of 2008 were smartphones.4 Importantly, the innovation in smartphones is being felt in the U.S. first as a result of our robust marketplace. In the last 18 months, some of the most advanced handsets have been launched in the U.S., including Apple’s iPhone 3G,5 LG’s Voyager,6 Samsung’s Instinct,7 Google’s G1,8 and four Research in Motion Blackberry devices (Blackberry Storm, Blackberry Bold, Blackberry Pearl Flip and Blackberry Curve 8900).9
3 See BT, http://www.bt.co.uk; O2, http://www.o2.co.uk; 3, http://www.3.co.uk; Virgin Mobile, http://www.virginmobile.com; Carphone Warehouse, http://www.carphonewarehouse.co.uk; Vodafone, http://www.vodafone.co.uk. Handsets of the same model with differing color schemes were not counted as unique handsets. 4 http://www.npd.com/press/releases/press_090303.html 5 Press Release, at http://www.att.com/gen/press-room?pid=4800&cdvn=news&newsarticleid=25146 6 Verizon Press Release, at http://news.vzw.com/news/2007/11/pr2007-11-19.html 7 Sprint Press Release, at http://newsreleases.sprint.com/phoenix.zhtml?c=127149&p=irol-newsArticle_newsroom&ID=1124417
12
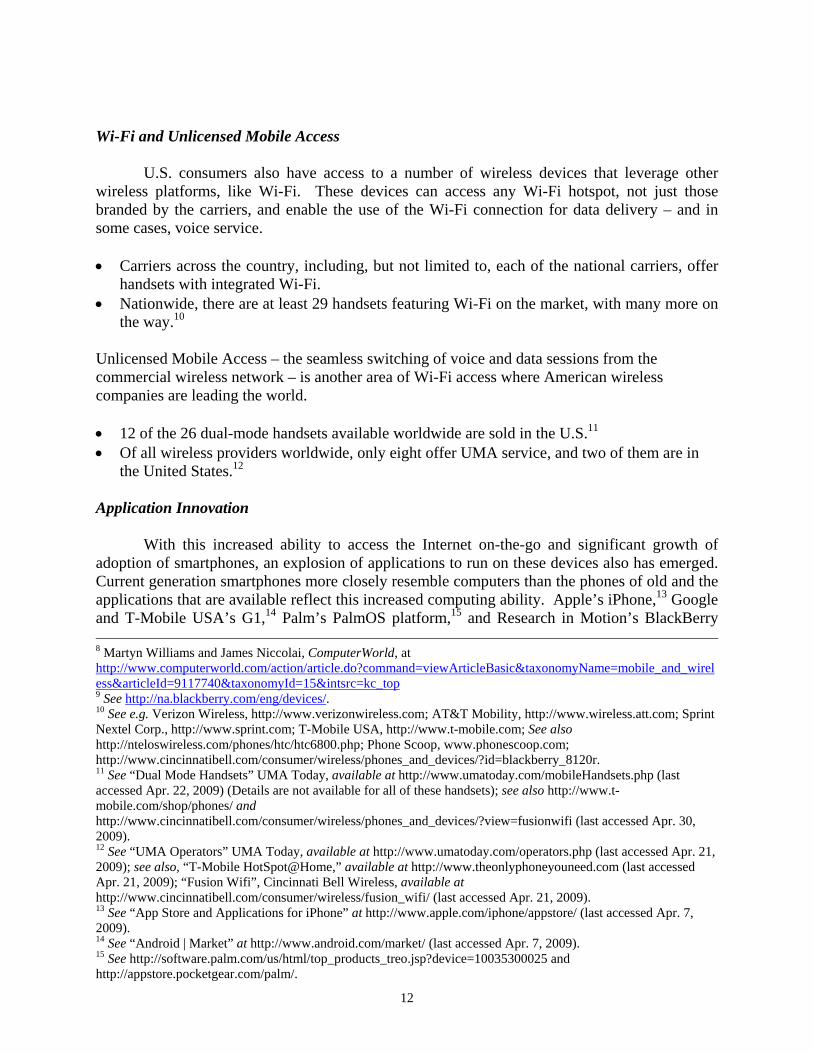
Wi-Fi and Unlicensed Mobile Access
U.S. consumers also have access to a number of wireless devices that leverage other wireless platforms, like Wi-Fi. These devices can access any Wi-Fi hotspot, not just those branded by the carriers, and enable the use of the Wi-Fi connection for data delivery – and in some cases, voice service. • Carriers across the country, including, but not limited to, each of the national carriers, offer
handsets with integrated Wi-Fi. • Nationwide, there are at least 29 handsets featuring Wi-Fi on the market, with many more on
the way.10 Unlicensed Mobile Access – the seamless switching of voice and data sessions from the commercial wireless network – is another area of Wi-Fi access where American wireless companies are leading the world. • 12 of the 26 dual-mode handsets available worldwide are sold in the U.S.11 • Of all wireless providers worldwide, only eight offer UMA service, and two of them are in
the United States.12 Application Innovation
With this increased ability to access the Internet on-the-go and significant growth of
adoption of smartphones, an explosion of applications to run on these devices also has emerged. Current generation smartphones more closely resemble computers than the phones of old and the applications that are available reflect this increased computing ability. Apple’s iPhone,13 Google and T-Mobile USA’s G1,14 Palm’s PalmOS platform,15 and Research in Motion’s BlackBerry 8 Martyn Williams and James Niccolai, ComputerWorld, at http://www.computerworld.com/action/article.do?command=viewArticleBasic&taxonomyName=mobile_and_wireless&articleId=9117740&taxonomyId=15&intsrc=kc_top 9 See http://na.blackberry.com/eng/devices/. 10 See e.g. Verizon Wireless, http://www.verizonwireless.com; AT&T Mobility, http://www.wireless.att.com; Sprint Nextel Corp., http://www.sprint.com; T-Mobile USA, http://www.t-mobile.com; See also http://nteloswireless.com/phones/htc/htc6800.php; Phone Scoop, www.phonescoop.com; http://www.cincinnatibell.com/consumer/wireless/phones_and_devices/?id=blackberry_8120r. 11 See “Dual Mode Handsets” UMA Today, available at http://www.umatoday.com/mobileHandsets.php (last accessed Apr. 22, 2009) (Details are not available for all of these handsets); see also http://www.t-mobile.com/shop/phones/ and http://www.cincinnatibell.com/consumer/wireless/phones_and_devices/?view=fusionwifi (last accessed Apr. 30, 2009). 12 See “UMA Operators” UMA Today, available at http://www.umatoday.com/operators.php (last accessed Apr. 21, 2009); see also, “T-Mobile HotSpot@Home,” available at http://www.theonlyphoneyouneed.com (last accessed Apr. 21, 2009); “Fusion Wifi”, Cincinnati Bell Wireless, available at http://www.cincinnatibell.com/consumer/wireless/fusion_wifi/ (last accessed Apr. 21, 2009). 13 See “App Store and Applications for iPhone” at http://www.apple.com/iphone/appstore/ (last accessed Apr. 7, 2009). 14 See “Android | Market” at http://www.android.com/market/ (last accessed Apr. 7, 2009). 15 See http://software.palm.com/us/html/top_products_treo.jsp?device=10035300025 and http://appstore.pocketgear.com/palm/.
13
platform16 all have online stores dedicated to providing users access to applications for their wireless devices. Palm has an application store in development for their new webOS platform17 and press reports indicate that Microsoft is planning a store for its Windows Mobile platform.18 Additionally, Nokia has announced the launch of its store.19
Like mobile wireless broadband services, generally, American consumers have embraced
the world of applications and services that are being designed for their mobile platforms. For example, in Apple’s iTunes App Store alone there are more than 35,000 applications available for download. The following chart shows the application stores that are available to U.S. consumers:
Application Store Date Launched Number of Apps Available iTunes App Store July 2008 > 35,00020 Android Market October 2008 > 1,00021 Palm Software Store January 2009 > 5,00022 BlackBerry App World April 2009 Launched with appx. 1,00023 Palm App Catalog Pending Launch of Palm
webOS
Nokia Ovi Store Launch Scheduled in July 2009
20,000 Apps and Media Files24
Windows Mobile Marketplace25
In the short time since the iTunes App Store’s launch – just nine months – more than one billion applications have been downloaded by consumers.26 Even the Skype application, the subject of a pending proceeding before the Commission27, is available on the iTunes App Store for the iPhone28 and available for download to any Windows Mobile device on the Skype website.29
These incredible innovations in applications on mobile wireless devices have brought consumers literally tens of thousands of applications for use whenever and wherever consumers want. However, as CTIA has described for the Commission before, in the absence of reasonable 16 See “App World” at http://na.blackberry.com/eng/services/appworld/? (last accessed Apr. 7, 2009). 17 See http://developer.palm.com/ 18 Trade press reports that Microsoft is planning a marketplace for Windows Mobile devices called “SkyMarket”. See http://www.fiercedeveloper.com/story/microsoft-launch-winmo-app-store-next-month/2009-01-19. 19 Elizabeth Woyke, “Nokia’s Gigantic App Store”, Forbes.com available at http://www.forbes.com/2009/05/07/nokia-ovi-store-technology-wireless-nokia.html. 20 See http://www.apple.com/iphone 21 See “Paid Apps Enter Google’s Android Market”, at http://mashable.com/2009/02/13/google-android-paid-apps/. 22 See http://software.palm.com/us/html/top_products_treo.jsp?device=10035300025 and http://appstore.pocketgear.com/palm/. 23 See “RIM Launches BlackBerry App World”, available at http://na.blackberry.com/eng/newsroom/news/press/release.jsp?id=2223. 24 See supra n. 19. 25 Trade press reports that Microsoft is planning a marketplace for Windows Mobile devices. See http://www.fiercedeveloper.com/story/microsoft-launch-winmo-app-store-next-month/2009-01-19; see also http://www.downloadsquad.com/tag/windows-marketplace-for-mobile. 26 See http://www.apple.com/itunes/billion-app-countdown/. 27 Petition to Confirm a Consumer’s Right to Use Internet Communications Software and Attach Devices to Wireless Networks, Skype Communications S.A.R.L., RM-11361 (filed Feb. 20, 2007). 28 http://www.skype.com/go/getskype-iphone. 29 “Skype 2.5 for Windows Mobile” at http://www.skype.com/download/skype/windowsmobile/ (last accessed Apr. 7, 2009).
14
network management, wireless carriers cannot ensure the high level of quality service that consumers have come to expect from wireless and that have enabled this growth in application development.30 In fact, the efficient use of the spectrum to provide quality service is consistently ranked one of the highest factors in consumer choice of wireless provider. The technological limitations of the spectrum medium demands careful management in order to provide wireless consumers a quality, fast and reliable wireless broadband experience. The U.S. mobile wireless industry continues to evolve and adapt to serve consumer needs. Network Innovation
Of course, 3G handsets cannot perform to their full potential without a strong network supporting them, and so carriers have made significant strides in bulking up the nation’s infrastructure. AT&T31 and T-Mobile32 both undertook major expansions of their 3G network in 2008. Many carriers, including Verizon Wireless,33 have already started planning for their fourth-generation networks, to bring even more speed and flexibility to American consumers in the near future. Sprint and Clearwire also formed a new company to combine their WiMAX businesses to create an open mobile broadband network.34 Additionally, CTIA’s Tier II and Tier III carriers continue to evolve their networks. For example, U.S. Cellular has announced that it continues to upgrade its CDMA network and that more than 60% of its sites will be EV-DO capable by the end of this year.35 Wireless carriers in late 2007 and 2008 have also, independently, moved to empower their consumers with additional choices by opening up their networks to compatible wireless handsets. Verizon36 and AT&T37 both opened their networks in the past year to compatible devices.
The networks are becoming more open, and the software driving wireless mobility is as well. In 2008 there was a major push towards open source software in the wireless mobile world, and carriers are embracing it as a way to provide consumers with even more flexibility from their mobile handsets. Google’s Android mobile operating system saw its first major handset release on T-Mobile’s G1,38 and Sprint also came aboard the Open Handset Alliance.39 Verizon Wireless joined an open source group, the LiMo Foundation, working on expansion of the popular open-source Linux operating system to mobile handsets.40
30 See Comments of CTIA – The Wireless Association®, WC Docket No. 07-52 (filed Feb. 13, 2008). 31 Press Release, at http://www.att.com/gen/press-room?pid=4800&cdvn=news&newsarticleid=25146 32 Press Release, at http://www.t-mobile.com/company/PressReleases_Article.aspx?assetName=Prs_Prs_20081017&title=T-Mobile%20USA%20Further%20Expands%20Commercial%203G%20Network%20Availability%20in%202008 33 Press Release, at http://news.vzw.com/news/2007/11/pr2007-11-29.html 34 Sprint Press Release, May 7, 2008 at http://newsreleases.sprint.com/phoenix.zhtml?c=127149&p=irol-newsArticle_newsroom&ID=1141088&highlight=xohm 35 “US Cellular accelerates EV-DO push, weighing LTE trial”, available at http://telephonyonline.com/wireless/news/us-cellular-evdo-upgrade-0506/. 36 Kim Hart, The Washington Post, at http://www.washingtonpost.com/wp-dyn/content/article/2007/11/27/AR2007112701077.html 37 Leslie Cauley, USA Today, at http://www.usatoday.com/tech/wireless/phones/2007-12-05-att_N.htm 38 Martyn Williams and James Niccolai, ComputerWorld, at http://www.computerworld.com/action/article.do?command=viewArticleBasic&taxonomyName=mobile_and_wireless&articleId=9117740&taxonomyId=15&intsrc=kc_top 39 Sprint Press Release, at http://newsreleases.sprint.com/phoenix.zhtml?c=127149&p=irol-newsArticle_newsroom&ID=1072575&highlight=handset 40 “Verizon joins rival of Google handset group,” by Eric Benderoff, Chicago Tribune
Me xicoS. KoreaSpainCa nadaItalyFranc eU.K.GermanyJapanUSA
*Figure includes AWS-1, 700 MHz spectrum not yet in use and 55.5 MHz of spectrum at 2 .5 GHz.
** Glen Campbell, et al., “Global Wireless Matrix 4Q08 ,” Merrill Lynch, April 13, 2009, at Table 1.
The combination of highly efficient networks and handsets have made U.S. carriers the most efficient users of spectrum worldwide – serving more consumers with less spectrum. With access to just 409 MHz of spectrum (which includes AWS and 700 MHz spectrum, some of which is not available, as well as 55 MHz of 2.5 GHz BRS spectrum), the U.S. wireless industry serves over 270 million subscribers – that’s more than 630,000 consumers per MHz of spectrum. Further, as detailed above, these 630,000 customers per MHz also use their service at a much higher rate than our foreign counterparts.
Additionally, as CTIA has described before, the concept of the “third pipe to the home” has been surpassed by technological advances and consumer expectations. Mobile wireless broadband is broadband to the person, wherever and whenever they want it. In bringing this unparalleled level of convenience to consumers, however, wireless carriers are limited by the spectrum medium over which they operate. Despite these very real limitations of spectrum-based services, consumers’ ability to access the Internet through their mobile wireless device continues to expand and improve at breathtaking speed.
In the absence of a regulatory mandate, U.S. wireless carriers continue to bring
consumers the mobile Internet services they demand. As carriers acquire increased spectrum resources – and are permitted to manage the resources for maximum efficiency – consumers benefit from the speed and services that are enabled. Over the last several years, statistics have confirmed that broadband consumers are going mobile.
• The Commission’s data shows that, since 2005, mobile wireless providers have been the
fastest-growing providers of both high-speed lines (over 200 kbps in at least one direction) and advanced service lines (over 200 kbps in both directions).
• Subscriber counts for high-speed lines more than doubled and advanced service lines more than tripled from just one year earlier.41
• As of December 2007, mobile wireless providers served more than 15 million customers with advanced service lines – nearly 20 percent of all advanced services.42
• Additionally, CTIA’s semi-annual survey has found that more than 78 percent of U.S. wireless consumers have a wireless device that is capable of accessing the Internet.43
41 HIGH-SPEED SERVICES FOR INTERNET ACCESS: STATUS AS OF DECEMBER 31, 2007, available at http://hraunfoss.fcc.gov/edocs_public/attachmatch/DOC-287962A1.pdf, at tbls.1-2. 42 Id. at tbl. 2.
16
• When the market for all data services is considered, the numbers are even more staggering. More than half of all American wireless consumers are “data users,” which includes data messaging services like SMS and MMS.44 This incredible growth in data use has been made possible by wireless carriers’ ability to carefully maintain and balance network load to ensure quality of service.
Worldwide, the wireless broadband comparisons are equally impressive. American
wireless consumers are among the most prolific mobile Internet users worldwide.
• According to a Nielsen Media study, the United States has a higher percentage of consumers actively using mobile Internet capabilities – 15 percent – than any country measured in the survey.45
• Put in terms of total number of users, 15 percent of wireless subscribers equals 40 million American consumers who are “active users” of mobile web service – 75 percent more than just two years earlier.46
Additionally, while much has been made of reports on U.S. broadband rankings, when it
comes to mobile broadband, U.S. consumers are leading the way.
• U.S. wireless web use ranks first in the world, accounting for 29.3 percent of all mobile web surfing worldwide according to Bango, a firm that tracks statistics for surfing of web sites optimized for mobile users.47
43 CTIA’S Wireless Industry Indices, Semi-Annual Data Survey Results: A Comprehensive Report from CTIA Analyzing the U.S. Wireless Industry, Midyear 2008 Results, rel. Oct. 2008 at p.10. 44 Id. at 3. 45 “Critical Mass: The Worldwide State of the Mobile Web”, Nielsen Mobile (July 2008) at 2, 4, attached as Appendix B. 46 Id. at 2. 47 “U.S. tops worldwide charts for mobile web browsing and spending”, Bango.com available at http://news.bango.com/2009/03/12/us-tops-mobile-web-browsing-and-spending-charts/ (last accessed Apr. 29, 2009).
17
The U.S. wireless industry has a history of evolving and offering new and improved services as technology advances allow. The growth of mobile wireless broadband itself is an example of this evolution to meet consumer demand. Innovation in the mobile wireless sector occurs at all levels of service. From the core to the handset edge, network evolution in mobile wireless continues at a staggering pace. CTIA believes this trend will continue. As the chart below shows, the number of wireless-related patents has grown over the last 10 years with more than 6,500 patents filed in 2008.
Wireless-Related Patents in the US, 1988-2008 - Licensed CMRS Patents
153 300471
965
1,777
2,583
3,051
4,220
6,3026,505
90
0
1,000
2,000
3,000
4,000
5,000
6,000
7,000
1988
1990
1992
1994
1996
1998
2000
2002
2004
2006
2008
Ann
ual W
irele
ss P
aten
ts (U
.S.)
* * * CONCLUSION
The Federal Communications Commission should be proud of the environment they have created for wireless consumers in the United States. American consumers have more choices, lower costs, and better value in wireless than the 25 other countries measured. A light regulatory touch has resulted in a market that other consumers throughout the world envy, not the opposite. For United States wireless carriers large and small, the true regulator is the customer, and carriers move quickly to react to that “regulatory” pressure. The Commission should not disrupt the innovative and competitive U.S. wireless market that Vice President Gore described as “one of the great success stories in the American economy and the global economy.”
Pursuant to Section 1.1206 of the Commission’s rules, a copy of this letter is being filed via ECFS with your office. Should you have any questions, please do not hesitate to contact the undersigned. Sincerely,
/s/ Christopher Guttman-McCabe Christopher Guttman-McCabe