3CNR-IBF Via Ugo la Malfa 153, 90146, Palermo Italy
Abstract— In the last few years Electronic Noses (ENs) have been revealed to be a very effective and fast tool for monitoring the microbiological spoilage and food quality control. European regulations report the maximum concentration of mycotoxins permitted in green coffee beans. The aim of this study was to test the ability of a novel EN, equipped with an array of MOX gas sensors based on thin films as well as nanowires, to early detect mold contaminations from Aspergillus spp., in cooperation with classical microbiological and chemical techniques like Gas Chromatography coupled with Mass Spectroscopy with SPME technique. In general the selection of the green coffee is controlled by visual inspection of shape, color and size. However, this process in often not enough to prevent the entrance in the food chains of contaminated products. We have demonstrated that the novel EN is able to early detect the qualitative and quantitative differences between contaminate and uncontaminated samples. Achieved results vividly recommend the use of our EN as a quality control tool in coffee producer industry.
Keywords-component; Green coffee, Aspergillus spp.,
mycotoxins, electronic nose, GC-MS SPME.
I. INTRODUCTION
All the coffee, produced and consumed, belongs to the genus Coffea, which highlights primarily two species: C. arabica and C. canephora. Those species usually grow in the equatorial zone, where the conditions of humidity, temperature, wind, rains and altitude allow the harvest of many different varieties, each one with particular requirements. According with the provenance area, the harvesting and processing methods change depending on the zone. Most of the producers are developing countries, so the storage conditions and the methods used for harvesting and transport of green coffee depend on the production country, but anyway can be easily contaminated by mold throughout the working process (food-chain). Usually the contamination occurs due to molds belonging to the genus Aspergillus [1]. Green coffee beans are stored for months until it pass to the next step in the production chain, named roasting process. During this time, as long as the raw material is at the correct temperature and humidity, the mold is able to grow and produce mycotoxins. Mycotoxins are secondary metabolites. Those produced by
Aspergillus species are called aflatoxins, produced by A.niger and A. flavus. Ochratoxins A (OTA) are normally produced by A. ochraceus, A. carbonarius, and some strains of A. niger [2][3]. This kind of metabolites carries a big risk for consumer’s health due to the strong carcinogenic action and big toxicity for the kidneys and liver. The presence of aflatoxins and ochratoxins was discover between the early 1960’s and late 1970’s [4] [5]. A little time later European Union (EU) started a program to set the regulations of the presence of this toxics in foodstuffs. This regulation specifies the maximum allowed concentration of OTA as 5 parts per billion (ppb) in green coffee beans. It has been documented that the roasting process reduces the presence of this substances, but only in a little amount due to the thermal stability of the molecule [6][7]. The real challenge is to avoid the entrance of contaminated products in the processing chain. The selection of the raw material occurs in the early stages of the processing chain by visual inspection. The parameters that determinate the quality of green coffee beans are shape, color, and size. Frequently the raw material is already contaminated when this selection occurs, and thus the detection of the contamination became very difficult. Nowadays the EU advises to use chromatographic and fluorimetric techniques to reveal the presence of the mycotoxins in food stuffs. Unfortunately this is an back-evaluation that doesn’t prevent the presence of contaminated green coffee beans in the industry. An early identification of contaminated products will preserve the consumer health and prevent economic losses. One possible way to overcome this limitation is the use of electronic nose (EN) that in the last years has proven to be an effective, rapid and useful tool for the detection of early contamination in food matrix [8].
2013 Seventh International Conference on Sensing Technology
This instrument performs the analysis of the volatile, organic or inorganic, compounds present in the head space created in this case by different contamination in green coffee [9]. In this work we used the EN EOS835 (SACMI IMOLA scarl, Imola, Italy) equipped with a thermally controlled sensor chamber of 20 ml internal volume. We removed the original sensors and placed six new custom gas sensors instead. All sensors were Metal Oxide Semiconductor based; four of them were prepared by RGTO thin film technique, while the other two were prepared using the nanowire technology [10] described further below. The EN was provided with the auto-sampler headspace system HT200 (HTA srl, Brescia, Italy), supporting a 40 loading sites carousel and a shaking oven to equilibrate the sample headspace. During their growth, the aspergilla create a big amount of metabolites, mostly volatiles, organic or inorganic compounds. The assay made by EN, based on the analysis of the head space, is able to reveal the presence of these metabolites, making evident the difference between contaminated and uncontaminated samples and different type of contamination. The goal of this study is the setting up of a new approach for the detection of mold contamination in the early stages of the coffee production chain, based on the cooperation between innovative instruments like EN equipped with NWs gas sensors and standard techniques, like GC-MS coupled with standard microbiology.
II. MATERIALS AND METHODS
A. Preparation of Gas Sensors with Metal Oxide NWs
Nanowires of metal oxides were prepared using the technique of evaporation-condensation, which exploits the vapor phase-solid (VS) and vapor-liquid-solid (VLS) growth mechanisms. The experimental set-up for the deposition of metal oxides consisted in an alumina tubular furnace capable of reaching high temperatures (1500° C). This high temperature was required to enable the decomposition of the oxide and to promote evaporation. The temperature gradient within the furnace and the low pressure in an inert atmosphere allowed condensation and nucleation of the nanostructures[11]. The pressure, the thermal gradient and the gas flow must be strictly controlled in order to ensure the reproducibility of the samples among different depositions. During the transient to reach the evaporation temperature and to return back to room temperature, the inert gas flow was maintained in the opposite direction (from the substrate towards the dust), to prevent unwanted condensation on the substrate. The temperature of the tubular furnace for zinc oxide was maintained at 1200 ° C, and the oxide powder was placed in the center of the furnace, where the temperature was the highest. Alumina 2x2mm substrates were catalyzed with platinum prior to the introduction into the oven. The deposition parameters for the catalyst (deposited by sputtering) were: DC sputtering mode, 50W power and deposition time 2 s. Subsequently, the substrates were placed on a sample holder and inserted in a lateral zone of the furnace, where the temperature was lower (570 °C). The pressure was decreased to 1 mbar. A 100sccm flow of argon was introduced into the chamber, while a pressure controller maintained the pressure at 10mbar. The substrates were maintained at a temperature of about 570 °C for 5 minutes and then brought back to room temperature.
Figure 1: ZnO nanowires SEM picture, at 50k magnification.
Figure 1 reports FE-SEM investigation (LEO 1525) on the morphology of ZnO nanostructures. Synthesis process results in the formation of mats of thin ZnO nanowires, with average diameter between 20-40 nm[12]. A titanium-tungsten alloy was used to deposit the soldering pads on alumina substrates, via DC magnetron sputtering (70W argon plasma, 300 °C, 5.5x10⁻³ mbar). Afterwards, platinum interdigited contacts were deposited using the same sputtering technique. A platinum heater was deposited on the backside, in order to either heat the sensors or control the operation temperature of the sensing material.
Figure 2: Sketch of the conductometric device. Alumina substrate is white colored in the middle, TiW pads are in brown and platinum heater and contacts
are in metallic gray.
B. Sample preparation
Rose-Bengal Chloranphenicol Agar (Sigma-Aldrich Chemical Co., St. Louis, MO, USA) was used, as a selective medium for the enumeration of yeast and molds [13] from a wide range of different food matrix. The Chloramphenicol plays as suppressor of bacteria growth, while the Rose-Bengal act as a restrictive agent of the mold growth. In order to assist the enumeration of small colonies, the media have neutral pH. The same kind of medium was used to perform all the analysis.
2013 Seventh International Conference on Sensing Technology
For the microbiological analysis Petri dishes were prepared. Different kinds of green coffee bean were selected according with the provenance: Honduras, Indonesia and India. In the case of GC-MS-SPME and EN analysis, 5 ml of medium were placed into sterile 20 ml chromatographic vial and let it solidify. After the solidification, three green coffee beans of every different chosen typology were placed separately inside the vial, covered with an aluminum crimp and then coated with PTFE/silicone septum without crimping. The ensemble was covered with aluminum foil in order to keep vial and cap together, to maintain the inside sterility and at the same time provide the aerobic condition for the mold growth. Control dishes were achieved using the sterile vials with just 5 ml of solid Rose-Bengal Chloranphenicol Agar inside. All the samples, for microbiological analysis, CG-MS-SPME and EN were prepared the first day of the analysis, taking this day as zero-time. Once prepared, all the samples were stored and incubated under the same conditions during all the duration of analysis, namely 28ºC for a total of 7 days. During the 7 days of the experiment, analysis where done at zero-time, inoculation day, at T3 (3 days after the inoculation), at T4 (4 days after the inoculation), at T6 (6 days after the inoculation) and at T7 (7 days after the inoculation). For each day, 10 vial of every type of samples were prepared (Control, Honduras, Indonesia and India): one of each type was used for the GC-MS-SPME analysis, while the other 36 for the EN analysis. B. Microbiological analysis 1 g of every typology was taken and then mixed using vortex with a known amount of sterile physiological solution. 100µl of the dispersion have been dispersed on Petri dishes with Rose-Bengal Chloramphenicol Agar. The growth was followed during all the duration of analysis. C. Gas chromatography – mass spectrometry For each day of analysis the vials were crimped and incubated in an oven thermostatically regulated at 40ºC for 15 minutes, due to create the headspace equilibrium. In order to extract the volatile compound from the samples, a DVB/carboxen/PDMS stable flex (50/30 µm) (Supelco Co.Bellefonte, PA, USA) SPME fiber was used. To furnish the adsorption of volatile compounds, the SPME fiber was exposed to the headspace of the vials for 15 minutes at room temperature. For the desorption of the compounds, the fiber was placed in the injector of the heated GC for 6 min. The ramping of temperature in the column was performed in the following way: 60°C for 2 min to 100°C at 5 C°/min, followed by a rise from 100°C to 240°C at 5°C/min and then this temperature was kept for 5 min. Chromatographic analysis was accomplished using a HP 6890 series GC system, 5973 mass selective detector with a DB-WAX capillary column. The injection was verified in splitless mode at 240ºC using helium as gas carrier with a setting flow of 1.5 ml/min. Controls dishes were achieved using the sterile vials with just 5 ml of solid Rose-Bengal Chloramphenicol Agar inside. D. Electronic nose For each day of experiment the vials were placed in a randomized mode into the HT200 carousel. Each vial was incubated at 40°C for 10 min into the HT200 oven, shaking
them during all the incubation. The sample headspace (4 ml) was then extracted from the vial in static headspace path and injected into the carried flow (speed 4 ml min) through a properly modified gas chromatography injector (kept at 40°C to prevent any condensation). The sensor baseline was performed by using synthetic chromatographic air with a continuous flow rate of 10 ml/min and the recovery time was 28 min. The data analysis was run by means of Principal Component Analysis (PCA), operated with the Nose Pattern Editor software (SACMI Imola scarl, Imola, Italy).
III. RESULTS AND DISCUSSION A. Microbiological analysis
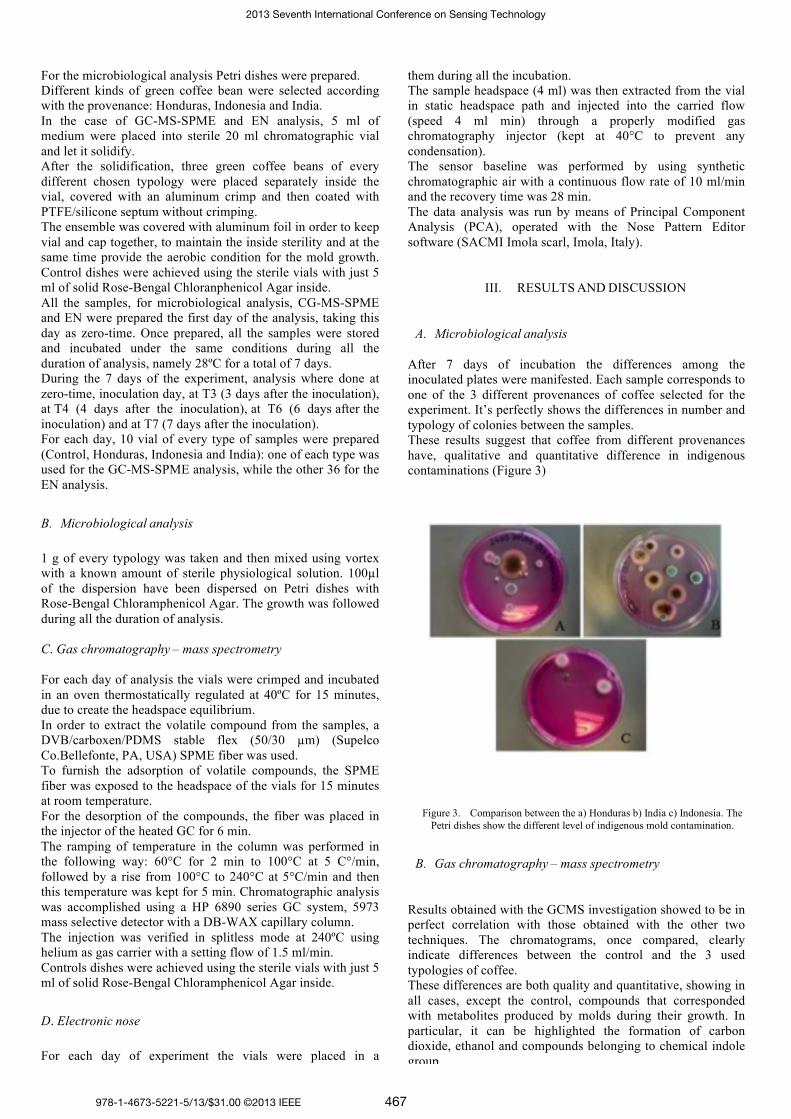
After 7 days of incubation the differences among the inoculated plates were manifested. Each sample corresponds to one of the 3 different provenances of coffee selected for the experiment. It’s perfectly shows the differences in number and typology of colonies between the samples. These results suggest that coffee from different provenances have, qualitative and quantitative difference in indigenous contaminations (Figure 3)
Figure 3. Comparison between the a) Honduras b) India c) Indonesia. The Petri dishes show the different level of indigenous mold contamination.
B. Gas chromatography – mass spectrometry Results obtained with the GCMS investigation showed to be in perfect correlation with those obtained with the other two techniques. The chromatograms, once compared, clearly indicate differences between the control and the 3 used typologies of coffee. These differences are both quality and quantitative, showing in all cases, except the control, compounds that corresponded with metabolites produced by molds during their growth. In particular, it can be highlighted the formation of carbon dioxide, ethanol and compounds belonging to chemical indole group.
2013 Seventh International Conference on Sensing Technology
C. Electronic nose In (Figure 3 and 4) are shown the data corresponding to Honduras and Indonesia typologies respectively, from the day of the sample preparation (T0) to four days later (T4). It is clearly visible a separation in the PC1 axis between the days of analysis, showing a progression of the growth of the molds, that in both case has more statistical significance. In the previous literature references all result are referred to an array of 6 MOX thin film sensors that provide a real individualization of the samples only at day 6. With the new array composed of 4 MOX thin film sensors and other 2 fabricated with MOX nanowire technology, the differences between samples are evident already at day 3, halving the response time and hence increasing the instrument threshold [10][14].
Figure 5. PCA score plot analysis from T0 to T4 of Indonesia green coffee beans showing a clear division started around day 3
Figure 6. PCA analysis from T0 to T4 for Honduras, India and Indonesia green coffee beans.
In the case of Figure 6, PCA analysis compares T0 to T4 for all three typologies of green coffee beans. It’s remarkable that T4 forms a cluster separate from the others. This result is perfectly correlated with the data furnished by microbiological techniques and GC-MS-SPME analysis, that showed highly qualitative and quantitative differences between the samples. In particular for Honduras coffee beans, at the T4 there is more separation in the PCA score plot. This is due to a higher contamination results, also supported by the ones acquired of the other techniques used.
IV. CONCLUSION
This work suggests that the electronic nose, once trained, is a potential and useful tool for the early detection of indigenous mold presence in green coffee beans. Sensing technology like EN provides a detection response of contaminations faster than conventional techniques. Early detection of molds in green coffee beans sets the roots to implement the appropriated actions to avoid the presence of mycotoxins in the last stages in the production food chains. Future work will be the investigation of the correlation
Figure 4. PCA score plot analysis from T0 to T4 of Honduras green coffee beans showing a clear division started around day 3.
2013 Seventh International Conference on Sensing Technology
between contaminated green coffee and the roasted one, measuring the real decrease of contamination after the roasting process.
ACKNOWLEDGMENT
This work was partially supported by CAFIS "Utilizzo di tecniche analitiche per la determinazione di indici di qualità nel caffè verde, tostato e macinato", Progetto Operativo FESR 2007-2013 – CUP G73F12000120004.
REFERENCES
[1] H. M. L. J. Joosten, J. Goetz, A. Pittet, M. Schellenberg, P. Bucheli,
“Production of ochratoxin A by Aspergillus carbonarius on coffee cherries”, International Journal of Food Microbiology, Vol. 65, pp. 39–44, 2001.
[2] M. Suarez-Quirozb, O. Gonzalez-Riosb, M. Barela, B. Guyota, S.
Schorr-Galindob, J. P. Guiraudb, “Effect of the post-harvest processing procedure on OTA occurrence in artificially contaminated coffee”, International Journal of Food Microbiology, Vol.103, pp. 339– 345, 2005.
[3] L. R. Batista, S. M. Chalfoun, C. Ferreira Silva , M. Cirillo, E. Azevedo
Varga, R. Freitas Schwan, “Ochratoxin A in coffee beans (Coffea arabica L.) processed by dry and wet methods”, Food Control, Vol. 20, pp. 784–790, 2009.
[4] T. W. Kensler, B. D. Roebuck, G. N. Wogan, J. D. Groopman,
“Aflatoxin: A 50-Year Odyssey of Mechanistic and Translational Toxicology”, Toxicologycal Science, Vol. 120, no.1, pp. 28–48, 2011.
[5] P. S. Steyn, C. W. Holzapfel, N. P. Ferreira, “The Biosynthesis of the
Ochratoxins, metebolites of Aspergillys ochraceus” Phytochemistry, Vol. 9, pp. 1977-1983, 1970.
[6] O. Castellanos-Onorio, O. Gonzalez-Rios, B. Guyot, Tachon A.
Fontana, J.P. Guiraud, S. Schorr-Galindo, N. Durand, M. Suárez-Quiroz, “Effect of two different roasting techniques on the Ochratoxin A (OTA) reduction in coffee beans (Coffea arabica)” Food Control, Vol. 22, no. 8, pp. 1184-1188, Aug. 2011.
[7] G. Oliveira, D. M. da Silva, R. Gualberto Fonseca Alvarenga Pereira,L.
C. Paiva, G. Prado, L. R. Batista, “Effect of different roasting levels and particle sizes on ochratoxin A concentration in coffee beans”, Food Control, Vol. 34, no. 2, pp. 651-656, Dec. 2013.
[8] I. Concina, M. Falasconi, V. Sberveglieri, “Electronic Nose as flexible
tool to assess food quality and safety: should we trust them?”, IEEE Sensors Journal, Vol. 12, Issue 11, pp.3232-3237, 2012.
[9] M. Falasconi, I. Concina, E. Gobbi, V. Sberveglieri, A.Pulvirenti, and G.
Sberveglieri, “Electronic Nose for Microbiological Quality Control of Food Products,” International Journal of Electrochemistry, Vol. 2012, pp. 1-12, 2012.
[10] G. Sberveglieri, I. Concina, E. Comini, M. Falasconi,M. Ferroni, and V.
Sberveglieri, “Synthesis and integration of tin oxide nanowires into an electronic nose,” Vacuum, Vol. 86, no. 5, pp. 532-535, Jan. 2012.
[11] E. Comini, C. Baratto, I. Concina, G. Faglia, M. Falasconi, M.Ferroni, V. Galstyan, E. Gobbi, A. Ponzoni, A. Vomiero, D. Zappa, V. Sberveglieri, G. Sberveglieri. “Metal oxide nanowire gas sensors: Application of conductometric and surface ionization architecture”, Sensors and Actuators, B: Chemical, Vol. 179, pp. 3-20, 2013.
[12] A. Ponzoni, D. Zappa, E. Comini, V. Sberveglieri, G. Faglia, G.
Sberveglieri, “Metal oxide nanoscience and nanotechnology for chemical sensors”, Chemical Engineering Transactions, Vol. 30, pp. 31-36, 2012.
[13] J. E.L. Corry, G.D.W. Curtis, R. M. Baird, Handbook of Culture Media
for Food Microbiology Progress in Industrial Microbiology, Rose
Bengal Chloramphenicol (RBC) Agar, Vol. 37, pp. 586-588, 2003. [14] V. Sberbeglieri, I. Concina, M. Falasconi, E. Gobbi, A. Pulvirenti, P.
Fava, “Early detection of fungal contination on green coffee by a MOX sensors based Electronic Nose” ISOEN 2011, Vol. 1362, pp. 119-120, May 2011 [14th International Symposium on Olfaction and Electronic Nose, United States 2011]
2013 Seventh International Conference on Sensing Technology