42
Electronic Safety, Productivity & Analytics for Underground Hard Rock Mechanized Mines
Electronic Safety, Productivity & Analytics for Underground Hard Rock Mechanized Mines

Value proposition
• Eliminate production bottlenecks
• Eliminate safety blackspots
• Accelerate evacuation and rescue
3

Customers

Customers by geography

Network extension for active headings
6

Network extension for active headings
7

Installed in seconds with only a tie-wrap!
8

Features
1. No wires for power or communications. Battery life of wireless nodes is
3 years for typical applications!
2. Self-forming, self-healing, battery-powered wireless mesh network.
3. 900 MHz RF propagation bends around corners for coverage at the
face without being in the line of fire of blasting.
4. Frequency Hopping (FHSS) RF links mitigate multipath fading caused
by harsh, confined and often obstructed environment.
5. RF transmit power below the 40mW limit set by MSHA for no minimum
distance from blasting caps.
6. Backhaul to surface over narrowband or broadband backbones.
9

Benefits
1. Quick installation does not interrupt production.
2. Nodes can be installed by equipment operators and/or shift
supervisors with simple tie wrap mounting. No tools are
required to drill holes, install rock bolts, etc..
3. No need to recover/redeploy leaky feeder cable between
blasts, since battery-powered wireless nodes can be
permanently installed between drawpoints, to avoid blasting
line of fire.
4. Offloads data from leaky feeder to fiber, when available.
5. Fast and easy to recover (cutting tie wraps vs. coiling cable).
10

Accelerated post-blast re-entry with remote gas monitoring in stope

9
Monitor multiple locations with the same man power • Identify patterns
• Process improvement
• Clearly see vent damage etc.
Can clearly see bogger activity
Can clearly see Jumbo activity (spike in temp/no
increase in CO)
Can clearly see Truck activity (spike in temp/CO)

7
Wireless Gas Monitoring at the 920 Face

Accelerated post-blast re-entry with remote gas monitoring in stope
Battery-powered & MineHop Wireless
Semi-Fixed Gas Detectors
Line-Powered Air Quality Monitoring
Stations with Modbus interface to
any MineHop wireless node
VS.

Remote monitoring and control of fans and pumps
Industry standard controller
with Modbus interface to any MineHop node

Accelerated post-blast re-entry with remote geotechnical monitoring in stope

Accelerated post-blast re-entry with remote geotechnical monitoring in stope

Accelerated post-blast re-entry with remote geotechnical monitoring in stope

Accelerated post-blast re-entry with remote geotechnical monitoring in stope

No infrastructure required!
15

Proximity warning of vehicles, personnel and fixed hazards in range
16

Typical detection distance in a straight 4x5m drift
17

Detection range around corners @ 900 MHz is significantly better than @ 2.4 GHz
Typical detection distance around corners
18

Detection range in ramp @ 900 MHz is significantly better than @ 2.4 GHz
Typical detection distance in ramp
19

Notification of emergency stop request
20

Notification of man down
21

• Panic buttons (broken leg, bleeding)
• Inertial-based (gas intoxication, heart attack, heat stroke)
• Timer-based (regulatory compliance to 2 hour check-in)
22
Man down notification

Tracking of personnel
23

19
19
Ensure Safe tag in and out of workers
• Department view
• Level view

18
18
Locate Personnel at any stage during a shift – evacuation and rescue

Tracking of mobile equipment
24

17
17
Locate Equipment at Start of Shift Quickly

12
12
Truck Cycle Activity
AUR to Callie Dump Avg. Cycle time 33 minutes

10
10
Bogger Cycle Activity
1. Number of tonnes bogged
2. Time to first and last bucket

13
Jumbo Analysis – Left and Right Percussion
• Simple install and passive data collection at the face

Critical KPI = Face Utilization
15
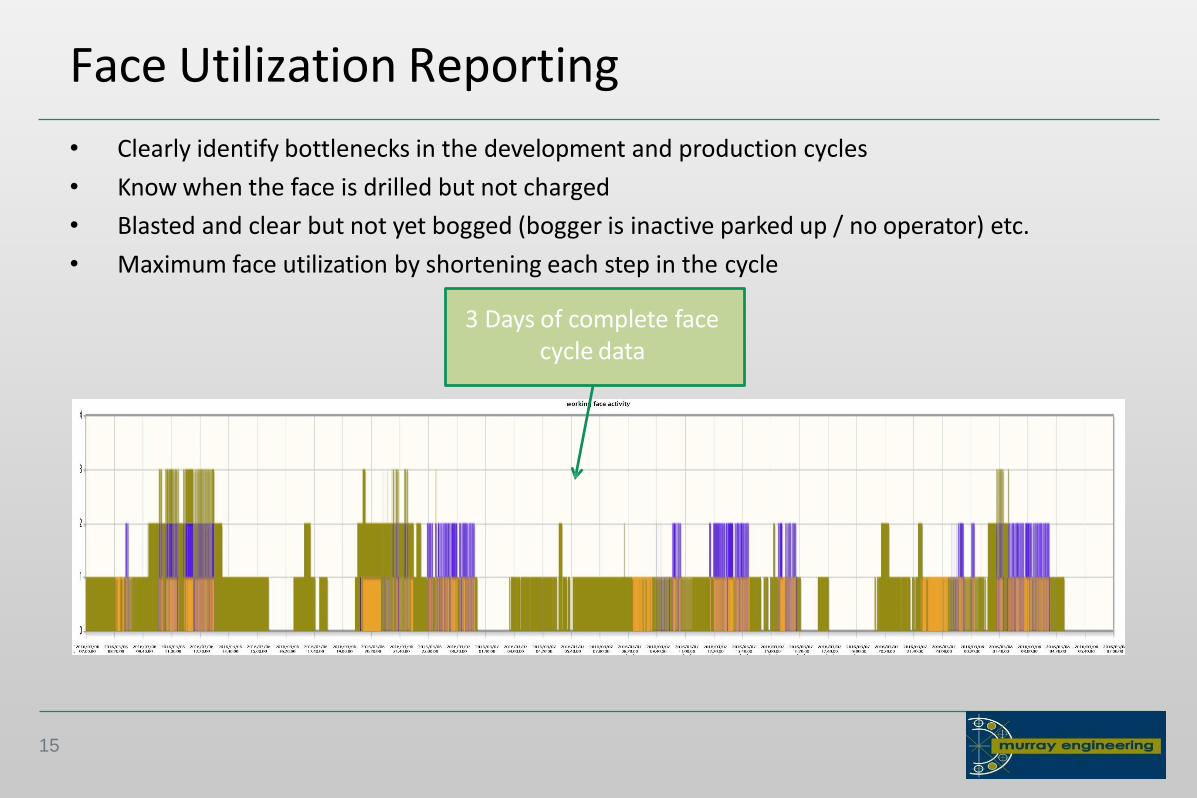
Face Utilization Reporting
• Clearly identify bottlenecks in the development and production cycles
• Know when the face is drilled but not charged
• Blasted and clear but not yet bogged (bogger is inactive parked up / no operator) etc.
• Maximum face utilization by shortening each step in the cycle
3 Days of complete face cycle data

16
Face Utilization Analysis

Actionable info to eliminate bottlenecks
1. Arrival/Departure from work areas
2. Alarm sent to shift supervisor if face idle time exceeds a pre-
defined threshold, e.g. 2 hours
3. Accelerated re-entry post-blasting, with remote monitoring of
geotech and gas instrumentation in stope
4. Accelerated backfill, with monitoring of barricade pressure,
paste level and pipe flow to allow continuous pour across
shifts
30

Evacuation notification with flashing of light via leaky feeder and MineHop
31

Product roadmap - Highlights
Wi-Fi on-demand over MineHop in active headings (patent pending
• Better analytics on big data from existing Newtrax IoT systems
• Automatic 3D positioning of nodes on mine map (patent pending)
•
• Microseismic telemetry over MineHop in active headings (patent
pending)
• Expanding ecosystem of 3rd party application partners
32

Microseismic telemetry in active headings
33

Wi-Fi on-demand
34


