Electronic Supplementary Information
A microfluidic photobioreactor array demonstrating high-
throughput screening for microalgal oil production
Hyun Soo Kim1, Taylor L. Weiss2, 4, Hem R. Thapa2, Timothy P. Devarenne2*, and Arum Han1, 3*
1 Department of Electrical and Computer Engineering, Texas A&M University, College Station, Texas
77843, USA
2 Department of Biochemistry and Biophysics, Texas A&M University, College Station, Texas 77843,
USA
3 Department of Biomedical Engineering, Texas A&M University, College Station, Texas 77843, USA
4 Current address: Department of Biology, Washington University, Saint Louis, Missouri 63130, USA
*Correspondence should be addressed to Arum Han ([email protected]) or Timothy P. Devarenne ([email protected]).
Supplementary Information Operation principle of a microfluidic binary demultiplexer
Supplementary Fig. S1 Fabrication process of the microfluidic microalgal
photobioreactor array
Supplementary Fig. S2 Light interference among neighboring chambers
Supplementary Fig. S3 Experimental setup
Supplementary Fig. S4 Correlation between size and chlorophyll autofluorescence
of B. braunii colonies
Supplementary Fig. S5 Microfabricated high-throughput microfluidic microalgal
photobioreactor array
Electronic Supplementary Material (ESI) for Lab on a ChipThis journal is © The Royal Society of Chemistry 2014
Supplementary Fig. S6 B. braunii growth under 16 different light intensities using
the developed microfluidic platform
Supplementary Fig. S7 B. braunii growth under 8 different light-dark cycles using
the developed microfluidic platform
Supplementary Fig. S8 Different designs of algal colony trapping sites
Supplementary Table S1
Light intensity measured through black-dye-filled light
intensity control channel in the microfluidic platform and
corresponding light transmittance rate
Supplementary Video S1 Operation principle of the high-throughput microfluidic
microalgae cultivation platform
Electronic Supplementary Material (ESI) for Lab on a ChipThis journal is © The Royal Society of Chemistry 2014
Supplemental Information (SI)
Microfluidic pneumatic binary demultiplexer
The microfluidic pneumatic binary demultiplexer1 was composed of two distinct PDMS layers where
the control layer containing control lines (H0 – H7 in SI Fig. 1) to actuate microvalve patterns were
placed on top of the flow layer comprising of input and output channels to be controlled (V0 – V15 in
SI Fig. 1). The microvalve patterns were formed at the junction where the top control lines crossed the
bottom flow channels so that the thin membrane between the top and the bottom channels could be
deflected by pneumatic actuation. This resulted in opening (negative pressure applied) or closing
(positive pressure applied) of the bottom flow channels (SI Fig. 1A).
The pneumatic binary demultiplexer was used to choose one particular channel out of the 16
output channels through which input solution could flow (SI Fig. 1B). Each pair of control channels
(4 pairs in total) was connected to a group of microvalves regulating half of the flow channels. Thus, a
pair of control channels formed a complementary pair (e.g., H0–H1, H2–H3, H4–H5, and H6–H7),
and constituted one selection bit. To open (or select) a single output channel, only one control channel
from each complementary valve pair had to be opened (actuated with a negative pressure, “open”)
while the other was closed (actuated with a positive pressure, “close”). Thus, the open-close states of
the two control channels forming a selection bit were always opposite. For instance, if the selection
bit was 0, H0 was closed while H1 was open. On the other hand, if the selection bit was 1, H0 was
open and H1 was closed. By deciding the state of each selection bit, opening and closing of the 16
output channels could be independently controlled. For example, when selection bit 1, 2, 3, and 4
were in state 0, 1, 0, and 1, input solution could flow through the selected output channel V10 (01012
= 10; SI Fig. 1B). Due to the complementary microvalves organized in a binary architecture, 16
output microchannels (N) could be controlled with 8 control microchannels (2log2N).
For our developed microalgae photobioreactor array to control the different light-dark cycles,
a modified microfluidic pneumatic binary demultiplexer having two inputs (DI water and black dye)
instead of a single input as described above was used. The overall working principle in the modified
schematic was same, with the only difference being that two additional microvalve structures (A1 and
A2 in complementary state) were used to control the two inputs (SI Fig. 1C). Depending on whether
A1 was open and A2 was closed, or A1 was closed and A2 was open, either black dye (input 1) or DI
water (input 2) could flow into the system. This selected input solution could then flow into one of the
8 output channels selected by the pneumatic binary demultiplexer (SI Fig. 1C).
Electronic Supplementary Material (ESI) for Lab on a ChipThis journal is © The Royal Society of Chemistry 2014
SI Fig. 1. Operation principle of a microfluidic binary demultiplexer. (A) Microvalve composed of a
control layer and a flow layer utilized in this demultiplexer. (B) Binary demultiplexer in which 16
output channels were regulated with 8 control microchannels. (C) Modified binary demultiplexer
having two inputs and two additional microvalves, which was utilized in the high-throughput
microfluidic microalgal photobioreactor array to control different light-dark cycles.
A
B
C
Electronic Supplementary Material (ESI) for Lab on a ChipThis journal is © The Royal Society of Chemistry 2014
Supplementary Fig. S1. Fabrication process of the microfluidic microalgal photobioreactor array. (A)
Light blocking layer. (B) Microfluidic light-dark cycle control layer. (C) Microfluidic light intensity
control layer. (D) Microalgae culture layer. (E) Bonding of all PDMS layers using O2 plasma
treatment and assembly into a gas-tight acrylic frame for CO2-controlled environment.
Electronic Supplementary Material (ESI) for Lab on a ChipThis journal is © The Royal Society of Chemistry 2014
Supplementary Fig. S2. Light interference among neighboring chambers. (A) Schematic showing
the setup for this measurement. All chambers in the light blocking layer were blocked except for one
chamber (highlighted as “Open”), and the intensities of light underneath this particular chamber as
well as adjacent chambers were measured and compared. (B) Comparison of the degree of transmitted
light from neighboring chambers by changing the distance from the bottom of the platform used (0.5
and 1.5 in the graph legend indicate 0.5 and 1.5 mm). Number 165 in the graph legend indicates the
intensity of incident light, 165 μmol photons·m−2·s−1. Less than 1.5% light transmittance was
observed, which is negligible.
Electronic Supplementary Material (ESI) for Lab on a ChipThis journal is © The Royal Society of Chemistry 2014
Supplementary Fig. S3. Experimental setup. Air containing 2.5% CO2 was generated by mixing
atmospheric air and 99.9% CO2 in the ratio of 40 to 1 by controlling each gas flow with compact
shielded flowmeters (VWR). This mixed gas was then sterilized through a filter, and flowed into the
acrylic culture frame, where CO2 could diffuse into the microalgae culture compartments through the
exposed thin PDMS layer. A 14-W compact fluorescent light bulb (65 K), which could provide
different incident intensities of light depending on the distances from the microalgae culture platform,
was used. Nutrients were continuously supplied by a syringe pump (1 μl/min, Chemyx Inc.), which
introduced fresh culture media into the platform and flushed any waste products out of the platform.
The flow of DI water and black dye to produce different light intensities and different light-dark
cycles were also controlled with syringe pumps, where different flow rates were used for intensity
control (5 μl/min : 0.8 μl/min = DI water : black dye) and light cycle control (1.5 μl/min for both
solutions). All control lines in the microfluidic pneumatic binary demultiplexer to regulate the light-
dark cycles were operated automatically by an array of solenoid valves and a programmable
LabviewTM interface.
Electronic Supplementary Material (ESI) for Lab on a ChipThis journal is © The Royal Society of Chemistry 2014
Supplementary Fig. S4. Correlation between size and chlorophyll autofluorescence of B. braunii
colonies. (A) Chlorophyll autofluorescence and bright field images of captured B. braunii colonies
inside the platform. (B) Strong linear correlation (R2=0.9937) between B. braunii size and intensity
sum of its corresponding chlorophyll autofluorescence, which also indicates strong linear relationship
between size and biomass.
Electronic Supplementary Material (ESI) for Lab on a ChipThis journal is © The Royal Society of Chemistry 2014
Supplementary Fig. S5. Microfabricated high-throughput microfluidic microalgal photobioreactor
array. (A) Light blocking layer. (B) Fully assembled system. Light-dark cycle control layer (cyan:
cycle control channels, pink: pneumatic binary demultiplexer) + light intensity control layer (purple)
+ microalgae culture layer (green) stacked on top of each other. (C) SEM image of a single culture
chamber with five B. braunii colony trapping sites.
Electronic Supplementary Material (ESI) for Lab on a ChipThis journal is © The Royal Society of Chemistry 2014
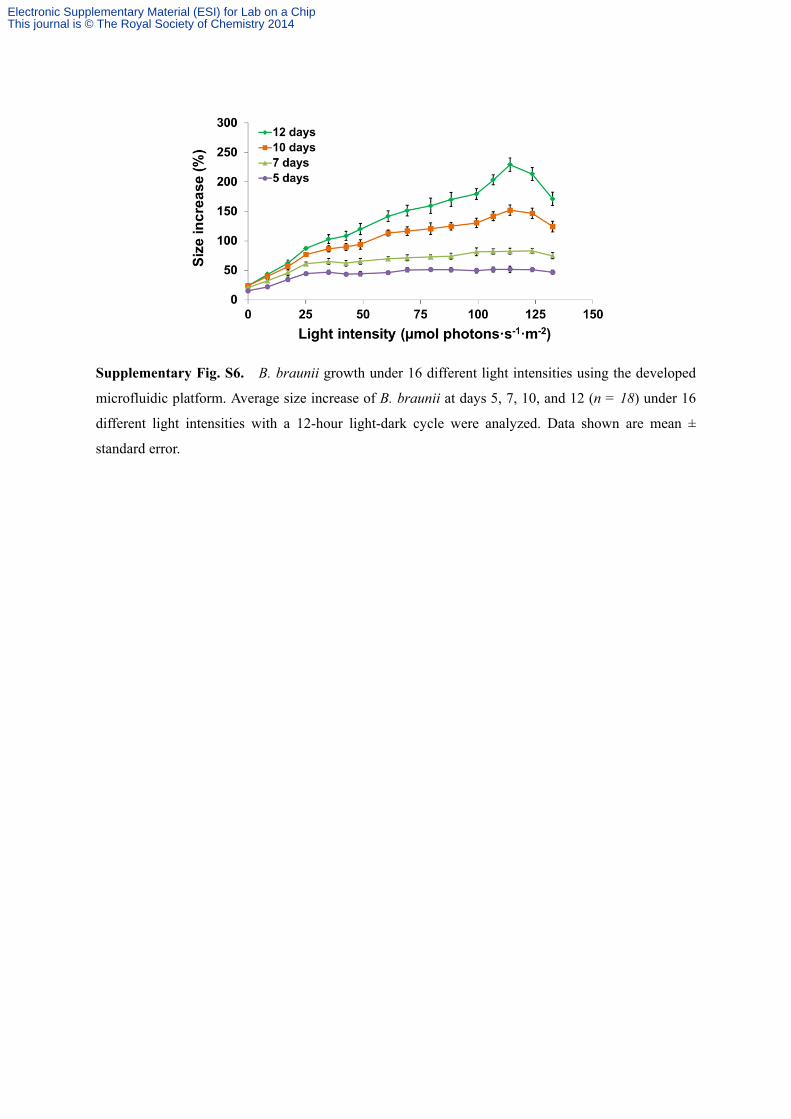
Supplementary Fig. S6. B. braunii growth under 16 different light intensities using the developed
microfluidic platform. Average size increase of B. braunii at days 5, 7, 10, and 12 (n = 18) under 16
different light intensities with a 12-hour light-dark cycle were analyzed. Data shown are mean ±
standard error.
Electronic Supplementary Material (ESI) for Lab on a ChipThis journal is © The Royal Society of Chemistry 2014
Supplementary Figure S7. B. braunii growth under 8 different light-dark cycles using the
developed microfluidic platform. Average size increase of B. braunii at days 4, 7, 11, 14 and 17 (n =
15) under 8 different light-dark cycles with a light intensity of 120 μmol photons·m−2·s−1 were
analyzed. Data shown are mean ± standard error.
Electronic Supplementary Material (ESI) for Lab on a ChipThis journal is © The Royal Society of Chemistry 2014
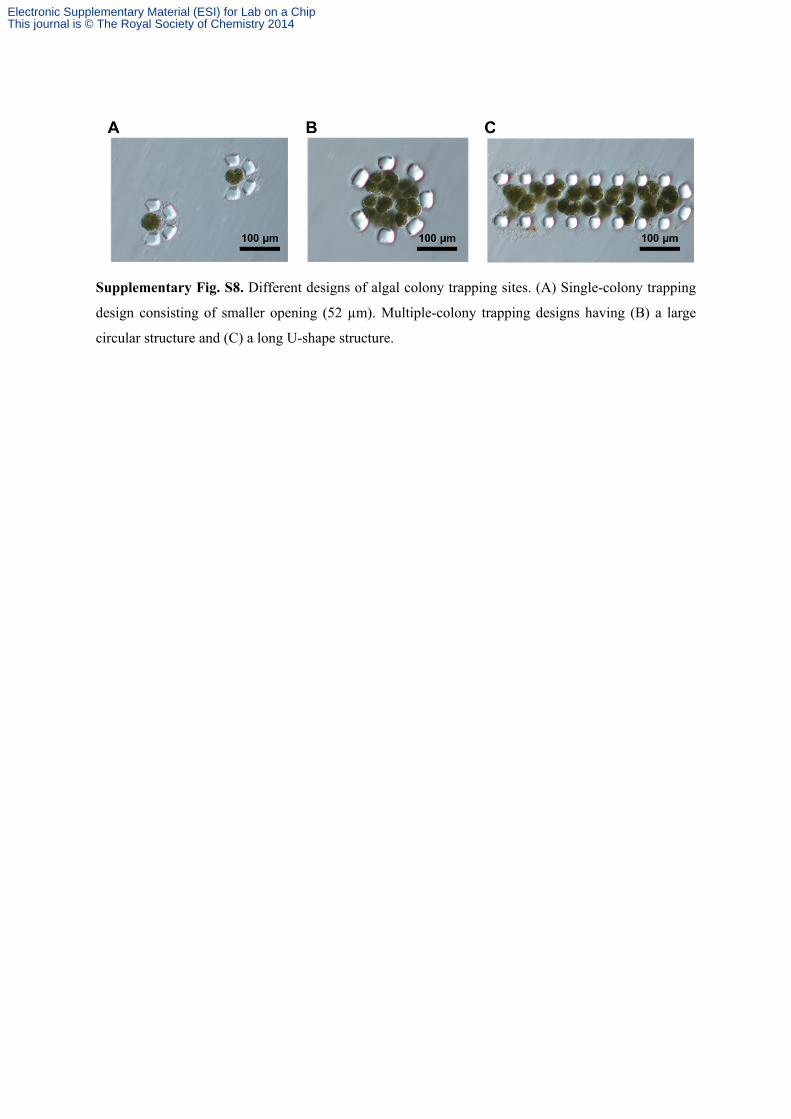
Supplementary Fig. S8. Different designs of algal colony trapping sites. (A) Single-colony trapping
design consisting of smaller opening (52 µm). Multiple-colony trapping designs having (B) a large
circular structure and (C) a long U-shape structure.
Electronic Supplementary Material (ESI) for Lab on a ChipThis journal is © The Royal Society of Chemistry 2014
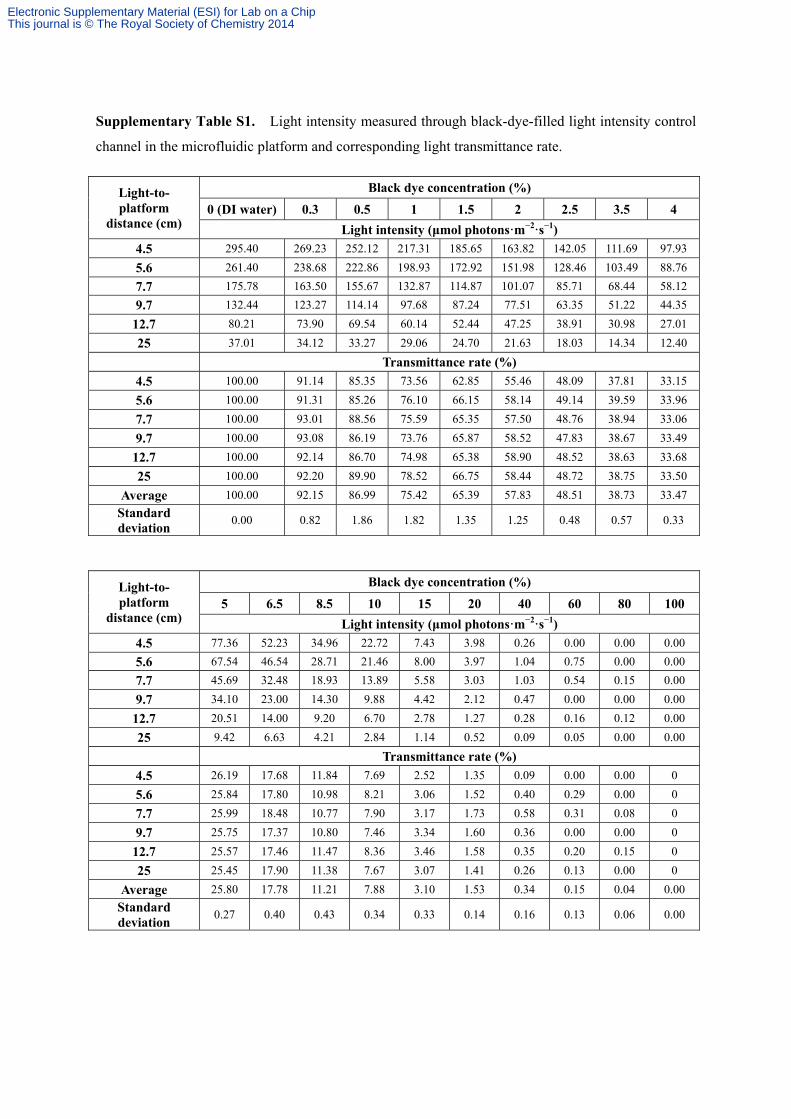
Supplementary Table S1. Light intensity measured through black-dye-filled light intensity control
channel in the microfluidic platform and corresponding light transmittance rate.
Light-to-platform
distance (cm)
Black dye concentration (%)
0 (DI water) 0.3 0.5 1 1.5 2 2.5 3.5 4
Light intensity (μmol photons·m−2·s−1)
4.5 295.40 269.23 252.12 217.31 185.65 163.82 142.05 111.69 97.93
5.6 261.40 238.68 222.86 198.93 172.92 151.98 128.46 103.49 88.76
7.7 175.78 163.50 155.67 132.87 114.87 101.07 85.71 68.44 58.12
9.7 132.44 123.27 114.14 97.68 87.24 77.51 63.35 51.22 44.35
12.7 80.21 73.90 69.54 60.14 52.44 47.25 38.91 30.98 27.01
25 37.01 34.12 33.27 29.06 24.70 21.63 18.03 14.34 12.40
Transmittance rate (%)
4.5 100.00 91.14 85.35 73.56 62.85 55.46 48.09 37.81 33.15
5.6 100.00 91.31 85.26 76.10 66.15 58.14 49.14 39.59 33.96
7.7 100.00 93.01 88.56 75.59 65.35 57.50 48.76 38.94 33.06
9.7 100.00 93.08 86.19 73.76 65.87 58.52 47.83 38.67 33.49
12.7 100.00 92.14 86.70 74.98 65.38 58.90 48.52 38.63 33.68
25 100.00 92.20 89.90 78.52 66.75 58.44 48.72 38.75 33.50
Average 100.00 92.15 86.99 75.42 65.39 57.83 48.51 38.73 33.47
Standard deviation
0.00 0.82 1.86 1.82 1.35 1.25 0.48 0.57 0.33
Light-to-platform
distance (cm)
Black dye concentration (%)
5 6.5 8.5 10 15 20 40 60 80 100
Light intensity (μmol photons·m−2·s−1)
4.5 77.36 52.23 34.96 22.72 7.43 3.98 0.26 0.00 0.00 0.00
5.6 67.54 46.54 28.71 21.46 8.00 3.97 1.04 0.75 0.00 0.00
7.7 45.69 32.48 18.93 13.89 5.58 3.03 1.03 0.54 0.15 0.00
9.7 34.10 23.00 14.30 9.88 4.42 2.12 0.47 0.00 0.00 0.00
12.7 20.51 14.00 9.20 6.70 2.78 1.27 0.28 0.16 0.12 0.00
25 9.42 6.63 4.21 2.84 1.14 0.52 0.09 0.05 0.00 0.00
Transmittance rate (%)
4.5 26.19 17.68 11.84 7.69 2.52 1.35 0.09 0.00 0.00 0
5.6 25.84 17.80 10.98 8.21 3.06 1.52 0.40 0.29 0.00 0
7.7 25.99 18.48 10.77 7.90 3.17 1.73 0.58 0.31 0.08 0
9.7 25.75 17.37 10.80 7.46 3.34 1.60 0.36 0.00 0.00 0
12.7 25.57 17.46 11.47 8.36 3.46 1.58 0.35 0.20 0.15 0
25 25.45 17.90 11.38 7.67 3.07 1.41 0.26 0.13 0.00 0
Average 25.80 17.78 11.21 7.88 3.10 1.53 0.34 0.15 0.04 0.00
Standard deviation
0.27 0.40 0.43 0.34 0.33 0.14 0.16 0.13 0.06 0.00
Electronic Supplementary Material (ESI) for Lab on a ChipThis journal is © The Royal Society of Chemistry 2014
Supplementary Video S1. Operation principle of the high-throughput microfluidic microalgae cultivation platform
Electronic Supplementary Material (ESI) for Lab on a ChipThis journal is © The Royal Society of Chemistry 2014
Supplementary References
1. T. Thorsen, S. J. Maerkl and S. R. Quake, Science, 2002, 298, 580-584.
Electronic Supplementary Material (ESI) for Lab on a ChipThis journal is © The Royal Society of Chemistry 2014