a Institute of Chemistry, Academia Sinica, No. 128, Sec. 2, Academia Road, Nankang, Taipei 115 (Taiwan). E-mail: [email protected] or [email protected] National Synchrotron Radiation Research Center, 101 Hsin-Ann Road, Hsinchu Science Park, Hsinchu 30076 (Taiwan).
Polypeptide SynthesisAll polypeptides were synthesized by the batch FMOC polyamide method on the peptide synthesizer (PS3, Rainin Instrument, USA). Rink amide AM resin was selected as the solid support. After cleaved from resin, crude polypeptides were purified by the high-performance liquid chromatography (HPLC) (Waters 2690, Waters Corp., USA) with reverse phase semi-preparative column (C18). The gradient separation was achieved by mixing Buffer A (5% acetonitrile / 0.1% TFA / 94.9 % water) and Buffer B (0.1% TFA / 99.9 % acetonitrile). The flow rate was kept at 3 mL/min. Polypeptide purity was confirmed by RP-HPLC with analytical column (C18) and identified by Matrix-Assisted Laser Desorption/Ionization (MALDI) (Applied Biosystem, USA) mass spectroscopy (Fig. S1).
Plasmid Constructions The DNA sequence encoding human TDP-43 was introduced into several plasmids for different applications. For the cell-free reactions, the genes of TDP-43, TDP1-207, TDP208-414 and GFP
including the additional encoded FLAG-tag at the 5’-end, was ligated between the NcoI-XhoI enzyme sites in pIVEX2.3d vector (Roche, Germany). For TDP-43 expression in E. coli, pET17b plasmid was used. All the constructs were sequenced by Tri-I Biotech, Inc. (Taiwan) and the inserted sequences of the recombinant TDP-43 were verified.
Seed Preparation The polypeptides (50M) were dissolved in PBS buffer, and the solution was incubated at 37°C. The amyloid fibrils were then spun down in the Eppendorf tube and resuspended in RNase-free water. The fibril suspension was fragmented with 5 cycles of intermittent pulses (ten pulses of 0.6 s each; 5 s interval between each cycle) using an ultrasonic processor (UP100H, Hielscher, USA) equipped with a 1-mm micro-tip immersed in the sample. The power setting was fixed at 100%1-3.
The Seeding Effect on Aggregation of TDP-43 in the eukaryotic cell-free SystemThe eukaryotic cell-free system derived from the rabbit reticulocyte lysate (20L) (TNT T7 Quick-Coupled Transcription/Translation System, Promega, USA) was applied to generate the TDP-43 proteins and provides a cellular mimicking environment to study the TDP-43 protein aggregation. After the synthesis was completed at 30°C for 2 h, the cell-free reactions were further incubated at 30°C (24 h) for the formation of the TDP-43 aggregates. To evaluate the influence of seeding effect, various seeds (2L) were added into the cell-free reaction immediately after the synthesis. After incubation, the samples were divided into supernatant and pellet fractions by centrifugation at 16,100 × g for 20 minutes at 4°C. The pellet was then dissolved by SDS-PAGE loading buffer (50 mM Tris-HCl pH 6.8, 7.5% glycerol, 1% SDS, 0.02% bromophenol blue and 1% -mercaptoethanol) and the
proteins in the supernatant were precipitated by acetone followed by re-suspension with the SDS-PAGE loading buffer. The TDP-43 in both fractions was detected by western blotting with a primary anti-FLAG M2 monoclonal antibody (Sigma, USA) and a secondary anti-mouse antibody conjugated with HRP (Sigma, USA). The antibodies-TDP-43 complexes were detected on Biospectrum® AC image system (UVP, USA) using a chemiluminescent substrate for HRP (Millipore, USA). The blotting signals were analyzed by Image J (National Institutes of Health, Bethesda, MD) and the fractions of TDP-43 protein in supernatant were obtained by the equation P/(S + P), where S and P denote the detected signals of the TDP-43 in the supernatant and pellet fractions, respectively. All the experiments for each sample were repeated three times.
Circular Dichroism Measurement of PolypeptidesThe TDP331-360 (QN1), TDP343-374 (QN2), and scramble TDP331-360 (sQN1) (50 M) were dissolved in phosphate buffer and incubated at 37°C. The CD spectra of the resulting protein solutions were recorded in 1 mm quartz cuvette on the J-815 CD spectrometer (JASCO, Japan). All data were collected from 200 to 260 nm with the scanning speed of 100 nm/min. Three scans were averaged for each sample.
Fibril Incubations50 M of different polypeptides were incubated in phosphate buffer (70 mM KCl, 20 mM sodium phosphate, pH 7.0) at 37°C for several days, respectively. The concentration of polypeptide solutions were determined by UV spectrometry. Each of the polypeptide concentration was calculated using the following extinction coefficients. (ε280 nm = 5690 M -1cm -1 for QN1 and sQN1; ε276 nm = 1280 M -1cm -1 for QN2.)
Electron MicroscopyFibril solutions of polypeptides were incubated in the phosphate buffer at 37°C for 2 weeks. The resulting aliquots of fibril solutions (5 L) were placed on a glow-charged, 300 mesh, formvar- and carbon-coated copper grids stained with 1% uranyl acetate. After drying for overnight, all samples were recorded on a JEM-2011 electron microscope (JEOL, Japan) at 200 kV.
Thioflavin T (ThT) Binding Assay2 mM concentrated dye solution of Thioflavin-T (ThT) was prepared in pH 7.5 buffer (140 mM KCl, 100 mM sodium phosphate) as the stock solution and filtered through a 0.22 m Millipore filter. The fresh working solution was prepared by diluting the stock solution to 200 M. 60 L aliquot of the fibril solutions was mixed with 60 L of the working solution for 5 min at room temperature. The fluorescence emission spectra between 460 and 600 nm was taken in a 3 mm pathlength rectangular fluorescence quartz cuvette on ISS-PC1 spectrofluorimeter (ISS, USA) with excitation at 442 nm.
Cell Culture and TransfectionREF52 (rat embryonic fibroblast cell line, kindly provided by Professor Rudy Juliano) cells were cultured in Dulbecco’s modified Eagle’s medium (DMEM) (Gibco, USA) containing 2 mM glutamine, 10% heat inactivated fetal bovine serum and 100U U/mL penicillin-streptomycin liquid (Gibco, U.S.) at 37 °C in a humidified atmosphere containing 5% CO2. 5x10⁴ of REF52 cells in 12-well cell culture plate were transfected with 1 g of full-length TDP-43-EGFP or TDP208-414-EGFP plasmid by GeneJuice® transfection reagent (Novagen, USA) according to manufacturer’s recommendations. After 24 hours transfection, TDP-43 transfected cells were subculture into sterile 35 mm μ-Dish (Ibidi, Germany) for microinjection experiments.
The Preparation of TAMRA-attached PolypeptidesIn order to observe the seeding effect in the fibroblast cell, we used the Q/N-rich polypeptides which have been labeled with 5-(and -6)-Carboxytetramethylrhodamine (TAMRA) (AnaSpec, USA) under chemical reaction. Note that this commercial dye is a mixture of two isomers. In brief, peptides were dissolved in 100 L Dimethyl sulfoxide (DMSO). Both 10 L of triethylamine and 20 L of TAMRA dye (stock solution = 1mM) were then gradually added into the peptide solution. After 10 h incubation and shaking, the TAMRA-attached polypeptides were purified by RP-HPLC. The purity of polypeptides was confirmed by RP-HPLC with analytical C18 column and identified by mass spectrum (Fig. S1).
Microinjection and Time-course Fluorescence MicroscopyMicroinjections were performed using glass microneedles (1B100-F4, World Precision Instruments, USA) and pulled with a PC-10 capillary puller (Nalishige®, Japan). Microneedles were back-loaded with TAMRA-peptide solution (10 M). A microinjection system, Picospriterzer III and Joystick Micromanipulator (Nalishige®, Japan) mounted with stage-side of microscopy (IX-71, Olympus, Japan) for deliver TAMRA-peptide into REF52 cells. Injections were performed in the cytoplasm, using PBS buffer. After microinjection (injection pressure 137 hPa, injection time 100 msec, compensation pressure 15 hPa), cells were subsequently washed with 2 ml of 10% FBS containing L-15 medium for recovery 1 h. Time-course epifluorescence image collection was carried out using an NIKON TiE microscope where samples were illuminated with ultrahigh pressure mercury lamp (130W) for UV excitation and/or bright light source. Differential interference contrast (DIC) images were grabbed by employing a bright light source. Filters used to collect fluorescence emission including excited EGFP and TAMRA cubes. Cellular images were captured with Andor iXon3 888 back-illuminated High Sensitivity EMCCD Camera (Andor Technology Ltd., UK). Images were analyzed and quantified using Nikon NIS element software.
Annexin-V Staining
After 16h of various synthetic polypeptides treatment, cells expressing full-length TDP-43-EGFP or TDP208-414–EGFP were washed twice with PBS, washed once with 1X Annexin V binding Buffer (BioVision, USA) and incubated with Annexin V-Cy5 (BioVision, USA) at room temperature. Cells that have bound Annexin V-Cy5 on the plasma membrane were visualized by inverted fluorescent microscope using Cy5 filter.
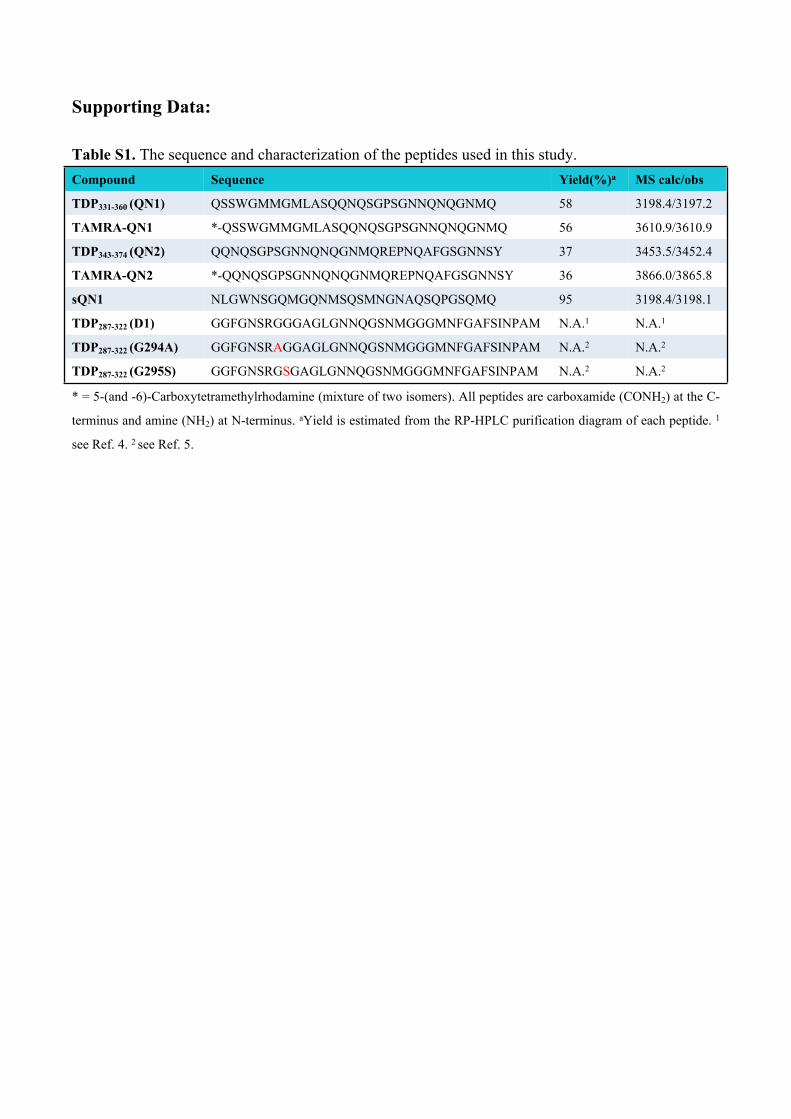
Supporting Data:
Table S1. The sequence and characterization of the peptides used in this study. Compound Sequence Yield(%)a MS calc/obs
* = 5-(and -6)-Carboxytetramethylrhodamine (mixture of two isomers). All peptides are carboxamide (CONH2) at the C-
terminus and amine (NH2) at N-terminus. aYield is estimated from the RP-HPLC purification diagram of each peptide. 1
see Ref. 4. 2 see Ref. 5.
Figure S1. The analytical RP-HPLC of purified a) QN1, c) QN2, e) TAMRA-QN1, and g) TAMRA-QN2 (A/B 100/0 to 0/100 in 30 min). The molecular weight of purified b) QN1, d) QN2, f) TAMRA-QN1, and h) TAMRA-QN2 were identified by MALDI mass.
Figure S2. EM images of the QN1 and QN2 peptides in the phosphate buffer with different incubation times. Scale bars, 100 nm.
Figure S3. Seeding effects of D1 on TDP-43 aggregation under different incubation time and temperature in the eukaryotic cell-free system. a) The time-course solubility change of TDP-43 was detected in the presence and absence of D1 at 37 oC for 2h incubation by western blotting. b) The solubility change of TDP-43 was detected in the presence and absence of D1 seed at 30oC for either 12h or 24h incubating by western blotting with anti-Flag antibody.
Figure S4. The supernatant and palette fractions of Flag-EGFP protein in the presence of D1 and QN1 seeds in the cell-free system. The Anti-Flag antibody has been utilized to identify Flag-GFP protein by western blotting.
Figure S5. The solubility changes of a) full-length, b) C-terminal and c) N-terminal TDP-43 protein in the presence and absence of various synthetic polypeptides (D1, G295S, G294A, QN1 and QN2) were identified in the cell-free system by western blotting with anti-Flag antibody at 30oC.
Figure S6. The EM images of the TAMRA-QN1 after 7 and 14 days of incubation. Scale bars, 100 nm.
Figure S7. The differential interference contrast (DIC) images of REF52 cells expressing a) full-length TDP-43-EGFP and b) TDP208-414-EGFP were circled by yellow line to contrast the morphological changes. Note that this figure is a simultaneous DIC image accompany with Fig. 3b and c in the article. The cells microinjected with QN1 seeds appeared to destabilize cell adhesion for subsequent shrinking, membrane blebbing and eventual death over 16h. Scale bars, 10m.
Figure S8. The morphology of the REF52 cells and the distribution of either a) full-length TDP-43-EGFP or b) TDP208-414-EGFP were monitored for 16 h after the microinjection of QN1 or QN2 in PBS. Annexin V immune-staining was performed at 16 h. A magnified image is shown in the corner of some panels in a) and b). The differential interference contrast (DIC) images of REF52 cells expressing either c) full-length TDP-43-EGFP or d) TDP208-414-EGFP were circled by yellow line to contrast the morphological changes. c) and d) are simultaneous DIC images accompany with a) and b). Scale bars, 10 m.
Figure S9. The distribution of full-length TDP-43-EGFP and the morphology of the REF52 cells are monitored for 16h after microinjection of D1. Scale bars, 10m.
Figure S10. The a) EM, b) time-course CD, and c) ThT assay of sQN1. d) The seeding effect of QN1 and sQN1 against full-length TDP-43 was identified in the cell-free system. e) The distribution of full-length TDP-43-EGFP and the morphology of the REF52 cells are monitored for 16h after microinjection of sQN1. Scale bars, 10m.
References:
(1) Yu, X.; Luo, Y.; Dinkel, P.; Zheng, J.; Wei, G.; Margittai, M.; Nussinov, R.; Ma, B. The Journal of biological chemistry 2012, 287, 14950.(2) Wood, S. J.; Chan, W.; Wetzel, R. Biochemistry 1996, 35, 12623.(3) Furukawa, Y.; Kaneko, K.; Nukina, N. The Journal of biological chemistry 2011, 286, 27236.(4) A. K. Chen, R. Y. Lin, E. Z. Hsieh, P. H. Tu, R. P. Chen, T. Y. Liao, W. Chen, C. H. Wang and J. J. Huang, J Am Chem Soc 2010, 132, 1186-1187.(5) C. S. Sun, C. Y. Wang, B. P. Chen, R. Y. He, G. C. Liu, C. H. Wang, W. Chen, Y. Chern and J. J. Huang, PLoS One 2014, 9, e103644.