571 Chapter Outline 23.1 Introduction: The Human Genome Project 23.1A What Is Electrophoresis? 23.1B How Is Electrophoresis Performed? 23.2 General Principles of Electrophoresis 23.2A Factors Affecting Analyte Migration 23.2B Factors Affecting Band-Broadening 23.3 Gel Electrophoresis 23.3A What Is Gel Electrophoresis? 23.3B How Is Gel Electrophoresis Performed? 23.3C What Are Some Special Types of Gel Electrophoresis? 23.4 Capillary Electrophoresis 23.4A What Is Capillary Electrophoresis? 23.4B How Is Capillary Electrophoresis Performed? 23.4C What Are Some Special Types of Capillary Electrophoresis? Chapter 23 Electrophoresis 23.1 INTRODUCTION: THE HUMAN GENOME PROJECT February 2001 saw one of the greatest achievements of modern science. It was at this time that two scientific papers appeared, one in the journal Science and the other in Nature, reporting the sequence of human DNA (or the “human genome”). 1,2 These papers were the result of a major research effort known as the Human Genome Project, which was formally begun in 1990 under the sponsorship of the U.S. Department of Energy and the National Institutes of Health. 3 Although it was anticipated to take 15 years to fin- ish, this project was “completed” in about a decade. This early completion was made possible by several advances that occurred in techniques for sequencing DNA. One common approach for sequencing DNA is the Sanger method (see Figure 23.1). In the Sanger method, the sec- tion of DNA to be examined (known as the “template”) is mixed with a segment of DNA that binds to part of this sequence (the “primer”). This mixture is placed into four containers that have the nucleotides and enzymes needed to build on the template. These containers also have special labeled nucleotides that will stop the elonga- tion of DNA after the addition of a C, G, A, or T to its sequence. The DNA strands formed in each container are later separated according to their size. By comparing the length of these strands and by knowing which labeled nucleotides are at the end of each strand, the sequence of the DNA can be determined. 4 The Sanger method was originally developed as a manual technique that took long periods of time to per- form. Thus, one thing that had to be addressed early in the Human Genome Project was the creation of faster, automated systems for sequencing DNA. 5,6 Both tradi- tional and newer systems for accomplishing this sequencing utilize a separation method known as electrophoresis. In this chapter we learn about elec- trophoresis, look at its applications, and see how improvements in this technique made the Human Genome Project possible. 23.1A What Is Electrophoresis? Electrophoresis is a technique in which solutes are sepa- rated by their different rates of migration in an electric field (see Figure 23.2). 7–10 To carry out this method, a sample is first placed in a container or support that also contains a background electrolyte (or “running buffer”). When an electric field is later applied to this system, the ions in the running buffer will flow from one electrode to the other and provide the current needed to maintain the applied voltage. At the same time, positively charged ions in the sample will move toward the negative elec- trode (the cathode), while negatively charged ions will move toward the positive electrode (the anode). The result is a separation of these ions based on their charge and size. Because many biological compounds have charges or ionizable groups (e.g., DNA and proteins), electrophoresis is frequently utilized in biochemical and 96943_23_ch23_p571-596 1/8/10 2:54 PM Page 571
Transcript
571
Chapter Outline23.1 Introduction: The Human Genome Project
23.1A What Is Electrophoresis?23.1B How Is Electrophoresis Performed?
23.2 General Principles of Electrophoresis23.2A Factors Affecting Analyte Migration23.2B Factors Affecting Band-Broadening
23.3 Gel Electrophoresis23.3A What Is Gel Electrophoresis?23.3B How Is Gel Electrophoresis Performed?23.3C What Are Some Special Types of Gel Electrophoresis?
23.4 Capillary Electrophoresis23.4A What Is Capillary Electrophoresis?23.4B How Is Capillary Electrophoresis Performed?23.4C What Are Some Special Types of Capillary Electrophoresis?
Chapter 23
Electrophoresis
23.1 INTRODUCTION: THE HUMAN GENOME PROJECT
February 2001 saw one of the greatest achievements ofmodern science. It was at this time that two scientificpapers appeared, one in the journal Science and the otherin Nature, reporting the sequence of human DNA (or the“human genome”).1,2 These papers were the result of amajor research effort known as the Human GenomeProject, which was formally begun in 1990 under thesponsorship of the U.S. Department of Energy and theNational Institutes of Health.3
Although it was anticipated to take 15 years to fin-ish, this project was “completed” in about a decade. Thisearly completion was made possible by several advancesthat occurred in techniques for sequencing DNA. Onecommon approach for sequencing DNA is the Sangermethod (see Figure 23.1). In the Sanger method, the sec-tion of DNA to be examined (known as the “template”) ismixed with a segment of DNA that binds to part of thissequence (the “primer”). This mixture is placed into fourcontainers that have the nucleotides and enzymesneeded to build on the template. These containers alsohave special labeled nucleotides that will stop the elonga-tion of DNA after the addition of a C, G, A, or T to itssequence. The DNA strands formed in each container arelater separated according to their size. By comparing thelength of these strands and by knowing which labelednucleotides are at the end of each strand, the sequence ofthe DNA can be determined.4
The Sanger method was originally developed as amanual technique that took long periods of time to per-form. Thus, one thing that had to be addressed early inthe Human Genome Project was the creation of faster,automated systems for sequencing DNA.5,6 Both tradi-tional and newer systems for accomplishing thissequencing utilize a separation method known aselectrophoresis. In this chapter we learn about elec-trophoresis, look at its applications, and see howimprovements in this technique made the HumanGenome Project possible.
23.1A What Is Electrophoresis?
Electrophoresis is a technique in which solutes are sepa-rated by their different rates of migration in an electricfield (see Figure 23.2).7–10 To carry out this method, asample is first placed in a container or support that alsocontains a background electrolyte (or “running buffer”).When an electric field is later applied to this system, theions in the running buffer will flow from one electrode tothe other and provide the current needed to maintain theapplied voltage. At the same time, positively chargedions in the sample will move toward the negative elec-trode (the cathode), while negatively charged ions willmove toward the positive electrode (the anode). Theresult is a separation of these ions based on their chargeand size. Because many biological compounds havecharges or ionizable groups (e.g., DNA and proteins),electrophoresis is frequently utilized in biochemical and
96943_23_ch23_p571-596 1/8/10 2:54 PM Page 571
572 Chapter 23 • Electrophoresis
Primer
Sample of DNA
Add DNA and primer tofour reaction mixtures
for replication,
each mixture containinga different elongation-stopping nucleotide
Stopsat C
Stopsat T
Stopsat A
Stopsat G
Mixtures of elongated primer strands withvarious lengths and stopped at different
nucleotides
Sequence oforiginal DNA
Separate primers strand
s bysize using electrophoresis
Stoppedat C
Stoppedat T
Stoppedat A
Stoppedat G
GTGACTAGTCGAT
(a)
(b)
DNA replication
Separate and analyze primer strands
FIGURE 23.1 Sequencing of DNA by the Sanger method. This method is named after F. Sanger, one of thescientists who originally reported this technique.4 The final DNA sequence is determined in this method bylooking at the sequence of the primer strands and using the complementary nucleotides (C for G, A for T, Gfor C, and T for A) to describe the sequence of the original DNA.
of moving boundaries between regions that contained dif-ferent mixtures of proteins, as shown in Figure 23.3.10,16
Today it is more common to use small samples to allowanalytes to be separated into narrow bands or zones, givinga method known as zone electrophoresis.8–10,16 An example ofzone electrophoresis is shown in Figure 23.1, where DNA issequenced by separating its strands of various lengths intonarrow bands on a gel.
There are many ways in which electrophoresis isused for chemical analysis. These include the sequencingof DNA, as well as the purification of proteins, peptides,and other biomolecules. In clinical chemistry, elec-trophoresis is an important tool for examining the pat-terns of amino acids, serum proteins, enzymes, andlipoproteins in the body. Electrophoresis is also used inthe analysis of organic and inorganic ions in foods, com-mercial products, and environmental samples. In addi-tion, electrophoresis is an essential component of medicaland pharmaceutical research for the characterization of
medical research. This approach can also be adapted forwork with small ions (like or ) or for largecharged particles (such as cells and viruses).
Even though it has been known for one hundred yearsthat substances like proteins and enzymes have a character-istic rate of travel in an electric field,11–13 electrophoresis didnot become a routine separation method until around the1930s. One notable advance occurred in 1937 when a scien-tist named Arne Tiselius (Figure 23.3) used electrophoresisfor the separation of serum proteins.3,14 Tiselius conductedthis separation by employing a U-shaped tube in which heplaced his sample and running buffer. When he applied anelectric field, proteins in the sample began to separate asthey migrated toward the electrodes of opposite charge.However, the use of a large sample volume gave a series ofbroad and only partially resolved regions that containeddifferent mixtures of the original proteins.15
The method employed by Tiselius is now known asmoving boundary electrophoresis, because it produced a series
NO3 -Cl-
96943_23_ch23_p571-596 1/8/10 2:54 PM Page 572
Section 23.1 • Introduction: The Human Genome Project 573
�
Apply electric field
SampleBackgroundelectrolyte
(�)(�)�
�
�
�
�
�
�
�
��
�
�
�
� �
FIGURE 23.2 Separation of positively andnegatively charged analytes in a sample by electrophoresis.
proteins in normal and diseased cells and for looking fornew substances.10
23.1B How Is Electrophoresis Performed?
Electrophoresis can be performed in a variety of formats(see Figure 23.4). One format is to apply small amountsof a sample to a support (usually a gel) and allow theanalytes in this sample to travel in a running bufferthrough the support when an electric field is applied.
This approach is known as gel electrophoresis (a methodwe will discuss in Section 23.3).17–19 It is also possible toseparate the components of a sample by using a narrowcapillary that is filled with a running buffer and placedinto an electric field. This second format is calledcapillary electrophoresis (discussed in Section 23.4).17,19–22
Depending on the type of electrophoresis beingused, the resulting separation can be viewed in one oftwo ways. In the case of gel electrophoresis, the separa-tion is stopped before analytes have traveled off the sup-port. The result is a series of bands where the migrationdistance (dm) characterizes the extent to which each ana-lyte has interacted with the electric field. This approach issimilar to that used to characterize the retention of ana-lytes in thin-layer chromatography and paper chro-matography (see Chapter 22). Because the migrationdistance of an analyte through a gel for electrophoresiswill depend on the exact voltage and time used for theseparation, it is common to include standard samples onthe same support as the sample to help in analyte identi-fication. The intensity of the analyte band is then used tomeasure the amount of this substance in the sample.
In capillary electrophoresis all analytes travel thesame distance, from the point of injection to the oppo-site end where a detector is located. The analytes willdiffer, however, in the time it takes them to travel thisdistance, in a manner similar to what occurs in thechromatographic methods of gas chromatography (GC)and high-performance liquid chromatography (HPLC).In this situation the migration time (tm) for each ana-lyte is measured and recorded.7 The resulting plot ofdetector response versus migration time is called an
Sample with a mixtureof proteins (1–3)
Proteins 1–3
Protein 1
Protein 1 � 2Protein 3
Protein 2 � 3
Buffer
Before applyingelectric field
During applicationof electric field
FIGURE 23.3 Arne W. K. Tiselius (1902–1971), and an example of a protein separation performed bymoving boundary electrophoresis. Tiselius was a Swedish scientist who won the 1948 Nobel Prize in chemistryfor his early work in the field of electrophoresis. Tiselius began this research while working as a graduatestudent at the University of Uppsala in Sweden. He received his doctorate degree in 1930 and later returnedin 1937 to the University of Uppsala as a professor of biochemistry. It is here that he explored the use ofmoving boundary electrophoresis to separate chemically similar proteins in blood.3,15 Electrophoresis is stillused today by clinical chemists when they examine the pattern of major and minor proteins in blood, urine,and other samples from the body.
96943_23_ch23_p571-596 1/8/10 2:54 PM Page 573
574 Chapter 23 • Electrophoresis
Mig
rati
on d
ista
nce
Sample Standards
(b)
Electrophoresis gel/supportElectropherogram
Migration time
Detector
(�)(�)
(�)
(�)(a)
FIGURE 23.4 Examples of the results produced by (a) gel electrophoresis, and (b) capillary electrophoresis.
electropherogram. The migration times in this plot canbe used to help in analyte identification, while the peakheights or areas are used to determine the amount ofeach analyte. An internal standard is usually injectedalong with the sample to correct for variations duringinjection or small fluctuations in the experimental con-ditions during the separation.
23.2 GENERAL PRINCIPLES OF ELECTROPHORESIS
The separation of analytes by electrophoresis has two keyrequirements. The first requirement is there must be a dif-ference in how analytes will interact with the separationsystem. In electrophoresis this requirement means theanalytes must have different migration times or migra-tion distances. The second requirement is that the bandsor peaks for the analytes must be sufficiently narrow toallow them to be resolved.
23.2A Factors Affecting Analyte Migration
Electrophoretic Mobility. Electrophoresis is similar tochromatography in that both involve the separation of com-pounds by differential migration. Chromatography bringsabout differential migration through chemical interactionsbetween analytes with the stationary phase and mobilephase. In electrophoresis, differential migration is producedby the movement of analytes in an electric field, where theirrate of migration will depend on their size and charge.
The overall rate of travel of a charged solute in elec-trophoresis will depend on two opposing forces (seeFigure 23.5). The first of these forces (F+) is the attraction
of a charged solute toward the electrode of oppositecharge. This force depends on the strength of the appliedelectric field (E, units of volts per distance) and the chargeon the solute (z). The second force acting on the solute isresistance to its movement, as created by the surroundingmedium. The force of this resistance (F–) depends on the“size” of the solute (as described by its solvated radius r),the viscosity of the medium , and the solute’s velocityof migration (v, in units of distance per time).
When an electric field is applied, a solute will accel-erate toward the electrode of opposite charge until theforces F+ and F– become equal in size (although oppositein direction).10,21 At this point a steady-state situation isproduced in which the solute begins to move at a con-stant velocity. This velocity can be found by setting theexpressions for F+ and F– equal to each other and rear-ranging the resulting equation in terms of v.
(23.1)6prhv = E z or v =
E z6prh
(h)
(�)(�)
Attraction of solute toelectrode(F� � E z)
Resistance to solutemovement
(F� � 6�r�v)
�
FIGURE 23.5 Forces that determineelectrophoretic mobility.
96943_23_ch23_p571-596 1/8/10 2:54 PM Page 574
Section 23.2 • General Principles of Electrophoresis 575
To see how this velocity will be affected by only thestrength of the electric field, we can combine the otherterms in Equation 23.1 to give a single constant ,
(23.2)
where . This new combination of terms isknown as the electrophoretic mobility, which is repre-sented by the symbol .7,9 The value of is oftenexpressed in units of or and is con-stant for a given analyte under a particular set of temper-ature and solvent conditions. The value of alsodepends on the apparent size and charge of the solute, asrepresented by the ratio z/r in Equation 23.1. This last fea-ture means that any two solutes with different charge-to-size ratios can, in theory, be separated by electrophoresis.
m
cm2>kV # minm2>V # smm
m = z>(6 p r h)
v = mE
(m)
If we lower the applied voltage from 20 kV to 10 kV(a twofold change), the migration times will increase andthe migration velocities for these proteins will decrease(also by twofold), but their electrophoretic mobilities willremain exactly the same. This situation occurs becausethe electrophoretic mobility is independent of voltageand electric field strength, while migration times andvelocities are not. Thus, if there is a decrease in V and E,Equation 23.3 indicates there must be a proportionaldecrease in v and tm to keep constant.m
EXERCISE 23.1 Determining the ElectrophoreticMobility for an Analyte
The apparent electrophoretic mobility for an analyte incapillary electrophoresis can be found by rewritingEquation 23.2 in the form shown.
(23.3)
In this equation, V is the voltage applied to the elec-trophoretic system over a length L, and Ld is the distancetraveled from the point of application to the detector bythe analyte in migration time tm.
A sample of several proteins is applied to a neutral-coated capillary with a total length of 25.0 cm and a distanceto the detector of 22.0 cm. Two of the proteins in the samplegive migration times of 15.3 min and 16.2 min when usingan applied voltage of 20.0 kV. What are the migration veloc-ities and electrophoretic mobilities of these proteins underthese conditions? What will their electrophoretic mobilitiesand migration times be at an applied voltage of 10.0 kV?
SOLUTION
The electrophoretic mobility of the first protein can befound by substituting the known values for Ld (22.0 cm), tm(15.3 min), V (20.0 kV), and L (25.0 cm) into Equation 23.3.
A similar calculation for the second protein gives an elec-trophoretic mobility of . The lowerelectrophoretic mobility of the second protein makessense because it takes longer for this protein to migratethrough the system. The migration velocities for theseproteins can be found by simply dividing their distanceof travel by their migration times , whichgives (22.0 cm/15.3 min) = 1.44 cm/min and (22 cm/16.2 min) = 1.36 cm/min for proteins 1 and 2.
(v = Ld>tm)
1.70 cm2>kV # min
Protein 1: m =
(22.0 cm>15.3 min)
(20.0 kV>25.0 cm)= 1.80 cm2>kV # min
m =
vE
=
(Ld>tm)
(V>L)
Secondary Interactions. To obtain good separationsin electrophoresis it is often necessary to adjust the con-ditions of this method to change the electrophoreticmobility of a solute. We can accomplish this goal byusing secondary reactions that alter the charge or appar-ent size of the solute. If an analyte is a weak acid orweak base, for example, its net charge can be varied bychanging the pH. In the case of a weak monoprotic acid,the main species at a pH well below the pKa will be theneutral form of the acid (HA), while the dominantspecies at a pH much greater than the pKa will be thenegatively charged conjugate base . At an interme-diate pH, we will have a mixture of these two forms andthe average charge for all of these species will be some-where between “0” and “–1.” As a result, the overallobserved electrophoretic mobility for such a compound(as well as for other weak acids and weak bases) can beadjusted by varying the pH.
It is also possible to use side reactions to change theeffective size or charge of the analyte. This effect occursin a method known as sodium dodecyl sulfate polyacry-lamide gel electrophoresis (SDS-PAGE), which is a tech-nique for separating proteins according to their size (seeSection 23.4C). This analysis begins by first denaturingthe proteins and coating them with sodium dodecyl sul-fate, a negatively charged surfactant. The coatingprocess can be thought of as a type of complexation reac-tion. The negative coating not only alters the overallcharge but helps convert a protein into a rod-shapedstructure, which alters its size and shape.18,19
Another approach for altering the apparent elec-trophoretic mobility of an analyte is to use a solubilityequilibrium. As an example, we could include a secondphase within the running buffer into which the analytecan partition as it moves through the system (such asthrough the use of micelles, a method we will examinein Section 23.4C). Because the analyte in such a systemwill usually have different mobilities when it is presentin the running buffer or in the second phase, the parti-tioning of an analyte between these regions leads to achange in the analyte’s rate of travel through the elec-trophoretic system. Physical interactions can also affectanalyte migration. For instance, DNA sequencing by gelelectrophoresis uses a porous support to separate DNAstrands of different lengths. The same strategy is used inSDS-PAGE for protein separations.
(A-)
96943_23_ch23_p571-596 1/8/10 2:54 PM Page 575
576 Chapter 23 • Electrophoresis
Electroosmosis. Up until now we have examinedonly the direct movement of an analyte in an electricfield. It is also possible for the running buffer to movein such a field. This phenomenon can occur if there areany fixed charges present in the system, such as on theinterior surface of an electrophoretic system or on asupport within this system (see Figure 23.6). The pres-ence of these fixed charges attracts ions of oppositecharge from the running buffer and creates an electricaldouble layer at the surface of the support. In the pres-ence of an electric field, this double layer acts like a pis-ton that causes a net movement of the buffer toward theelectrode of opposite charge versus the fixed ionicgroups. This process is known as electroosmosis andresults in a net flow of the buffer and its contentsthrough the system.7
The extent to which electroosmosis affects the bufferand analytes in electrophoresis is described by using aterm known as the electroosmotic mobility (or ).7 Thisterm has the same units as the electrophoretic mobility .The value of depends on such factors as the size of theelectric field, the type of running buffer that is beingemployed, and the type of charge that is present on thesupport. This relationship is described by Equation 23.4,
(23.4)
where E is the electric field, and are the dielectric con-stant and viscosity of the running buffer, and is the zetapotential (which represents the charge on the support).
Depending on the direction of buffer flow, electroos-mosis can work either with or against the inherent migra-tion of an analyte through the electrophoretic system. The
z
he
meo = Ae zE B >h
meo
m
meo
overall observed electrophoretic mobility for ananalyte will be equal to the sum of its own electrophoreticmobility and the mobility of the running buffer due toelectrosmotic flow .
(23.5)
In gel electrophoresis, electroosmotic flow is often smallcompared to the inherent rate of analyte migration. Thisis not usually true in capillary electrophoresis, where thesupport has a relatively large charge and high surfacearea compared to the volume of running buffer (seeSection 23.3).
23.2B Factors Affecting Band-Broadening
The same terms used to describe efficiency in chromatogra-phy (e.g., the number of theoretical plates N and the heightequivalent of a theoretical plate H) can be used to describeband-broadening in electrophoresis. Two particularlyimportant band-broadening processes in electrophoresisare (1) longitudinal diffusion and (2) Joule heating.
Longitudinal Diffusion. You may recall from Chapter 20that longitudinal diffusion occurs when a solute diffusesaway from the center of its band along the direction oftravel, causing this band to broaden over time and tobecome less concentrated. One factor that affects the extentof this band-broadening is the “size” of the diffusing solute,or its solvated radius. Because larger analytes have slowerdiffusion, they will be less affected by longitudinal diffusionthan smaller substances. The rate of this diffusion will alsodecrease as we increase the viscosity of the running bufferor lower the temperature of the system.
mNet = m + meo
(meo)(m)
(mNet)
(�)(�)
Electroosmosis
Fixed chargeson support wall
Ions indouble layer
Other ions inrunning buffer
�
�
� � � � � � � �
�
�
�
�� � �
�� �
�
� � � � �
��
��
��
�
�
�
FIGURE 23.6 The production and effects of electroosmosis. This particular exampleshows a support that has a negatively charged interior. Such a situation is oftenencountered when working with a support that is an uncoated silica capillary. Theinterior wall of this capillary has silanol groups at its surface, which can act as weakacids and form a conjugate base with a negative charge. The extent of electroosmosisin this case will depend on the pH of the running buffer, because this will affect therelative amount of the silanol groups that are present in their neutral acid form orcharged conjugate base form.
96943_23_ch23_p571-596 1/8/10 2:54 PM Page 576
Section 23.3 • Gel Electrophoresis 577
The extent of longitudinal diffusion will depend onthe amount of time that is allowed for this process tooccur.10 This time, in turn, will be affected in elec-trophoresis by the size of the electric field, because lowerelectric fields result in smaller migration velocities andlonger migration times.22 Electroosmosis will also affectthe time needed for an electrophoretic separation and dif-fusion. If electroosmosis moves in a direction opposite tothat desired for the separation of analytes, the effectiverate of travel for these analytes is decreased and the timeallowed for longitudinal diffusion is increased. If elec-troosmosis instead occurs in the same direction as analytemigration, longitudinal diffusion is decreased.
One way we can minimize the effects of longitudi-nal diffusion in electrophoresis is to have an analytemove through a porous support. If the pores of this sup-port are sufficiently small, they will inhibit the move-ment of analytes due to diffusion and help providenarrower bands. If the pore size becomes too small, asize-based separation will also be created. Although thislast feature is not always desirable, in some cases it canbe an advantage, such as in the sequencing of DNA bygel electrophoresis.
Joule Heating. The most important band-broadeningprocess in electrophoresis is often Joule heating.21-23 Thisprocess is caused by heating that occurs whenever anelectric field is applied to the system. According to Ohm’slaw (see Chapter 14), placing a voltage V across a mediumwith a resistance of R requires that a current of I be pres-ent to maintain this voltage across the medium.10
(23.6)
As current flows through the system, heat is gener-ated. This heat production depends on the voltage, cur-rent, and time t the current passes through the system, asshown below.
(23.7)
As heat is produced, the temperature of the elec-trophoretic system will begin to rise. This rise in tempera-ture will increase longitudinal diffusion and lead toincreased band-broadening. In addition, if the heat is notdistributed uniformly throughout the electrophoretic sys-tem, the temperature will not be the same throughout thesystem. An uneven temperature will lead to regions withdifferent densities (causing mixing) and different rates ofdiffusion, which results in even more band-broadening.Other problems created by an increase in temperatureinclude possible degradation of the analytes or compo-nents of the system and the evaporation of solvent fromthe running buffer, the latter of which can alter the pHand composition of the buffer. All of these factors lead to aloss of reproducibility and efficiency in the system.
One way Joule heating can be decreased is by using alower voltage for the separation. A lower voltage, how-ever, will lower the migration velocities of analytes andgive longer separation times. An alternative approach is to
Heat = V # I # t
Ohm’s law: V = I # R
use more efficient cooling for the system, which wouldallow higher voltages to be used and provide shorter sepa-ration times. Another possibility is to add a support to theelectrophoretic system that minimizes the effects of Jouleheating due to uneven heat distribution and density gradi-ents in the running buffer. Examples of these approacheswill be given later when we examine the methods of gelelectrophoresis and capillary electrophoresis.
Another factor that affects Joule heating is the ionicstrength of the running buffer. A lower ionic strength forthis buffer will lower heat production, because at lowionic strengths there are fewer ions in this buffer. Thislower ionic strength creates a greater resistance R to cur-rent flow at any given voltage because fewer ions areavailable to carry the current. We can see from Ohm’s lawin Equation 23.6 that as R increases a smaller current isneeded at voltage V. This smaller current, in turn, willcreate lower heat production, as shown by Equation 23.7.
Other Factors. Eddy diffusion (a process we discussedin Chapter 20 for chromatography) is another factor thatcan sometimes lead to band-broadening in electrophore-sis. This type of band-broadening can occur if a supportis used to minimize the effects of Joule heating, a situa-tion that creates multiple flow paths for analytes throughthe support. If the support interacts with analytes, band-broadening due to these secondary interactions will beintroduced as well; this extra band-broadening alsooccurs when secondary interactions are used to adjustanalyte mobility, such as complexation reactions or parti-tioning into a micelle. These latter effects are similar tothose described in Chapter 20 for stationary phase masstransfer in chromatography. Broadening of the peaksbefore or after separation can be another issue when deal-ing with highly efficient systems, such as those used incapillary electrophoresis.
Wick flow is another source of band-broadening thatoccurs in gel electrophoresis.19 In such a system, the gel iskept in contact with the electrodes and buffer reservoirsthrough the use of wicks. Because this support is oftenopen to air, the presence of any Joule heating will lead tosome evaporation of solvent in the running buffer fromthe support. As this solvent is lost, it is replenished by theflow of more solvent through the wicks and from thebuffer reservoirs. This flow leads to a net movement ofbuffer from each reservoir towards the center of the sup-port. The rate of this flow depends on the rate of solventevaporation, so it will increase with the use of a high volt-age or high current. The extent of this flow varies acrossthe support, with the fastest rates occurring furthest fromthe center of the support.
23.3 GEL ELECTROPHORESIS
23.3A What Is Gel Electrophoresis?
One of the most common types of electrophoresis is themethod of gel electrophoresis. This technique is an elec-trophoretic method that is performed by applying a sample
96943_23_ch23_p571-596 1/8/10 2:54 PM Page 577
578 Chapter 23 • Electrophoresis
to a gel support that is then placed into an electric field.17–20
Typical separations obtained by gel electrophoresis wereshown previously in Figures 23.1 and 23.4. In this type ofsystem, several samples are usually applied to the gel andallowed to migrate along the length of the support in thepresence of an applied electric field. The separation isstopped before analytes have left the end of the gel, withthe location and intensities then being determined.
It is important to remember in gel electrophoresisthat the velocity of an analyte’s movement will be relatedto the distance it has traveled in the given separation time(as represented by the migration distance). The fartherthis distance is from the point of sample application, thehigher the migration velocity is for the analyte and thelarger its electrophoretic mobility. This migration dis-tance will, in turn, be related to the size and charge of theanalyte and can be used in identifying such a substance.
23.3B How Is Gel Electrophoresis Performed?
Equipment and Supports. Some typical systems forcarrying out gel electrophoresis are shown in Figure 23.7.These systems may have a support that is held in either avertical or horizontal position. This support contains arunning buffer with ions that carry a current through thesupport when an electric field is applied. To replenish thisbuffer and its components as they move through the sup-port or evaporate, the ends of the support are placed incontact with two reservoirs that contain the same buffersolution and the electrodes. Once samples have beenplaced on the support, the electrodes are connected to apower supply and used to apply a voltage across the sup-port. This electric field is passed through the system for agiven amount of time, causing the sample components tomigrate. After the electric field has been turned off, the gelis removed and examined to locate the analyte bands.
The type of support we use in such a system willdepend on our analytes and samples.17,19 Celluloseacetate, filter paper, and starch are useful supports forwork with relatively small molecules, like amino acids andnucleotides. Electrophoresis involving large molecules can
be carried out on agarose, a support that we discussed inChapter 22. The resulting approach is known as “agaroseelectrophoresis.” In addition to its low nonspecific bindingfor many biological compounds, agarose has a low inher-ent charge. Agarose also has relatively wide pores thatallow it to be employed in work with large molecules, suchas during the sequencing of DNA.
The most common support used in gel electrophoresisis polyacrylamide. This combination is often referred to as polyacrylamide gel electrophoresis, or PAGE.17–19
Polyacrylamide is a synthetic, transparent polymer that isprepared as shown in Figure 23.8. It can be made with avariety of pore sizes that are smaller than those in agaroseand of a size more suitable for the separation of proteins andpeptide mixtures. Like agarose, polyacrylamide has lownonspecific binding for many biological compounds anddoes not have any inherent charged groups in its structure.
Sample Application. The samples in gel electrophore-sis are applied to small “wells” that are made in the gelduring its preparation (see Figures 23.4 and 23.7). A sam-ple volume of 10–100 µL is then placed into one of thesewells by using a micropipette. These sample volumeshelp provide a sufficient amount of analyte for laterdetection and collection, but they also create a danger ofintroducing band-broadening by creating a large sampleband at the beginning of the separation.
A common approach to create narrow sample bandsis to employ two types of gels in the system: a “stackinggel” and a “running gel.”19 The running gel is the supportused for the electrophoretic separation of substances in thesample. In a vertical gel electrophoresis system, this gel isformed first and is located throughout the middle andlower section of the system (see right-hand portion ofFigure 23.7). The stacking gel has a lower degree of cross-linking (giving it larger pores) and is located on top of therunning gel. The stacking gel is also the section of the sup-port in which the sample wells are located. After a samplehas been placed in the wells and an electric field has beenapplied, analytes will travel quickly through the stackinggel until they reach its boundary with the running gel.
Vertical gel electrophoresis systemHorizontal gel electrophoresis system
FIGURE 23.7 Horizontal (image on the left) and vertical (image on the right) gel electrophoresissystems. (Reproduced with permission from Thermo Fisher Scientific)
96943_23_ch23_p571-596 1/8/10 2:54 PM Page 578
Section 23.3 • Gel Electrophoresis 579
NH
NH
H2C
Ammonium Persulfate/TEMED
Bisacrylamide
Polyacrylamide
Acrylamide
NH2
H2C
NH
NH
O
O
CONH2CONH2
CONH2
CONH2
CONH2CONH2CONH2
CONH2
O O�
O
FIGURE 23.8 Preparation of a polyacrylamide gel. In thisreaction, acrylamide is used as the monomer andbisacrylamide is used as a cross-linking agent. The reaction ofthese two agents is begun by adding ammonium persulfate,where persulfate forms sulfate radicals thatcause the acrylamide and bisacrylamide to combine. N,N,N ,N -Tetramethylethylenediamine (TEMED) is added to thismixture as a reagent that stabilizes the sulfate radicals. Thesize of the pores that are formed in the polyacrylamide gelwill be related to how much bisacrylamide is used vs.acrylamide. As the amount of bisacrylamide is increased, morecross-linking occurs and smaller pores are formed in the gel.As less bisacrylamide is used, larger pores are formed, but thegel also becomes less rigid.
¿
¿
(SO4 -)(S2O8
2-)
These substances will then travel much more slowly,allowing other parts of the sample to catch up and to forma narrower, more concentrated band at the top of the run-ning gel. The result is a system that can use larger samplevolumes without introducing significant band-broadeninginto the final electrophoretic separation.
Detection Methods. There are several ways analytescan be detected in gel electrophoresis. Analyte bands canbe examined directly on the gel or they can be transferredto a different support for detection. Direct detection cansometimes be performed visually (when dealing withintensely colored proteins like hemoglobin) or by usingabsorbance measurements and a scanning device knownas a densitometer.9,20
The most common approach for detection in gel elec-trophoresis is to treat the support with a stain or reagentthat makes it easier to see the analyte bands. Examples ofstains that are used for proteins are Amido black,Coomassie Brilliant Blue, and Ponceau S. These stains areall highly conjugated dyes with large molar absorptivities(see Chapter 18). Silver nitrate is used in a method knownas silver staining to detect low concentration proteins. DNAbands can be detected by using ethidium bromide (seeChapter 2). When separating enzymes, the natural cat-alytic ability of these substances can be employed for their
detection, as occurs when using the fluorescent compoundNAD(P)H to detect enzymes that generate this substancein their reactions.19,20
Another possible approach for detection in gel elec-trophoresis is to transfer a portion of the analyte bands toa second support (such as nitrocelluose), where they arereacted with a labeled agent. This approach is known as“blotting.”19 There are several blotting methods. Onesuch method is a Southern blot (named after its discov-erer Edwin Southern, a British biologist).24 A Southernblot is used to detect specific sequences of DNA by hav-ing these sequences bind to an added, known sequence ofDNA that is labeled with a radioactive tag or with alabel that can undergo chemiluminescence. A Northernblot (which was developed after the Southern blot) issimilar, but is instead used to detect specific sequences ofRNA by using a labeled DNA probe.25
Another type of blotting method is a Westernblot.26,27 A Western blot is used to detect specific proteinson an electrophoresis support. In this technique, proteinsare first separated on a support by electrophoresis andthen blotted onto a second support like nitrocellulose ornylon. The second support is then treated with labeledantibodies that can specifically bind the proteins of inter-est. After the antibodies and proteins have been allowedto form complexes, any extra antibodies are washedaway and the remaining bound antibodies are detectedthrough their labels, indicating whether there is any ofthe protein of interest present. This method is used toscreen blood for the HIV virus by looking for the pres-ence of proteins from this virus in samples.
There also has been growing interest in the use ofinstrumental methods for analyzing bands on elec-trophoresis supports. For instance, mass spectrometry isbecoming a popular method for determining the molecu-lar mass of a protein in a particular band. Such an analy-sis is accomplished by removing a portion of the bandfrom the gel (or sometimes by looking at the gel directly)and examining this band by matrix-assisted laserdesorption/ionization time-of-flight mass spectrometry(MALDI-TOF MS) (see Box 23.1). This approach makes itpossible to identify a particular analyte (such as a pro-tein) by its molecular mass even when there are manysimilar analytes in a sample.
23.3C What Are Some Special Types of Gel Electrophoresis?Sodium Dodecyl Sulfate Polyacrylamide GelElectrophoresis. Whenever a porous support is pres-ent in an electrophoretic system, it is possible that largeanalytes may be separated based on their size as well astheir electrophoretic mobilities. This size separationoccurs in a manner similar to that which occurs in size-exclusion chromatography and can be used to determinethe molecular weight of biomolecules. This type ofanalysis is accomplished for proteins in a techniqueknown as sodium dodecyl sulfate polyacrylamide gelelectrophoresis, or SDS-PAGE (see Figure 23.10).18,19
(32P)
96943_23_ch23_p571-596 1/8/10 2:54 PM Page 579
580 Chapter 23 • Electrophoresis
In SDS-PAGE, the proteins in a sample are first dena-tured and their disulfide bonds broken through the use of areducing agent. This pretreatment converts the proteinsinto a set of single-stranded polypeptides. These polypep-tides are then treated with sodium dodecyl sulfate (SDS), asurfactant with a nonpolar tail and a negatively chargedsulfate group. The nonpolar end of this surfactant coatseach protein, forming roughly linear rods that have an exte-rior layer of negative charge. The result for a mixture ofproteins is a series of rods with different lengths but similarcharge-to-mass ratios. Next, these protein rods are passedthrough a porous polyacrylamide gel in the presence of anelectric field. The negative charges on these rods (from theSDS coating) cause them to all move toward the positiveelectrode, while the pores of the gel allow small rods totravel more quickly to this electrode than large rods.
At the end of an SDS-PAGE run, the positions ofprotein bands from a sample are compared to thoseobtained for known protein standards applied to thesame gel. This comparison is made either qualitatively orby preparing a calibration curve. The calibration curve istypically prepared by plotting the log of the molecularweight (MW) for the protein standards versus theirmigration distance (dm) or retardation factor (Rf). The retar-dation factor for an analyte band in SDS-PAGE is calcu-lated by using the ratio of a protein’s migration distanceover the migration distance for a small marker com-pound (ds), where . The resulting plot oflog(MW) versus dm or Rf gives a curved response with anintermediate linear region for proteins with sizes that areneither totally excluded from the pores nor able to accessall pores in the support.
Rf = dm>ds
BOX 23.1
Matrix-Assisted Laser Desorption/Ionization Time-of-Flight Mass Spectrometry
Matrix-assisted laser desorption/ionization time-of-flight massspectrometry (MALDI-TOF MS) is a type of mass spectrometry inwhich a special matrix capable of absorbing light from a laser isused for chemical ionization. The term “MALDI” was first used in1985 to describe the use of a laser to cause ionization of theamino acid alanine in the presence of tryptophan (the “matrix” inthis case).28 In 1988 it was shown almost simultaneously by tworesearch groups, one in Germany and one in Japan, that MALDI-TOF MS could also be employed in work with large biomolecules,such as proteins.29,30 The value of this method was recognized in2002 when members of both these groups shared the NobelPrize in chemistry for the development of this technique.
Figure 23.9 shows the typical way in which a sample isanalyzed by MALDI-TOF MS. First, the sample is mixed with amatrix that can readily absorb UV light. This mixture is thenplaced on a holder in the MALDI-TOF instrument, where pulsesof a UV laser are aimed at the sample and matrix. As the matrix
absorbs some of this light, it transfers its energy to molecules inthe sample, causing these to form ions. These ions are thenpassed through an electric field into a time-of-flight mass ana-lyzer, where ions of different mass-to-charge ratios will travel atdifferent velocities. The number of ions arriving at the otherend is measured at various times, allowing a mass spectrum tobe obtained for analytes in the sample.31
MALDI-TOF MS is a soft ionization approach that resultsin a large amount of molecular ions and few, if any, fragmentions for most analytes. This method also has a low backgroundsignal, a high mass accuracy, and can be used over a widerange of masses. These properties make MALDI-TOF MS valu-able in the study and identification of proteins after they havebeen separated by techniques like SDS-PAGE or 2-dimensional(2-D) electrophoresis (see Section 23.3). MALDI-TOF MS canalso be used to look at peptides, polysaccharides, nucleic acids,and some synthetic polymers.31,32
Sample ions(to mass spectrometer)
Sample in matrix thatabsorbs UV light
Pulsed N2laser beam(337 nm)
�
�
�
�
�
�
�
�
Drift tubeDetector
Electric field
Laser
Ionizationchamber
FIGURE 23.9 The analysis of a sample by MALDI-TOF MS. Theindividual steps in this analysis are described in the text.
96943_23_ch23_p571-596 1/8/10 2:54 PM Page 580
Section 23.3 • Gel Electrophoresis 581
mobility will become zero, causing the analyte to stopmigrating.1 The result is a series of tight bands, whereeach band appears at the point where pH = pI for agiven zwitterion.
The reason isoelectric focusing produces tightbands for these analytes is that even if a zwitterionmomentarily diffuses out of the region where the pH isequal to its pI, the system will tend to “focus” the zwitte-rion back into this region (see Figure 23.11). This focusingoccurs because of the way the pH gradient is alignedwith the electric field. High pH’s occur toward the nega-tive electrode, so as solutes diffuse out of their band and
Denature proteins and reduce disulfide bonds
Coat proteins with SDS
Protein separation
Sample pretreatment
(a)
(b)(�)
Sample 1(�)
Sample 2Standard
High MW
Low MW
Protein migration
�
��
�� �
��
��
��
� � � �
��
FIGURE 23.10 Preparation of proteins and their separation by sodium dodecylsulfate polyacrylamide gel electrophoresis (SDS-PAGE).
EXERCISE 23.2 Using SDS-PAGE for Estimatingthe Molecular Mass of a Protein
The proteins in the standard in Figure 23.10 have molecu-lar weights (from top-to-bottom) of 200, 116, 97, 66, 45, 31,23, and 14 kDa. What are the molecular weights of theproteins in sample 1?
SOLUTION
The first band in sample 1 is at approximately the same loca-tion as the 66 kDa band in the standard sample. The secondband in sample 1 appears between the 45 kDa and 31 kDabands in the standard, giving this second protein a mass ofroughly 38 kDa. A similar analysis for the second samplegives proteins with estimated masses of 31 and 97 kDa.
Isoelectric Focusing. Another type of electrophore-sis that often employs supports is isoelectric focusing(IEF).10 IEF is a method used to separate zwitterions(substances with both acidic and basic groups, as dis-cussed in Chapter 8). Zwitterions are separated in IEFbased on their isoelectric points by having these com-pounds migrate in an electric field across a pH gradi-ent. In this pH gradient, each zwitterion will migrateuntil it reaches a region where the pH is equal to itsisoelectric point. At this point, the zwitterion will nolonger have any net charge and its electrophoretic
(�) (�)
� �
�
�
� �� �
(�) (�)
Low
High
pH
pH � pI
pH � pI
pH � pI
FIGURE 23.11 Isoelectric focusing.
96943_23_ch23_p571-596 1/8/10 2:54 PM Page 581
582 Chapter 23 • Electrophoresis
toward this region they will take on a more negativecharge and be attracted back to the positive electrode. Atthe same time, zwitterions that move toward the positiveelectrode and region of lower pH will acquire a more pos-itive charge and be attracted back toward the negativeelectrode. It is this focusing property that makes it possi-ble for IEF to separate zwitterions with only very smalldifferences in their pI values.
To obtain a separation in IEF, it is necessary to havea stable pH gradient. This pH gradient is produced byplacing in the electric field a mixture of small reagentzwitterions known as ampholytes. These are usuallypolyprotic amino carboxylic acids with a range of pKavalues.6 When these ampholytes are placed in an electricfield, they will travel through the system and align in theorder of their pKa values. The result is a pH gradient thatcan be used directly or by cross-linking the ampholytes toa support to keep them stationary in the system.
IEF is a valuable tool for separating proteins orother compounds that contain both positive and negativecharges. These include some drugs, as well as bacteria,viruses, and cells. Applications of this method rangefrom biotechnology and biochemistry to forensic analysisand paternity testing. IEF is particularly useful in provid-ing high-resolution separations between different formsof enzymes or cell products. For instance, it is possiblewith this method to separate proteins with differences inpI values as small as 0.02 pH units.
2-Dimensional Electrophoresis. Another way gelelectrophoresis can be utilized is in two-dimensional (or2-D) electrophoresis, which is a high-resolution tech-nique used to look at complex protein mixtures.19,33 Inthis method, two different types of electrophoresis areconducted on a single sample. The first of these separa-tions is usually based on a isoelectric point, as accom-plished by using isoelectric focusing. The secondseparation method (SDS-PAGE) is according to size.
A typical 2-D electrophoresis method is illustratedin Figure 23.12. First, a small band of sample is appliedto the top of a support for use in isoelectric focusing.The support used in this case is typically agarose or apolyacrylamide gel with large pores. After this firstseparation has been finished, some proteins will havebeen separated based on their pI values, but there maystill be many proteins with similar isoelectric pointsand overlapping bands. A further separation isobtained by turning this first gel on its side and placingit at the top of a second support (a polyacrylamide gel)for use in SDS-PAGE. This process gives a separationaccording to size, in which each band from the first sep-aration has its own lane on the SDS-PAGE gel. Theresult is a series of peaks that are now separated in twodimensions (one based on pI and the other on size)across the gel. The fact that two different characteristicsof each protein are used in their separation makes itpossible to resolve a much larger number of proteinsthan is possible by either IEF or SDS-PAGE alone.
After a 2-D separation has been finished, the proteinbands can be detected using the methods discussed inSection 23.3B. Staining with Coomassie blue or silvernitrate is often used in the location and measurement ofthese bands. Analysis by mass spectrometry is anotheroption. Other issues to consider are the interpretationand analysis of the many protein bands that can occur ina single sample. This analysis requires the use of comput-ers to help image and catalog the location of each bandand to correlate this information with that obtained byother methods, such as mass spectrometry.
23.4 CAPILLARY ELECTROPHORESIS
23.4A What Is Capillary Electrophoresis?
Another type of electrophoresis is the method ofcapillary electrophoresis (CE). CE is a technique thatseparates analytes by electrophoresis and that is carriedout in a capillary. This method was first reported in thelate 1970s and early 1980s and is sometimes known as“capillary zone electrophoresis.”23,34 CE in its currentform is typically conducted in capillaries with innerdiameters of 20–100 µm and lengths of 20–100 cm.7 Theuse of these narrow-bore tubes provides efficient removalof Joule heating by allowing this heat to be quickly dissi-pated to the surrounding environment.8,17,23 Thisremoval of heat helps to decrease band-broadening andprovides much more efficient and faster separations thangel electrophoresis (see Figure 23.13).
One reason capillary electrophoresis is more efficientthan gel electrophoresis is that Joule heating is greatlyreduced as a source of band-broadening. Also, capillaryelectrophoresis is often used with no gel or support pres-ent, which eliminates eddy diffusion and secondary inter-actions with the support (other than the capillary wall).The result is that longitudinal diffusion now becomes themain source of band-broadening. Under these conditions,
(�) (�)
(�) (�)
Second separationSDS-Page
First separationIsoelectric focusing
Low pH/pI
High pH/pI
Separateby pI
Low MW
High MW
Separateby MW
FIGURE 23.12 Two-dimensional gel electrophoresis, using acombination of isoelectric focusing and SDS-PAGE as an example.
96943_23_ch23_p571-596 1/8/10 2:54 PM Page 582
Section 23.4 • Capillary Electrophoresis 583
Time (min)0 222015
C
G
H
E
D
A,B
IF
KL
J
105
Res
pons
e
FIGURE 23.13 An early example of capillary electrophoresis, usedhere use for the separation of dansylated amino acids (representedby peaks A–L). (Reproduced with permission from J.W. Jorgensonand K.D. Lukacs, “Capillary Zone Electrophoresis,” Science, 222(1983) 266–272.)
the number of theoretical plates (N) expected for this sys-tem is given by the following equations,
(23.8)
where D is the diffusion coefficient of the analyte, is theelectrophoretic mobility of the analyte, E is the electricfield strength, L is the total length of the capillary, Ld isthe distance from the point of injection to the detector,and V is the applied voltage (where E = V/L).8
Equation 23.8 shows that the value of N (represent-ing the efficiency of the CE system) will increase as we usehigher electric fields and voltages. This result makes sensebecause higher electric fields will cause the analyte tomigrate faster and spend less time in the capillary. Theseshorter migration times will decrease band-broadeningbecause less time is allowed for longitudinal diffusion.The result is a fast separation with a high efficiency andnarrow peaks.
m
N =
mELd
2D or N =
mVLd
2DL
20.0 kV and at 30.0 kV? What factors may cause lowervalues for N to be obtained?
SOLUTION
We can use Equation 23.8 along with the conditions givenin Exercise 23.1 and the electrophoretic mobility calcu-lated earlier for protein 1 to get the expected value for Nat 20.0 kV.
If we increase the applied voltage from 20.0 to 30.0 kV(or by 1.5-fold), Equation 23.8 indicates we will see aproportional increase of 1.5-fold in N from to
. Factors that might give lower platenumbers include the presence of adsorption betweenthe protein and capillary wall, extra-column band-broadening, or an increase in Joule heating as the volt-age is increased.
1.9 : 106 plates1.3 * 106
= 1.3 * 106 theoretical plates
N =
A1.80 cm2>kV # min B # 20.0 kV # 22.0 cm
2 # A2.0 * 10-7cm2>s B # (60 s>min) # 25.0 cm
EXERCISE 23.3 The Effect of Electric FieldStrength on Efficiency inCapillary Electrophoresis
The protein 1 in Exercise 23.1 has a diffusion coefficientof approximately in its running buffer.If longitudinal diffusion is the only significant band-broadening process present during the separation ofthis protein by capillary electrophoresis, what is themaximum number of theoretical plates that would beexpected for this protein’s peak at an applied voltage of
2.0 * 10-7 cm2>s
Besides providing efficient separations, we haveseen that the use of high electric fields in capillary elec-trophoresis also reduces the time needed for a separa-tion. This relationship can be shown by rewritingEquation 23.3 to give the expected migration time for ananalyte in terms of the electric field, the electrophoreticmobility of the analyte, and the length of the capillary.
(23.9)
For instance, Equation 23.9 indicates that the migrationtime for the protein in Exercise 23.3 will decrease by1.5-fold (from 15.3 to 10.2 min) if we increase theapplied voltage from 20.0 to 30.0 kV. The result is a sit-uation in which we can improve both the efficiency andspeed of a separation by increasing the voltage. Thisfeature has made capillary electrophoresis popular forthe analysis of complex samples, such as those used inDNA sequencing. Unfortunately, there is a limit to howhigh the voltage can be increased before Joule heatingagain becomes important. Most CE systems are capableof using voltages of up to 25–30 kV, but significantJoule heating can appear at lower voltages.
23.4B How Is Capillary ElectrophoresisPerformed?
Equipment and Supports. Besides being faster andmore efficient than gel electrophoresis, capillary elec-trophoresis is easier to perform as part of an instrumen-tal system. An example of a CE system is shown inFigure 23.14.8,21 Along with the capillary, this systemincludes a power supply and electrodes for applying theelectric field, two containers that create a contact
tm =
LdL
mV=
Ld
mE
96943_23_ch23_p571-596 1/8/10 2:54 PM Page 583
584 Chapter 23 • Electrophoresis
between these electrodes and the solution within thecapillary, an on-line detector, and a means for injectingsamples onto the capillary. Because these instrumentscan use voltages of up to 25–30 kV, they include safetyfeatures that protect the user from the high-voltageregion and that can turn off this voltage when the systemis opened for maintenance or the insertion of samplesand reagents.
The capillary in a CE system is typically made of fusedsilica. This capillary can be used directly or it can be modi-fied to place various coatings on its interior surface. Anuncoated silica capillary can lead to a significant amount offlow due to electroosmosis when working at a neutral orbasic pH, due to deprotonation of the silica’s surface silanolgroups. One useful feature of this electroosmosis is it tendsto cause all analytes, regardless of their charge, to travel inthe same direction through the CE capillary. This effectmeans that a sample containing many types of ions can beinjected at one end of the capillary (at the positive elec-trode), with electroosmosis then carrying these through tothe other end (to the negative electrode) and past an on-linedetector. This format is called the “normal polarity mode” ofCE.8 It is important to remember in this situation that a sep-aration of ions will still occur, but that the observed mobilitywill now be equal to the sum of an analyte’s inherent elec-trophoretic mobility plus the mobility created by electroos-mosis (see Equation 23.5). This effect on observed mobilitywill, in turn, affect the observed migration time and the effi-ciency and resolution obtained for the separation.
Although many analytes will travel in the samedirection as electroosmotic flow through a CE system, itis possible for some to have migration rates faster thanelectroosmosis, which will carry them in the opposite
direction. The analysis of these ions in a silica capillary isperformed by injecting them at the end by the negativeelectrode and allowing them to migrate toward the posi-tive electrode and against electroosmotic flow. Thismethod is known as the “reversed polarity mode” of CE.8
In addition, electroosmotic flow can be altered by chang-ing the pH (which changes the degree of deprotonationand charge on silica), or by placing a coating on the sur-face of the support. In this second case, a neutral coatinghelps to reduce electroosmosis while a positively chargedcoating will reverse the direction of this flow toward thepositive rather than negative electrode.
Injection Techniques. There are two features of capillaryelectrophoresis that place special demands on how samplescan be injected. First, the small volume of a CE capillarymust be considered. A typical 50 µm I.D. 25 cm long cap-illary for CE will contain only of running buffer.Another factor to consider is the high efficiency of capillaryelectrophoresis. Both of these factors restrict the sample vol-umes that can be injected without introducing significantband-broadening (< 10 nL for a volume capillary).8
There are two techniques that make it possible toinject these small sample volumes onto a CE system. Thefirst technique is hydrodynamic injection, which uses a dif-ference in pressure to deliver a sample to the capillary.This method can be carried out by placing one end of thecapillary into the sample in an enclosed chamber andapplying a pressure to this chamber for a fixed period oftime, where the amount of injected sample will depend onthe size of the pressure difference and the amount of timethat this pressure is applied. Once the sample has enteredthe capillary, the separation is begun after the capillary
0.5 mL
0.5 mL*
Net migration
Data acquisition(and control)
Detector
High voltagepower supply
Capillary
Inletreservioror sample
Outletreservior
(�) Electrode(�) Electrode
FIGURE 23.14 General design of a capillary electrophoresis system, and a commercial instrument forcapillary electrophoresis. (The picture on the right is courtesy of Beckman Instruments.)
96943_23_ch23_p571-596 1/8/10 2:54 PM Page 584
Section 23.4 • Capillary Electrophoresis 585
Conditions after sample stacking
Initial conditions
Separation buffer(higher ionic strength
and conductivity)
Sample(low ionic strengthand conductivity)
Sample and bufferinterface
(�)(�)
(�)(�)
�
�
�
�
�
�
�
�
FIGURE 23.15 Principle of sample self-stacking.
has been put back into contact with the running bufferand electrodes. A second technique that allows the injec-tion of small sample volumes is electrokinetic injection. Thismethod again begins by placing the capillary into thesample, but an electrode is also now in contact with thesample. When an electric field is applied across the capil-lary, electroosmostic flow and the electrophoretic mobilityof the analytes cause them to enter the capillary. Theamount of each analyte that is injected in this method willdepend on the analyte’s electrophoretic mobility, the elec-tric field, and the time over which this field is applied.8
There are various methods for concentrating sam-ples and providing narrow analyte bands in CE. Onesuch method is sample stacking (see Figure 23.15).21
Sample stacking occurs when the ionic strength (andtherefore the conductivity) of the sample is less than thatof the running buffer. When an electric field is applied tosuch a system, analytes will migrate quickly through thesample matrix until they come to the boundary betweenthe sample and running buffer. Because the runningbuffer has a higher ionic strength than the sample, therate of analyte migration decreases at this boundary. Thisdecrease in migration rate causes the analytes to concen-trate into a narrower band as they enter the runningbuffer. The overall effect is similar to what occurs whenusing stacking gels in traditional electrophoresis.
Detection Methods. Examples of detection methodsthat are used for capillary electrophoresis are shown inTable 23.1. Many of these methods are also used in liquidchromatography (see Chapter 22).8,21 An important dif-ference between detection in LC and CE is the need inCE for methods that can work with very small samplesizes. This need is a result of the small injection volumesthat are required in capillary electrophoresis to avoidexcessive band-broadening. Selective monitoring meth-ods that work well for this purpose are electrochemicaland fluorescence detection. Ultraviolet-visible (UV-vis)absorbance, conductance, and mass spectrometry detec-tion are also often employed in CE.
Another difference between detection in LC andCE concerns how their signals vary with analyte reten-tion or migration. In LC, all analytes pass at the sameflow rate (that of the mobile phase) through the detec-tor and spend the same amount of time in this device.This effect makes it possible to directly compare thepeak areas of two analytes with different retentiontimes. However, in capillary electrophoresis analyteswith different migration times also spend differentamounts of time in the detector. A correction must bemade for this difference if we wish to compare theareas of two analytes in the same CE run. We can makethis adjustment by using a corrected peak area (Ac),which is equal to the ratio of the measured peak area(A) for an analyte divided by its migration time.
(23.10)Ac = A>tm
TABLE 23.1 Properties of Common Capillary Electrophoresis Detectors*
Detector Name Compounds Detected Detection Limits
General detectors
Ultraviolet-visible (UV/vis) absorbance detector Compounds with chromophores 10-13–10-16 mol
Electrochemical detector Electrochemically active compounds 10-18–10-19 mol
Structure-specific detectors
Mass spectrometry Compounds forming gas-phase ions 10-16–10-17 mol
*These data are for commercial instruments.
96943_23_ch23_p571-596 1/8/10 2:54 PM Page 585
586 Chapter 23 • Electrophoresis
This correction allows areas for different analytes to becompared, as well as areas that are obtained for the sameanalyte under different electrophoretic conditions.
Along with the various detection methods we dis-cussed for liquid chromatography in Chapter 22, anotherdetection approach that is used in capillary electrophoresisis laser-induced fluorescence (LIF).6,8,21 This methodemploys a laser to excite a fluorescent compound, allowingthe detection of this agent through its subsequent emissionof light. There are several advantages to using a laser as theexcitation source. First, the laser is monochromatic and hasa high intensity, which allows for the selective and strongexcitation of a compound with an excitation spectrum thatoverlaps with the emission wavelength of the laser. Also,the laser beam can be focused as a very narrow beam. Thisfeature is extremely valuable in work with the small-borecapillaries found in capillary electrophoresis. One limita-tion of LIF detection is it does require an analyte that is nat-urally fluorescent or that can be converted into a fluorescentderivative. This second option makes use of a fluorescenttag like fluorescein or rhodamine (see Chapter 18).
LIF detection with CE was used in the automatedDNA sequencing systems that made early completion ofthe Human Genome Project possible. This detectioninvolved the use of several fluorescent dyes, one for each ofthe four terminating nucleotides present during the Sangerreaction. These labeled DNA strands were then separatedbased on their lengths by capillary electrophoresis (seeFigure 23.16). It was possible to further increase the speedof this analysis by using a single laser beam to simultane-ously examine a whole array of capillaries, each sequencinga different segment of DNA. The utilization of multiple
EXERCISE 23.4 Correcting Peak Areas forAnalyte Migration Times
Proteins 1 and 2 in Exercise 23.1 have measured areas of1290 and 1360 units at 20.0 kV when examined by anabsorbance detector. If it is known that these two proteinshave a similar response to the detector, what is the cor-rected area and relative amount of each protein in thegiven sample?
SOLUTION
The migration times for these proteins (given inExercise 23.1) are 15.3 min and 16.2 min. Placing thesedata into Equation 23.10 along with the measured peakareas gives the following results.
If these proteins have a similar response to the detector,then we can say from these corrected areas that there isapproximately the same amount of both proteins in thesample. If we had used the uncorrected areas for this cal-culation, we would have incorrectly concluded that pro-tein 2 was present at a greater level.
Protein 2: Ac,2 = A1360 B > A16.2 min B = 84.0
Protein 1: Ac,1 = A1290 B > A15.3 min B = 84.3
Relative migration time (scan no.)4800 5000 5200 5400
403020 5010A AAAAAAAAAT T T T T T T T TT TG G GG GGGGGGGGGG G C CCCCCCC CCCC C C
5600
Rel
ativ
e si
gnal
Detected Sequence
FIGURE 23.16 DNA sequencing by a capillary electrophoresis system. The top panel shows the original electrophoretic data, and thebottom panel shows the same data after they have been processed to determine the nucleotide sequence of the DNA segment beingexamined (as given by the symbols A, C, T, and G). (Based on data from J. Bashkin, in Capillary Electrophoresis of Nucleic Acids, K.R.Mitchelson and J. Cheng, Eds., Humana Press, Totowa, NJ, 2001, Chapter 7.)
96943_23_ch23_p571-596 1/8/10 2:54 PM Page 586
Section 23.4 • Capillary Electrophoresis 587
capillaries in a single CE system is known as capillary arrayelectrophoresis (CAE).6,7,35 Such a system can examine manyDNA sequences at the same time, which increases samplethroughput and lowers the cost per analysis.
23.4C What Are Some Special Types of CapillaryElectrophoresis?
The main capillary electrophoresis method that has beendiscussed up to this point is zone electrophoresis, in whichdifferences in the charge/size ratio of analytes is the onlymeans employed for their separation. It is possible toinclude other chemical and physical interactions in a CE
system to give additional types of separations. Examplesinclude CE methods that separate analytes based on theirsize, isoelectric points, or interactions with additives in therunning buffer. The use of CE in microanalytical systemshas also been a topic of great interest (see Box 23.2).
Capillary Sieving Electrophoresis. One useful fea-ture of gel electrophoresis is the ability of some sup-ports to separate analytes based on size, as occurs forproteins in SDS-PAGE. The same effect can be obtainedin capillary electrophoresis by including an agent inthe CE system that “sieves” the analytes, or separates them based on size. This approach is known
BOX 23.2
Analytical Chemistry on a Chip
The development of silicon microchips created a revolution inthe computer and electronic industries. The result over the pastfew decades has been a continuous decrease in the size of elec-tronic devices and an increase in their capabilities. A similarchange is occurring in analytical chemistry. This change beganin 1979, when methods developed for the creation ofmicrochips where used to make a gas chromatographic systemon a silicon wafer.36 In 1990 it was proposed that all of thecomponents of a chemical analysis could even be placed onto aminiaturized system. The resulting device is now known as a“lab-on-a-chip” or a micro total-analysis system .37
Capillary electrophoresis was one of the first analyticalmethods that was adapted for use on a microchip.38 An exam-ple of such a device is given in Figure 23.17. There are nowmany reports that have used microchips for CE.39–41 One fea-ture that makes CE and microchips a good match is the need inCE for narrow channels to avoid the effects of Joule heating. In
(mTAS)
addition, the elimination of Joule heating allows CE to workwith short separation channels and high electric fields, as isused in Figure 23.17. The creation of an electric field to sepa-rate analytes and to generate electroosmotic flow for CE is rel-atively easy to obtain with a microchip by including electrodesas part of this device. The availability of detection schemes likeLIF that are capable of working with small detection volumes isalso valuable when placing a CE system on a microchip.38–41
CE is not the only analytical method that has been carriedout on microchips. Other methods have included liquid chro-matography, gel electrophoresis, biosensing, water analysis, flowinjection analysis, and solid-phase extraction. There are severalpotential advantages of using microchips with these techniques.One is the small sample requirements of these devices. The abil-ity to make these systems fully portable or disposable are addi-tional advantages. The possibility of making microchips on alarge scale and at a low cost are other attractive features.39–41
Time [ms]0.0 0.5 1.0 1.5
Res
pons
e
InjectSeparation
channel
Injectionvalve
SampleSamplewaste
Buffer
Waste
2 mm
RB
DCF
FIGURE 23.17 Design of a microchip-based system for performing electrophoresis and the use of thisdevice in the fast separation of the dyes rhodamine B (RB) and dichlorofluorescein (DCF). (Reproducedwith permission from S.C. Jacobson, C.T. Culbertson, J.E. Daler, and J.M. Ramsey, Analytical Chemistry, 70(1998) 3476–3480.)
96943_23_ch23_p571-596 1/8/10 2:54 PM Page 587
588 Chapter 23 • Electrophoresis
as capillary sieving electrophoresis (CSE).7 A compar-ison of the results of CSE and a size separation by gelelectrophoresis (e.g., by SDS-PAGE) is given in Figure 23.18.
There are several ways we can perform capillarysieving electrophoresis. The first way is to place a porousgel in the capillary, like the polyacrylamide gelsemployed in SDS-PAGE. This method is called capillarygel electrophoresis (CGE).7 One problem with these gels isthey are not always stable in the high electric fields usedin capillary electrophoresis and must frequently bereplaced. A second approach, and the one now used inDNA sequencing by CE, is to add to the running buffer alarge polymer that can entangle with analytes and altertheir rate of migration. This approach provides a systemwith better reproducibility and stability than those usinggels, because the polymer is continuously renewed asthe running buffer passes through the capillary.
Electrokinetic Chromatography. Ordinary capillaryelectrophoresis works well for separating cations andanions, but it cannot be used to separate neutral sub-stances from each other. Instead, these substances migrateas a single peak that travels with the electroosmotic flow. Itis possible to employ CE with such compounds if we placein the running buffer a charged agent that can interact withthese substances. This approach is called electrokinetic chromatography. One common way of carrying out thismethod is to employ micelles as additives, giving a subsetof electrokinetic chromatography known as micellar electrokinetic chromatography (MEKC).7,21,42,43
A micelle is a particle formed by the aggregation of alarge number of surfactant molecules, such as sodium
dodecyl sulfate (SDS). We saw earlier that SDS has a longnonpolar tail attached to a negatively charged sulfategroup. When the concentration of a surfactant like SDSreaches a certain threshold level (known as the “criticalmicelle concentration”), some of the surfactant moleculescome together to form micelles. If these micelles form in apolar solvent like water, the nonpolar tails of the surfactantwill be on the inside of the aggregate (giving a nonpolarinterior), while the charged groups at the other end will beon the outside by the solvent (see Figure 23.19).
When micelles based on SDS are placed into the runningbuffer of a CE system, they will be attracted toward the posi-tive electrode. If a sample with several neutral compounds isnow injected into this system, some of these neutral sub-stances may enter the micelles and interact with their nonpo-lar interior. This interaction involves a partitioning processsimilar to that found in liquid–liquid extractions and sometypes of liquid chromatography (see Chapters 20 and 22), inwhich the micelles act as the “stationary phase.” Althoughthese neutral compounds normally travel with the electroos-motic flow through the capillary, while they are in the micellesthey migrate with the micelles in the opposite direction. Theresult is a separation of neutral compounds based on thedegree to which they enter the micelles. Micelles can also alterthe migration times for charged substances through partition-ing and charge interactions between the analytes and micelles.
Other Methods. There are many other types of CE thathave been explored for use in chemical analysis and sepa-rations. For example, isoelectric focusing can be carriedout in a capillary, creating the method of capillary isoelectricfocusing (CIEF).7,21 This technique involves the productionof a pH gradient across the capillary for the separation of
5.40
4.62
4.88
5.14
4.36
�4.101.60 1.89 2.18 2.47
25,669
59,217
2.76 3.05
log(
MW
)
Normalized migration time (min)
200 kDa
66 kDa97 kDa
116 kDa
14 kDa21 kDa31 kDa45 kDa
2 4 6 108Time (min)
FIGURE 23.18 Comparison of capillary electrophoresis and traditional SDS-PAGE in the separation and analysisof proteins. The figure on the left shows an electropherogram obtained for a series of proteins with molecularmasses ranging from 14 to 200 kDa. The inset shows an SDS-PAGE gel for the same proteins. The calibrationcurve on the right shows how the migration times for these proteins in CE are related to their molecular masses.(Adapted with permission from Bio-Rad Laboratories.)8
96943_23_ch23_p571-596 1/8/10 2:54 PM Page 588
Section 23.4 • Capillary Electrophoresis 589
zwitterions. One way CIEF can be conducted is shown inFigure 23.20. In this example, the electrodes are in contactwith two different electrolyte solutions: (1) the“catholyte,” which is a basic solution located by the cath-ode, and (2) the “anolyte,” which is an acidic solutionlocated by the anode. The capillary contains a mixture ofampholytes that will create a pH gradient when an elec-tric field is applied between these electrodes. A coatedcapillary is also used in this case to minimize or eliminateelectroosmotic flow. When a sample (generally a mixtureof proteins) is injected onto this system, its zwitterionswill migrate until they reach a region where the pH isequal to their pI. Once these bands have formed, they are
pushed through the capillary and past the detector byapplying pressure to the system.
Another type of capillary electrophoresis occurswhen biologically related agents are placed as additivesin the running buffer. As analytes travel through thisbuffer, their overall mobility will be affected by theirbinding to these agents (see Figure 23.21). The result is amethod known as affinity capillary electrophoresis(ACE).7,21,44,45 One common use of ACE is in the separa-tion of chiral analytes through the use of binding agentslike cyclodextrins or proteins (see Chapters 8 and 22).This method can also be used in clinical and pharmaceu-tical assays and for the study of biological interactions.
(�)(�)
Net migration ofneutral analytes
ElectroosmosisMicelle migration
� ��
���
�
�
�
�
�� �
�
���
� �
�
�� �
�
���
�
��
�
�
FIGURE 23.19 Micellar electrokinetic chromatography. The circles representanalytes from the injected sample. A negatively charged surfactant such assodium dodecyl sulfate is used in this example, as represented by the circles thatcontain negative charges and nonpolar tails.
(a)
Anolytesolution
Catholytesolution
(�) Electrode(�) Electrode
Sample withprotein mixture Detector
(b)
Focusedprotein bands
Solution withmixture of
amphyloytes
(�) Electrode(�) Electrode PressureDetector
FIGURE 23.20 Capillary isoelectric focusing. The diagram in (a) shows the initialconfiguration of this system before an electric field is applied. The diagram in (b)shows the separation of proteins from the original sample after the electric field hasbeen applied. These protein bands are later passed through the capillary and past thedetector by applying pressure to the system.
96943_23_ch23_p571-596 1/8/10 2:54 PM Page 589
590 Chapter 23 • Electrophoresis
(�)(�)
Net migrationof analytes
ElectroosmosisLigand migration
FIGURE 23.21 Affinity capillary electrophoresis. The circles represent analytesfrom the injected sample. The half-circles represent a binding agent for one ormore of these analytes that has been added to the running buffer.
1. Define “electrophoresis” and explain how this method isused to separate chemicals.
2. What is “zone electrophoresis”? How does this techniquediffer from “moving boundary electrophoresis”? Which ofthese methods is more common in modern laboratories?
HOW IS ELECTROPHORESIS PERFORMED?
3. Define each of the following terms and explain how they areused in electrophoresis.(a) Migration distance(b) Migration time(c) Electropherogram
4. Chloride is found to migrate a distance of 35 cm in a capillaryelectrophoresis system with a migration time of 5.63 min.What is the migration velocity of chloride under these condi-tions? At the same velocity, what distance would chloridehave traveled in 2.5 min?
5. A protein is found to migrate a distance of 3.2 cm in 30 minwhen 100 V is applied to a 10 cm long polyacrymide gel. What
is the migration velocity of this protein? If an applied voltageof 200 V is used instead, how long will it take the same proteinto migrate a distance the entire length of the 10 cm gel?
FACTORS AFFECTING ANALYTE MIGRATION
6. Explain why a charged substance will tend to move at aconstant velocity through an electric field. What forces areinvolved in this process?
7. What is “electrophoretic mobility”? How is this term relatedto the movement of a substance in an electric field? Whatare some general factors that affect the size of the elec-trophoretic mobility for an analyte?
8. A peptide is found to have a migration time of 8.31 min atan applied voltage of 10.0 kV and on a capillary elec-trophoresis system with a total length of 25.0 cm. The detec-tor is located at 21.5 cm from the point of sample injectionand conditions are used so that electroosmotic flow is negli-gible. What is the migration velocity of the peptide? What isits electrophoretic mobility?
9. How would the migration velocity and migration time forthe peptide in the previous problem change if the voltage
Questions
96943_23_ch23_p571-596 1/8/10 2:54 PM Page 590
• Questions 591
was changed to 15.0 kV? What change, if any, would occurin the electrophoretic mobility?
10. What are some examples of secondary interactions that canaffect analyte migration in electrophoresis?
11. Dicamba is a herbicide commonly used on broadleaf weeds.Its major metabolite is dichlorosalicylic acid (DCSA). Bothcompounds are weak acids. Dicamba has a single weak-acidgroup, which is a carboxylic acid group with a pKa of 1.94.DCSA has two weak-acid groups: a carboxylic acid groupwith a pKa of 2.08 and a phenol group with a pKa of 8.60. Aseparation of these compounds at pH 7.4 by capillary elec-trophoresis (CE) gives a migration time of 2.05 min fordicamba and 2.35 min for DSCA. The same compounds hadmigration times of 2.06 min and 4.1 min at pH 10.0.46
Explain why there is a large shift in the migration time forDCSA over this pH range but no significant shift in themigration time for dicamba.
12. Two chiral forms of a drug have identical electrophoreticmobilities in a CE system. However, it is possible to sepa-rate these forms when -cyclodextrin (a complexing agentwe discussed in Chapter 7) is placed as an additive into therunning buffer. Based on your knowledge of chemical reac-tions, explain why the presence of -cyclodextrin mightlead to such a separation.
13. What is “electroosmosis”? What causes electroosmosis tooccur? How does electroosmosis affect the movement ofanalytes in an electrophoresis system?
14. What is the “electroosmotic mobility”? What factors affectthis mobility?
15. A neutral compound injected onto a capillary elec-trophoresis system has a migration time of 1.52 minthrough a 50 cm long capillary at 30.0 kV, with the detectorbeing located 30.0 cm from the point of injection. If it isassumed that the observed electrophoretic mobility forthis compound is equal to the electroosmotic mobility,what is the value of µeo under these conditions?
16. The electroosmotic mobility for a particular separation isfound to be . A 25 cm long capillary isused for this separation at an applied voltage of 20.0 kV,with the detector being located 20 cm from the point ofinjection. What is the expected migration time for a neutralanalyte in this system (i.e., an analyte that travels throughthe system only due to electroosmotic flow)?
FACTORS AFFECTING BAND-BROADENING
17. Use the same equations as given in Chapter 20 for chro-matography to calculate the following values. (Note: Youcan assume Gaussian peaks are present.)(a) The plate number of a peak in capillary electrophoresis
that has a migration time of 7.30 min and baseline widthof 0.12 min
(b) The plate height of the system in Part (a) for a capillarywith a total length of 35.0 cm
(c) The plate number of a band in gel electrophoresis with amigration distance of 4.2 cm and baseline width of 2.1 mm
18. Use the equations given in Chapter 20 to calculate the fol-lowing values.(a) The resolution of two peaks in capillary electrophoresis
with migration times of 10.1 min and 10.4 min withbaseline widths of 0.15 min and 0.16 min, respectively
(b) The resolution of two bands in gel electrophoresis withmigration distances of 2.3 cm and 2.6 cm with an aver-age baseline width of 1.5 mm
8.3 * 10-10m2>V # s
b
b
19. How does longitudinal diffusion affect band-broadening inelectrophoresis? How is this type of band-broadening relatedto the time of the separation and the size of the analytes? Whycan a porous support help minimize the effects of this process?
20. What is “Joule heating”? What causes this heating? Why doesJoule heating result in band-broadening in electrophoresis?
21. What are some approaches that can be used to minimize theeffects of Joule heating in electrophoresis?
22. One useful tool in optimizing a separation for capillary elec-trophoresis is an “Ohm’s law plot.” This graph is preparedby plotting the measured current of the electrophoretic sys-tem at various applied voltages.21
(a) Based on Equation 23.6, what information will be pro-vided by the slope of this plot?
(b) Deviations from linearity are often seen at high voltagesin an Ohm’s law plot. What do you think is usually thesource of these deviations?
23. Under what conditions will eddy diffusion be present dur-ing electrophoresis?
24. What is “wick flow”? How does wick flow create band-broadening? In what types of electrophoresis can wick flowbe important?
WHAT IS GEL ELECTROPHORESIS?
25. What is “gel electrophoresis”? How is this technique usedfor analyte identification and measurement?
26. A biochemist looking for a particular protein in a cell sam-ple obtains the following results when using gel elec-trophoresis and a Western blot to compare this sample withstandards containing the same protein. What is the approxi-mate amount of this protein in the unknown cell sample?
Amount of Protein (ng) Relative Band Area
0.0 50
5.0 560
10.0 1120
20.0 2040
Unknown sample 980
27. Figure 23.22 shows a typical result that is obtained for theanalysis of a human serum sample by gel electrophoresis.Explain how this information might be used by a physicianto detect both qualitative and quantitative changes in serumproteins for their patients.
HOW IS GEL ELECTROPHORESIS PERFORMED?
28. Draw a diagram of a typical gel electrophoresis system andlabel its main components. Explain the difference betweenhorizontal and vertical gel electrophoresis systems.
29. List some supports that can be used in gel electrophoresis.What type of support is often used with DNA? What type isoften used with proteins?
30. Describe how samples are usually applied to a support ingel electrophoresis. Explain the purpose of a “stacking gel”versus a “running gel.”
31. Describe how each of the following items can be used fordetection in gel electrophoresis.(a) Densitometer(b) Coomassie Brilliant Blue
96943_23_ch23_p571-596 1/8/10 2:54 PM Page 591
592 Chapter 23 • Electrophoresis
(c) Silver staining(d) Blotting
32. What is the difference between a Southern blot and aNorthern blot? What is the difference between a Southern blotand a Western blot? How is each of these methods performed?
33. What is MALDI-TOF MS (matrix-assisted time-of-flightmass spectrometry)? Explain how this method can be usedfor identifying the contents of bands in gel electrophoresis.
WHAT ARE SOME SPECIAL TYPES OF GEL ELECTROPHORESIS?
34. Explain how SDS-PAGE (sodium dodecyl sulfate polyacry-lamide gel electrophoresis), is performed. Describe whySDS-PAGE can provide information on the molecular massof a protein.
35. The molecular mass of a protein is to be estimated by SDS-PAGE. The following migration distances are obtained for pro-teins of known mass on the gel: 200 kDa, 0.33 cm; 116.3 kDa,0.57 cm; 66.3 kDa, 0.91 cm; 36.5 kDa, 1.63 cm; 21.5 kDa, 1.96 cm;14.4 kDa, 2.24 cm. The unknown protein has a migration dis-tance of 1.25 cm on the same gel. What is the approximatemolecular weight of this protein?
36. A biochemist uses the same conditions as in the last problemto look for proteins with approximate masses of 18.5 kDa,40.2 kDa, and 91.8 kDa. What are the expected migration dis-tances for these proteins in this gel?
37. What is “isoelectric focusing”? Describe how this methodseparates analytes.
38. What is an “ampholyte”? How is an ampholyte used in iso-electric focusing?
39. What is “2-D electrophoresis”? What types of electrophore-sis are often used in this method? What advantages arethere in the use of 2-D electrophoresis for complex samples?
WHAT IS CAPILLARY ELECTROPHORESIS?
40. What is meant by the term “capillary electrophoresis”?How does this method differ from gel electrophoresis?
41. The amount of a nitrate in an unknown sample is to bequantitated by capillary electrophoresis. Another anion isadded to all samples and standards as an internal standard(IS) prior to injection. The following results are obtained.What is the amount of the nitrate in the unknown sample?
FIGURE 23.22 Pattern obtained by staining ofserum proteins that have been separated by gelelectrophoresis. The bottom plot shows the proteinbands on this gel after staining and the top tracingshows the intensity of these bands, as determined byusing a densitometer. The labels on the bands referto the types of proteins that are present in a givenregion or zone. The general location of these bandscan be used to identify proteins in an unknownsample, while their intensity can be used to indicatethe relative amount of each protein that is present.(Based on data from J.M. Anderson and G.A. Tetrault,“Electrophoresis.” In Laboratory Instrumentation, 4thed., M.C. Haven, G.A. Tetrault, and J.R. Schenken, Eds.,Van Nostrand Reinhold, New York, 1995, Chapter 12.)
Staining pattern of gel
Migration distance
Densitometer scan of stained gel
Sign
al in
tens
ity
�2 ��1
Albumin
Globulins
Concentration ofNitrate (mg/L)
PeakHeight
Concentration ofInternal
Standard (mg/L)Peak
Height
0.0 0.2 2.5 9.8
5.0 18.8 2.5 10.2
10.0 43.1 2.5 11.5
15.0 55.2 2.5 10.1
Unknown sample 15.1 2.5 9.7
42. Capillary electrophoresis and laser-induced fluorescencedetection were used to determine the amount of a fluorescein-labeled peptide in a biological sample. A fixed amount of non-conjugated fluorescein was added to each sample as aninternal standard. The following results were obtained in thismethod for a series of standards.
Concentration ofPeptide (nM)
Peak Area —Peptide
Peak Area —Fluorescein
0.0 109 546
15.0 2185 598
25.0 3174 532
50.0 7046 601
The unknown sample gave measured peak areas of 4098and 556 for the labeled peptide and fluorescein. What wasthe concentration of this peptide in the unknown sample?
43. What helps give capillary electrophoresis high efficiency?What processes are normally the most important in CE indetermining the band-broadening of this method?
44. A small anion with a diffusion coefficient of and an electrophoretic mobility of is to beanalyzed at 20.0 kV by a capillary electrophoresis system. Thesystem has a total length of 40.0 cm and the detector islocated 33.0 cm from the point of injection. In the absence ofelectroosmotic flow, what is the maximum number of theo-retical plates that can be obtained for this anion (i.e., assum-ing longitudinal diffusion is the only band-broadeningprocess)? What will the migration time of the analyte beunder these conditions?
1.58 cm2>kV # min3.0 * 10-5 cm2>s
96943_23_ch23_p571-596 1/8/10 2:54 PM Page 592
• Questions 593
45. A chemist wishes to use the plate number measured for aCE to estimate the diffusion coefficient for a new drug. Thisdrug is injected onto a 42.5 cm long neutral coated capillary,which has no binding for the drug and produces negligibleelectroosmotic flow. The detector is located 38.0 cm from thepoint of injection. The drug has a measured migration timeof 14.8 min and a baseline width of 26 s, when a voltage of15.0 kV is applied across the capillary.(a) What is the number of theoretical plates for the peak
due to the drug, if it is known that this peak has aGaussian shape?
(b) What is the diffusion coefficient for the drug (in units ofcm2/s)? What assumptions did you make in reachingyour answer?
HOW IS CAPILLARY ELECTROPHORESIS PERFORMED?
46. What are the main components of a capillary electrophore-sis system? How does this system differ from the equipmentused in gel electrophoresis?
47. Why does the use of an uncoated silica capillary lead toelectroosmotic flow in capillary electrophoresis? What is thedirection of this flow? How does electroosmosis affect theapparent migration of analytes through the CE system?
48. What is the “normal polarity” mode of CE? What is the“reversed polarity” mode? In what general situations arethese two modes utilized?
49. Explain why it is necessary in capillary electrophoresis to usesmall injection volumes. What are some difficulties in work-ing with these small volumes? What are some advantages?
50. What is “hydrodynamic injection”? What is “electrokineticinjection”? How does each of these methods work?
51. What is “sample stacking”? Describe one way sample stack-ing can be accomplished in capillary electrophoresis.
52. List some general and some selective detectors that are usedin capillary electrophoresis. How does this list compare tothat given in Chapter 22 for liquid chromatography?
53. Two isoforms of a protein are found to elute with migrationtimes of 20.3 min and 24.5 min from a capillary elec-trophoresis system. These protein peaks have measuredareas of 3430 and 1235 units, respectively. What is the rela-tive amount of each protein in the sample?
54. A drug is found to have a peak area of 11,250 units and itmigrates through a 50.0 cm long capillary in the presence ofan applied voltage of 15.0 kV. The detector is located at adistance of 45.0 cm from the point of injection. What will theexpected area be for this sample if it is injected onto thesame system, but now using an applied voltage of 20.0 kV?
55. What is “laser-induced fluorescence”? Explain why thistechnique is useful in capillary electrophoresis.
WHAT ARE SOME SPECIAL TYPES OF CAPILLARYELECTROPHORESIS?
56. What is “capillary sieving electrophoresis”? What are twoways in which this method can be performed?
57. A protein is injected onto the same system used inFigure 23.18. What is the molecular weight of this protein ifit has a normalized migration time of 2.65?
58. Define each of the following terms.(a) Electrokinetic chromatography(b) MEKC(c) Micelle(d) Critical micelle concentration
59. What is “capillary isoelectric focusing”? Describe one waythis method can be performed.
60. What is “affinity capillary electrophoresis”? What are someapplications of this method?
CHALLENGE PROBLEMS
61. Compare the capillary electrophoresis system in Figure 23.14with the electrochemical cells that are discussed in Chapter 10.(a) What similarities can you find in these two types of sys-
tems? Based on this comparison, which part of the elec-trochemical cell would be equivalent to the capillary ina CE system? Which part of an electrochemical cell doyou think would be equivalent to the gel or support in agel electrophoresis system?
(b) Describe how current is carried from the power supplyand throughout an electrophoresis system. What is therole of the running buffer in this regard? What are theroles of the electrodes?
(c) One tool we used in Chapter 6 for solving chemicalproblems was to use the method of charge balance,which says that the number of positive and negativecharges in a system must be equal. And yet, in elec-trophoresis we use an electric field to separate analyteswith positive and negative charges. Why do you thinkthis separation is possible? (Hint: Consider youranswers to Parts (a) and (b).)
62. The effect of electroosmotic flow on the overall observed elec-trophoretic mobility and migration velocity (tm) for ananalyte in electrophoresis is given by the following equations,
(23.11)
(23.12)
where all terms are the same as described earlier in thischapter.21,23
(a) A cation has an electrophoretic mobility ofon a CE system containing a 30.0 cm
long coated, neutral capillary with a detector located25.0 cm from the point of injection. What migration timeand migration velocity would be expected for thiscation when using an applied voltage of 15.0 kV?
(b) What migration time and velocity would be obtainedfor the same cation as in Part (a) if a switch was madefrom the neutral capillary to a negatively charged capil-lary of an identical size, but that gives an electroosmoticmobility of ?
(c) Repeat the calculations in Parts (a) and (b) now using ananion that has an electrophoretic mobility of
. Compare your results with thoseobtained for the cation. What does this comparison tellyou about the role electroosmotic flow plays in theanalysis of cations and anions in CE?
63. The effect of electroosmotic flow on the efficiency and reso-lution of a separation in electrophoresis is given by theequations shown,23
(23.13)
(23.14)Rs = 0.177 (m1 - m2)AV
D(mavg + mosm)
N =
(m + mosm)V2D
-2.50 cm2>kV # min
4.10 cm2>kV # min
2.50 cm2>kV # min
tm =
LdL
(m+mosm)V=
Ld
mNet E
v = mNet E =
(m+mosm)VL
(mNet)
96943_23_ch23_p571-596 1/8/10 2:54 PM Page 593
594 Chapter 23 • Electrophoresis
where and are the electrophoretic mobilities of the firstand second eluting solutes, is the average electrophoreticmobility of solutes 1 and 2, and D is their diffusion coefficient.(a) The same protein as in Exercise 23.1 is examined on a CE
system with a 25.0 cm long negatively charged capillary(22.0 cm to the detector) at 20.0 kV. This new capillaryhas an electroosmotic mobility of . Ifthe protein still has an inherent electrophoretic mobilityof and a diffusion coefficient of
, how many theoretical plates are pos-sible for this system? How does this result compare withthat in Exercise 23.1?
(b) Make a plot showing what resolution would be expectedat various values for µosm in the case where the appliedvoltage is 10.0 kV and two analyte peaks have elec-trophoretic mobilities of 1.70 and ,with an average diffusion coefficient of . At what values of will the largest reso-lutions be obtained? What values of will give thesmallest resolutions?
64. The amount of sample applied to a capillary by hydrody-namic injection can be determined by the following form ofthe Hagen–Poiseuille equation,
(23.15)
where P is the pressure applied across the capillary duringinjection, d is the inner diameter of the capillary, t is the timeover which the pressure is applied, is the viscosity of theapplied solution, and L is the total length of the capillary.8
(a) What volume of sample would be applied to acapillary if a pressure of 0.5 psi is
applied for 1 s to a solution with a viscosity of 0.01 poise?(b) How much sample would be applied under the same
conditions but using a 1 s pulse on a capillary?
65. The amount of an analyte that is applied to a capillary byelectrokinetic injection is described by Equation 23.16,
(23.16)
where Q is the quantity of analyte injected, is the elec-trophoretic mobility of the analyte, is the mobility dueto electroosmosis, V is the applied voltage, A is the cross-sectional area of the capillary, C is the analyte concentrationin the original sample, t is the time over which the electricfield is applied for injection, and L is the distance overwhich the voltage is applied.8
(a) Based on Equation 23.16, which types of analytes will havethe largest injected quantities in electrokinetic injection:those that move with electroosmotic flow or against it?
(b) How does the value of Q change with the size of elec-troosmotic flow? Are small values or large values forµosm desirable in this method?
66. Compare and contrast the following analytical methods interms of the way in which they separate analytes.(a) Electrokinetic chromatography and reversed-phase
chromatography(b) Capillary electrophoresis and ion-exchange
chromatography(c) SDS-PAGE and capillary gel electrophoresis(d) Affinity capillary electrophoresis and affinity
chromatography
mosm
m
Q =
(m + mosm)VACt
L
20 cm long25 mm ID *
50 mm ID * 20 cm long
h
¢
Sample volume =
¢P d4pt
128h L
mosm
mosm versus mavg
2.0 * 10-7 cm2>s1.72 cm2>kV # min
2.0 * 10-7 cm2>s1.70 cm2>kV # min
3.0 cm2>kV # min
mavg
m2m1 TOPICS FOR REPORTS AND DISCUSSION
67. Obtain more information on the Human Genome Project.Discuss the challenges this project presented to analyticalchemists. What changes in DNA sequencing methods weremade to make this project possible?
68. Now that human DNA has been sequenced, scientists havebegun to examine the vast number of proteins that areencoded by this DNA. This research has lead to an areaknown as “proteomics.” Obtain more information on pro-teomics and the challenges that are presented by this field tochemical analysis. Describe some analytical methods thatare being used in this field.
69. Contact or visit a local hospital or biochemical laboratory.Report on how electrophoresis is used in these laboratories.
70. Compare and contrast the advantages and disadvantagesfor each of the following pairs of methods(a) Gel electrophoresis versus capillary electrophoresis(b) Gel electrophoresis versus HPLC(c) Capillary electrophoresis versus HPLC
71. Use the Internet to obtain material safety data sheet (MSDS)information for the various chemicals that are shown inFigure 23.8 for the preparation of a polyacrylamide gel.Identify any chemical or physical hazards that are associ-ated with these reagents.
72. Work with Northern and Southern blots in gel electrophore-sis often involves the use of phosphorus-32 as a radiola-bel. Obtain further information on any special requirements,training or facilities that are needed for dealing with thisagent. In addition, find out why phosphorus-32 is used as alabel for these applications. Write a report discussing yourfindings.
73. There are several additional types of electrophoresisbesides those that were discussed in this chapter. A fewexamples are listed below.10,17 Write a report on one ofthese methods. Include of description of how the methodseparates analytes, its applications, and its advantagesand disadvantages.(a) Isotachophoresis(b) Pulsed-field electrophoresis(c) Dielectrophoresis(d) Immunoelectrophoresis
74. The need for small sample sizes originally created severalchallenges in the design of CE instruments. This same fea-ture has made capillary electrophoresis attractive for theanalysis of samples for which only small volumes are avail-able. For instance, it has been shown that CE can be used toanalyze the content of single cells. Obtain a recent researcharticle or review on this topic. Write a report that discusseshow CE was used to analyze single cells in the subject paper.
75. Some early examples of capillary electrophoresis can be foundin Referemces 23 and 34. Look up these articles and examinehow electrophoresis was performed in them. How do themethods described in these papers compare to those that arenow commonly used in CE, as described in this chapter?
76. Capillary electrochromatography is a method in which themovement of an analyte through a stationary phase isachieved through the use of electroosmotic flow rather thanby only a difference in pressure.7,47,48 Obtain more informa-tion on this method. Report on how this method works andon some of its recent applications. Discuss how this methodis related to both traditional liquid chromatography andcapillary electrophoresis, even though it is usually classifiedas a chromatographic method.
(32P)
96943_23_ch23_p571-596 1/8/10 2:54 PM Page 594
• References 595
77. Four chemicals that can be used as matrices in MALDI-TOF MS are nicotinic acid, sinapinic acid, -cyano-4-hydroxycinnamic acid, and 2,5-dihydroxybenzoic acid.Obtain more information on one or more of these chemi-cals and learn about how they are used in MALDI-TOFMS. What chemical or physical properties make thesechemicals used in this method? What are some analytesthat can be examined with these matrices?
a
78. Find a recent research article that describes or uses a “lab-on-a-chip” or device. Describe this device and theapplication for which it was employed. What advantages ordisadvantages were reported for this device versus moretraditional methods for chemical analysis?
mTAS
1. J. C. Venter et al., “The Sequence of the Human Genome,”Science, 291 (2001) 1304–1351.
2. E. S Lander et al., “Initial Sequencing and Analysis of theHuman Genome,” Nature, 409 (2001) 890–921.
3. The New Encyclopaedia Britannica, 15th ed., EncyclopaediaBritannica, Inc., Chicago, IL, 2002.
4. F. Sanger, “The Early Days of DNA Sequences,” NatureMedicine, 7 (2001) 267–268.
5. “A History of the Human Genome Project,” Science, 291(2001) 1195.
6. N. J. Dovichi and J. Zhang, “How Capillary ElectrophoresisSequenced the Human Genome,” Angewandte ChemieInternational Edition, 39 (2000) 4463–4468.
7. M.-L. Riekkola, J. A. Jonsson, and R. M. Smith,“Terminology for Analytical Capillary ElectromigrationTechniques (IUPAC Recommendations 2003),” Pure andApplied Chemistry, 76 (2004) 443–451.
8. T. Blanc, D. E. Schaufelberger, and N. A. Guzman,“Capillary Electrophoresis.” In Analytical InstrumentationHandbook, 2nd ed., G. W. Ewing, Ed., Marcel Dekker, NewYork, 1997, Chapter 25.
9. J. Inczedy, T. Lengyel, and A. M. Ure, Compendium of AnalyticalNomenclature, 3rd ed., Blackwell Science, Malden, MA, 1997.
10. B. L. Karger, L. R. Snyder, and C. Hovath, An Introduction toSeparation Science, Wiley, New York, 1973, Chapter 17.
11. W.B. Hardy, “On the Coagulation of Proteid by Electricity,”Journal of Physiology, 26 (1899) 288–304.
12. W. B. Hardy, “Colloidal Solution. The Globulins,” Journal ofPhysiology, 33 (1905) 251–337.
13. L. Michaelis, “Elektrische Uberfuhrung von Fermenten,”Biochemische Zeitschrift, 16 (1909) 81–86.
14. A. W. K. Tiselius, “A New Apparatus for ElectrophoreticAnalysis of Colloidal Mixtures,” Transactions of the FaradaySociety, 33 (1937) 524–531.
15. Nobel Lectures, Chemistry 1942–1962, Elsevier, Amsterdam,the Netherlands, 1964.
16. J. W. Jorgenson, “Electrophoresis,” Analytical Chemistry, 58(1986) 743A–760A.
17. J. C. Giddings, Unified Separation Science, Wiley, New York,1991, Chapter 8.
18. L. Stryer, Biochemistry, Freeman, New York, 1988, Chapter 3.19. D. S. Hage, “Chromatography and Electrophoresis,” In
Contemporary Practice in Clinical Chemistry, W. Clarke and D. R.Dufour, Eds., AACC Press, Washington, DC, 2006, Chapter 7.
20. J. M. Anderson and G. A. Tetrault, “Electrophoresis,” InLaboratory Instrumentation, 4th ed., M. C. Haven, G. A.Tetrault, and J. R. Schenken, Eds., Van Nostrand Reinhold,New York, 1995, Chapter 12.
21. J. P. Landers, Handbook of Capillary Electrophoresis, CRC Press,Boca Raton, FL, 1992.
23. J. W. Jorgenson and K. D. Lukacs, “Zone Electrophoresis inOpen-Tubular Glass Capillaries,” Analytical Chemistry, 53(1981) 1298–1302.
24. E. M. Southern, “Detection of Specific Sequences amongDNA Fragments Separated by Gel Electrophoresis,” Journalof Molecular Biology, 98 (1975) 503–517.
25. J. C. Alwine, D. J. Kemp, and G. R. Stark, “Method forDetection of Specific RNAs in Agarose Gels by Transfer toDiazobenzyloxymethyl-Paper and Hybridization withDNA Probes,” Proceedings of the National Academy of ScienceUSA, 74 (1977) 5350–5354.
26. J. Renart, J. Reiser, and G. R. Stark, “Transfer of Proteinsfrom Gels to Diazobenzyloxymethyl-Paper and Detectionwith Antisera: A Method for Studying Antibody Specificityand Antigen Structure,” Proceedings of the National Academyof Science USA, 76 (1979) 3116–3120.
27. W. N. Burnette, “Western Blotting: Electrophoretic Transferof Proteins from Sodium Dodecyl Sulfate-PolyacrylamideGels to Unmodified Nitrocellulose and RadiographicDetection with Antibody and Radioiodinated Protein A,”Analytical Biochemistry, 112 (1981) 195–203.
28. M. Karas, D. Bachmann, and F. Hillenkamp, “Influence ofthe Wavelength in High-Irradiance Ultraviolet LaserDesorption Mass Spectrometry of Organic Molecules,”Analytical Chemistry, 57 (1985) 2935–2939.
29. M. Karas and F. Hillenkamp, “Laser Desorption Ionizationof Proteins with Molecular Masses Exceeding 10,000Daltons,” Analytical Chemistry, 60 (1988) 2299–2301.
30. K. Tanaka, H. Waki, Y. Ido, S. Akita, Y. Yoshida, and T. Yoshida,“Protein and Polymer Analyses up to m/z 100 000 by LaserIonization Time-of-Flight Mass Spectrometry,” RapidCommunications in Mass Spectrometry, 2 (1988) 151–153.
31. F. Hillenkamp and J. Peter-Katalinic, Eds., MALDI MS: APractical Guide to Instrumentation, Methods and Applications,Wiley, New York, 2007, 31.
32. M. J. Stump, R. C. Fleming, W.-H. Gong, A. J. Jaber, J. J.Jones, C. W. Surber, and C. L. Wilkins, “Matrix-AssistedLaser Desorption Mass Spectrometry,” Applied SpectroscopyReviews, 37 (2002) 275–303.
33. D. E. Garfin, “Two-Dimensional Gel Electrophoresis: AnOverview,” Trends in Analytical Chemistry, 22 (2003) 263–272.
34. F. E. P. Mikkers, F. M. Everaerts, and Th. P. E. M. Verheggen,“High-Performance Zone Electrophoresis,” Journal ofChromatography, 169 (1979) 11–20.
35. K. R. Mitchelson and J. Cheng, Eds., Capillary Electrophoresis ofNucleic Acids, Humana Press, Totowa, NJ, 2001.
36. S. C. Terry, G. H. Jerman, and J. B. Angell, “A GasChromatographic Air Analyzer Fabricated on a Silicon Wafer,”IEEE Transactions on Electron Devices, 12 (1979) 1880–1886.
References
96943_23_ch23_p571-596 1/8/10 2:54 PM Page 595
596 Chapter 23 • Electrophoresis
37. A. Manz, N. Graber, and H. M. Widmer, “Miniaturized TotalChemical Analyses Systems. A Novel Concept for ChemicalSensing,” Sensors and Actuators, B1 (1990) 244.
38. D. J. Harrison, K. Fluri, K. Seiler, Z. Fan, C. S. Effenhauser,and A. Manz, “Micromachining a Miniaturized CapillaryElectrophoresis-Based Chemical Analysis System on aChip,” Science, 261 (1993) 895–897.
39. M. Freemantle, “Downsizing Chemistry,” Chemical &Engineering News, 77 (1999) 27–36.
40. O. Geschke, H. Klank, and P. Telleman, MicrosystemEngineering of Lab-on-a-Chip Devices, Wiley-VCH, Weinheim,Germany, 2004.
41. Charles S. Henry, Ed., Microchip Capillary Electrophoresis,Springer-Verlag, New York, 2006.
42. S. Terabe, K. Otsuka, K. Ichikawa, A. Tsuchiya, and T.Ando, “Electrokinetic Separations with Micellar Solutionsand Open-Tubular Capillaries,” Analytical Chemistry, 56(1984) 111–113.
43. S. Terable, K. Otsuka, and T. Ando, “ElectrokineticChromatography with Micellar Solution and Open-TubularCapillary,” Analytical Chemistry, 57 (1985) 834–841.
44. N. H. H. Heegaard and C. Schou, “Affinity Ligands inCapillary Electrophoresis,” In Handbook of AffinityChromatography, D. S. Hage, Ed., CRC Press, Boca Raton, FL,2005, Chapter 26.
45. R. Neubert and H.-H. Ruttinger, Eds., Affinity CapillaryElectrophoresis in Pharmaceutics and Biopharmaceutics, CRCPress, Boca Raton, FL, 2003.
46. J. Yang, X.-Z. Wang, D. S. Hage, P. L. Herman, and D. P. Weeks,“Analysis of Dicamba Degradation by PseudomonasMaltophilia Using High-Performance CapillaryElectrophoresis,” Analytical Biochemistry, 219 (1994) 37–42.
47. S. Eeltink and W. Th. Kok, “Recent Applications in CapillaryElectrochromatography,” Electrophoresis, 27 (2006) 84–96.
48. Z. Deyl and F. Svec, Eds., Capillary Electrochromatography,Elsevier, Amsterdam, the Netherlands, 2001.
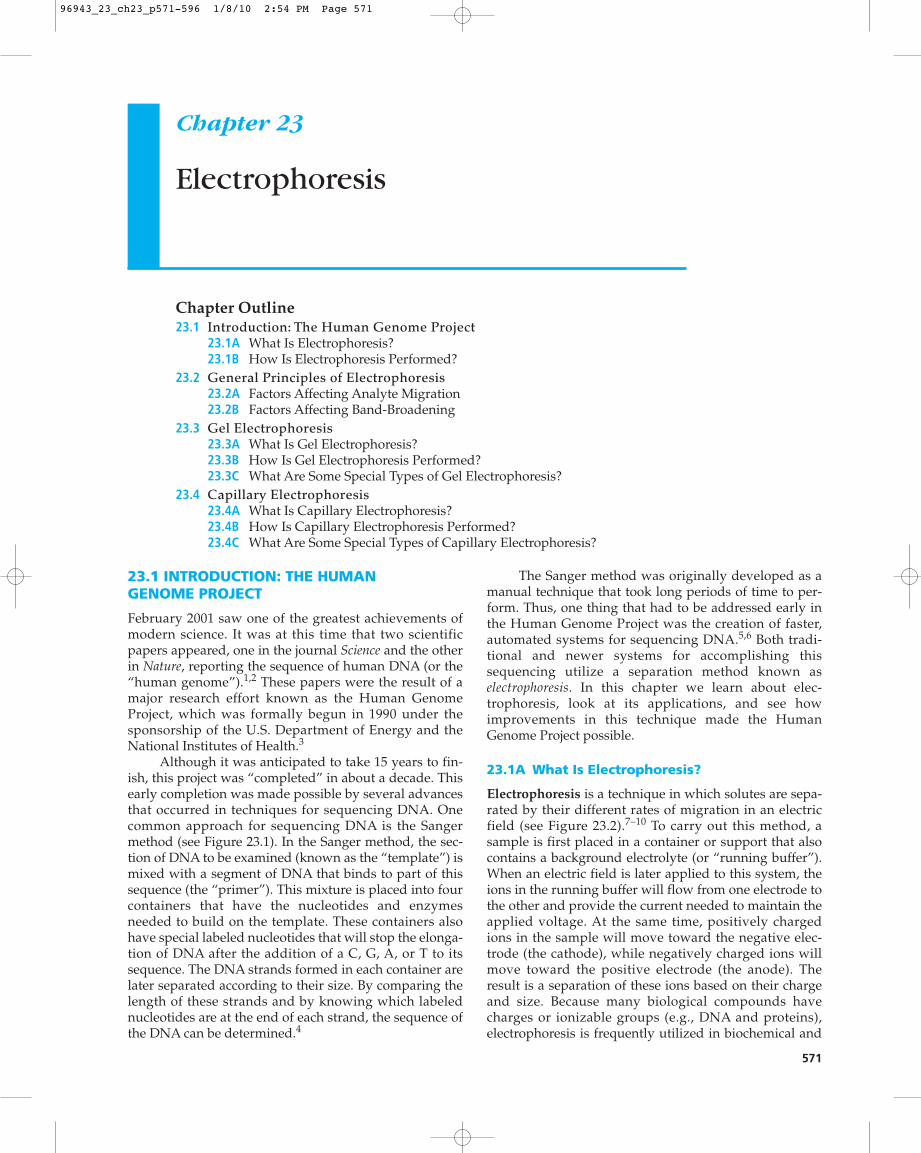
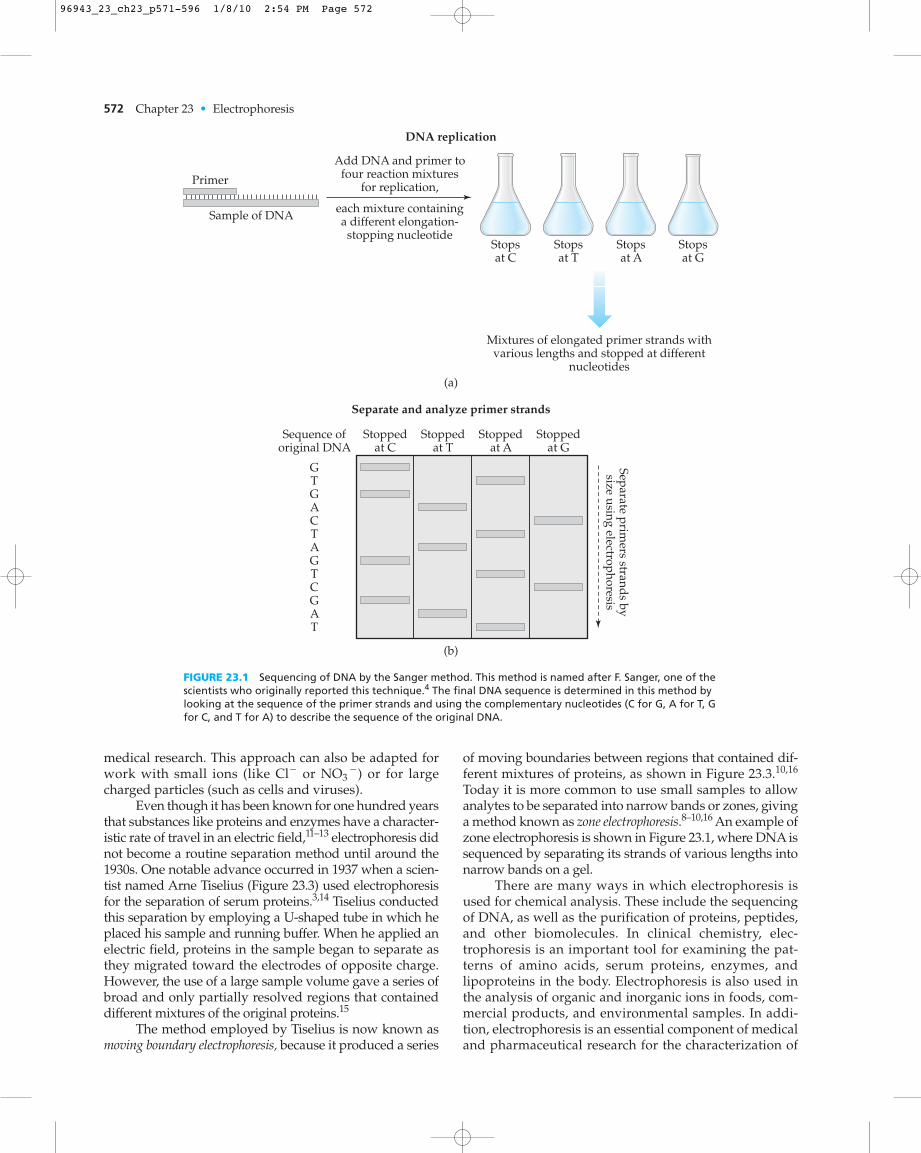
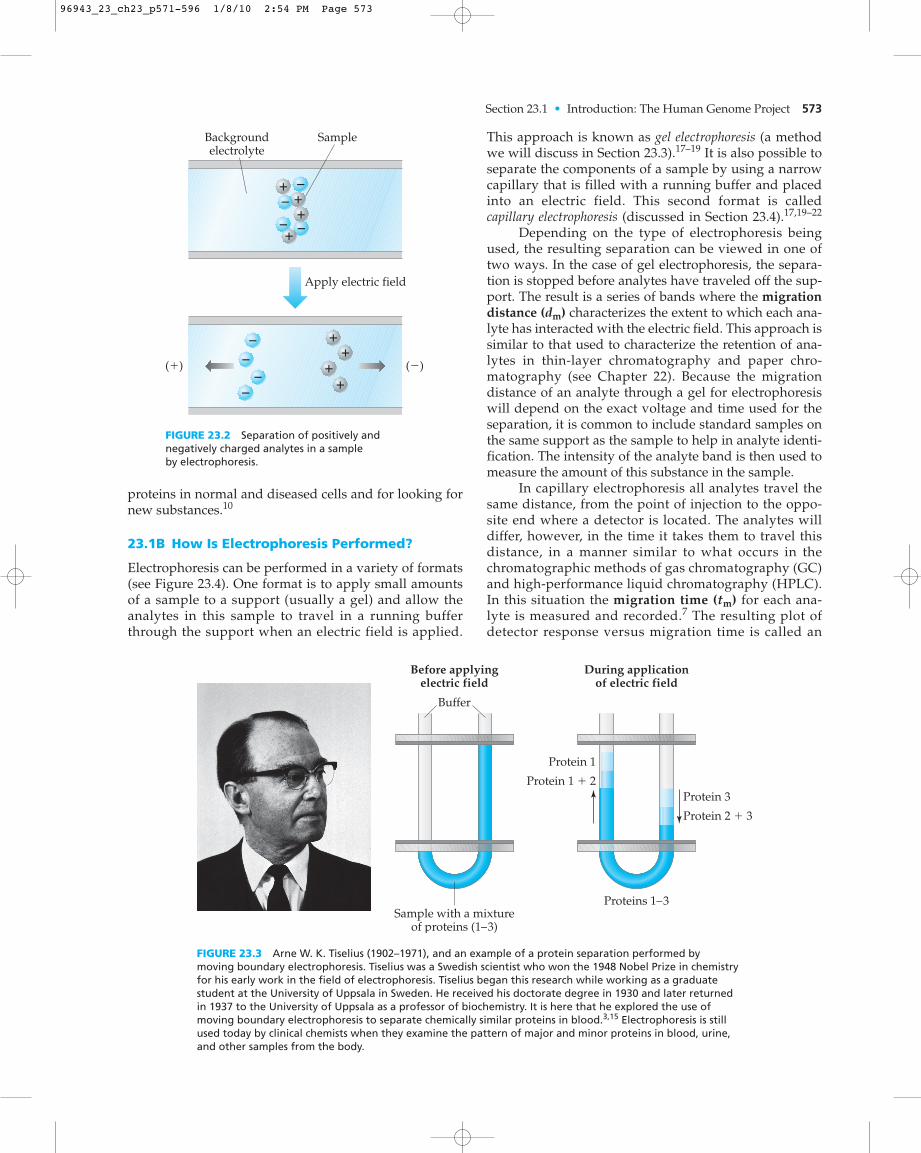
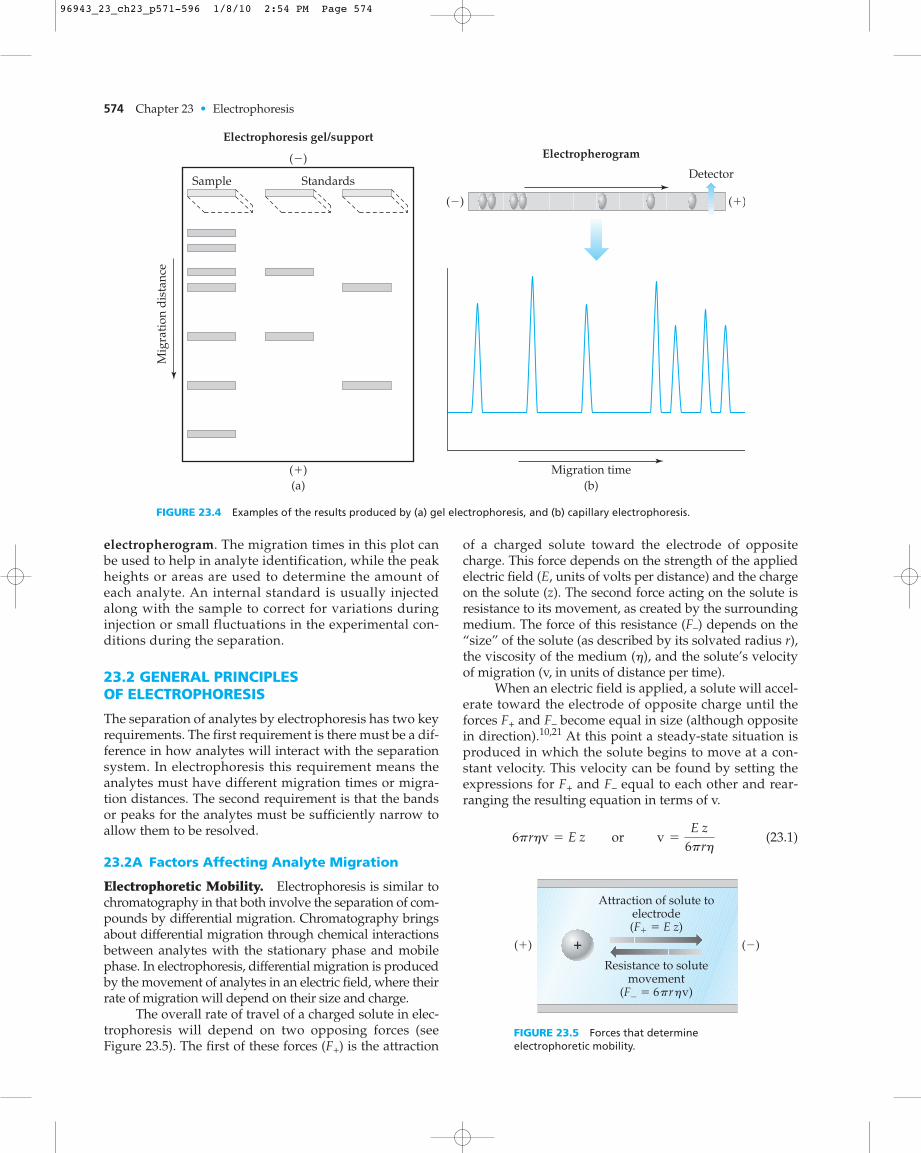
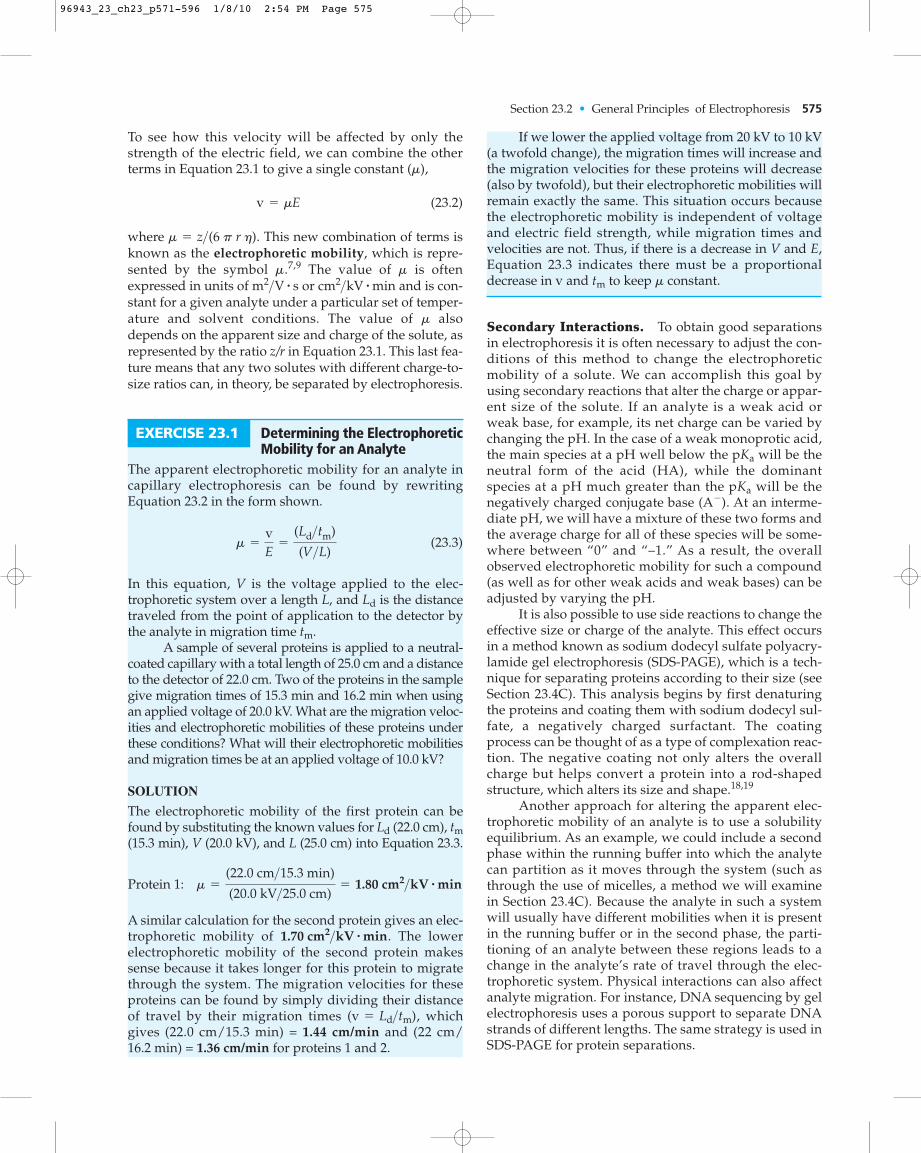


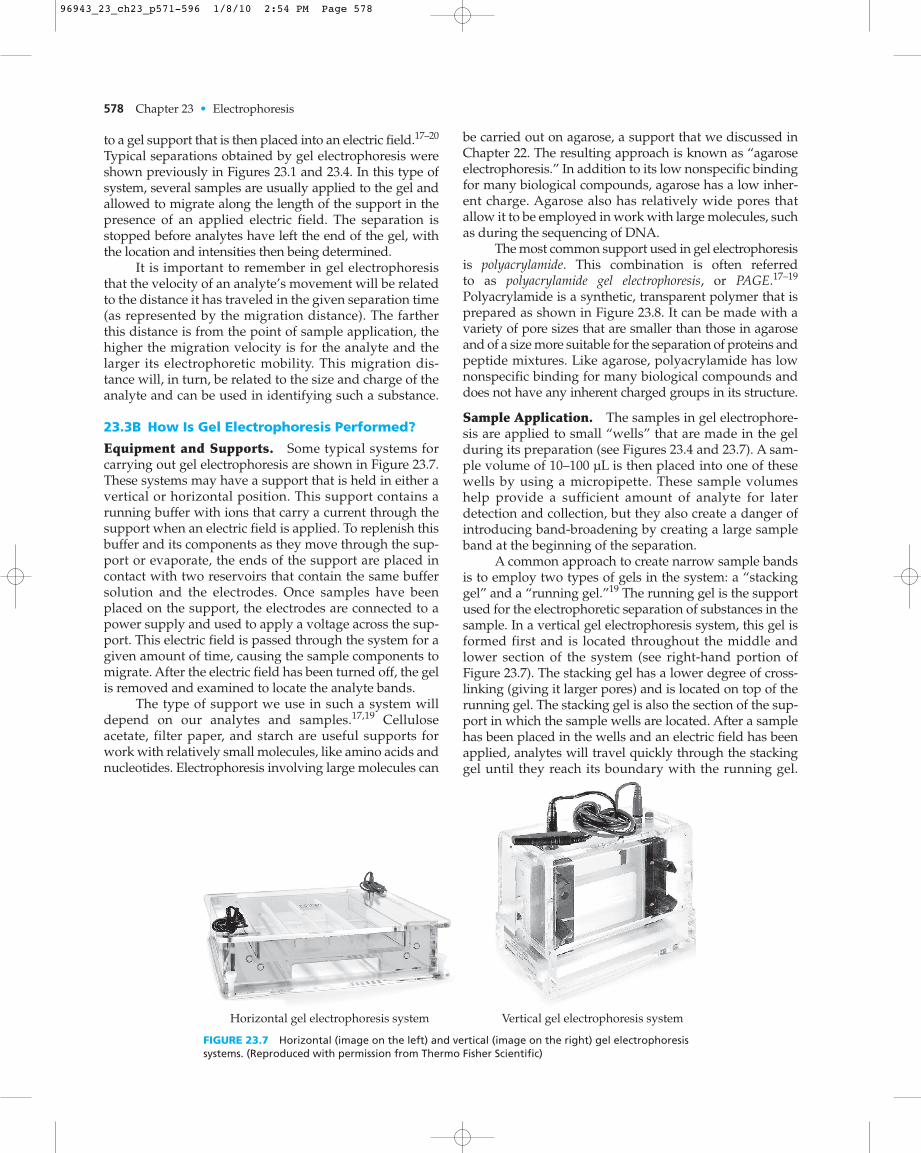
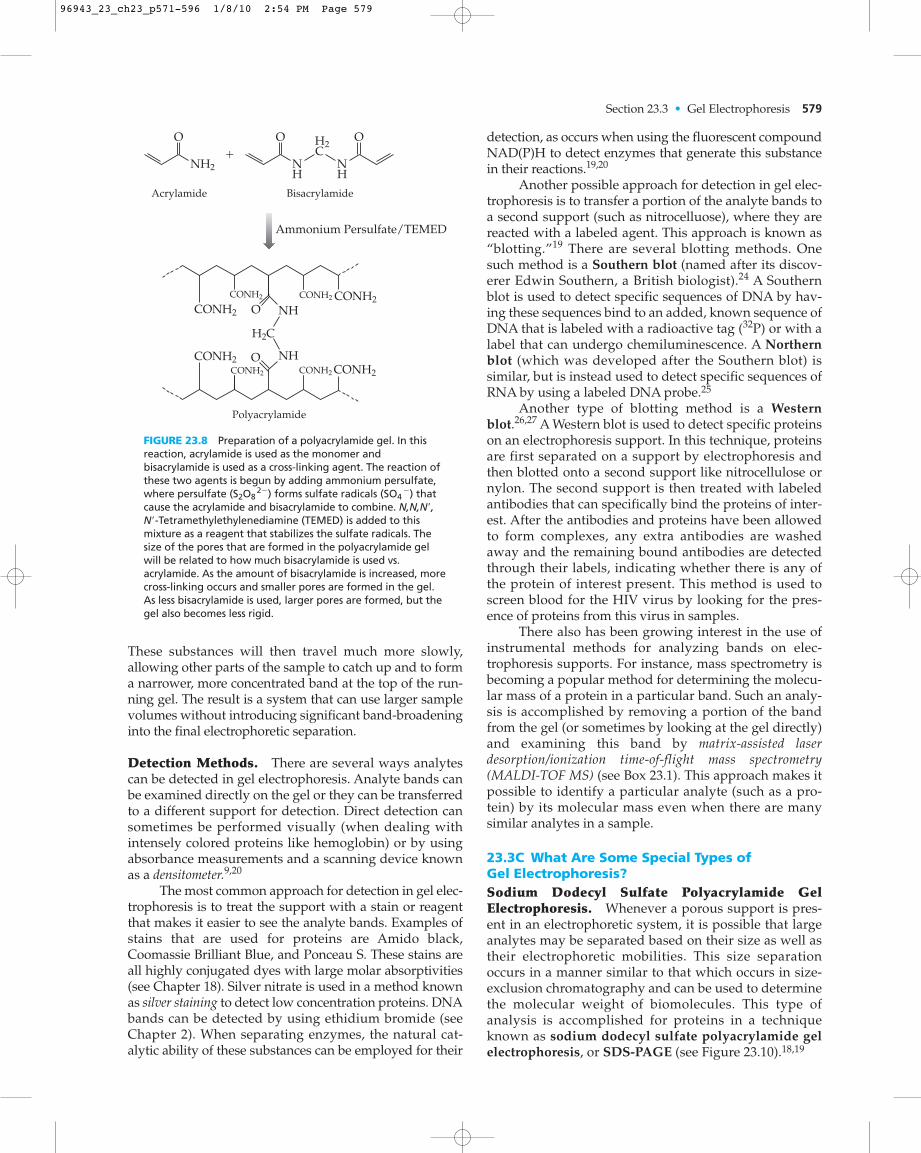
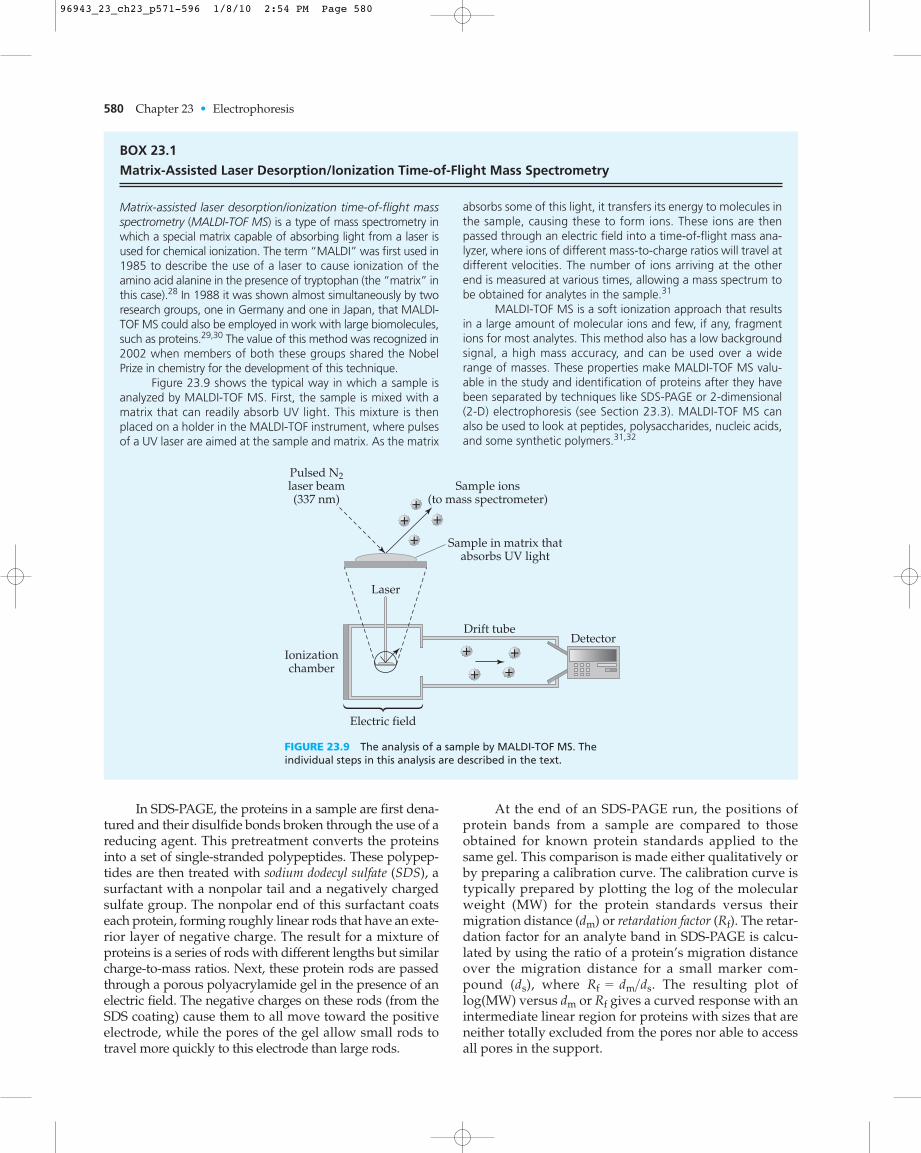


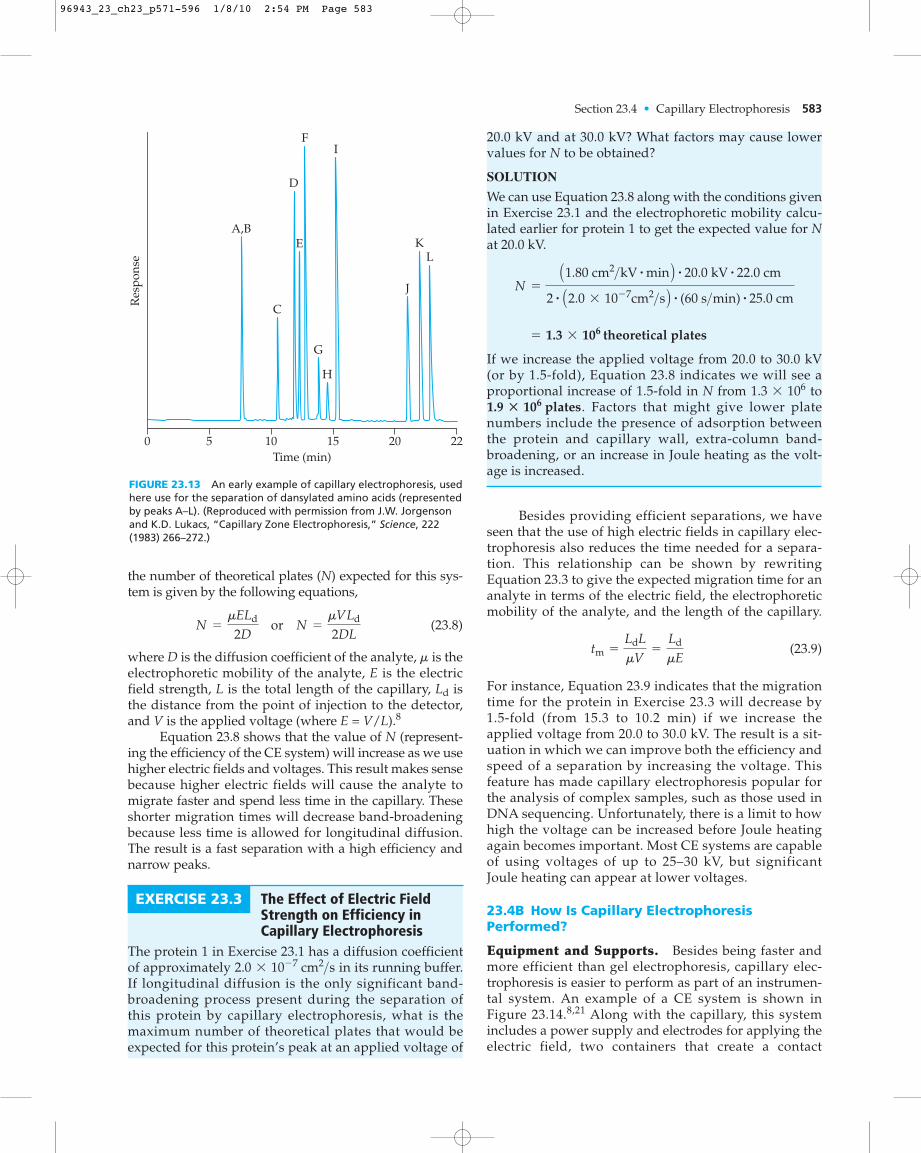
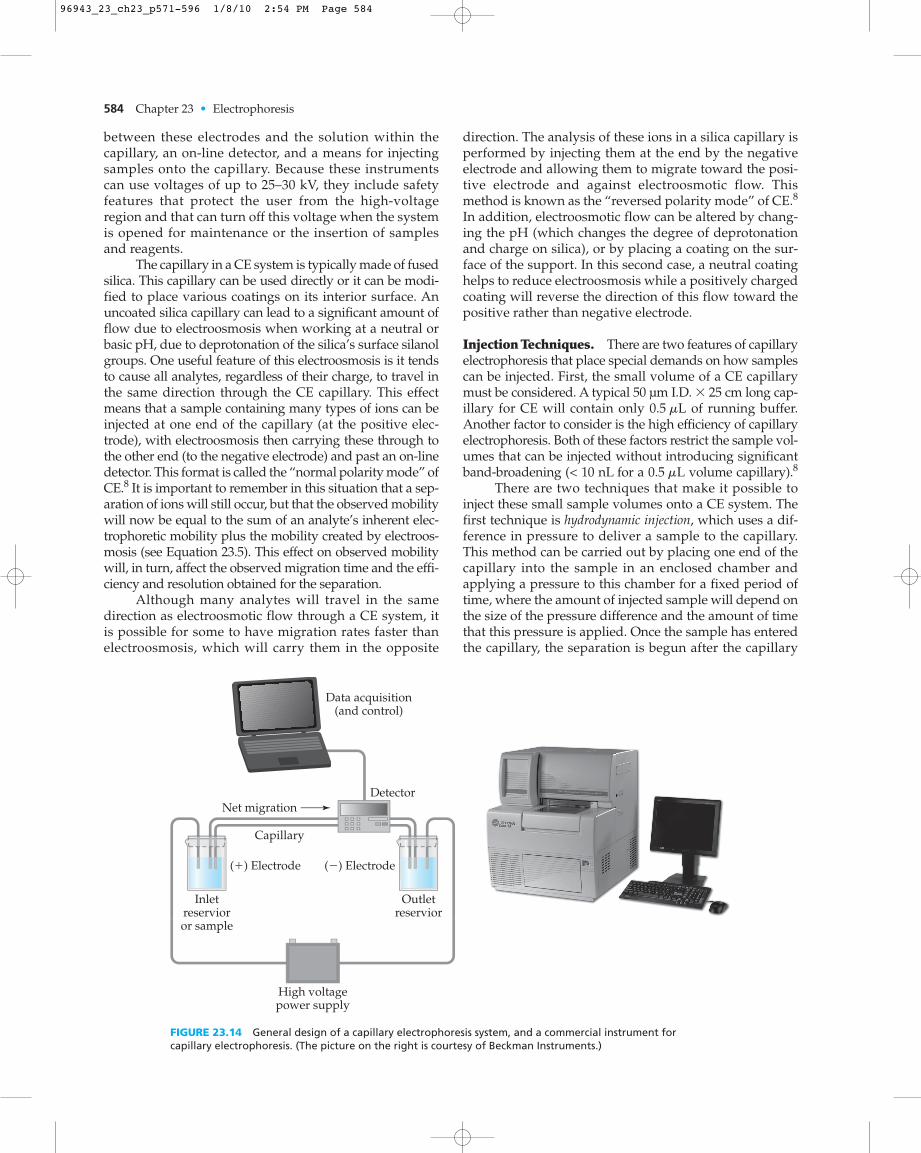

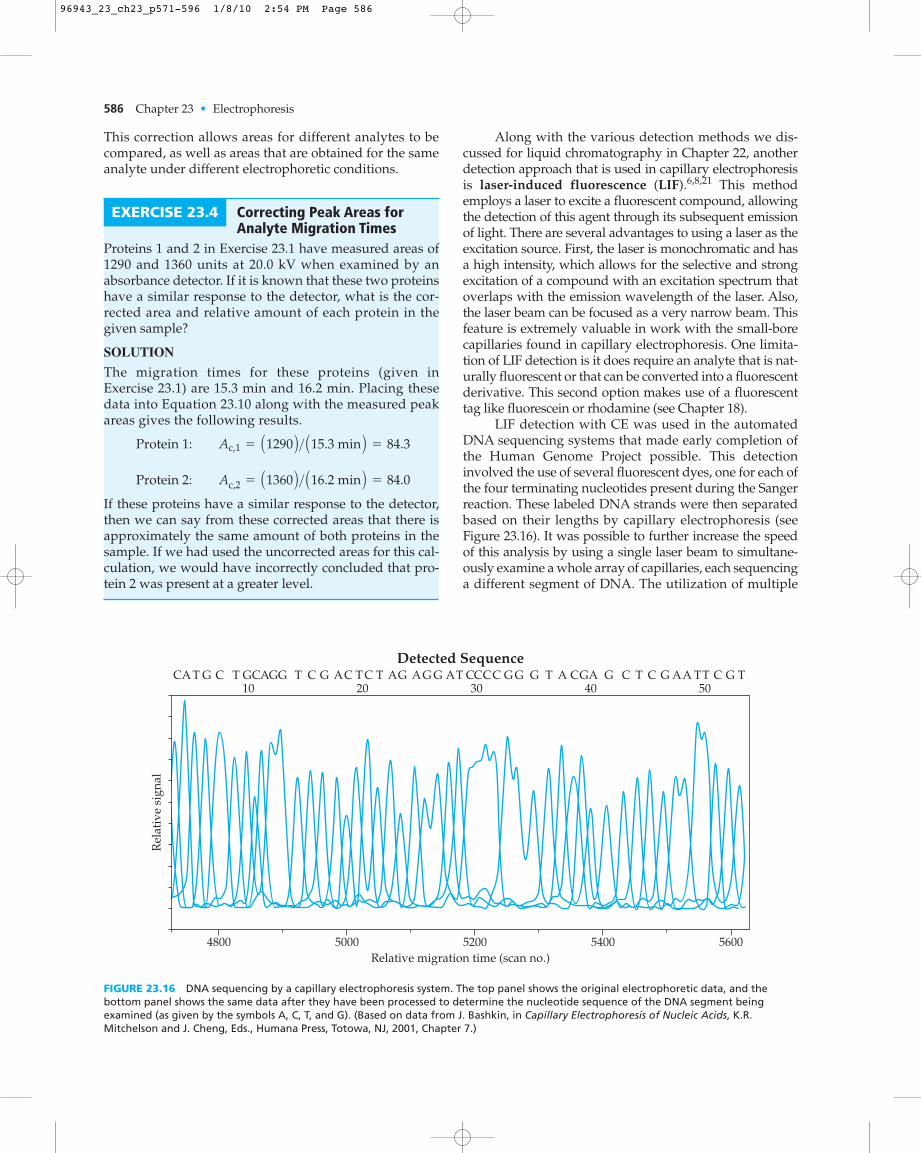
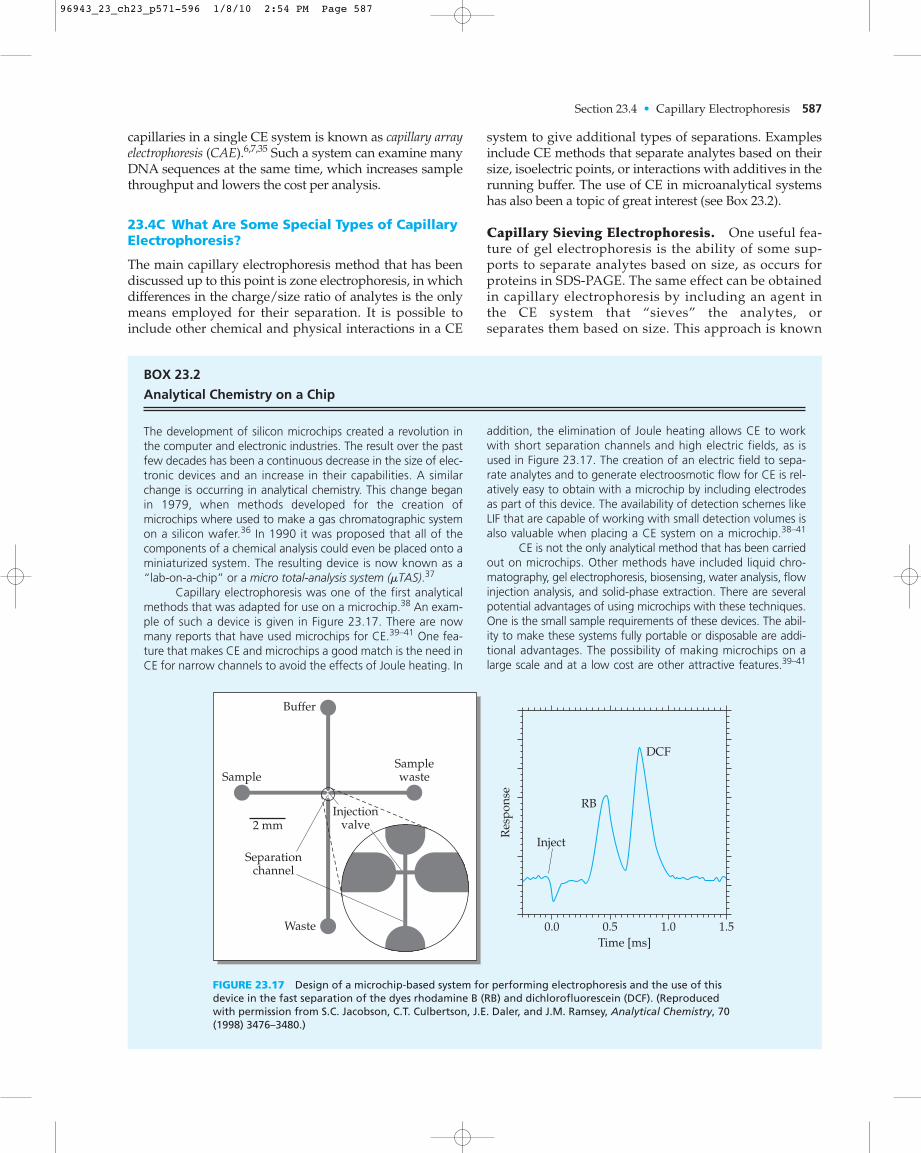
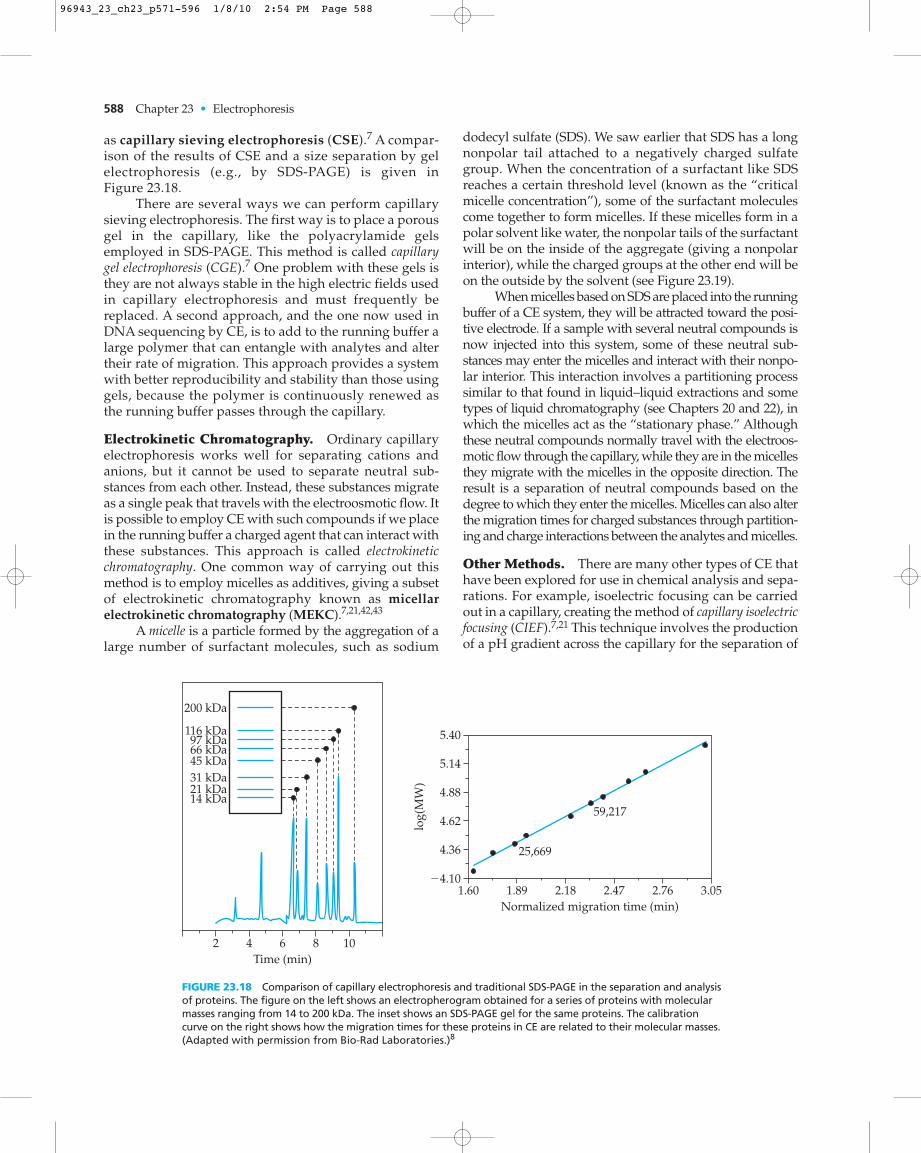


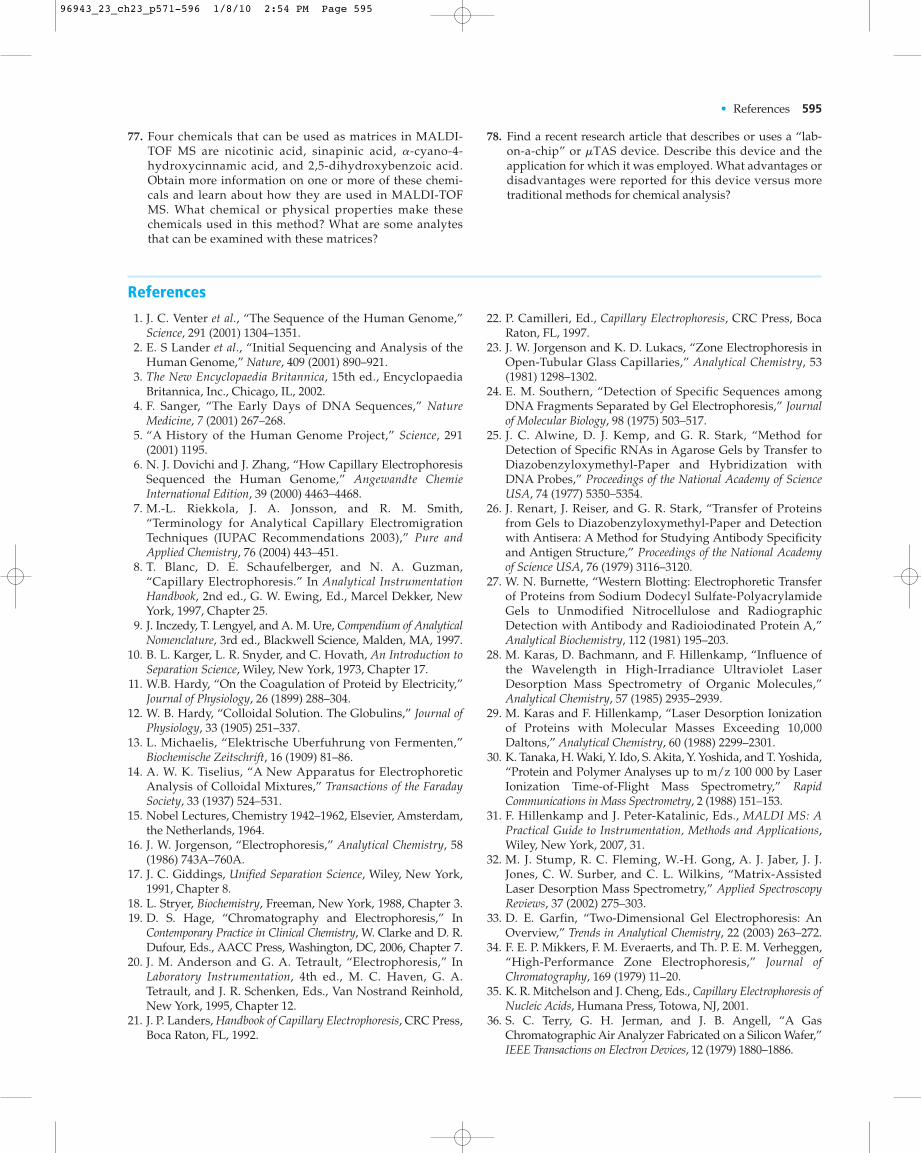


![DevelopmentofaMethodforRapidDeterminationof ...downloads.hindawi.com/journals/jamc/2018/9670481.pdf · matography (GC) [15–17], gas chromatography-mass spectrometry (GC-MS) [18],](https://static.documents.pub/doc/80x56/606182e5b600d91f494a9933/developmentofamethodforrapiddeterminationof-matography-gc-15a17-gas-chromatography-mass.jpg)


![MACROS: Molecular Analyzer for Complex Refractory Organic ... · matography (LC) [3]. This integration will achieve unprecedented capabilities within a compact instru-ment footprint,](https://static.documents.pub/doc/80x56/601d323a22127f43c43376b4/macros-molecular-analyzer-for-complex-refractory-organic-matography-lc-3.jpg)


![ElectrochemicalSensorforDeterminationofParathionBasedon ...downloads.hindawi.com/journals/ijelc/2011/986494.pdf · matography (GC),oftencoupledto mass spectroscopy (MS) [1, 2]. Direct](https://static.documents.pub/doc/80x56/5eaf040f96c164225e734be1/electrochemicalsensorfordeterminationofparathionbasedon-matography-gcoftencoupledto.jpg)
