Page 1
HAL Id: hal-01613032https://hal-lirmm.ccsd.cnrs.fr/hal-01613032v2
Submitted on 24 Oct 2017
HAL is a multi-disciplinary open accessarchive for the deposit and dissemination of sci-entific research documents, whether they are pub-lished or not. The documents may come fromteaching and research institutions in France orabroad, or from public or private research centers.
L’archive ouverte pluridisciplinaire HAL, estdestinée au dépôt et à la diffusion de documentsscientifiques de niveau recherche, publiés ou non,émanant des établissements d’enseignement et derecherche français ou étrangers, des laboratoirespublics ou privés.
Electrophysiological brain mapping: Basics of recordingevoked potentials induced by electrical stimulation and
its physiological spreading in the human brainMarion Vincent, David Guiraud, Hugues Duffau, Emmanuel Mandonnet,
François Bonnetblanc
To cite this version:Marion Vincent, David Guiraud, Hugues Duffau, Emmanuel Mandonnet, François Bonnetblanc. Elec-trophysiological brain mapping: Basics of recording evoked potentials induced by electrical stimulationand its physiological spreading in the human brain. Clinical Neurophysiology, Elsevier, 2017, 128 (10),pp.1886-1890. �10.1016/j.clinph.2017.07.402�. �hal-01613032v2�
Page 2
1
Electrophysiological brain mapping: basics of recording evoked potentials
induced by electrical stimulation and its physiological spreading in the human
brain.
Marion Vincent1, David Guiraud1, Hugues Duffau4, Emmanuel Mandonnet5,*, François
Bonnetblanc1,2,3,*,
1INRIA, Université de Montpellier, LIRMM, équipe Camin, F-34095 Montpellier, France.
2Cognition, Action et Plasticité Sensorimotrice, INSERM U1093, Université de
Bourgogne, UFR STAPS, F-27877 Dijon, France.
3Institut Universitaire de France, F-75005 Paris, France.
4Département de Neurochirurgie, Hôpital Gui de Chauliac, F-34295 Montpellier, France;
Institut des Neurosciences de Montpellier, INSERM U1051, Hôpital Saint Eloi, F-34091
Montpellier, France.
5Assistance Publique-Hôpitaux de Paris (AP-HP), Service de Neurochirurgie, Hôpital
Lariboisière, Paris, France. IMNC, UMR8165, Orsay, France. Université Paris 7 Diderot,
Paris, France.
*Both authors contributed equally to this work, corresponding authors:
[email protected] and [email protected]
Conflict of interest: None.
Page 3
2
Introduction
Being able to change or inhibit the activity of a region or population of neurons in the
brain is an essential approach in fundamental neuroscience, as it helps the researcher to
determine the functional role of neurons. This approach is also important at a more
applied level, for brain function mapping during neurosurgical procedures (Desmurget
et al. 2007). It is well known that electrical stimulation (ES) affects neural activity by
modifying the voltage gradient along the neuronal cell inducing depolarization or
hyperpolarization of the membrane. When a current flows in tissues around neuronal
cells, it can change their membrane potential and trigger an action potential. However,
this general principle can be applied in vivo via several different settings and much is
unknown about which neural elements are excited or inhibited locally (Ranck 1975) and
how this local perturbation spreads within the brain through physiological pathways
(Vincent et al. 2016a). We briefly present here different types of electrophysiological
potentials that are evoked by ES in the human brain and some basic methodological
considerations required for their correct assessment. Three different types of evoked
potentials should be distinguished:
- Cortical evoked-potential (also called direct cortical response, DCR), when
recording the cortex at the stimulation site,
- Cortico-axono-cortical evoked-potential, i.e. recording the cortex at a distant site
from the stimulating site. These potentials are elicited by physiological
propagation through white matter associative pathways from the locally
stimulated area towards the distal area,
- Axono-cortical evoked potentials, when the cortex is distally recorded from a
stimulation site within the white matter.
Page 4
3
These evoked potentials are technically difficult to observe. Their recording imposes
important methodological considerations about the way they can be triggered and
measured. In particular, we detail the factors potentially determining the generation of
true cortico-axono-cortical evoked potentials, spreading from one stimulated cortical
area to another distant one and passing through the white matter pathways. We further
offer an explanation about why a current frequency of 50-60 Hz is needed to obtain an
effect at the behavioural level. Finally, we propose a simple theory suggesting how ES
hyperpolarizes a cortical area, thus excluding this area from the network it belongs to.
As a result, the function is not anymore supported by this disconnected network. ES only
perturbs locally a single area within a network of several cortical areas “dialoguing”
together and thus perturbs its functional connectivity.
Methodological pitfalls when measuring evoked potentials in the brain
Measuring evoked potentials triggered by ES in the brain is somehow a difficult
challenge. Some requirements are needed in order to verify and check that the putative
variations in the voltage difference between the recording electrodes and their
reference is not due to stimulus and filtering artefacts, which are the consequences of
the electronic responses of the measuring system. Two requirements are quite simple,
but surprisingly never discussed before in the literature. First, the validity of any evoked
potential can be verified if the current polarity, even if it is a biphasic current, is
reversed, for instance by switching the poles of the probe, thus reversing the anode and
the cathode. This simple manipulation allows verifying that the polarity of true
physiological potentials is not reversed, whereas that of ES artefact is. In most cases,
biphasic current has been alternated mainly to cancel the stimulation artefacts when
averaging several trials together. However, by averaging, one cannot determine the
Page 5
4
electronic noise induced by the system, thus precluding to measure the evoked potential
on a trial-by-trial basis.
In particular, caution should be taken with respect to oscillations that can appear due to
the filter step response of the amplifier. In this case, it is important to analyse the data
on a trial-by-trial basis in order to accurately identify and remove this unphysiological
oscillation. Averaging several trials together without a detailed analysis of the raw
signals can clearly mask those oscillations and lead to false interpretations (Vincent et
al. 2016b).
Stimuli and recording parameters for the DCR and the ACEP
Usual cortical and white matter functional mappings were first completed on awake
patients using a current controlled stimulator (Nimbus, Captomed, France). DES was
delivered thanks to a bipolar probe (0.5 mm diameter electrode tips, 5 mm apart).
Constant-current biphasic square wave pulse of 1 ms duration each was applied at a
fixed frequency of 60 Hz. The current intensity was patient-specific within 1.5 to 2 mA.
EPs recordings were performed after the tumour resection, under general anaesthesia,
according to the following detailed set-up.
4-contacts strips of ECoG electrodes (4 mm exposed surface stainless steel contacts, 10
mm spaced, DIXI, France) were positioned on the surface of the brain. ECoG signals were
recorded using differential (contacts 1 to 3 and 5 to 7) and common mode (contacts 4
and 8) configurations. For the differential mode, both active and reference are two
adjacent electrodes of one strip. The signal was measured between each channel of
interest (active) and a reference electrode for the classical common mode configuration.
The reference electrode (Au cupule-electrode, G.tec, Austria) was located on the mastoid
Page 6
5
ipsilateral to the surgery. All channels were grounded to a patch-electrode located on
the same-side acromion.
ECoG signals were amplified and filtered (g.BSamp, G.tec, Austria) before being digitally
converted (PowerLab, ADInstrument). A band-pass filter was set to [0.5 Hz - 1 kHz] as it
allows acquiring all useful information of ECoG. To minimize the saturation of the
frontend amplifier, signals were recorded with a gain of 1,000. Using the 50 Hz Notch
filter integrated in the amplifier was required for all the recordings to ease the impact of
the electrical noise present in the operative room. Unused amplifier's channels were
bypassed. Finally, data were sampled at 10 kHz.
Low-frequency DES was performed at different cortical and sub-cortical sites, identified
as functional during the brain mapping. Stimulation intensities were adapted to each
patient and to the type of evoked potentials to record. DCRs were recorded with 5 and
10 Hz DES, applied with intensities ranging from 0.5 to 2 mA. ACEPs were induced by ~1
mA DES at 5 Hz.
The various types of potentials evoked by electrical stimulation.
Three different categories of cortical evoked potentials can be measured, depending on
the location of the recording electrodes relatively to the stimulating electrode.
The DCR is an electrical potential recorded in the immediate vicinity (distance to the
stimulation < 2-5 mm) of a focal electrical stimulation applied on the cortical surface
(Adrian 1936, Goldring et al. 1991, 1994, Vincent et al. 2016b). This potential can either
be negative or positive depending on the recording mode. For the classical common
mode configuration, the signal is measured between each active electrode and a distant
reference electrode or an average of all electrodes’ signals and the DCR appears to be
Page 7
6
negative. For a differential recording mode in which an adjacent electrode serves as
reference for the nearest electrode in order to improve the focality, the DCR can either
be negative or positive depending on the location of the potential towards the active and
reference electrodes (Vincent et al. 2016b). Its amplitude peaks between 15-25 ms after
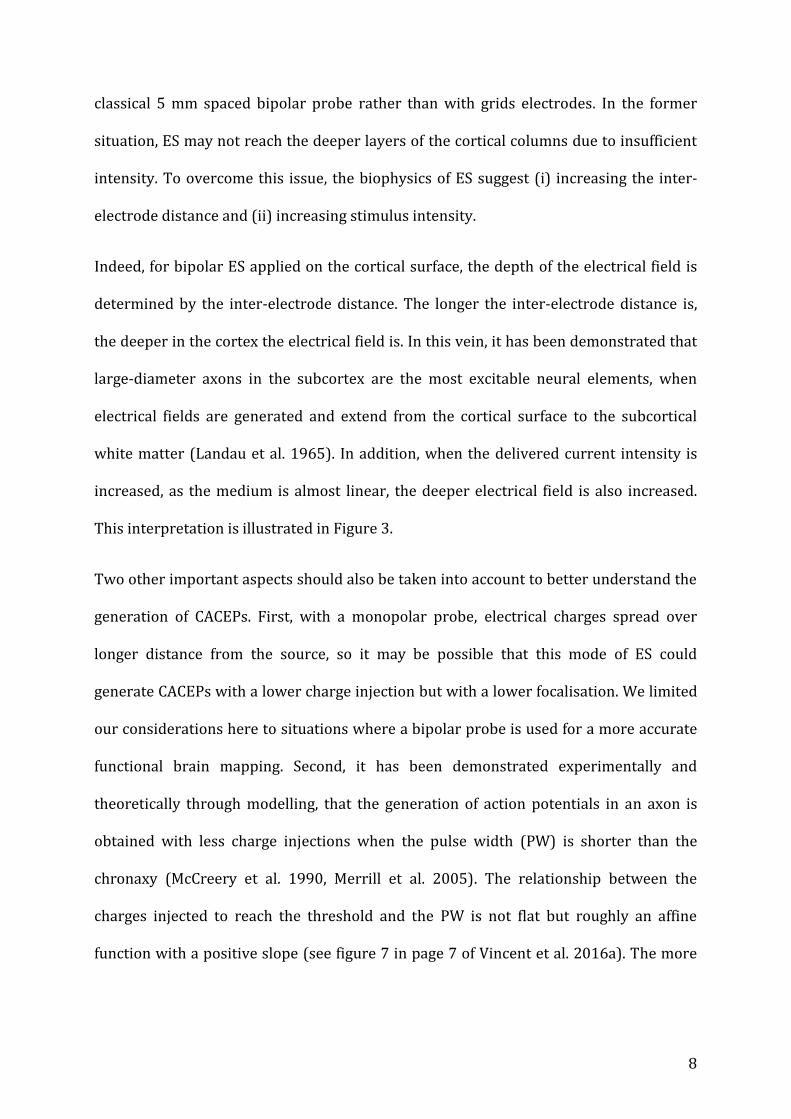
the beginning of the stimulation. A typical DCR is presented in Figure 1.
------------------------------------------------------
Please insert Figure 1 here
------------------------------------------------------
It has been suggested that the DCR depends mainly on post-synaptic events. A weak
stimulus evokes a 20 ms negative deflection called the primary negative potential that
represents excitatory post-synaptic potentials of apical dendrites (Goldring et al. 1994).
In addition, it is also assumed that the DCR has different profiles that are correlated to
the local cytoarchitectonic organisation of the stimulated area (Goldring et al. 1994).
They also could be used to establish in real-time and in vivo the electrophysiological
state of a particular area as for instance the level of excitability (Vincent et al. 2016b)
The ACEP is also an electrical potential recorded on the cortical surface (Mandonnet et
al. 2016, Yamao 2014), but obtained when the subcortical white matter pathways are
directly stimulated in the cavity (e.g. after resection of a brain tumor). As for DCR, this
potential can either be positive or negative depending on the recording mode. In theory
it could be recorded quite far from the site of ES, however a single proof of an ACEP has
been obtained ~3 cm further from the site of stimulation (Yamao et al. 2014). For
similar parameters, its amplitude peaks before that of a DCR and around 10-25 ms after
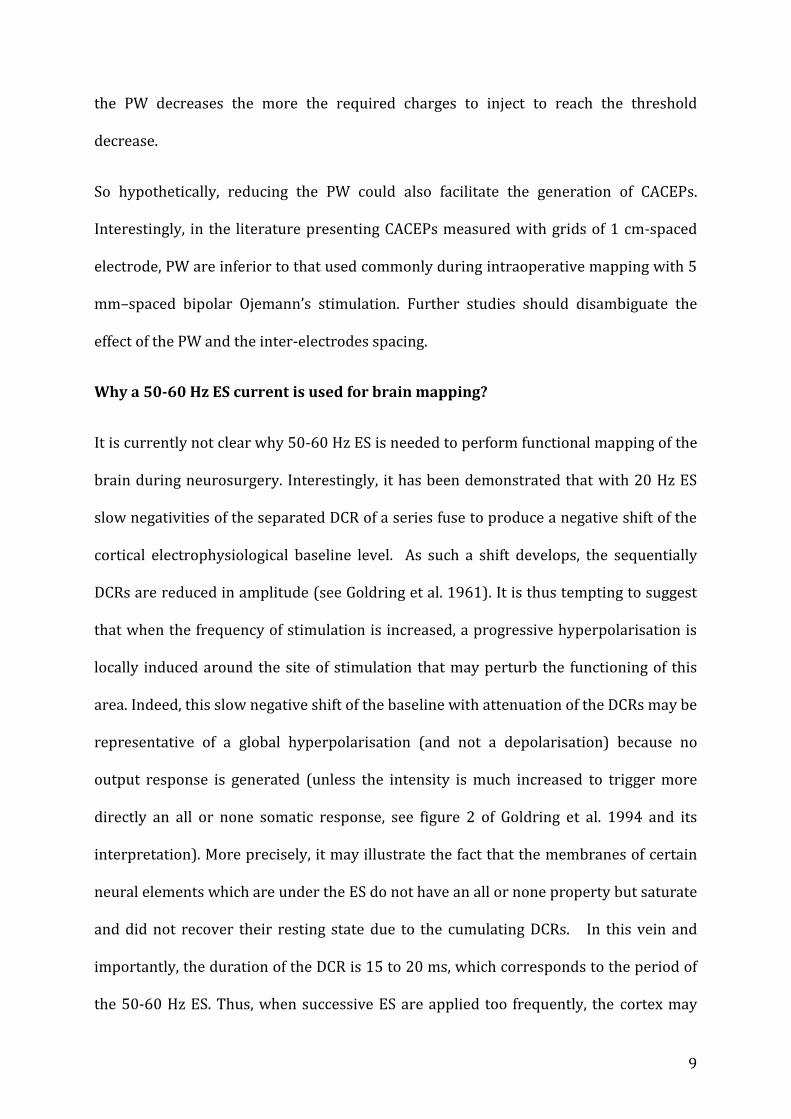
the beginning of the stimulation. A typical ACEP is presented in Figure 2.
Page 8
7
------------------------------------------------------
Please insert Figure 2 here
------------------------------------------------------
The true cortico-cortical evoked potential (CCEP), that should rather be named cortico-
axono-cortical evoked potential (CACEP), is a post-synaptic potential recorded on the
cortical surface. It is obtained when a distant cortical area is stimulated (Matsumoto et
al. 2004 and Keller et al. 2011). This type of potential might be more difficult to measure
in the context of intraoperative brain mapping performed with the standard bipolar
probe. It has mainly been described in the context of epilepsy when two adjacent
electrodes of subdural electrocorticographic grids (ECoG) were used to produce a
bipolar stimulation (space between the two poles: ~10 mm) and for high intensity
(around 10 mA). We do not present a typical CACEP since there is currently no raw and
single measurement of one sample without averaging of a large amount of trials
together (see previous methodological considerations). As reported above, in all this
literature, the main requirements for evoked potential verification were not identified
and discussed adequately.
How to obtain true CACEP?
As mentioned previously, CACEPs have only been measured in the context of epilepsy
(Matsumoto et al. 2004, Keller et al. 2011), when ES was applied thanks to subdural
grids and two contacts were used as a cathode and an anode for bipolar stimulations.
Such CACEPs have been not yet reported when stimulating with a classical 5 mm spaced
bipolar probe. The comparison between these two modes of ES is important and yields a
main hypothesis to explain why it could be more difficult to observe CACEPs with a
Page 9
8
classical 5 mm spaced bipolar probe rather than with grids electrodes. In the former
situation, ES may not reach the deeper layers of the cortical columns due to insufficient
intensity. To overcome this issue, the biophysics of ES suggest (i) increasing the inter-
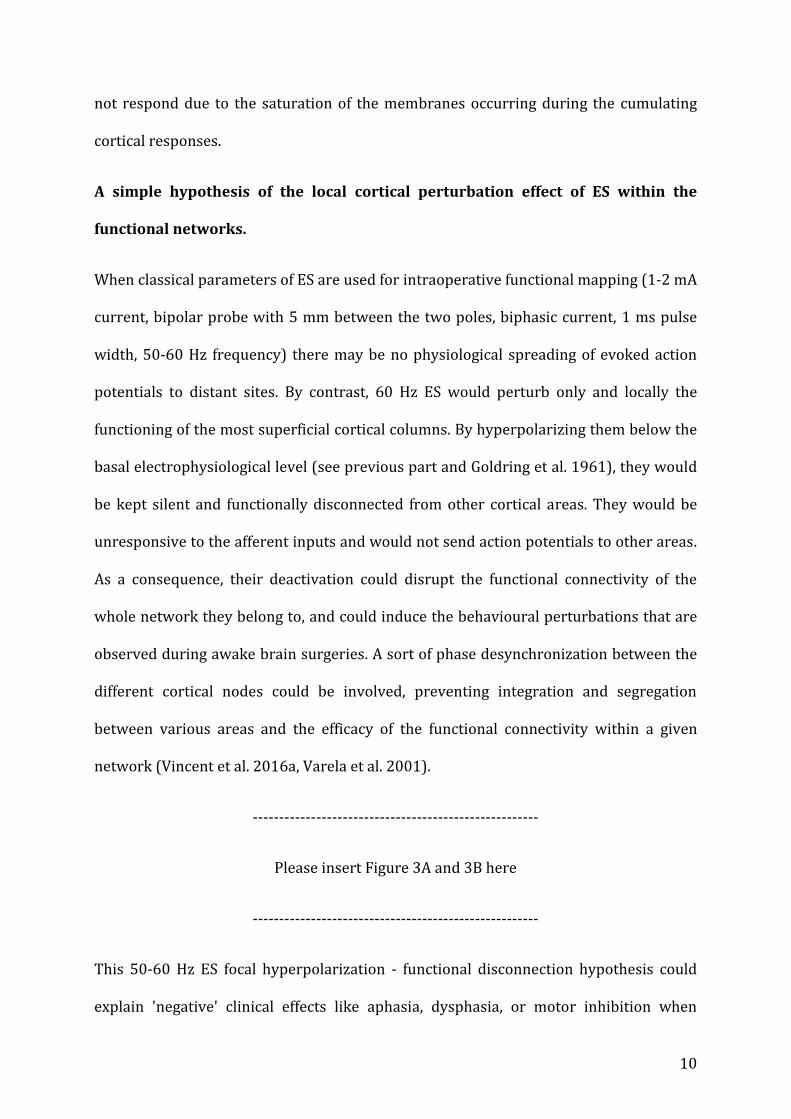
electrode distance and (ii) increasing stimulus intensity.
Indeed, for bipolar ES applied on the cortical surface, the depth of the electrical field is
determined by the inter-electrode distance. The longer the inter-electrode distance is,
the deeper in the cortex the electrical field is. In this vein, it has been demonstrated that
large-diameter axons in the subcortex are the most excitable neural elements, when
electrical fields are generated and extend from the cortical surface to the subcortical
white matter (Landau et al. 1965). In addition, when the delivered current intensity is
increased, as the medium is almost linear, the deeper electrical field is also increased.
This interpretation is illustrated in Figure 3.
Two other important aspects should also be taken into account to better understand the
generation of CACEPs. First, with a monopolar probe, electrical charges spread over
longer distance from the source, so it may be possible that this mode of ES could
generate CACEPs with a lower charge injection but with a lower focalisation. We limited
our considerations here to situations where a bipolar probe is used for a more accurate
functional brain mapping. Second, it has been demonstrated experimentally and
theoretically through modelling, that the generation of action potentials in an axon is
obtained with less charge injections when the pulse width (PW) is shorter than the
chronaxy (McCreery et al. 1990, Merrill et al. 2005). The relationship between the
charges injected to reach the threshold and the PW is not flat but roughly an affine
function with a positive slope (see figure 7 in page 7 of Vincent et al. 2016a). The more
Page 10
9
the PW decreases the more the required charges to inject to reach the threshold
decrease.
So hypothetically, reducing the PW could also facilitate the generation of CACEPs.
Interestingly, in the literature presenting CACEPs measured with grids of 1 cm-spaced
electrode, PW are inferior to that used commonly during intraoperative mapping with 5
mm–spaced bipolar Ojemann’s stimulation. Further studies should disambiguate the
effect of the PW and the inter-electrodes spacing.
Why a 50-60 Hz ES current is used for brain mapping?
It is currently not clear why 50-60 Hz ES is needed to perform functional mapping of the
brain during neurosurgery. Interestingly, it has been demonstrated that with 20 Hz ES
slow negativities of the separated DCR of a series fuse to produce a negative shift of the
cortical electrophysiological baseline level. As such a shift develops, the sequentially
DCRs are reduced in amplitude (see Goldring et al. 1961). It is thus tempting to suggest
that when the frequency of stimulation is increased, a progressive hyperpolarisation is
locally induced around the site of stimulation that may perturb the functioning of this
area. Indeed, this slow negative shift of the baseline with attenuation of the DCRs may be
representative of a global hyperpolarisation (and not a depolarisation) because no
output response is generated (unless the intensity is much increased to trigger more
directly an all or none somatic response, see figure 2 of Goldring et al. 1994 and its
interpretation). More precisely, it may illustrate the fact that the membranes of certain
neural elements which are under the ES do not have an all or none property but saturate
and did not recover their resting state due to the cumulating DCRs. In this vein and
importantly, the duration of the DCR is 15 to 20 ms, which corresponds to the period of
the 50-60 Hz ES. Thus, when successive ES are applied too frequently, the cortex may
Page 11
10
not respond due to the saturation of the membranes occurring during the cumulating
cortical responses.
A simple hypothesis of the local cortical perturbation effect of ES within the
functional networks.
When classical parameters of ES are used for intraoperative functional mapping (1-2 mA
current, bipolar probe with 5 mm between the two poles, biphasic current, 1 ms pulse
width, 50-60 Hz frequency) there may be no physiological spreading of evoked action
potentials to distant sites. By contrast, 60 Hz ES would perturb only and locally the
functioning of the most superficial cortical columns. By hyperpolarizing them below the
basal electrophysiological level (see previous part and Goldring et al. 1961), they would
be kept silent and functionally disconnected from other cortical areas. They would be
unresponsive to the afferent inputs and would not send action potentials to other areas.
As a consequence, their deactivation could disrupt the functional connectivity of the
whole network they belong to, and could induce the behavioural perturbations that are
observed during awake brain surgeries. A sort of phase desynchronization between the
different cortical nodes could be involved, preventing integration and segregation
between various areas and the efficacy of the functional connectivity within a given
network (Vincent et al. 2016a, Varela et al. 2001).
------------------------------------------------------
Please insert Figure 3A and 3B here
------------------------------------------------------
This 50-60 Hz ES focal hyperpolarization - functional disconnection hypothesis could
explain 'negative' clinical effects like aphasia, dysphasia, or motor inhibition when
Page 12
11
stimulating association cortices. However, it appears to explain less well the 'positive'
clinical effects like focal tonic-clonic movement, paresthesiae or phosphines commonly
observed when stimulating primary motor, sensory or visual cortices. In these latter
cases, there may be an indirect disinhibition of pyramidal neurons, through the ES-
induced inhibition. This disinhibition could depend also on many architectonic factors of
the stimulated areas, including the role of local inhibitory networks and the way a given
area integrates successive ES pulses (electrophysiological response to the frequency
modulation). Further efforts should be made to better understand this fascinating
phenomenon.
Correctly measuring evoked potentials in the human brain induced by electrical
stimulation is important in the clinical domain especially in the neurosurgical context. It
remains challenging because of many pitfalls that can occur at the methodological level
and few teams in the world are currently able to efficiently record these evoked
potentials. Nevertheless, they can give strong real-time in-vivo insights into the
functional state and connectivity of a patient’s brain.
In the next years measuring intraoperatively the evoked potentials with ES in the brain
will be a new method for mapping the brain in vivo and in real time and taking into
account the specificity of each patient’s brain.
Acknowledgments: We thank Pr David B. MacDonald for his precise and stimulating
comments about the present work.
Page 13
12
References
Adrian ED (1936) The spread of activity in cerebral cortex. J Physiol 88: 127-161.
Desmurget M, Bonnetblanc F, and Duffau H (2007) Contrasting acute and slow-growing
lesions: a new door to brain plasticity. Brain 130: 898–914.
Goldring S, Jerva MJ, Holmes TG, O’Leary JL, Shields JR (1961) Direct response of human
cerebral cortex. Arch Neurol 4:22-30.
Goldring S, Harding GW, Gregorie EM (1994) Distinctive electrophysiological
characteristics of functionally discrete brain areas: a tenable approach to functional
localization. J Neurosurg 80:701-709.
Histed, M.H., Bonin, V., and Reid, R.C. (2009). Direct activation of sparse, distributed
populations of cortical neurons by electri- cal microstimulation. Neuron 63, 508–522.
Keller, C.J., Bickel, S., Entz, L., Ulbert, I., Milham, M.P., Kelly, C., and Mehta, A.D. (2011).
Intrinsic functional architecture predicts electrically evoked responses in the human
brain. Proc. Natl. Acad. Sci. USA 108, 10308–10313.
Landau WM, Bishop GH, Clare MH (1965) Site of excitation in stimulation of the motor
cortex. J Neurophysiol 28:1206-1222.
Mandonnet E, Dadoun Y, Poisson I, Madadaki C, Froelich S, Lozeron P (2016) Axono-
cortical evoked potentials: a proof-of-concept study. Neurochirurgie 62:67-71.
Matsumoto, R., Nair, D.R., LaPresto, E., Najm, I., Bingaman, W., Shibasaki, H., and Lüders,
H.O. (2004) Functional connectivity in the human language system: a corticocortical
evoked potential study. Brain 127, 2316–2330.
Page 14
13
McCreery DB, Agnew WF, Yuen TGH, Bullara LA (1990) Charge density and charge per
phase as cofactors in neural injury induced by electrical stimulation. IEEE Trans Biomed
Eng ;37:996–1001
Merrill, D.R., Bikson, M., and Jefferys, J.G.R. (2005). Electrical stimulation of excitable
tissue: design of efficacious and safe protocols. J. Neurosci. Methods 141, 171–198.
Ranck, J. B. (1975). Which elements are excited in electrical stimulation of mammalian
central nervous system: a review. Brain research, 98(3), 417-440.
Varela F, Lachaux JP, Rodriguez E, Martinerie J (2001) The brainweb: phase
synchronization and large-scale integration. Nat Rev Neurosci 2(4):229-39.
Vincent M, Rossel O, Hayashibe M, Herbet G, Duffau H, Guiraud D, Bonnetblanc F (2016a)
The difference between electrical microstimulation and direct electrical stimulation –
towards new opportunities for innovative functional brain mapping? Rev Neurosci
27:231-58.
Vincent M, Rossel O, Duffau H, Bonnetblanc F, Guiraud D (2016b) A measure of cortico-
cortical potentials evoked by 10 Hz direct electrical stimulation of the brain and by
means of a differential recording mode of electrocorticographic signals. Conf Proc IEEE
Eng Med Biol Soc 4543-4546.
Yamao Y, Matsumoto R, Kunieda T, Arakawa Y, Kobayashi K, Usami K, Shibata S, Kikuchi
T, Sawamoto N, Mikuni N, et al. (2014) Intraoperative dorsal language network mapping
by using single-pulse electrical stimulation. Human brain mapping, 35(9):4345-4361.
Page 15
14
Figure captions
Figure 1. ECoG signal corresponding to the stimulation of a cortical site close to the
electrode (gain = 104). A raw negative DCR (no averaging) can be observed ~25ms
systematically after the three stimulation artefacts. Current Intensity = 0.5mA and ES
frequency = 5Hz. Identical DCR were also observed when the polarity of the ES was
reversed. Note that a constant and recurrent noise is present here probably due to the
scialytic operation lights. Electrophysiological measurement in the operating room is a
challenging task. Measures were made using a differential recording mode (Vincent et al.
2016b).
Figure 2. ECoG signal corresponding to the stimulation of subcortical white matter
pathways about 2 cm from the electrode (gain = 104). A raw positive ACEP (no
averaging) can be observed ~25ms after the stimulation artefact. Current Intensity =
1mA and ES frequency = 5Hz. Identical ACEP were also observed when the polarity of
the ES was reversed. Measures were made using a differential recording mode (Vincent
et al. 2016b).
Figure 3. A. Superficial cortical effects of the ES when the space between the two poles of
the bipolar electrode is not sufficient (~0.5 cm) to excite deeper neurons and axons to
induce a CACEP. Only local effects can be triggered (DCR) at low frequency. B. When the
ES frequency is increased (up to 20 Hz) the basal electrophysiological level may be
hyperpolarized progressively and the DCR may be attenuated thereby perturbing the
functional connectivity of the whole network.
B. Deeper cortical effects of the ES when the space between the two poles is sufficiently
large (~1 cm) and current is increased (~[10;20]mA) like when using two electrodes of
Page 16
15
a subdural ECoG grid in epilepsy. The electrical field lines vehicle a sufficient charge in
the deeper cortical layer to excite neurons or axons with long range projections to more
distant cortical areas, and thereby induce a CACEP.