Page 1
University of ConnecticutOpenCommons@UConn
Honors Scholar Theses Honors Scholar Program
Spring 4-28-2015
Electrophysiological Changes in P200 Latency andAmplitude of Jittered Orientation VisualIntegration Task in Healthy Participants: a Multi-Block Design EEG StudyMonika M. RozynskiUniversity of Connecticut - Storrs, [email protected]
Chi-Ming ChenUniversity of Connecticut - Storrs
Follow this and additional works at: https://opencommons.uconn.edu/srhonors_theses
Part of the Biological Psychology Commons, Cognition and Perception Commons, and theCognitive Psychology Commons
Recommended CitationRozynski, Monika M. and Chen, Chi-Ming, "Electrophysiological Changes in P200 Latency and Amplitude of Jittered OrientationVisual Integration Task in Healthy Participants: a Multi-Block Design EEG Study" (2015). Honors Scholar Theses. 433.https://opencommons.uconn.edu/srhonors_theses/433
Page 2
Running head: P200 JOVI EEG
1
Electrophysiological Changes in P200 Latency and Amplitude of
Jittered Orientation Visual Integration Task in Healthy Participants:
a Multi-Block Design EEG Study
Monika Rozynski
Under the thesis advisement of Chi-Ming Chen, Ph.D.
Under the honors advisement of Heather Read, Ph.D.
Honors Thesis
Department of Psychology: Translational Research and Neural Stimulation Lab
University of Connecticut
Storrs, CT
Spring 2015
Author Note
Address correspondence to Monika Rozynski, Department of Psychology, University of
Connecticut, Bousfield Building, 406 Babbidge Road, U-1020, Storrs, Connecticut 06269-1020,
USA. Email: [email protected]
Page 3
P200 JOVI EEG 2
Abstract
Visual integration, the ability to fuse environmental information such as light, color, shades, and
motion to form a representation of a whole cohesive higher-order visual image, is impaired in
persons with schizophrenia. Little is known how the P200 component, an event-related potential
(ERP) in the parieto-occipital region, is affected in persons with schizophrenia while they
perform visual integration tasks, when compared to healthy persons. This study administered
Gabor contours that varied in high and low degrees of orientational jitter through the Jitter
Orientation Visual Integration (JOVI) task to investigate visual integration by analyzing latency
and amplitude of the P200 component. Data was acquired via EEG from seventeen healthy
participants. The purpose of this study was to assess difficulty of jitter on the latency and
amplitude of P200, and the electrophysiological effect from practice when comparing the last
block data with the first block data. The mean amplitude of the hard difficulty jitters (11, 13, and
15 degrees) was found to be significantly larger than that of the easy difficulty jitters (0, 7, and 9
degrees). A trend in the latency of P200 between hard difficulty and easy difficulty was found.
No interaction between blocks and latency and amplitude was found. Data from this study will
be further used and analyzed when EEG data is acquired from patients with schizophrenia in the
upcoming years.
Keywords: P200, integration, latency, amplitude, EEG, JOVI, schizophrenia
Page 4
P200 JOVI EEG 3
Electrophysiological Changes in P200 Latency and Amplitude of
Jittered Orientation Visual Integration Task in Healthy Participants:
a Multi-Block Design EEG Study
Schizophrenia, a mental disorder that causes visual and auditory hallucinations,
delusions, disorganized thinking and behavior, depressive-like symptoms, and cognitive
impairments affects approximately 2.5 million Americans (National Institute of Mental Health).
The psychopharmacology for treatment for schizophrenia, and behavioral profiles have been
extensively studied, but only recently has great interest been expressed in understanding the
neurological processes underlying the disease (Silverstein et al., 2011). The Cognitive
Neuroscience Treatment Research to Improve Cognition in Schizophrenia (CNTRICS) is an
initiative that started in 2011 to focus neuroscience on finding treatments for impaired cognitive
systems in humans. Visual integration, one of the four core paradigms in the CNTRICS
initiative, is the process that fuses local visual environmental information such as light, color,
shades, and motion to form a cohesive complex higher-order visual image; people with
schizophrenia are known to have deficits in this type of visual perception (Kozma-Wiebe et al.,
2006; Silverstein et al., 2011; Wynn et al., 2015). Interestingly enough, it is suggested that the
reduced ability to organize stimulus segments at the neuronal level is correlated to clinical
behavioral aspects of disorganization (Silverstein, 2000).
The neural systems underlying the visual systems are complex, and perceptual
organization cannot be localized to a specific brain region or latency (Silverstein & Keane,
2011). The visual system consists of the magnocellular and parvocellular pathways which start in
the retina, project through the lateral geniculate nucleus, and synapse on the different layers of
V1, the primary visual cortex (Butler, Silverstein, & Dakin, 2008). The magnocellular pathway
Page 5
P200 JOVI EEG 4
extends to the dorsal parieto-occipital stream that is involved in eye movement control, motion
perception, and visual as well as somatosensory integration where the global motion of large
complex objects is processed (Butler et al., 2008). The parvocellular pathway extends to the
ventral tempero-occipital stream where orientation and size in V1, contour and form in V2, and
shape in V4 are processed due to its main role in object recognition (Ungerleider & Pasternak,
2004; Butler et al., 2008). Data from a study by Silverstein et al., 2009 using BOLD signal and
fMRI data suggest that V2, V3, and V4, the higher-order visual areas in the ventral tempero-
occipital stream are underactivated during visual integration processes in schizophrenic patients
when compared with healthy individuals.
Visual integration can be studied using variants of a contour integration paradigm
(Silverstein et al., 2011). In our study, visual integration was examined using the Jittered
Orientation Visual Integration (JOVI) task. JOVI utilizes Gabor shaped luminance patches,
which are Gaussian-modulated sinusoidal luminance variations that resemble the structure of the
receptive field orientation simple cells in the primary visual cortex, V1 (Kozma-Wiebe et al.,
2006; Silverstein et al., 2011). When adjacent line segments, or in this example, Gabor patches
have similarly oriented long-axes, they are perceptually grouped together as part of a coherent
visual contour (Kovács, Polat, Pennefather, Chandna, & Norcia, 2000; Li & Gilbert, 2002;
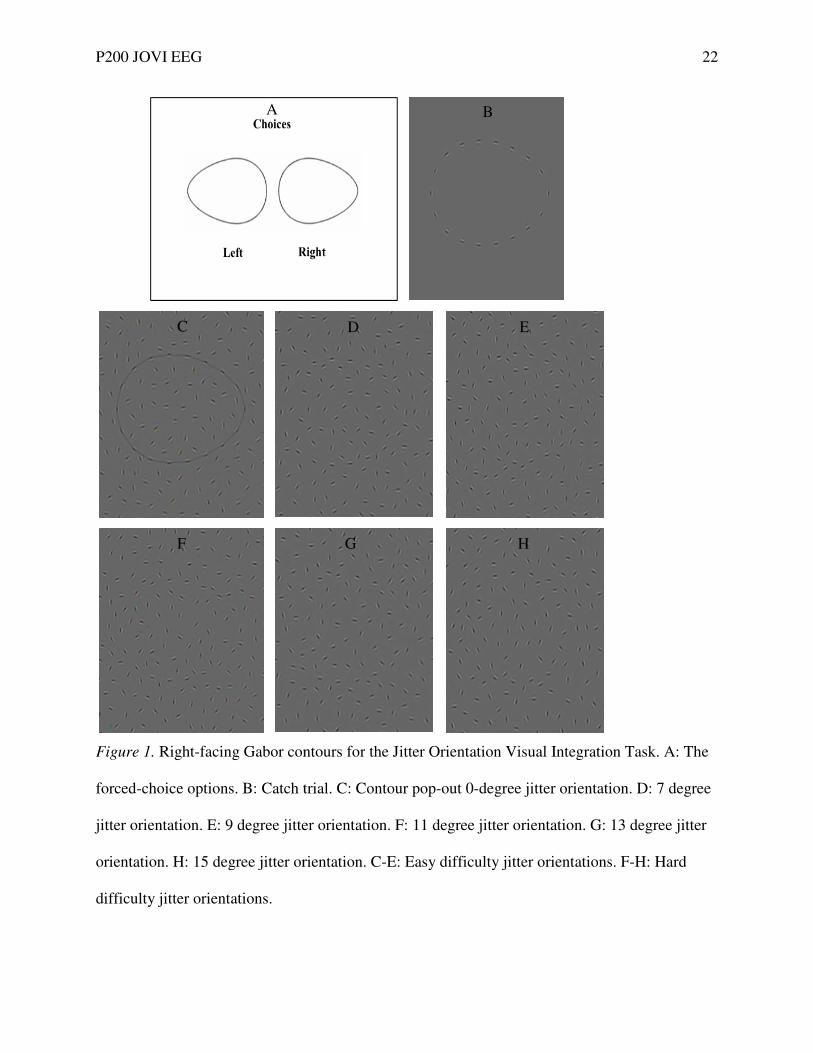
Silverstein et al., 2009). For example, Figure 1 C illustrates an egg-shaped contour pop-out
constructed with an 18 element Gabor patch surrounded by many distractor Gabor patches with
uncorrelated orientations. All contours in Figure 1 had a 5 cycles/degree spatial frequency and
contrast was approximately 95% (Silverstein, Kovács, Corry, & Vallone, 2000). As the Gabor
patch orientation correlation is reduced, the perceived contour no longer segments or pops-out
from the distractors (Silverstein et al., 2009). Task performance by people with schizophrenia
Page 6
P200 JOVI EEG 5
using simple, closed contours, for example, showed unimpaired results due to little integration
cortical processing needed, but the visual integration processing was impaired with non-closed,
complex images that need to be perceptually integrated into a whole (Silverstein et al., 2009).
The perception of the Gabor contour requires the receptive field orientation simple cells in V1 to
code the orientation-correlated contour line segments (Li and Gilbert, 2002; Kozma-Wiebe et al.,
2006; Silverstein et al., 2009). Higher visual areas such as V2, V3, and V4 are where coherent
contour visual information is initially grouped and, as a result, are also involved in field
orientation feedback (Silverstein et al., 2009).
Our study uses the JOVI task and an electroencephalogram (EEG) to measure event
related potentials (ERPs), which are ideal due to their ability to access different stages of
integration processing because of their high temporal resolution (Butler et al., 2013). We are
mainly focused on the P200 component, a parieto-occipital region ERP. P200 is a positive-
amplitude spike in neural activity approximately 125-275 milliseconds after a stimulus is
presented (Schizophrenia Research Institute: P200-EEG, 2013). P200 has been proposed as a
biological marker for schizophrenia in terms of amplitude and latency (Schizophrenia Research
Institute: P200-EEG, 2013). Very little is known about the nature of the P200 ERP component or
its’ role in schizophrenia processes (Wynn et al., 2015).
The purpose of this study was to use EEG to investigate visual integration in healthy
participants and examine amplitude and latency of P200 of hard and easy jitter orientation
difficulties. As aforementioned, Silverstein et al. (2009) found that as the contour orientation
jitter gets higher, the perceived contour segmentation is reduced (Silverstein et al., 2009). Butler
et al. (2013) found that the N120 and closure negativity (Ncl) components showed a significant
amplitude difference between low versus high jitter stimuli, and ERP current source density
Page 7
P200 JOVI EEG 6
response effects between patients with schizophrenia and controls in P100 showed a significant
difference but did not examine P200 in their study. Here, we hypothesized that P200 latency and
amplitude will be longer and larger respectively, when perceived contour segmentation is
reduced due to orientation jitter. Pernet et al. (2003) suggest that P200 is involved with implicit
memory of stimuli, due to their findings of over-learned stimuli resulting in short P200 latency
and unfamiliar stimuli resulting in longer P200 latency. These findings suggest that there could
be a potential electrophysiological effect from practice between blocks. Accordingly, we
hypothesized that there would be an electrophysiological effect from practice when comparing
the 4th
block data with the 1st block data.
Method
Measures
Participants took part in a medical and psychiatric screening that was used to exclude
participants with any possible psychological disorders. They also participated in a vision test to
check for any vision issues. Participants were first screened by a general medical history
evaluation form, Edinburgh Handedness Questionnaire (Oldfield, 1971), and then, participated in
a Structured Clinical Interview for DSM Disorders, non-patient version (SCID-I/NP) (First,
Spitzer, Gibbon, & Williams, 2002) as well as a Brief Visuospatial Memory Test (BVMT)
(Benedict, Schretlen, Groninger, Dobraski, & Shpritz, 1996). Sensory Gating Inventory (SGI)
(Hetrick, Erickson, & Smith, 2012), and the Schizotypal Personality Questionnaire (SPQ)
(Raine, 1991) were also administrated to assess each participant’s level in the spectrums of
sensory processing and schizotypal personality, respectively. All assessments were conducted by
the lead researcher or a graduate student. A 64 electrode EEG cap was used to record responses
from the JOVI task.
Page 8
P200 JOVI EEG 7
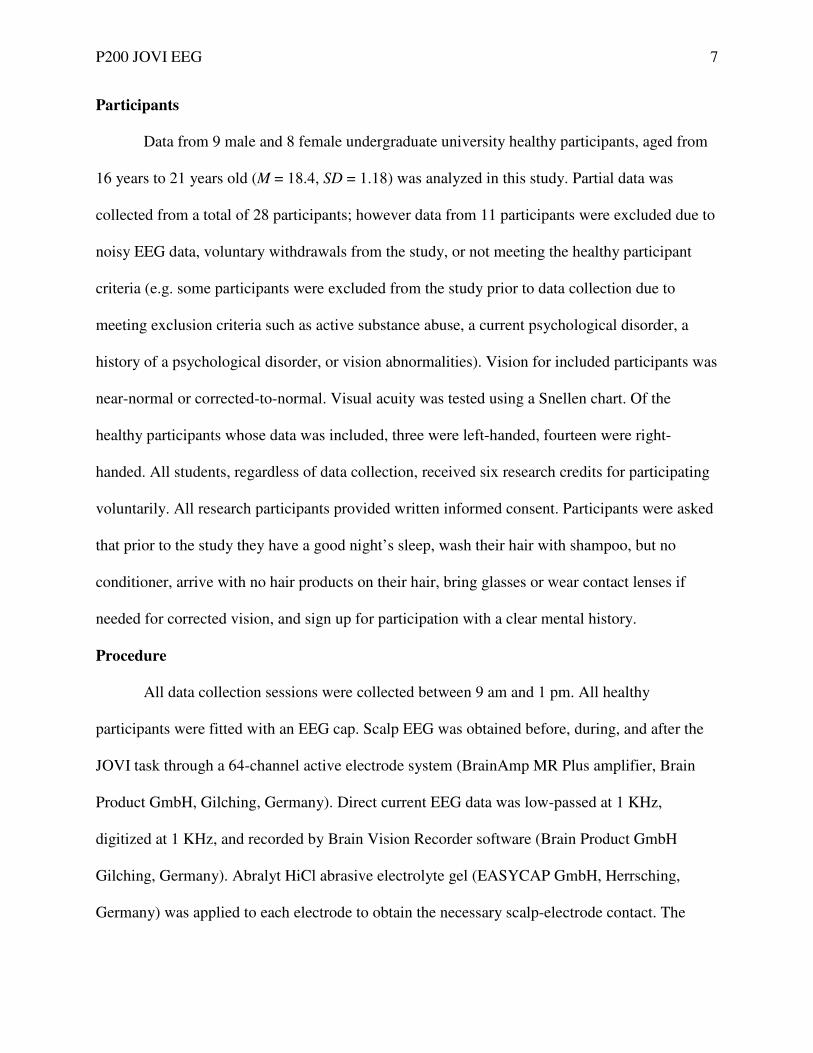
Participants
Data from 9 male and 8 female undergraduate university healthy participants, aged from
16 years to 21 years old (M = 18.4, SD = 1.18) was analyzed in this study. Partial data was
collected from a total of 28 participants; however data from 11 participants were excluded due to
noisy EEG data, voluntary withdrawals from the study, or not meeting the healthy participant
criteria (e.g. some participants were excluded from the study prior to data collection due to
meeting exclusion criteria such as active substance abuse, a current psychological disorder, a
history of a psychological disorder, or vision abnormalities). Vision for included participants was
near-normal or corrected-to-normal. Visual acuity was tested using a Snellen chart. Of the
healthy participants whose data was included, three were left-handed, fourteen were right-
handed. All students, regardless of data collection, received six research credits for participating
voluntarily. All research participants provided written informed consent. Participants were asked
that prior to the study they have a good night’s sleep, wash their hair with shampoo, but no
conditioner, arrive with no hair products on their hair, bring glasses or wear contact lenses if
needed for corrected vision, and sign up for participation with a clear mental history.
Procedure
All data collection sessions were collected between 9 am and 1 pm. All healthy
participants were fitted with an EEG cap. Scalp EEG was obtained before, during, and after the
JOVI task through a 64-channel active electrode system (BrainAmp MR Plus amplifier, Brain
Product GmbH, Gilching, Germany). Direct current EEG data was low-passed at 1 KHz,
digitized at 1 KHz, and recorded by Brain Vision Recorder software (Brain Product GmbH
Gilching, Germany). Abralyt HiCl abrasive electrolyte gel (EASYCAP GmbH, Herrsching,
Germany) was applied to each electrode to obtain the necessary scalp-electrode contact. The
Page 9
P200 JOVI EEG 8
participants were then seated 100 cm away from a 24-inch computer monitor while wearing the
electrode cap.
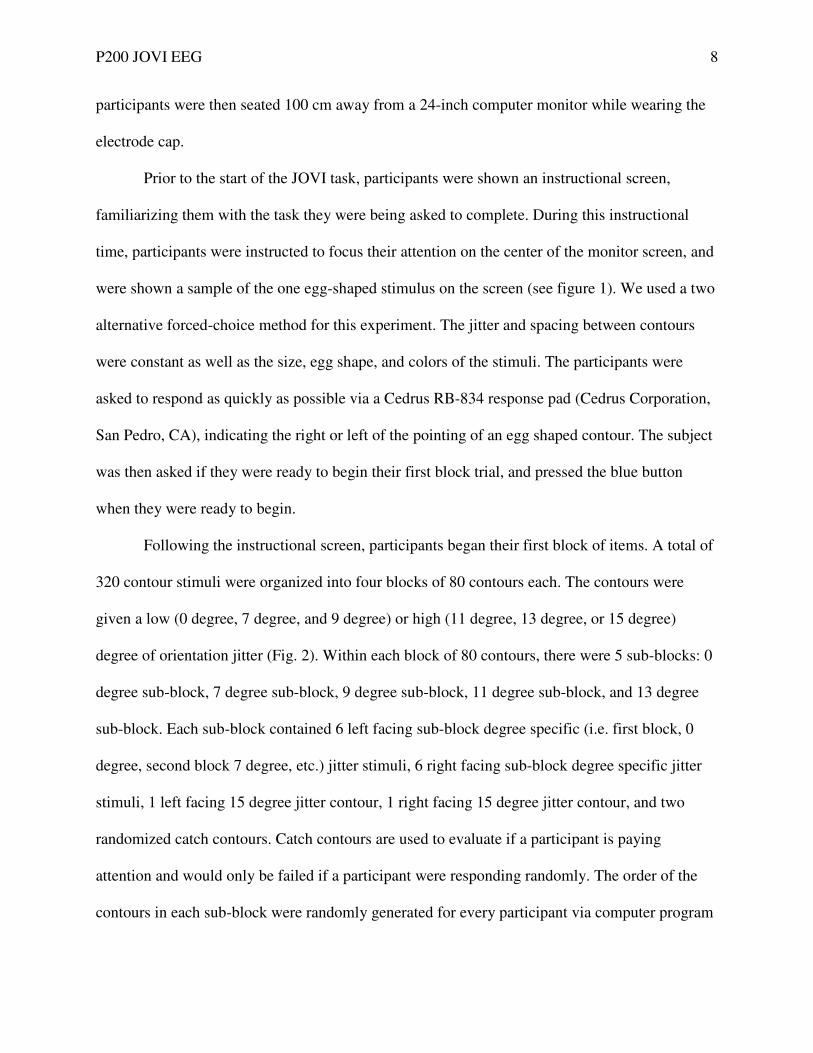
Prior to the start of the JOVI task, participants were shown an instructional screen,
familiarizing them with the task they were being asked to complete. During this instructional
time, participants were instructed to focus their attention on the center of the monitor screen, and
were shown a sample of the one egg-shaped stimulus on the screen (see figure 1). We used a two
alternative forced-choice method for this experiment. The jitter and spacing between contours
were constant as well as the size, egg shape, and colors of the stimuli. The participants were
asked to respond as quickly as possible via a Cedrus RB-834 response pad (Cedrus Corporation,
San Pedro, CA), indicating the right or left of the pointing of an egg shaped contour. The subject
was then asked if they were ready to begin their first block trial, and pressed the blue button
when they were ready to begin.
Following the instructional screen, participants began their first block of items. A total of
320 contour stimuli were organized into four blocks of 80 contours each. The contours were
given a low (0 degree, 7 degree, and 9 degree) or high (11 degree, 13 degree, or 15 degree)
degree of orientation jitter (Fig. 2). Within each block of 80 contours, there were 5 sub-blocks: 0
degree sub-block, 7 degree sub-block, 9 degree sub-block, 11 degree sub-block, and 13 degree
sub-block. Each sub-block contained 6 left facing sub-block degree specific (i.e. first block, 0
degree, second block 7 degree, etc.) jitter stimuli, 6 right facing sub-block degree specific jitter
stimuli, 1 left facing 15 degree jitter contour, 1 right facing 15 degree jitter contour, and two
randomized catch contours. Catch contours are used to evaluate if a participant is paying
attention and would only be failed if a participant were responding randomly. The order of the
contours in each sub-block were randomly generated for every participant via computer program
Page 10
P200 JOVI EEG 9
(Presentation; Neurobehavioral Systems Inc., Berkely, CA). Each contour was shown for 2
seconds. There was a 1 second inter-stimulus interval. After each block, the participant could
relax and move their neck to prevent muscle stiffness. The participant was then asked if they
were prepared to continue the next block, and pressed the blue button when they were ready to
continue. This resting period occurred after every block until the fourth block was completed.
Data processing
We analyzed the data for this study using BrainVision Analyzer 2.1.0 (Brain Product
GmbH, Gilching, Germany). All EEG data were re-referenced to a new common average
reference in all 63 other channels for all data. Afterwards, an IIR filter was applied to all data.
The low cutoff frequency entailed .4 Hz at a 24 db/Oct slope at .3978873 second time constant.
The high cutoff frequency entailed a 15 Hz at 24 db/Oct slope. The notch was set to 60 Hz to
eliminate interference from the electricity network/line noise.
Data was recorded for each participant in four block chunks. Within each block, the
segmentation function was applied, and data was separated by degree of jitter stimuli (0 degrees,
7 degrees, 9 degrees, 11 degrees, 13 degrees, and 15 degrees). The duration of segments chosen
were all based on the stimulus-onset time from -500 ms to 3000 ms totaling a duration of 3500
ms. Within each separated stimulus segmentation, artifact rejection was implemented manually
to remove segments with incorrect and timed-out responses to the stimuli and visible artifacts
within a segment. Following this, baseline correction was applied from a range of -100 ms to -5
ms. The average transform was used to average the segmented data.
To separate the segmented data into low (0 degree, 7 degree, and 9 degree) or high (11
degree, 13 degree, or 15 degree) degree of orientational jitter groups, a grand average transform
was performed within the two difficulties. For every high and low degree data group for each
Page 11
P200 JOVI EEG 10
participant, a peak detection of P200 on the Oz channel (i.e. midline occipital electrode) from
150 ms to 275 ms was performed to gain the latency and amplitude of the P200 component. This
data was then exported for analysis in SPSS.
Results
A general linear model analysis was run in SPSS for the data and the following post-hoc
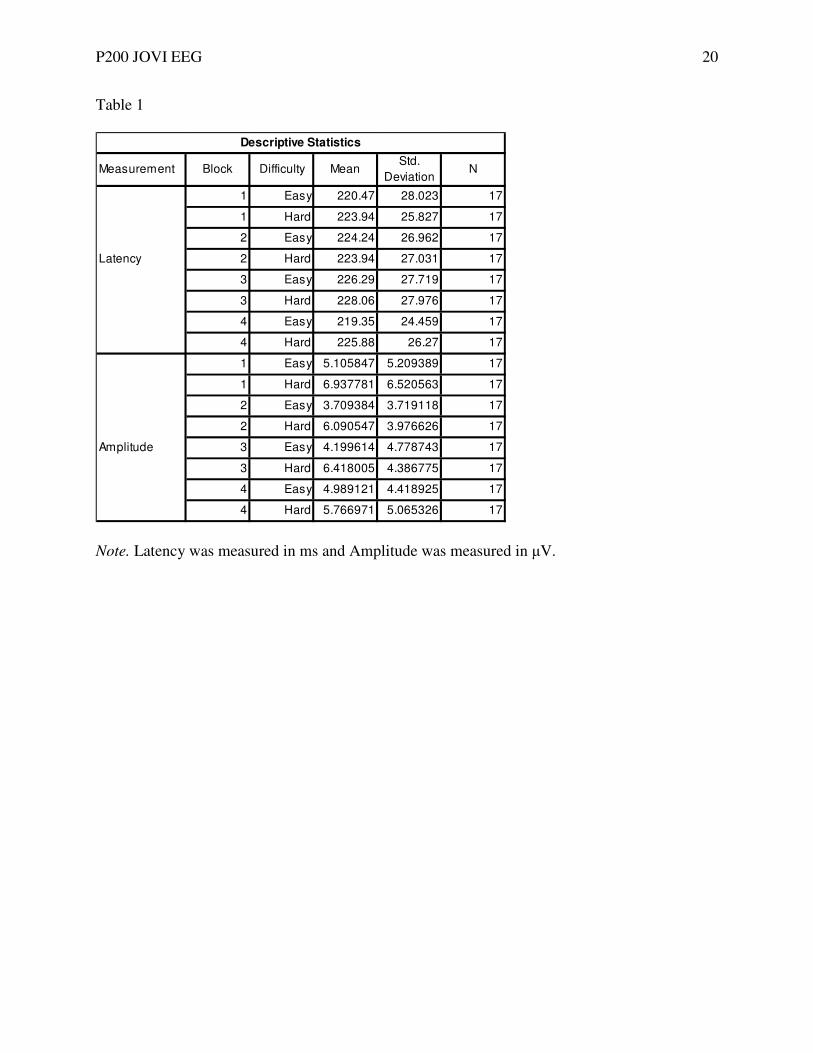
test using the Bonferoni correction. The descriptive statistics from the general linear model
analysis are provided in Table 1. Data were analyzed using a within-subjects factor of latency,
amplitude, difficulty levels, and blocks. Maulchy’s Test of Sphericity indicated that the
assumption of sphericity had been violated within-subjects block and amplitude (X² (5) = 12.744,
p = .026). Degrees of freedom were corrected using Greenhouse-Geisser corrections when the
assumption of sphericity were violated.
A repeated-measures MANOVA was conducted to compare the effect of easy and hard
difficulty of contour on P200 ERP latency and amplitude. For the multivariate tests, there was a
significant main effect of difficulty, Wilks’ Lambda = 0.461, F (2,11) = 8.777, p = .003. No main
effect was found across blocks, Wilks’ Lambda = 0.431, F (6,11) = 2.423, p = .569. No
interaction effect was found between blocks and difficulty, Wilks’ Lambda = 0.637, F (6,11) =
1.047, p = .447.
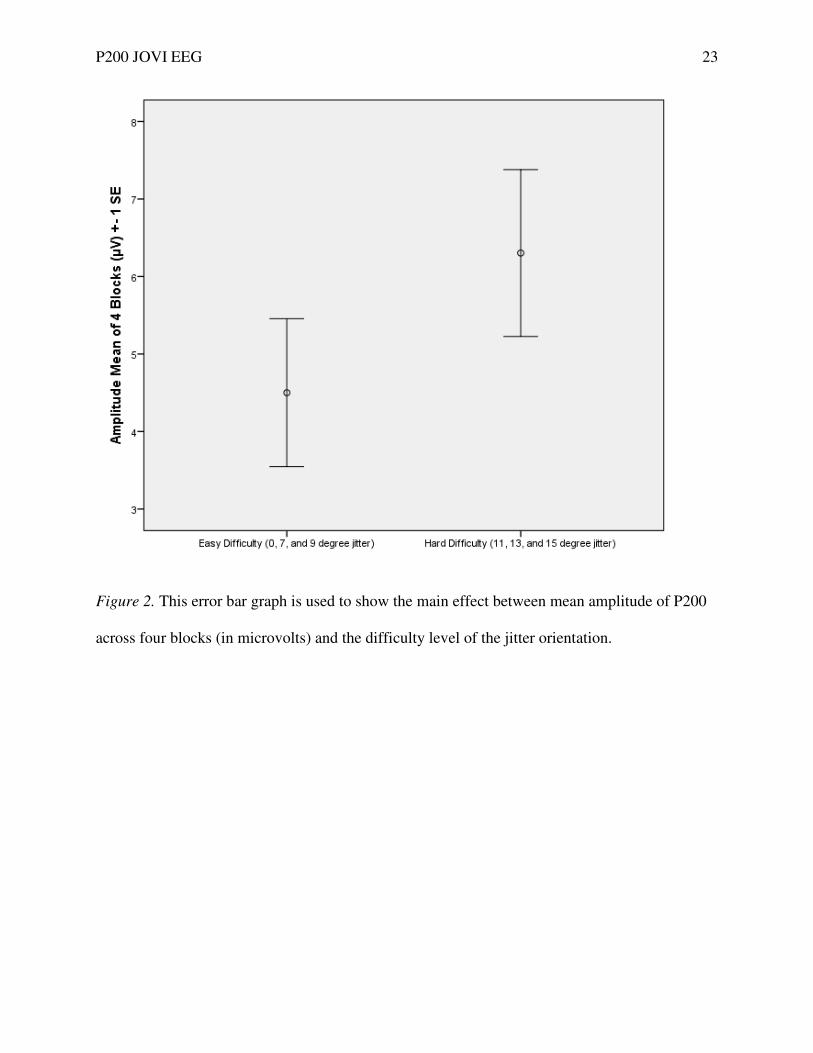
For univariate tests, a significant main effect between easy and hard difficulty of contours
on amplitude was found, F(1,16) = 18.284, p = .001. An error bar graph (± standard error of
means) was produced to show the main effect between mean amplitude of P200 and the
difficulty level of jitter orientation (Fig. 2). A trend-level main effect between easy and hard
difficulty of contours on latency was found, F(1,16) = 3.229, p = .091. An error bar graph was
produced to show the trend of mean latency of P200 and the difficulty level of jitter orientation
Page 12
P200 JOVI EEG 11
(Fig. 3). Confidence interval and standard error data are provided in Table 2. There was no
interaction found between block number and latency, F(2.18, 34.89) = 1.641, p = .207,
(Greenhouse-Geisser corrected p-value). No interaction was found between block number and
amplitude, F(3, 48) = .741, p = .533.
Discussion
The contour element linking process is thought to be executed in the ventral tempero-
occipital stream where orientation and size in V1, contour and form in V2, and shape in V4 are
processed due to its main role in object recognition (Ungerleider & Pasternak, 2004; Butler et al.,
2008; Silverstein et al., 2011). The magnocellular pathway to the dorsal parieto-occipital stream,
is believed to initially detect coarse spatial structures in order to segregate objects such as the
Gabor contour from background stimuli (Kaplan, 1991; Merigan & Maunsell, 1993; Butler et al.,
2001, 2008). In contrast, the parvocellular pathway, which is the primary source of the ventral
tempero-occipital stream, is believed to code the fine spatial details of objects (e.g. co-linear
orientations across neighboring Gabor patches) (Kaplan, 1991; Merigan & Maunsell, 1993;
Butler et al., 2001, 2008). Wynn and colleagues (2015) suggest that visual integration deficits
may occur at early stages of ventral stream processing in V1 and V2.
The present study was conducted using JOVI, a contour integration task, to investigate
visual integration by analyzing P200 component latency and amplitude in healthy subjects. This
contour integration task was used in previous studies (Silverstein et al., 2000; Silverstein et al.,
2009; Butler et al., 2013) but the P200 component was not focused on in these studies. In this
study, solely the visual waveform P200, whose peak latency ranges from 150 to 275 ms
(Breznitz, 2008), was analyzed. The auditory-lingual P200 component has been investigated
rigorously (Roth, Pfefferbaum, Berger, & Kopell, 1981; Shenton et al., 1989; Rentzsch, de
Page 13
P200 JOVI EEG 12
Castro, Neuhaus, Jockers-Scherübl, & Gallinat, 2007; Lijffijt et al., 2012) however the visual
P200 component has been far less researched. The limited amount of research conducted on the
visual P200 component, and the lack of knowledge about the nature of the component (Breznitz,
2008), created a focus point for this study. We strove to study the visual P200 ERP response to
low versus high degree jitter contours in order to gain further knowledge on the integration of
stimuli.
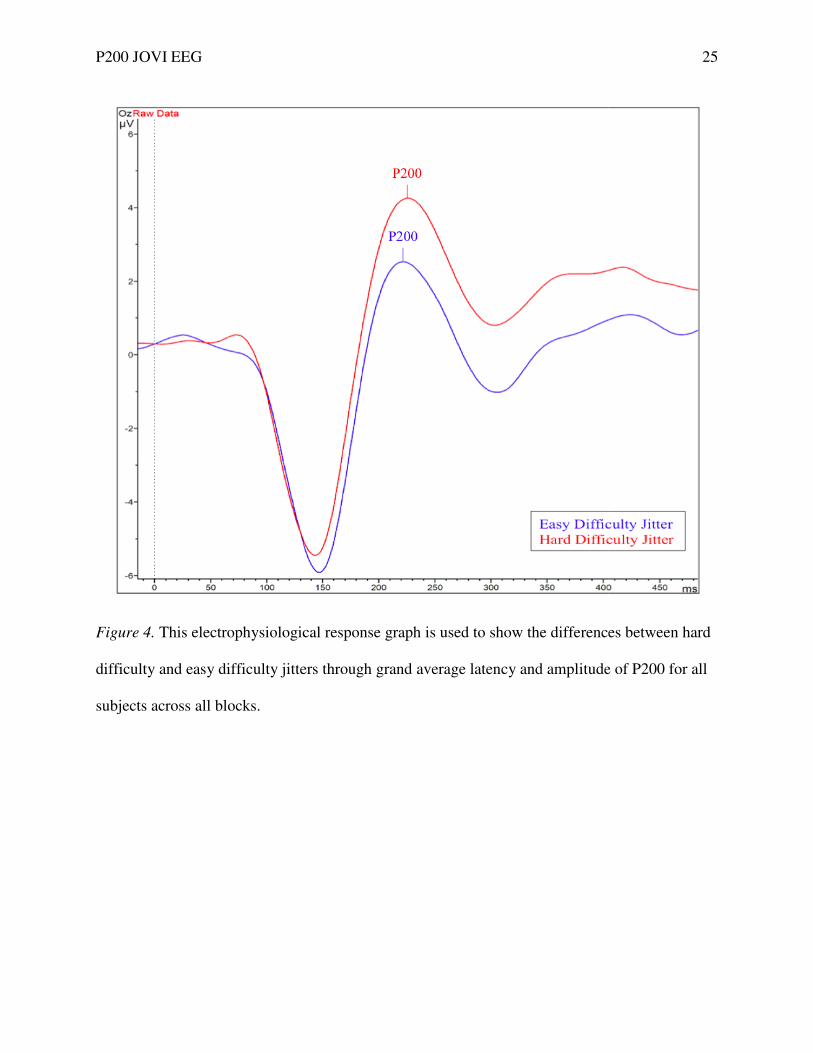
Supporting our first hypothesis, a main effect between P200 amplitude and difficulty
level was found. The mean P200 amplitude was larger when the orientation jitter was higher and
contour detection was more difficult (see Fig. 4). An electrophysiological graph showing the
mean difficulty jitter orientations and P200 amplitudes for subjects illustrates these findings (see
Figs. 5 & 6). Our results are similar to the N120 and Ncl component amplitude and difficulty
main effect result reported by Butler and colleagues (2013). Also, a trend between latency and
difficulty was shown, and we suggest that it is likely that our findings are an artifact of the
difficulty variance. Breznitz and Meyler (2003) suggest that the latency of P200 reflects the
speed that stimuli are evaluated, implying that latency is dependent on task difficulty. A time
constraint limited the participant pool data that could be collected, but also due to the long list of
exclusion criteria for this study, many participants screened out of our study, resulting in our data
analysis being limited to seventeen participants. More data from participants could have yielded
a stronger correlation between latency and difficulty.
We expected to find an electrophysiological effect from practice between the 1st block
and the 4th
block on latency or amplitude, but our data does not support this. Pernet et al. (2003)
suggested that P200 is involved with implicit memory of stimuli, due to their findings of over-
learned stimuli resulting in short P200 latency and unfamiliar stimuli resulting in longer P200
Page 14
P200 JOVI EEG 13
latency. These findings suggested that there could be a potential electrophysiological effect from
practice between blocks. Perhaps a larger sample size could yield a significant
electrophysiological data effect from practice. Also, maybe the findings that support an
electrophysiological effect from practice between blocks could be supported with data, but at a
later cognitive latency component such as N400 or P600 or at an earlier component such as
N100. Further research should be conducted to investigate this hypothesis.
We found that the number of correct responses from participants for the 15 degree
contour, our highest contour, was at random guessing probability (M= .510, SD =.625) compared
to our 13 degree contour, where the number of correct responses across subjects was higher than
random guessing probability (M=.625, SD = .141). This data suggests that visual integration of
the 15 degree contour shape possibly did not occur, and only the contour elements were visually
perceived and the contour direction response was a guess. This type of element perception could
possibly have been producing a similar electrophysiological response, but from a different
stimulus process than expected. As the contour jitter orientation gets higher, the ability to
perceive the shape of the egg is reduced (Silverstein et al., 2009). Perhaps at a certain jitter
orientation, people can no longer perceive the contour at all. Visual integration is the process that
fuses local visual environmental information to form a cohesive complex higher-order visual
image (Kozma-Wiebe et al., 2006; Silverstein et al., 2011), and analyzing a response that reflects
a failed inability to form a cohesive visual image would result in confounded data. We suggest
that studies that used contours with jitter orientations much greater than 15 degrees (Silverstein
et al., 2009, 2011; Butler et al., 2013) could be flawed in design possibly due to inaccurate
electrophysiological responses at these higher jitter orientations. Future studies should be wary
of using Gabor contours with jitter orientations larger than 15 degrees.
Page 15
P200 JOVI EEG 14
Another limitation of the study includes the lack of generalizability due to the college
student population being the participant sample. According to recent findings, the brain does not
reach full maturity until approximately the mid-20s, including the occipital lobe (Giedd, 2004).
However, our data was collected from participants 16 to 21 years old, producing a large
developmental gap in terms of brain development. Silverstein and Keane (2011) report that
perceptual organization mechanisms do not become fully mature until late adolescence or early
adulthood. For our participants, the magnocellular and parvocellular pathways, V1, V2, V3, and
V4, as well as the ventral tempero-occipital and dorsal parieto-occipital streams that are involved
in visual processing (Butler et al., 2008) may not be fully developed. Varying developmental
stages of perceptual organization mechanisms could yield inconsistent data. Perhaps future
research should focus on a cohort ages 25 and older to avoid this possible variance. Similarly,
our study initially was going to exclude left-handed participants using the Edinburgh Handedness
Questionnaire (Oldfield, 1971), however due to an already small amount of eligible participants,
left-handed participants’ data was not excluded. However, the inclusion of left handed
participants could have confounded our data due to visual processing hemispheric dichotomy
between dominant left versus right handed individuals (McKeever & VanDeventer, 1977).
The number of participants in this sample produced data that is inadequate to generalize
to the population. The time constraint on this study limited the number as participants as well as
the types of participants we wanted to include in this study. The primary researcher and graduate
students are currently still collecting data from healthy participants as well as from patients with
schizophrenia at a local hospital psychiatric facility. The ultimate goal is to further collect
healthy participant EEG visual integration data as well as EEG visual integration data from
patients with schizophrenia, and analyze multiple ERP components, including P200, to satisfy
Page 16
P200 JOVI EEG 15
the CNTRICS (2011) initiative of identifying the impaired cognitive systems and component
processes to then be able to target them for treatment development for schizophrenia.
Page 17
P200 JOVI EEG 16
References
Benedict, R. H., Schretlen, D., Groninger, L., Dobraski, M., & Shpritz, B. (1996). Revision of
the Brief Visuospatial Memory Test: Studies of normal performance, reliability, and
validity. Psychological Assessment, 8(2), 145.
Breznitz, Z. (2008). The P200 Component. In Brain Research in Language. Boston, MA:
Springer-Verlag US.
Breznitz, Z., & Meyler, A. (2003). Speed of lower-level auditory and visual processing as a basic
factor in dyslexia: Electrophysiological evidence. Brain and Language, 85(2), 166-184.
Butler, P. D., Schechter, I., Zemon, V., Schwartz, S. G., Greenstein, V. C., Gordon, J., ... &
Javitt, D. C. (2001). Dysfunction of early-stage visual processing in schizophrenia.
American Journal of Psychiatry, 158(7), 1126-1133.
Butler, P. D., Abeles, I. Y., Silverstein, S. M., Dias, E. C., Weiskopf, N. G., Calderone, D. J., &
Sehatpour, P. (2013). An event-related potential examination of contour integration
deficits in schizophrenia. Frontiers in psychology, 4.
Butler, P. D., Silverstein, S. M., & Dakin, S. C. (2008). Visual perception and its impairment in
schizophrenia. Biological psychiatry, 64(1), 40-47.
CNTRICS. (2011). Retrieved April 12, 2015, from http://cntrics.ucdavis.edu/
First, Michael B., Spitzer, Robert L, Gibbon Miriam, and Williams, Janet B.W.: Structured
Clinical Interview for DSM-IV-TR Axis I Disorders, Research Version, Non-patient
Edition. (SCID-I/NP) New York: Biometrics Research, New York State Psychiatric
Institute, November 2002.
Foxe, J. J., Murray, M. M., & Javitt, D. C. (2005). Filling-in in schizophrenia: a high-density
electrical mapping and source-analysis investigation of illusory contour processing.
Page 18
P200 JOVI EEG 17
Cerebral Cortex, 15(12), 1914-1927.
Giedd, J. N. (2004). "Structural magnetic resonance imaging of the adolescent brain." Adolescent
Brain Development: Vulnerabilities and Opportunities: 77 - 85.
Hetrick, W. P., Erickson, M. A., & Smith, D. A. (2012). Phenomenological dimensions of
sensory gating. Schizophrenia bulletin, 38(1), 178-191.
Kaplan, E. (1991). The receptive field structure of retinal ganglion cells in cat and monkey. The
Neural Basis of Visual Function, 4, 10-40.
Kovács, I., Polat, U., Pennefather, P. M., Chandna, A., & Norcia, A. M. (2000). A new test of
contour integration deficits in patients with a history of disrupted binocular experience
during visual development. Vision research, 40(13), 1775-1783.
Kozma-Wiebe, P., Silverstein, S. M., Fehér, A., Kovács, I., Ulhaas, P., & Wilkniss, S. M. (2006).
Development of a world-wide web based contour integration test. Computers in human
behavior, 22(6), 971-980.
Li, W., & Gilbert, C. D. (2002). Global contour saliency and local colinear interactions. Journal
of neurophysiology, 88(5), 2846-2856.
Lijffijt, M., Cox, B., Acas, M. D., Lane, S. D., Moeller, F. G., & Swann, A. C. (2012).
Differential relationships of impulsivity or antisocial symptoms on P50, N100, or P200
auditory sensory gating in controls and antisocial personality disorder. Journal of
psychiatric research, 46(6), 743-750.
McKeever, W. F., & VanDeventer, A. D. (1977). Visual and auditory language processing
asymmetries: Influences of handedness, familial sinistrality, and sex. Cortex, 13(3), 225-
241.
Merigan, W. H., & Maunsell, J. H. (1993). How parallel are the primate visual pathways?.
Page 19
P200 JOVI EEG 18
Annual review of neuroscience, 16(1), 369-402.
National Institute of Mental Health: What is Schizophrenia? (n.d.). Retrieved April 9, 2015, from
http://www.nimh.nih.gov/health/topics/schizophrenia/index.shtml
Oldfield, R. C. (1971). The assessment and analysis of handedness: the Edinburgh inventory.
Neuropsychologia, 9(1), 97-113.
Pernet, C., Basan, S., Doyon, B., Cardebat, D., Démonet, J. F., & Celsis, P. (2003). Neural
timing of visual implicit categorization. Cognitive Brain Research, 17(2), 327-338.
Raine, A. (1991). The SPQ: a scale for the assessment of schizotypal personality based on DSM-
III-R criteria. Schizophrenia bulletin, 17(4), 555.
Rentzsch, J., de Castro, A. G., Neuhaus, A., Jockers-Scherübl, M. C., & Gallinat, J. (2007).
Comparison of midlatency auditory sensory gating at short and long interstimulus
intervals. Neuropsychobiology, 58(1), 11-18.
Roth, W. T., Pfefferbaum, A., Kelly, A. F., Berger, P. A., & Kopell, B. S. (1981). Auditory
event-related potentials in schizophrenia and depression.Psychiatry research, 4(2), 199-
212.
Schizophrenia Research Institute: P200-EEG. (2013, May 14). Retrieved April 5, 2015, from
http://www.schizophreniaresearch.org.au/library/browse-library/physical-features/
function/electrophysiology/eeg/p200/
Shenton, M. E., Faux, S. F., McCarley, R. W., Ballinger, R., Coleman, M., & Duffy, F. H.
(1989). Clinical correlations of auditory P200 topography and left temporo-central
deficits in schizophrenia: a preliminary study. Journal of psychiatric research, 23(1), 13-
34.
Silverstein, S. M. (2000). Psychiatric rehabilitation of schizophrenia: Unresolved issues, current
Page 20
P200 JOVI EEG 19
trends, and future directions. Applied and preventive psychology, 9(4), 227-247.
Silverstein, S. M., Berten, S., Essex, B., Kovacs, I., Susmaras, T., & Little, D. M. (2009). An
fMRI examination of visual integration in schizophrenia. Journal of integrative
neuroscience, 8(02), 175-202.
Silverstein, S. M., & Keane, B. P. (2011). Perceptual organization impairment in schizophrenia
and associated brain mechanisms: review of research from 2005 to 2010. Schizophrenia
Bulletin, 37(4), 690-699.
Silverstein, S. M., Keane, B. P., Barch, D. M., Carter, C. S., Gold, J. M., Kovács, I., ... & Strauss,
M. E. (2011). Optimization and validation of a visual integration test for schizophrenia
research. Schizophrenia bulletin, sbr141.
Silverstein, S. M., Kovács, I., Corry, R., & Valone, C. (2000). Perceptual organization, the
disorganization syndrome, and context processing in chronic schizophrenia.
Schizophrenia research, 43(1), 11-20.
Ungerleider, L.G., and Pasternak, T. (2004). Ventral and dorsal cortical processing streams. In
The Visual Neurosciences, L.M. Chalupa and J.S. Werner, eds. (Cambridge: MIT Press),
pp. 541–562.
Wynn, J. K., Roach, B. J., Lee, J., Horan, W. P., Ford, J. M., Jimenez, A. M., & Green, M. F.
(2015). EEG Findings of Reduced Neural Synchronization during Visual Integration in
Schizophrenia. PloS one, 10(3), e0119849.
Page 21
P200 JOVI EEG 20
Table 1
Note. Latency was measured in ms and Amplitude was measured in µV.
Measurement Block Difficulty MeanStd.
DeviationN
1 Easy 220.47 28.023 17
1 Hard 223.94 25.827 17
2 Easy 224.24 26.962 17
Latency 2 Hard 223.94 27.031 17
3 Easy 226.29 27.719 17
3 Hard 228.06 27.976 17
4 Easy 219.35 24.459 17
4 Hard 225.88 26.27 17
1 Easy 5.105847 5.209389 17
1 Hard 6.937781 6.520563 17
2 Easy 3.709384 3.719118 17
2 Hard 6.090547 3.976626 17
Amplitude 3 Easy 4.199614 4.778743 17
3 Hard 6.418005 4.386775 17
4 Easy 4.989121 4.418925 17
4 Hard 5.766971 5.065326 17
Descriptive Statistics
Page 22
P200 JOVI EEG 21
Table 2
Note. Latency was measured in ms and Amplitude was measured in µV.
1 222.588 6.292 209.25 235.927 -2.868 1.596 0.091
2 225.456 6.098 212.529 238.383 2.868 1.596 0.091
1 4.501 .954* 2.478 6.524 -1.802 0.422 0.001
2 6.303 1.076* 1.076 8.585 1.802 0.422 0.001
Sig.
Pairwise Comparisons
Latency
Amplitude
Mean
Measure
Difference
Standard
Error
95%
Confidence
Interval
Lower
Bound
95%
Confidence
Interval
Upper
Bound
Mean
Measure
Difference
Standard
Error of
the Mean
Measure Difficulty Mean
Page 23
P200 JOVI EEG
Figure 1. Right-facing Gabor contours for
forced-choice options. B: Catch trial. C:
jitter orientation. E: 9 degree jitter orientation. F:
orientation. H: 15 degree jitter orientation.
difficulty jitter orientations.
C
F
A
abor contours for the Jitter Orientation Visual Integration Task.
choice options. B: Catch trial. C: Contour pop-out 0-degree jitter orientation. D: 7
degree jitter orientation. F: 11 degree jitter orientation. G:
orientation. H: 15 degree jitter orientation. C-E: Easy difficulty jitter orientations. F
B
D E
H G
22
Jitter Orientation Visual Integration Task. A: The
degree jitter orientation. D: 7 degree
13 degree jitter
E: Easy difficulty jitter orientations. F-H: Hard
Page 24
P200 JOVI EEG 23
Figure 2. This error bar graph is used to show the main effect between mean amplitude of P200
across four blocks (in microvolts) and the difficulty level of the jitter orientation.
Page 25
P200 JOVI EEG 24
Figure 3. This error bar graph is used to show the trend between mean latency of P200 across
four blocks (in milliseconds) and the difficulty level of the jitter orientation.
Page 26
P200 JOVI EEG
Figure 4. This electrophysiological response graph is used to show the differences between hard
difficulty and easy difficulty jitters through grand average latency and amplitude of P200 for all
subjects across all blocks.
This electrophysiological response graph is used to show the differences between hard
difficulty and easy difficulty jitters through grand average latency and amplitude of P200 for all
25
This electrophysiological response graph is used to show the differences between hard
difficulty and easy difficulty jitters through grand average latency and amplitude of P200 for all
Page 27
P200 JOVI EEG
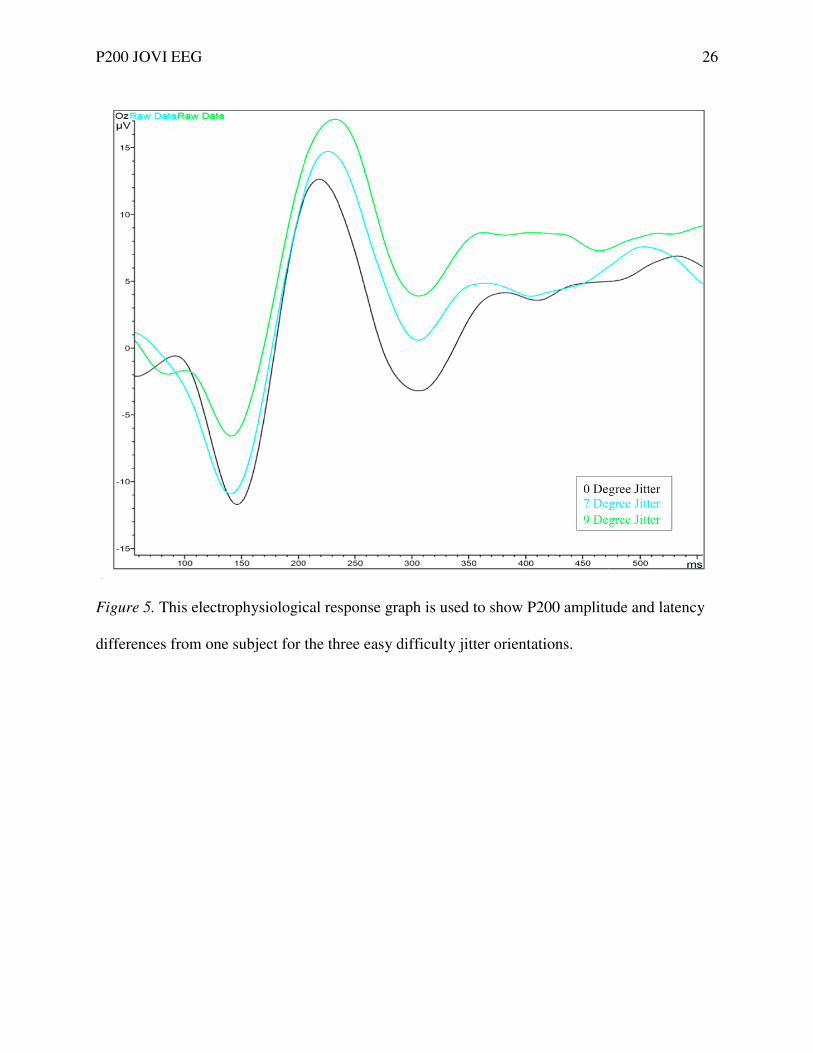
Figure 5. This electrophysiologica
differences from one subject for the
This electrophysiological response graph is used to show P200 amplitude and latency
one subject for the three easy difficulty jitter orientations.
26
ude and latency
Page 28
P200 JOVI EEG
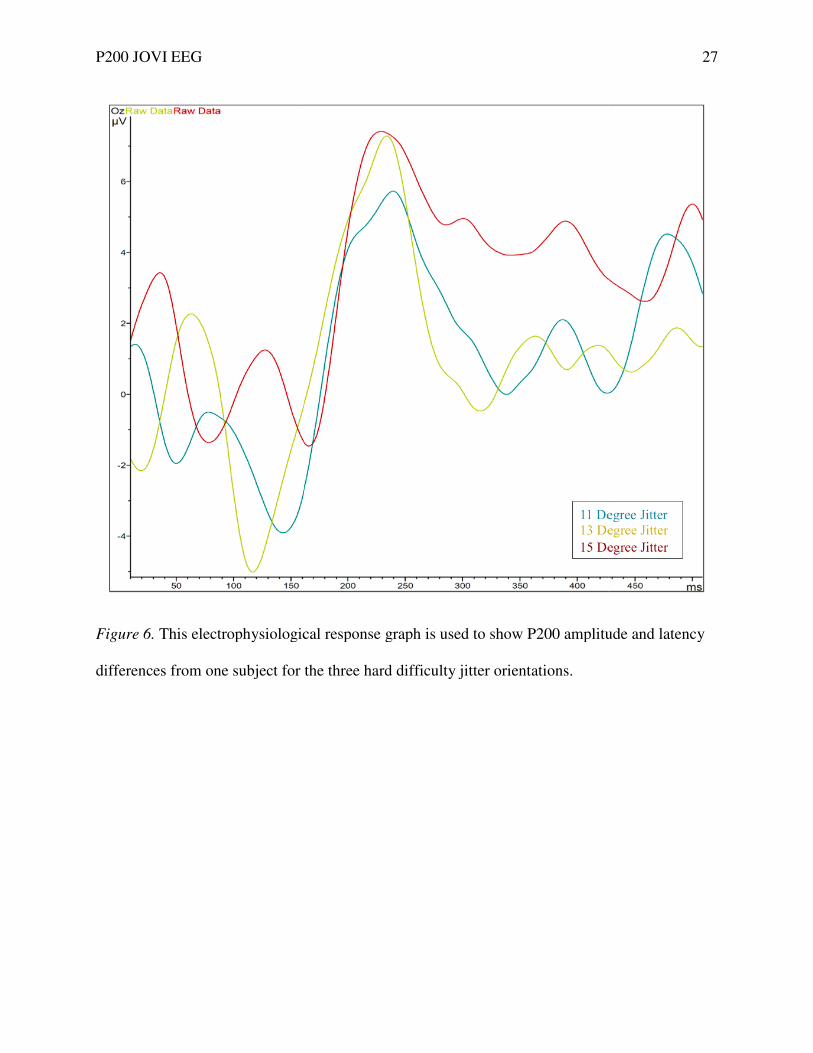
Figure 6. This electrophysiological response graph is used to show P200 amplitude and latency
differences from one subject for the three hard difficulty jitter orientations.
This electrophysiological response graph is used to show P200 amplitude and latency
from one subject for the three hard difficulty jitter orientations.
27
This electrophysiological response graph is used to show P200 amplitude and latency