MISHA T. KWASNIEWSKI , ASSISTANT RESEARCH PROFESSOR, UNIVERSITY OF MISSOURI Elemental Sulfur Residue’s Journey from field to winery ORIGINAL WORK WITH GAVIN SACKS AND WAYNE WILCOX, CORNELL UNIVERSITY
Transcript
M I S H A T . K W A S N I E W S K I , A S S I S TA N T R E S E A R C H P R O F E S S O R , U N I V E R S I T Y O F M I S S O U R I
Elemental Sulfur Residue’s Journey from field to winery
FEBRUARY 2016 MEETING ANNOUNCEMENT
Dispelling the Myths: Elemental Sulfur and Winegrapes During Ripening and Fermentation
Dr. Doug Gubler, UC Davis Department of Plant Pathology
Sulfur for Disease Management in Vineyards and the Potential for Residue at Harvest Dr. Misha Kwasniewski, Missouri University Grape and Wine Institute
Persistence of Sulfur Residues During the Vinification Process Dr. Roger Boulton, UC Davis Department of Viticulture and Enology
Formation, Effects and Management of Hydrogen Sulfide in Wine DATE: Tuesday, February 2, 2016 TIME: 10am to 11:30am LOCATION: Dutton Pavilion, SRJC Shone Farm, 7450 Steve Olsen Lane, Forestville From Highway 101, take River Road exit and head West After 6 miles and turn right onto Trenton-Healdsburg Road After 1.5 miles turn left at stop sign onto Eastside Road then make immediate right onto Steve Olson Ln COST: None. The program is open to the public. Please let us know you plan to attend. Register online at http://ucanr.edu/scvtg feb 2016 or phone 707.565.2621 1.5 CE Units in the category “Other” has been requested from the Calif. Dept. of Pesticide Regulation 1.5 CE Units has been requested in “Integrated Pest Management” for Certified Crop Advisers
For more information on the program contact: Rhonda Smith 707-565-2621
SCVTG: P.O. Box 424, Healdsburg, CA 95448
O R I G I N A L W O R K W I T H G AV I N S A C K S A N D WAY N E W I L C O X , C O R N E L L U N I V E R S I T Y
THE PROBLEM OF MARKETING H2S
• Smoke= Lucious and sophisticated • Cat Pee= delicious OK • Fox Pheromone= The taste of youth • Port-a-potty on a suny day...
Yeast Strain
MAJOR FACTORS INFLUENCING H2S PRODUCTION
H2S Nutritional deficiencies in juice • Yeast assimilable nitrogen (YAN)
S0 containing pesticides in juice • Elemental sulfur • Other pesticides
Other poorly understood factors, e.g. cysteine degradation?
3
BACKGROUND
• About every 30 years someone tries to understand the risk • Numerous reports indicate 10mg/L will increase H2S and hurt wine quality
(Thoukis and Stern 1962, Acree et al. 1972 , Wenzel et al. 1980) • Some indicate impacts on H2S production as low as 1mg/L • Impact varies with yeast strain, sulfur formulation, must nutrient content etc.
Elemental sulfur
H2S Fermentation
No elemental sulfur
With elemental sulfur
H2S
Pro
du
ctio
n
H2S
Pro
du
ctio
n
Fermentation Time à Fermentation Time à
Ad
ap
ted
fro
m A
cre
e, e
t.a
l. A
JEV
197
2
WHO RUINED THE WINE
• Late season elemental sulfur (S0) application will ruin your wine (Published reports going back to 19th century!)
• Some buyers put heavy restriction on S0 use • Is this warranted? • Maybe hastening resistance development in other control • Wasting money • Placing an unreasonable burden and risk on growers
htt
p:/
/ww
w.a
nim
aa
tjes.
nl/
be
roe
pe
n-
pla
atje
s
OR
IN THE VINEYARD
• Limited previous research • Studies have found late season residue to be sensorial
important (Schutz et al. 1977) • Residue levels found to be as high as 8mg/L when S0
application ceased 7 weeks before harvest • near 10mg/L concentration
• Meaningful S0 concentrations not apparent under CA growing conditions using best practices (Thomas, 1992)
• Formulation, Climate and methodology very different in these to studies
• How should a grower responsibly use sulfur then?
QUESTIONS WE SET OUT TO ANSWER
• We Know a fermentation with 10mg/L of elemental sulfur will make a stinky wine • maybe as low as 1mg/L can impact H2S production
• How much sulfur accumulates on a heavily sprayed cluster over a season?
• How long does that sulfur persist in the vineyard? • Does it matter?
• What impact do vinification practices have on S0 getting into the wine?
• Is it a grower problem or a winemaker problem?
EXPERIMENTAL DESIGN
• Spray Sulfur on vines • Different Formulation (Wettable and micronized) • Different rates (around 2.5 or 5 kg/ha) • Different pre-harvest dates to stop application • Three years in Geneva, NY (2009-2011) • Treatments initiating AFTER berry set through 8-12 days before
harvest
• Measure how much sticks to the fruit • Monitor sulfur on fruit through out the season • Quantify sulfur for all treatments at harvest • Characterize sulfur fate during vinification
WEATHER CONDITIONS
• Varied Greatly
• 2009 • Lots of October
Precip.
• 2010 • Relatively warm
and dry
454 – Kwasniewski et al.
Am. J. Enol. Vitic. 65:4 (2014)
that clarification of white wine must can greatly lower the S0 concentration therein, leading to lower H2S production dur-ing fermentation (Wenzel and Dittrich 1978, Wenzel et al. 1980). As a result of these conflicting observations, growers and winemakers cannot objectively assess the risk that late season applications will yield deleterious residues on ber-ries, sometimes resulting in arbitrary commercial restrictions and conflicting recommendations regarding late-season sulfur use. A poor understanding of this relationship increases the likelihood of economic losses resulting from (1) an unneces-sary overreliance on more expensive alternatives to S0, which also increases the probability of compromised disease control following the eventual development of pathogen resistance to many of the substituted materials, or (2), at the other extreme, the production of faulted wine as a result of S0 application too close to harvest.
A major impediment to studies requiring quantification of S0 residues has been the lack of an affordable technology to do so in complex matrices such as grape juice and must, as standard elemental analysis techniques measure total sulfur, including not only S0 but also sulfur from endogenous sul-fates, S-amino acids, and other compounds. Thomas et al. (1993b) circumvented this limitation by washing sulfur dust residues from the surface of intact clusters and measuring total S in the rinsate. We were unable to apply this technique successfully in our own initial field studies, as the sprayable formulations of S0 used in many regions (and which are stan-dard in humid climates such as New York) left visible residues on the fruit after repeat washings and measured S concen-trations in the rinsate were unexpectedly low. However, we recently reported the development of a rapid, inexpensive technique for measuring S0 in complex matrices, based upon its quantitative reduction to H2S in situ and simultaneous colorimetric quantification using commercially available de-tection tubes (Kwasniewski et al. 2011). The present report details the subsequent use of this technique to study the effect of fungicide formulation, rate, and application timing on the persistence of S0 residues on grape clusters in the field and their transfer to the must after harvest and crushing. Addi-tionally, we report on the influence of vinification factors such as whole-cluster pressing, length of skin contact, and must clarification on the proportion of S0 transferred into the must.
Materials and MethodsS0 persistence following field applications. Three years
of field trials were conducted in test vineyards at the New York State Agriculture Experiment Station in Geneva, NY (lat: 42°52’43”; long: -77°00’56”), to determine the effect of preharvest spray interval, product formulation, and applica-tion rate on S0 persistence. In 2009 and 2010, these trials were conducted on vines of Vitis vinifera cv. Chardonnay, and in 2011 on V. vinifera cv. Riesling. All vines were planted in 2004 on 3309C rootstock and were trained to a vertical shoot-positioned system with 3 m row spacing and 2 m vine spacing. Vines were sprayed and fertilized according to typi-cal commercial practices for the region, except that no S0 sprays were applied other than those in the variable treatment
regimens. S0 treatments were applied to test vines using a custom-built, over-the-row, hooded boom sprayer operating at 2070 kPa pressure and delivering 935 L/ha through seven hollow cone nozzles on each side of the boom. Cumulative temperature and rainfall data for each intervening period be-tween S0 applications and between the final application and harvest were determined (Table 1).
Two commercial elemental sulfur products were applied over the course of this study: a micronized formulation (Mi-crothiol Disperss 80DF, Cerexagri Inc., King of Prussia, PA) and a wettable powder formulation (Yellow Jacket Wettable Sulfur, Georgia Gulf Sulfur Corp., Valdosta, GA). Particle size for these formulations was quantified using a Master-sizer 2000 (Malvern Instruments, Worcestershire, UK). The median particle diameter of the micronized formulation was 4.7 µm with 90% of particles between 2.6 and 8.4 µm, and the median particle diameter of the wettable powder was 32.0 µm with 90% of particles between 9.0 and 73.5 µm.
In 2009, a single application of the micronized formula-tion was made either 68, 40, or 12 days preharvest, at a rate of either 2.69 or 5.38 kg/ha S0. Each of the seven treatments, including a control in which no S0 was incorporated, was applied to six replicate four-vine panels arranged in a ran-domized complete block design. Fruit was harvested 14 Oct.
In 2010, all treatments were initiated on 12 Aug (veraison), with additional sprays applied at approximately two-week in-tervals and continuing until either 50, 35, 22, or 8 days before harvest (1 Oct 2010), depending on the treatment. Vines in the 50-day preharvest treatment received only a single application of micronized sulfur at a rate of 2.69 kg/ha S0, whereas those
Table 1 Accumulation of heat units and precipitation during the periods between sulfur applications in field experiments,
2009 to 2011.
Treatment date (PHI)a
Degree days (10 C)b
Precipitation (mm)c
20097 Aug (68) – –4 Sep (40) 522 69.02 Oct (12) 267 145.0Harvest 28 33.0
201011 Aug (50) – –26 Aug (35) 272 96.09 Sep (22) 263 13.223 Sep (8) 127 34.8Harvest 88 25.7
aPHI = preharvest interval (days).bAccumulated degree days (base 10°C) since previous sulfur ap-plication.
cAccumulated precipitation (mm) since previous sulfur application.
YEAR 1- IS THIS A PROBLEM WORTH PURSUING
• Found the potential for very high levels after one application • 40 days or longer pre-harvest showed “safe” levels • Ceasing application 12 days put us well above safe limits • No Differences between application rate
0
10
20
30
40
50
60
68 40 12
S0re
sidu
eon
grape
s(μg
/g)
Daypre-harvestoflastS0applica<on
Micronizedsulfurat2.69kg/ha
Micronizedsulfurat5.38kg/ha
cc
2009
a ab b b
c
c
RESIDUE AT HARVEST- WITH FULL SEASON APPLICATION
• Residue levels at harvest • In all three years ceasing >35 days before harvest brought us below 10mg/L • <25 days constantly put levels over 10mg/L • >50 days detectable levels still present, some above 1mg/L
• More often micronized sulfur persisted at higher levels then wettable • A reduced application rate can reduce residue meaningfully (e.g.
• After each application there is a jump in residue • Residue levels where about half two weeks after application • Later applications/more applications resulted in higher
concentrations immediately after sulfur is was applied
0
5
10
15
20
25
30
35
40
54 38 25 12
S0 residu
eon
grape
s(μg
/g)
DaysBeforeHarvestofLastSulfurApplica<on
WeBablesulfurat4.48kg/hain2011
REMINDER ABOUT SULFUR
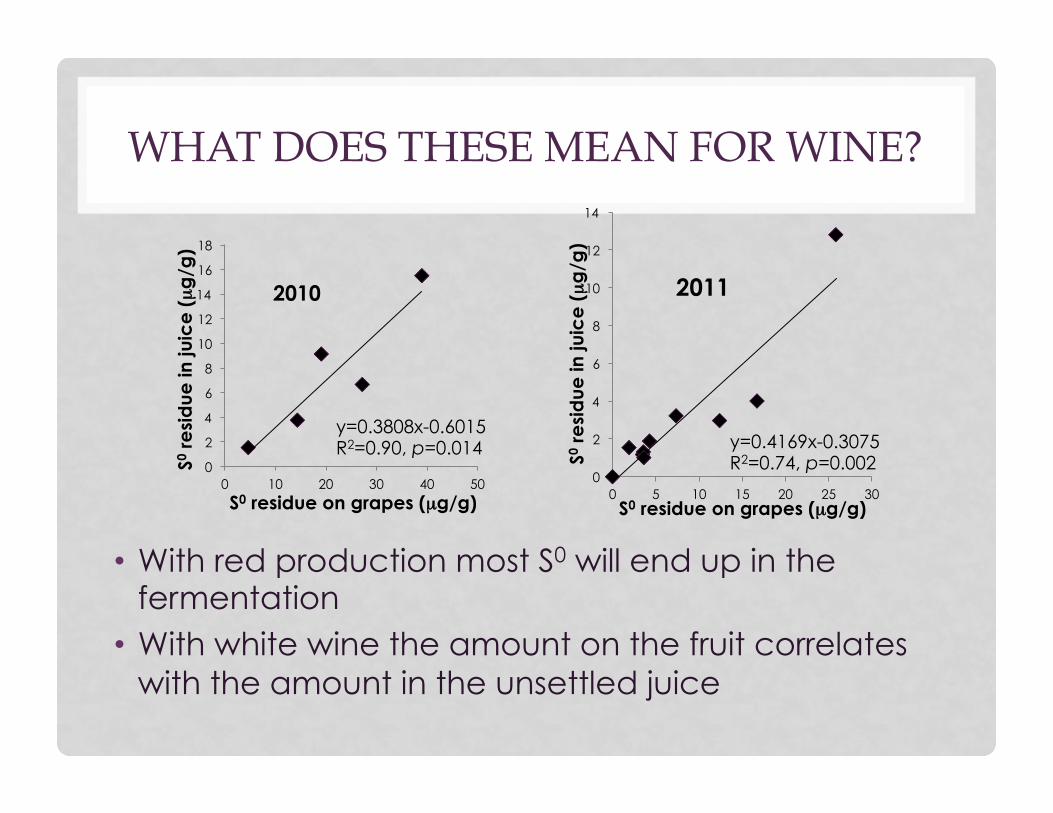
WHAT DOES THESE MEAN FOR WINE?
• With red production most S0 will end up in the fermentation • With white wine the amount on the fruit correlates
with the amount in the unsettled juice
0
2
4
6
8
10
12
14
16
18
0 10 20 30 40 50
S0 re
sid
ue in
juic
e (µ
g/g
)
S0 residue on grapes (µg/g)
y=0.3808x-0.6015 R2=0.90, p=0.014
2010
0
2
4
6
8
10
12
14
0 5 10 15 20 25 30
S0 re
sid
ue in
juic
e (µ
g/g
)
S0 residue on grapes (µg/g)
2011
y=0.4169x-0.3075 R2=0.74, p=0.002
RESIDUE PERSISTENCE WITH DIFFERENT VINIFICATION PRACTICES
• All Fruit recieved micronized sulfur at a rate of 2.69 kg/ha 10 days before harvest • This resulted in S0 residues of 11.4 ±1.2 �g/g • Residue in macerated fruit must similar to value at
harvest • No increase from skin contact before pressing
0 2 4 6 8
10 12 14
Sulfu
r Re
sid
ue
Pre
sent
(µ
g/g
)
VINIFICATION TREATMENTS
0
50
100
150
200
250
Control whole cluster crushed cold-soak 1-week 2-week
H2S
pro
duce
d du
ring
fer
men
tati
on (
ng/m
l)
Vinification Treatment of Cabernet Franc 2010 16
EXAMPLE OF SETTLING IMPACT
• Huge differences still can exist after destemming/crushing and pressing
• Clarification can dramatically reduce residue and bring sulfur to safe concentrations
0
5
10
15
20
25
30
Harvest Juice after Press
1-Hour 14-Hours 24-Hours
Sulfu
r Re
sid
ue P
rese
nt
(µg
/g)
Measurement Timing
Micronized Sulfur ceased 12-days before harvest
Micronized Sulfur ceased 54-days before harvest
Close up at 24 hours
0
0.05
0.1
0.15
0.2
0.25
0.3
0.35
0.4
24-Hours
Sulfu
r Re
sid
ue P
rese
nt
(µg
/g)
Measurement Timing
you still don’t believe me?
Test it for yourself
Overview of the Method: convert elemental sulfur to the easier-to-detect H2S
H2S Detection
Tube
H2S
Sample +
reducing agent
Gas in à Gas Out à
H2S
H2S
H2S
Step 1- Convert S to H2S with reducing agent Step 2- Sparge sample, quantify H2S with detection tube
S0 H2S Reducing agent
H2S Detection Tubes – reactive immobilized metal salt
Options • “The Sulfur Stick” – Wine focused tube
produced by Figara Technologies • Mining Industry detection tubes (Gastec and
others)
Hydrogen Sulfide + Lead Acetate (White) à Lead Sulfide (Black)
OPTIMIZING IN SITU REDUCTION
S0 H2S Reducing agent
1. Dithiothreitol (DTT) selected as reducing agent, gave quantitative conversion
2. Optimal pH is 6, gives best balance between enhancing nucleophilicity of DTT and volatility of H2S
3. Polyethylene glycol selected as solvent to facilitate dispersion of S0
Kwasniewski, Allison, Wilcox, and Sacks. Analytica Chimica Acta, 2011.
Plop Plop Fizz Fizz, Let’s See how much Sulfur There Is
• Dissolved O2 causes a significant reduction is H2S released
• Two tablets reduce dissolved oxygen in 200 ml of solution (from 7.4 mg/L to 0.1 mg/L in five minutes)
• Buffers sample at pH at 6 • H2S is volatile • DTT is active
• Can also be used to sparge sample
http://www.lib.fit.edu
FINAL METHOD
• Adapted from Hach water test (original range 0.1-5 mg/L H2S )
• elemental S residue down to 0.005 mg/L quantifiable
1) 1-10ml sample, add D.I. water for 80ml total liquid
add second tab 5) Measure length of detection stick that changed color
CONCLUSIONS
• Factors that impact final sulfur concentration • Application rate • Formulation • Number of applications • Days before harvest of last spray
• Fruit destined for skin maceration is at a higher risk (more of the sulfur pool will get into the fermentation) • With white wines, must clarification can quickly
bring concentrations to safe levels • When in doubt measure your sulfur residue • No Sulfur is not the Answer!
REMAINING QUESTIONS
• In The Vineyard • Varietal differences • Impact of weather • Precipitation • Temperature (sublimation)
• With complete picture modeling seems feasible
• In The Winery • Exactly how much sulfur impacts wine quality • Big difference between 1mg/L and 10mg/L
• Best practices for reds what will receive late season application (how high can you push it?)
SUPPLEMENTAL INFORMATION
• “Persistence of Elemental Sulfur Spray Residue on Grapes during Ripening and Vinification” is Available for free. AJEV, 65(4), (2014): pg. 453-462)
• Youtube instructional video of Sulfur residue analysis available at... • https://youtu.be/yH83vDX8ORQ • “Assay for Measurement of Elemental Sulfur
Residues on Grapes”
• Technical brief of the instructions are available at... • Elemental Sulfur Residue Analysis Instructions,
v1.3 • http://articles.extension.org/pages/69748/
analyzing-elemental-sulfur-residues-on-grapes
THANK YOU
• Special thanks to... • My co-authors, Wayne Wilcox and Gavin Sacks • Rachel Allison, Herb Cooley, Dr. Olga Padilla-Zakour, Luann Preston-