80
Globalization, trade policy and industrialization in the long run Kevin Hjortshøj O’Rourke All Souls College, Oxford

Globalization, trade policy and industrialization in the long run
Kevin Hjortshøj O’Rourke
All Souls College, Oxford
The spread of modern industry & globalization in the long run
• Introduction: the convergence context
• The Industrial Revolution
• The spread of modern industry
• The second unbundling
• Gambling on globalization: future challenges

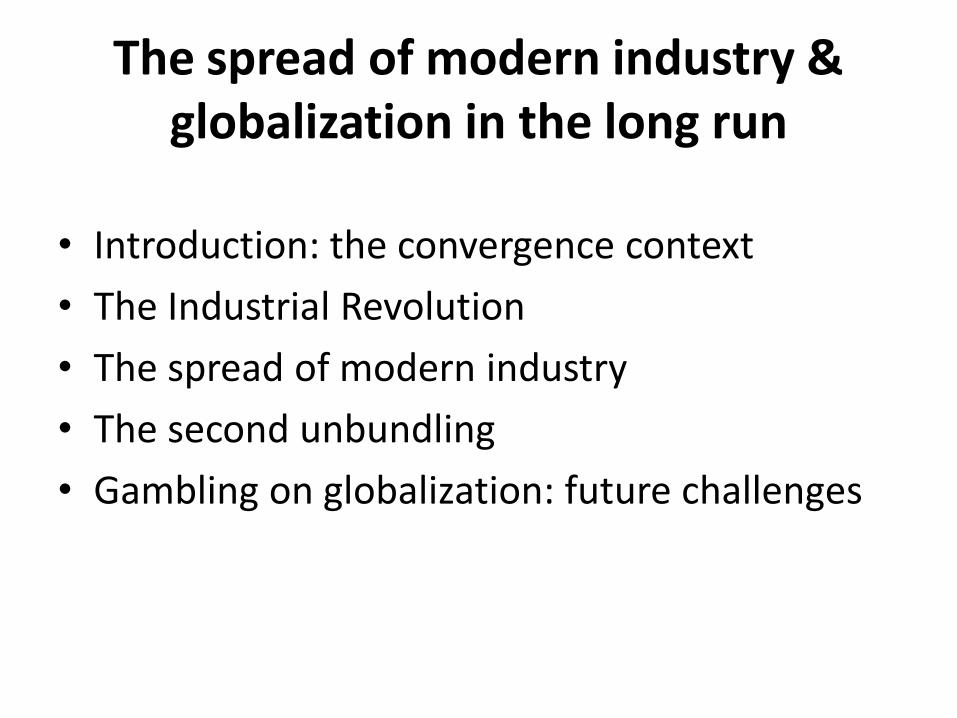
1. Introduction: the convergence context

Growth on the technological frontier
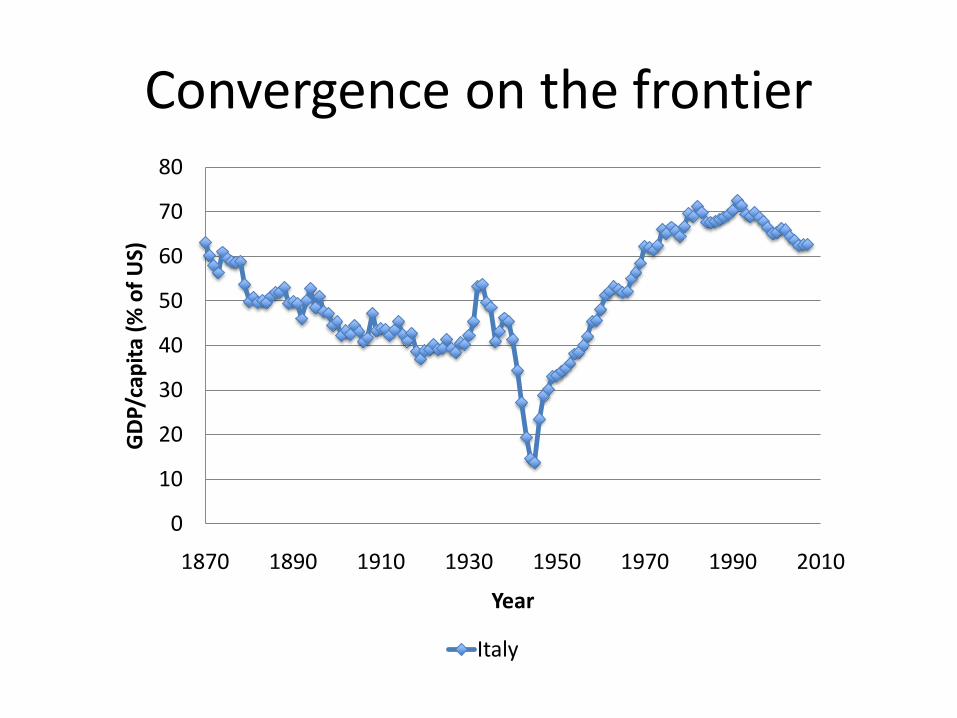
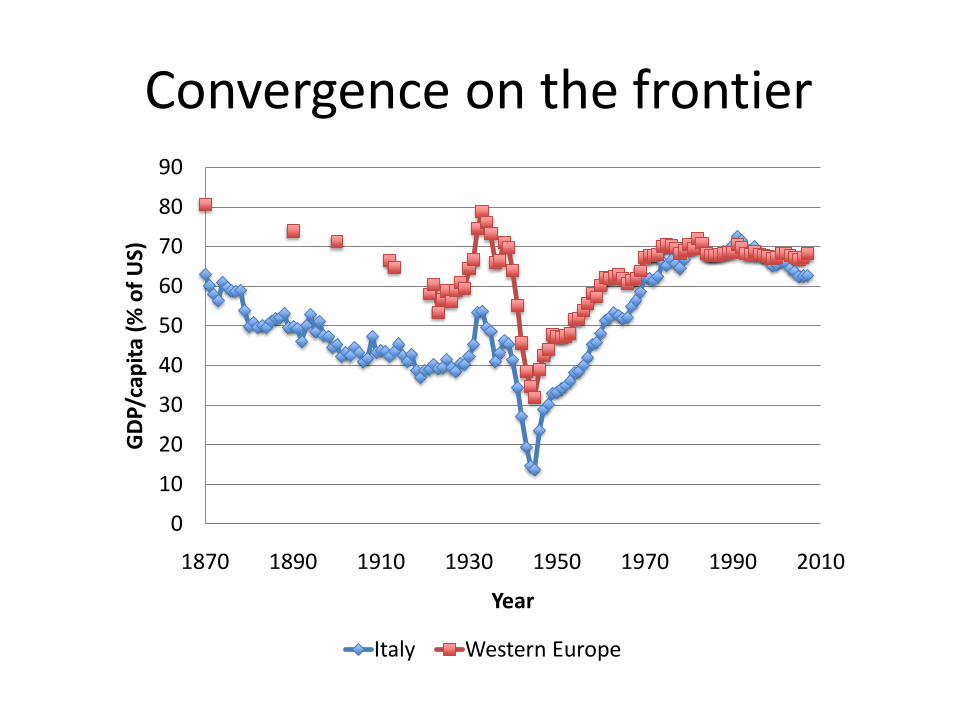
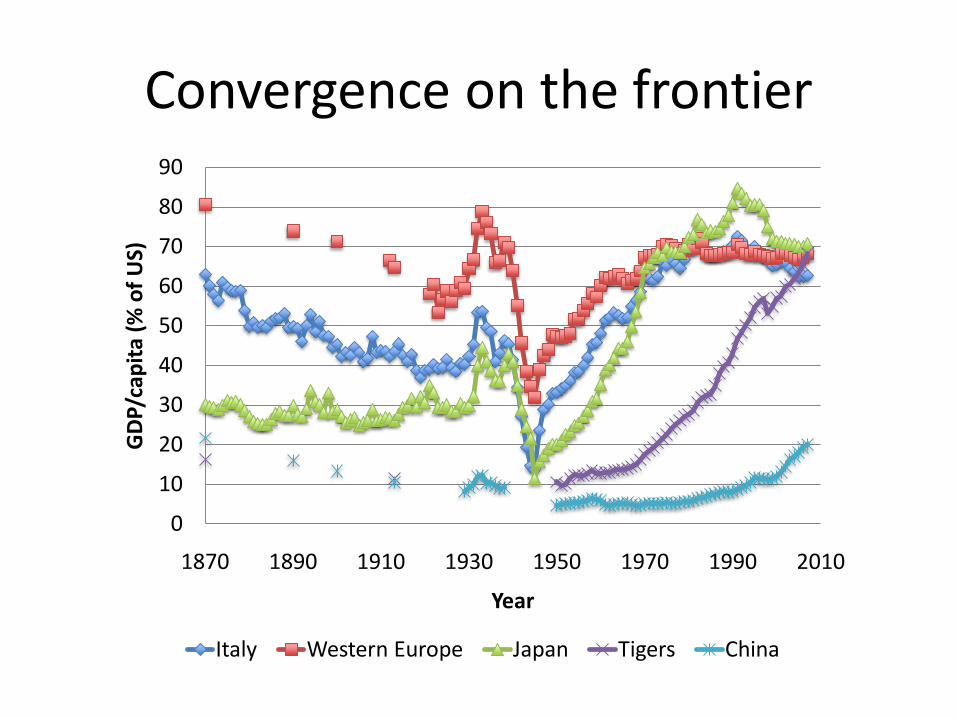
Convergence on the frontier
0
10
20
30
40
50
60
70
80
1870 1890 1910 1930 1950 1970 1990 2010
GD
P/ca
pit
a (%
of
US)
Year
Italy
Convergence on the frontier
0
10
20
30
40
50
60
70
80
90
1870 1890 1910 1930 1950 1970 1990 2010
GD
P/ca
pit
a (%
of
US)
Year
Italy Western Europe

Convergence on the frontier
0
10
20
30
40
50
60
70
80
90
1870 1890 1910 1930 1950 1970 1990 2010
GD
P/ca
pit
a (%
of
US)
Year
Italy Western Europe Japan
Convergence on the frontier
0
10
20
30
40
50
60
70
80
90
1870 1890 1910 1930 1950 1970 1990 2010
GD
P/ca
pit
a (%
of
US)
Year
Italy Western Europe Japan Tigers
Convergence on the frontier
0
10
20
30
40
50
60
70
80
90
1870 1890 1910 1930 1950 1970 1990 2010
GD
P/ca
pit
a (%
of
US)
Year
Italy Western Europe Japan Tigers China

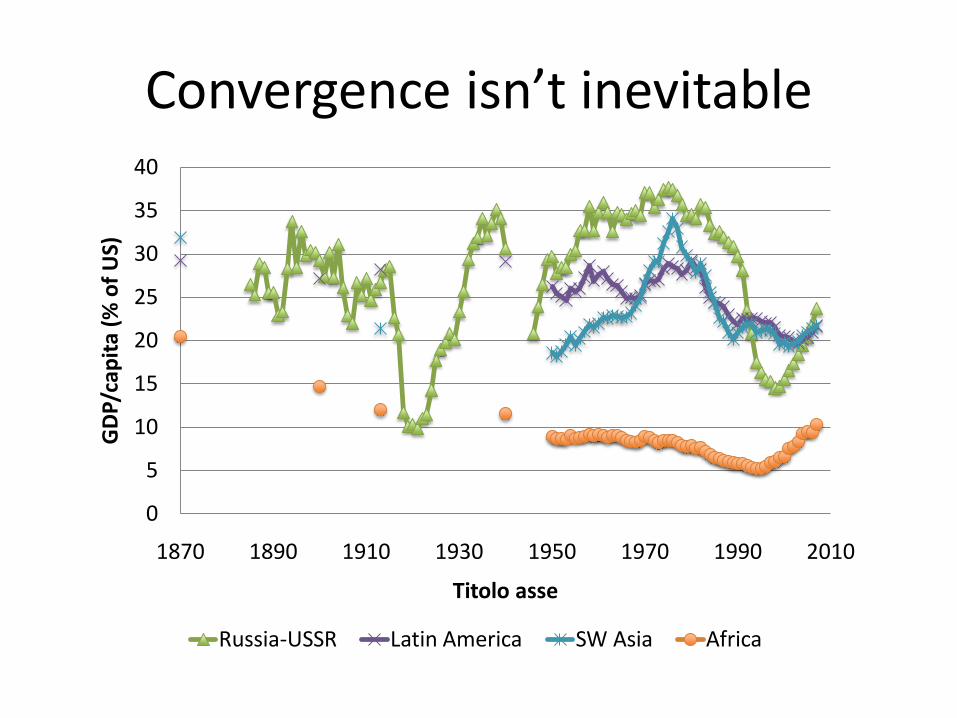
Convergence isn’t inevitable
0
5
10
15
20
25
30
35
40
1870 1890 1910 1930 1950 1970 1990 2010
GD
P/ca
pit
a (%
of
US)
Titolo asse
Russia-USSR

Convergence isn’t inevitable
0
5
10
15
20
25
30
35
40
1870 1890 1910 1930 1950 1970 1990 2010
GD
P/ca
pit
a (%
of
US)
Titolo asse
Russia-USSR Latin America

Convergence isn’t inevitable
0
5
10
15
20
25
30
35
40
1870 1890 1910 1930 1950 1970 1990 2010
GD
P/ca
pit
a (%
of
US)
Titolo asse
Russia-USSR Latin America SW Asia
Convergence isn’t inevitable
0
5
10
15
20
25
30
35
40
1870 1890 1910 1930 1950 1970 1990 2010
GD
P/ca
pit
a (%
of
US)
Titolo asse
Russia-USSR Latin America SW Asia Africa

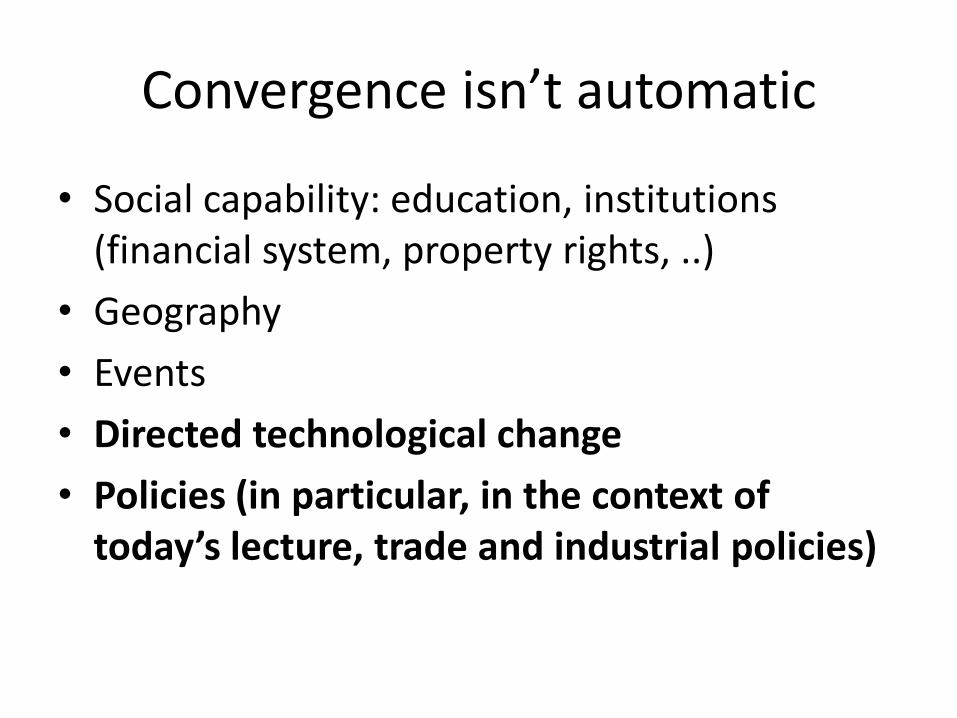
Convergence isn’t automatic
• Social capability: education, institutions (financial system, property rights, ..)
• Geography
• Events

Convergence isn’t automatic
• Social capability: education, institutions (financial system, property rights, ..)
• Geography
• Events
• Directed technological change
Convergence isn’t automatic
• Social capability: education, institutions (financial system, property rights, ..)
• Geography
• Events
• Directed technological change
• Policies (in particular, in the context of today’s lecture, trade and industrial policies)
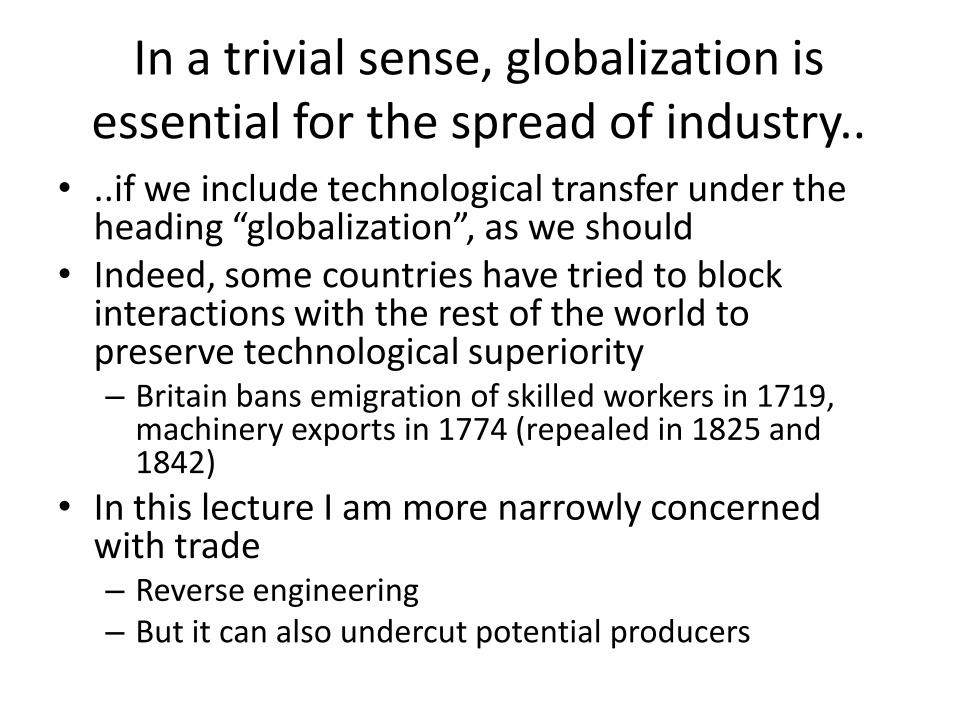
In a trivial sense, globalization is essential for the spread of industry..
• ..if we include technological transfer under the heading “globalization”, as we should
• Indeed, some countries have tried to block interactions with the rest of the world to preserve technological superiority– Britain bans emigration of skilled workers in 1719,
machinery exports in 1774 (repealed in 1825 and 1842)
• In this lecture I am more narrowly concerned with trade– Reverse engineering– But it can also undercut potential producers

2. The Industrial Revolution
Coal and the Industrial Revolution
• Wrigley (2010): transition from an organic economy to an energy-rich economy
• In organic economies photosynthesis is the source of most energy; land is an essential input into all our material products, and a constraint on growth
– “competition for land among Malthus’s four necessities – food, fuel, fiber, and building materials” (Pomeranz 2000, p. 56)
Escape from Malthus
• “In the Carboniferous era over many millions of years a proportion of the annual plant growth in some swampy areas became part of an energy store by the process which has given rise to the presence of coal measures in all the continents. A massive capital store of energy was slowly brought into being by setting aside a small proportion of the products of photosynthesis over a geological era” (Wrigley 2010, p. 22)
• “switch to coal may be regarded as a necessary condition for the industrial revolution” (p. 23)
The Industrial Revolution
• Allen (2009)
– IR involves substituting capital and energy for labour
– Happens first in Britain since wages there are high relative to energy (coal) prices
– Directed technological change: implies that new technologies may not be cost-efficient elsewhere (e.g. where wages are lower and/or energy is more expensive)
Britain was different
0
1
2
3
4
5 Amsterdam
London
Paris
Strasbourg
Newcastle
Beijing
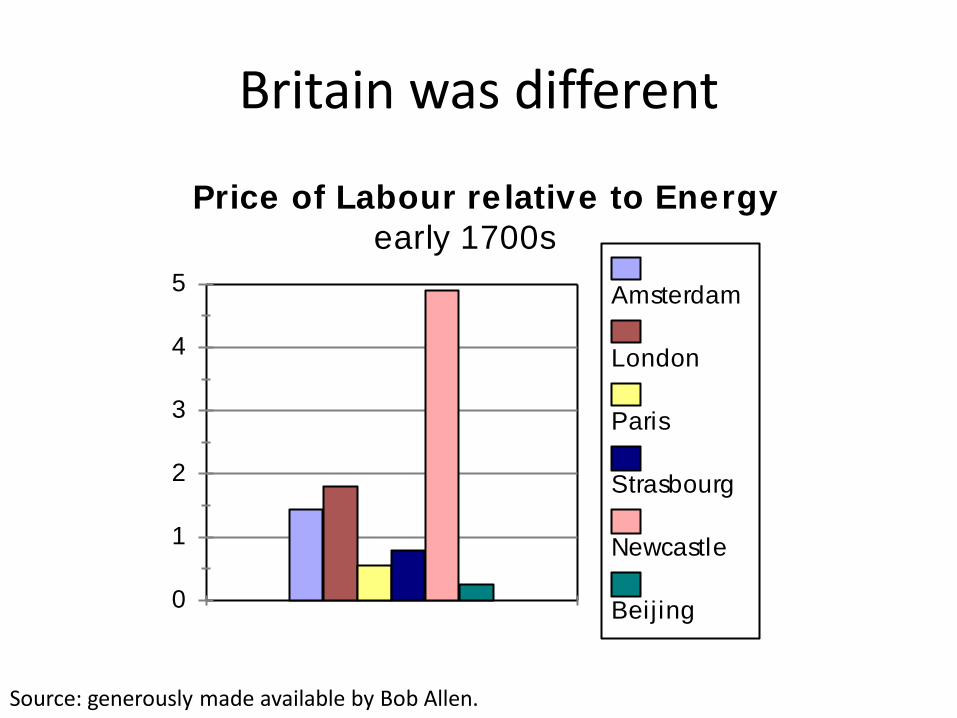
Price of Labour re lative to Energy
early 1700s
Source: generously made available by Bob Allen.
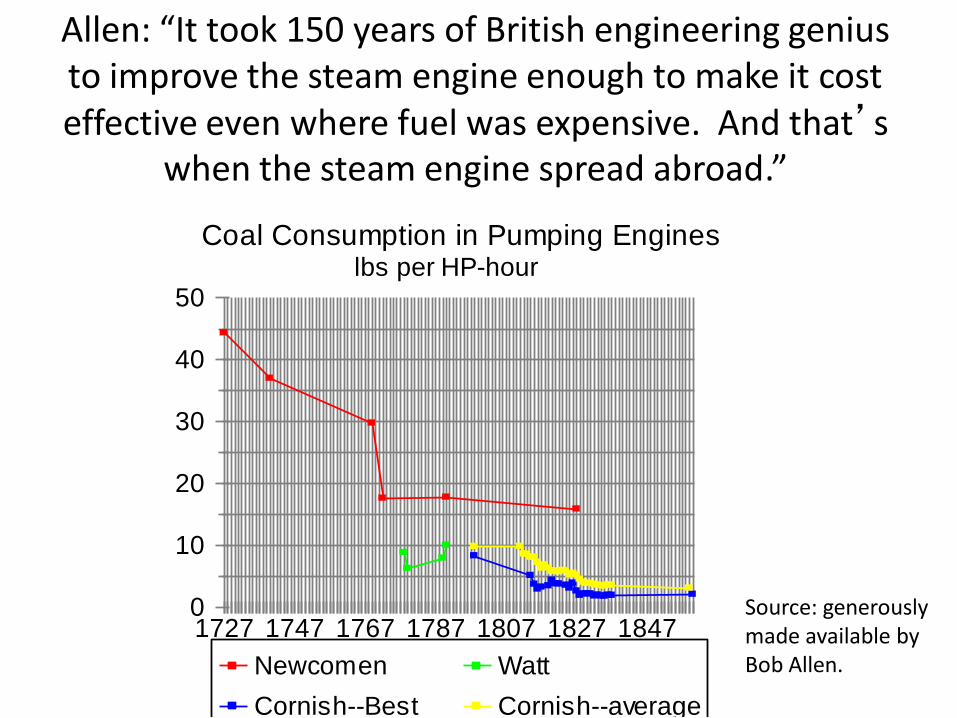
Allen: “It took 150 years of British engineering genius to improve the steam engine enough to make it cost effective even where fuel was expensive. And that’s
when the steam engine spread abroad.”
0
10
20
30
40
50
1727 1747 1767 1787 1807 1827 1847
Newcomen Watt
Cornish--Best Cornish--average
Coal Consumption in Pumping Engineslbs per HP-hour
Source: generously made available by Bob Allen.
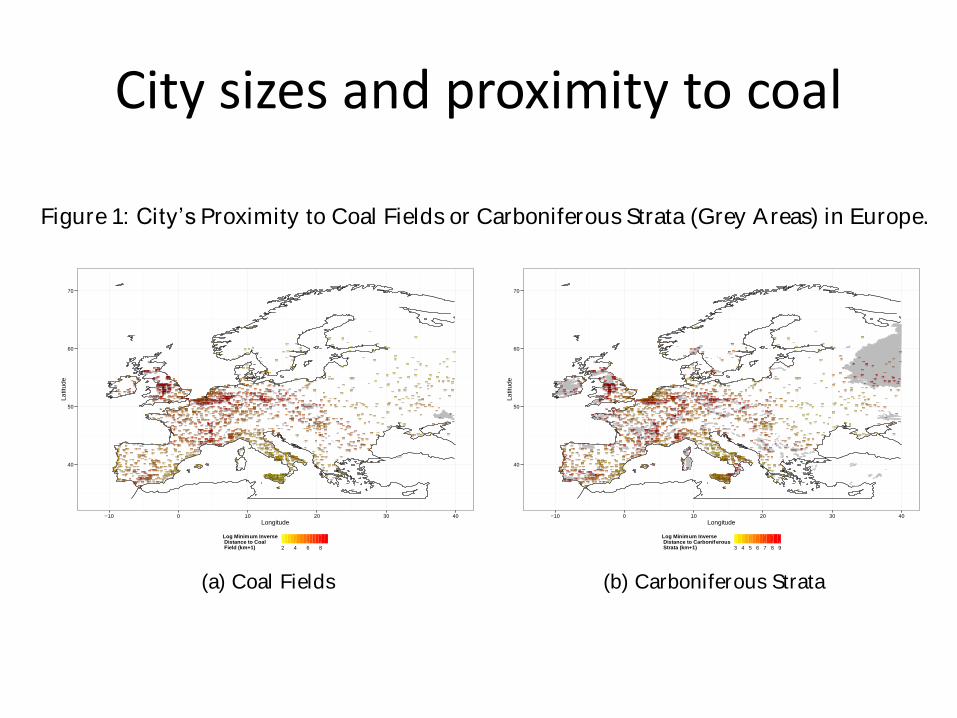
City sizes and proximity to coal
Figure 1: City’s Proximity to Coal Fields or Carboniferous Strata (Grey Areas) in Europe.
40
50
60
70
−10 0 10 20 30 40
Longitude
La
titu
de
2 4 6 8
Log Minimum Inverse Distance to Coal Field (km+1)
(a) Coal Fields
40
50
60
70
−10 0 10 20 30 40
Longitude
La
titu
de
3 4 5 6 7 8 9
Log Minimum Inverse Distance to Carbonif erous Strata (km+1)
(b) Carboniferous Strata
Figure 2: Proximity to Coal Fields and Proximity to Carboniferous Strata Scatterplot.
●
●
●
●
●
●
●
●
●
●
●
●
●
●
●
●
●
●
●
●
●
●
●
●
●
●●
●
●
●
●
●
●
●
●
●
●●
●
●
●
●
●
●●
●
●
●
●
●
●●
●
●
●
● ●
●
●
●
●●
●
●
●
●
●
●
●
●
●
●
●
●
●
●
●
●
●
●
●
●
●
●
●
●
●
●
●
●
●
●
●
●
●
●
●
●
●
●●
●●
●
●
●
●
●
● ●
●
●●
●
●
●
●
●
●
●
●
●
●
●
●
●
●●
●
●
●
●
●
●
●
●
●
●
●
●
●
●
●
●
●● ●
●
●
●
●
●
●
●
●
●
●
●
●●●
●
●
●
●
●
●
●
●
●
●
●
●
●
●
●●
●
●●
●●
●
●
●
●
●
●
●
●
●
●
●
●
●
●●
● ●
●●
●●
●
●
●
●
●
●
●
●
●
●
●
●
●
●
●
●
●
●
●
●
●
●
●
●
●
●●
●
●●
●
●
●
●
●
●
●
●
●
●
●
●
●
●
●
●
●
●
●
●
●
●
●
●
●
●
●
●
●
●
●
●
●
●
●
●
●
●
● ●
●●
●
●
●● ●
●●
●
●
●●
●
●
●
●
●
●
●
●
●
●
●●
●
●
●
●
●
●
●
●
●
●
●
●
●
●
●●
●
●
●
●
●
●
●
●
●
●
●
●
●
●
●
●
●
●●
●
●
●
●
●
●
●
●
●
●
●
●●
●●
● ●●●
●
●
●
●
●
●
●
●
●
●
●
●
●
●
●●
●
●
●
●
●
●
●
●
●
●
●
●
●
●
●
●
●
●
●
●
●●
●
●
●
●●
●
●●
●
●
●
●●●●
●
●
●
●
●
●
●
●
●
●
●
●
●
●
●
●
●
●
●
●
●
●
●
●
●
●
●
●
●
●
●
●
●
●
●
●
●
●
●
●
●
●
●
●
●
●
●
●
●
●
●
●
●
●
●
●
●
●
●
●
●
●
●
●
●
●
●● ●
●
●
●
●●
●●
●
●
●
●
●
●
●●
●
●
●
●
●
●●
●
●
●
●
●
●
●
●
●
●
●
●●
●
●
●
●●
●
●
●
●
●
●
●
●
●
●
●
●
●
●
●
●
●
●
●
●
●
●
●
●
●
●
●
●
●
●
●
●
●
●
●
●
●●
●
●
●
● ●
●
●
●
●● ●
●
●
●
●
●
●
●
●
●
●
●
●
●
●
●
●
●
●
●
● ●
●
●
●
●
●
●
●
●
●●
●
●
●
●
●
●
●
● ●
●
●●
●
●
●
●
●
●
●●
●●
●
●
●●
●
●
●
●
●
●
●
●
●
●
●
●
●
●
●
●
●
●
●
●
●
●
●
●
●
●
●
●
●
●
●
●
●
●
●
●
●
●
●
●
●
●
●
●
●
●
●●
●
●
●
●
●
●
●
●
●
●
●
●
●
●
●
●
●
●
●
●
●
●
●
●
●
●●
●●
●
●●
●
●
●
●
●
●
●
●●
●
●
●
●
●
●
●
●
● ●
●
●
●
●
●
●
●
●
●
●
●
●●
●
●
●
●
●
●
●
●
●
●
●
●
●
●
●
●
●
● ●
●
●
●
●
●
●
●
●
●
●
● ●
●
●
●
●
●
●●
●
●
●
●●
●
●
●
●
●
●
●
●
●
●●
●
●
●
●
●●
●
●
●
●
● ●
●
●
●●
●
●
●
●
●
●
●
●
●
●
●
●
●
●
●
●
●
●
●
●●
●
●
●
●
●
●
●
●
●
●
●
●
●
●
●
●
●
●
●
●
●
●
●
●
●
●
●
●
●
●
●
●
●
●
●
●
●
●
●
●
●
●
●
●●
●
●
●
●
●
●
●
●
●
●
●
●
●
●
●
●
●
●
●
●
●
●
●
●
●
●
●
●
●
●
●●
●
●
●
●
●
●
●
●
●
●
●
●●
●●
●
●
●●
●
●
●
●
●
●
●
●
●
●
●
●
●
●
●
●
●
●
●
●
●
●
●
●
●
●
●
●
●
●
●
●
●
●
●
●
●
●
●
●
●
●
●
●
●
●
●
● ●
●●
●
●
●
●
●
●
●
●
●
●
●
●
● ●
●
●
●
●
●
●
●●
●●
●
●
●
●
●
●●
●●
●
●
●
●
●
●
●
●
●
●●
●
●
●
●
●
●
●
●
●
●
●
●
● ●
●
●
●
● ●
●
●
●
●
●
●●
●
●
●
●
●
●
●
●
●
● ●
●
● ●
●
●
●
●
●
●
●
●
●
●
●
●
●
●
●
●
●
●
●●●
●
●
●●
●
●
●
●
●
●
●
● ●
●
●
●
●
●
●
● ●
●
●
●
●
●
●
●
●
●
●●
●
●
●
●
●
●
●
●
●●
●
●
●
●
●
●
●
●
●
●
●
●
●
●
●
●●
●
●
●
●●
●
●
●
●●
●
●
●
●
●
●
●
●
●
●
●
●
●
●
●
● ●
●
●
●
●
●
●
●
●
●
●
●
●
●●
●
●
●
●●
●
●
●
●
●
●
●
●
●
●
●
●
●
●
●●
●●
●
●
●
●
●●
●
●
●
●
●
●
●
●
●
●
●
●
●●
●
●
●
●
●
●
●
●
●
●●
●●
●
●
●
●
●
●
●
●
●
●
●
●
●●
●
●
●
●
●
●
●
●
●
●
●●
●
●
●
●
●
●
●
●
●●
●
●
●
●
●
●
●
●
●
●
●
●
●●
●
●●●
●
●
●
●
●
●
●
●
●
●
●
●
●
●
●
●
●
●
●
●
●
●
●
●
●
●
●
●
●
●
●
●
●
● ●●
●●
●●
●
●
●
●
●
●
●
●
●
●
●
●
●
●
●
●
●●
●
●
●
●
●
●
●
●
●
●
●
●
●
●
●
●
●
●
●
●
●
●
●●
●
●
●
●
●
●
●
●
●
●
●
●
●
●
●
●
●
●
●
●● ●
●
●
●
●
●
●
●
●●
●
●
●
●
●
● ●
●
●
●
●
●
●
●●
●●
●
●
●
●
●
●
●
●
●
●
●
●
●
●
●●
●●
●
●
●
●
●
●
●
●●
●●
●
●
●
●●
●
●
●●
●●
●
●
●
●●
●
●
●
●
●
●
●
●
●
●
●
●
●
●
●
●
●
●
●
●
●
●
●
●
●
●
●
●
●
●
●
●
●
●
●
●
●
●
●
●●
●
●●
●
●
●●
●
●●
●
●●
●
●
●
●
●
● ●
●
●
●
●
●
●
●
●
●●
●
●
●
●
●
●
●
●
●
●
●
●
●
●
●
●
●
●
●
●
●
●
●
●
●
●
●
●
●
●
●
●
●●
●
●
●
●
●
●
●
●
●
●
●
●
●
●●
●
●
●
●
●
●●
●
●
●●
●
●
●
●●
●
●
●
●
●
●
●
●
●
●
●
●
●
●
●
●
●
●
●
●
●
●
●
●
●
●
●
●
●
●
●
●
●
●
●
●●
●
●
●
●
● ●
●
●
●
●
●
●
●
●
●
●
●
●
●
●
●
●
●
●
●
●
● ●
●●
●
●
●
●
●
●
●
●
●
●●
●
●
●
●
●
●
●
●
●
●
●
●
●
●
●
●
●
●
●
●
●
●
●
●●
●
●
●
●
●
●
●
●
●●
●
●
●
●
●
●
●
●
●
●
●
●
●
●
●
●
●
●
●
●
●
●
●
●
●
●●
●
●
●
●
●
●●
●
●
●
●
●
●
●
●
●
●
●
●
●
●
●
●
●
●
●
●
●
●●
●●
●
●
●
●
●
●
●
●
●
●
●
●
●
●
●
●
●
●
●
●
●
●
●
●
●
●
●
● ●
●
●
●●
●
●
●
●
●
●
●
●
●
●
●
●
●
●
●
●
●●
●
●
●
●
●
●
●●
●
●
●
●
●
●
●
●
●
●
●
●●
●
● ●
●
●
●
●
●
●
●
●
●
●
●
●
●
●
●
●
●
●
●
●●
●
●
●
●
●
●
●
●
●
●
●
●
●●
●
●
●●
●
●●●
●
●
●
●
●
●
●
●
●
●
●
●●
●
●
●
●
●
●●
● ●
●
●
●
●
●
●
●●
●●
●
●
●
●●●
●
●
●
●
●
●
●
●
●
●
●
●
●
●
● ●
●
●
●
●
●
●
●
●
●
●
●
●
●●
●
●
●
●
●●
●●
●
●●
●
●
●
●
●
●
●
●
●
●
●
●
●●●●
●●
●
●
●
●
●
●
●
●
●
●
●
●
●
●
●
●
●
●●
●
●
●
●
●
● ●
●
●●
● ●
●
●
●
●
●
●
●
●
●
●●
●
●
●
●
●
●
●
●
●
●
●
●
●
●
●
●
●
●
●
●
●
●
●
●
●●
●
●
●
●●
●●
●
●
●
●
●
●
●
●
●●
●
●
●
●
●
● ●●
●
●
●
●
●●
●
●
●
●
●●
●
●
●●
●
●
●
●
●
●
●
●
●
●
●
●
●
●
●
●
●
●
●
●
●
●
●
●
●
●
●
● ●
●
●
●
●
●
●
●
●
●
●
●
●
●●
●●
●
●
●
●
●
●
●
●
2
4
6
8
4 6 8
ln Proximity to Carboniferous Strata Measure
ln P
roxim
ity t
o C
oa
l F
ield
Me
asu
re
Correlation=0.574, N=2145
2
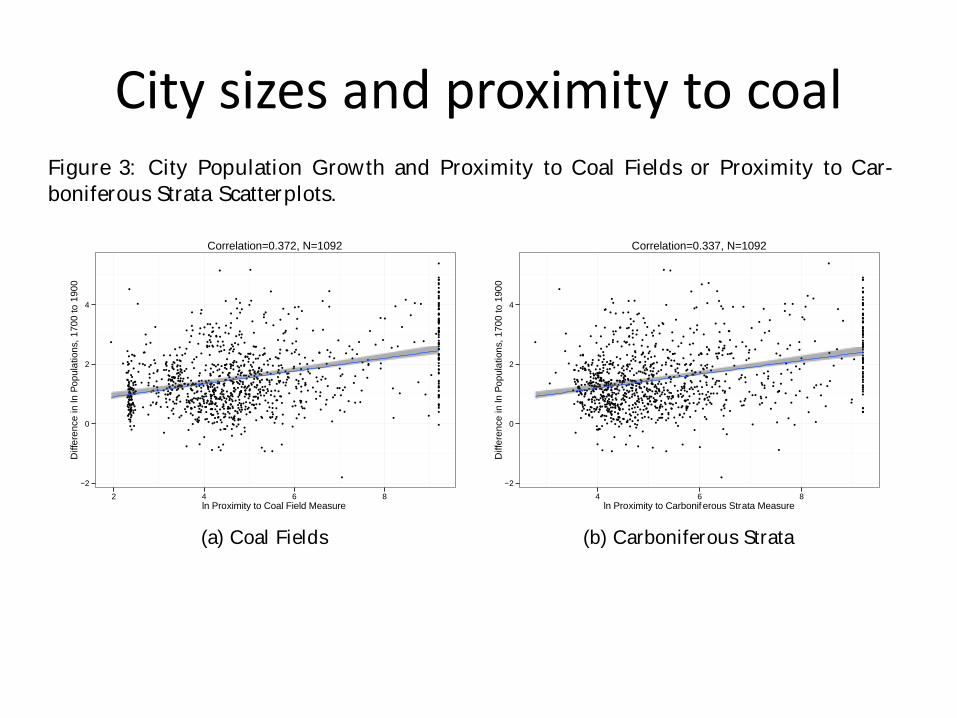
City sizes and proximity to coalFigure 3: City Population Growth and Proximity to Coal Fields or Proximity to Car-
boniferous Strata Scatterplots.
●
●
●
●
●
●
● ●
●●
●
●●
●
●●
●
●●
●
●
●
●
●
●
●
●
●
●
● ●
●
●
●
●
● ●●
●●
●
●
●
●
●
●
●
●
●
●
●
●
●
●
●●
●
●
●
●
●
●
●
●
●
● ●
●
●●
●
●
●
●
●●
●
●●
●
●
●●
●
●
●
●
●
●
●
●
●
●
●●
●
●
●
●
●
●●
●
●
●
●
●
●
●
●
●
●
● ●
●
●
●
●
●
●
● ●●
●
●
●
●
●
●
●
●
●
●
●
●
●
●
●
●
●
●
●
●
●
●
●
●
●
●
●
●
●
●
●
●
●
●
●
●
●
●
●
●
●
●
●
●
●
●●
●
●
●
●
●
●
●
●
●
●
●
●
●
●
●●●
●
●
●
●●
●
●
●
●
●
●
●
●
●
●
●
●●
●
● ●
●
●
●
●
●
●
●
●●
●
●
●
●
●●
●
●
●
●
●●
●
●
●
●
●
●
●
●
●
●
●
●
●
●
●
●
●
●●
●
●
●
●
●●
●
●●
●●
●
●
●
●●
●
●
●
●
●
●
●
●●
●
●
●
●
●
●
●
●●
●
●
●
●
●
●
●
●
●
●
●
●
●
●
●
●
●
●
●
●
●
●
●
●
●
●
●
●
●
●●
●
●
●
●
●
●
●
●
●
●
●
●
●
●
● ●●
●
●
●●
●
●
●●
●
●
● ●
●●
●
●
●
●
●
●
●●
●
●
●
●●
●●
●●
●●
●
●
●
●
●
●
●●
●
●●
●
●
●
●
●
●
●●
●●
●
●●
●
●
●
●
●
●
●
●
●●
●
●
●
●●
●
●
●
●
●
●
●
●
●
●
●
●
●
●
●●
●
●
●●
●
●●
● ●
●
●
●
● ●
●
●
●
●
●●
●
●
●
●
●
●
●
●
●●
●
●
●
●
●
●
●
●
●
●
●
●●
●●
●
●●
●
●
●
●
●
●
●
●
●
●
●
●
●
●●
●
●
●
●
●
●
●
●
●
●
●
●
●
●
●
●
●
●
● ●
●
● ●
●
●
●
●
●
●
●
●
●
● ●
●
●
●
●
●
●●
●
●
●
●
●●
●
●
●
●
●
●
●
●
●
●
●
●
●
●
●
●
●
●
●●
● ●
●
●●
●●
●●
●●
●
●
●
●●
●
●
●
●
●
●
●
●
●
●
●
●
●
●
●
●●
●
●
●
● ●
●
●
●
●
●
●
●
●
●
●
●
●
●
●
●
●
●
●
●
●
●
●
●●
●●
●
●
●
●
●
●
●
●
●
●
●
●
●
●
●●
●
●
●
●
●
●
●
●
●
●
●
●
●
●●
●
●
●
●
●
●
●
●
●
●
●
●
●
●
●
●●
●
●
●
●
●
●
●
●
●●
●
●
●●
●
●
●
●
●
●
●
●
●
●
●
●
●
●
●
●
●
●
●
●
● ●
●
●
●
●●
●
●
●
●
●
●
●
●
●
●●
●
●
●
●
●
●
●
●
●
●
●
●●
●
●
●
●
●
●
●
●
●●
●
●
●
●
●
●●
●
●
●
●
●
●
● ●
●
●
●
●
●
●
●
●
●
●
●
●
●
●
●
●
●
●
●
●
●
●
●
●
●
●
●
●
●
●
●
●
●
●
●●
●
●
●
●
●
●
●
●
●
●
●
●
●
●
●
●●
●
●
●
●
●
●
●
●
●
●
●
●
●
●
●●
●
●
●●
●
●
●
●
●●
●
●
●
●
●
●
●
●
●
●
●● ●
●
●
●
●
●
●
●
●
●
●
●
●
●
●
●
●
●
●
●
●
●
●
●
●
●
●
●
●
●
●
●
●
●
●
●●
●
●
●
●
●
●●
●
●
●
●●
●●
●
●
●
●
●●
●
●
●
●
●
●
●
●
●
●
●
●
●
●
●
●
●
●
●
●
●
●
●
●
●
●
●
●
●
●
●
●
●
●●
●
●
●
●
●
●●
●
●
●
●
●
●
●
●
●
●
●●
●
●●
●
●
●
●
●
●
●
●●
●●
●
●
●
●●
●
●
●
●
●
●
●
●
● ●●
●
●
●
●
●
●
●
●
●
●
●
●
●
●
●
●
●
●
●●
●
●
●
●●
●
●
●
●
● ●
●
●
●
●●
●
●
●
●
●
●
●
● ●
●●
●
●
●
●
●
●●
●
●
●
●
●
●
●
● ●
●
●
●
●
●
●
●
●●●
●
●
●
●
●
●
●●
●
●
●
●●
●
●
●
●
●
●
●
●
●
●●
●
●
●●●
●
●
●
●
●
●
●
●
−2
0
2
4
2 4 6 8
ln Proximity to Coal Field Measure
Diffe
ren
ce
in ln
Pop
ula
tion
s,
170
0 to
190
0
Correlation=0.372, N=1092
(a) Coal Fields
●
●
●
●
●
●
●●
●●
●
●●
●
●●
●
●●
●
●
●
●
●
●
●
●
●
●
● ●
●
●
●
●
● ●●
●●
●
●
●
●
●
●
●
●
●
●
●
●
●
●
●●
●
●
●
●
●
●
●
●
●
● ●
●
●●
●
●
●
●
●●
●
●●
●
●
●●
●
●
●
●
●
●
●
●
●
●
●●
●
●
●
●
●
●●
●
●
●
●
●
●
●
●
●
●
●●
●
●
●
●
●
●
●●●
●
●
●
●
●
●
●
●
●
●
●
●
●
●
●
●
●
●
●
●
●
●
●
●
●
●
●
●
●
●
●
●
●
●
●
●
●
●
●
●
●
●
●
●
●
●●
●
●
●
●
●
●
●
●
●
●
●
●
●
●
●●●
●
●
●
●●
●
●
●
●
●
●
●
●
●
●
●
●●
●
●●
●
●
●
●
●
●
●
●●
●
●
●
●
●●
●
●
●
●
●●
●
●
●
●
●
●
●
●
●
●
●
●
●
●
●
●
●
●●
●
●
●
●
● ●
●
●●
●●
●
●
●
●●
●
●
●
●
●
●
●
●●
●
●
●
●
●
●
●
●●
●
●
●
●
●
●
●
●
●
●
●
●
●
●
●
●
●
●
●
●
●
●
●
●
●
●
●
●
●
●●
●
●
●
●
●
●
●
●
●
●
●
●
●
●
● ●●
●
●
●●
●
●
●●
●
●
●●
●●
●
●
●
●
●
●
●●
●
●
●
● ●
●●
●●
●●
●
●
●
●
●
●
●●
●
●●
●
●
●
●
●
●
●●
●●
●
●●
●
●
●
●
●
●
●
●
●●
●
●
●
● ●
●
●
●
●
●
●
●
●
●
●
●
●
●
●
●●
●
●
●●
●
●●
● ●
●
●
●
● ●
●
●
●
●
●●
●
●
●
●
●
●
●
●
● ●
●
●
●
●
●
●
●
●
●
●
●
●●
●●
●
●●
●
●
●
●
●
●
●
●
●
●
●
●
●
● ●
●
●
●
●
●
●
●
●
●
●
●
●
●
●
●
●
●
●
●●
●
● ●
●
●
●
●
●
●
●
●
●
● ●
●
●
●
●
●
●●
●
●
●
●
●●
●
●
●
●
●
●
●
●
●
●
●
●
●
●
●
●
●
●
●●
● ●
●
●●
● ●
●●
●●
●
●
●
●●
●
●
●
●
●
●
●
●
●
●
●
●
●
●
●
●●
●
●
●
● ●
●
●
●
●
●
●
●
●
●
●
●
●
●
●
●
●
●
●
●
●
●
●
●●
●●
●
●
●
●
●
●
●
●
●
●
●
●
●
●
●●
●
●
●
●
●
●
●
●
●
●
●
●
●
●●
●
●
●
●
●
●
●
●
●
●
●
●
●
●
●
●●
●
●
●
●
●
●
●
●
●●
●
●
●●
●
●
●
●
●
●
●
●
●
●
●
●
●
●
●
●
●
●
●
●
● ●
●
●
●
●●
●
●
●
●
●
●
●
●
●
●●
●
●
●
●
●
●
●
●
●
●
●
●●
●
●
●
●
●
●
●
●
●●
●
●
●
●
●
●●
●
●
●
●
●
●
● ●
●
●
●
●
●
●
●
●
●
●
●
●
●
●
●
●
●
●
●
●
●
●
●
●
●
●
●
●
●
●
●
●
●
●
●●
●
●
●
●
●
●
●
●
●
●
●
●
●
●
●
●●
●
●
●
●
●
●
●
●
●
●
●
●
●
●
●●
●
●
●●
●
●
●
●
● ●
●
●
●
●
●
●
●
●
●
●
●● ●
●
●
●
●
●
●
●
●
●
●
●
●
●
●
●
●
●
●
●
●
●
●
●
●
●
●
●
●
●
●
●
●
●
●
●●
●
●
●
●
●
●●
●
●
●
●●
●●
●
●
●
●
● ●
●
●
●
●
●
●
●
●
●
●
●
●
●
●
●
●
●
●
●
●
●
●
●
●
●
●
●
●
●
●
●
●
●
●●
●
●
●
●
●
●●
●
●
●
●
●
●
●
●
●
●
●●
●
●●
●
●
●
●
●
●
●
●●
●●
●
●
●
●●
●
●
●
●
●
●
●
●
●●●
●
●
●
●
●
●
●
●
●
●
●
●
●
●
●
●
●
●
● ●
●
●
●
●●
●
●
●
●
●●
●
●
●
●●
●
●
●
●
●
●
●
● ●
●●
●
●
●
●
●
●●
●
●
●
●
●
●
●
● ●
●
●
●
●
●
●
●
●●
●
●
●
●
●
●
●
●●
●
●
●
●●
●
●
●
●
●
●
●
●
●
●●
●
●
●● ●
●
●
●
●
●
●
●
●
−2
0
2
4
4 6 8
ln Proximity to Carbonif erous Strata MeasureD
iffe
ren
ce
in ln
Pop
ula
tion
s,
170
0 to
190
0
Correlation=0.337, N=1092
(b) Carboniferous Strata
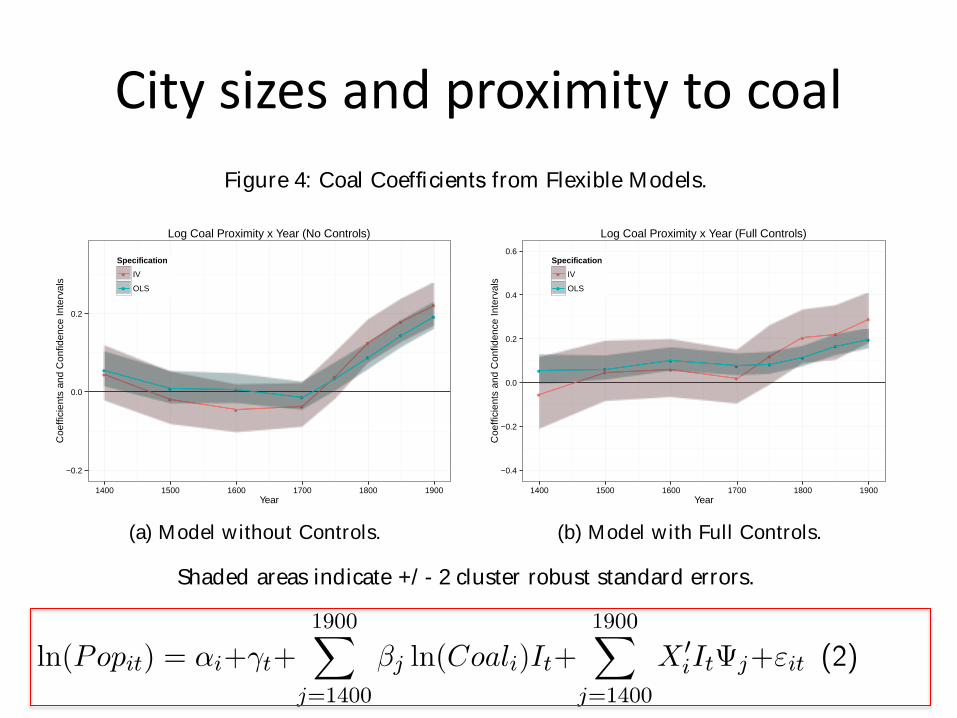
Figure 4: Coal Coefficients from Flexible Models.
●
● ●●
●
●
●
●
●
●
● ●
●
●
●
●
−0.2
0.0
0.2
1400 1500 1600 1700 1800 1900
Year
Co
eff
icie
nts
and
Co
nfid
ence I
nte
rva
ls
Specification
●
●
IV
OLS
Log Coal Proximity x Year (No Controls)
(a) Model without Controls.
● ●
●● ●
●
●●
●
● ●
●
●
●●
●
−0.4
−0.2
0.0
0.2
0.4
0.6
1400 1500 1600 1700 1800 1900
Year
Co
eff
icie
nts
and
Co
nfid
ence I
nte
rva
ls
Specification
●
●
IV
OLS
Log Coal Proximity x Year (Full Controls)
(b) Model with Full Controls.
Shaded areas indicate +/ - 2 cluster robust standard errors.
3
City sizes and proximity to coal
Figure 3: City Population Growth and Proximity to Coal Fields or Proximity to Car-
boniferous Strata Scatterplots.
●
●
●
●
●
●
● ●
●●
●
●●
●
●●
●
●●
●
●
●
●
●
●
●
●
●
●
● ●
●
●
●
●
● ●●
●●
●
●
●
●
●
●
●
●
●
●
●
●
●
●
●●
●
●
●
●
●
●
●
●
●
● ●
●
●●
●
●
●
●
●●
●
●●
●
●
●●
●
●
●
●
●
●
●
●
●
●
●●
●
●
●
●
●
●●
●
●
●
●
●
●
●
●
●
●
● ●
●
●
●
●
●
●
● ●●
●
●
●
●
●
●
●
●
●
●
●
●
●
●
●
●
●
●
●
●
●
●
●
●
●
●
●
●
●
●
●
●
●
●
●
●
●
●
●
●
●
●
●
●
●
●●
●
●
●
●
●
●
●
●
●
●
●
●
●
●
●●●
●
●
●
●●
●
●
●
●
●
●
●
●
●
●
●
●●
●
● ●
●
●
●
●
●
●
●
●●
●
●
●
●
●●
●
●
●
●
●●
●
●
●
●
●
●
●
●
●
●
●
●
●
●
●
●
●
●●
●
●
●
●
●●
●
●●
●●
●
●
●
●●
●
●
●
●
●
●
●
●●
●
●
●
●
●
●
●
●●
●
●
●
●
●
●
●
●
●
●
●
●
●
●
●
●
●
●
●
●
●
●
●
●
●
●
●
●
●
●●
●
●
●
●
●
●
●
●
●
●
●
●
●
●
● ●●
●
●
●●
●
●
●●
●
●
● ●
●●
●
●
●
●
●
●
●●
●
●
●
●●
●●
●●
●●
●
●
●
●
●
●
●●
●
●●
●
●
●
●
●
●
●●
●●
●
●●
●
●
●
●
●
●
●
●
●●
●
●
●
●●
●
●
●
●
●
●
●
●
●
●
●
●
●
●
●●
●
●
●●
●
●●
● ●
●
●
●
● ●
●
●
●
●
●●
●
●
●
●
●
●
●
●
●●
●
●
●
●
●
●
●
●
●
●
●
●●
●●
●
●●
●
●
●
●
●
●
●
●
●
●
●
●
●
●●
●
●
●
●
●
●
●
●
●
●
●
●
●
●
●
●
●
●
● ●
●
● ●
●
●
●
●
●
●
●
●
●
● ●
●
●
●
●
●
●●
●
●
●
●
●●
●
●
●
●
●
●
●
●
●
●
●
●
●
●
●
●
●
●
●●
● ●
●
●●
●●
●●
●●
●
●
●
●●
●
●
●
●
●
●
●
●
●
●
●
●
●
●
●
●●
●
●
●
● ●
●
●
●
●
●
●
●
●
●
●
●
●
●
●
●
●
●
●
●
●
●
●
●●
●●
●
●
●
●
●
●
●
●
●
●
●
●
●
●
●●
●
●
●
●
●
●
●
●
●
●
●
●
●
●●
●
●
●
●
●
●
●
●
●
●
●
●
●
●
●
●●
●
●
●
●
●
●
●
●
●●
●
●
●●
●
●
●
●
●
●
●
●
●
●
●
●
●
●
●
●
●
●
●
●
● ●
●
●
●
●●
●
●
●
●
●
●
●
●
●
●●
●
●
●
●
●
●
●
●
●
●
●
●●
●
●
●
●
●
●
●
●
●●
●
●
●
●
●
●●
●
●
●
●
●
●
● ●
●
●
●
●
●
●
●
●
●
●
●
●
●
●
●
●
●
●
●
●
●
●
●
●
●
●
●
●
●
●
●
●
●
●
●●
●
●
●
●
●
●
●
●
●
●
●
●
●
●
●
●●
●
●
●
●
●
●
●
●
●
●
●
●
●
●
●●
●
●
●●
●
●
●
●
●●
●
●
●
●
●
●
●
●
●
●
●● ●
●
●
●
●
●
●
●
●
●
●
●
●
●
●
●
●
●
●
●
●
●
●
●
●
●
●
●
●
●
●
●
●
●
●
●●
●
●
●
●
●
●●
●
●
●
●●
●●
●
●
●
●
●●
●
●
●
●
●
●
●
●
●
●
●
●
●
●
●
●
●
●
●
●
●
●
●
●
●
●
●
●
●
●
●
●
●
●●
●
●
●
●
●
●●
●
●
●
●
●
●
●
●
●
●
●●
●
●●
●
●
●
●
●
●
●
●●
●●
●
●
●
●●
●
●
●
●
●
●
●
●
● ●●
●
●
●
●
●
●
●
●
●
●
●
●
●
●
●
●
●
●
●●
●
●
●
●●
●
●
●
●
● ●
●
●
●
●●
●
●
●
●
●
●
●
● ●
●●
●
●
●
●
●
●●
●
●
●
●
●
●
●
● ●
●
●
●
●
●
●
●
●●●
●
●
●
●
●
●
●●
●
●
●
●●
●
●
●
●
●
●
●
●
●
●●
●
●
●●●
●
●
●
●
●
●
●
●
−2
0
2
4
2 4 6 8
ln Proximity to Coal Field Measure
Diffe
rence
in
ln P
op
ula
tio
ns,
17
00 t
o 1
90
0
Correlation=0.372, N=1092
(a) Coal Fields
●
●
●
●
●
●
●●
●●
●
●●
●
●●
●
●●
●
●
●
●
●
●
●
●
●
●
● ●
●
●
●
●
● ●●
●●
●
●
●
●
●
●
●
●
●
●
●
●
●
●
●●
●
●
●
●
●
●
●
●
●
● ●
●
●●
●
●
●
●
●●
●
●●
●
●
●●
●
●
●
●
●
●
●
●
●
●
●●
●
●
●
●
●
●●
●
●
●
●
●
●
●
●
●
●
●●
●
●
●
●
●
●
●●●
●
●
●
●
●
●
●
●
●
●
●
●
●
●
●
●
●
●
●
●
●
●
●
●
●
●
●
●
●
●
●
●
●
●
●
●
●
●
●
●
●
●
●
●
●
●●
●
●
●
●
●
●
●
●
●
●
●
●
●
●
●●●
●
●
●
●●
●
●
●
●
●
●
●
●
●
●
●
●●
●
●●
●
●
●
●
●
●
●
●●
●
●
●
●
●●
●
●
●
●
●●
●
●
●
●
●
●
●
●
●
●
●
●
●
●
●
●
●
●●
●
●
●
●
● ●
●
●●
●●
●
●
●
●●
●
●
●
●
●
●
●
●●
●
●
●
●
●
●
●
●●
●
●
●
●
●
●
●
●
●
●
●
●
●
●
●
●
●
●
●
●
●
●
●
●
●
●
●
●
●
●●
●
●
●
●
●
●
●
●
●
●
●
●
●
●
● ●●
●
●
●●
●
●
●●
●
●
●●
●●
●
●
●
●
●
●
●●
●
●
●
● ●
●●
●●
●●
●
●
●
●
●
●
●●
●
●●
●
●
●
●
●
●
●●
●●
●
●●
●
●
●
●
●
●
●
●
●●
●
●
●
● ●
●
●
●
●
●
●
●
●
●
●
●
●
●
●
●●
●
●
●●
●
●●
● ●
●
●
●
● ●
●
●
●
●
●●
●
●
●
●
●
●
●
●
● ●
●
●
●
●
●
●
●
●
●
●
●
●●
●●
●
●●
●
●
●
●
●
●
●
●
●
●
●
●
●
● ●
●
●
●
●
●
●
●
●
●
●
●
●
●
●
●
●
●
●
●●
●
● ●
●
●
●
●
●
●
●
●
●
● ●
●
●
●
●
●
●●
●
●
●
●
●●
●
●
●
●
●
●
●
●
●
●
●
●
●
●
●
●
●
●
●●
● ●
●
●●
● ●
●●
●●
●
●
●
●●
●
●
●
●
●
●
●
●
●
●
●
●
●
●
●
●●
●
●
●
● ●
●
●
●
●
●
●
●
●
●
●
●
●
●
●
●
●
●
●
●
●
●
●
●●
●●
●
●
●
●
●
●
●
●
●
●
●
●
●
●
●●
●
●
●
●
●
●
●
●
●
●
●
●
●
●●
●
●
●
●
●
●
●
●
●
●
●
●
●
●
●
●●
●
●
●
●
●
●
●
●
●●
●
●
●●
●
●
●
●
●
●
●
●
●
●
●
●
●
●
●
●
●
●
●
●
● ●
●
●
●
●●
●
●
●
●
●
●
●
●
●
●●
●
●
●
●
●
●
●
●
●
●
●
●●
●
●
●
●
●
●
●
●
●●
●
●
●
●
●
●●
●
●
●
●
●
●
● ●
●
●
●
●
●
●
●
●
●
●
●
●
●
●
●
●
●
●
●
●
●
●
●
●
●
●
●
●
●
●
●
●
●
●
●●
●
●
●
●
●
●
●
●
●
●
●
●
●
●
●
●●
●
●
●
●
●
●
●
●
●
●
●
●
●
●
●●
●
●
●●
●
●
●
●
● ●
●
●
●
●
●
●
●
●
●
●
●● ●
●
●
●
●
●
●
●
●
●
●
●
●
●
●
●
●
●
●
●
●
●
●
●
●
●
●
●
●
●
●
●
●
●
●
●●
●
●
●
●
●
●●
●
●
●
●●
●●
●
●
●
●
● ●
●
●
●
●
●
●
●
●
●
●
●
●
●
●
●
●
●
●
●
●
●
●
●
●
●
●
●
●
●
●
●
●
●
●●
●
●
●
●
●
●●
●
●
●
●
●
●
●
●
●
●
●●
●
●●
●
●
●
●
●
●
●
●●
●●
●
●
●
●●
●
●
●
●
●
●
●
●
●●●
●
●
●
●
●
●
●
●
●
●
●
●
●
●
●
●
●
●
● ●
●
●
●
●●
●
●
●
●
●●
●
●
●
●●
●
●
●
●
●
●
●
● ●
●●
●
●
●
●
●
●●
●
●
●
●
●
●
●
● ●
●
●
●
●
●
●
●
●●
●
●
●
●
●
●
●
●●
●
●
●
●●
●
●
●
●
●
●
●
●
●
●●
●
●
●● ●
●
●
●
●
●
●
●
●
−2
0
2
4
4 6 8
ln Proximity to Carbonif erous Strata Measure
Diffe
rence
in
ln P
op
ula
tio
ns,
17
00 t
o 1
90
0
Correlation=0.337, N=1092
(b) Carboniferous Strata
Figure 4: Coal Coefficients from Flexible Models.
●
● ●●
●
●
●
●
●
●
●●
●
●
●
●
−0.2
0.0
0.2
1400 1500 1600 1700 1800 1900
Year
Coe
ffic
ients
an
d C
onfid
en
ce I
nte
rvals
Specification
●
●
IV
OLS
Log Coal Proximity x Year (No Controls)
(a) Model without Controls.
● ●●
● ●●
●●
●
● ●
●
●
●●
●
−0.4
−0.2
0.0
0.2
0.4
0.6
1400 1500 1600 1700 1800 1900
YearC
oe
ffic
ients
an
d C
onfid
en
ce I
nte
rvals
Specification
●
●
IV
OLS
Log Coal Proximity x Year (Full Controls)
(b) Model with Full Controls.
Shaded areas indicate +/ - 2 cluster robust standard errors.
3
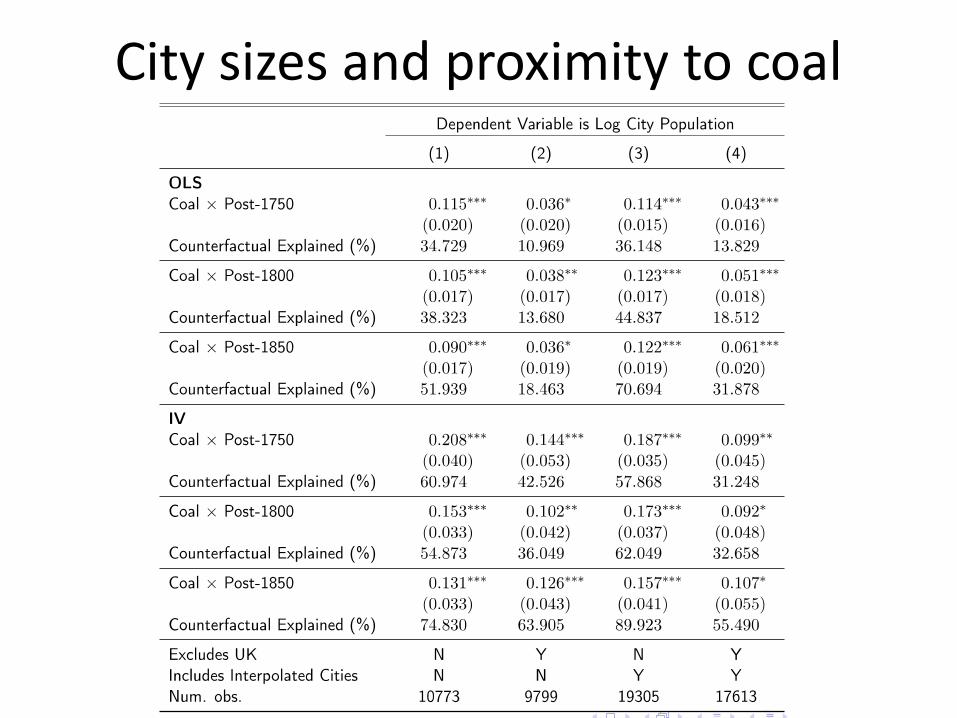
City sizes and proximity to coal
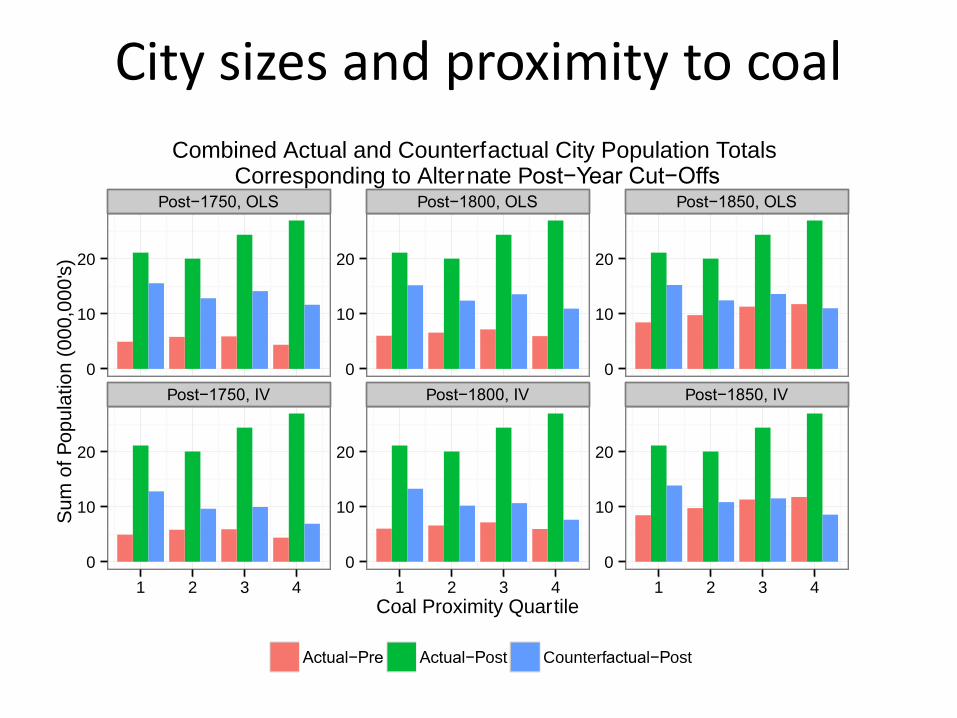
City sizes and proximity to coal
Post−1750, OLS Post−1800, OLS Post−1850, OLS
Post−1750, IV Post−1800, IV Post−1850, IV
0
10
20
0
10
20
0
10
20
0
10
20
0
10
20
0
10
20
1 2 3 4 1 2 3 4 1 2 3 4
Coal Proximity Quartile
Su
m o
f P
opu
latio
n (
00
0,0
00
's)
Actual−Pre Actual−Post Counterfactual−Post
Combined Actual and Counterfactual City Population Totals Corresponding to Alternate Post−Year Cut−Offs
3. The spread of modern industry: escaping coalfields, protecting markets

Escaping coalfields(Percentage price gap, Japanese import prices vs UK export prices)
-100
0
100
200
300
400
500
600
700
1860 1870 1880 1890 1900 1910 1920
Pe
rce
nt
Year

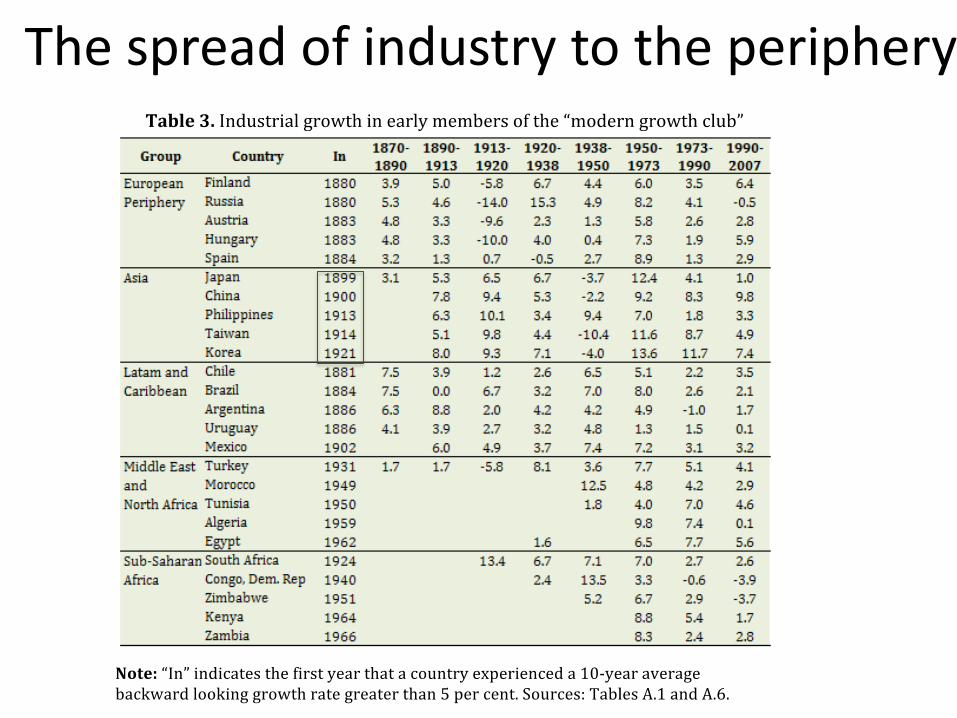
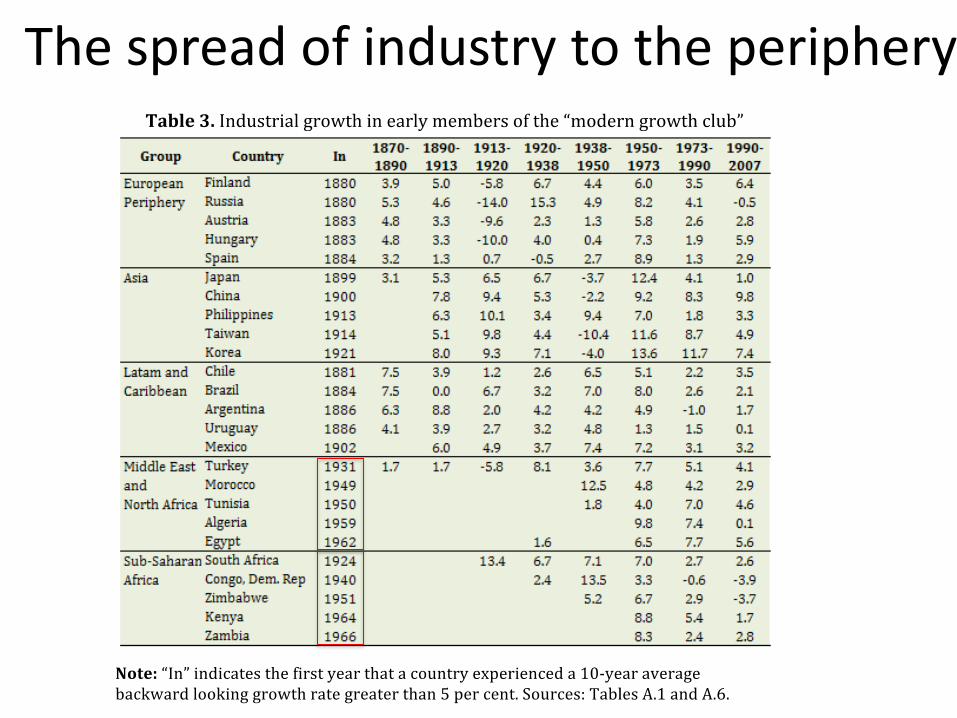
The spread of industry to the periphery
The spread of industry to the periphery
The spread of industry to the periphery

The spread of industry to the periphery
The spread of industry to the periphery
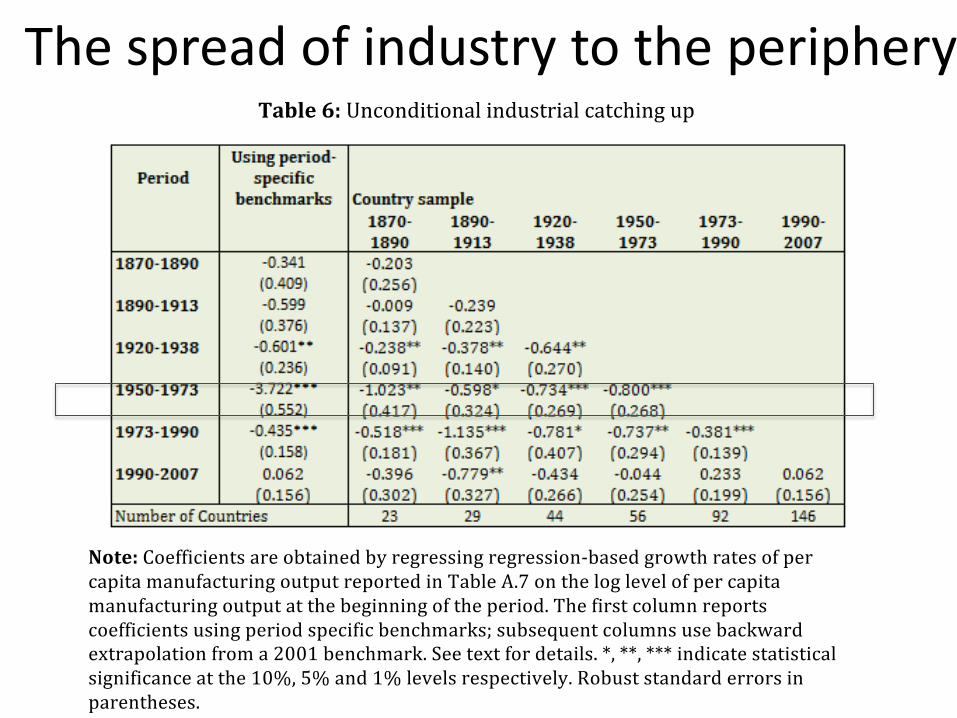
Trade policy and the spread of industry: suggestive timing
• ISI period is the one in which there was the most systematic tendency for less industrialised countries to see more rapid industrial growth
• Latin America was protecting industry by the late 19th century
• So was the European periphery• 1914-1950: war, Depression, protectionism:
offered some dynamic benefits to periphery• Post-1950: decolonisation, import substitution• Late 19th century Japan, China, India an obvious
exception
Trade policy and the spread of industry: suggestive timing
• ISI period is the one in which there was the most systematic tendency for less industrialised countries to see more rapid industrial growth
• Latin America was protecting industry by the late 19th century
• So was the European periphery• 1914-1950: war, Depression, protectionism:
offered some dynamic benefits to periphery• Post-1950: decolonisation, import substitution• Late 19th century Japan, China, India an obvious
exception• What about Italy?

Italy was a part of this process
( 37(
Table!A.6!Countries(entering(and(exiting(the(5%(growth(club!
!
! !
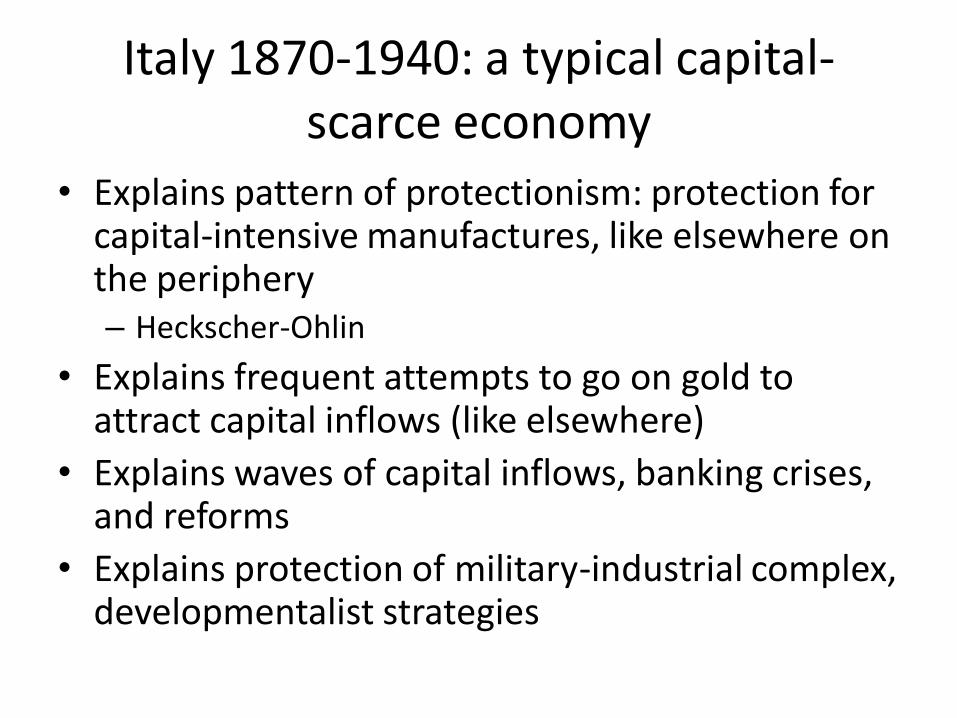
Italy 1870-1940: a typical capital-scarce economy
• Explains pattern of protectionism: protection for capital-intensive manufactures, like elsewhere on the periphery– Heckscher-Ohlin
• Explains frequent attempts to go on gold to attract capital inflows (like elsewhere)
• Explains waves of capital inflows, banking crises, and reforms
• Explains protection of military-industrial complex, developmentalist strategies

Trade policy 1861-1929
• Like elsewhere in Europe, Italy in 1861 adopts a liberal trade policy
• Shift to protection from 1878 not unusual; by 1887 K-scarce heavy industry a major beneficiary
• Levels of protection not extraordinary in a European context
• Terni (but Italy not the only country to chose location for such industries on strategic grounds)
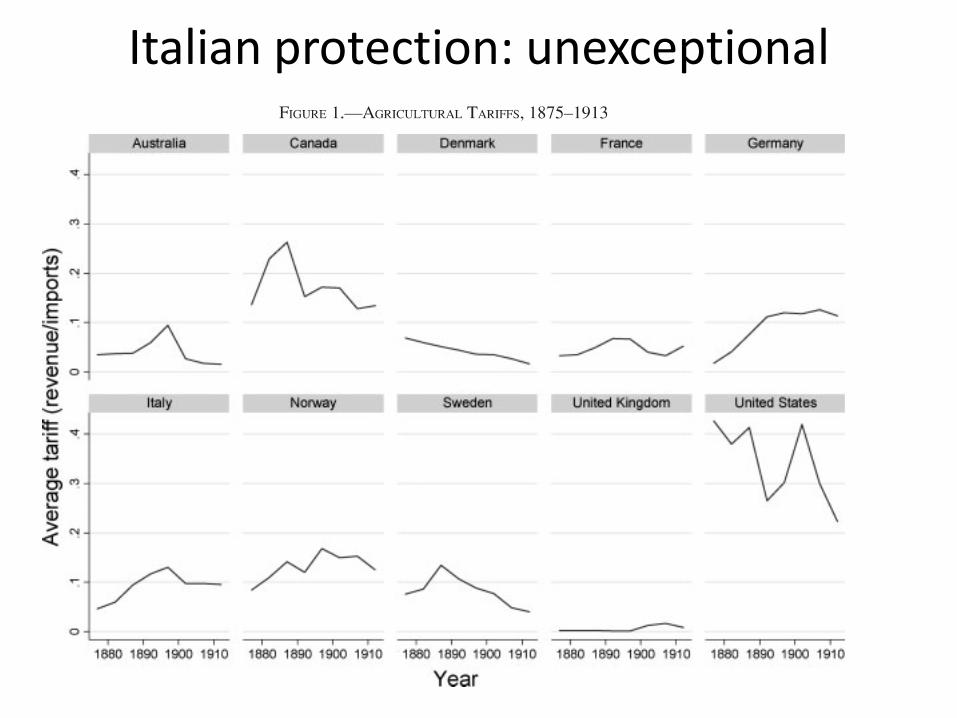
Italian protection: unexceptional
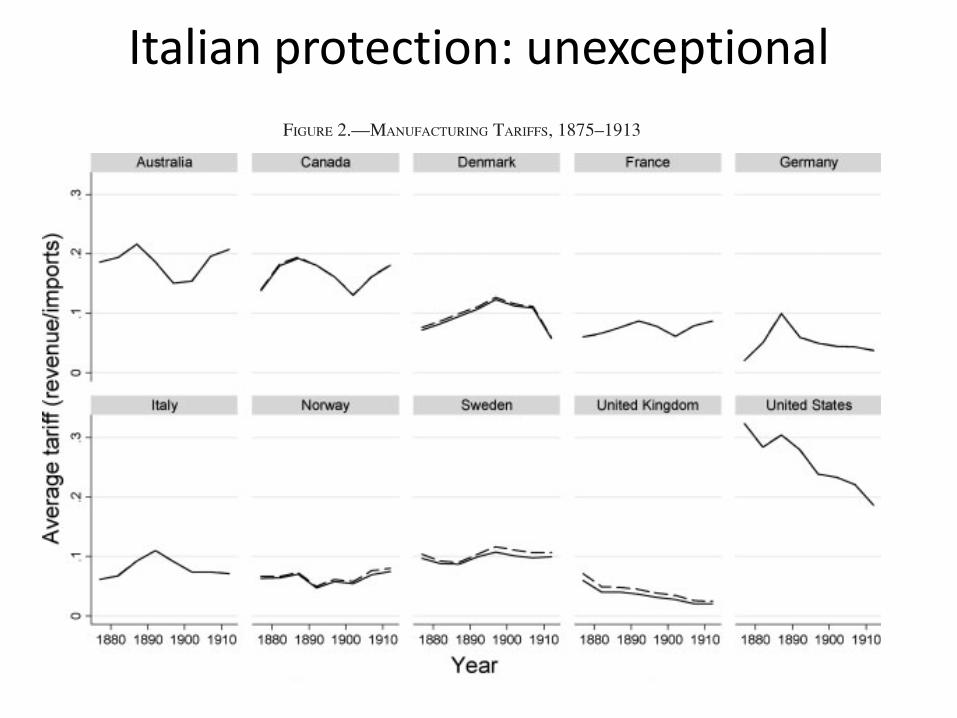
Italian protection: unexceptional
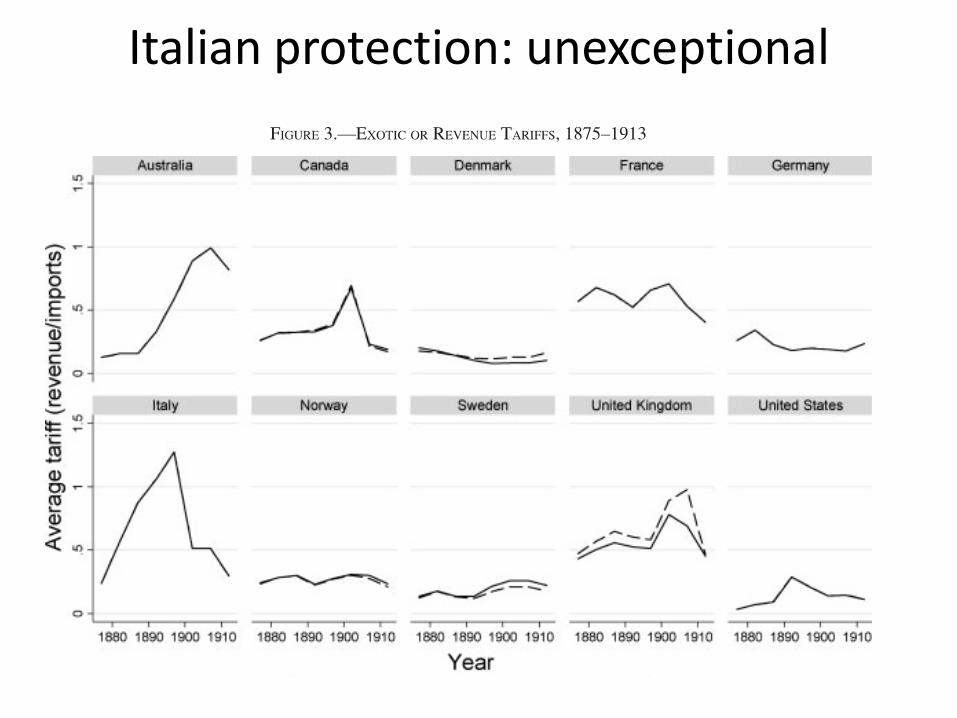
Italian protection: unexceptional
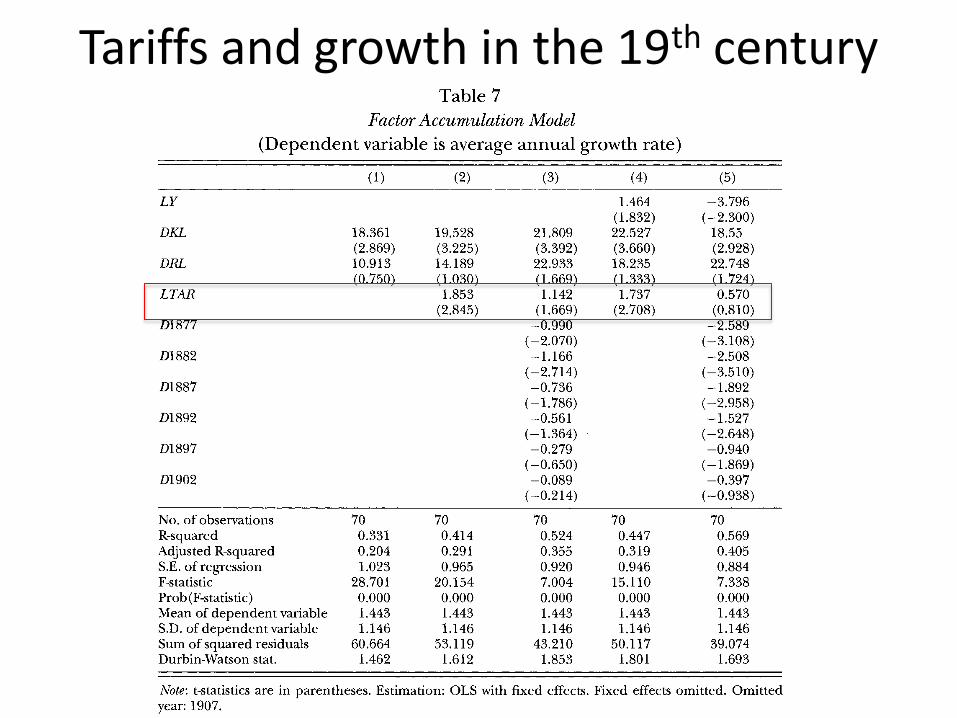
Tariffs and growth in the 19th century
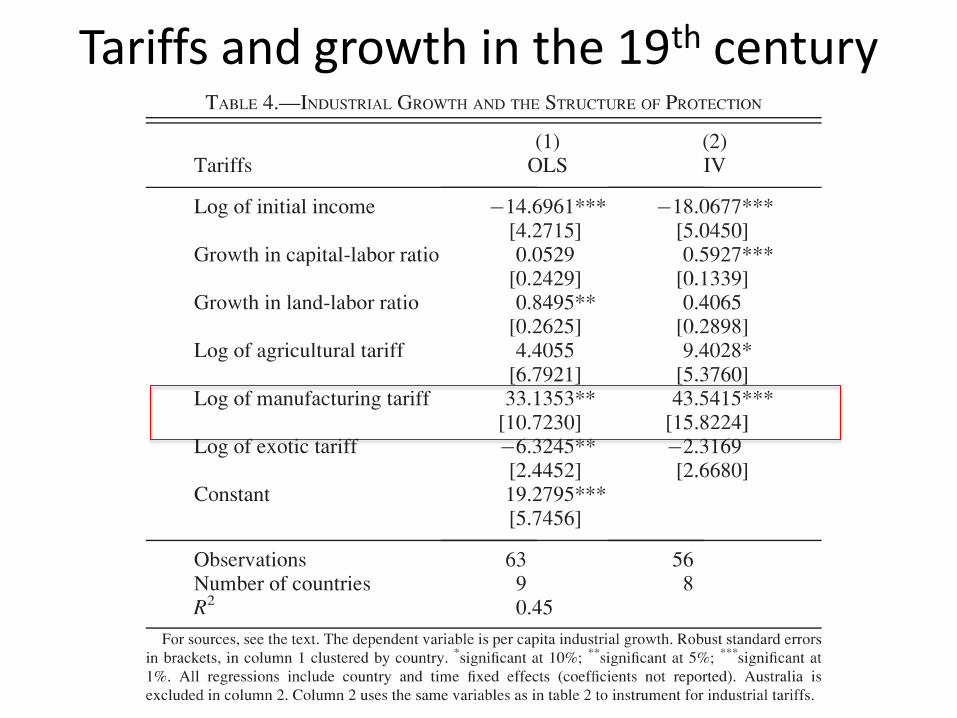
Tariffs and growth in the 19th century
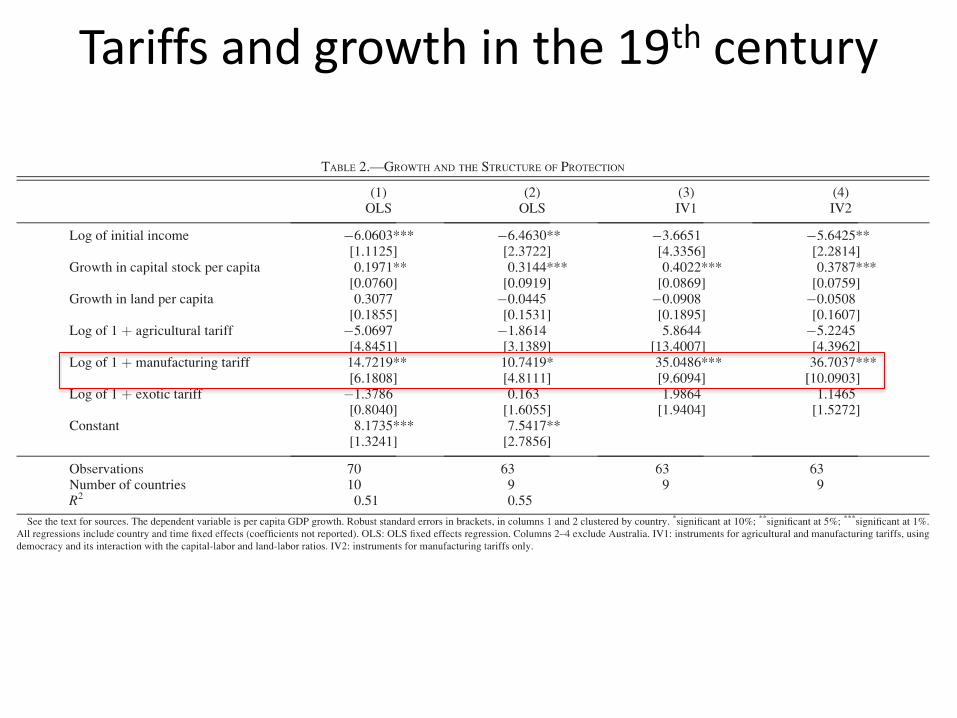
Tariffs and growth in the 19th century

Correlation and causation
Source: Rodrik (1995)
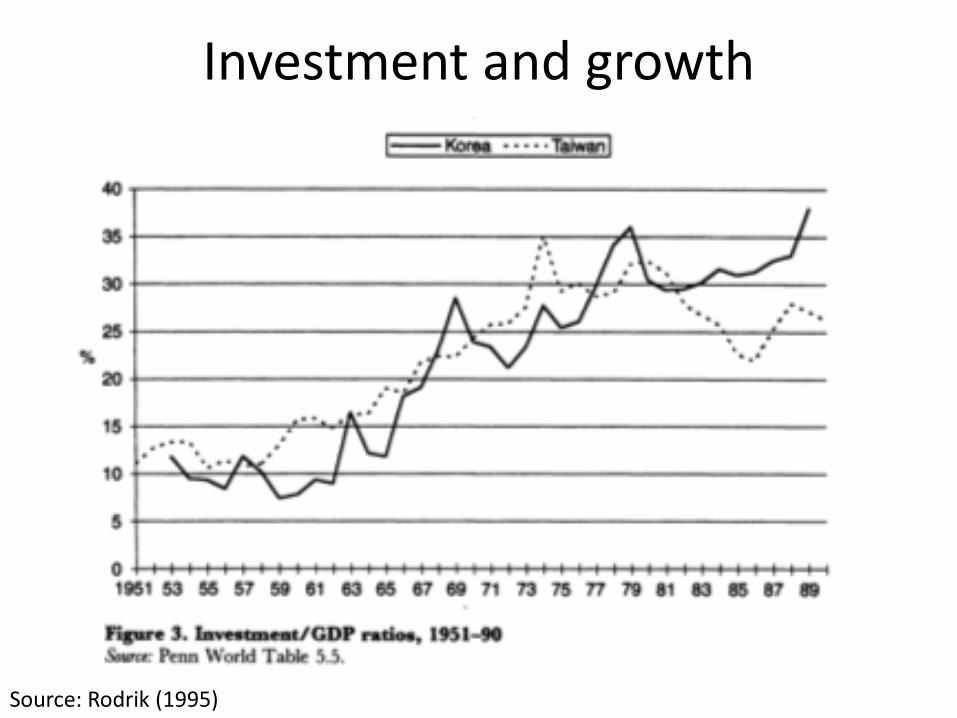
Investment and growth
Source: Rodrik (1995)

Trade essential, but investment the key
Source: Rodrik (1995)
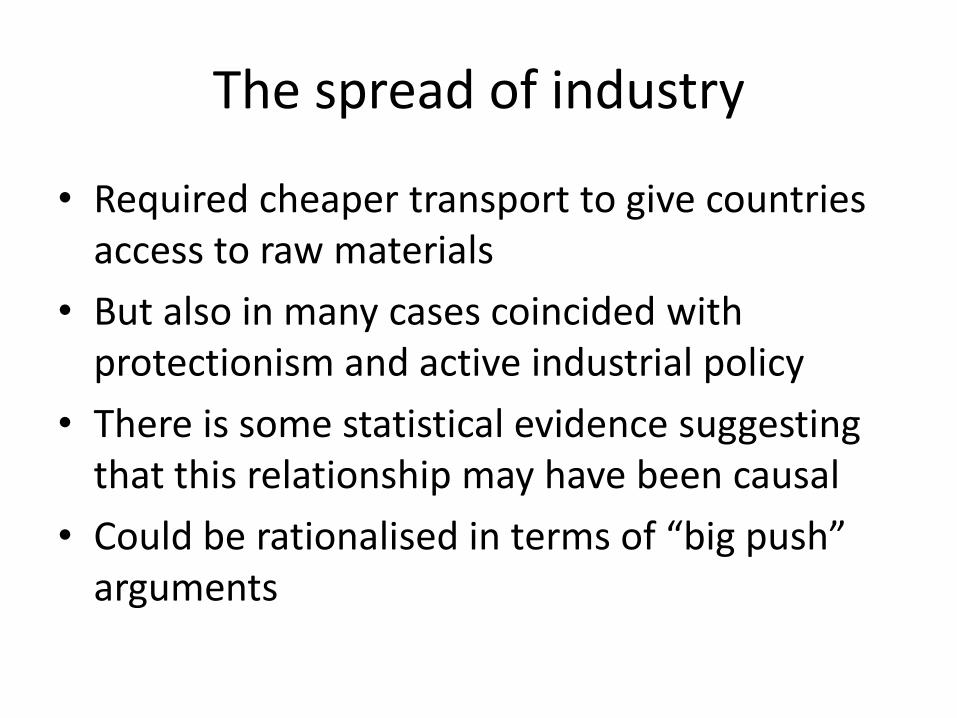
The spread of industry
• Required cheaper transport to give countries access to raw materials
• But also in many cases coincided with protectionism and active industrial policy
• There is some statistical evidence suggesting that this relationship may have been causal
• Could be rationalised in terms of “big push” arguments
4. The second unbundling: gambling on globalization

All changed, changed utterly: the iPhone
Country Components Manufacturers Costs
Chinese Taipei Touch screen, camera Largan Precision, Wintek 20.75$
GermanyBaseband, power
management, transceiverDialog, Infineon 16.08$
KoreaApplications processor,
display, DRAM memory LG, Samsung 80.05$
United States
Audio codec, connectivity,
GPS, memory, touchscreen
controller
Broadcom, Cirrus Logic,
Intel, Skyworks, Texas
Instruments, TriQuint
22.88$
Other Other Misc. 47.75$
Total 187.51$
Source: OECD/WTO (2012)
0% 10% 20% 30% 40% 50% 60% 70% 80%
Luxembourg
Slovak Republic
Czech Republic
Korea
Ireland
Belgium
Netherlands
Hungary
Austria
Finland
Sweden
Iceland
Estonia
Norway
Slovenia
Switzerland
Portugal
Denmark
Israel
Germany
Poland
Chile
France
Japan
Greece
United Kingdom
Mexico
Spain
Italy
Australia
United States
Turkey
Canada
New Zealand
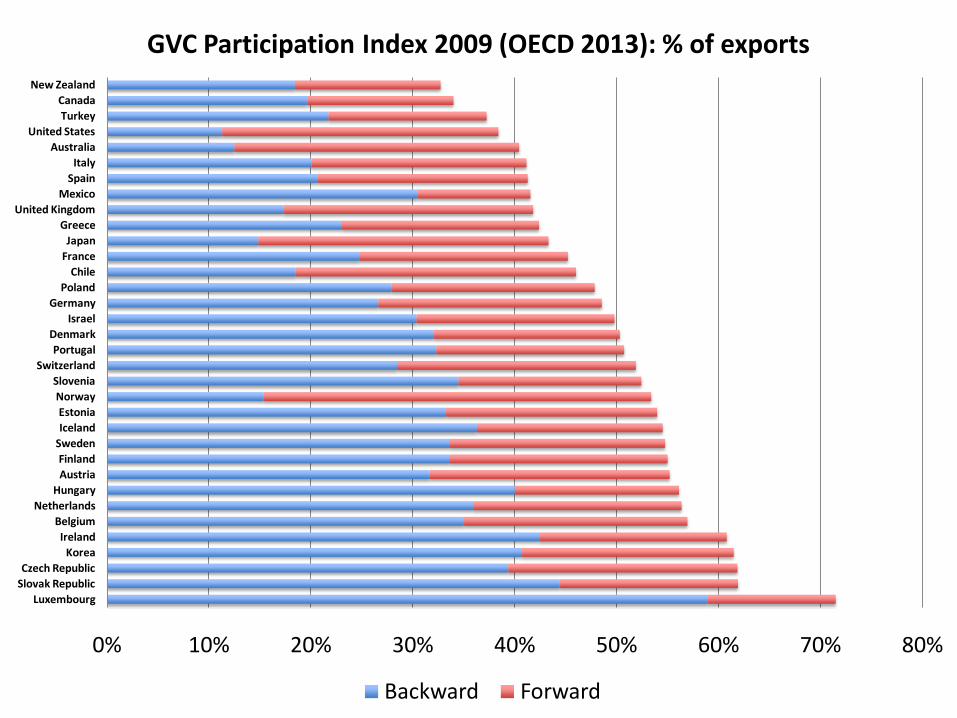
GVC Participation Index 2009 (OECD 2013): % of exports
Backward Forward

0% 10% 20% 30% 40% 50% 60% 70% 80%
Singapore
Chinese Taipei
Philippines
Malaysia
Hong Kong, China
Thailand
Viet Nam
Lithuania
Russian Federation
Latvia
Bulgaria
Romania
Indonesia
India
Cambodia
China
Brazil
Argentina
South Africa
GVC Participation Index 2009 (OECD 2013): % of exports
Backward Forward

Source: OECD/WTO/UNCTAD 2013
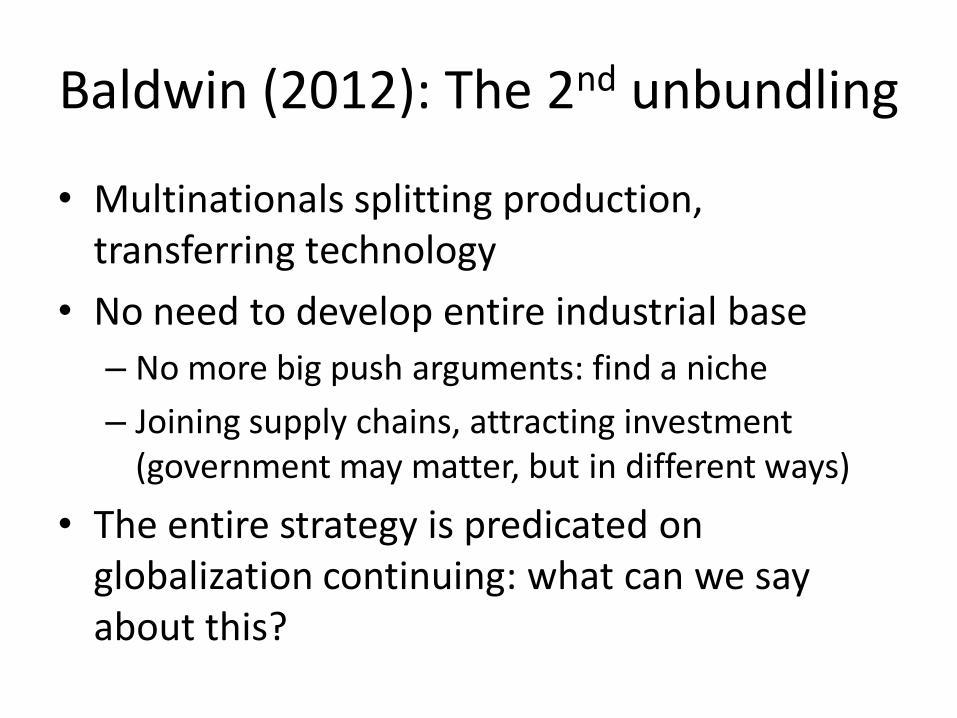
Baldwin (2012): The 2nd unbundling
• Multinationals splitting production, transferring technology
• No need to develop entire industrial base
– No more big push arguments: find a niche
– Joining supply chains, attracting investment (government may matter, but in different ways)
• The entire strategy is predicated on globalization continuing: what can we say about this?

5. The future of globalization
The future of globalization
• Globalization is neither new nor irreversible
• Shifts, shocks and shock absorbers
– Financial shocks: the Great Depression
– Comparative advantage shifts: rail, steamships and frontiers
– Geopolitical shifts: Germany and Japan
• Ways in which today is different, and lessons for the future
Financial shocks: the Great Depression
• Was not caused by Smoot-Hawley: rather the Depression led to protectionism
• Adherence to gold standard: contractionaryimpulses generalised
• Lack of shock absorbers: can’t lower interest rates and government deficits also seen as risky

Share of imports subject to quantitative restrictions on trade
Source: Eichengreen and Irwin (2010).

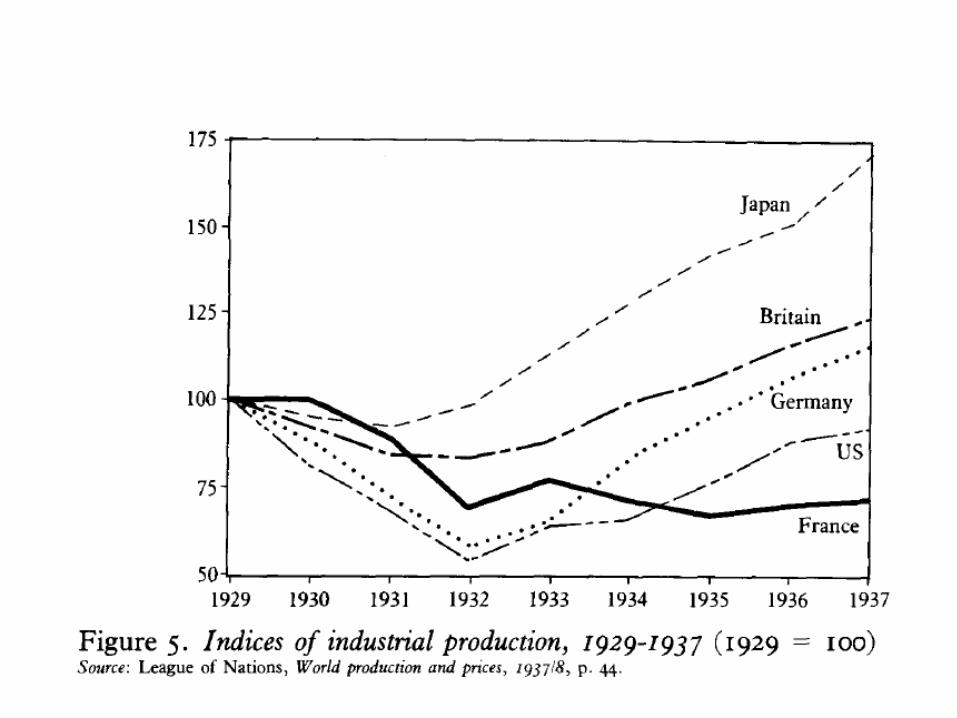
World industrial output during two global crises
Source: Eichengreen and O’Rourke (2009), updated September 2012
60
70
80
90
100
110
120
130
25 50 75 100
June 1929=100 April 2008=100
Months since peak
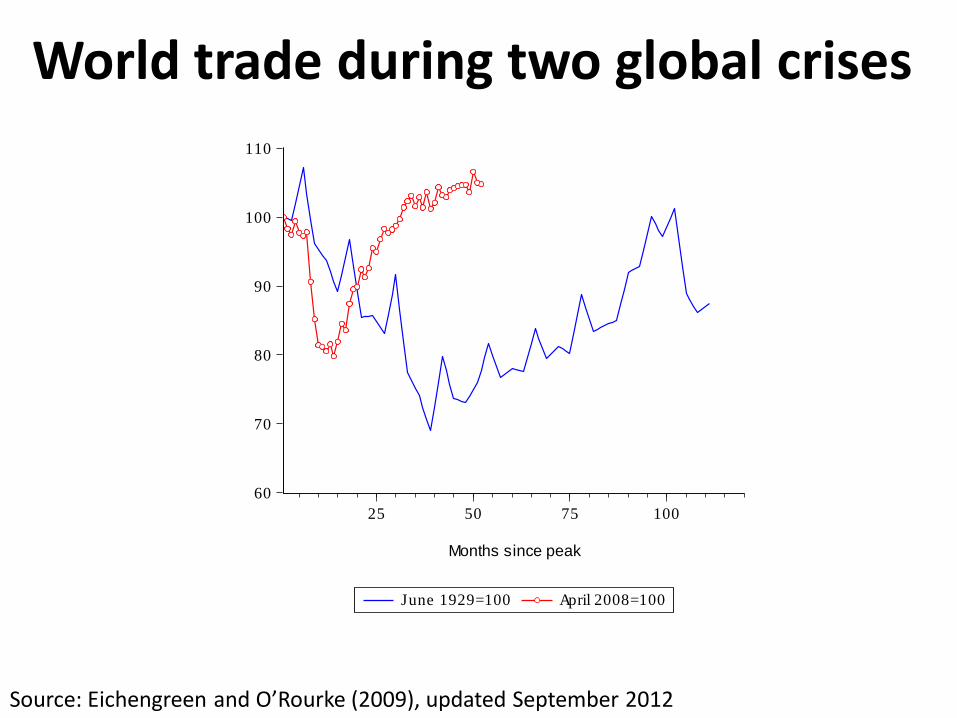
World trade during two global crises
Source: Eichengreen and O’Rourke (2009), updated September 2012
60
70
80
90
100
110
25 50 75 100
June 1929=100 April 2008=100
Months since peak
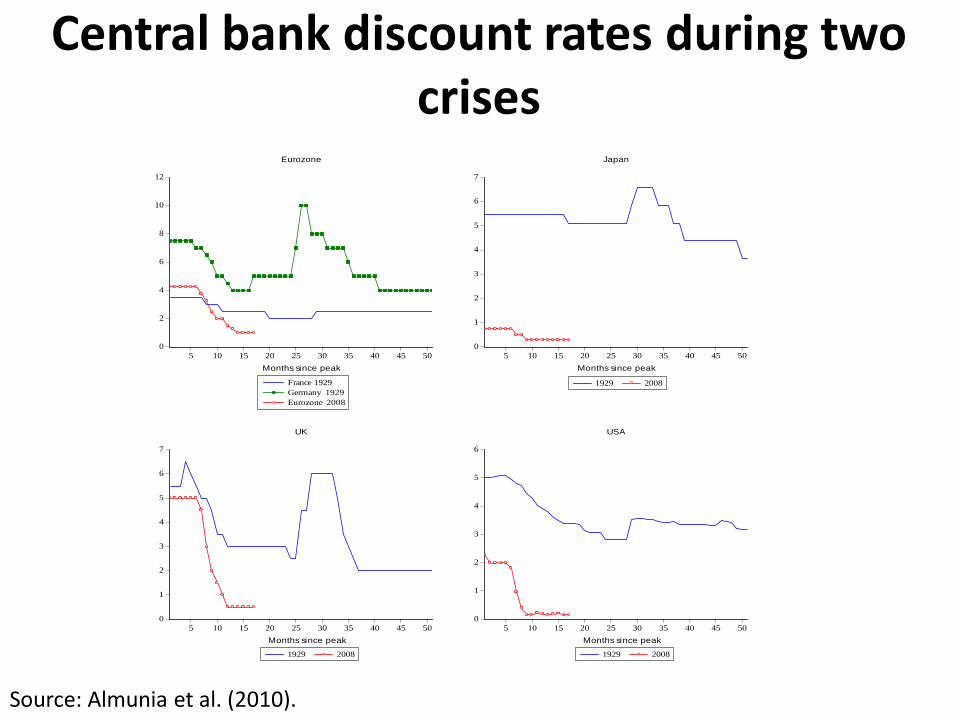
Central bank discount rates during two crises
0
2
4
6
8
10
12
5 10 15 20 25 30 35 40 45 50
France 1929
Germany 1929
Eurozone 2008
Eurozone
Months since peak
0
1
2
3
4
5
6
7
5 10 15 20 25 30 35 40 45 50
1929 2008
Japan
Months since peak
0
1
2
3
4
5
6
7
5 10 15 20 25 30 35 40 45 50
1929 2008
UK
Months since peak
0
1
2
3
4
5
6
5 10 15 20 25 30 35 40 45 50
1929 2008
USA
Months since peak
Source: Almunia et al. (2010).
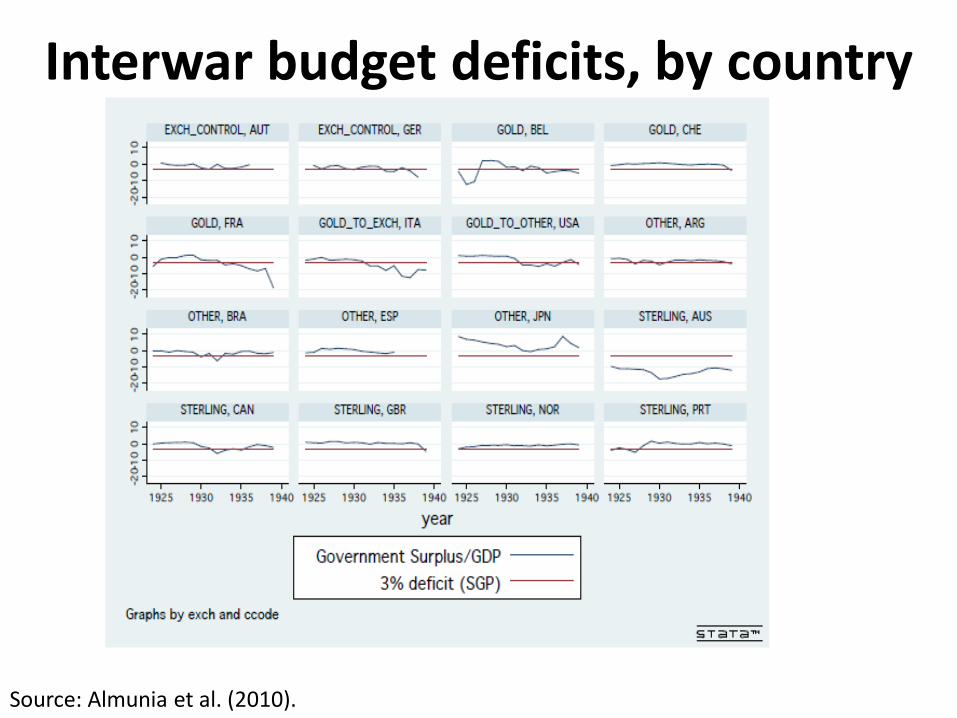
Interwar budget deficits, by country
Source: Almunia et al. (2010).

19th century transport revolutions: how globalization can undermine itself
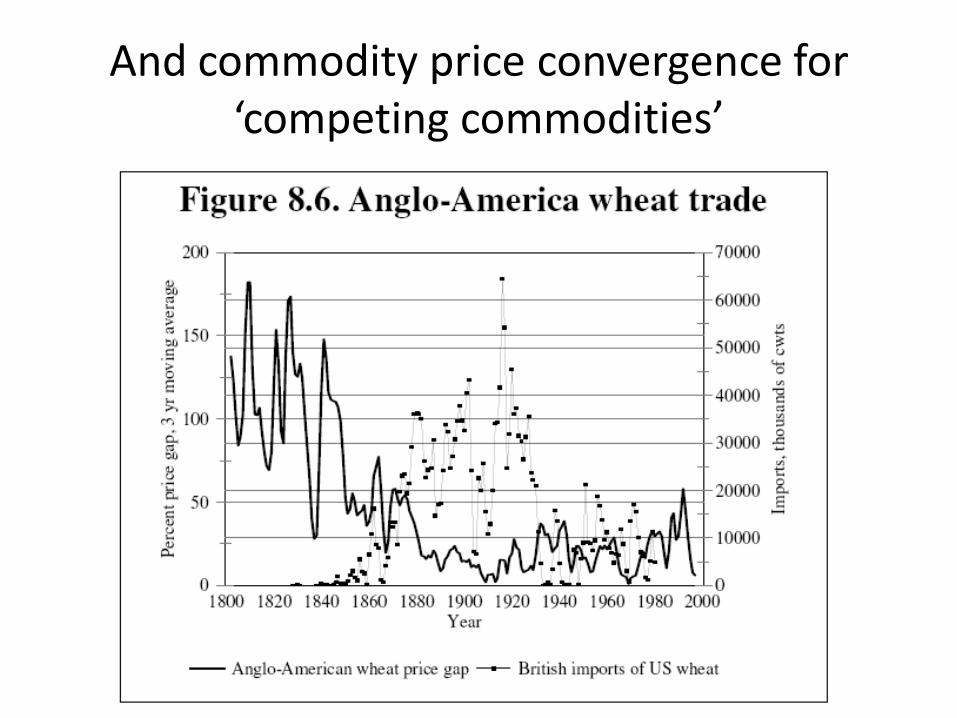
And commodity price convergence for ‘competing commodities’
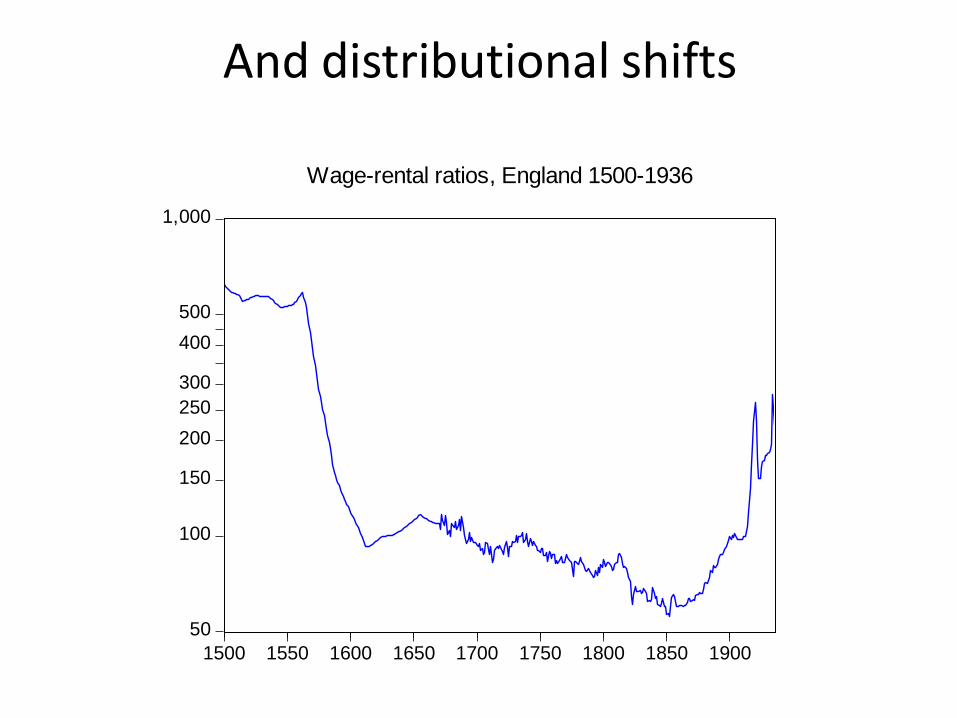
And distributional shifts
1,000
500
400
300
250
200
150
100
50
1500 1550 1600 1650 1700 1750 1800 1850 1900
Wage-rental ratios, England 1500-1936
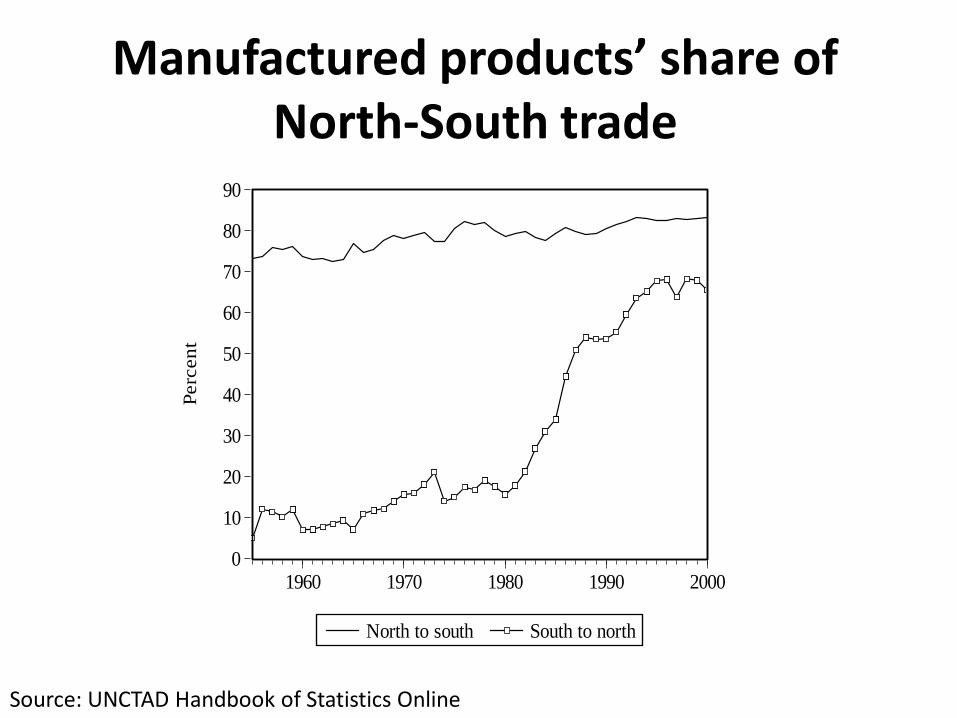
Manufactured products’ share of North-South trade
0
10
20
30
40
50
60
70
80
90
1960 1970 1980 1990 2000
North to south South to north
Perc
en
t
Source: UNCTAD Handbook of Statistics Online

The high-skilled are pro-free trade in rich countries, not in poor countries
Source: O’Rourke and Sinnott (2001)
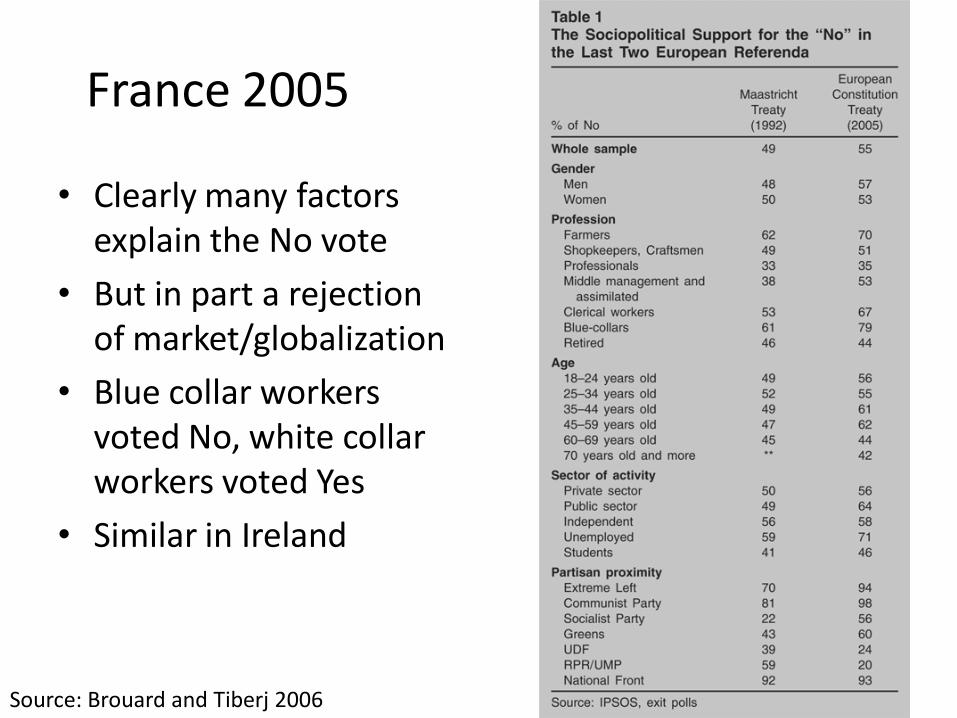
France 2005
• Clearly many factors explain the No vote
• But in part a rejection of market/globalization
• Blue collar workers voted No, white collar workers voted Yes
• Similar in Ireland
Source: Brouard and Tiberj 2006

Atlantic Charter, August 1941
Fifth, they desire to bring about the fullest collaboration between all nations in the economic field with the object of securing, for all, improved labor standards, economic advancement and social security

Libanius, 4th century
God did not bestow all products upon all parts of the earth, but distributed His gifts over different regions, to the end that men might cultivate a social relationship because one would have need of the help of another. And so he called commerce into being, that all men might be able to have common enjoyment of the fruits of the earth, no matter where produced
1914 is a problem for this thesis
“The economies of both Britain and Germany came to depend on hundreds of merchant ships that entered their ports every month. Overseas resources, the security of the sea lanes and the economics of blockade affected the war plans of the great powers and influenced their decision to embark on war.” (Offer 1989)
Lessons drawn from WWI
• Hitler on trade vs imperial autarky
• Barnhart (1987) on Japan
• Search for self-sufficiency can feed on itself: oil, rubber, natural resources
• Crucial shock absorber: guarantee that no matter what, you can buy what you need at going rate on world markets
• Multiple equilibria

Atlantic Charter, August 1941
Fourth, they will endeavor, with due respect for their existing obligations, to further the enjoyment by all States, great or small, victor or vanquished, of access, on equal terms, to the trade and to the raw materials of the world which are needed for their economic prosperity;

The Malacca dilemma
“It is no exaggeration to say that whoever controls the Strait of Malacca will also have a stranglehold on the energy route of China” (China Youth Daily, June 15, 2004)
“the Lord of Melaka has his hand on the throat of Venice” (Tome Pires, early 16th century)

Straws in the wind
• Rare earths
• Grain and petroleum export bans
• Madagascar 2008: “We want to plant corn there (Madagascar) to ensure our food security. Food can be a weapon in this world,” said Hong Jong-wan, a manager at Daewoo. “We can either export the harvests to other countries or ship them back to Korea in case of a food crisis.”

Lessons
• Countries’ industrial development strategies now intimately linked to globalization. This is new.
• Political economy of trade very different now than in 1914 or 1929
– MNCs
– WTO
• The system was remarkably resilient after 2008
However
• Openness could still come under threat from– Future macroeconomic and financial shocks (or a
continuation of our present crisis)– Distributional shifts– Geopolitical shifts
• The system still needs macroeconomic, distributional and strategic shock absorbers: too much rigidity can be dangerous.
• The state and the market are complements: cutting back too much on the latter may place the former at risk
• The biggest loser from such a development would be the developing world


