Eleventh Meeting of National Eleventh Meeting of National Food Security Mission Executive Food Security Mission Executive Committee Committee Government of West Bengal Department of Agriculture 15 th January, 2013 AJC Bose Hall, Krishi Bhavan, New Delhi
Transcript
Eleventh Meeting of National Eleventh Meeting of National Food Security Mission Executive Food Security Mission Executive Committee Committee
Government of West Bengal
Department of Agriculture
15th January, 2013AJC Bose Hall,Krishi Bhavan, New Delhi
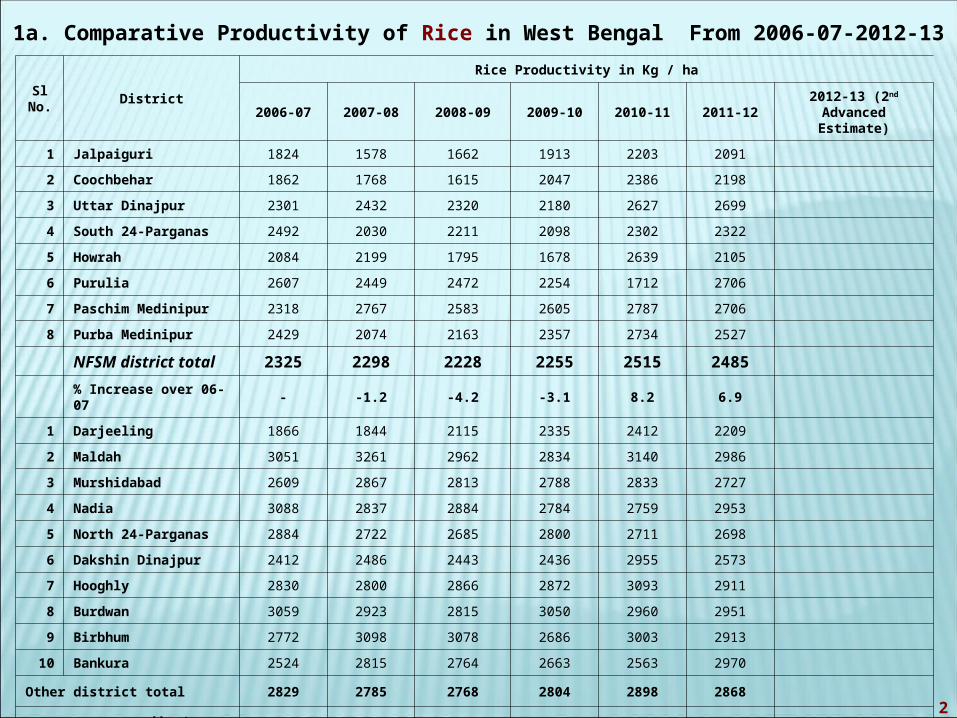
1a. Comparative Productivity of Rice in West Bengal From 2006-07-2012-13
2. Crop wise Production Estimates of Kharif and Rabi in West Bengal during 2012-13
Sl. No.
Crop Production (in ‘000 tonnes)
Kharif ( As per Partial report of Crop
Cutting & States own Assessment)
Rabi ( As per States
own Assessment)
Total
1 Rice 10400 4400 14800
2 Wheat - 900 900
3 Total Pulses
32.4 167.75 200.15
4 Total Food Grain
10545.88 5792.1 16337.978
5
3. Financial Statement 2012-13 (Rs. In lakh)
Component
Approved Plan
Unspent Balance of 2011-12* (Provision
al)
Fund Release from GOI
Total Fund
Available during
2012-13
ExpenditureUp to
31.12.2012
Anticipated
Expenditure
during2012-13
Further Requirement of Fund
during 2012-13
NFSM - Rice
3662.85
651.72 1757.75
2409.47
1819.07841
2806.25
396.78
NFSM – Wheat
831.84 396.41 68.75 465.16 530.36128
759.84 294.68
NFSM – Pulses
897.49 336.51 - 336.51 369.3049 872.20 535.69
A3P (Urd + Lentil)
540.00 127.28 - 127.28 190.9426 466.84 339.56
Total 5932.18
1511.92 1826.50
3338.42
2729.68719
4905.13
1566.71* Audit is going on and Audited UC will be submitted shortly
6
4. A. Physical and Financial Progress under NFSM during 2012-13MONTHLY PROGRESS REPORT FOR IMPLEMENTATION OF NATIONAL FOOD SECURITY MISSION – RICE DURING 2012-13 TILL 31st Dec., 2012.
Sl. No.
InterventionsApproved Rate of
AssistanceUnit
Targets approved by GOI
Achievement Report upto31.12.12
Achievement % Justifica
tion for Shortfa
ll
Anticipated Expenditure for
12-13Phy Fin Phy Fin Phy Fin
1 2 3 4 5 6 7 8 9 10 Phy Fin
1
Cluster Demonstrations (100 Ha each)
(a) Direct Seeded Rice/Line Transplanting/SRI
Rs 7500/-per Ha Ha 13500 1012.500 6600416.2624
648.9 41.1
Non Availabil
ity of seed s in
time
7000 525.00
(b) Cluster Demonstrations on Hybrid Rice (One cluster of 100 ha)
Rs 7500/-per Ha Ha 8000 600.00 5100 337.705 63.7 56.2 5100 382.50
(c) Cluster Demonstrations on Swarna Sub-1/ Sahbhagi Dhan of 100 Ha each.
Rs 7500/-per Ha Ha by GOI
(d) Frontline Demonstrations by ICAR/SAUs on Hybrids/ Varieties (Cluster of Minimum 10 ha each)
7(a) Project Management Team & Other Miscellaneous Expenses at District level
Rs 6.36 lakh per District
No. of District
8 50.880 8 28.50 - 56.0 -do- 8 50.880
(b) Proect Management Team & Other Miscellaneous Expenses at State level
Rs 13.87 lakh per State
1 13.870 1 6.16545 - 44.4 -do- 1 13.870
8Local Initiative(Check Dam)
No. of district
8 104.00 8.00 7.7 -do- 8 104.00
Total Financial (1 to 8) 3662.851819.078
4149.7 2806.25
(Rs. in Lakh)
8
4. B. Physical and Financial Progress under NFSM during 2012-13
MONTHLY PROGRESS REPORT FOR IMPLEMENTATION OF NATIONAL FOOD SECURITY MISSION – WHEAT DURING 2012-13 TILL 31st Dec., 2012.
(Rs. in Lakh)
Contd…….
Sl. No.
InterventionsApproved
Rate of Assistance
Unit
Final Targets approved by
GOI
Achievement up to 31.12..2012
Achievement %
Justification for
shortfall
AnticipatedExpenditure during 12-
13
Phy Fin Phy Fin Phy Fin
Phy Fin
1 2 3 4 5 6 7 8 9 10
1
Cluster Demonstrations (100 Ha each) on Conservation Agriculture by State Department of Agriculture with Technical backstopping of ICAR/SAUs (Direct seeded rice –wheat system) Approved norms for Rice and Wheat = Rs. 7500/- and Rs 5000/- (hence for sytem Rs. 12,500/- per ha)
Rs 12500/-per ha
Ha 550 68.75 550 56.25 100 79.99On
progress550
68.75
2
Demonstrations of Drainage Management in Waterlogged Areas for Rice-Wheat System (Project based smallest unit to be kept 100 Ha)
Rs 12500/-per ha
Ha by GOI
3Demonstrations on Frontline Technologies-Varieties/ RCTs in Wheat
Rs. 5000/-per Ha
Ha by GOI
4Distribution of Certified Seeds of Improved Varieties
Rs 500/-per Qtl
Qtls1700
085.000 2719 19.035 15.99 22.4
Non availabilit
y of seeds
260013.0
0
5
Need Based Plant/Soil Management:
(a) Micronutrients Rs 500/-per ha Ha4000
0200.00 41271
199.99628
100.0 100.0On
progress40000
200.00
(b) Gypsum Rs 500/-per ha Ha
(c) Plant Protection Chemicals & bio-agents Rs 500/-per ha Ha3500
0175.00 37550 175.00 100.0 100.0 -do- 35000
175.00
9
MONTHLY PROGRESS REPORT FOR IMPLEMENTATION OF NATIONAL FOOD SECURITY MISSION – WHEAT DURING 2012-13 TILL 31st Dec., 2012. (Rs. in Lakh)
Nos 2500 250.00 273 27.3 10.9 10.9 -do- 2500 250.00
d) Pipe for Carrying water from source to the field
Rs. 15000/- per Farmer
Nos 150 22.50 50 7.50 33.3 33.3 -do- 150 22.50
7
Cropping System based trainings (Four Sessions .ie one before Kharif, One each during kharif and rabi crops an one after Rabi harvest)
Rs 3500/-SessionRs 14000/-Training
Nos 64 8.96 38 5.32 59.4 59.4 -do- 64 8.96
8
Miscellaneous Expenses
(a) PMT & Other Miscellaneous Expenses at District level
Rs 4.47 lakh per District
No. of
District
5 22.35 9.48613 42.4 22.35
(b) PMT & Other Miscellaneous Expenses at State level
Rs 6.28 lakh per State
No 1 6.28 3.00 47.8 6.28
c) Misscellaneous Expenses to State for Other Districts
Rs. 1.00 lakh per District
No. of
District
13 13.00 7.01 53.9 -do- 13.00
9 Local Initiatives 150.003
0.0020.0 -do- 150.00
TOTAL FINANCIAL (1 to 9) 897.49 369.3049 41.13 872.20
12
4. D. Progress Report of A3P under NFSM – Pulse in West Bengal during 2012-13 up to 31st Dec., 2012
Sl. No.
Crop
No. of A3Punit
(100 ha )
sanctioned
Target Achievement
Phy( Area in ha )
Financial (Rs. in lakh)
Phy( Area
in ha )
Financial (Rs. in lakh)
Cost of Block
Demonstration
Cost ofe-pest
surveillance
Total
Cost of Block
Demonstration
Cost ofe-pest
surveillance
Total
1.Black gram
20 200093.00(@ Rs.
4650/ha)
3.00(@ Rs. 150/ha)
96.00(@ Rs.
4800/ha)700 22.841 - 22.841
2. Lentil 60 6000
289.80(@ Rs.
4830/ha)
10.20(@ Rs. 170/ha)
300.00(@ Rs.
5000/ha)6000 168.1016 - 168.1016
3.Summer
Moong* 30 3000
139.50(@ Rs.
4650/ha)
4.50(@ Rs. 150/ha)
144.00(@ Rs.
4800/ha)- - - -
TOTAL 110 11000 522.30 17.70 540.00 6700 190.9426 - 190.9426
* Season yet to come
13
5. Major Focus given by the State on different Inputs under NFSM
Supply of Quality Seeds and other inputs
Application of micronutrients based on Soil Nutrient Map and
Soil Test Report.
Timely supply of inputs.
Well ahead Selection of site and beneficiary.
Demonstrations organized to motivate the farming community
with modern Resource conservation technologies / Tools /
Efficient and judicious water application tools.
Organization of FFS for dissemination of improved
technologies and to select progressive contact farmer.
14
6. Progress of A3P during Kharif and Rabi 2012-13
15
SeasonNo of units (@ 100 ha) allocated
No of units implemented
by state
Expenditure Incurred
(Rs. in Lakhs)
Kharif (Black Gram)
20 7 22.841
Rabi (Lentil) 60 60 168.1016
Rabi-Summer (Moong)
30Season yet to
come (February)
-
Total 110 67 190.9426
7. Status of Implementation of pest Surveillance in A3P units of 2011-12 and 2012-13
Status of Implementation during 2011-12
Sl. No.
Crop No. of A3P unit Sanctioned
Physical (Area in ha) Achievement under e-pest surveillance
Target Achievement Physical Financial (Rs. in lakh)
1 Black Gram 3 (Maldah, Nadia, Purulia)
3000 1000 1000 1.784
2 Lentil 2 (Nadia, Murshidabad)
2000 2000 1000 0.992
Total 5 5000 3000 2000 2.776
Status of Implementation during 2012-13
Pest surveillance programme has not been implemented during Kharif,
2012-13 as the separate programme has not been received till date.
8. Implementation of Special Plan to achieve 19+ Million Tones of Pulse Production during Kharif, 2012-13
Allotment on sprinklers was sanctioned under the scheme. But
due to high precipitation in the state, sprinklers are not
popular. As such, no action plan was submitted.
17
9. Physical and Financial Progress under Action Plan for Additional Area coverage of Pulses during Rabi / Summer under NFSM-Pulses during 2012-13
No Allotment was given to the state of West Bengal.
18
10a. Input Planning for Summer Rice under NFSM 2012-13
19
Sl.No.
Intervention Unit
Planned physical target
Supply tie up status
Supplied Supplying Agency
1 Hybrid MT 76.50 63.00Supplying agencies like NSC,
WBSSC, CADC, WBAIC, BENFED & other Private sector
producers & manufacturers have been sensitized for timely
supply of inputs upto Block level. District Agril. Officers
have been authorized to procure the input
2 HYV MT 15695 on going
3Micro
NutrientHa 67048 on going
4 PP Chemical Ha 30895 on going
5Cono-Weeder + Knapsack
Nos. 3590 on going
6 Pump Set Nos. 1780 on going
10b. Input Planning for Summer Pulses under NFSM 2012-13
20
Sl.No.
Components Unit
Planned
physical
target
Supply tie up status
Supplied
Supplying Agency
1 Seed MT 54.00On going
Supplying agencies like NSC, WBSSC, CADC, WBAIC, BENFED & other Private sector producers & manufacturers have been sensitized for timely supply of inputs up to Block level. District Agril. Officers have been authorized to procure the input
2 Micro Nutrient ha 3540On going
3 Rhizobium ha 3280On going
4 IPM ha 2310On going
5 PP Chemical ha 1968On going
6 Knapsack Nos. 1366On going
7 Pump Set Nos. 2277On going
8 PVC Pipe
Units of 800
meter104
On going
11. Status of Online Submission of Progress Report at State / District Level
All the districts submit their report through Online to the State Head Quarter.
21
12. NFSM- PMT status in the state/ districts
22
No. of consultants sanctioned
No. of consultants
engaged
No. of STA/ TA sanctioned
No. of STA / TA engaged Reasons for not
engaging the PMT in full strengthState
levelDistrict
levelState level
District level
State level
District level
State level
District level
5 17 1 8 6 58 2 13
Due to insufficient allotment,
full strength of PMT could
not be engaged
13. Concurrent Evaluation of NFSM
Concurrent Evaluation has been done during 2008-09
Actions already taken for evaluation during 2012-13
23
14. Specific Issues and SuggestionsSl. No
Issues / Suggestions
1 Rate of Assistance for distribution of seeds under subsidy may be increased from Rs. 2000/- per qtl to Rs. 5000/- per qtl in case of Hybrid rice seed. The Assistance rate for distribution of HYV rice seeds may be increased from Rs. 500/- per qtl to Rs. 1000/- per qtl. The Rate of Assistance for distribution of Pulse seeds under subsidy may be increased from Rs.1200/- per qtl to Rs. 5000/- per qtl.
2 Due to low availability of certified pulse seeds, utilization of TL seeds may be permitted.
3 Attempts are being taken up to popularize the Mini Dal Mill for value addition to the produce of the pulse farmers.
4 Amount of assistance for 100 ha cluster DC may be enhanced