43
BD Biosciences February 23, 2011 In Vitro Transporter Testing Alignment with Regulatory Agency Guidelines and ITC Recommendations Elke S. Perloff, Ph.D.

BD Biosciences
February 23, 2011
In Vitro Transporter Testing Alignment with RegulatoryAgency Guidelines and ITC Recommendations
Elke S. Perloff, Ph.D.

Presentation Overview
• Guidance documents and position papers• Transporter expression and function
– Role in drug-drug interactions– In vitro models to study transporter interactions
• Focus on assessment of P-gp and BCRP Interactions – Identification of substrates and inhibitors using the
bidirectional transport assay– Technical considerations (cell lines, positive controls, assay
conditions, parameter calculations, data interpretation)– Decision trees
Guidance Documents and Position Papers

Guidance Documents and Position Papers on Transporter DDI Testing
• Tucker et al. (2001) – Basel conference, sponsored by FDA, EUFEPS, and AAPS
• US FDA (2006) Draft Guidance for Industry• Zhang et al. (2006) Mol Pharmacol 3:62• Huang et al. (2008) J. Clin Pharmacol 48:662• Zhang et al. (2008) Xenobiotica 38:709• International Transporter Consortium White Paper
(2010) Nature Rev Drug Discovery 9:215• EMA (2010) Draft Guideline on the Investigation of Drug
Interactions

FDA Guidance Documents
• Over 400 draft or final guidance documentshttp://www.fda.gov/cder/guidance/index.htm
• Represent the Agency's current thinking • Do not bind the FDA or the public, but provide
pharmaceutical companies with assurance– An alternative approach may be used if it satisfies requirements
of any applicable statutes, or regulations.– If in doubt, contact the originating office (e.g. CDER).

Transporter Expression and Function
Role in drug-drug interactionsIn vitro models to study transporter interactions
Transporters
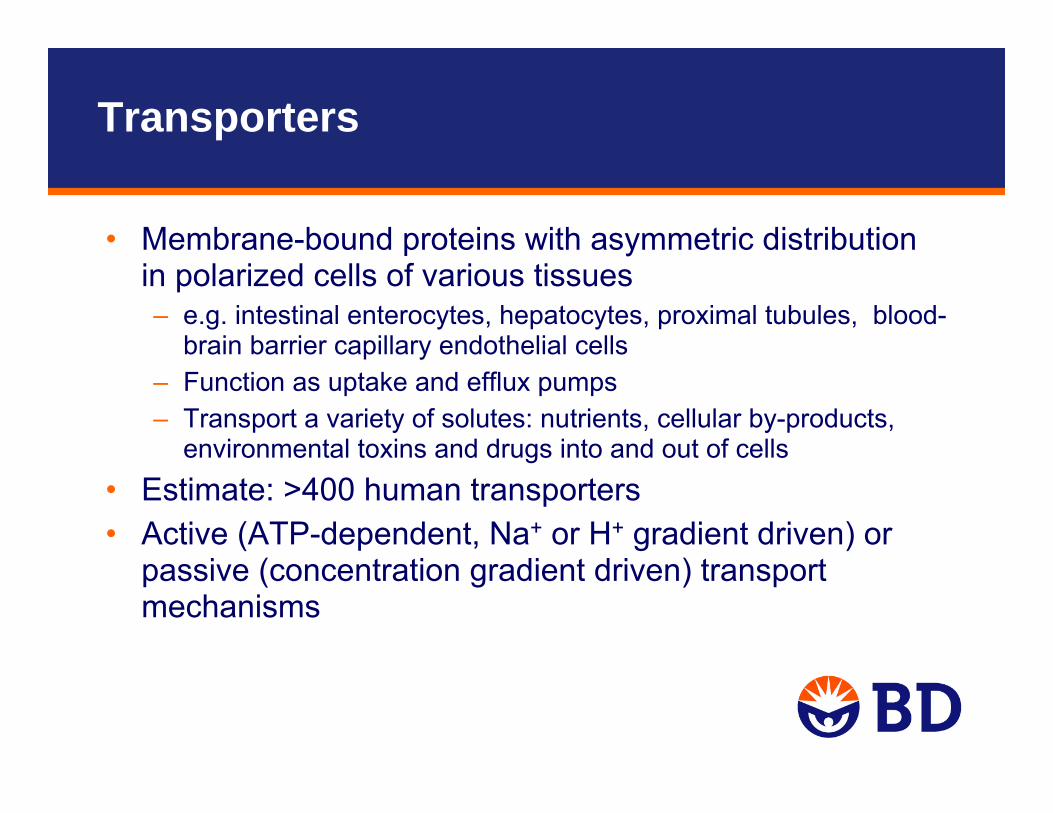
• Membrane-bound proteins with asymmetric distribution in polarized cells of various tissues– e.g. intestinal enterocytes, hepatocytes, proximal tubules, blood-
brain barrier capillary endothelial cells– Function as uptake and efflux pumps – Transport a variety of solutes: nutrients, cellular by-products,
environmental toxins and drugs into and out of cells• Estimate: >400 human transporters• Active (ATP-dependent, Na+ or H+ gradient driven) or
passive (concentration gradient driven) transport mechanisms

Major Human Transporters (ABC)
FDA DRAFT Guidance (2006) and ITC White Paper (2010)
Gene Aliases Tissue Substrate InhibitorABCB1 P-gp,
MDR1intestine, liver, kidney, brain, placenta, adrenal, testes
digoxin, fexofenadine, indinavir, vincristine, colchicine, topotecan, paclitaxel, loperamide, doxorubicin, vinblastine
ritonavir, cyclosporine, verapamil, erythromycin, ketocoanzole, itraconazole, quinidine, elacridar (GF120918), LY335979, valspodar (PSC833)
ABCB4 MDR3 liver digoxin, paclitaxel, vinblastine verapamil, cyclosporineABCB11 BSEP liver pravastatin, taurocholic acid, bile acids cyclosporine, rifampicin, glibenclamideABCC1 MRP1 intestine, liver,
kidney, brainadefovir, indinavir
ABCC2 MRP2, CMOAT
intestine, liver, kidney, brain
methotrexate, glucuronides, valsartan, indinavir, cisplatin,
cyclosporine, delavirdine, efavirenz, emtricitabine
ABCC3 MRP3, CMOAT2
intestine, liver, kidney, placenta, adrenal
etoposide, methotrexate, tenoposide, glucoronides, fexofenadine
delavirdine, efavirenz, emtricitabine
ABCC4 MRP4 liver, brain adeforvir, tenofovir, methotrexate, topotecan, furosemide, cAMP,
celecoxib, diclofenac
ABCC5 MRP5 brainABCC6 MRP6 liver, kidney cisplatin, daunorubicinABCG2 BCRP intestine, liver,
mammary glands, placenta
daunorubicin, doxorubicin, topotecan, rosuvastatin, sulfasalazine, imatinib, methotrexate
elacridar (GF120918), gefitinib, fumitremorgin C, novobiocin
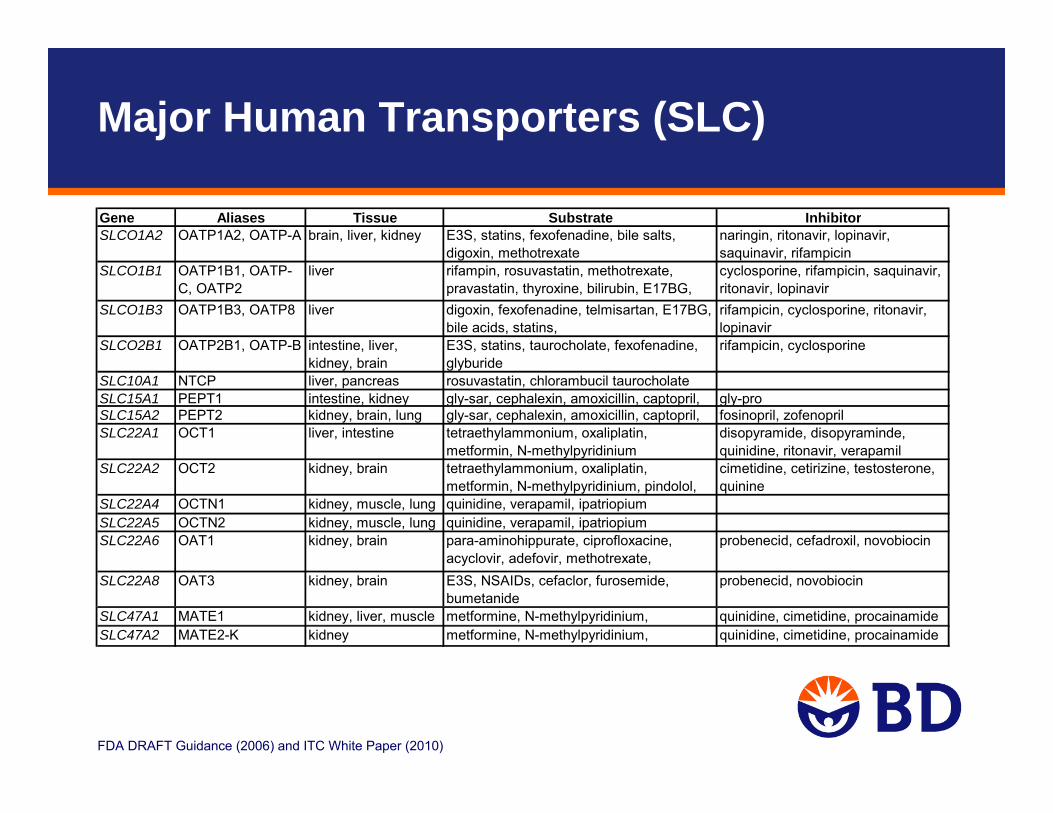
Major Human Transporters (SLC)
FDA DRAFT Guidance (2006) and ITC White Paper (2010)
Gene Aliases Tissue Substrate InhibitorSLCO1A2 OATP1A2, OATP-A brain, liver, kidney E3S, statins, fexofenadine, bile salts,
digoxin, methotrexatenaringin, ritonavir, lopinavir, saquinavir, rifampicin
SLCO1B1 OATP1B1, OATP-C, OATP2
liver rifampin, rosuvastatin, methotrexate, pravastatin, thyroxine, bilirubin, E17BG,
cyclosporine, rifampicin, saquinavir, ritonavir, lopinavir
SLCO1B3 OATP1B3, OATP8 liver digoxin, fexofenadine, telmisartan, E17BG, bile acids, statins,
rifampicin, cyclosporine, ritonavir, lopinavir
SLCO2B1 OATP2B1, OATP-B intestine, liver, kidney, brain
E3S, statins, taurocholate, fexofenadine, glyburide
rifampicin, cyclosporine
SLC10A1 NTCP liver, pancreas rosuvastatin, chlorambucil taurocholateSLC15A1 PEPT1 intestine, kidney gly-sar, cephalexin, amoxicillin, captopril, gly-proSLC15A2 PEPT2 kidney, brain, lung gly-sar, cephalexin, amoxicillin, captopril, fosinopril, zofenoprilSLC22A1 OCT1 liver, intestine tetraethylammonium, oxaliplatin,
metformin, N-methylpyridiniumdisopyramide, disopyraminde, quinidine, ritonavir, verapamil
SLC22A2 OCT2 kidney, brain tetraethylammonium, oxaliplatin, metformin, N-methylpyridinium, pindolol,
cimetidine, cetirizine, testosterone, quinine
SLC22A4 OCTN1 kidney, muscle, lung quinidine, verapamil, ipatriopiumSLC22A5 OCTN2 kidney, muscle, lung quinidine, verapamil, ipatriopiumSLC22A6 OAT1 kidney, brain para-aminohippurate, ciprofloxacine,
acyclovir, adefovir, methotrexate, id di
probenecid, cefadroxil, novobiocin
SLC22A8 OAT3 kidney, brain E3S, NSAIDs, cefaclor, furosemide, bumetanide
probenecid, novobiocin
SLC47A1 MATE1 kidney, liver, muscle metformine, N-methylpyridinium, quinidine, cimetidine, procainamideSLC47A2 MATE2-K kidney metformine, N-methylpyridinium, quinidine, cimetidine, procainamide

From: Zhang L et al. 2006, Mol Pharm.; 3:62, ITC paper 2010, Nature Rev Drug Disc 9:215
Kidney Basolateral TransportUptake: OCT2, OAT1, OAT2, OAT3, OATP4C1
Kidney Apical TransportP-gp, MRP2, MRP4, MATE, OCTN1, OCTN2, OAT4, Reabsorption: PEPT1, PEPT2
Blood-Brain BarrierUptake: OATP1A2, OATP2B1Efflux: P-gp (MDR1), BCRP, MRP4, MRP5
Liver Sinusoidal Transport Uptake: OCT1, OATP1B1, OATP2B1, OATP1B3, NTCP, OAT2Secretion: MRP3, MRP4
Liver Canalicular (Biliary) TransportSecretion: P-gp, BCRP, BSEP, MRP2, MATE1
Intestinal Lumen Absorption: PEPT1, OATPSecretion: P-gp, BCRP, MRP2
Transporter Expression

Transporter Drug-Drug Interactions
• Depending on the expression pattern of the affected transporter, DDI can result in changes to Absorption, Tissue Distribution (e.g. CNS, tumors), and/or Elimination of the victim drug.
– PK changes that can result in toxicity or inactivity for drugs with a narrow therapeutic index (e.g. digoxin).
– Tissue distribution changes may not be reflected in PK alone, but may lead to organ specific toxicity (e.g. liver). Therefore, the inclusion of pharmacodynamic markers to reflect altered distribution to the organs expressing the transporter should be considered whenever possible.

Clinical Examples for Transporter Related Drug-Drug Interactions
From: ITC paper (2010) Nature Rev Drug Disc 9:215

Relevant Transporters for DDI
• Currently considered most important transporters for DDI:– FDA 2006 Draft Guidance:
P-gp – ITC 2010 White Paper:
P-gp, BCRP, OATP1B1, OATP1B3, OAT1, OAT3, OCT2
– EMA 2010 Draft Guideline: P-gp, BCRP, BSEP, OATP1B1, OATP1B3, OAT1, OAT3, OCT1, OCT2
• Currently considered less important:– MRP transporters

In Vitro Models for Transporter Interaction
Assess inter-individual variability
Direct, functional uptake assay; Substrate and/or inhibitor screening; Affinity determination Km/Vmax, IC50, Ki
Assess biliary excretion
HepatocytesFresh hepatocytes plated or in suspension
Transporter Characterized Cryopreserved Hepatocytes (OATP, NTCP, OCT1)
Sandwich cultured human hepatocytes
Direct, functional efflux assay; Substrate and/or inhibitor testing; IC50, Kidetermination
Transfection of single (e.g. MDR1) or multiple transporters
Polarized cell monolayersCaco-2
Transfected cell lines (LLC-PK1, MDCK)
Direct, functional uptake assay with vesicles to identify substrates and inhibitors
“Inside-out” Vesicles from cells expressing transporter cDNA
Direct, functional uptake assay; Substrate and/or inhibitor screening; Affinity determination Km/Vmax, IC50, Ki
Xenopus leavis oocytesexpressing SLC transporters (e.g. OAT, OATP, OCT, NTCP, PEPT)
Membranes from cells expressing transporter cDNA
In Vitro Model
ATPase assay; Discovery screen; Indirect assay; does not differentiate substrates/inhibitors
Notes

Considerations for In Vitro Transport Studies
• Evaluate NME as a substrate and inhibitor of transporters – In line with the practices for enzyme identification, if renal and biliary
secretion account for more than 25% of systemic clearance, attempt to identify the transporter(s) involved
• Investigate drug transport with and without presence of the specific transporter activity
• Include positive controls (selective substrates/inhibitors) to verify specific transporter activity
• Test a concentration range of the investigational drug expected to be relevant for the site of interaction– For systemic transporter interaction, consider expected unbound Cmax
– For local transporter interaction, consider concentration at active site • Use a eukaryotic system where the physiological
functions of the transporter are preserved
EMA Draft Guideline (2010)

Assessment of P-gp and BCRP Interactions
Identification of P-gp/BCRP substrates and inhibitors using the bidirectional transport assay

P-gp and BCRP
Substrates overlap with P-gp, but also include acids and conjugatesPhysiological substrates include porphyrins, riboflavin and potentially other vitamins
Substrates are generally hydrophobic molecules, cationic or neutralMW 200 to >1000Multiple substrate binding sites
Involved in absorption, disposition, excretionKnown clinical DDIResistance to cancer chemotherapyClinically relevant polymorphisms
Involved in absorption, disposition, excretionKnown clinical DDI Resistance to cancer chemotherapy
Expressed in intestine, kidney proximal tubule, hepatocytes (canalicular), brain endothelia, placenta, stem cells, mammary glands
Expressed in intestine, kidney proximal tubule, hepatocytes (canalicular), brain endothelia
BCRP (ABCG2)P-gp (MDR1, ABCB1)

Bidirectional Transport Assay Design
• Cell monolayers grown on filters and placed in cluster plates• Filters are typically PET or PC membranes with 0.4-1 μm pores• Transport is measured in two directions:
– Apical (A) to Basolateral (B), i.e. test compound added to apical side– Basolateral (B) to Apical (A), i.e. test compound added to basolateral side
• Inhibition testing: Same as transport, but with inhibitor added to both A and B
Drug
= Active transport
= Passive diffusion
12
Filter membrane
Cell monolayer
ATP
A(apical)
B(basolateral)
1 2

Materials & Equipment
Example:BD FalconTM 24-multiwell HTS insert plate (1 µm PET) with feeder tray (for culture), 24-well cluster plates (for assay), lid
• Filter plate system (available in 6-, 12-, 24-, 96-well formats)
• 37°C incubator
• Pipettes (manual or automated) for liquid transfers
• TEER (Trans-Epithelial Electrical Resistance) meter to confirm presence of functionally polarized monolayersprior to the experiment
– TEER [Ω·cm2] = resistance (cells-blank) [Ω] x filter area [cm2]– Varies with cell line, 100-800 Ω·cm2
• Liquid scintillation counter or LC/MS/MS for analysis

Cell Lines for Bidirectional Transport Assays
• Caco-2 – Human colon carcinoma cell line– Morphologically similar to small intestinal epithelial cells– Most extensively characterized human cell-based model for investigating permeability and
P-gp/BCRP transport of drugs– Expression of various uptake and efflux transporters– P-gp and BCRP are functionally the most predominant, allows testing for both transporters
in the same system and assay.– No wild-type cells to run alongside
• LLC-PK1– Transfected porcine kidney cell line – Low transporter background, especially for P-gp
• MDCK– Transfected canine kidney cell line– High background of dog transporters, especially for P-gp

Cell Monolayers & QC
• Cells used for bidirectional transport studies should form a functionally polarized cell monolayer, complete with tight junctions.
• Cells should be allowed to grow to confluence on filter plates– typically 3-7 days for LLC-PK1 or MDCK– 18-21 days for Caco-2 – accelerated 3-5 day Caco-2 models are available
• Verify monolayer integrity by pre-experimental TEER measurements (e.g. > 150 Ω·cm2 for LLC-PK1 cells, >250 Ω·cm2 for Caco-2 cells)
• A paracellular marker (e.g. mannitol, lucifer yellow) is commonly used as an additional integrity marker
– Concurrently with the test article, or after the end of the assay– Detects toxicity or physical damage to monolayers during the assay
• Validate effects of organic solvents in your model (<1% organic is typically ok, keep constant)

Positive Control Substrate Characteristics
• Ideally: – Selective for the transporter of interest– Low to moderate passive permeability– May be used as an in vivo probe substrate – No significant metabolism in the cells– Commercially available
• Realistically:– A P-gp or BCRP substrate that meets all these criteria has not been identified, due to
overlapping substrate selectivity between different transporters as well as transporters and enzymes.
– Acceptable probe substrates meet the majority of the criteria and can confirm that the cell systems have functional P-gp and BCRP activity.
• Examples:– P-gp: digoxin, vinblastine, fexofenadine, saquinavir– BCRP: estrone-3-sulfate, prazosin, sulfasalazine– Select based on guidance and scientific justification

Positive Control Inhibitor Characteristics
• Ideally: – Selective for the transporter of interest – Low Ki or IC50 values (e.g. IC50 < 10 µM) – No significant metabolism in the cells– May be used as an in vivo inhibitor– Commercially available
• Realistically:– A P-gp or BCRP inhibitor that meets all these criteria has not been identified, due to
substantial overlap between different transporters. – Because of the lack of specificity, use multiple inhibitors to determine whether the efflux
activity observed in vitro is related to P-gp or BCRP.• Examples:
– P-gp: quinidine, verapamil, ketoconazole– BCRP: novobiocin, FTC, sulfasalazine– Select based on guidance and scientific justification

P-gp/BCRP Substrate Testing
• Test a range of concentrations– for intestinal transport: 0.1 to 50 x dose/250 mL– for systemic transport: 0.1 to 50 fold unbound Cmax
• Use triplicate monolayers for each condition • Include wild-type LLC-PK1 or MDCK cells as negative controls• Include a probe substrate as a positive control• Test in presence and absence of at least 2 potent P-gp/BCRP
positive control inhibitors to determine if efflux can be inhibited• Determine compound recovery from the test system at the end of
the assay– sample donor compartments at t=0 min and at the last time point

P-gp/BCRP Inhibition Testing
• Use a P-gp probe substrate that has been validated as a positive control in the test system.
– Select a concentration and incubation time within the linear range of transport for the probe substrate
– Efflux ratio should be high enough to provide sufficient dynamic range for inhibition (the >2 cutoff may be too low)
– Run in absence and presence of positive control inhibitors• Use triplicate monolayers for each condition • Initially, test a high concentration (e.g. 100 µM, solubility permitting). If
inhibition is observed, follow up with an IC50 determination.• Include 2 potent P-gp/BCRP positive control inhibitors.
– Single concentration of positive controls typically sufficient– In IC50 assays a full IC50 curve of the positive control
might be valuable

Probe Substrate Efflux Screen
Caco-2
0
2
4
6
8
10
12
14
16
18
20
Dig
oxin
(5uM
) ±
Ver
apam
il (5
0uM
)
E3S
(5uM
) ±
Nov
obio
cin
(10u
M)
Pra
zosi
n (5
uM
) ±N
ovob
ioci
n (1
0uM
)
LTC
4 (0
.1uM
) ±M
K57
1 (5
0uM
)
E17
BG
(5uM
) ±M
K57
1 (1
0uM
)
Effl
ux ra
tio (B
-A/A
-B)
Probe substrateProbe substrate + inhibitor MDR1 -LLC-PK1
0
2
4
6
8
10
12
14
16
18
20
Dig
oxin
(5uM
) ±
Ver
apam
il (5
0uM
)
E3S
(5uM
) ±
Nov
obio
cin
(10u
M)
Pra
zosi
n (5
uM
) ±N
ovob
ioci
n (1
0uM
)Q
uini
dine
(100
uM
)
LTC
4 (0
.1uM
) ±M
K57
1 (5
0uM
)
E17
BG
(5uM
) ±M
K57
1 (1
0uM
)
Effl
ux ra
tio (B
-A/A
-B)
Control-LLC-PK1
0
2
4
6
8
10
12
14
16
18
20
Dig
oxin
(5uM
) ±
Ver
apam
il (5
0uM
)
E3S
(5uM
) ±
Nov
obio
cin
(10u
M)
Pra
zosi
n (5
uM
) ±N
ovob
ioci
n (1
0uM
)
LTC
4 (0
.1uM
) ±M
K57
1 (5
0uM
)
E17
BG
(5uM
) ±M
K57
1 (1
0uM
)
Effl
ux ra
tio (B
-A/A
-B)
Perloff et al., 2010 AAPS Annual Meeting

Probe Substrate Validation: Digoxin Transport in MDR1-LLC-PK1 Cells
P-gp facilitated TransportTime dependence
0
200
400
600
800
1000
1200
0 50 100 150min
P-g
p tra
nspo
rt [p
mol
]
digoxin 0.5 uMdigoxin 5.0 uMdigoxin 50 uM
P-gp facilitated TransportConcentration dependence
0
200
400
600
800
1000
1200
1400
0 10 20 30 40 50 60uM
P-gp
tran
spor
t [pm
ol]
digoxin 30 mindigoxin 60 mindigoxin 90 mindigoxin 120 min
Transport of the P-gp probe substrate digoxin is linear over the concentration range of 0.5 - 50 µM and incubation times of 30 -120 min.
Standard assay conditions: 5 µM @ 90 min

Probe Substrate Validation: E3S Transport in Caco-2 Cells
Transport of the BCRP probe substrate estrone-3-sulfate is linear over the concentration range of 0.1 - 10 µM and incubation times of 45 -180 min.
Standard assay conditions: 5 µM @ 90 min
Concentration dependence
0
50
100
150
200
250
300
350
400
450
500
0 2 4 6 8 10uM
Net
E3S
tran
spor
t [pm
ol]
45 min90 min120 min180 min
Time dependence
050
100150
200250300
350400
450500
0 50 100 150 200min
Net
E3S
tran
spor
t [pm
ol]
0.1 uM1.0 uM10 uM

Positive Control Inhibitor Validation
Caco-2 cells
Perloff et al., 2010 AAPS Annual Meeting

Positive Control Inhibitor Selectivity
P-gp and BCRP inhibitors tested in Caco-2 cells
* Standard Error of the parameter fit, SigmaPlot v8.0
+-8439n/a>100Sulfasalazine
++-0.00610.120.545.2Fumitremorgin C
+++-0.170.93n/a>100Novobiocin
--0.420.570.0390.36Elacridar
-+++9.81000.543.1Verapamil
-++n/a>3000.422.0Quinidine
-+0.192.60.0520.45Ketoconazole
BCRPP-gpSE*IC50 [uM]SE*IC50 [uM]
Relative SelectivityBCRP inhibition (E3S efflux)
P-gp Inhibition(digoxin efflux)
Perloff et al., 2010 AAPS Annual Meeting

Calculations: Papp and Efflux Ratios
Apparent Permeability (Papp)
Papp [cm/s] = Vr/C0 x 1/S x dC/dtVr is the volume in the receiver chamber [cm3]C0 is the concentration in the donor chamber at t=0 [mM]S is the filter surface area [cm2]dC/dt is the is the linear slope of the drug concentration in the receiver chamber
with time after correcting for dilution [mM/s]
Efflux Ratio
Efflux Ratio = Papp (B to A) / Papp (A to B)Papp (B-A) is the Papp value measured in the B to A directionPapp (A-B) is the Papp value measured in the A to B direction
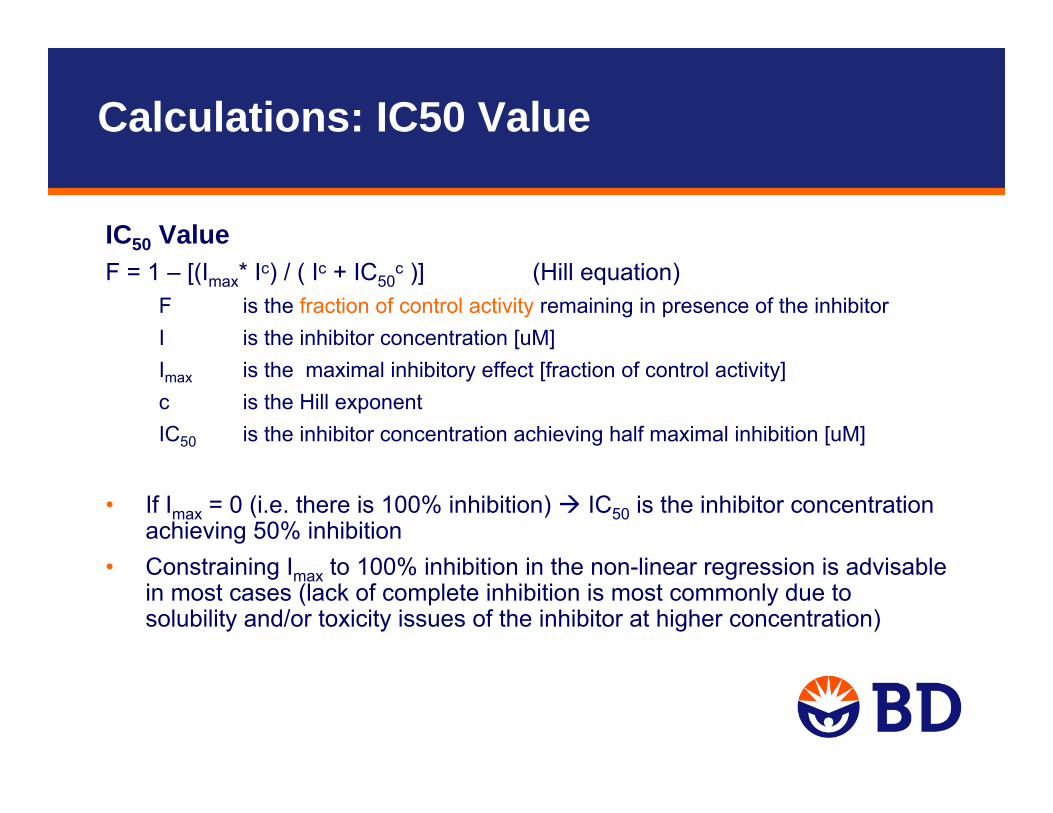
Calculations: IC50 Value
IC50 ValueF = 1 – [(Imax* Ic) / ( Ic + IC50
c )] (Hill equation)F is the fraction of control activity remaining in presence of the inhibitorI is the inhibitor concentration [uM]Imax is the maximal inhibitory effect [fraction of control activity]c is the Hill exponent IC50 is the inhibitor concentration achieving half maximal inhibition [uM]
• If Imax = 0 (i.e. there is 100% inhibition) IC50 is the inhibitor concentration achieving 50% inhibition
• Constraining Imax to 100% inhibition in the non-linear regression is advisable in most cases (lack of complete inhibition is most commonly due to solubility and/or toxicity issues of the inhibitor at higher concentration)

Calculations: Inhibition (fraction of control)
• There is considerable discussion in the scientific community regarding the most appropriate way to calculate the degree of P-gp inhibition
• An industry initiative to assess inter-laboratory variability in P-gp inhibition testing and evaluate various calculation methods is ongoing
• Approaches include assessment of the inhibitors effect on probe substrate’s– Efflux ratio (B-to-A / A-to-B)– Net flux ([B-to-A] – [A-to-B])– Unidirectional permeability (B-to-A or A-to-B Papp only)
• This gets further complicated by the option of factoring in the effect of a positive control inhibitor (assumed to cause maximum effect) vs. measuring against baseline (no inhibitor) activity alone
• Choice of calculation method has significant impact on IC50
• Preliminary findings to be presented at the AAPS Transporter Workshop in March 2011 (Caroline Lee, Pfizer)
• Publications, updated guidance to follow

Decision Tree for P-gp / BCRP Substrates
Bidirectional transport assayBidirectional transport assay
In vivo drug interaction study may be warranted
In vivo drug interaction study may be warranted
Is efflux ratio ≥ 2 ? *Is efflux ratio ≥ 2 ? *
Likely to be P-gp/BCRP substrate
Likely to be P-gp/BCRP substrate
Unlikely to be a P-gp/BCRP substrate
Unlikely to be a P-gp/BCRP substrate
YES NO
Is efflux inhibited by P-gp/BCRP inhibitors? **
Is efflux inhibited by P-gp/BCRP inhibitors? **
Is efflux ratio < 2 ? *Is efflux ratio < 2 ? *
Transporters other than P-gp or BCRP might be involved
Transporters other than P-gp or BCRP might be involved
Further in vitro studies to identify transporters may be warranted
Further in vitro studies to identify transporters may be warranted
FDA DRAFT Guidance (2006) and ITC White Paper (2010)
* There is concern that this value is too liberal and will lead to too many positive results. Alternatively, use a % value relative to a probe substrate, such as digoxin
** Reduces the efflux ratio significantly (> 50% or to unity)

Example: Identification of a Test Article as a P-gp Substrate in Caco-2 Cells
Test article shows active efflux, which is inhibited by P-gp inhibitorslikely a P-gp substrate
Data are for 120 min incubation time; similar results were obtained at 30 and 60 min
0
5
10
15
20
25
digo
xin
5 uM
digo
xin
5 uM
+ke
to 2
5 uM
digo
xin
5 uM
+cs
a 10
uM
TA 1
.0 u
M
TA 3
.0 u
M
TA 1
0 uM
TA 1
.0 u
M +
keto
25
uM
TA 3
.0 u
M +
ke
to 2
5 uM
TA 1
0 uM
+
keto
25
uM
TA 1
.0 u
M +
cs
a 10
uM
TA 3
.0 u
M +
cs
a 10
uM
TA 1
0 uM
+
csa
10 u
M
Pap
p [1
0-6
cm/s
]
A-B PappB-A Papp
positive control+/- inhibitors
test articlewithout inhibitors
test articlewith 25 uM ketoconazole
test articlewith 10 uM cyclosporine
Efflux Ratios: 14 1.4 1.1 3.6 2.8 2.3 1.3 1.4 1.3 1.3 1.1 1.2
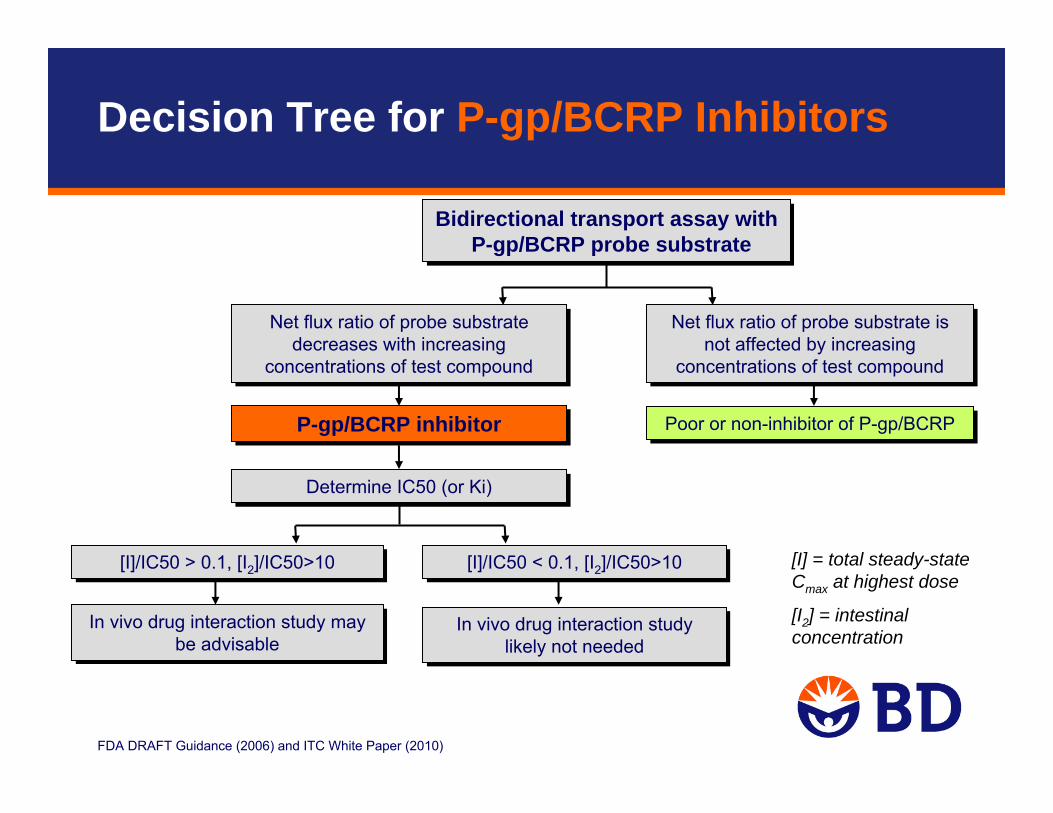
Decision Tree for P-gp/BCRP Inhibitors
FDA DRAFT Guidance (2006) and ITC White Paper (2010)
Bidirectional transport assay with P-gp/BCRP probe substrate
Bidirectional transport assay with P-gp/BCRP probe substrate
In vivo drug interaction study may be advisable
In vivo drug interaction study may be advisable
Net flux ratio of probe substrate decreases with increasing
concentrations of test compound
Net flux ratio of probe substrate decreases with increasing
concentrations of test compound
[I]/IC50 > 0.1, [I2]/IC50>10[I]/IC50 > 0.1, [I2]/IC50>10
Poor or non-inhibitor of P-gp/BCRPPoor or non-inhibitor of P-gp/BCRP
Determine IC50 (or Ki) Determine IC50 (or Ki)
Net flux ratio of probe substrate is not affected by increasing
concentrations of test compound
Net flux ratio of probe substrate is not affected by increasing
concentrations of test compound
[I]/IC50 < 0.1, [I2]/IC50>10[I]/IC50 < 0.1, [I2]/IC50>10
In vivo drug interaction study likely not needed
In vivo drug interaction study likely not needed
P-gp/BCRP inhibitorP-gp/BCRP inhibitor
[I] = total steady-state Cmax at highest dose
[I2] = intestinal concentration

Example: Identification of a Test Article as a P-gp Inhibitor in Caco-2 Cells
Test article shows concentration dependent inhibition of digoxin efflux P-gp inhibitor determine IC50
0
2
4
6
8
10
12
14
digo
xin
5 uM
digo
xin
5 uM
+ k
eto
25 u
M
digo
xin
5 uM
+ cs
a 10
uM
digo
xin
5 uM
+ TA
0.5
uM
digo
xin
5 uM
+ TA
1 u
M
digo
xin
5 uM
+ TA
2.5
uM
digo
xin
5 uM
+ TA
5 u
M
digo
xin
5 uM
+ TA
10
uM
Pap
p [1
0-6
cm/s
]
A-B PappB-A Papp
no inhibitionprobe P-gp inhibitorsas positive controls increasing concentation of the test article
Efflux Ratios: 14.8 1.2 1.1 12.2 8.4 4.9 3.5 1.6

Test article concentration [uM]
0 2 4 6 8 10 12
% In
hibi
tion
of d
igox
in e
fflux
0
20
40
60
80
100
120
Example: Identification of a Test Article as a P-gp Inhibitor in Caco-2 Cells
[I] / IC50 > 0.1 is the recommended cut-off for in vivo testing
If [I] (steady-state total Cmaxafter highest dose) is >0.12 uM, an in vivo P-gp interaction study might be warranted
IC50 = 1.2 µM

Interpretation of Results
• Highly permeable compounds may not be identified as substrates, howeverfor such compounds, basolateral to apical efflux is not likely to be a significant barrier to cross membranes.
• Consider the following factors when interpreting bidirectional transport data:– Mass balance (can impact Papp and efflux ratio)
– Limited solubility (can underestimate Papp or % inhibition)
– Toxicity (can mimic inhibition or mask efflux)
– Other transporters (probe substrates/inhibitors are not 100% selective)
– Radiochemical purity (impurity may impact results)

Mass Balance (Compound Recovery)
• Amount of compound recovered in the donor and receiver chambers at the end of the assay relative to the amount in the donor chamber at T=0 min
• Low recovery may significantly underestimate Papp values and overestimate efflux ratios
– Typical cut-offs used in the industry are 50-80%, depending on the stage of the compound in the development process
• Factors contributing to low recovery include:– Non-specific binding to the cells– Uptake into the cells – Non-specific binding to the plastic plate– Metabolism or non-metabolic instability
• Addition of protein (e.g. 2% BSA) may improve recovery, however, the impact on Papp and efflux ratios is not fully understood
• Preincubation may help by saturating binding sites

Recommendations
• Wherever possible, follow recommendations in the draft regulatory guidance documents
• Be prepared to explain/defend alternate approaches• Until documents are final, consider the docket comments and
consensus documents / White Papers• Contact the agency early for input on complex interaction scenarios• In vitro transport studies are not required to be GLP compliant.
However, using validated methods and test systems, positive control tracking processes, SOPs, etc. are expectations
• Use well accepted reagents from reputable suppliers• Engage experienced CRO partners to help meet your transport
needs!

Questions?
Contact information:Elke Perloff, PhDe-mail: [email protected]
Technical Support:tel: 877.232.8995e-mail: [email protected]/webinarsFor research use only. Not intended for use in diagnostic or therapeutic procedures. BD, BD Logo, and all other trademarks are property of Becton, Dickinson and Company. ©2010 BD


