+ All Categories
Home > Documents > Elliot Brown 2007

Elliot Brown 2007

Date post: 01-Dec-2015
Category:
Upload: umar-mujahid
View: 18 times
Download: 3 times
Share this document with a friend
Description:
Sodium Intake
85
SODIUM INTAKES AROUND THE WORLD Background document prepared for the Forum and Technical meeting on Reducing Salt Intake in Populations (Paris 5-7th October 2006) By Paul Elliott and Ian Brown
Transcript

SODIUM INTAKES AROUND THE WORLD

Background document prepared for the Forum and Technical meeting on Reducing Salt Intake in Populations (Paris 5-7th October 2006)

By Paul Elliott and Ian Brown

1

WHO Library Cataloguing-in-Publication Data : Elliott, Paul.

Sodium intakes around the world / Paul Elliott and Ian Brown Background document prepared for the Forum and Technical meeting on Reducing Salt

Intake in Populations (Paris 5-7th October 2006) 1.Sodium, dietary - statistics. 2.Sodium, dietary - urine. 3.Urinalysis - utilization. 4.Diet

surveys. 5.World health. I.Brown, Ian. II.World Health Organization.

ISBN 978 92 4 159593 5 (NLM classification: WB 424)

© World Health Organization 2007

All rights reserved. Publications of the World Health Organization can be obtained from WHO Press,

World Health Organization, 20 Avenue Appia, 1211 Geneva 27, Switzerland (tel.: +41 22 791 3264;

fax: +41 22 791 4857; e-mail: [email protected]). Requests for permission to reproduce or translate

WHO publications – whether for sale or for noncommercial distribution – should be addressed to

WHO Press, at the above address (fax: +41 22 791 4806; e-mail: [email protected]).

The designations employed and the presentation of the material in this publication do not imply the

expression of any opinion whatsoever on the part of the World Health Organization concerning the

legal status of any country, territory, city or area or of its authorities, or concerning the delimitation of

its frontiers or boundaries. Dotted lines on maps represent approximate border lines for which there

may not yet be full agreement.

The mention of specific companies or of certain manufacturers’ products does not imply that they are

endorsed or recommended by the World Health Organization in preference to others of a similar

nature that are not mentioned. Errors and omissions excepted, the names of proprietary products are

distinguished by initial capital letters.

All reasonable precautions have been taken by the World Health Organization to verify the

information contained in this publication. However, the published material is being distributed without

warranty of any kind, either expressed or implied. The responsibility for the interpretation and use of

the material lies with the reader. In no event shall the World Health Organization be liable for

damages arising from its use.

The named authors alone are responsible for the views expressed in this publication.

2

ABSTRACT

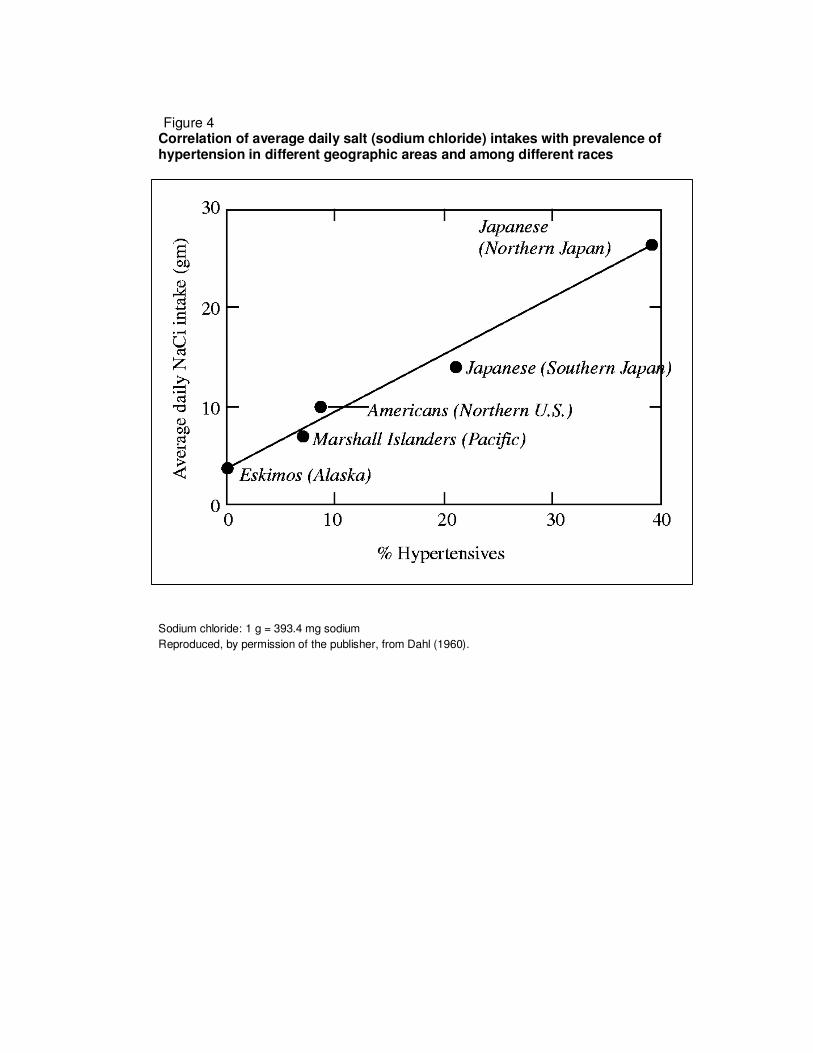
Sodium intakes of different populations around the world became of interest to the medical

research community with the publication of Dahl’s famous graph showing a positive straight-

line relationship of dietary sodium intake to prevalence of hypertension. At that time

populations were identified around the world with vastly different sodium intakes (and rates of

hypertension) ranging up to about 10.6 g/d sodium (460 mmol/d) in north-east Japan. Dietary

survey methods tend to underestimate sodium intakes and timed 24-hour urinary sodium

excretion is considered the “gold standard” method to estimate intake (some 85–90% of

ingested sodium is excreted through the kidneys). However, there is also some evidence to

suggest that spot (casual) urine samples may give valid estimates of sodium excretion in a

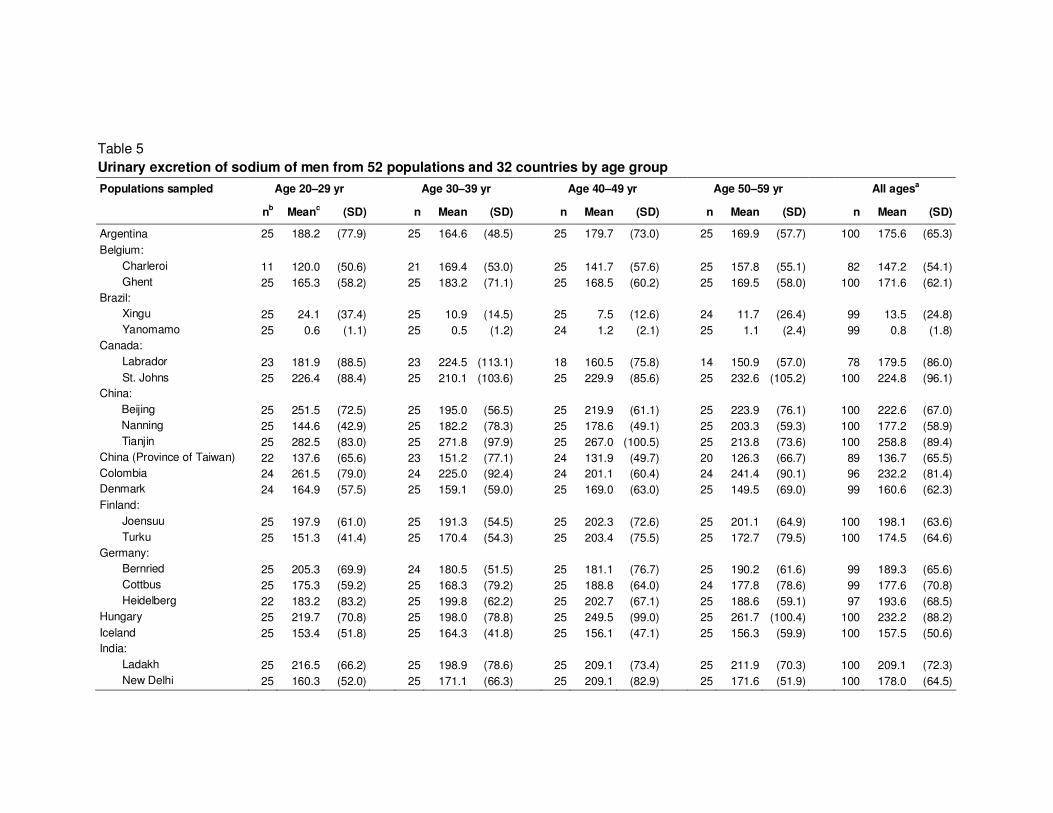
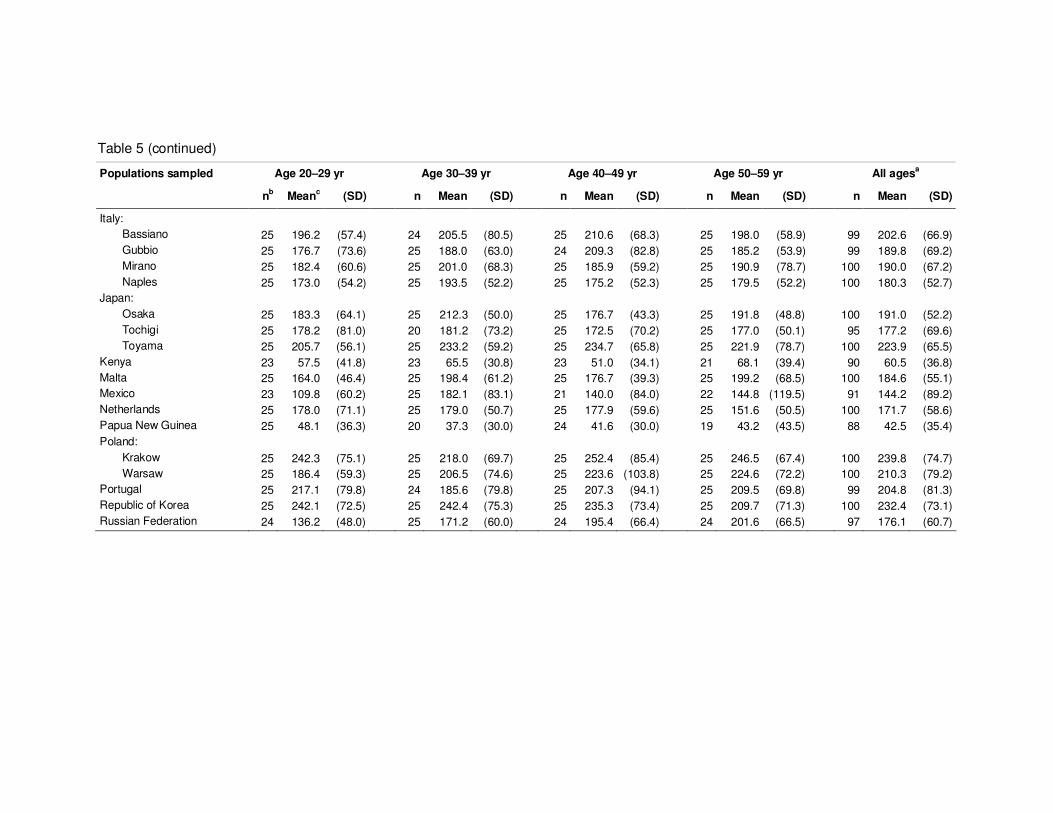
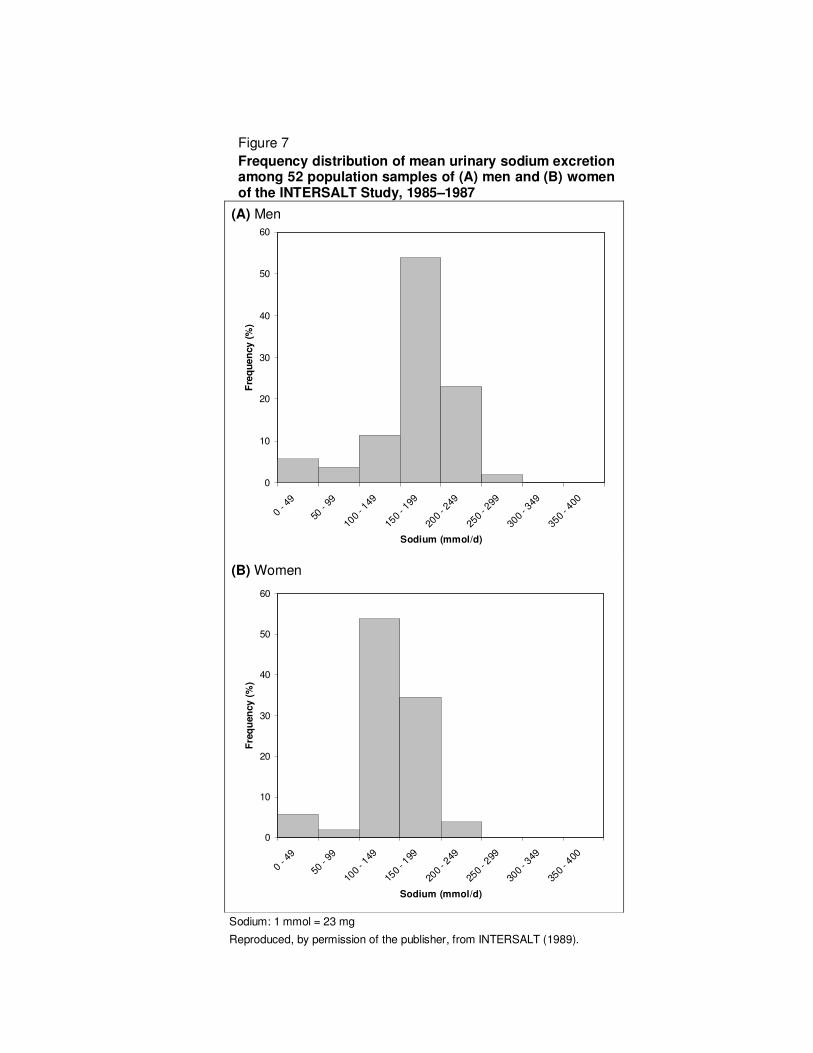
population. The INTERSALT Study provided standardized data on 24-hour urinary sodium

excretion among 52 population samples in 32 countries, for the mid to late 1980s. The

highest mean 24-hour urinary sodium excretion ranged from 260 mmol/d (6.0 g) in men and

230 mmol/d (5.3 g/d) in women in China and to 1 mmol/d (23 mg/d) among the Yanomamo

Indians of Brazil. The INTERMAP Study provided standardized data on sodium intakes and

24-hour urinary sodium excretion in China, Japan, the United Kingdom of Great Britain and

Northern Ireland, and the United States of America for the late 1990s. Although some

downward trends in sodium consumption have been noted in the past in countries like

Belgium and Japan where there have been public health campaigns to lower sodium in the

community, for the most part mean sodium intakes have not changed much over the past 20

or more years. Sodium intakes tend to be higher in men than women, reflecting their higher

food and energy intakes. Data in children and young people suggest higher intakes in boys

than girls and at older ages in both sexes, but there are serious methodological difficulties in

obtaining reliable and valid dietary data in this age group. For all countries for which recent

data are available, dietary sodium intakes are much higher than the physiological need of

10–20 mmol/d (230–460 mg/d). In industrialized countries, about 75% of sodium in the diet

comes from manufactured foods and foods eaten away from home. Some children’s foods

are extremely high in sodium. In Asian countries, high proportions of sodium in the diet come

from salt added in cooking and from sauces such as soy and miso (in Japan).

Representative samples of around 100 people (200 if men and women are to be considered

separately), each providing a single timed 24-hour collection of urine for the estimation of

sodium, would be required to monitor sodium intake in the community with a 95% confidence

limit about the mean of c. +/- 12 mmol/d. Much larger samples might be needed if greater

precision is required.

3

TABLE OF CONTENTS ABSTRACT............................................................................................................................ 1

TABLE OF CONTENTS......................................................................................................... 3

1. INTRODUCTION ............................................................................................................... 4

2. SCOPE AND METHODS ................................................................................................... 5

Search methods................................................................................................................. 5

Units .................................................................................................................................. 5

3. THE MEASUREMENT OF DIETARY SODIUM INTAKE.................................................... 6

Dietary survey methods ..................................................................................................... 6

24-hour urine collections .................................................................................................... 7

Measures of completeness of 24-hour urine collections ..................................................... 9

Overnight and spot (casual) urine collections................................................................... 12

Novel markers of sodium intake ....................................................................................... 15

Sample size estimates for monitoring 24-hour urinary sodium excretion .......................... 15

Summary ......................................................................................................................... 16

4. SODIUM INTAKES IN ADULTS....................................................................................... 17

INTERSALT Study ........................................................................................................... 17

INTERMAP Study ............................................................................................................ 18

Other studies published since 1988 ................................................................................. 19

Variation by sex and age.................................................................................................. 20

Trends over time.............................................................................................................. 20

Summary ......................................................................................................................... 21

5. SODIUM INTAKES IN CHILDREN AND YOUNG PEOPLE ............................................. 22

Summary ......................................................................................................................... 23

6. SOURCES OF DIETARY SODIUM.................................................................................. 24

Summary ......................................................................................................................... 25

7. REFERENCES ................................................................................................................ 26

ACKNOWLEDGEMENTS .................................................................................................... 33

4

1. INTRODUCTION

Sodium is the principal cation of the extracellular fluid. It plays vital and diverse roles in mammalian

physiology, including maintenance of the extracellular fluid volume, water balance, and generation of

the membrane potential of cells. The extracellular fluid contains some 95% of the total sodium content

of the body. Most dietary sodium is consumed as common salt (sodium chloride) – about 90% in the

United States of America (USA) and United Kingdom of Great Britain and Northern Ireland (Institute of

Medicine, 2004; Medical Research Council, 2005) – largely added in food processing, in restaurant

foods (James, Ralph & Sanchez-Castillo, 1987; Mattes & Donnelly, 1991) and, especially in some

Asian countries, in sauces and cooking (Yu et al., 1999; Campbell et al., 2006). Most ingested sodium

is excreted via the kidneys, with usually only small amounts lost in the faeces, sweat and through

other routes such as saliva, hair, nails, tears, semen and menstruation (Dahl, 1958).

While sodium is an essential nutrient in man, physiological need in acclimatized adults is only of the

order of 8–10 mmol/d (184–230 mg/d) (Dahl, 1972). In contrast to the present day, our predecessors

during 70 million years of mammalian and primate evolution, and 4–15 million years of hominoid and

hominid evolution leading to Homo sapiens had no exposure to sodium (salt) as a food additive, only

to sodium occurring naturally in foods and water (Denton, 1982). This was true also for Homo sapiens

during tens of thousands of years of evolution as a nomadic food gatherer

and hunter, until about

6000–8000 years ago when agriculture and animal husbandry developed, and for the first time, the

need to have a substantial reserve of food. Hence there developed a requirement to preserve food,

i.e. by salting of meat, fish, vegetables and dairy products (Stamler, 1993). Our species evolved in the

warm climate of Africa (Leakey, 1991), a salt-poor continent, on a low salt diet

of no more than 20–40

mmol sodium/day; it became – and remains – exquisitely adapted to the physiological retention and

conservation of the limited salt naturally present in foods. We are not optimally adapted to the

excretion (via the kidneys) of large quantities of sodium, many times physiological need, that has

become necessary with the addition of salt to foods late in human evolution (Denton, 1982; Stamler,

1993).

In this paper, we first review methods for estimating sodium intakes and then summarize data on

sodium intakes from different parts of the world. Our main focus is on dietary intakes in adults, with the

aim to include at least one study for each country or region for which data are available. We did not

aim to be comprehensive; we relied on published reports in the English language and for the most part

did not attempt to access the “grey” literature, e.g. national food composition data, and data on local or

national surveys that might be contained in government reports. Finally, we review the sources of

dietary sodium in both industrialized countries (mainly United Kingdom of Great Britain and Northern

Ireland and the United States of America) and some Asian countries for which food composition and

survey data are available.

5

2. SCOPE AND METHODS

We based our findings around the extensive standardized population data on 24-hour urinary sodium

excretion from the INTERSALT Study (INTERSALT, 1988, 1989), and on sodium intakes and 24-hour

urinary sodium excretion from the subsequent INTERMAP Study (Stamler et al., 2003a). INTERSALT

included over 10 000 men and women aged 20–59 years from 52 population samples in 32 countries,

with data collection carried out during 1985–1987 (INTERSALT, 1988, 1989). INTERMAP included

4680 men and women aged 40–59 years from four countries (China, Japan, United Kingdom, and

USA) with data collection during 1996–1999 (Stamler et al., 2003a). Both studies used a highly

standardized protocol, which incorporated extensive systems for data checking and quality control

(Elliott & Stamler, 1988; Dennis et al., 2003; Stamler et al., 2003a). We augmented these data with

reference to the historical literature on sodium intakes and blood pressure (Dahl, 1960; Sasaki, 1962,

1964; Gleibermann, 1973; Froment, Milon & Gravier, 1979) and data from observational studies from

around the world published in peer-reviewed reports after 1988.

We also included estimates of sodium intake in children and young adults obtained from two key

reviews by Lambert and colleagues (2004) and Simons-Morton & Obarzanek (1997); these

summarize, respectively, the available data on children’s intakes from national surveys, and

observational studies of sodium intake and blood pressure.

Search methods

We carried out a search of the peer-reviewed literature on dietary survey methods, sources of sodium

in the diet, and dietary surveys of sodium intakes published from 1988 onwards. Papers potentially to

be included in our report were identified by (1) a comprehensive keyword search of Medline and

Thompson ISI Web of Science databases (keywords listed in Table 1); (2) a Web of Science cited

reference search identifying papers that have cited the INTERSALT Study; (3) examination of the

resulting reference lists; and (4) authors’ own knowledge and contacts.

Abstracts were reviewed by one of us (IB) and classified as “not relevant”, “of potential interest” or “of

definite interest”. Those deemed “not relevant” were discarded, while efforts were made to obtain

copies of the remaining publications for review of the full paper1. To be included in our review of

worldwide dietary intakes of sodium, we required that the study was observational and not

interventional in design, was community based, and that mean dietary sodium intake or urinary

excretion was reported. Additional details including date of survey, sample size, gender mix and an

estimate of variability of sodium were recorded when available.

Units

Published reports refer to sodium intake as either mass or millimolar amounts of sodium or as mass of

sodium chloride (salt). In this report we mainly refer to dietary sodium and not to dietary salt (1g

sodium chloride = 17.1 mmol or 393.4 mg sodium). In common with usual practice in the scientific

literature, we present urinary sodium excretion in mmol, whereas estimates of dietary sodium intake

are given in g (or mg). We provide the conversion between the two measures in the text, and

conversion factors in the tables and figures: 1 mmol sodium = 23 mg; 1000 mg (1 g) sodium = 43.5

mmol. For ease of reference, Table 2 gives conversions between various mmol and mg quantities of

sodium.

1 At time of writing, some references are still pending “on request”

6

3. THE MEASUREMENT OF DIETARY SODIUM INTAKE

Sodium intake can be estimated indirectly either from questionnaire or food consumption data, or

directly by the measurement of urinary excretion (Table 3). In an early example of the questionnaire

approach, Dahl and Love used a simple question concerning the use of a saltshaker at the table to

classify men as having low or high salt intakes, and reported a significant difference in the prevalence

of hypertension (140/90 mmHg or more) between these two groups (Dahl & Love, 1954, 1957).

However, these results were not replicated by other investigators (Miall, 1959, Dawber et al., 1967)

and Dahl subsequently commented that “our salt habit questionnaire was useful to us but a disservice

to others… unless such questions give an index of actual NaCl intake, they have no relevance

whatsoever” (Dahl, 1972).

Dietary survey methods

More generally, dietary survey methods are used to obtain data on food consumption as reported on

questionnaire or at interview which are then converted into nutrient intakes estimated from

standardized food tables. Such methods are prone to numerous errors including reporting errors,

inaccurate or incomplete food composition tables, coding errors, and sampling bias (Bingham, 1987).

Specific sources of error with regard to sodium intake include: difficulties in estimating the amount of

sodium chloride added during cooking (including in restaurants) and at the table; variation in the

proportion of salt added during cooking that is retained by the food; plate losses (i.e. salt left behind on

the plate); variation in the sodium content of manufactured foods; and variation in sodium

concentration of local water supplies (Bingham, 1987; James, Ralph & Sanchez-Castillo, 1987). The

sodium content of processed and restaurant foods is especially important, as these foods contribute

three-quarters or more of the sodium intake of a typical developed country diet (James, Ralph &

Sanchez-Castillo, 1987; Mattes & Donnelly, 1991). This is illustrated in Table 4, which shows the

sodium content of different brands of foods in the USA. Sodium content of hot dogs, for example,

varies from 0.5 g/100 g (Wellshire Farms Old Fashioned Premium Franks) to 1.4 g/100 g (Gwaltney

Great Dogs 40% Less Fat) and of Caesar salad dressings from 0.5 g/100 g (Morgan’s Caesar) to 2.0

g/100 g (Ken’s Caesar Lite) (Center for Science in the Public Interest, 2005).

As a consequence of the above sources of error, sodium estimates based on the food diary, weighed

records, food–frequency questionnaire or 24-hour recall approach tend to underestimate sodium

intakes as compared with intakes estimated from duplicate diets or 24-hour urine collections.

Schachter and colleagues (1980) compared estimates of sodium intake from duplicate food portions

(with sodium content measured by flame photometry) and 3-day food records with those from urinary

sodium excretion measured over the same period (three consecutive 24-hour collections) in nine

highly-motivated adults. Highest estimate of sodium intake was obtained from the duplicate portions.

Mean urinary sodium excretion was on average 5% lower than intake assessed by duplicate portions,

while intake assessed by food records was on average 6.3% lower than the urinary estimate.

Similarly, Clark and Mossholder (1986) estimated sodium intakes among eight adolescent girls using

the duplicate diet method and compared chemically analysed values against urinary excretion from

24-hour urine collections, and calculated estimates from food tables. Discretionary use of salt from the

7

saltshaker was estimated separately. For each participant, urinary sodium excretion was higher than

that calculated from food tables: on average 2.39 g/d (104 mmol/d; standard error (SE), 0.13 g/d) vs

1.85 g/d (80 mmol/d; SE, 0.11 g/d). Urinary sodium excretion comprised on average 83% of total

sodium intake estimated from chemical analysis of sodium in the duplicate diets plus discretionary

sodium.

In a study of 55 middle-aged adults, Caggiula et al. (1985) compared sodium intakes estimated from a

six-day food record with urinary excretion from a single 24-hour urine collection. On average, mean

24-hour urinary sodium excretion was higher than sodium intake estimated from food records by

approximately 40%. More recently, Espeland et al. (2001) estimated sodium intake from repeated 24-

hour dietary recalls (including discretionary use of sodium) and Khaw et al. (2004) from a seven-day

diary (excluding discretionary sodium), in comparison with urinary sodium excretion from repeated 24-

hour urine collections. Both studies found that sodium intake was underestimated by the recall/diary

methods in comparison with urinary sodium excretion, on average by 22% and 16–17% respectively

(Figures 1 and 2).

However, not all studies that carried out such comparisons have found that sodium intake is

underestimated by dietary intake methods vs urinary sodium excretion. Pietinen (1982) reported that

urinary sodium excretion (from three consecutive 24-hour collections) was 93% of sodium intake

estimated from food records kept for four consecutive days in North Karelia, Finland. She concluded

that food consumption data collected in nutrition surveys could be used for estimating sodium intakes

where accurate data on the sodium content of local foods were available. In the INTERMAP study,

similar estimates of sodium intakes were obtained from the average of four 24-hour dietary recalls and

two 24-hour urine collections, for the samples from Japan, United Kingdom and USA, but for China

estimates from the 24-hour recalls were lower than those from the urinary excretion data, by 18% and

30%, in men and women respectively (Figure 3) (Stamler et al., 2003b).

24-hour urine collections

Because of the problems of underestimation of sodium intakes based on dietary surveys in most

studies (notwithstanding the notable exceptions above), and given that chemical analysis of duplicate

diets is not a viable option for studies with more than a few individuals, 24-hour urinary sodium

excretion has become the “gold standard” method of obtaining data on sodium intakes in population

surveys (Bingham, 1987; Bates, 1991; Hunter, 1998). A 24-hour period is required to capture the

pattern of sodium excretion, since there is a marked diurnal variation in sodium, chloride and water

excretion (see Wesson, 1964, for a review). Electrolyte excretion in healthy individuals reaches a

maximum at or before midday, and a minimum at night towards the end of sleep. The cycle is

independent of moderate activity (Stanbury & Thomson, 1951) although severe exercise may produce

decreased excretion of sodium and chloride (O’Connor, 1977), and is present on either sodium

restricted or sodium-supplemented diets. The cycle may be reversed in night workers, healthy

individuals given large doses of cortisone, in Cushing’s disease and primary aldosteronism (Wesson,

1964). Stanbury and Thomson (1951) made an intensive study of the diurnal cycle of electrolyte

8

excretion in healthy people, making more than 80 observations on each of 12 individuals. Glomerular

filtration rate (GFR) was calculated by measuring inulin clearance (inulin was injected continuously by

intravenous infusion). The GFR, urine volume and mean rates of sodium and chloride excretion fell

overnight to about 30% of the midday value for sodium, and urinary concentrations of sodium and

chloride increased with the relative oliguria of sleep. Marked differences in electrolyte excretion rates

were observed between individuals.

The 24-hour urinary excretion method takes no account of electrolyte loss other than via the kidney,

and therefore will tend to underestimate true intake. For example, Holbrook et al. (1984) reported that

among 28 adults, average urinary excretion of sodium from seven consecutive 24-hour urine

collections was 86% of that estimated from chemical analysis of duplicate diets collected over the

same seven-day period. Losses of sodium in the faeces are small under normal conditions (Baldwin,

Alexander & Warner, 1960) and over a wide range of intakes (Kirkendall et al., 1976), and other losses

are thought to be negligible, except those from sweating which in certain circumstances can be

considerable (Dahl, 1958). Such losses depend both on the concentration of electrolyte in the sweat –

which is under hormonal control (Conn, 1950) related to the amount of sodium in the diet (McCance,

1938) – and on the rate of sweating. However, losses through sweat (which might be expected to vary

with ambient temperature and humidity) are minimal in temperate climates (Bingham et al., 1988).

The 24-hour urine collection has the advantage that it is not affected by subjective reporting of dietary

intakes, though it is subject to several limitations.

1. Participant burden is high and therefore rates of incomplete collection/attrition may be high.

2. The collection must be complete, with no more than a few drops lost, otherwise the excretion

estimate will be biased.

3. There is no absolute check on completeness, though good survey technique may help to

reduce levels of incompleteness.

4. The collection must be accurately timed to avoid over- as well as under-collection and so that

minor deviations from a 24-hour collection period can be corrected.

An important consideration is whether sodium intake is being estimated at individual or group level.

Luft, Fineberg & Sloan (1982a) conducted an experiment on 43 volunteers in whom sodium intake

was allowed to vary randomly about a mean of 150 mmol/d; they calculated that nine 24-hour urine

collections per participant were necessary to show a correlation coefficient of 0.75 between sodium

excretion and mean sodium intake over a 10-d period. More generally Liu et al. (1979a) and Joossens

et al. (1980) showed that, because of the large day-to-day intra-individual variability in sodium intakes

in developed countries, a single 24-hour urine collection is insufficient to characterize the sodium

intake of the individual, and as many as fourteen 24-hour urine collections may be required. Smaller

numbers of collections may be needed in Asian populations such as in China (Lisheng et al., 1987)

9

and in the elderly (Elliott et al., 1988) because of lower day-to-day variation in sodium excretion in

these groups.

On the other hand, by including sufficient numbers of people, mean sodium excretion for populations

can be estimated from single 24-hour urine collections, with little error about the mean. For example,

Liu et al. (1979a) reported mean sodium excretion of 176 mmol/d (4.0 g/d; SE, 3.9 mmol) among 116

businessmen in Chicago, USA. In Milton, New Zealand, in a study of 565 men and 537 women, mean

24-hour sodium excretion (in all age-groups) was 173 mmol/d (4.0 g/d; SE, 3.2 mmol) for men and 140

mmol/d (3.2 g/d; SE, 2.3 mmol) for women (Simpson et al., 1978). In the Polynesian islands of

Rarotonga and Pukapuka, mean 24-hour sodium excretion was, in Rarotonga, 114 mmol/d (2.6 g/d;

SE, 10 mmol) in 35 men; 102 mmol/d (2.3 g/d; SE, 9 mmol) in16 women; and in Pukapuka, 62 mmol/d

(1.4 g/d; SE, 7 mmol) in 38 men; and 63 mmol/d (1.4 g/d; SE, 7 mmol) in 22 women (Prior &

Stanhope, 1980).

Measures of completeness of 24-hour urine collections

A critical consideration in the use of the 24-hour urine collection method to estimate sodium intakes is

to ensure as far as possible that urine collections are complete (and also that there is not over-

collection).

a. Creatinine. Assuming that the rate of urinary creatinine excretion is constant (Pollack, 1970), 24-

hour excretion of creatinine has been used as a standard to exclude urine collections judged to be

incomplete (Doyle, Chua & Duffy, 1979; Schachter et al., 1980; Ljungman et al., 1981). However,

there is a wide range in individual excretion of creatinine related to body mass and diet. Twenty-four

hour urinary creatinine excretion is strongly correlated with lean body mass (LBM). In one study,

where LBM was calculated by estimating total body potassium, a correlation coefficient of 0.988 was

found between LBM (measured in either sex) and urinary creatinine excretion (Forbes & Bruining,

1976). Other studies cited by Forbes and Bruining (1976) reported correlation coefficients of between

0.72 and 0.99 for LBM, but weight appears to be less well correlated. Bleiler and Schedl (1962)

reported a correlation coefficient of 0.5 between estimates of metabolically-effective tissue derived

from functions of body weight, and creatinine excretion.

A carnivorous diet is an important source of creatine, a precursor of creatinine. In a series of

experiments in which the diet was manipulated to be free of meat protein, falls in serum creatinine,

and in urinary creatinine of up to 40% were observed. Ingestion of meat caused a rapid rise in

creatinine excretion; exercise had no effect (Bleiler & Schedl, 1962). Large increases in serum

creatinine (into the ‘pathological’ range) were noted in six healthy male volunteers, especially following

a meal of boiled beef or goulash (Jacobsen et al., 1979). Lykken et al. (1980) studied eight male

volunteers on a metabolic ward, who were fed either a high (HPC) or a low (LPC) protein diet.

Excretion of creatinine increased when a participant’s diet was changed from LPC to HPC and

decreased when the diet was changed from HPC to LPC. The authors proposed a mathematical

10

model describing the body creatinine pool size as a function of the diet, and hence predicting

variations in the 24-hour urinary excretion of creatinine following a change in diet (Lykken et al., 1980).

The coefficient of variation (CV%) has been used to describe this variability in creatinine excretion

within individuals. For example, Vestergaard and Leverett (1958) measured creatinine excretion over

ten 24-hour collections of urine in 18 healthy individuals; the CV% for creatinine was between 1.7%

and 17.3%. Paterson (1967) studied eight healthy individuals; the mean CV% for creatinine excretion

was 9.2%. Cramer et al. (1967) reported a mean CV% for creatinine excretion of 18.4% in 35

individuals. Scott and Hurley (1968) validated 24-hour urine collections in six individuals using a

radioisotope technique; they found a CV% for creatinine excretion in individuals of about 10% (and

29% between individuals). Ram and Reddy (1970) showed wide variations in creatinine excretion in

eight adults in whom they studied excretion over both 4-hour and 24-hour periods. The 24-hour

creatinine excretion varied by as much as 50% in some individuals; between 4-hour periods, the

variation in some instances was over 100%.

This large intra-individual variability in creatinine excretion and the responsiveness to meat in the diet

seriously limit the utility of creatinine as a marker for the completeness of 24-hour urine collections

(Edwards, Bayliss & Millen, 1969). Liu et al. (1979a) have suggested that the CV% of creatinine

excretion might give a measure of the accuracy of 24-hour collections within the group, and Joossens

et al. (1980) have proposed a model to standardize 24-hour excretion values of sodium to creatinine at

group level based on functions of weight, height, sex, age and social class. However, according to

Bingham and Cummings (1983), up to 40% of urine could be lost in a 24-hour period, and yet

creatinine excretion measured in the remainder would still fall within the normal (24-hour) range. In

population terms, systematic under-collections of urine – of up to 40% – may go undetected by the

creatinine method and could result in seriously biased (low) estimates of urinary sodium excretion from

survey data.

b) p-aminobenzoic acid (PABA). Bingham and Cummings (1983) have proposed the use of PABA as a

biomarker for the completeness of 24-hour urine collections as an alternative to the creatinine method.

PABA, a B-complex vitamin, was selected as it was considered to be non-toxic in man; in health, it is

thought to be absorbed and excreted within 24 hours and can be readily analysed (International

Agency for Research on Cancer, 1978). Studies in rats suggest that absorption of PABA from the gut

is by passive diffusion (Arvanitakis, Longnecker & Folscroft, 1978). Once absorbed, PABA is

metabolized in the liver to p-aminohippuric acid (PAHA) and both PABA and PAHA are acetylated. In

a series of experiments in human calorimeters, excretion of PABA in the urine was found to be dose

dependent. At a dose of 240 mg (80 mg three times a day with meals), mean recovery of PABA over a

24-hour period was 93% in 33 individuals. The range between minimum and maximum values was

15% of the mean compared with 70% for creatinine excretion. Bingham and Cummings (1983)

concluded that in the general population, collections containing more than 85% (205 mg) of the

administered dose can be considered complete (with a 5% chance of incorrectly excluding a complete

sample).

11

Although the use of PABA has proved of value in validation studies (Bingham 2002), its wider use in

population surveys may be more problematic. Bingham et al. (1992) reported that PABA recovery was

lower in patients with renal disease with increased creatinine excretion than in those with normal

creatinine excretion. Hydrolysis of acetylated metabolites occurs in the urine, and the free amine

groups become available for detection by chemical analysis; a number of drugs including

sulphonamides, folic acid, paracetamol, phenacetin and frusemide contain amine groups or may be

metabolized to them, and erroneously high PABA recovery rates might therefore be obtained in

individuals taking these drugs (Bingham & Cummings, 1983). Jakobsen, Pederson & Ovesen (2003)

observed that PABA recovery declined with age, at a rate of approximately 1% per year from age 30

onwards, such that in older individuals complete urine collections might be falsely rejected (false

negative). They also raised the possibility that incomplete collections might be falsely accepted (false

positive).

Because the PABA technique relies on the participant taking PABA tablets (3 x 80 mg) informed

consent and ethics committee approval is required (Henderson et al., 2003). The technique relies on

the participant taking their tablets as instructed at intervals during the 24-hour period; missing a tablet,

or taking the tablets at the wrong times, might result in complete urine collections being falsely

rejected.

The PABA method was initially used in the 2000–2001 British National Diet and Nutrition Survey,

carried out among adults aged 19 to 64 years to validate the 24-hour urine collections. However,

during the first wave of data collection, one respondent exhibited an acute allergic reaction with

generalised urticaria and periorbital oedema, and on medical advice, the procedure was discontinued

for the remainder of the survey (Henderson et al., 2003). Thus the utility and the safety of the PABA

technique for population surveys have not been established.

c. Survey technique. In the absence of a reliable biochemical technique to validate completeness of

24-hour urine collections, the INTERSALT and INTERMAP studies adopted rigorous survey methods

to minimize under- and also over-collection (Elliott & Stamler, 1988; Stamler et al., 2003a). This

involved both the beginning and end of the 24-hour collection being supervised and timed by the

research team. Participants attended for a clinic visit where they were instructed on the method of

urine collection, counselled on the importance of collecting a complete sample, and provided with a

sufficient number of standard 1-litre collection jars (and a funnel for women) for the 24-hour period:

equivalent to a capacity of 4–5 litres (or more in some cases) depending for example on climate or

usual intake. Immediately before starting the collection, the participant was asked to void his or her

bladder. All urine voided from that moment onwards was to be collected until the same time the

following day when either the participant should re-visit the clinic or the end of the collection should be

supervised in the home. To prevent deterioration of the samples, the collection jars were pretreated

with boric acid as preservative. Each participant was provided with a suitable bag to carry and protect

the jars from spillage and to avoid embarrassment. At about the same time the next day, the

12

participant was asked to empty his or her bladder completely, and the final urine specimen was

collected. At this point the collection time was recorded; collections within the range 20–28 hours were

acceptable (corrected to 24 hours in the statistical analysis). On completion of the urine collection,

each participant was asked a simple set of questions about completeness. If the participant responded

that ”more than a few drops” of urine were lost during the collection, it was considered invalid and the

participant was asked to repeat the collection, or a replacement participant was recruited. The total

volume of urine collected was measured using a specially-devised linear measuring scale, and the

complete sample mixed thoroughly before aliquots were taken for laboratory analysis (Elliott &

Stamler, 1988).

In order to calculate an individual’s sodium excretion, three values are needed:

� sodium concentration (e.g. mmol per litre)

� total volume of urine collected (e.g. ml), and

� collection time (e.g. hours and minutes).

Sodium concentration is measured in the laboratory by flame absorption spectrophotometry or ion-

selective electrode potentiometry (Hunter, 1998). Twenty-four hour sodium excretion is then calculated

by multiplying the sodium concentration by the total volume collected and multiplying the product by

24/collection time (hours), to correct to 24 hours. If samples need to be transported or stored before

laboratory analysis they can be refrigerated overnight and then frozen; after freezing, the samples may

be stored over the long term, as sodium is stable in frozen urine (Hunter, 1998).

Overnight and spot (casual) urine collections

Overnight and spot (casual or single) urine collections have been proposed as low-burden alternatives

to the 24-hour collection (Watson & Langford, 1970), as fewer voidings are required, and the

participant does not have to continue the collection during daily activities. There are however

important questions concerning the validity of both approaches.

a. Overnight urine collections. Collection of overnight urine is more readily achieved than 24-hour

urine collections, and a higher rate of compliance is likely in large epidemiological surveys (Pietinen et

al., 1976). Before going to sleep, the participant is required to empty his or her bladder and discard the

urine. The collection then begins and the time is recorded; all urine voided during the night, and the

first void in the morning upon rising, constitute the overnight collection. The total volume of urine

collected and the time that the collection is completed are recorded, so that sodium excretion may be

calculated and corrected to an 8-hour base (Dyer et al., 1987).

Sodium excretion exhibits diurnal variation, with the lowest excretion rate observed at night. Sodium

excretion in one overnight collection from each of 19 individuals was significantly correlated with mean

sodium excretion over 3 days (Pietinen et al. 1976). Higher correlations were observed in a sub-study

of 50 people when three overnight urine collections were compared with three 24-hour collections

(Pietinen et al., 1979). Langford and Watson (1973) reported a correlation (r) of 0.42 between sodium

excretion in one overnight urine sample, and mean sodium excretion over 6 days. Ogawa (1986) and

13

Yamori et al. (1982) reported correlations of 0.8 and 0.6 respectively between overnight and 24-hour

urinary sodium excretion. However, studies where ‘part‘ collections are compared to the ‘whole’ have

been criticized on statistical grounds (Liu et al., 1979a; Cooper & Liu, 1980). In an attempt to

overcome this problem, Liu et al. (1979b) compared 24-hour urinary sodium excretion on one day with

overnight sodium excretion on a different day (in 142 men). The correlation between the ‘true’ mean

24-hour and the ‘true’ mean overnight sodium excretion was estimated to be 0.722. (The ’true’ mean

of a variable for the individual was defined as the real (actual) average about which it varied during a

given time whilst a stable dietary pattern was maintained). Most individuals with high ‘true’ mean

overnight urinary sodium excretion were likely to have high ‘true’ mean 24-hour urinary sodium

excretion. Similarly, those with low overnight values were likely to have low 24-hour values. However,

to classify individuals by overnight sodium excretion, Liu et al. (1979b) calculated that 6–12 overnight

collections of urine would be required and concluded that for epidemiological studies overnight

collections might be preferable – in terms of participant compliance – to 24-hour collections.

Luft et al. (1982b) studied 24 individuals (12 white and 12 black men) on different constant levels of

sodium intake. After five or more days on each regimen, the amount of sodium excreted in 24 hours or

overnight was related to sodium intake, and “good correlations” were obtained. There was also a

strong correlation between overnight and 24-hour sodium excretion. No differences in excretion

patterns were noted between the two groups of men, although in a previous study, Luft et al. (1979)

found that black individuals excreted a sodium load more slowly than white individuals, with relatively

more of the load being excreted at night. Subsequently the diets of 22 white and 21 black men and

women were varied day to day randomly about a mean sodium intake of 150 mmol/d (3.45 g/d;

standard deviation (SD), 50 mmol/d) (Luft et al. 1982a). Under these conditions, nocturnal excretion of

sodium correlated poorly with mean sodium intake, even after nine urine collections (r = 0 27). Luft et

al. (1982a) concluded that ‘‘nocturnal urine collections do not appear promising in the estimation of

mean sodium intake”.

While the overnight urine collection method has distinct advantages over the 24-hour urine collection

in terms of feasibility for large population surveys and participant burden, there are large individual

differences in the rate of electrolyte excretion at night compared to the day, and also in the proportion

of solute excreted overnight compared to the full 24 hours. Dyer et al. (1987) compared 24-hour,

daytime and overnight rates of sodium excretion in 107 hypertensive adults, and observed a higher

average rate of sodium excretion at night than during the day, a reversal of the usual pattern whereby

more sodium is excreted during the day (Pietinen et al., 1976). Overnight sodium excretion was also

higher in women than men. In a subsequent report, Dyer et al. (1998) again found that a relatively

greater proportion of sodium was excreted at night among hypertensive individuals. These

observations raise questions as to whether estimates of sodium intake from overnight urine collections

might be biased according to, for example, the mix of hypertensive and normotensive individuals,

percentage of men and women, or black and white individuals in the sample.

b. Spot (casual) urine collections. A single voiding of the bladder is all that is required for a spot urine

collection. Sodium concentration and ratios to creatinine and potassium are obtained from laboratory

14

analysis. Time of day of the collection (often first void, when the urine is most concentrated) should be

standardized to minimize error introduced by diurnal variation in urinary solute excretion (Widdowson

& McCance, 1970). Wesson (1964) has reported results from 12 individuals in whom marked inter-

individual variation was apparent in the amplitude and timing of the diurnal sodium, chloride and

potassium cycles.

The results of Stanbury and Thomson (1951) allow estimations of variability in the ratios of sodium:

potassium (Na:K) and sodium:creatinine (Na:Cr) across different urine specimens throughout the day.

Large variations are apparent, not only between individuals but also within individuals in adjacent time

periods. Thus participant R had a Na:K ratio of 4.29 between times 08:12 and 09:13, which fell to 2.51

between times 09:13 and 10:01, and 1.90 between 10:01 and 10:56. The mean ratio over a 12-hour

period was 2.74 (SD, 0.75). Participant J showed a range in Na:K ratios from 2.00 to 6.54 with mean

4.17 (SD, 1.59) over an 11-hour period; participant T showed a range of only 1.94 to 2.65 over a 16-

hour waking period, but the ratio rose to 3.47 at night. Participant B on a rice (low-sodium) diet

showed a greater than 10-fold increase in Na:K ratio over a 3-hour period from 0.03 to 0.44. Similar

fluctuations were observed in Na:Cr ratios; for example there was a more than four-fold increase in the

Na:Cr ratio (participant R) between sleep and a waking period 4 hours later. As noted by Vestegaard

and Leverett (1958) variation in creatinine excretion ‘‘from hour to hour will frequently exceed 100%”.

Cummins, Shaper & Walker (1981) were critical of the use of sodium concentration from spot urines

as a proxy for sodium excretion, noting that sodium concentration relies not only on the quantity of

sodium, but also the volume of fluid ingested (which, along with sodium consumption varies greatly

throughout the day), and the amount of water used by the kidneys to excrete a given quantity of

sodium. The wide variation in Na:K and Na:Cr ratios within individuals reflects the fact that both

numerator and denominator are dynamic variables.

Nonetheless, Walker et al. (1979) reported significant correlations between Na:Cr ratios in spot urine

and 24-hour urine collections. For 18 individuals with normal blood pressure the correlation coefficient

was 0.62; for 37 hypertensive individuals the coefficient was 0.56. Moore et al. (1979) reported a

significant correlation between 24-hour urinary sodium and the Na:Cr ratio of the next voided

(morning) spot urine (r = 0.84) in eight individuals under 30 years of age with essential hypertension,

but no significant correlations were apparent in 18 older people. Milne et al. (1980) reported on a study

of 97 men showing significant correlations (r = 0.25 to 0.52) between sodium excretion in urine

samples at different times of the day and in 24-hour collections of urine. They commented that spot

urine specimens might be useful in differentiating between individuals with large differences in

electrolyte excretion. Widdowson and McCance (1970) collected single specimens of urine to study

the excretion of urinary electrolytes by young children in Uganda and Cambridge, United Kingdom,

and concluded that the method was useful for a group, although not necessarily for individuals.

Dauncey and Widdowson (1972) used single urine specimens to estimate electrolyte excretion

individuals in five British towns. In a small validation study in 10 men, they found non-significant

differences in estimated sodium excretion over 24 hours on comparing spot values with those

15

measured in 24-hour urine collections. Na:Cr ratios ranged from 2.1 to 2.9 in four spot urine

collections over a 24-hour period.

More recently, in an analysis of the 10 079 men and women from 52 population samples of the

INTERSALT Study, Elliott et al. (1992) found the ratio of sodium to creatinine assessed by spot urine

to be positively correlated with sodium excretion from an independent 24-hour collection (r = 0.82

between population samples and r = 0.37 between individuals). Khaw et al. (2004) reported similar

estimates of mean sodium excretion based on spot urines and repeated 24-hour urine collections.

Novel markers of sodium intake

Other methods to determine sodium intake have been investigated.

a. Chloride titrator stick. Pietinen et al. (1976) demonstrated good correlations between chloride

excretion estimated using a chloride titrator stick from 24-hour or overnight urine samples, and sodium

excretion in 19 adults. The correlation of mean chloride and sodium excretion from three 24-hour urine

collections was 0.87. Correlations on individual days ranged from 0.72 to 0.92, while the correlation

from three overnight urine collections was 0.70. The advantage of this method is that chloride

concentration can be estimated rapidly in situ. Sodium chloride is not however the only potential

source of chloride, and the authors noted that estimates may be biased for individuals consuming

potassium chloride or alkalizers. Though there has long been interest in this method (Sloan, Beevers

& Baxter, 1984; Tochikubo et al., 1986, Minetti et al., 1992; Brungel, Kluthe & Furst, 2001), the titrator

stick has a relatively narrow calibration range (Brungel, Kluthe & Furst, 2001) and is probably not

precise enough for dietary surveys of sodium intake, nor for monitoring changes in population sodium

intakes.

b. Other methods. These include, for example sodium content in human hair (Sasaki, 1979) and

salivary sodium concentrations (Farleigh, Shepherd & Land, 1985). Although these methods have

been investigated in preliminary studies, they are not established for use in population surveys.

Sample size estimates for monitoring 24-hour urinary sodium excretion

Generally samples of the order of 100 people would be sufficient to characterize the group mean with

95% confidence intervals (CI) of +/- 12 mmol/d (+/- 276 mg/d) (i.e. +/-2 SE), assuming a standard

deviation of urinary sodium excretion of about 60 mmol/d (1.38 g/d), or 200 people if means for men

and women are to be estimated separately. Samples of the order of 400 people (800 if men and

women considered separately) would be required to reduce the 95% CI to +/- 6 mmol/d (+/- 138 mg/d)

about the mean, and sample sizes of the order of 1600 people (3200 if men and women considered

separately) to reduce the 95% CI to +/- 3 mmol/d (69 mg/d) about the mean.

Because of the large day-to-day variability in urinary sodium excretion (Liu et al., 1979a) precision

would also be improved to some extent by obtaining more than one 24-hour urine collection from each

individual. For example, for 100 people, each carrying out two 24-hour urinary collections instead of

one, the 95% CI around the mean would be reduced from +/- 12 mmol/d (+/- 276 mg/d) to

16

approximately +/- 10 mmol/d (230 mg/dl), assuming a reliability coefficient for urinary sodium excretion

of 0.38 (Dyer et al., 1994).

Summary

Dietary survey methods tend to underestimate sodium intakes because of problems in characterizing

the sodium content of foods in food tables, the amount of sodium added in cooking and at the table,

and in food eaten away from home. Although many of these problems can be overcome by high

quality survey methodology and detailed information on the sodium content of local foods, there is

general agreement that sodium intakes are best measured via urinary sodium excretion, as in normal

circumstances a high proportion of ingested sodium is excreted via the kidneys. As an example, the

Food Standards Agency in the United Kingdom is embarking on a programme to monitor sodium

intakes in the population through repeated surveys of urinary sodium excretion, to evaluate the

effectiveness of its campaign to lower population sodium intakes (Food Standards Agency, 2006).

Twenty-four hours is the minimum time required to characterize the pattern of urinary excretion for a

given individual. There is evidence to suggest that use of overnight urine collections may result in

biased estimates of sodium excretion. Some studies have suggested that spot (casual) urine samples

may be representative of the sodium intake of the group despite the fluctuations in values for

individuals. As spot urines are readily obtained at low cost they may prove to be of value in monitoring

sodium intakes, particularly in resource-poor settings or where 24-hour urine collections are not

deemed feasible. However, spot urines have not been extensively tested in epidemiological surveys

and further validation would be required. Therefore, despite logistic issues and concerns about

participant compliance and completeness of collections, the 24-hour urine collection currently remains

the method of choice for estimation of sodium intakes of populations. Because of losses through other

routes, 24-hour urine collections will still underestimate intakes by about 10–15%.

Assuming a standard deviation of 24-hour urinary sodium excretion of about 60 mmol/d (1.38 g/d), as

few as 100 individuals from a representative sample, with each participant carrying out a single 24-

hour urine collection, would be sufficient to provide an estimate of sodium intake of a population with

95% CI around the mean of about +/- 12 mmol/d (276 mg/d). Much larger samples may be required for

more precise estimates. Because of the large day-to-day variability in urinary sodium excretion (Liu et

al., 1979a) precision would also be improved to some extent by obtaining more than one 24-hour urine

collection from each individual.

There are no established biochemical techniques to monitor completeness of urine collections in

large-scale population surveys, although the PABA technique has proved of value in smaller-scale

validation surveys. Therefore good survey methodology, preferably with timed start and end of the

urine collection under supervision, is essential to minimize problems of over- and under-collection.

17

4. SODIUM INTAKES IN ADULTS

Sodium intakes of different populations around the world were vividly brought to the attention of the

research community by publication of Louis Dahl’s famous graph in 1960, showing a positive linear

relationship between prevalence of hypertension and mean salt intake across five population groups

(Dahl, 1960). He noted that daily intakes of sodium (salt) varied considerably across population groups

from 4 g salt/d (1.56 g/d, 68 mmol/d sodium) among Alaskan Eskimos to 27 g salt/d (10.6 g/d, 460

mmol/d sodium) in Akita prefecture, north-east Japan (Figure 4). American men had intakes averaging

10 g salt/d (3.91 g/d, 170 mmol/d sodium). He also noted a strong north–south trend in death rates

from stroke in Japan. This coincided with differences in sodium intakes ranging from 14 g salt/d (5.47

g/d, 238 mmol/d sodium) in the south up to the 27 g/d salt (10.6 g/d, 459 mmol/d sodium) in the north-

east region noted above (Figure 5). The extremely high sodium intakes in north-east Japan reflected

the dietary practice of eating rice with miso soup and pickles, and the use of soy sauce as seasoning

(Sasaki, 1962)

Other authors subsequently extended Dahl’s observations on five populations to other population

groups. Perhaps the best known of these reports is by Gleibermann (1973), an anthropologist, who

provided data on sodium intakes of 27 populations across the world. In contrast to Dahl’s use of 24-

hour urinary excretion data to estimate sodium intake, in six of Gleibermann’s populations, the

author’s own estimates of sodium intake (6 g salt/d; 2.35 g/d, 102 mmol/d sodium) were used, while in

a further ten “a quantitative value for mean salt consumption was reported with or without indications

as to how it was calculated” (Gleibermann, 1973).

One of the most comprehensive of these cross-cultural (ecological) studies of salt intakes (in relation

to blood pressure) since those noted above, was reported by Froment, Millon & Gravier (1979) using

published data on sodium (salt) intakes from 28 populations around the world. Data on sodium intake

were mostly based on 24-hour urinary sodium excretion, except in two studies where spot (casual)

urine collections were used. The data are summarized in Figure 6. Reported salt intake varied from

0.06 g/d (23 mg/d, 1 mmol/d sodium) among the Yanomamo Indians of Brazil (Oliver, Cohen & Neel,

1975) to 22.5 g salt/d (8.80 g/d, 383 mmol/d sodium) in the Republic of Korea (Kesteloot et al., 1978)

and the Bahamas (Moser et al., 1959). Nine isolated populations had salt intakes of less than 2 g/d

(782 mg/d, 34 mmol/d sodium). Excluding these nine populations, the modal sodium intake was in the

range 150–199 mmol/d (3.45-4.58 g/d) (Figure 6).

INTERSALT Study

Because of apparent inconsistencies in the epidemiological literature on salt and blood pressure at the

time of the First Advanced Seminar on Cardiovascular Epidemiology in 1982, participants at the

seminar were given the task of devising an international study to investigate the salt–blood pressure

association. This led to the setting up of the INTERSALT study. INTERSALT collected standardized

data on 24-hour urinary excretion of sodium among 10 079 men and women aged 20–59 years from

52 population samples in 32 countries (INTERSALT Co-operative Research Group, 1988; Elliott et al.,

1996). Data collection took place over two years, from 13 January 1985 (Rambugu and Ndori villages,

18

rural Kenya) to 13 January 1987 (Charleroi, Belgium). INTERSALT provides by far the largest set of

standardized data on 24-hour urinary sodium excretion patterns around the world. Eight percent of the

study sample collected two 24-hour urinary collections to estimate within-individual variability of

sodium intakes. As noted in Section 3, to ensure timings of the collection and to guard against either

under- or over-collection, both start and end times of the urine collections were supervised by clinic

staff. Urine collections were rejected if the participant answered that ”more than a few drops” were

missing from the collection, if urinary volume were less than 250 ml, or if the timing of the collection fell

outside the range of 20–28 hours.

Mean 24-hour sodium excretion by age and population sample is shown in Table 5 for men and Table

6 for women. Lowest values of sodium excretion were found among the Yanomamo Indians of Brazil:

0.8 mmol/d (18 mg/d) in men and 1.0 mmol (23 mg/d) in women. Three other remote population

groups had 24-hour urinary sodium excretion at or below 60 mmol/d (1.38 g/d): Xingu Indians of

Brazil, Papua New Guinea Highlanders and the Luo in rural Kenya. Highest values of urinary sodium

excretion were recorded in Tianjin, China, and were 259 mmol/d (5.95 g/d) in men and 233 mmol/d

(5.35 g/d) in women. Sodium excretion values in Nanning in southern China were lower than in the

other two Chinese samples: 177 mmol/d (4.10 g/d) in men and 161 mmol/d (3.70 g/d) in women. The

highest mean urinary sodium excretion in Japan was found in Toyama: 224 mmol/d (5.12 g/d) in men

and 201 mmol/d (4.62 g/d) in women. Values over 200 mmol/d (4.6 g/d) in men were also found in

Canada, Columbia, Hungary, Ladakh (India), Bassiano (Italy), Poland, Portugal and the Republic of

Korea.

The distributions of sample mean 24-hour urinary sodium excretion values in men and women in

INTERSALT are summarized in Figure 7. Men had higher values of urinary sodium excretion than

women. Most of the populations had 24-hour urinary sodium excretion in the range 100–250 mmol/d

(2.30–5.75 g/d) for men and 100–200 mmol/d (2.30–4.60 g/d) for women. The modal value was 150–

199 mmol/d (3.45–4.58 g/d) for men and 100–149 mmol/d (2.30–3.43 g/d) for women. Compared with

the data summarized by Froment, Milon & Gravier (1979) (Figure 6), the values of urinary sodium

excretion across populations in INTERSALT were shifted toward the left, from the very high values

recorded previously in Japan and some other countries.

INTERMAP Study

The INTERMAP Study of macro- and micronutrients and blood pressure (Stamler, 2003a) included

men and women, aged 40–59 years, from 17 randomly selected population samples in China (3

samples), Japan (4 samples), United Kingdom (2 samples), and USA (8 samples). Each participant

had two study visits on consecutive days, with two additional study visits on consecutive days 3–6

weeks later. In addition to blood pressure, measurements included dietary intake based on four

multiple-pass 24-hour dietary recalls (one at each study visit) (Dennis et al. 2003; Stamler et al.,

2003a). All foods and beverages consumed in the previous 24 hours, including dietary supplements,

were recorded. Two 24-hour urine samples, started at the research centre (on the first and third study

visits) and completed the next day, were obtained from each participant using the methods developed

in INTERSALT (Elliott & Stamler, 1988). Quality control was extensive, with local, national, and

19

international checks on the completeness and integrity of non-dietary and dietary information (Dennis

et al. 2003; Stamler et al., 2003a). In the USA, dietary data were entered directly into a computerized

database (Nutrition Data System, version 2.91; University of Minnesota, Minneapolis). This system

contains information on the nutrient composition of 17 000 foods, beverages, ingredients, and

supplements. In the other countries, data were entered onto standard forms, coded, and

computerized. Nutrient intake was calculated using country-specific food tables, which were

standardized for consistency across countries (Schakel et al., 2003). Individuals were excluded if (inter

alia) diet data were considered unreliable, calorie intake from any 24-hour dietary recall was less than

500 kcal/d (2100 kJ/d) or was greater than 5000 kcal/d (21 000 kJ/d) for women or greater than 8000

kcal/d (33 600 kJ/d) for men, or if two complete urine samples were not obtained.

Results for urinary sodium excretion estimated from the two 24-hour urinary collections and sodium

intake from the four 24-hour dietary recalls per person, by age and population sample, have been

published by Stamler (2003b) and are summarized in Figure 3. As noted in section 3, the data on 24-

hour urinary sodium excretion and sodium intakes estimated from the 24-hour recalls are comparable

except in China, where much higher values were found from the urine. As in INTERSALT, the highest

mean values of urinary sodium excretion were found in China, ranging up to 299 mmol/d (6.88 g/d) in

men and 253 mmol/d (5.82 g/d) in women in the Beijing sample, northern China. As in INTERSALT,

urinary sodium excretion in southern China (Guangxi) was much lower: 150 mmol/d (3.45 g/d) in men

and 128 mmol/d (2.94 g/d) in women (Zhao et al., 2004) and for this reason results for north and south

China are shown separately in Figure 3. In the USA, mean 24-hour urinary sodium excretion for the

eight samples were all in the range 180–190 mmol/d (4.14–4.37 g/d) for men and ca. 130–150 mmol/d

(2.99–3.45 g/d) for women. For the four Japanese samples, mean 24-hour urinary sodium excretion

ranged from 195–220 mmol/d (4.49–5.06 g/d) in men and ca. 160–200 mmol/d (3.68–4.60 g/d) in

women. Averaged 24-hour urinary excretion values for sodium in the two United Kingdom samples

were 161 mmol/d (3.70 g/d) in men and 127 mmol/d (2.92 g/d) in women.

Figure 8 shows the within-population sample distributions of 24-hour urinary sodium excretion for men

and women among each of the four countries in INTERMAP (with north and south China separately

identified). The vast majority of people in each of the countries had urinary sodium excretion > 100

mmol/d (2.30 g/d), and few had values < 70 mmol/d (1.61 g/d). Note that because of the large day-to-

day variability in urinary sodium excretion (Liu et al., 1979a), especially among the developed

countries, the standard deviation in urinary sodium is inflated by approximately 60% (i.e. [1/√(reliability

coefficient) – 1] x100%) so that even fewer people had ‘true’ urinary sodium excretion below these

values.

Other studies published since 1988

Table 7 lists studies published since 1988 giving data on sodium intakes or urinary excretion from

different countries around the world. It includes 22 reports from 17 countries on six continents. (Data

from two large national surveys of sodium intake in the USA are shown separately in Figure 9).

Intakes of less than 100 mmol/d (2.30 g/d) were reported in China (Province of Taiwan) (Liu & Chung,

1992), Samoa (Galanis et al., 1999), Spain (Schroder, Schmelz & Marrugat, 2002), Uganda and the

20

United Republic of Tanzania (Pavan et al., 1997), and Venezuela (Negretti de Bratter et al., 1998), but

these reports were based on a variety of methods including dietary recall, unspecified questionnaire

methods and duplicate diets, and none relied on 24-hour urine collections – the validity of these

estimates is therefore open to question. In addition, intakes of less than 100 mmol/d (2.30 g/d) were

recorded in South Africa from 24-hour recall data, but analysis of data obtained from concomitant 24-

hour urine collections gave urinary sodium excretion estimates ranging from 135–165 mmol/d (3.11–

3.80 g/d) (Charlton et al., 2005). Studies in China gave urinary sodium excretion estimates ranging

from 174–254 mmol/d (4.00–5.84 g/d) based on a single 24-hour urine collection (Liu et al., 2001), and

up to 4.84 g/d (210 mmol/d) based on a food frequency questionnaire (Woo et al., 1998).

In the third National Health and Nutrition Survey (NHANES III) in the USA, only about 10% or less of

adult men and 20–30% of adult women under 60 years of age were reported to consume less than

100 mmol/d (2.30 g/d) sodium (Loria, Obarzanek & Ernst, 2001).

Variation by sex and age

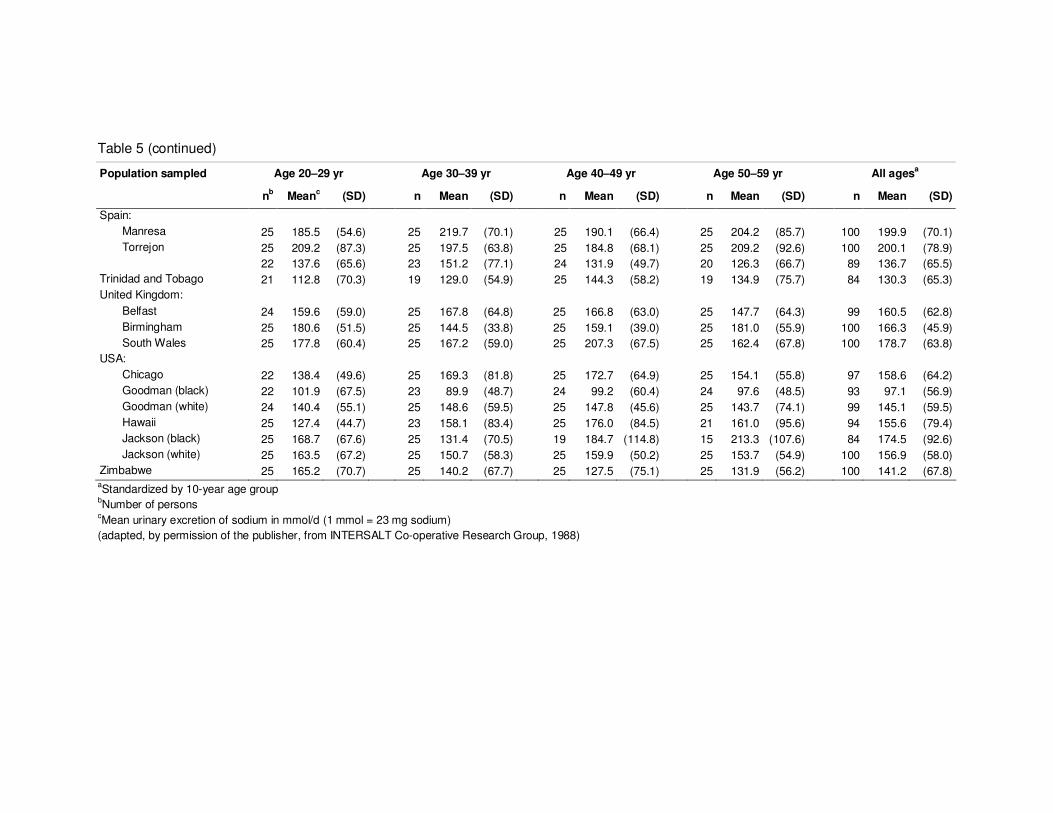
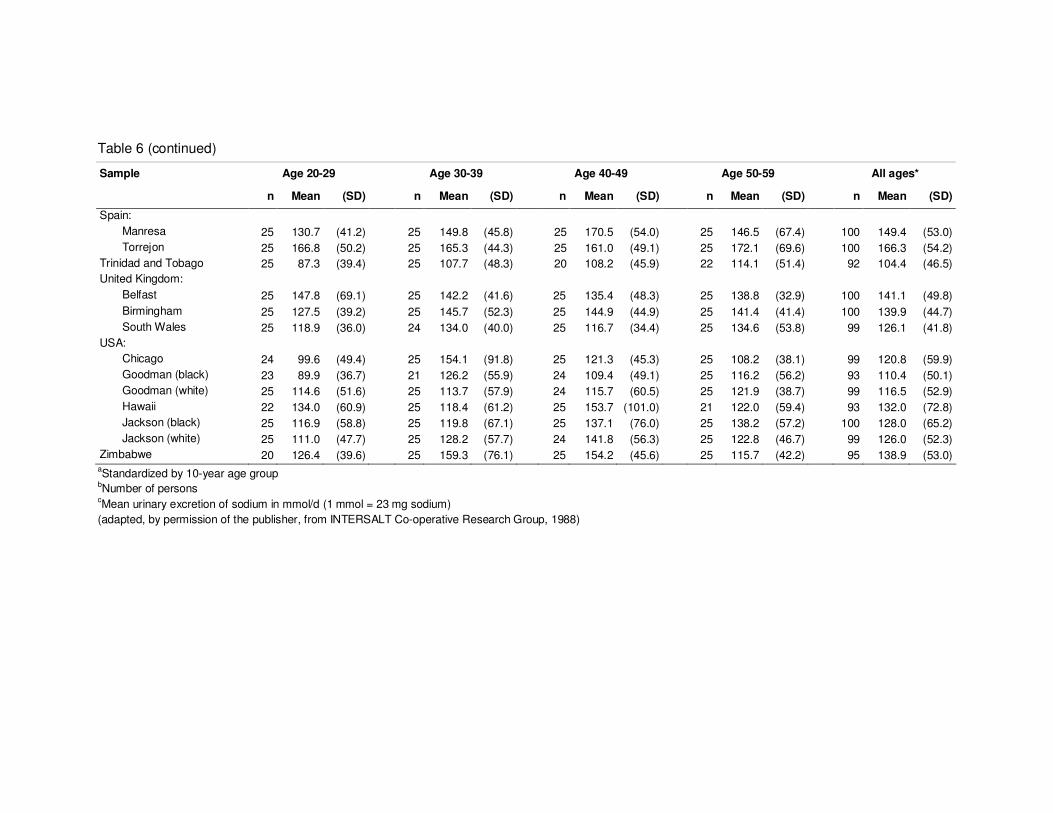
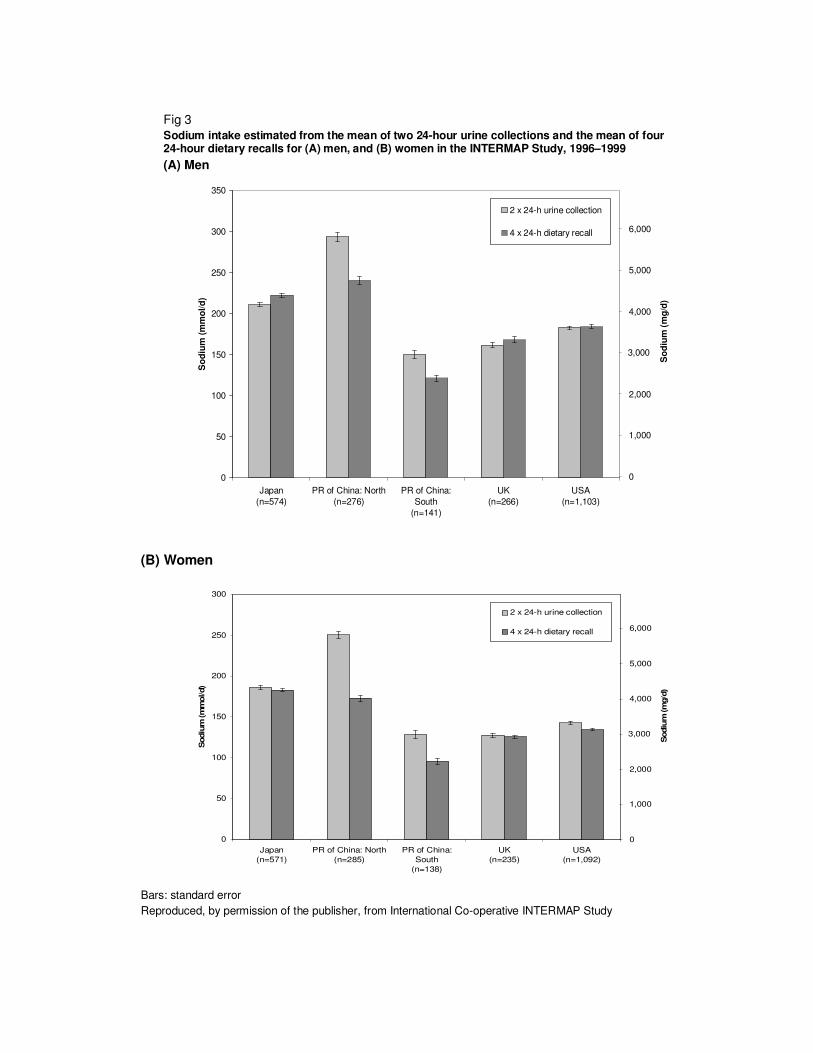
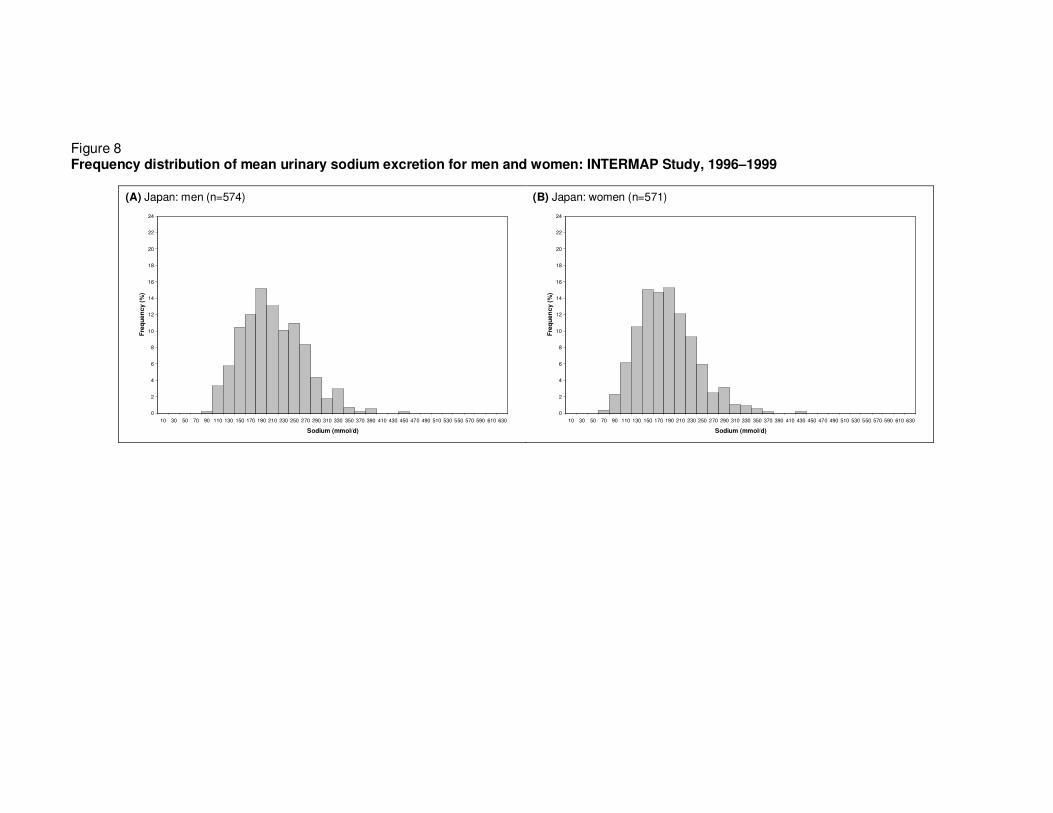
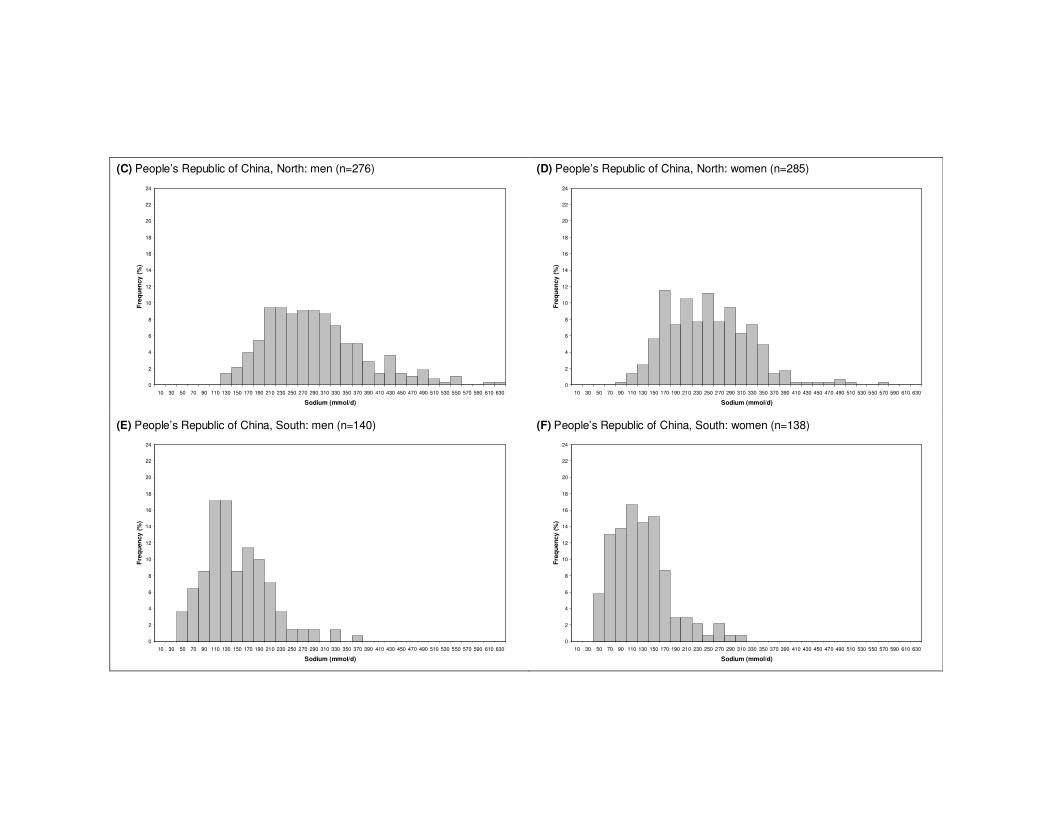
As already noted, sodium intakes in men are higher than in women (Tables 5 and 6, Figures 2, 3, 7, 8,

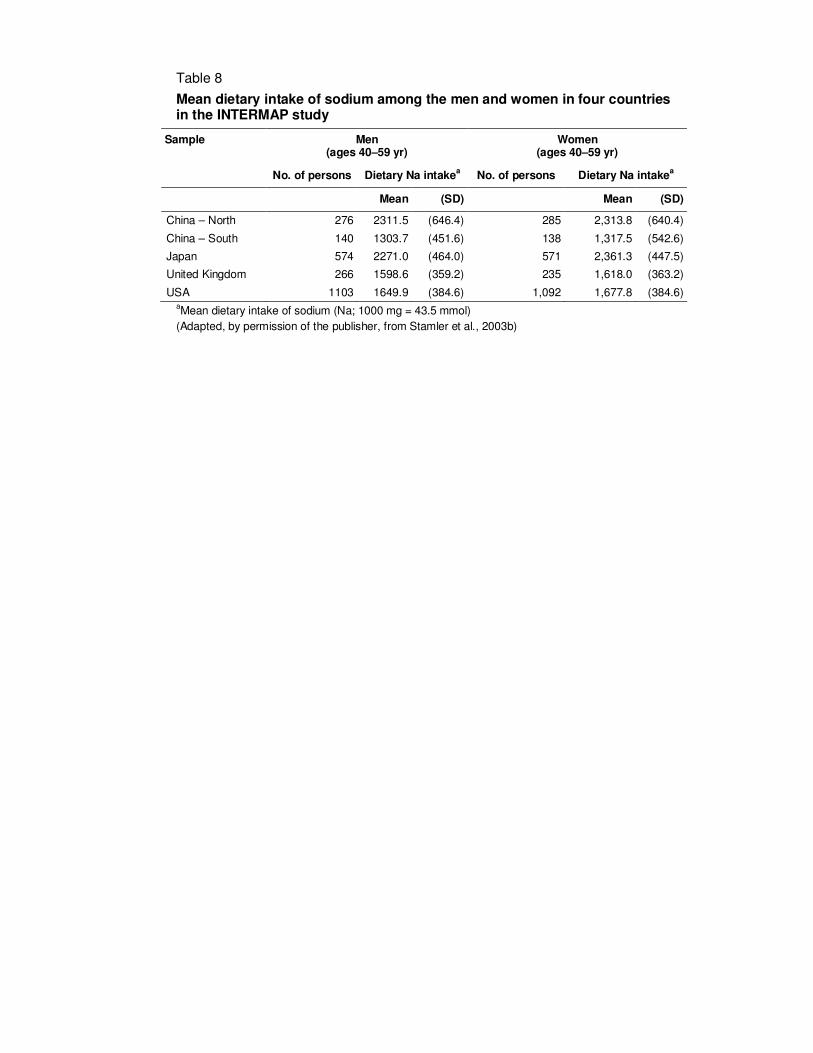
9), but this to large extent reflects differences in energy intake. Table 8 shows INTERMAP data on

sodium adjusted for energy (mg/1000 kcal) in each of the four countries (northern and southern China

shown separately). When sodium intake was adjusted for energy, the values in women were slightly

higher than those in men. There are also apparent trends of decreasing sodium intakes at older ages.

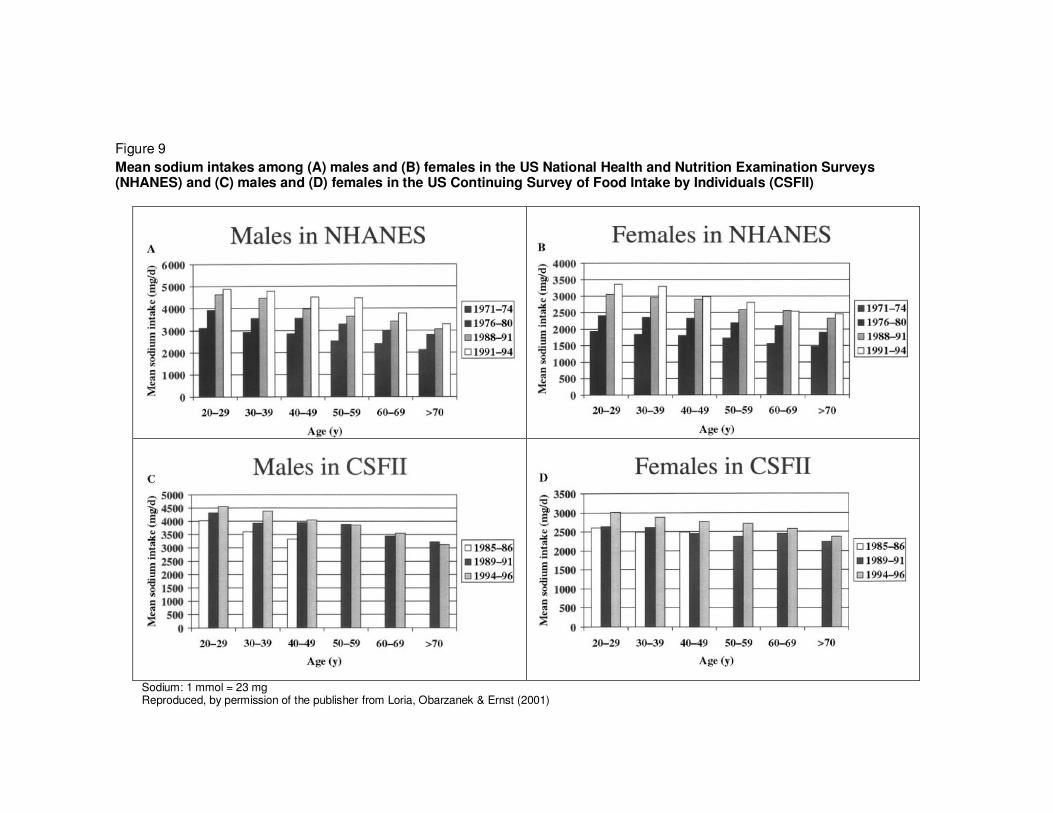
Figure 9 shows data by age, sex and over time for two large surveys in the USA: NHANES and the US

Continuing Survey of Food Intake by Individuals (CSFII). For each survey and in both sexes, there is

an apparent decline in sodium intakes after the age of about 50 years. A small decline in sodium

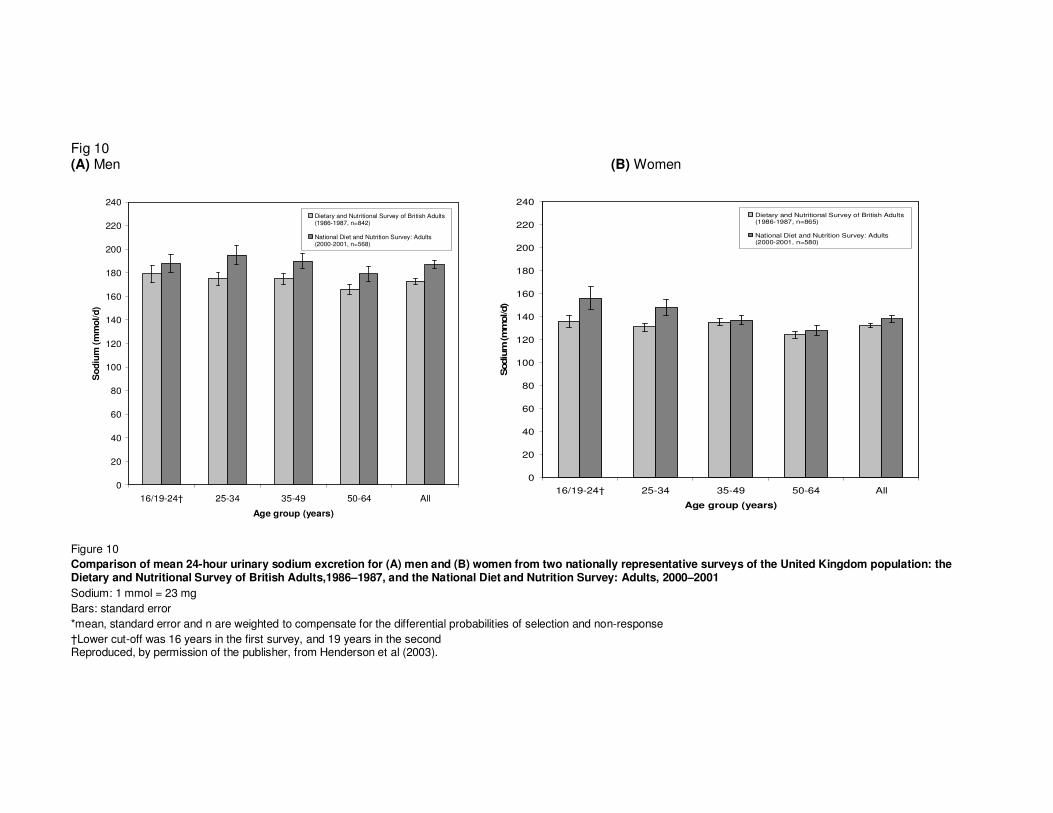
intakes after the age of about 50 years is also apparent in the United Kingdom, based on data from

the Dietary and Nutritional Survey of British Adults (1986–1987) and the National Diet and Nutrition

Survey (2000–2001) (Figure 10). Whether these data reflect real differences (e.g. a cohort effect) or

possible bias such as differential underreporting at older ages is unknown.

Trends over time

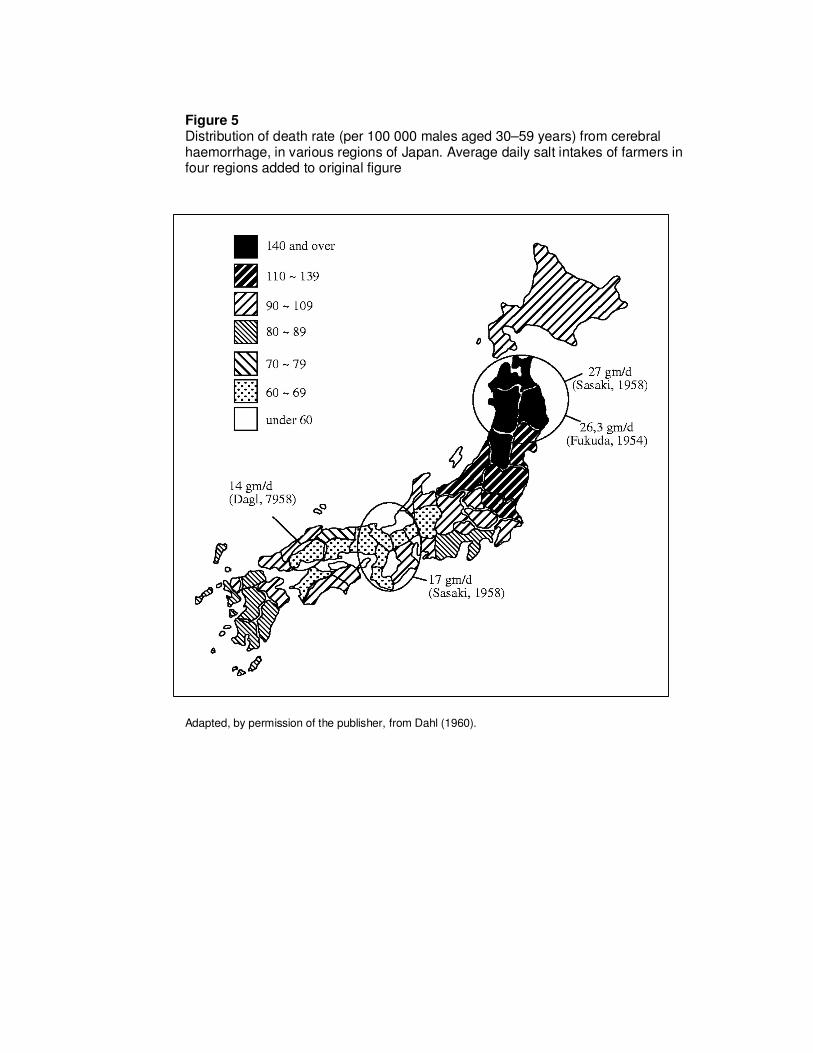
Following public health campaigns in Japan to lower sodium intake in the population (Sasaki, 1980),

the very high sodium intakes that were recorded in northern Japan in the 1950s and early 1960s

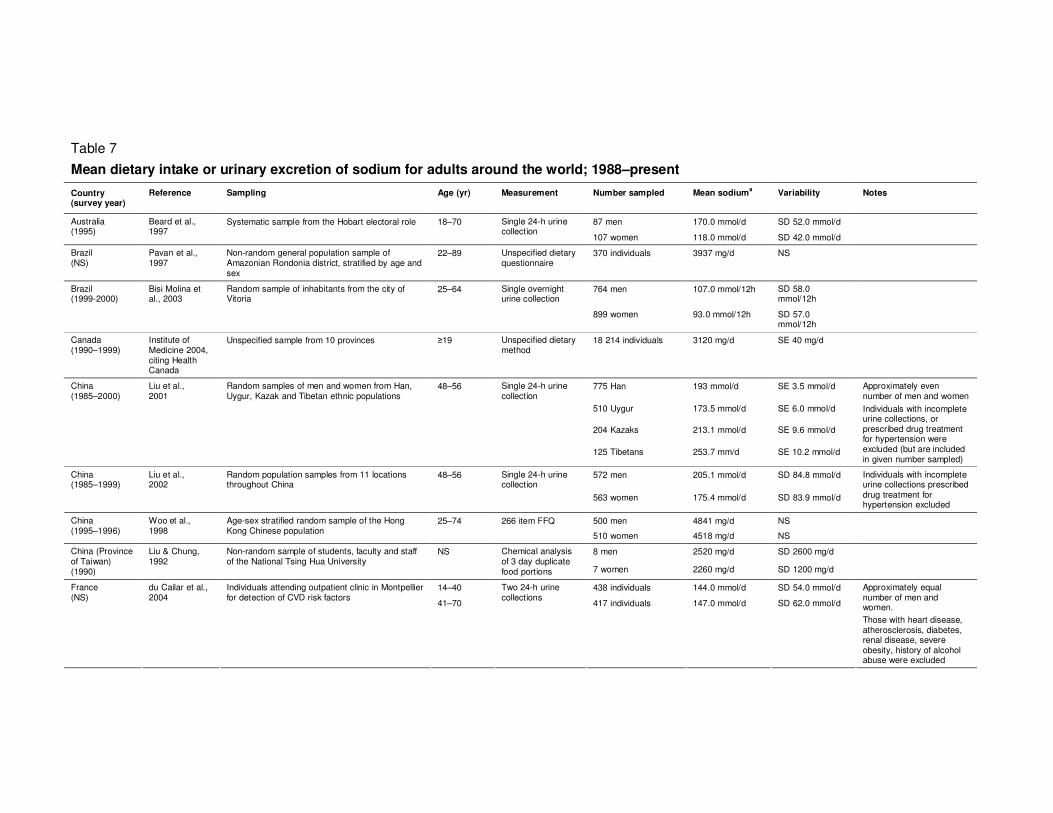
(Figure 5) were not found in the INTERSALT and INTERMAP studies nor in other studies (Table 7).

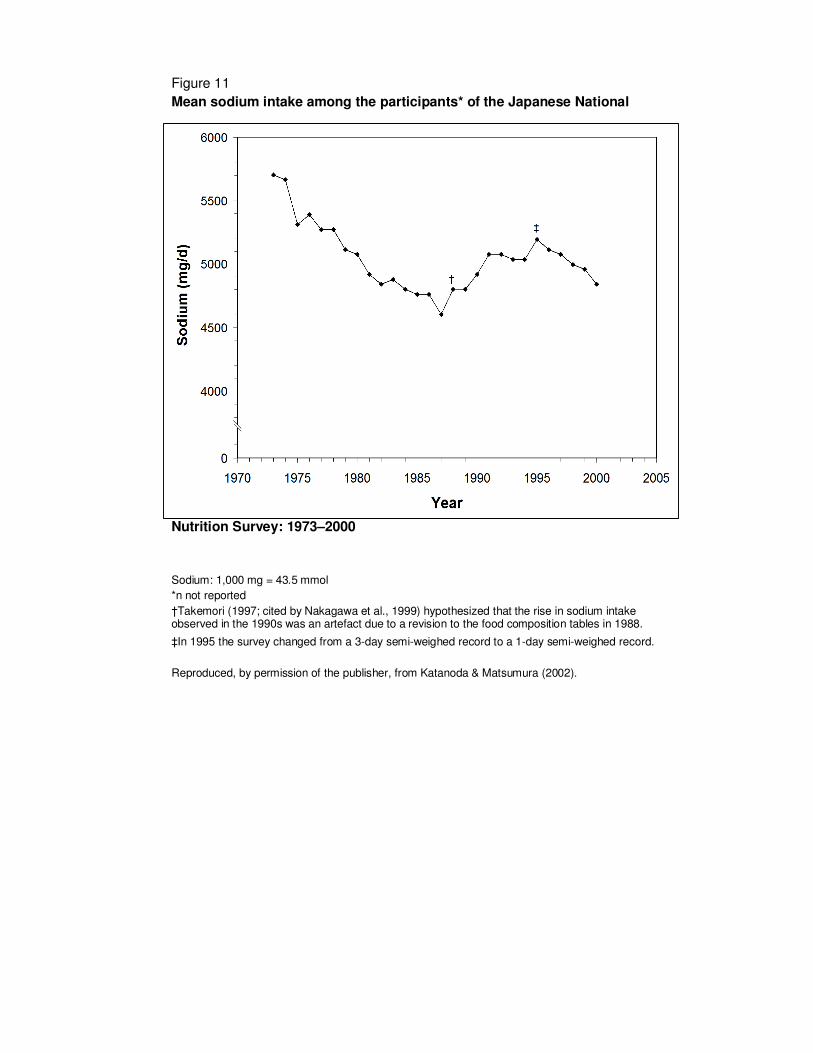
Data from the Japanese National Nutrition Survey (Figure 11) suggest that a fall in mean daily sodium

intake in Japan continued from 1973 to around the mid-1980s, after which there was a levelling off or

even a rise. However, methodological differences in survey techniques, and an apparent rise and fall

in reported energy intakes over the same period, complicate interpretation (Katanoda & Matsumura,

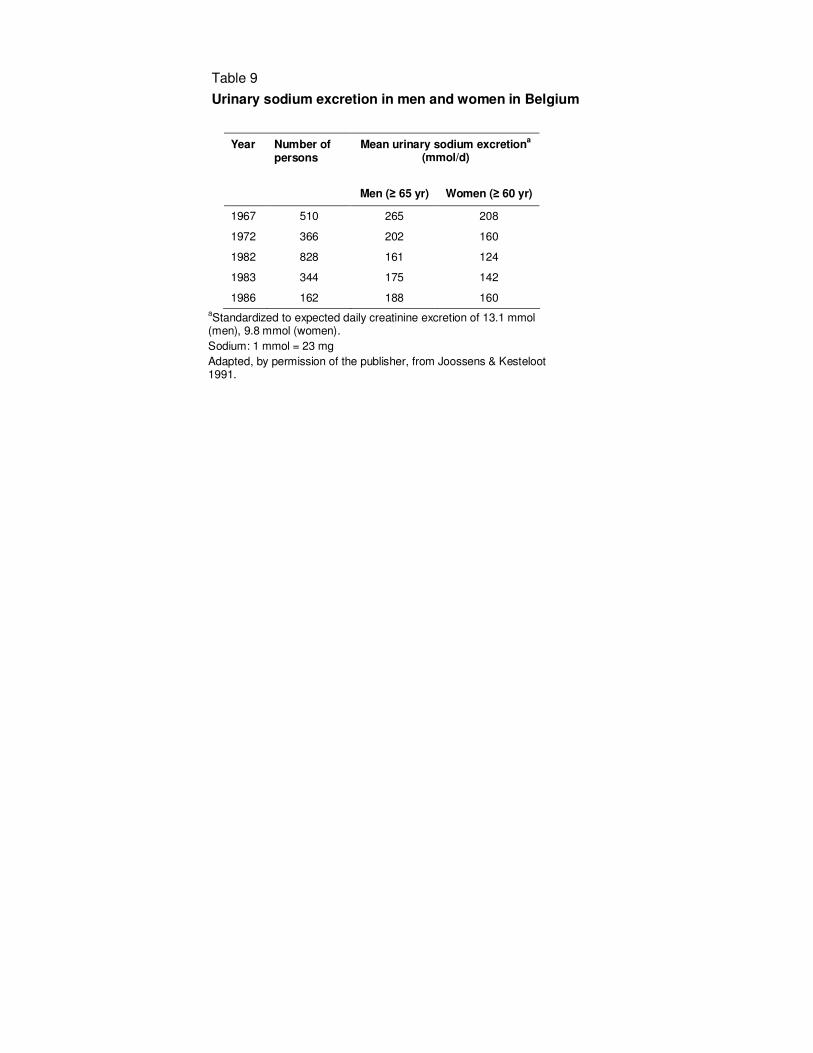
2002). In Belgium, where the amount of sodium in bread was reduced from the mid-1960s to the early

1980s (Joossens, Sasaki & Kesteloot, 1994), 24-hour urinary sodium excretion declined over the

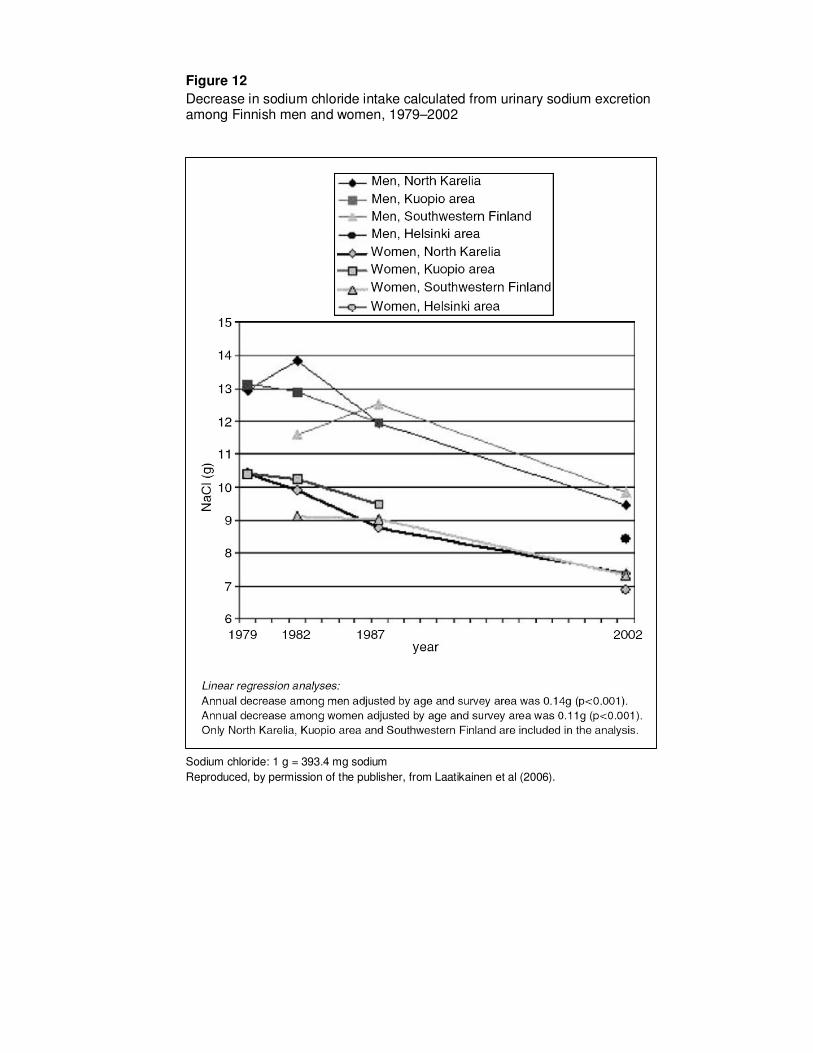
same period (Table 9). In Finland, where there has been a comprehensive public health campaign to

reduce cardiovascular disease, marked reductions in salt intake (as estimated from 24-hour urine

collections in repeated surveys) were documented over a 23-year period (Figure 12) (Laatikainen et

al., 2006).

21

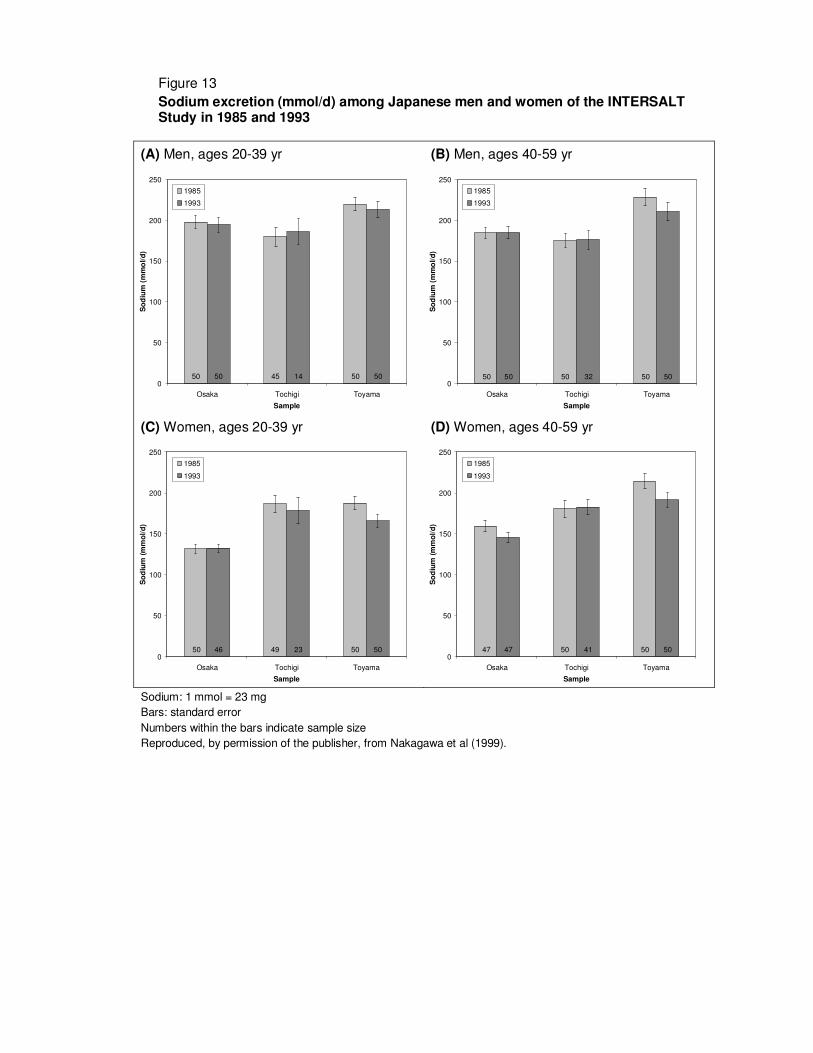
The Japanese data showing no recent declines in sodium intake are consistent with findings from the

INTERSALT and INTERMAP studies. The Japanese INTERSALT participants were re-contacted after

eight years and a further 24-hour urine collection was obtained. Other than a small reduction in

Toyama, there was little difference in mean 24-hour urinary sodium excretion across the two periods

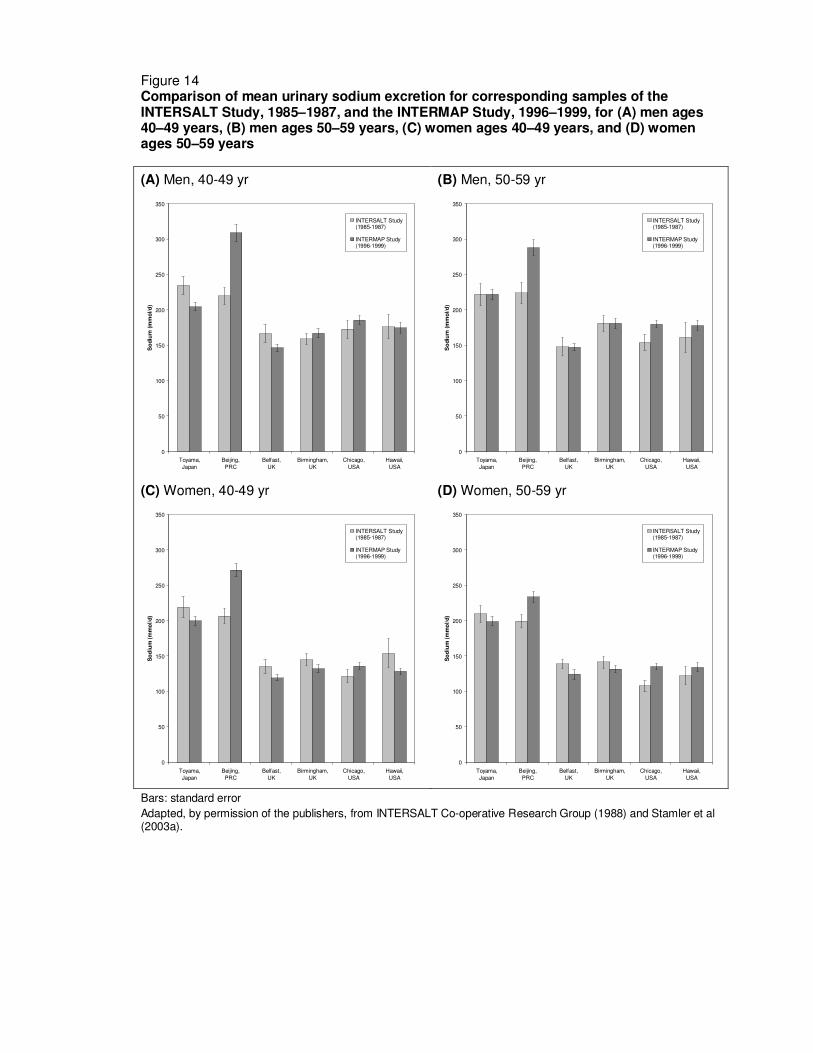
(Figure 13). Comparison of INTERSALT and INTERMAP findings, some 15 years apart, in populations

(though not individuals) that were included in both studies, shows generally small differences between

the two periods, except in Beijing, China, where sodium excretion is higher in the later study

(INTERMAP) (Figure 14).

The NHANES surveys in the USA reported successively higher sodium intakes in consecutive surveys

from 1971–74 to 1991–94, while the CSFII surveys reported unchanged or higher sodium intakes from

1985–86 to 1994–96 (Figure 9); to some extent these apparent increases might reflect methodological

differences between the surveys (Loria, Obarzanek & Ernst, 2001). Market research panel surveys

based on 14-day food diaries recorded little change in mean sodium intakes among adults aged ≥ 19

years over four repeated surveys between 1980–82 and 1990–92 (Engstrom, Tobelmann & Albertson,

1997). In the United Kingdom, there was an apparent small increase in mean 24-hour urinary sodium

excretion between two national diet surveys 15 years apart (Figure 10) (Henderson et al., 2003).

Summary

The extremely high sodium intakes recorded in some regions, notably northern Japan, in the late

1950s and early 1960s, are no longer apparent. These declines in sodium intakes coincided with

public health awareness campaigns about the dangers associated with a high salt intake. More recent

data from Japan and other countries suggest that salt intakes are no longer falling and may be on the

rise, nor do there appear to be populations with the low sodium intakes previously found, including in

the INTERSALT study. More recent data suggest that most populations appear to have mean sodium

intakes well in excess of 100 mmol/d (2.30 g/d), and in many (especially the Asian countries) in excess

of 200 mmol/d (4.60 g/d). Sodium intakes in men are greater than those in women, most likely

reflecting the higher food consumption (energy intake) among men. Sodium intake in adults appears

to be slightly lower above the age of 50 years than at younger ages.

An intake of 65 mmol/d (1500 mg/d) has been recommended as adequate intake (AI) in the USA to

ensure that the diet provides adequate intakes of other nutrients, and to cover sodium sweat losses in

unacclimatized individuals who are exposed to high temperatures, or who are physically active

(Institute of Medicine, 2004). The current data suggest that the vast majority of individuals have

sodium intakes well in excess of this level.

22

5. SODIUM INTAKES IN CHILDREN AND YOUNG PEOPLE

Fewer data are available on sodium intake in children and young people than in adults, and these are

mainly limited to the developed nations of Europe and North America (Simons-Morton & Obarzanek,

1997; Lambert et al., 2004). One reason may be the serious methodological difficulties in obtaining

complete and valid dietary data for children (Livingstone, Robson & Wallace, 2004). For younger

children, diet diaries are often kept by the parents, while older children or adolescents may keep their

own records, under the supervision of their parents and/or the researchers (Yamauchi et al., 1994).

Urinary collections are practicable only among older children, and because of the relative ease of

collection for boys compared to girls, urinary sodium excretion estimates from girls are

underrepresented in the literature (Simons-Morton & Obarzanek, 1997).

We focus here on recent reviews of observational studies of diet and blood pressure in children

(Simons-Morton & Obarzanek, 1997) and of dietary surveys among European children (Lambert et al.,

2004). The former study includes only English language publications from peer-reviewed journals,

while the latter comprises a combination of peer-reviewed articles and survey reports, many of which

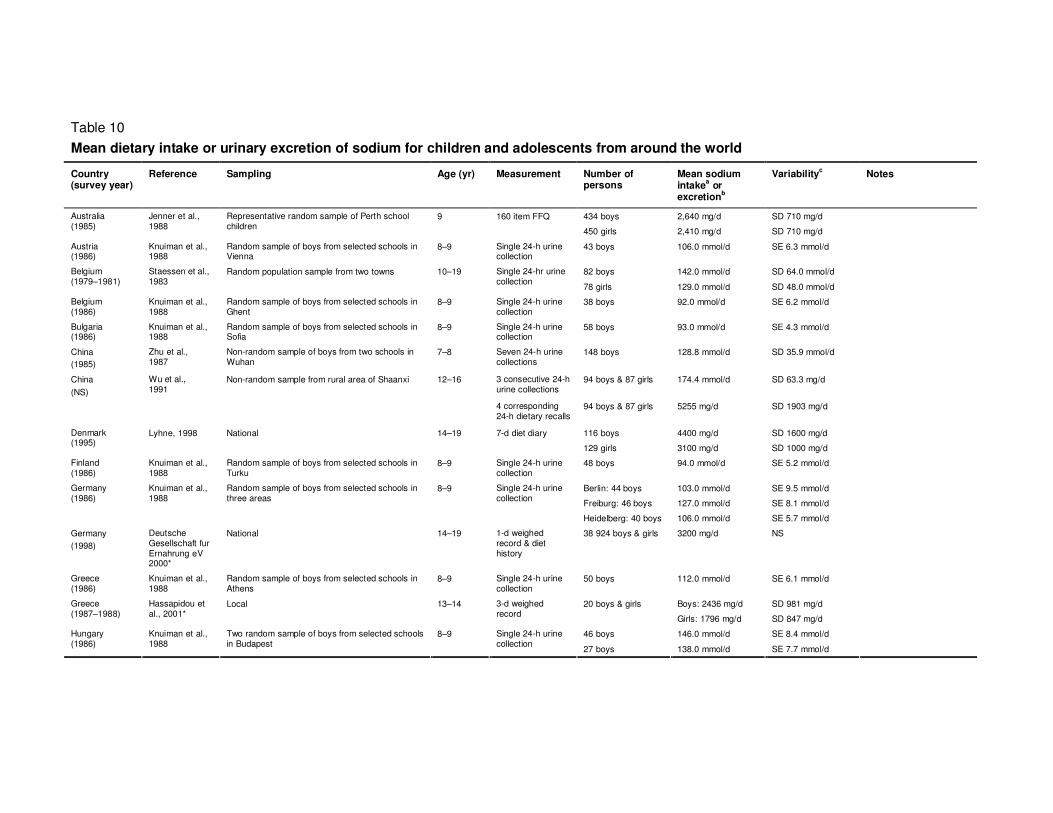
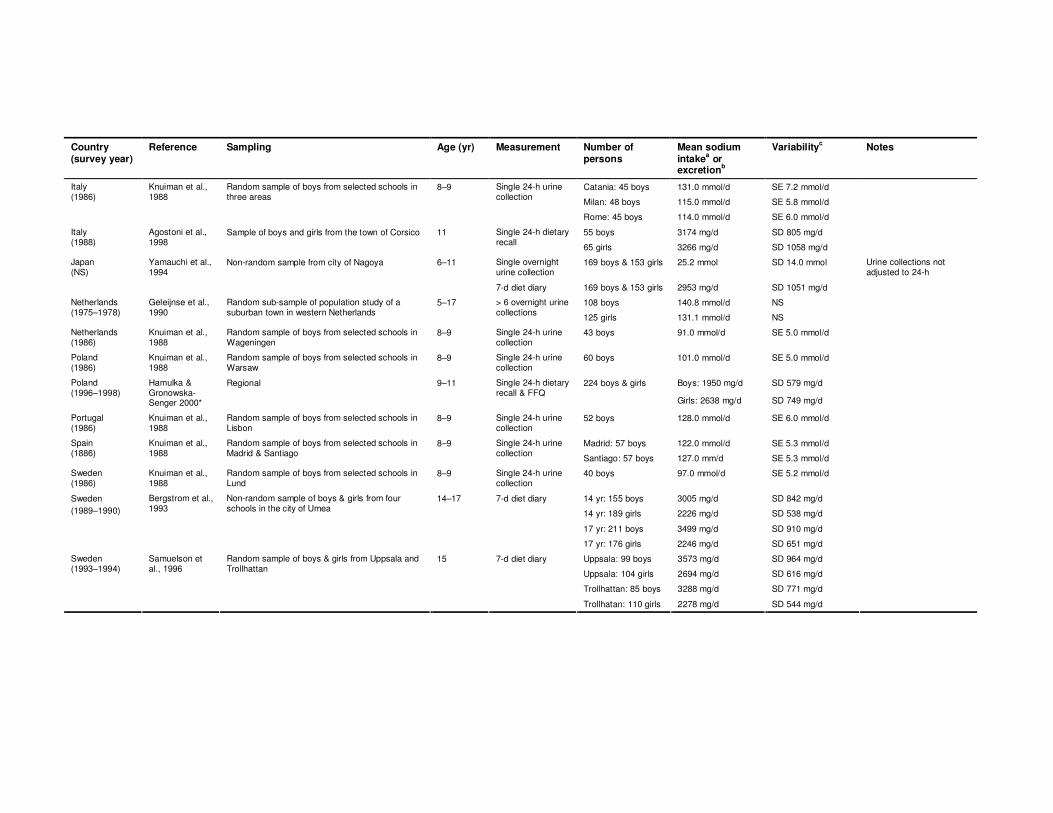
are in the local language. These studies are summarized in Table 10.

Sample sizes ranged from n = 20 to n = 38 924 (median n = 202.5). Four of the 26 studies (in

Denmark, Germany and two United Kingdom studies) were of nationally representative samples. The

remainder were sampled variously from regions, cities, schools and social groups; most were non-

random samples. The most commonly used methods for estimating sodium intake were one or more

24-hour urine collections (nine studies) and three or more days of diet diary (six studies). Overnight

urine collections and weighed records were also used (four studies each).

In the two studies which allow comparison of 24-hour urinary excretion and dietary estimates of intake,

the findings were contradictory. The dietary estimate was higher than the urinary estimate by c. 1.3 g/d

(56 mmol/d) in schoolchildren in China (Wu et al., 1991), while in children in the USA, the urinary

estimate was higher by c. 17 mmol/d (390 mg/d) (Faust et al., 1982).

The highest mean dietary sodium intake and urinary sodium excretion were reported from China in

boys and girls aged 12–16 years: estimated dietary intake was 5.26 g/d (229 mmol/d) and urinary

excretion 174 mmol/d (4.01 g/d) (Wu et al., 1991). The intake of boys (14-19 years) in Denmark was

also high: mean 4.40 g/d (191 mmol/d) (Lyhne, 1998). Estimated urinary sodium excretion was >140

mmol/d (>3.22 g/d) among boys from Belgium (Staessen et al, 1983), Hungary (Knuiman et al., 1988),

Netherlands (Geleijnse, Grobbee & Hofman, 1990) and USA (Cooper et al., 1980), and black boys

and girls from Tennessee, USA (Harshfield et al., 1991).

Dietary sodium intakes < 2.00 g/d (87 mmol/d) were reported for girls (13–14 years) in Greece

(Hassipidou & Fotiadou, 2001), boys (9–11 years) in Poland (Hamulka & Gronowska-Senger, 2000)

and boys and girls (< 18 years) in USA (Faust, 1982). The lowest mean intake was observed in the

23

youngest group comprising children aged 1.5–4.5 years from the United Kingdom: 1.53 g/d (67

mmol/d) and 1.48 g/d (64 mmol/d) for boys and girls respectively (Gregory et al., 1995).

Twenty-four hour urinary sodium excretion < 100 mmol/d (2.30 g/d) was reported from five countries

that participated in a European-wide study among boys aged 8–9 years (Belgium, Bulgaria, Finland,

Netherlands and Sweden ) (Knuiman et al., 1988) and among white girls (14–18 years) from Missouri,

USA.

Variation by sex, age and ethnic group

Where comparable data were available, sodium intake tended to be higher among boys than girls by

c. 500 mg/d (20 mmol/d) on average. Two samples from Italy were exceptions; mean intakes were

higher among girls than boys by c. 100 mg/d (4 mmol/d) and 700 mg/d (30 mmol/d) (Hamulka &

Gronowska-Senger, 2000).

Mean dietary sodium intake and mean urinary sodium excretion appeared to increase with age. Based

on data in Table 10, a regression of mean sodium intake or excretion on age indicated dietary sodium

intake higher by c. 100 mg/d (4 mmol/d) per year of age, and mean urinary sodium excretion higher by

2.5 mmol/d (60 mg/d) per year. Age-specific data on sodium intake of children in the USA from

NHANES III are shown in Table 11. Estimated sodium intakes were two to three times higher after the

first year of life, and for boys (but not girls) were higher at ages 14–18 than 9–13 years. Data on salt

intake by age from the 1992–1993 United Kingdom National Diet and Dentition Survey of children

aged 1.5–4.5 years, and the 1997 United Kingdom National Diet and Nutrition Survey of young people

aged 4–18 years, are shown in Figure 15. Estimated salt intake was above dietary targets for boys at

every age and girls < 11 years. It was higher for each successive age group among both boys and

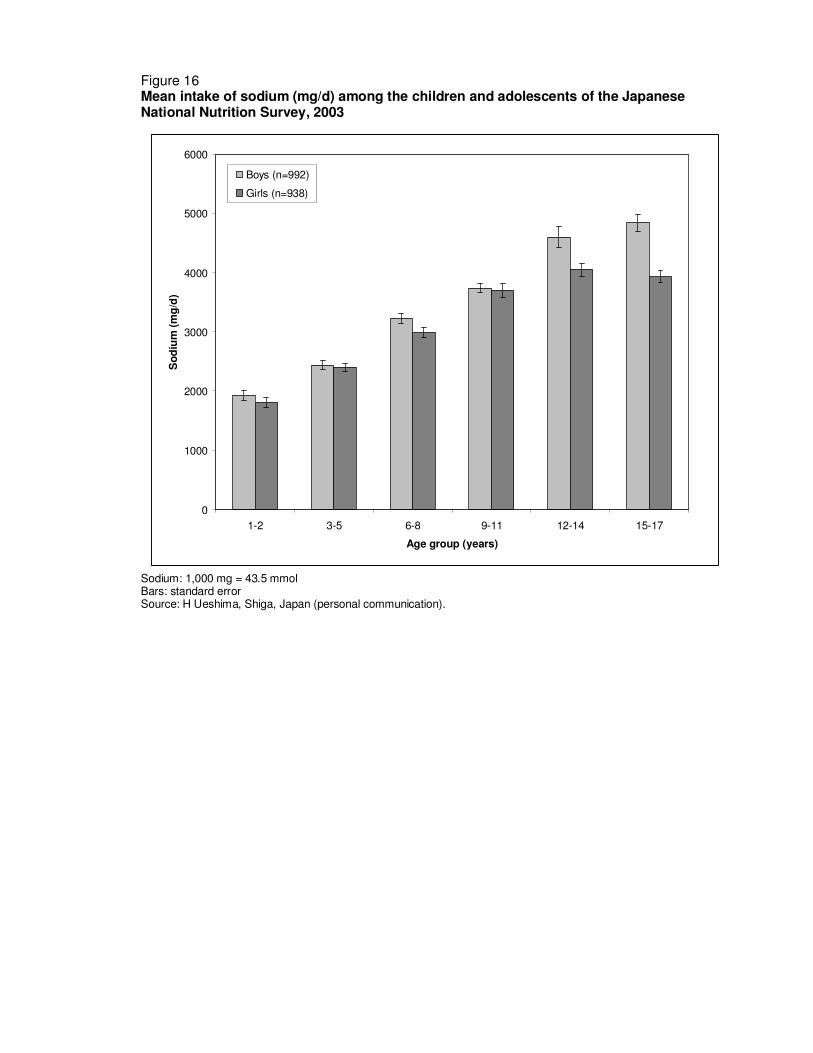
girls – reaching about 8.2 g/d salt (3.23 g/d, 140 mmol/d sodium) for boys aged 15–18 years. Data

from the 2003 Japanese National Nutrition Survey also indicate higher sodium intakes with increasing

age among children and young people (Figure 16).

The observed trends by age and sex are likely to reflect differences in total food consumption as well

as differences in food choices.

Estimates from several of the studies from the USA suggest that black children consume more sodium

than their white peers (Cooper et al., 1980; Watson et al., 1980; Harshfield et al., 1991; Simon et al.,

1994). Overall, mean urinary sodium excretion was c. 16 mmol/d (370 mg/d) higher in black than white

children.

Summary

Data on sodium intakes of children and young people are limited. Those available suggest intakes are

higher in boys than girls and increase with age (and are substantially lower in the first year of life).

Sodium intakes appear to be higher among black than white children in the USA. There are serious

methodological concerns about the completeness and validity of both dietary and urinary data in this

age group.

24

6. SOURCES OF DIETARY SODIUM

In developed country diets, a large proportion of the sodium ingested is added (as sodium chloride) in

food manufacture and foods eaten away from the home. James, Ralph & Sanchez-Castillo (1987) and

Mattes & Donnelly (1991) estimated that for the United Kingdom and USA, about 75% of sodium

intake was from processed or restaurant foods, 10–12% was naturally occurring in foods and the

remaining 10–15% was from the discretionary use of salt in home-cooking or at the table.

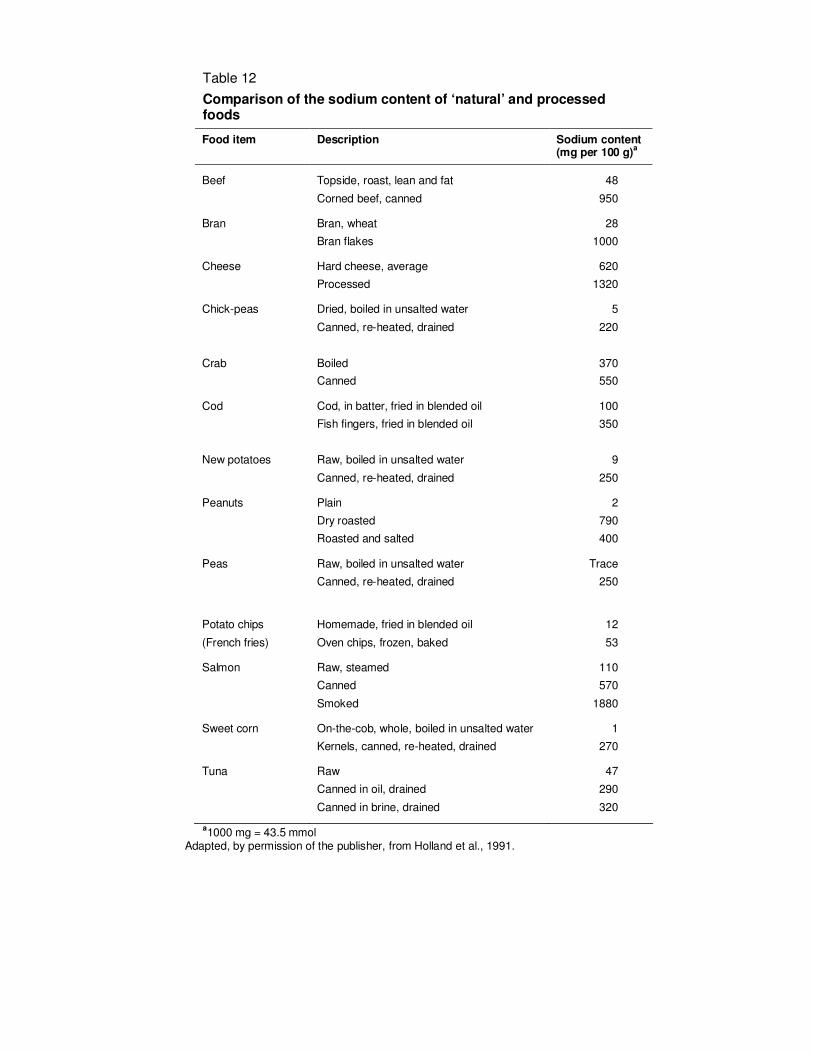
Figure 17 illustrates the difference in sodium content of two typical developed-country meals,

comparing a takeaway or manufactured meal with a home-cooked meal without added salt. Sodium

content of a takeaway cheeseburger and chips (French fries) is estimated at 1240 mg (54 mmol)

compared with homemade steak and chips at 92 mg (4 mmol); sodium content of a ‘ready-meal’

risotto is estimated at 1200 mg (52 mmol), while that of its homemade equivalent at < 2 mg (< 0.1

mmol). Table 12 lists the sodium content of a number of foods in their natural state and after

processing. In some cases, for example chick peas, sweetcorn and peas, which have a naturally very

low sodium content, food processing increases the sodium content by 10–100-fold; and foods such as

corned beef, bran flakes or smoked salmon, have sodium intakes of 1–2%, equivalent to, or more

than, the sodium concentration of Atlantic seawater (MacGregor & de Wardener, 1998).

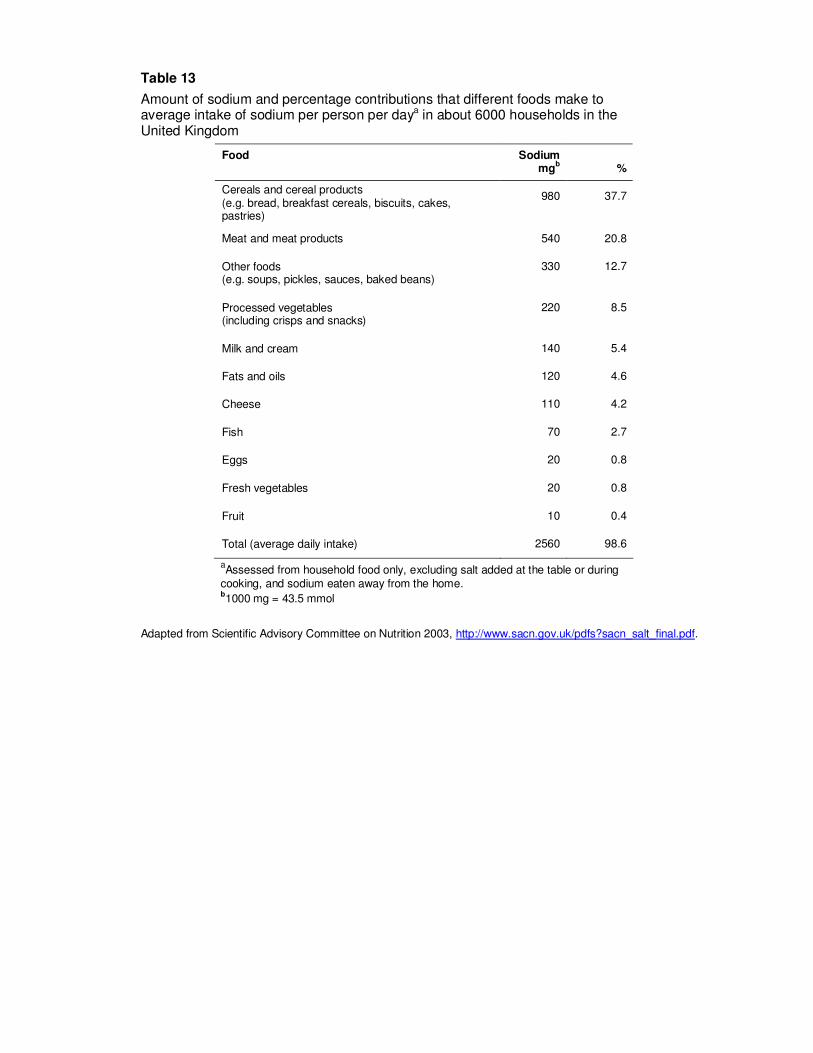
Table 13 lists the foods that contribute the largest proportions of sodium to the diet in the United

Kingdom, based on National Food Survey data for 2000. Cereals and cereal products including bread,

breakfast cereals, biscuits and cakes, contribute about 38% of estimated total intake, meat and meat

products 21%, and other foods such as soups, pickles, sauces and baked beans a further 13%.

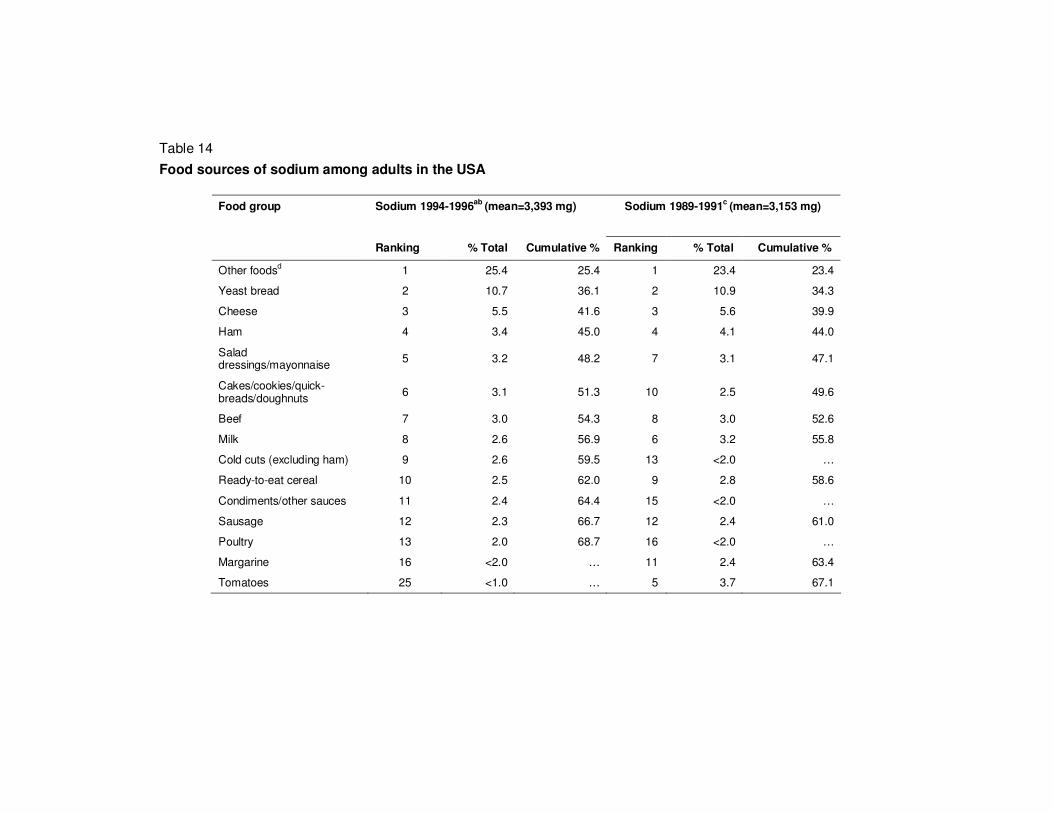
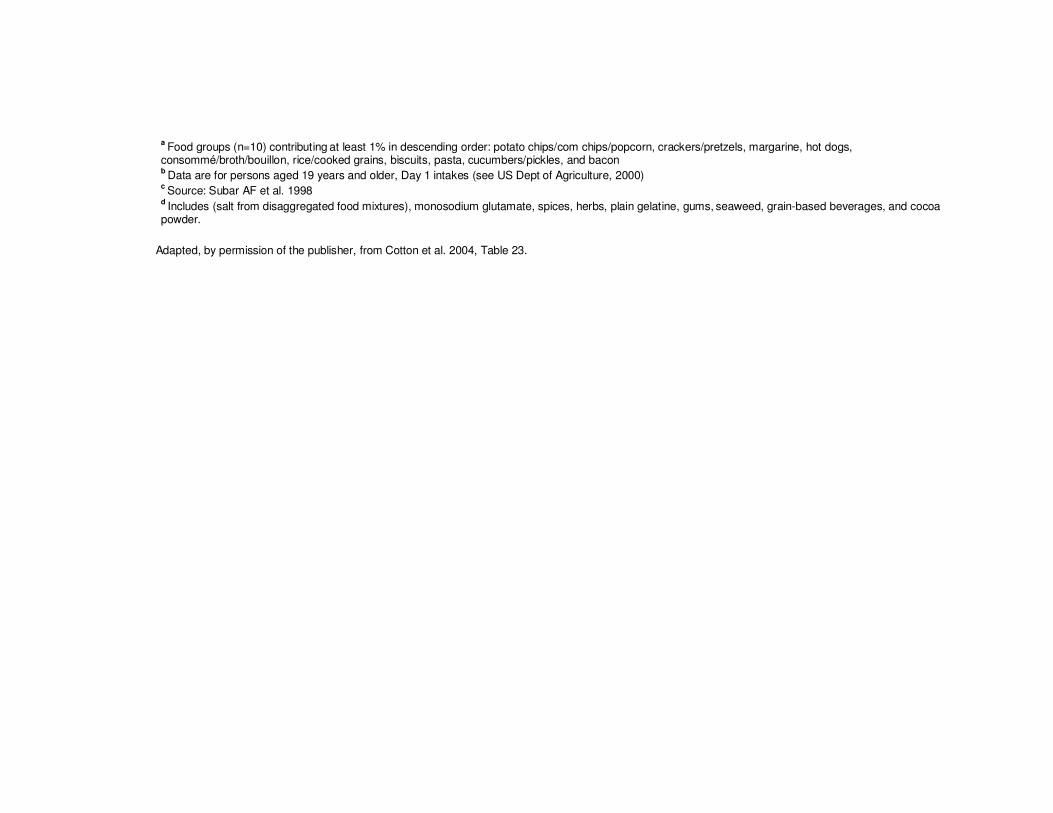
Similar data for the USA are shown in Table 14 (Cotton et al., 2004). Bread, ready-to-eat cereal and

cakes, cookies, quick-breads and doughnuts contribute 16-17% of sodium intake; ham, beef, poultry,

sausage and cold cuts about 13%; milk and cheese 8–9%; condiments, salad dressing and

mayonnaise about 5%; other foods including potato chips, popcorn, crackers and pretzels, margarine,

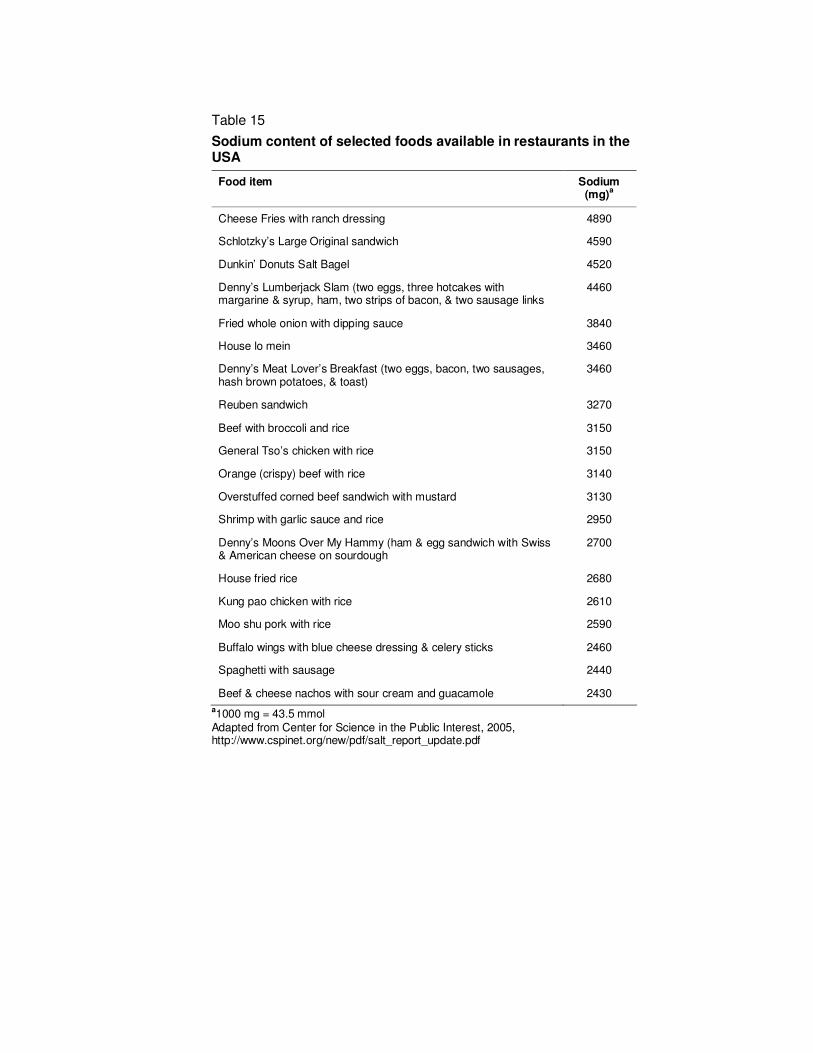
hot dogs, pickles and bacon a further 23–25%. Table 15 shows the sodium content of selected foods

available in restaurants in the USA. All the products listed alone contain over 2.3 g (100 mmol)

sodium, i.e. the recommended daily tolerable upper intake level (UL) for the USA (Institute of

Medicine, 2004); some foods contain twice the recommended UL.

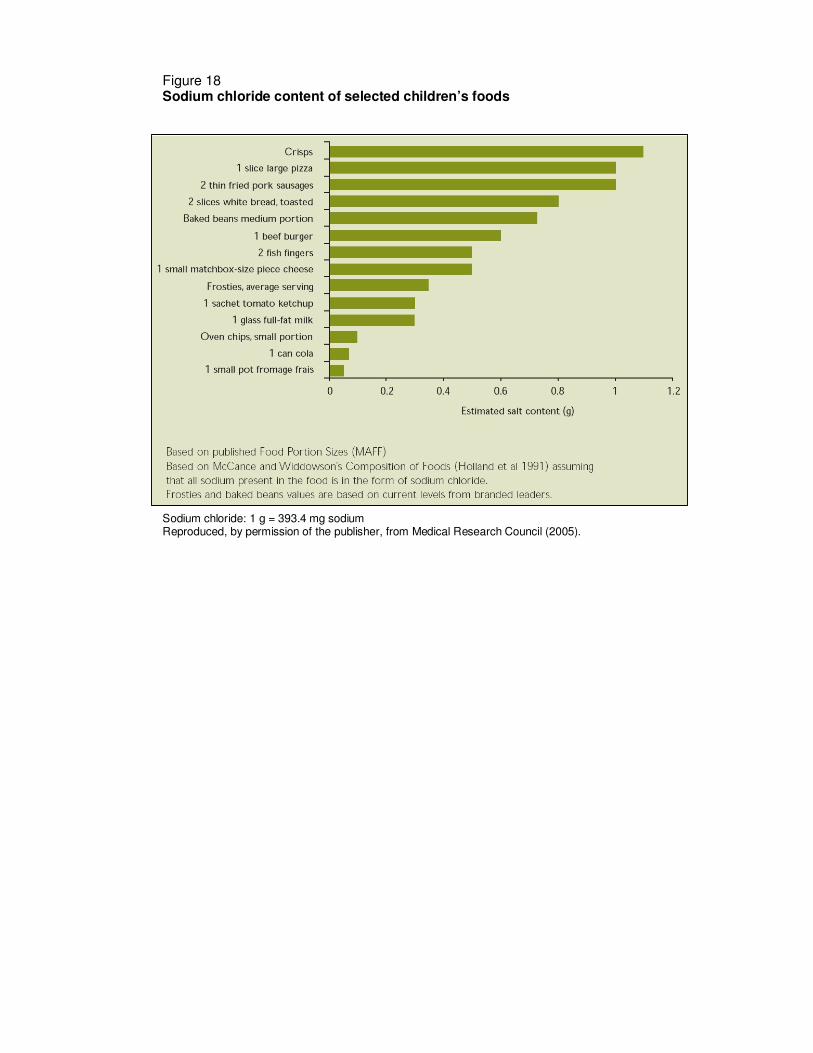
Some children’s foods are extremely high in sodium. For example the estimated salt content of one

large slice of pizza or two thin fried pork sausages is around 1 g (391 g, 17 mmol sodium) (Figure 18).

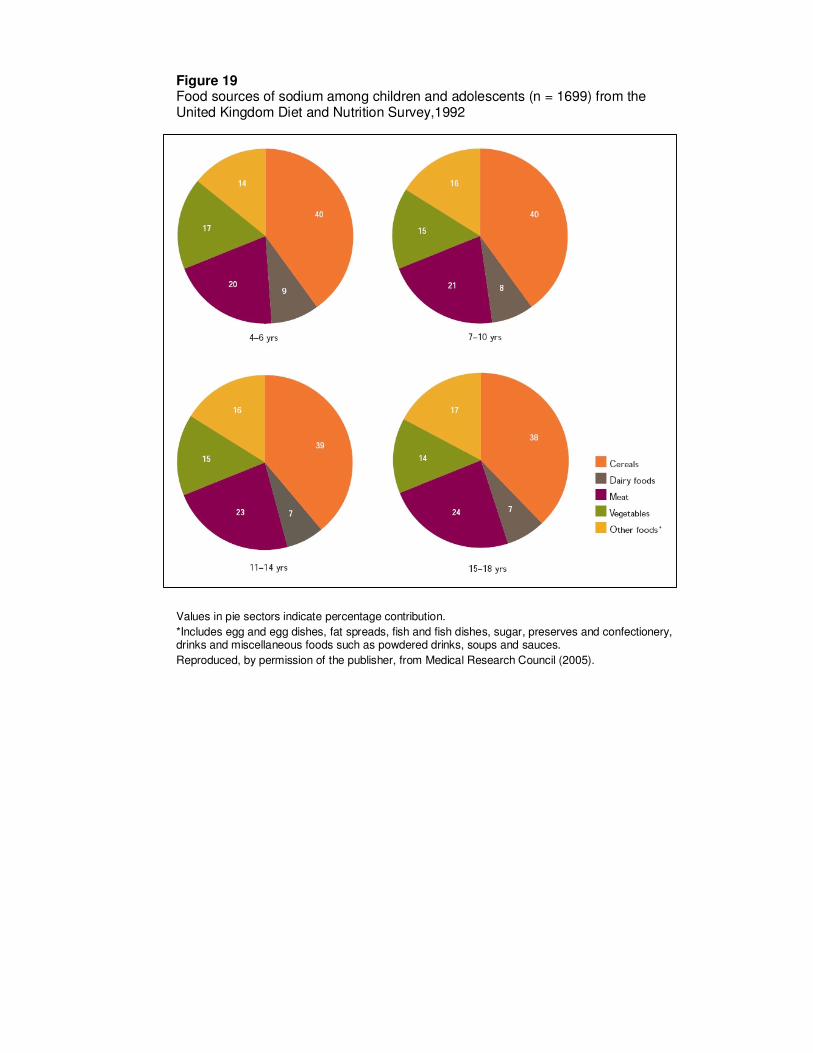
In the United Kingdom, cereals contribute 38–40% of sodium present in the diets of children and

young people ages 4–18 years; meats 20–24%; vegetables 14–17%, and dairy products 7–9% (Figure

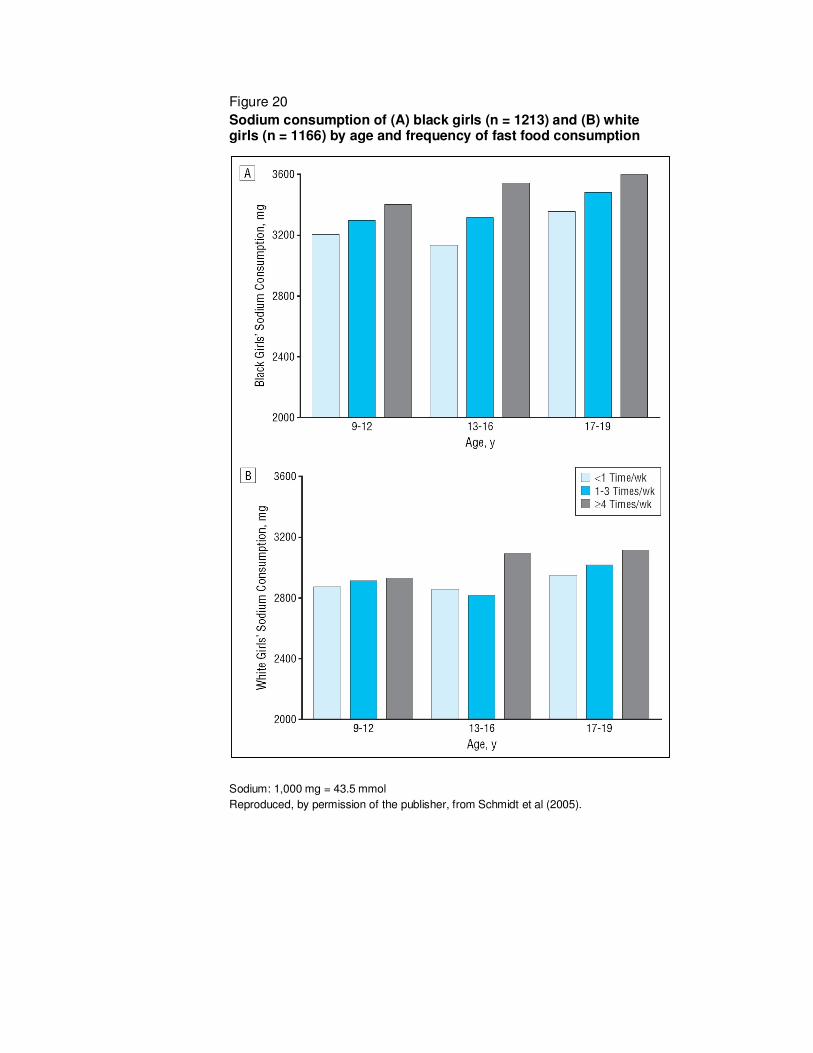
19). In the USA, girls reporting that they ate fast foods at least four times per week had higher sodium

intakes than girls having fast foods < 1–3 times per week (Figure 20) (Schmidt et al., 2005).

A different picture with regard to dietary sources of sodium is apparent in some Asian countries. In

China and Japan, a large proportion of sodium in the diet comes from sodium added in cooking and

25

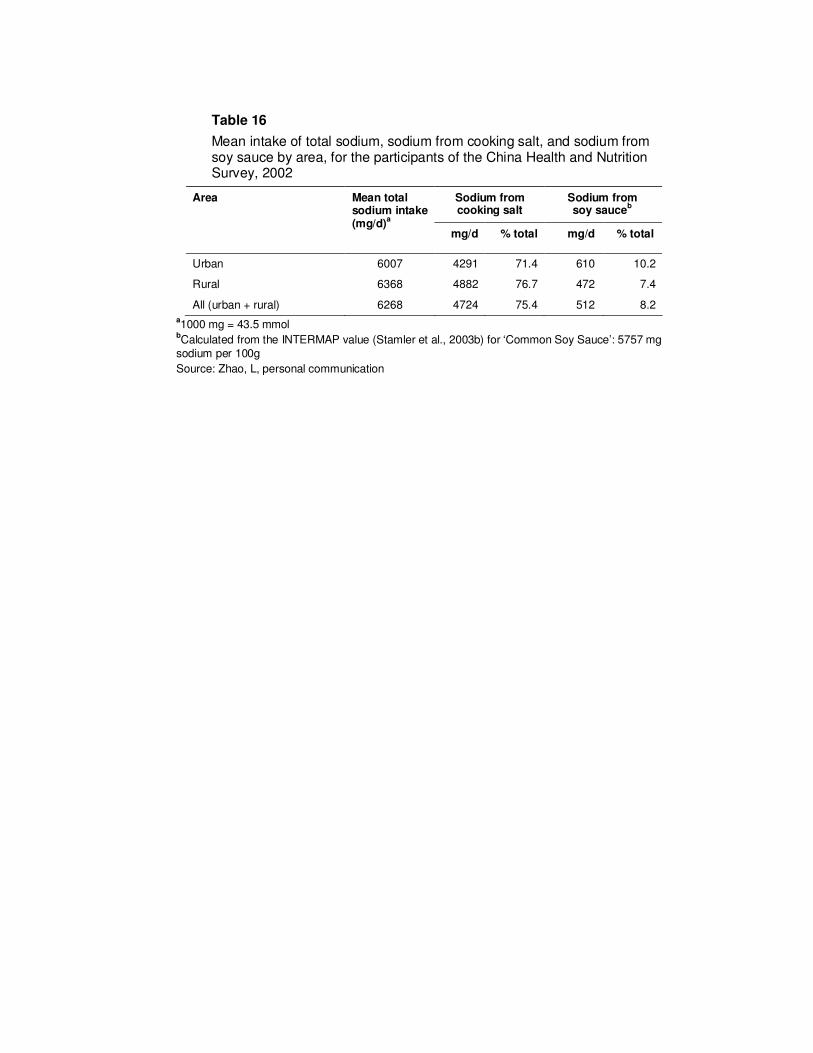
from various sauces, including soy sauce and (in Japan) miso. Table 16 shows the proportions of

sodium from different sources contributing to the Chinese diet, based on data from the 2002 Chinese

Health and Nutrition Survey (Zhao, personal communication). Overall, some 75% of dietary sodium

comes from sodium added as salt in cooking, and a further 8% from soy sauce. The main sources of

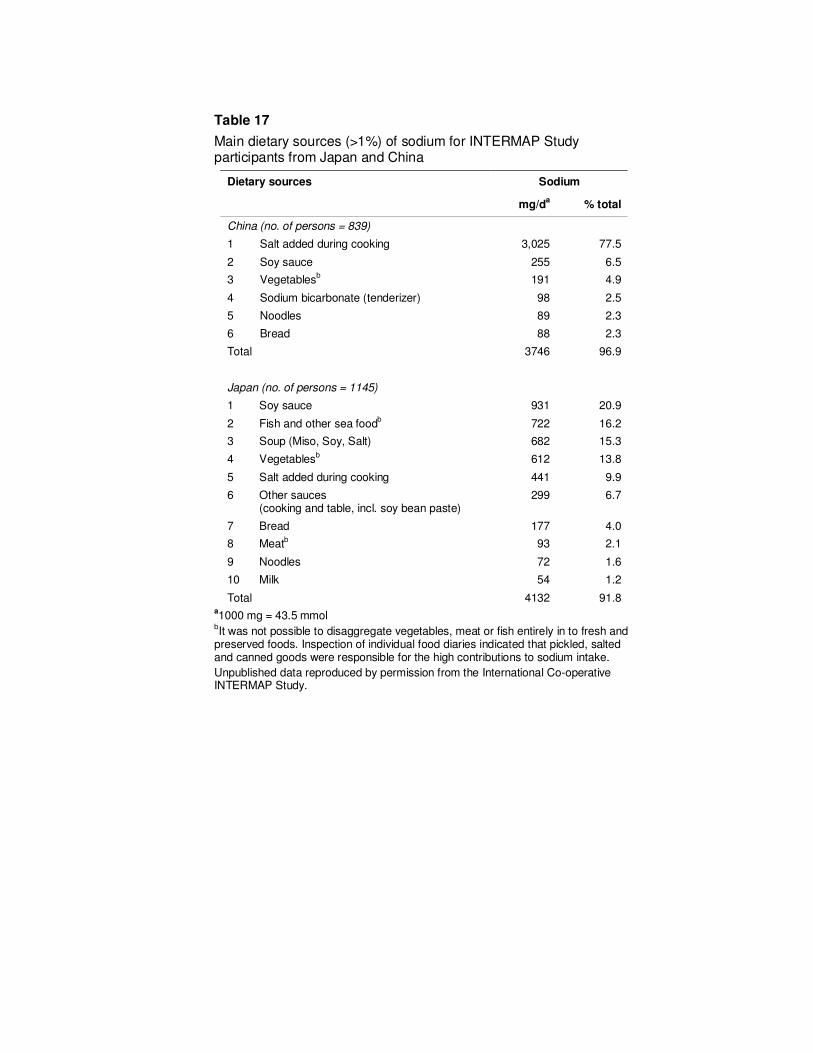
sodium in the diets of INTERMAP participants from China and Japan are shown in Table 17. Again,

the predominant source in China was salt added during cooking (78%). In Japan, the main sources

were soy sauce, fish and other sea food, soups and vegetables (66% in total) with a further 10% being

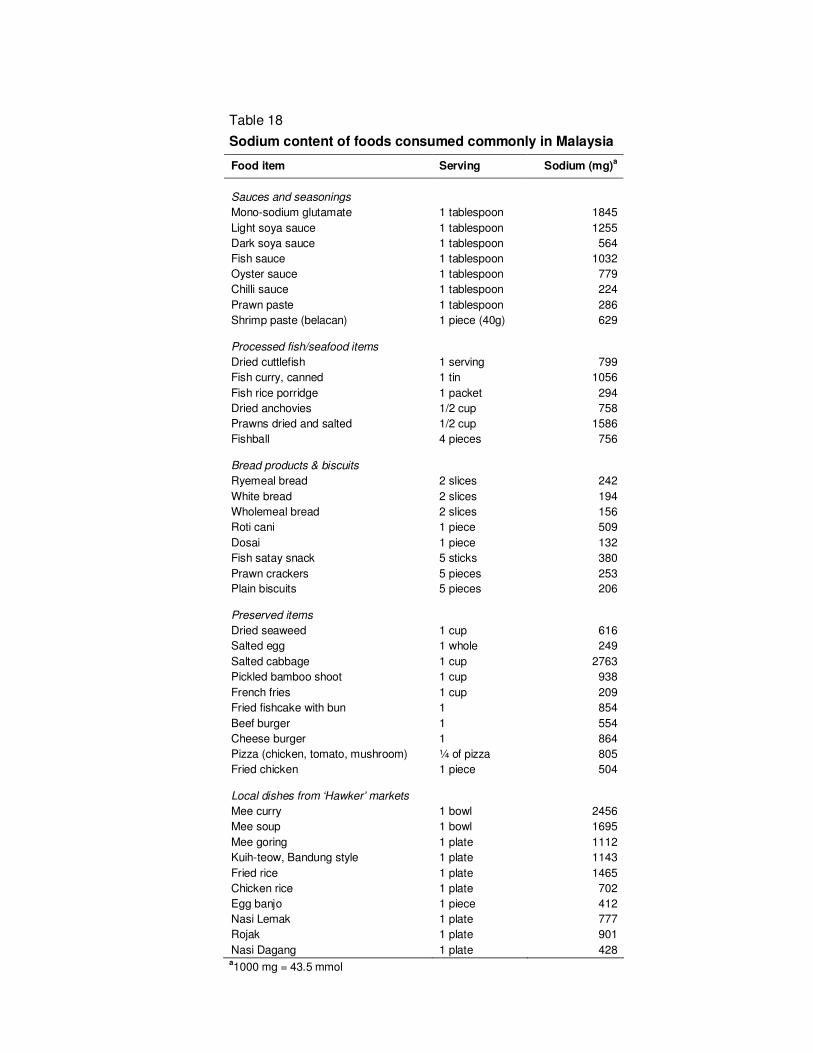
contributed by salt added during cooking. Some foods commonly consumed in Malaysia are also very

high in sodium (Table 18); for example a bowl of Mee curry and a bowl of Mee soup available from

‘hawker’ markets contain about 2.5 g (109 mmol) and 1.7 g (74 mmol) sodium, respectively (Campbell

et al., 2006).

Summary

The amount of sodium in diets in developed countries is dominated by salt added in food manufacture

and in foods eaten away from home. Some children’s foods are extremely high in sodium. In some

Asian countries, a different pattern is evident, with salt added in cooking and in various sauces (e.g.

soy) being predominant.

26

7. REFERENCES

Agostoni C et al. (1998). Studio delle abitudini alimentari in una popolazione scolastica di un comune della provincia di Milano [in Italian]. Riv Pediatr Prev Soc, 38:59–65.

Arvanitakis C, Longnecker MP, Folscroft J (1978). Characterization of p-aminobenzoic acid transport across the rat intestine. J Lab Clin Med, 91:467–472.

Azizi F et al. (2001). Effects of salted food consumption on urinary iodine and thyroid function tests in two provinces in the Islamic Republic of Iran. East Medit Health J, 7:115–120.

Baldwin U, Alexander RW, Warner EG (1960). Chronic sodium chloride challenge studies in man. J Lab Clin Med, 55:362–375.

Bates CJ. Biochemical Markers of Nutrient Intake. In: Margetts BM, Nelson M, eds. Design concepts in nutritional epidemiology. Oxford, Oxford Medical Publications, 1991:192–265.

Beard TC et al. (1997). The Hobart Salt Study 1995: few meet national sodium intake target. Med J Aust, 166:404–407.

Bergström E, Hernell O, Persson LA (1993). Dietary changes in Swedish adolescents. Acta Paediatr; 82:472–480.

Bingham SA (1987). The dietary assessment of individuals; methods, accuracy, new techniques and recommendations. Nutr Abstr Rev A, 57:706–742.

Bingham SA (2002). Biomarkers in nutritional epidemiology. Public Health Nutr, 5:821–827.

Bingham S, Cummings JH (1983). The use of 4-aminobenzoic acid as a marker to validate the completeness of 24 h urine collections in man. Clin Sci, 64:629–635.

Bingham SA et al. (1988). Reference values for analytes of 24-h urine collection known to be complete.Ann Clin Biochem;25:610–619.

Bingham SA et al. (1992). Para-amino benzoic-acid in the assessment of completeness of 24-hour urine collections from hospital outpatients and the effect of impaired renal-function. Eur J Clin Nutr; 46:131–135.

Bisi Molina M del C et al. (2003). Hypertension and salt intake in an urban population. Rev Saude Publica, 37:743–750.

Bleiler RE, Schedl HP (1962). Creatinine excretion: variability and relationship to diet and body size. J Lab Clin Med, 59:945–955.

Brungel M, Kluthe R, Furst P (2001). Evaluation of various rapid chloride tests for assessing urinary NaCl excretion. Ann Nutr Metab, 45:169–174.

Caggiula AW et al. (1985). The measurement of sodium and potassium intake. Am J Clin Nutr; 42:391–398.

Campbell N et al. (2006). Salt & Cardiovascular Disease in Malaysia. London: Blood Pressure Unit, St George’s Hospital [Report available on request to author].

Center for Science in the Public Interest (2005). Salt the forgotten killer. Sodium levels in processed foods. (http://www.cspinet.org/new/pdf/salt_report_update.pdf, accessed 24 September 2006).

Charlton KE et al. (2005). Diet and blood pressure in South Africa: intake of foods containing sodium, potassium, calcium, and magnesium in three ethnic groups. Nutrition, 21:39–50.

Clark AJ, Mossholder S (1986). Sodium and potassium intake measurements: dietary methodology problems. Am J Clin Nutr; 43:470–476.

Conn JW (1950). Mechanism of acclimatization to heat. Adv Int Med, 3:373–393.

Connor SL et al. (1984). The effects of familial relationships, age, body weight, and diet on blood pressure and the 24 hour urinary excretion of sodium, potassium, and creatinine in men, women, and children of randomly selected families. Circulation, 70:76–85.

27

Cooper R, Liu K (1980). Correlations between salt intake, blood pressure, and family history of hypertension. Am J Clin Nutr; 33:2218.

Cooper R et al. (1980). The association between urinary sodium excretion and blood pressure in children. Circulation, 62:97–104.

Cooper R et al. (1983). Urinary sodium excretion and blood pressure in children: absence of a reproducible association. Hypertension, 5:135–139.

Cotton PA et al. (2004). Dietary sources of nutrients among US adults 1994 to 1996. J Am Diet Assoc, 104:921–930.

Cramer K, Cramer H, Selander S (1967). A comparative analysis between variation in 24-hour urinary creatinine output and 24-hour urinary volume. Clin Chim Acta, 15:331–335.

Cummins RO, Shaper AG, Walker M (1981). Methodological problems with estimation of salt intake. Lancet, 1(8234):1373–1374.

Dahl LK (1958). Salt intake and salt need. N Eng J Med, 258:1152–1208.

Dahl LK. Possible role of salt intake in the development of essential hypertension. In: P Cottier, D Bock, eds. Essential Hypertension - An International Symposium. Berlin, Springer-Verlag, 1960:52–65.

Dahl LK (1972). Salt and hypertension. Am J Clin Nutr; 25:231–244.

Dahl LK, Love RA (1954). Evidence for relationship between sodium (chloride) intake and human essential hypertension. Arch Int Med, 94:525–531.

Dahl LK, Love RA (1957). Etiological role of sodium chloride intake in essential hypertension in humans. JAMA, 164:397–399.

Dauncey MJ, Widdowson EM (1972). Urinary excretion of calcium, magnesium, sodium and potassium in hard and soft water areas. Lancet, 1(7753):711–715.

Dawber TR et al. Environmental factors in hypertension. In: Stamler J, Stamler R, Pullman TN, eds. The Epidemiology of Hypertension. New York, London, Grune & Stratton, 1967, 255–288.

Dennis B et al. (2003). INTERMAP: The dietary data - process and quality control. J Hum Hypertens, 17:609–622.

Denton D (1982) The Hunger for Salt: An Anthropological, Physiological and Medical Analysis. Berlin: Springer.

Doyle AE, Chua KG, Duffy S (1979). Urinary sodium, potassium and creatinine excretion in hypertensive and normotensive Australians. Med J Aust, 2:898–900.

du Cailar G et al. (2004). Dietary sodium and pulse pressure in normotensive and essential hypertensive subjects. J Hypertens, 22:697–703.

Dyer AR, Shipley M, Elliott P, for the INTERSALT Cooperative Research Group (1994). Urinary electrolyte excretion in 24 hours and blood pressure in the INTERSALT Study. I. Estimates of reliability. Am J Epidemiol, 139:927–939.

Dyer AR et al. (1987). Do hypertensive patients have a different diurnal excretion pattern of electrolyte excretion? Hypertension, 10:417–424.

Dyer AR et al. (1998). Blood pressure and diurnal variation in sodium, potassium, and water excretion. J Hum Hypertens, 12:363–371.

Edwards OM, Bayliss RIS, Millen S (1969). Urinary creatinine excretion as an index of the completeness of 24-hour urinary collections. Lancet, 2(7631):1165–1166.

Elliott P, Stamler R (1988). Manual of operations for "INTERSALT" an international cooperative study on the relation of sodium and potassium to blood pressure. Control Clin Trials, 9(suppl):1S-118S.

Elliott P et al. (1992). Sodium/creatinine and sodium/potassium ratios in spot urines are positively related to blood pressure: the INTERSALT study. J Hypertens, 109(suppl):S141.

28

Elliott P et al. (1988) Sodium and blood pressure: positive associations in a north London population with consideration of the methodological problems of within-population surveys. J Hum Hypertens, 2:89–95.

Elliott P et al. (1996). Intersalt revisited: Further analysis of 24 hour sodium excretion and blood pressure within and across populations. Br Med J, 312:1249–1253.

Ellison RC et al. (1980). Obesity, sodium intake, and blood pressure in adolescents. Hypertension, 2(suppl 1):I-78–I-82.

Engstrom A, Tobelmann RC, Albertson AM (1997). Sodium intake trends and food choices. Am J Clin Nutr, 65(suppl):704S–707S.

Espeland MA et al. (2001). Statistical issues in analyzing 24-hour dietary recall and 24-hour urine collection data for sodium and potassium intakes. Am J Epidemiol, 153:996–1006.

Farleigh CA, Shepherd DR, Land DG (1985). Measurement of sodium intake and its relationship to blood pressure and salivary sodium concentration. Nutr Res, 5:815–826.

Faust HS (1982). Effects of drinking water and total sodium intake on blood pressure. Am J Clin Nutr, 35:1459–1467.

Food Standards Agency (2006). Regulatory Impact Assessment. Setting targets for salt content in a range of processed-food categories (http://www.food.gov.uk/multimedia /pdfs/salttargetsria.pdf, accessed 24 September 2006).

Forbes GB, Bruining GJ (1976). Urinary creatinine excretion and lean body mass. Am J Clin Nutr, 29:1359–1366.

Froment A, Milon H, Gravier C (1979). Relation entre consommation sodée et hypertension artérielle. Contribution de l'épidémiologie géographique. Rev Epidém et Santé Publ, 27:437–454.

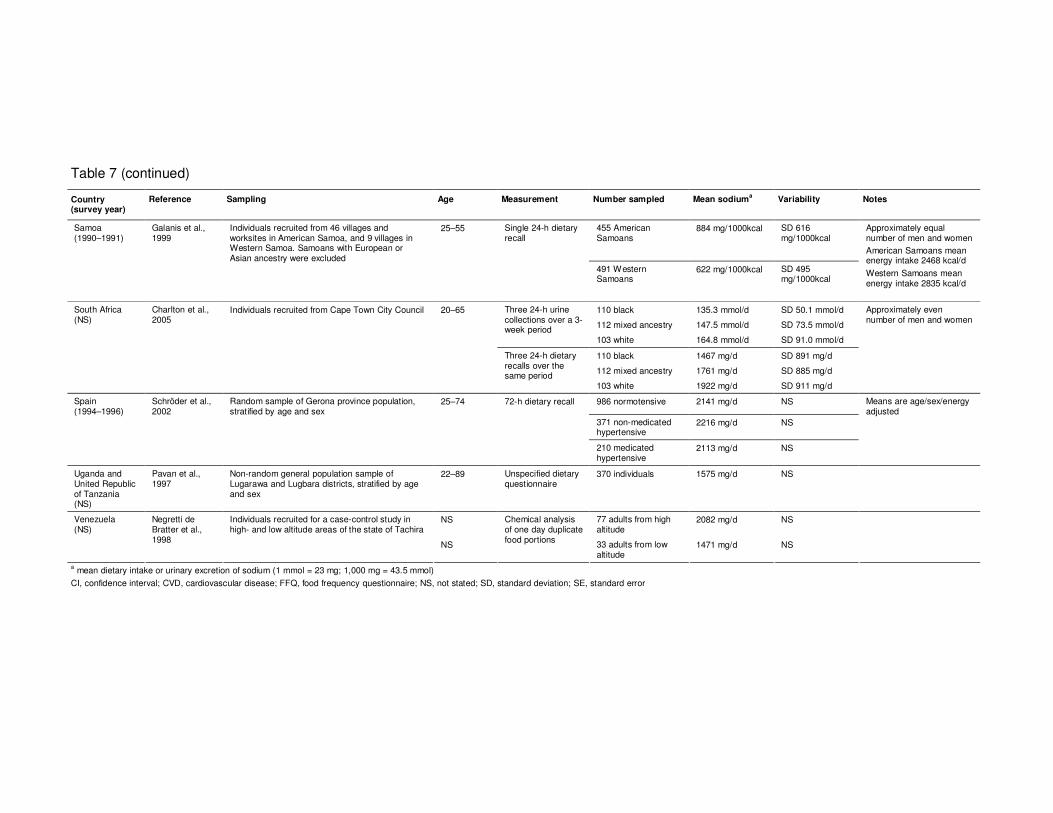
Galanis DJ et al. (1999). Dietary intake of modernizing Samoans: implications for risk of cardiovascular disease. J Am Diet Assoc, 99:184–190.

Geleijnse JM, Grobbee DE, Hofman A (1990). Sodium and potassium intake and blood pressure change in childhood. Br Med J, 300:899–902.

Geleijnse JM et al. (1997). Electrolytes are associated with blood pressure at old age: The Rotterdam Study. J Hum Hypertens, 11:421–423.

Gillman MW et al. (1992). Inverse association of dietary calcium with systolic blood pressure in young children. JAMA, 267:2340–2343.

Gleiberman L (1973). Blood pressure and dietary salt in human populations. Ecol Food Nutr, 2:143–156.

Gregory J & Lowe S. National Diet and Nutrition Survey: Young People aged 4 to 18 years. Vol 1, Report of the Diet and Nutrition Survey. London, HMSO, 2000.

Gregory JR et al. National Diet and Nutrition Survey: Children aged 1.5 to 4.5 years. Vol 1, Report of the Diet and Nutrition Survey. London, HMSO, 1995.

Hamułka J, Gronowska-Senger A (2000). Ocena sposobu Zywienia uczniow. Zywienie czlowieka i metabolism, 176–181 [cited by Lambert et al., 2004].

Harshfield GA et al. (1991). Sodium excretion and racial differences in ambulatory blood pressure patterns. Hypertension, 18:813–818.

Hassapidou MN, Fotiadou E (2001). Dietary intakes and food habits of adolescents in Northern Greece. Int J Food Sci Nutr, 52:109–116.

Henderson L et al., eds. National Diet and Nutrition Survey: Adults aged 19 to 64 Years. Vitamin and Mineral Intake and Urinary Analytes. Vol 3. London, The Stationery Office, 2003.

Holbrook JT et al. (1984). Sodium and potassium intake and balance in adults consuming self-selected diets. Am J Clin Nutr, 40:786–793.

29

Holland B et al. McCance and Widdowson's The Composition of Foods. 5th Edition, Cambridge, Royal Society of

Chemistry. 1991.

Hollenberg NK et al. (1997). Aging, acculturation, salt intake, and hypertension in the Kuna of Panama. Hypertension, 29:171–176.

Hunter D. Biochemical indicators of dietary intake. In: Willett W, ed. Nutritional Epidemiology. Oxford, Oxford University Press, 1998:174–243.

Institute of Medicine. Panel on dietary reference intakes for electrolytes and water; Standing committee on the scientific evaluation of dietary reference intakes. Dietary reference intakes for water, potassium, sodium, chloride, and sulphate. Washington, National Academies Press, 2004 (http://www.nap.edu/catalog.php?record_id=10925, accessed 24 September 2006).

International Agency for Research on Cancer (1978) Monographs on Evaluation of the Carcinogenic Risks to Humans. Some Aromatic Amines and Related Nitro Compounds. Vol 16: 249–263.

INTERSALT Co-operative Research Group (1988). INTERSALT: an international study of electrolyte excretion and blood pressure. Results for 24-hour urinary sodium and potassium. Br Med J, 297:319–328.

INTERSALT Special Issue (1989). Elliott P, ed. J Hum Hypertens, 3:279–408.

Jacobsen FK et al. (1979). Pronounced increase in serum creatinine concentration after eating cooked meat. Br Med J, 1(6170):1049–1050.

Jakobsen J, Pederson AN, Ovesen L (2003). Para-aminobenzoic acid (PABA) used as a marker for completeness of 24 hour urine: effects of age and dosage scheduling. Eur J Clin Nutr, 57:138–142.

James WP, Ralph A, Sanchez-Castillo CP (1987). The dominance of salt in manufactured food in the sodium intake of affluent societies. Lancet, 1(8530):426–429.

Jenner DA et al. (1988). Diet and blood pressure in 9-year old Australian children. Am J Clin Nutr, 47:1052–1059.

Joossens JV, Kesteloot H (1991). Trends in systolic blood pressure, 24-hour sodium excretion, and stroke mortality in the elderly in Belgium. Am J Med, 90:5S–11S.

Joossens JV, Sasaki S, Kesteloot H (1994). Bread as a source of salt: An international comparison. J Am Coll Nutr, 13:179–183.

Joossens JV et al. Electrolytes and creatinine in multiple 24-hour urine collections (1970-1974). In: Kestelhoot H, Joosens JV, eds. Epidemiology of arterial blood pressure. The Hague, Martinus Nijhoff Publishers, 1980:45–63.

Katanoda K, Matsumura Y (2002). National Nutrition Survey in Japan: Its methodological transition and current findings. J Nutr Sci Vitaminol (Tokyo), 48:423–432.

Kaufman JS et al. (1996). Determinants of hypertension in West Africa: contribution of anthropometric and dietary factors to urban-rural and socioeconomic gradients. Am J Epidemiol, 143:1203–1218.

Kawamura M et al. (1997). Relation of urinary sodium excretion to blood pressure, glucose metabolism, and lipid metabolism in residents of an area of Japan with high sodium intake. Hypertens Res, 20:287–293.

Kesteloot H et al. (1978). An epidemiological survey of arterial blood pressure in Korea using home reading. In: Rorive G, Van Cauwenberge H, eds. The arterial hypertensive disease; a symposium. Paris, Masson, 1978:141–148.

Khaw KT et al. (2004). Blood pressure and urinary sodium in men and women: the Norfolk Cohort of the European Prospective Investigation into Cancer (EPIC-Norfolk). Am J Clin Nutr, 80:1397–1403.

Kirkendall WM et al. (1976). The effect of dietary sodium chloride on blood pressure, body fluids, electrolytes, renal function and serum lipids of normotensive man. J Lab Clin Med, 87:418–434.

Knuiman JT et al. (1988). Blood pressure and excretion of sodium, potassium, calcium and magnesium in 8- and 9-year old boys from 19 European centres. Eur J Clin Nutr, 42:847–855.

Laatikainen T et al. (2006). Sodium in the Finnish diet: 20-year trends in urinary sodium excretion among the adult population. Eur J Clin Nutr, 60:965–970.

30

Lambert J et al. (2004). Dietary intake and nutritional status of children and adolescents in Europe. Br J Nutr, 92(suppl 2):S147–S211.

Langford HG, Watson R (1973). Electrolytes, environment and blood pressure. Clin Sci Mol Med, 45:111S–113S.

Leakey RE (1991). A review of the evidence for our African origins. Ethnicity Dis, 1:8–20.

Lisheng L et al. (1987). Variability of urinary sodium and potassium excretion in North Chinese men. J Hypertens, 5:331–335.

Liu K et al. (1979a). Assessment of the association between habitual salt intake and high blood pressure: methodological problems. Am J Epidemiol, 110:219–226.

Liu K et al. (1979b). Can overnight urine replace 24-hour urine collection to assess salt intake? Hypertension, 1:529–536.

Liu L et al. on behalf of the China-Japan Cooperative Research Group of the WHO-CARDIAC Study (2000). Comparative studies of diet-related factors and blood pressure among Chinese and Japanese: Results from the China-Japan Cooperative Research of the WHO-CARDIAC Study. Hypertens Res, 23:413–420.

Liu L et al. (2001). Ethnic and environmental differences in various markers of dietary intake and blood pressure among Chinese Han and three other minority peoples of China: Results from the WHO Cardiovascular Diseases and Alimentary Comparison (CARDIAC) Study. Hypertens Res, 24:315–322.

Liu L et al. (2002). Inverse relationship between urinary markers of animal protein intake and blood pressure in Chinese: results from the WHO Cardiovascular Diseases and Alimentary Comparison (CARDIAC) Study. Int J Epidemiol, 31:227–233.

Liu S-M, Chung C (1992). Trace elements in Taiwanese diet in different seasons. J Radioanal Nucl Chem, 161:27–38.

Livingstone MBE, Robson PJ, Wallace JMW (2004). Issues in dietary intake assessment of children and adolescents. Brit J Nutr, 92(suppl 2):S213–S222.

Ljungman S et al. (1981). Sodium excretion and blood pressure. Hypertension, 3:318–326.

Loria CM, Obarzanek E, Ernst ND (2001). Choose and prepare foods with less salt: Dietary advice for all Americans. J Nutr, 131:536S–551S.

Luft FC, Fineberg NS, Sloan RS (1982a). Estimating dietary sodium intake in individuals receiving a randomly fluctuating intake. Hypertension, 4:805–808.

Luft FC, Fineberg NS, Sloan RS (1982b). Overnight urine collections to estimate sodium intake. Hypertension, 4:494–498.

Luft FC et al. (1979). Effects of volume expansion and contraction in normotensive Whites, Blacks and subjects of different ages. Circulation, 59:643–650.

Lyhne AN (1998). Dietary habits and physical activity of Danish adolescents. Scand J Nutr; 42:13–16.

Lykken GI et al. (1980). A mathematical model of creatinine metabolism in normal males - comparison between theory and experiment. Am J Clin Nutr, 33:2674–2685.

MacGregor GA, de Wardener HE. Salt, Diet and Health. Cambridge, Cambridge University Press, 1998.

McCance RA (1938). The effect of salt deficiency in man on the volume of extracellular fluids, and on the composition of sweat, saliva, gastric juice and cerebrospinal fluid. J Physiol, 92:208–218.

Mattes RD, Donnelly D (1991). Relative contributions of dietary sodium sources. J Am Coll Nutr, 10:383–393.

Medical Research Council. Why 6g? A summary of the scientific evidence for the salt intake target. Jebb S, MacEvilly C, Aggett P, Lincoln P, eds. Cambridge, MRC Human Nutrition Research Unit, 2005.

Miall WE (1959). Follow-up study of arterial pressure in the population of a Welsh mining valley. Br Med J, 2:1204–1210.

31

Milne FJ et al. (1980). Spot urinary electrolyte concentrations and 24 hour excretion. Lancet, 2(8204):1135.

Minetti EE et al. (1992). Urinary salt titrator stick – A useful and quick estimate of dietary sodium intake. J Hum Hypertens, 6:287–289.

Moore N et al. (1979). Spot urinary sodium/creatinine ratio predicts previous day’s 24 hour sodium excretion in young essential hypertensives. Prev Med, 8:200.

Moser M et al. (1959). Epidemiology of hypertension with particular reference to the Bahamas. I. Preliminary report of blood pressures and review of possible etiologic factors. Amer J Cardiol, 4:727–733.

Nakagawa H et al. (1999). Trends in blood pressure and urinary sodium and potassium excretion in Japan: reinvestigation in the 8th year after the Intersalt Study. J Hum Hypertens, 13:735–741.

Negretti de Brätter VE et al. Study of the trace element status and the dietary intake of mineral and trace elements in relation to the gastric cancer incidence in Táchira, Venezuela. In: Collery P et al. eds. Metal Ions in Biology and Medicine, Vol 5. Paris, John Libbey Eurotext, 1998:557–565.

O’Connor WJ (1977). Normal sodium balance in dogs and in man. Cardiovasc Res, 11:375–408.

Ogawa M (1986). Feasibility of overnight urine for assessing dietary intakes of sodium, potassium, protein and sulfur amino acids in field studies. Jpn Circ J, 50:595–600.

Oliver WJ, Cohen EL, Neel JV (1975). Blood pressure, sodium intake, and sodium related hormones in the Yanomamo Indians, a “no salt” culture. Circulation, 52:146–151.

Paterson N (1967). Relative constancy of 24-hour urine volume and 24-hour creatinine output. Clin Chim Acta, 18:57–58.

Pavan L et al. (1997). Blood pressure, serum cholesterol and nutritional state in Tanzania and in the Amazon: comparison with an Italian population. J Hypertens, 15:1083–1090.

Pietinen P (1982). Estimating sodium intake from food consumption data. Ann Nutr Metabol, 26:90–99.

Pietinen PI, Wong O, Altschul AM (1979). Electrolyte output, blood pressure, and family history of hypertension. Am J Clin Nutr, 32:997–1005.

Pietinen PI et al. (1976). Studies in community nutrition: estimation of sodium output. Prev Med, 5:400–407.

Pollack H (1970). Creatinine excretion as an index for estimating urinary excretion of micronutrients or their metabolic end products. Am J Clin Nutr, 23:865–867.

Prior IAM, Stanhope JM. Blood pressure patterns, salt use and migration in the Pacific. In: Kestelhoot H, Joosens JV, eds. Epidemiology of arterial blood pressure. The Hague, Martinus Nijhoff Publishers, 1980:243–262.

Ram MM, Reddy V. (1970). Variability in urinary creatinine. Lancet, II:674.

Samuelson G et al. (1996). Food habits and energy and nutrient intake in Swedish adolescents approaching the year 2000. Acta Paediatr Suppl, 414:1–20.

Sasaki N (1962). High blood pressure and the salt intake of the Japanese. Jpn Heart J, 3:313–324.

Sasaki N (1964). The relationship of salt intake to hypertension in the Japanese. Geriatrics, 19:735–744.

Sasaki N. The salt factor in apoplexy and hypertension: Epidemiological studies in Japan. In: Yamori Y, ed. Prophylactic Approach to Hypertensive Diseases. New York, Raven Press, 1979:467–474.

Sasaki N. Epidemiological studies on hypertension in northeast Japan. In: Kesterloot H, Joossens JV, eds. Epidemiology of Arterial Blood Pressure. The Hague, Martinus Nijhoff Publishers, 1980:367–377.

Schachter J et al. (1980). Comparison of sodium and potassium intake with excretion. Hypertension, 2:695–699.

Schakel SF et al. (2003). Enhancing data on nutrient composition of foods eaten by the participants in the INTERMAP Study in China, Japan, the United Kingdom, and the United States. J Food Compost Anal, 16:395–408.

32

Schmidt M et al. (2005). Fast-food intake and diet quality in black and white girls: the National Heart, Lung, and Blood Institute Growth and Health Study. Arch Pediatr Adolesc Med, 159:626–631.

Schröder H, Schmelz E, Marrugat J (2002). Relationship between diet and blood pressure in a representative Mediterranean population. Eur J Nutr, 41:161–167.

Scientific Advisory Committee on Nutrition. Salt and Health. London, The Stationery Office, 2003 (http://www.sacn.gov.uk/pdfs?sacn_salt_final.pdf, accessed 24 September 2006).

Scott PJ, Hurley PJ (1968). Demonstration of individual variation in constancy of 24-hour urinary creatinine excretion. Clin Chim Acta, 21:411–414.

Simon JA et al. (1994). Dietary cation intake and blood pressure in black girls and white girls. Am J Epidemiol, 139:130–140.

Simons-Morton DG, Obarzanek E (1997). Diet and blood pressure in children and adolescents. Pediatr Nephrol, 11:244–249.

Simpson FO et al. (1978). Relationship of blood pressure to sodium excretion in a population survey. Clin Sci Mol Med, 55:373S–375S.

Sloan PJM, Beevers G, Baxter FE (1984). The Quantab strip in the measurement of urinary chloride and sodium concentrations. Clin Chem, 30:1706–1707.

Staessen J et al. (1983). Four urinary cations and blood pressure. A population study in two Belgian towns. Am J Epidemiol, 117:676–687.

Stamler J (1993). Dietary salt and blood pressure. Ann N Y Acad Sci, 676:122–156.

Stamler J et al. for the INTERMAP Research Group (2003a). INTERMAP: Background, aims, design, methods and descriptive statistics (non-dietary). J Hum Hypertens, 17:591–608.

Stamler J, Elliott P, Chan Q, for the INTERMAP Research Group (2003b). INTERMAP appendix tables. J Hum Hypertens, 17:655–775.

Stanbury SW, Thomson AE (1951). Diurnal variations in electrolyte excretion. Clin Sci, 10:267–293.

Subar AF et al. (1998). Dietary sources of nutrients among US adults, 1989 to 1991. J Am Diet Assoc, 98:537–547.

Takemori K (1997). Is the salt intake increase after 1987 reported in the Japan National Nutrition Survey an actual increase? JACD, 32:115–123.

Tochikubo O et al. (1986). Management of hypertension in high-school students by using new salt titrator tape. Hypertension, 8:1164–1171.

US Department of Agriculture. Continuing Survey of food intakes by individuals 1994–96, 1998 [CD-Rom]. Beltsville, MD, Agricultural Research Service, 2000.

Vestergaard F, Leverett R (1958). Constancy of urinary creatinine excretion. J Lab Clin Med, 51:211–218.

Walker GW et al. (1979). Relation between blood pressure and renin, renin substrate, angiotensin II, aldosterone and urinary sodium and potassium in 574 ambulatory subjects. Hypertension, I:287–291.

Watson RL, Langford HG (1970). Usefulness of overnight urines in population groups. Pilot studies of sodium, potassium, and calcium excretion. Am J Clin Nutr, 23:290–304.

Watson RL et al. (1980). Urinary electrolytes, body weight, and blood pressure. Pooled cross-sectional results among four groups of adolescent females. Hypertension, 2(suppl I):I-93–I-98.

Wesson LG Jr (1964). Electrolyte excretion in relation to diurnal cycles of renal functions. Medicine, 43:547–592.

Widdowson EM, McCance RA (1970). Use of random specimens of urine to compare dietary intakes of African and British children. Arch Dis Child, 45:547–552.

33

Woo J et al. (1998). Dietary intake and practices in the Hong Kong Chinese population. J Epidemiol Community Health, 52:631–637.

Wu Y et al. (1991). Effects of genetic factors and dietary electrolytes on blood pressure of rural secondary school students in Hanzhong. Chin Med Sci J, 6:148–152.

Yamauchi T et al. (1994). Dietary salt intake and blood pressure among schoolchildren. Ann Physiol Anthropol, 13:329–336.

Yamori Y et al. (1982). Dietary risk factors of stroke and hypertension in Japan. Part 1: Methodological assessment of urinalysis for dietary salt and protein intakes. Jpn Circ J, 46:933–938.

Yu Z et al. (1999). Changes in blood pressure, body mass index, and salt consumption in a Chinese population. Prev Med, 29:165–172.

Zhao L et al. (2004). Blood pressure differences between northern and southern Chinese: Role of dietary factors. The International Study on Macronutrients and Blood Pressure. Hypertension, 43:1332–1337.

Zhu K et al. (1987). The relation of urinary cations to blood pressure in boys aged seven to eight years. Am J Epidemiol, 126:658–663.

NOTE) Publication of this contribution is not intended to signify any attribution to "Taiwan" other than as a Province of China. Therefore, references to "Taiwan" or "Taiwanese" in this publication, including in the bibliography, should be interpreted as referring to the "the Taiwan Province of China".

ACKNOWLEDGEMENTS

We gratefully acknowledge permission to show unpublished data from the International Co-operative

INTERMAP Study on macro- and micronutrients and blood pressure, in Table 17 and Figure 8 of this

report. The INTERMAP Study is supported by grant R01 HL50490 from the National Heart, Lung, and

Blood Institute, Bethesda, Md; by Grant-in-Aid for Scientific Research [A], No. 090357003 from the

Ministry of Education, Science, Sports, and Culture, Tokyo, Japan; and by national agencies in the

People’s Republic of China and in the United Kingdom of Great Britain and Northern Ireland.

We thank Professor Hirotsugu Ueshima (Shiga, Japan) and Dr Liancheng Zhao (Beijing, China) for

their help in identifying data on food sources of sodium in Japan and People’s Republic of China. We

thank Ms Queenie Chan for her assistance in analysing the INTERMAP data shown in Table 17, and

Ms Jennifer Wells for secretarial assistance.
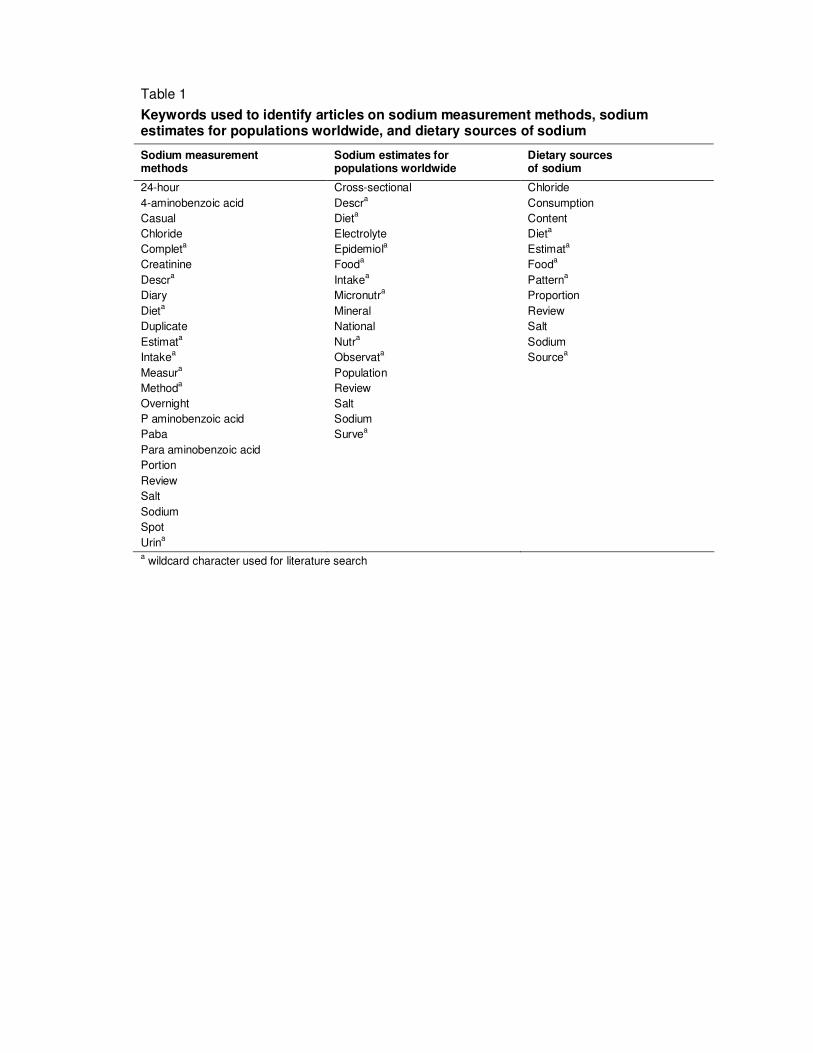
Table 1

Keywords used to identify articles on sodium measurement methods, sodium estimates for populations worldwide, and dietary sources of sodium

Sodium measurement methods

Sodium estimates for populations worldwide

Dietary sources of sodium

24-hour Cross-sectional Chloride

4-aminobenzoic acid Descra Consumption

Casual Dieta Content

Chloride Electrolyte Dieta

Completa Epidemiola Estimata

Creatinine Fooda Food

a

Descra Intake

a Pattern

a

Diary Micronutra Proportion

Dieta Mineral Review

Duplicate National Salt

Estimata Nutr

a Sodium

Intakea Observat

a Source

a

Measura Population

Methoda Review

Overnight Salt

P aminobenzoic acid Sodium

Paba Survea

Para aminobenzoic acid

Portion

Review

Salt

Sodium

Spot

Urina

a wildcard character used for literature search

Table 2

Conversion between mmol and mg of sodium

mmol mg mg mmol

1 23 500 22

50 1150 1000 43.5

100 2300 1500 65

150 3450 2000 87

200 4600 3000 130

250 5750 4000 174

300 6900 5000 217

350 8050 6000 260

Table 3

Methods for estimating sodium intake

Method Key reference Description Strengths Limitations

Food table approach (e.g. 7-day weighed record, 24-h dietary recall)

Clark & Mossholder, 1986

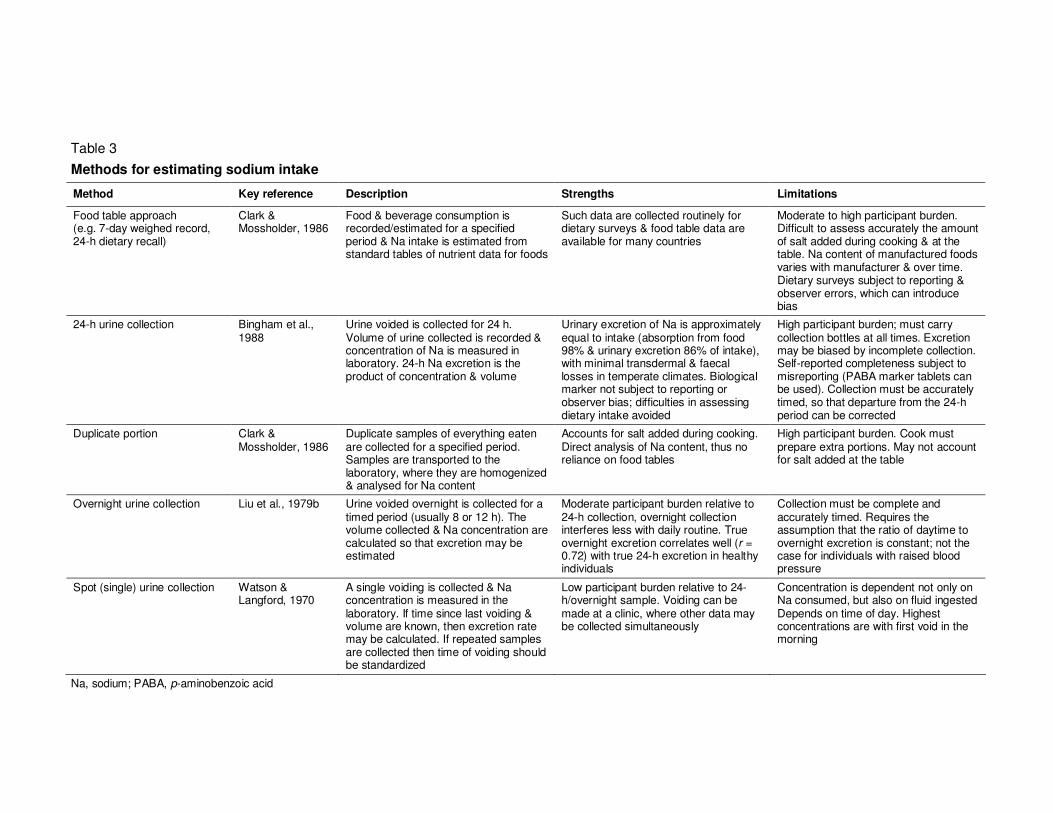
Food & beverage consumption is recorded/estimated for a specified period & Na intake is estimated from standard tables of nutrient data for foods

Such data are collected routinely for dietary surveys & food table data are available for many countries

Moderate to high participant burden. Difficult to assess accurately the amount of salt added during cooking & at the table. Na content of manufactured foods varies with manufacturer & over time. Dietary surveys subject to reporting & observer errors, which can introduce bias

24-h urine collection Bingham et al., 1988

Urine voided is collected for 24 h. Volume of urine collected is recorded & concentration of Na is measured in laboratory. 24-h Na excretion is the product of concentration & volume

Urinary excretion of Na is approximately equal to intake (absorption from food 98% & urinary excretion 86% of intake), with minimal transdermal & faecal losses in temperate climates. Biological marker not subject to reporting or observer bias; difficulties in assessing dietary intake avoided

High participant burden; must carry collection bottles at all times. Excretion may be biased by incomplete collection. Self-reported completeness subject to misreporting (PABA marker tablets can be used). Collection must be accurately timed, so that departure from the 24-h period can be corrected

Duplicate portion Clark & Mossholder, 1986

Duplicate samples of everything eaten are collected for a specified period. Samples are transported to the laboratory, where they are homogenized & analysed for Na content

Accounts for salt added during cooking. Direct analysis of Na content, thus no reliance on food tables

High participant burden. Cook must prepare extra portions. May not account for salt added at the table

Overnight urine collection Liu et al., 1979b Urine voided overnight is collected for a timed period (usually 8 or 12 h). The volume collected & Na concentration are calculated so that excretion may be estimated

Moderate participant burden relative to 24-h collection, overnight collection interferes less with daily routine. True overnight excretion correlates well (r = 0.72) with true 24-h excretion in healthy individuals

Collection must be complete and accurately timed. Requires the assumption that the ratio of daytime to overnight excretion is constant; not the case for individuals with raised blood pressure

Spot (single) urine collection Watson & Langford, 1970

A single voiding is collected & Na concentration is measured in the laboratory. If time since last voiding & volume are known, then excretion rate may be calculated. If repeated samples are collected then time of voiding should be standardized

Low participant burden relative to 24-h/overnight sample. Voiding can be made at a clinic, where other data may be collected simultaneously

Concentration is dependent not only on Na consumed, but also on fluid ingested Depends on time of day. Highest concentrations are with first void in the morning

Na, sodium; PABA, p-aminobenzoic acid
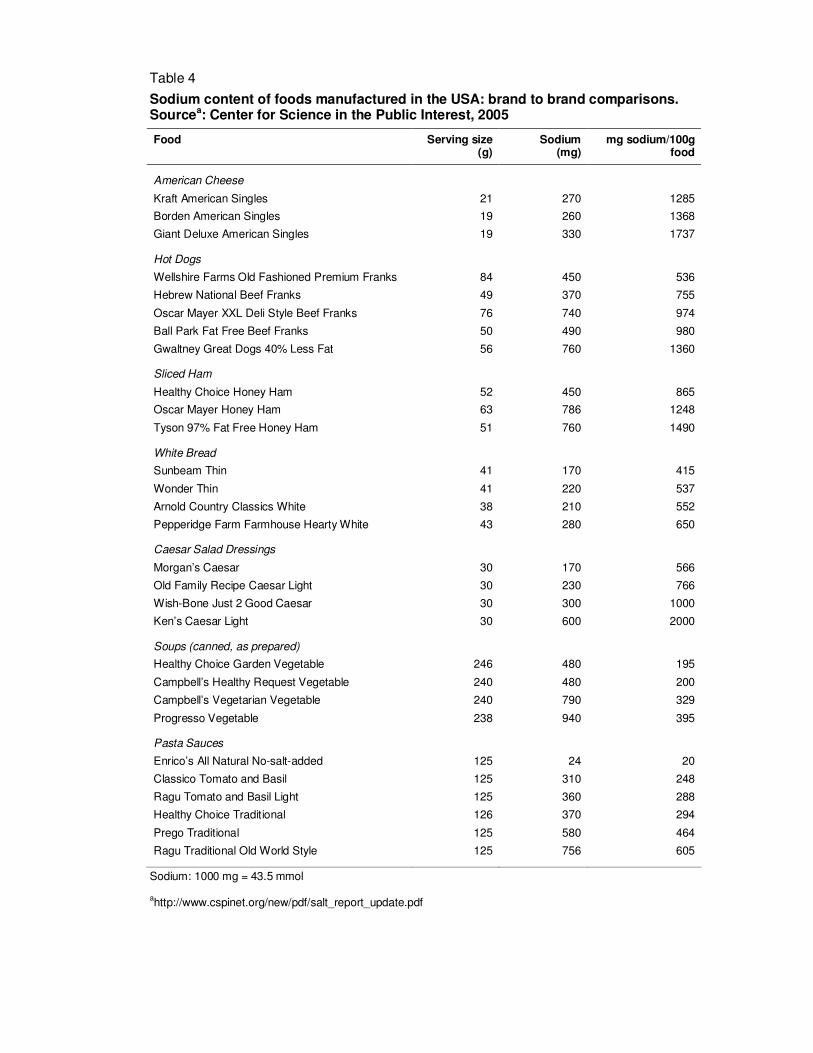
Table 4

Sodium content of foods manufactured in the USA: brand to brand comparisons. Sourcea: Center for Science in the Public Interest, 2005

Food Serving size (g)

Sodium (mg)

mg sodium/100g food

American Cheese

Kraft American Singles 21 270 1285

Borden American Singles 19 260 1368

Giant Deluxe American Singles 19 330 1737

Hot Dogs

Wellshire Farms Old Fashioned Premium Franks 84 450 536

Hebrew National Beef Franks 49 370 755

Oscar Mayer XXL Deli Style Beef Franks 76 740 974

Ball Park Fat Free Beef Franks 50 490 980

Gwaltney Great Dogs 40% Less Fat 56 760 1360

Sliced Ham

Healthy Choice Honey Ham 52 450 865

Oscar Mayer Honey Ham 63 786 1248

Tyson 97% Fat Free Honey Ham 51 760 1490

White Bread

Sunbeam Thin 41 170 415

Wonder Thin 41 220 537

Arnold Country Classics White 38 210 552

Pepperidge Farm Farmhouse Hearty White 43 280 650

Caesar Salad Dressings

Morgan’s Caesar 30 170 566

Old Family Recipe Caesar Light 30 230 766

Wish-Bone Just 2 Good Caesar 30 300 1000

Ken’s Caesar Light 30 600 2000

Soups (canned, as prepared)

Healthy Choice Garden Vegetable 246 480 195

Campbell’s Healthy Request Vegetable 240 480 200

Campbell’s Vegetarian Vegetable 240 790 329

Progresso Vegetable 238 940 395

Pasta Sauces

Enrico’s All Natural No-salt-added 125 24 20

Classico Tomato and Basil 125 310 248

Ragu Tomato and Basil Light 125 360 288

Healthy Choice Traditional 126 370 294

Prego Traditional 125 580 464

Ragu Traditional Old World Style 125 756 605

Sodium: 1000 mg = 43.5 mmol

ahttp://www.cspinet.org/new/pdf/salt_report_update.pdf

Table 5

Urinary excretion of sodium of men from 52 populations and 32 countries by age group

Populations sampled Age 20–29 yr Age 30–39 yr Age 40–49 yr Age 50–59 yr All agesa

nb Mean

c (SD) n Mean (SD) n Mean (SD) n Mean (SD) n Mean (SD)

Argentina 25 188.2 (77.9) 25 164.6 (48.5) 25 179.7 (73.0) 25 169.9 (57.7) 100 175.6 (65.3)

Belgium:

Charleroi 11 120.0 (50.6) 21 169.4 (53.0) 25 141.7 (57.6) 25 157.8 (55.1) 82 147.2 (54.1)

Ghent 25 165.3 (58.2) 25 183.2 (71.1) 25 168.5 (60.2) 25 169.5 (58.0) 100 171.6 (62.1)

Brazil:

Xingu 25 24.1 (37.4) 25 10.9 (14.5) 25 7.5 (12.6) 24 11.7 (26.4) 99 13.5 (24.8)

Yanomamo 25 0.6 (1.1) 25 0.5 (1.2) 24 1.2 (2.1) 25 1.1 (2.4) 99 0.8 (1.8)

Canada:

Labrador 23 181.9 (88.5) 23 224.5 (113.1) 18 160.5 (75.8) 14 150.9 (57.0) 78 179.5 (86.0)

St. Johns 25 226.4 (88.4) 25 210.1 (103.6) 25 229.9 (85.6) 25 232.6 (105.2) 100 224.8 (96.1)

China:

Beijing 25 251.5 (72.5) 25 195.0 (56.5) 25 219.9 (61.1) 25 223.9 (76.1) 100 222.6 (67.0)

Nanning 25 144.6 (42.9) 25 182.2 (78.3) 25 178.6 (49.1) 25 203.3 (59.3) 100 177.2 (58.9)

Tianjin 25 282.5 (83.0) 25 271.8 (97.9) 25 267.0 (100.5) 25 213.8 (73.6) 100 258.8 (89.4)

China (Province of Taiwan) 22 137.6 (65.6) 23 151.2 (77.1) 24 131.9 (49.7) 20 126.3 (66.7) 89 136.7 (65.5)

Colombia 24 261.5 (79.0) 24 225.0 (92.4) 24 201.1 (60.4) 24 241.4 (90.1) 96 232.2 (81.4)

Denmark 24 164.9 (57.5) 25 159.1 (59.0) 25 169.0 (63.0) 25 149.5 (69.0) 99 160.6 (62.3)

Finland:

Joensuu 25 197.9 (61.0) 25 191.3 (54.5) 25 202.3 (72.6) 25 201.1 (64.9) 100 198.1 (63.6)

Turku 25 151.3 (41.4) 25 170.4 (54.3) 25 203.4 (75.5) 25 172.7 (79.5) 100 174.5 (64.6)

Germany:

Bernried 25 205.3 (69.9) 24 180.5 (51.5) 25 181.1 (76.7) 25 190.2 (61.6) 99 189.3 (65.6)

Cottbus 25 175.3 (59.2) 25 168.3 (79.2) 25 188.8 (64.0) 24 177.8 (78.6) 99 177.6 (70.8)

Heidelberg 22 183.2 (83.2) 25 199.8 (62.2) 25 202.7 (67.1) 25 188.6 (59.1) 97 193.6 (68.5)

Hungary 25 219.7 (70.8) 25 198.0 (78.8) 25 249.5 (99.0) 25 261.7 (100.4) 100 232.2 (88.2)

Iceland 25 153.4 (51.8) 25 164.3 (41.8) 25 156.1 (47.1) 25 156.3 (59.9) 100 157.5 (50.6)

India:

Ladakh 25 216.5 (66.2) 25 198.9 (78.6) 25 209.1 (73.4) 25 211.9 (70.3) 100 209.1 (72.3)

New Delhi 25 160.3 (52.0) 25 171.1 (66.3) 25 209.1 (82.9) 25 171.6 (51.9) 100 178.0 (64.5)

Table 5 (continued)

Populations sampled Age 20–29 yr Age 30–39 yr Age 40–49 yr Age 50–59 yr All agesa

nb Mean

c (SD) n Mean (SD) n Mean (SD) n Mean (SD) n Mean (SD)

Italy:

Bassiano 25 196.2 (57.4) 24 205.5 (80.5) 25 210.6 (68.3) 25 198.0 (58.9) 99 202.6 (66.9)

Gubbio 25 176.7 (73.6) 25 188.0 (63.0) 24 209.3 (82.8) 25 185.2 (53.9) 99 189.8 (69.2)

Mirano 25 182.4 (60.6) 25 201.0 (68.3) 25 185.9 (59.2) 25 190.9 (78.7) 100 190.0 (67.2)

Naples 25 173.0 (54.2) 25 193.5 (52.2) 25 175.2 (52.3) 25 179.5 (52.2) 100 180.3 (52.7)

Japan:

Osaka 25 183.3 (64.1) 25 212.3 (50.0) 25 176.7 (43.3) 25 191.8 (48.8) 100 191.0 (52.2)

Tochigi 25 178.2 (81.0) 20 181.2 (73.2) 25 172.5 (70.2) 25 177.0 (50.1) 95 177.2 (69.6)

Toyama 25 205.7 (56.1) 25 233.2 (59.2) 25 234.7 (65.8) 25 221.9 (78.7) 100 223.9 (65.5)

Kenya 23 57.5 (41.8) 23 65.5 (30.8) 23 51.0 (34.1) 21 68.1 (39.4) 90 60.5 (36.8)

Malta 25 164.0 (46.4) 25 198.4 (61.2) 25 176.7 (39.3) 25 199.2 (68.5) 100 184.6 (55.1)

Mexico 23 109.8 (60.2) 25 182.1 (83.1) 21 140.0 (84.0) 22 144.8 (119.5) 91 144.2 (89.2)

Netherlands 25 178.0 (71.1) 25 179.0 (50.7) 25 177.9 (59.6) 25 151.6 (50.5) 100 171.7 (58.6)

Papua New Guinea 25 48.1 (36.3) 20 37.3 (30.0) 24 41.6 (30.0) 19 43.2 (43.5) 88 42.5 (35.4)

Poland:

Krakow 25 242.3 (75.1) 25 218.0 (69.7) 25 252.4 (85.4) 25 246.5 (67.4) 100 239.8 (74.7)

Warsaw 25 186.4 (59.3) 25 206.5 (74.6) 25 223.6 (103.8) 25 224.6 (72.2) 100 210.3 (79.2)

Portugal 25 217.1 (79.8) 24 185.6 (79.8) 25 207.3 (94.1) 25 209.5 (69.8) 99 204.8 (81.3)

Republic of Korea 25 242.1 (72.5) 25 242.4 (75.3) 25 235.3 (73.4) 25 209.7 (71.3) 100 232.4 (73.1)

Russian Federation 24 136.2 (48.0) 25 171.2 (60.0) 24 195.4 (66.4) 24 201.6 (66.5) 97 176.1 (60.7)

Table 5 (continued)

Population sampled Age 20–29 yr Age 30–39 yr Age 40–49 yr Age 50–59 yr All agesa

nb Mean

c (SD) n Mean (SD) n Mean (SD) n Mean (SD) n Mean (SD)

Spain:

Manresa 25 185.5 (54.6) 25 219.7 (70.1) 25 190.1 (66.4) 25 204.2 (85.7) 100 199.9 (70.1)

Torrejon 25 209.2 (87.3) 25 197.5 (63.8) 25 184.8 (68.1) 25 209.2 (92.6) 100 200.1 (78.9)

22 137.6 (65.6) 23 151.2 (77.1) 24 131.9 (49.7) 20 126.3 (66.7) 89 136.7 (65.5)

Trinidad and Tobago 21 112.8 (70.3) 19 129.0 (54.9) 25 144.3 (58.2) 19 134.9 (75.7) 84 130.3 (65.3)

United Kingdom:

Belfast 24 159.6 (59.0) 25 167.8 (64.8) 25 166.8 (63.0) 25 147.7 (64.3) 99 160.5 (62.8)

Birmingham 25 180.6 (51.5) 25 144.5 (33.8) 25 159.1 (39.0) 25 181.0 (55.9) 100 166.3 (45.9)

South Wales 25 177.8 (60.4) 25 167.2 (59.0) 25 207.3 (67.5) 25 162.4 (67.8) 100 178.7 (63.8)

USA:

Chicago 22 138.4 (49.6) 25 169.3 (81.8) 25 172.7 (64.9) 25 154.1 (55.8) 97 158.6 (64.2)

Goodman (black) 22 101.9 (67.5) 23 89.9 (48.7) 24 99.2 (60.4) 24 97.6 (48.5) 93 97.1 (56.9)

Goodman (white) 24 140.4 (55.1) 25 148.6 (59.5) 25 147.8 (45.6) 25 143.7 (74.1) 99 145.1 (59.5)

Hawaii 25 127.4 (44.7) 23 158.1 (83.4) 25 176.0 (84.5) 21 161.0 (95.6) 94 155.6 (79.4)

Jackson (black) 25 168.7 (67.6) 25 131.4 (70.5) 19 184.7 (114.8) 15 213.3 (107.6) 84 174.5 (92.6)

Jackson (white) 25 163.5 (67.2) 25 150.7 (58.3) 25 159.9 (50.2) 25 153.7 (54.9) 100 156.9 (58.0)

Zimbabwe 25 165.2 (70.7) 25 140.2 (67.7) 25 127.5 (75.1) 25 131.9 (56.2) 100 141.2 (67.8) aStandardized by 10-year age group

bNumber of persons

cMean urinary excretion of sodium in mmol/d (1 mmol = 23 mg sodium)

(adapted, by permission of the publisher, from INTERSALT Co-operative Research Group, 1988)

Table 6

Urinary excretion of sodium of women from 52 populations and 32 countries by age group

Population sampled Age 20–29 yr Age 30–39 yr Age 40–49 yr Age 50–59 yr All agesa

nb Mean

c (SD) n Mean (SD) n Mean (SD) n Mean (SD) n Mean (SD)

Argentina 25 136.9 (48.1) 25 139.3 (44.1) 25 126.8 (53.0) 25 140.7 (56.2) 100 135.9 (50.6)

Belgium:

Charleroi 9 123.7 (40.1) 20 122.2 (47.1) 22 148.6 (69.7) 24 132.0 (41.1) 75 131.6 (50.9)

Ghent 25 107.2 (44.4) 25 133.8 (39.2) 25 127.3 (51.4) 25 127.1 (41.7) 100 123.9 (44.4)

Brazil:

Xingu 24 14.0 (14.4) 25 13.0 (15.8) 25 8.2 (9.1) 25 8.7 (24.8) 99 11.0 (17.0)

Yanomamo 23 0.6 (1.1) 24 0.7 (1.1) 24 1.7 (5.5) 25 1.1 (2.4) 96 1.0 (3.1)

Canada:

Labrador 25 149.6 (61.1) 24 116.0 (70.3) 16 100.6 (52.4) 18 122.6 (62.7) 83 122.2 (62.0)

St. Johns 25 173.6 (69.0) 25 153.6 (55.9) 25 188.8 (64.6) 25 185.4 (65.9) 100 175.3 (64.0)

China:

Beijing 25 165.1 (80.7) 25 172.1 (68.6) 25 206.2 (53.7) 25 199.2 (47.2) 100 185.6 (63.9)

Nanning 25 154.1 (56.1) 25 177.4 (72.1) 25 155.3 (56.9) 25 158.3 (60.4) 100 161.3 (61.7)

Tianjin 25 251.4 (87.5) 25 253.1 (91.6) 25 209.7 (61.7) 25 215.7 (57.5) 100 232.5 (76.1)

China (Province of Taiwan) 22 139.8 (43.1) 23 148.2 (62.2) 25 157.6 (64.0) 22 135.8 (47.9) 92 145.4 (55.0)

Colombia 25 174.5 (62.0) 25 184.6 (68.0) 21 166.3 (65.3) 24 157.7 (51.0) 95 170.8 (61.9)

Denmark 25 121.7 (39.1) 25 114.8 (41.2) 25 120.0 (35.7) 25 122.6 (40.5) 100 119.8 (39.2)

Finland:

Joensuu 25 139.0 (43.3) 25 140.8 (34.5) 25 152.9 (61.7) 25 138.2 (54.5) 100 142.7 (49.6)

Turku 25 116.9 (51.9) 25 138.6 (45.8) 25 140.4 (55.6) 25 144.5 (54.0) 100 135.1 (51.9)

Germany:

Bernried 23 132.8 (49.3) 25 152.9 (52.6) 25 136.9 (59.1) 25 155.1 (56.9) 98 144.4 (54.6)

Cottbus 24 119.0 (28.2) 25 112.8 (42.5) 25 126.3 (48.7) 25 113.1 (38.2) 99 117.8 (40.1)

Heidelberg 24 139.3 (51.8) 25 150.2 (60.5) 25 156.3 (38.7) 25 161.6 (51.2) 99 151.8 (51.2)

Hungary 25 142.6 (51.1) 25 183.9 (50.7) 25 189.7 (80.9) 25 141.4 (44.4) 100 164.4 (58.5)

Iceland 25 110.8 (43.6) 25 118.5 (35.8) 25 120.1 (30.0) 25 126.8 (40.9) 100 119.1 (37.9)

India:

Ladakh 25 200.1 (72.0) 25 210.9 (70.6) 25 199.2 (68.1) 25 182.7 (99.2) 100 198.2 (78.5)

New Delhi 25 132.3 (43.8) 25 134.1 (60.9) 24 157.7 (48.5) 25 149.1 (42.4) 99 143.3 (49.5)

Table 6 (continued)

Population sampled Age 20–29 yr Age 30–39 yr Age 40–49 yr Age 50–59 yr All agesa

nb Mean

c (SD) n Mean (SD) n Mean (SD) n Mean (SD) n Mean (SD)

Italy:

Bassiano 25 179.0 (52.1) 25 154.5 (60.6) 25 181.8 (62.6) 25 153.8 (59.5) 100 167.3 (58.8)

Gubbio 25 144.9 (54.8) 25 153.9 (47.4) 25 175.8 (60.7) 25 169.7 (55.6) 100 161.1 (54.8)

Mirano 25 156.2 (48.0) 25 146.7 (48.7) 25 170.6 (45.9) 25 158.8 (63.0) 100 158.1 (51.9)

Naples 25 136.7 (47.4) 25 164.9 (47.4) 25 171.3 (61.5) 25 147.5 (34.2) 100 155.1 (48.6)

Japan:

Osaka 25 122.7 (35.8) 25 139.9 (42.9) 23 162.4 (49.2) 24 157.2 (41.5) 97 145.6 (42.6)

Tochigi 24 180.8 (77.0) 25 192.0 (66.9) 25 196.3 (89.4) 25 165.3 (50.7) 99 183.6 (72.4)

Toyama 25 166.1 (36.1) 25 209.2 (58.1) 25 219.1 (74.7) 25 209.5 (57.0) 100 201.0 (58.1)

Kenya 19 48.4 (30.6) 20 54.0 (29.7) 23 52.4 (29.8) 24 57.9 (24.7) 86 53.2 (28.8)

Malta 25 138.5 (61.8) 25 148.5 (47.1) 25 144.7 (63.1) 25 188.1 (55.8) 100 155.0 (57.3)

Mexico 23 148.7 (76.9) 20 177.4 (87.1) 18 122.2 (79.4) 20 126.3 (49.2) 81 143.6 (74.6)

Netherlands 25 125.2 (50.4) 25 140.4 (44.9) 25 136.1 (54.7) 24 115.9 (35.0) 99 129.4 (46.8)

Papua New Guinea 21 24.0 (19.3) 22 47.8 (32.7) 19 23.8 (16.8) 12 27.5 (27.7) 74 30.8 (25.0)

Poland:

Krakow 25 144.9 (58.8) 25 138.6 (51.0) 25 181.9 (67.1) 25 157.2 (54.4) 100 155.6 (58.2)

Warsaw 25 129.1 (52.8) 25 142.1 (49.8) 25 163.9 (69.2) 25 174.0 (96.4) 100 152.3 (69.6)

Portugal 25 152.7 (53.1) 24 151.1 (59.8) 26 168.7 (75.1) 24 162.5 (68.4) 99 158.7 (64.6)

Republic of Korea 25 166.3 (64.6) 25 175.9 (64.5) 23 224.8 (90.1) 25 171.1 (52.9) 98 184.5 (69.4)

Russian Federation 23 117.1 (37.4) 25 141.6 (34.8) 25 173.4 (71.2) 24 155.1 (59.4) 97 146.8 (52.9)

Table 6 (continued)

Sample Age 20-29 Age 30-39 Age 40-49 Age 50-59 All ages*

n Mean (SD) n Mean (SD) n Mean (SD) n Mean (SD) n Mean (SD)

Spain:

Manresa 25 130.7 (41.2) 25 149.8 (45.8) 25 170.5 (54.0) 25 146.5 (67.4) 100 149.4 (53.0)

Torrejon 25 166.8 (50.2) 25 165.3 (44.3) 25 161.0 (49.1) 25 172.1 (69.6) 100 166.3 (54.2)

Trinidad and Tobago 25 87.3 (39.4) 25 107.7 (48.3) 20 108.2 (45.9) 22 114.1 (51.4) 92 104.4 (46.5)

United Kingdom:

Belfast 25 147.8 (69.1) 25 142.2 (41.6) 25 135.4 (48.3) 25 138.8 (32.9) 100 141.1 (49.8)

Birmingham 25 127.5 (39.2) 25 145.7 (52.3) 25 144.9 (44.9) 25 141.4 (41.4) 100 139.9 (44.7)

South Wales 25 118.9 (36.0) 24 134.0 (40.0) 25 116.7 (34.4) 25 134.6 (53.8) 99 126.1 (41.8)

USA:

Chicago 24 99.6 (49.4) 25 154.1 (91.8) 25 121.3 (45.3) 25 108.2 (38.1) 99 120.8 (59.9)

Goodman (black) 23 89.9 (36.7) 21 126.2 (55.9) 24 109.4 (49.1) 25 116.2 (56.2) 93 110.4 (50.1)

Goodman (white) 25 114.6 (51.6) 25 113.7 (57.9) 24 115.7 (60.5) 25 121.9 (38.7) 99 116.5 (52.9)

Hawaii 22 134.0 (60.9) 25 118.4 (61.2) 25 153.7 (101.0) 21 122.0 (59.4) 93 132.0 (72.8)

Jackson (black) 25 116.9 (58.8) 25 119.8 (67.1) 25 137.1 (76.0) 25 138.2 (57.2) 100 128.0 (65.2)

Jackson (white) 25 111.0 (47.7) 25 128.2 (57.7) 24 141.8 (56.3) 25 122.8 (46.7) 99 126.0 (52.3)

Zimbabwe 20 126.4 (39.6) 25 159.3 (76.1) 25 154.2 (45.6) 25 115.7 (42.2) 95 138.9 (53.0) aStandardized by 10-year age group

bNumber of persons cMean urinary excretion of sodium in mmol/d (1 mmol = 23 mg sodium)

(adapted, by permission of the publisher, from INTERSALT Co-operative Research Group, 1988)

Table 7

Mean dietary intake or urinary excretion of sodium for adults around the world; 1988–present

Country (survey year)

Reference Sampling Age (yr) Measurement Number sampled Mean sodiuma Variability Notes

87 men 170.0 mmol/d SD 52.0 mmol/d Australia (1995)

Beard et al., 1997

Systematic sample from the Hobart electoral role 18–70 Single 24-h urine collection

107 women 118.0 mmol/d SD 42.0 mmol/d

Brazil (NS)

Pavan et al., 1997

Non-random general population sample of Amazonian Rondonia district, stratified by age and sex

22–89 Unspecified dietary questionnaire

370 individuals 3937 mg/d NS

764 men 107.0 mmol/12h SD 58.0 mmol/12h

Brazil (1999-2000)

Bisi Molina et al., 2003

Random sample of inhabitants from the city of Vitoria

25–64 Single overnight urine collection

899 women 93.0 mmol/12h SD 57.0 mmol/12h

Canada (1990–1999)

Institute of Medicine 2004, citing Health Canada

Unspecified sample from 10 provinces ≥19 Unspecified dietary method

18 214 individuals 3120 mg/d SE 40 mg/d

775 Han 193 mmol/d SE 3.5 mmol/d

510 Uygur 173.5 mmol/d SE 6.0 mmol/d

204 Kazaks 213.1 mmol/d SE 9.6 mmol/d

China (1985–2000)

Liu et al., 2001

Random samples of men and women from Han, Uygur, Kazak and Tibetan ethnic populations

48–56 Single 24-h urine collection

125 Tibetans 253.7 mm/d SE 10.2 mmol/d

Approximately even number of men and women

Individuals with incomplete urine collections, or prescribed drug treatment for hypertension were excluded (but are included in given number sampled)

572 men 205.1 mmol/d SD 84.8 mmol/d China (1985–1999)

Liu et al., 2002

Random population samples from 11 locations throughout China

48–56 Single 24-h urine collection

563 women 175.4 mmol/d SD 83.9 mmol/d

Individuals with incomplete urine collections prescribed drug treatment for hypertension excluded

500 men 4841 mg/d NS China (1995–1996)

Woo et al., 1998

Age-sex stratified random sample of the Hong Kong Chinese population

25–74 266 item FFQ

510 women 4518 mg/d NS

8 men 2520 mg/d SD 2600 mg/d China (Province of Taiwan) (1990)

Liu & Chung, 1992

Non-random sample of students, faculty and staff of the National Tsing Hua University

NS Chemical analysis of 3 day duplicate food portions 7 women 2260 mg/d SD 1200 mg/d

14–40 438 individuals 144.0 mmol/d SD 54.0 mmol/d France (NS)

du Cailar et al., 2004

Individuals attending outpatient clinic in Montpellier for detection of CVD risk factors

41–70

Two 24-h urine collections

417 individuals 147.0 mmol/d SD 62.0 mmol/d

Approximately equal number of men and women.

Those with heart disease, atherosclerosis, diabetes, renal disease, severe obesity, history of alcohol abuse were excluded

Table 7 (continued)

Country (survey year)

Reference Sampling Age Measurement Number sampled Mean sodiuma Variability Notes

Finland (2002)

Laatikainen et al., 2006

Random sample stratified by age and sex from population lists of 3 areas

25–64 Single 24-h urine collection

168 men (North Karelia)

163.2 mmol/d

95% CI 153.2–173.1 mmol/d

128 men (south-western Finland)

169.6 mmol/d

95% CI 156.5–182.7 mmol/d

127 men (Helsinki) 147.8 mmol/d 95% CI 131.7–163.8 mmol/d

174 women (North Karelia)

127.8 mmol/d 95% CI 120.5–135.0 mmol/d

156 women (south-western Finland)

127.1 mmol/d 95% CI 119.3–134.9 mmol/d

156 women (Helsinki) 119.1 mmol/d 95% CI 110.9–127.4 mmol/d

Rasht: 340 individuals 210.0 mmol/L SD 89.0 mmol/l Unspecified urine collection

Sari: 343 individuals 188.0 mmol/L SD 89.0 mmol/l

Rasht: 340 individuals 2935 mg/d SD 1850 mg/d

Islamic Republic of Iran (1998)

Azizi et al., 2001

Random sample of households from two cities: Rasht and Sari

>2

FFQ and 2 weeks weighed discretionary salt

Sari : 343 individuals 3032 mg/d SD 1575 mg/d

Approximately equal number of men and women

Italy (NS)

Pavan et al., 1997

Non-random general population sample from the towns of Mirano and Castelfranco Veneto, stratified by age and sex

22–89 Unspecified dietary questionnaire

370 men and women 4331 mg/d NS

484 men 221.2 mmol/d SE 4.2 mmol/d Japan (1985–1999)

Liu et al., 2000

Random population samples from 8 locations throughout Japan

48–56 Single 24-h urine collection

542 women 194.5 mmol/d SE 3.1 mmol/d

Individuals with incomplete urine collections prescribed drug treatment for hypertension were excluded

132 men 231 mmol/d SE 78 mmol/d Japan (1993–1994)

Kawamura et al., 1997

Non-random sample of healthy long-term residents of the Moriokia Iwate area

30–65 Single 24-h urine collection

70 women 189 mmol/d SE 78 mmol/d

Known to be an area of high sodium consumption

Men: 137.0 mmol/d SD 66.0 mmol/d Netherlands (NS)

Geleijnse et al., 1997

Non-random sample. All age-eligible residents of a suburb of Rotterdam were invited to participate

>55 Single overnight urine collection

1006 men and women

Women: 103.0 mmol/d

SD 50.0 mmol/d

Sex-specific number of persons not reported

Nigeria (1994)

Kaufman et al., 1996

Random recruitment of ‘rural farmers’ and ‘urban poor’ who had participated in an earlier study, and of age-eligible members of the Nigerian Railway Pensioners’ Union

>45 Single 24-h urine collection

144 men 111.6 mmol/d SD 53.6 mmol/d

Single 24-h urine collection

50 men and women 135 mmol/g creatinine

SE 15 mmol/g creatinine

Panama (NS)

Hollenberg et al., 1997

Non-random samples of Kuna Indians from the isolated San Blas Islands. All participants were from the same 9 families

18–82

Single 24-h dietary recall

50 men and women 4830 mg/d SE 506 mg/d

> 50% of urine collections thought to be incomplete

Table 7 (continued)

Country (survey year)

Reference Sampling Age Measurement Number sampled Mean sodiuma Variability Notes

455 American Samoans

884 mg/1000kcal SD 616 mg/1000kcal

Samoa (1990–1991)

Galanis et al., 1999

Individuals recruited from 46 villages and worksites in American Samoa, and 9 villages in Western Samoa. Samoans with European or Asian ancestry were excluded

25–55 Single 24-h dietary recall

491 Western Samoans

622 mg/1000kcal SD 495 mg/1000kcal

Approximately equal number of men and women

American Samoans mean energy intake 2468 kcal/d

Western Samoans mean energy intake 2835 kcal/d

110 black 135.3 mmol/d SD 50.1 mmol/d

112 mixed ancestry 147.5 mmol/d SD 73.5 mmol/d

Three 24-h urine collections over a 3-week period

103 white 164.8 mmol/d SD 91.0 mmol/d

110 black 1467 mg/d SD 891 mg/d

112 mixed ancestry 1761 mg/d SD 885 mg/d

South Africa (NS)

Charlton et al., 2005

Individuals recruited from Cape Town City Council 20–65

Three 24-h dietary recalls over the same period

103 white 1922 mg/d SD 911 mg/d

Approximately even number of men and women

986 normotensive 2141 mg/d NS

371 non-medicated hypertensive

2216 mg/d NS

Spain (1994–1996)

Schröder et al., 2002

Random sample of Gerona province population, stratified by age and sex

25–74 72-h dietary recall

210 medicated hypertensive

2113 mg/d NS

Means are age/sex/energy adjusted

Uganda and United Republic of Tanzania (NS)

Pavan et al., 1997

Non-random general population sample of Lugarawa and Lugbara districts, stratified by age and sex

22–89 Unspecified dietary questionnaire

370 individuals 1575 mg/d NS

Venezuela (NS)

NS 77 adults from high altitude

2082 mg/d NS

Negretti de Bratter et al., 1998

Individuals recruited for a case-control study in high- and low altitude areas of the state of Tachira

NS

Chemical analysis of one day duplicate food portions

33 adults from low altitude

1471 mg/d NS

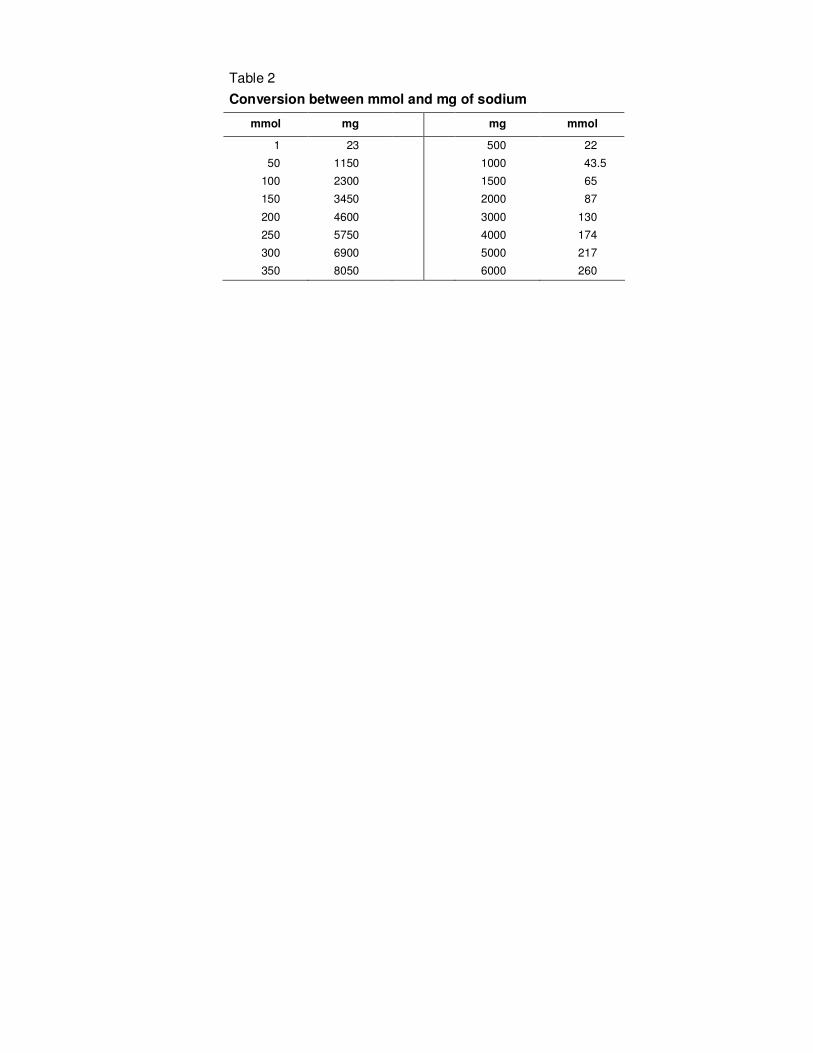
a mean dietary intake or urinary excretion of sodium (1 mmol = 23 mg; 1,000 mg = 43.5 mmol)

CI, confidence interval; CVD, cardiovascular disease; FFQ, food frequency questionnaire; NS, not stated; SD, standard deviation; SE, standard error

Table 8

Mean dietary intake of sodium among the men and women in four countries in the INTERMAP study

Sample

Men (ages 40–59 yr)

Women (ages 40–59 yr)

No. of persons Dietary Na intakea No. of persons Dietary Na intake

a

Mean (SD) Mean (SD)

China – North 276 2311.5 (646.4) 285 2,313.8 (640.4)

China – South 140 1303.7 (451.6) 138 1,317.5 (542.6)

Japan 574 2271.0 (464.0) 571 2,361.3 (447.5)

United Kingdom 266 1598.6 (359.2) 235 1,618.0 (363.2)

USA 1103 1649.9 (384.6) 1,092 1,677.8 (384.6) aMean dietary intake of sodium (Na; 1000 mg = 43.5 mmol)

(Adapted, by permission of the publisher, from Stamler et al., 2003b)

Table 9

Urinary sodium excretion in men and women in Belgium

Year

Number of persons

Mean urinary sodium excretiona

(mmol/d)

Men (≥ 65 yr) Women (≥ 60 yr)

1967 510 265 208

1972 366 202 160

1982 828 161 124

1983 344 175 142

1986 162 188 160

aStandardized to expected daily creatinine excretion of 13.1 mmol

(men), 9.8 mmol (women).

Sodium: 1 mmol = 23 mg

Adapted, by permission of the publisher, from Joossens & Kesteloot 1991.

Table 10

Mean dietary intake or urinary excretion of sodium for children and adolescents from around the world

Country (survey year)

Reference Sampling Age (yr) Measurement Number of persons

Mean sodium intake

a or

excretionb

Variabilityc Notes

434 boys 2,640 mg/d SD 710 mg/d Australia (1985)

Jenner et al., 1988

Representative random sample of Perth school children

9 160 item FFQ

450 girls 2,410 mg/d SD 710 mg/d

Austria (1986)

Knuiman et al., 1988

Random sample of boys from selected schools in Vienna

8–9 Single 24-h urine collection

43 boys 106.0 mmol/d SE 6.3 mmol/d

82 boys 142.0 mmol/d SD 64.0 mmol/d Belgium (1979–1981)

Staessen et al., 1983

Random population sample from two towns 10–19 Single 24-hr urine collection

78 girls 129.0 mmol/d SD 48.0 mmol/d

Belgium (1986)

Knuiman et al., 1988

Random sample of boys from selected schools in Ghent

8–9 Single 24-h urine collection

38 boys 92.0 mmol/d SE 6.2 mmol/d

Bulgaria (1986)

Knuiman et al., 1988

Random sample of boys from selected schools in Sofia

8–9 Single 24-h urine collection

58 boys 93.0 mmol/d SE 4.3 mmol/d

China

(1985)

Zhu et al., 1987

Non-random sample of boys from two schools in Wuhan

7–8 Seven 24-h urine collections

148 boys 128.8 mmol/d SD 35.9 mmol/d

3 consecutive 24-h urine collections

94 boys & 87 girls 174.4 mmol/d SD 63.3 mg/d China

(NS)

Wu et al., 1991

Non-random sample from rural area of Shaanxi 12–16

4 corresponding 24-h dietary recalls

94 boys & 87 girls 5255 mg/d SD 1903 mg/d

116 boys 4400 mg/d SD 1600 mg/d Denmark (1995)

Lyhne, 1998 National 14–19 7-d diet diary

129 girls 3100 mg/d SD 1000 mg/d

Finland (1986)

Knuiman et al., 1988

Random sample of boys from selected schools in Turku

8–9 Single 24-h urine collection

48 boys 94.0 mmol/d SE 5.2 mmol/d

Berlin: 44 boys 103.0 mmol/d SE 9.5 mmol/d

Freiburg: 46 boys 127.0 mmol/d SE 8.1 mmol/d

Germany (1986)

Knuiman et al., 1988

Random sample of boys from selected schools in three areas

8–9 Single 24-h urine collection

Heidelberg: 40 boys 106.0 mmol/d SE 5.7 mmol/d

Germany

(1998)

Deutsche Gesellschaft fur Ernahrung eV 2000*

National 14–19 1-d weighed record & diet history

38 924 boys & girls 3200 mg/d NS

Greece (1986)

Knuiman et al., 1988

Random sample of boys from selected schools in Athens

8–9 Single 24-h urine collection

50 boys 112.0 mmol/d SE 6.1 mmol/d

Boys: 2436 mg/d SD 981 mg/d Greece (1987–1988)

Hassapidou et al., 2001*

Local 13–14 3-d weighed record

20 boys & girls

Girls: 1796 mg/d SD 847 mg/d

46 boys 146.0 mmol/d SE 8.4 mmol/d Hungary (1986)

Knuiman et al., 1988

Two random sample of boys from selected schools in Budapest

8–9 Single 24-h urine collection

27 boys 138.0 mmol/d SE 7.7 mmol/d

Country (survey year)

Reference Sampling Age (yr) Measurement Number of persons

Mean sodium intake

a or

excretionb

Variabilityc Notes

Catania: 45 boys 131.0 mmol/d SE 7.2 mmol/d

Milan: 48 boys 115.0 mmol/d SE 5.8 mmol/d

Italy (1986)

Knuiman et al., 1988

Random sample of boys from selected schools in three areas

8–9 Single 24-h urine collection

Rome: 45 boys 114.0 mmol/d SE 6.0 mmol/d

55 boys 3174 mg/d SD 805 mg/d Italy (1988)

Agostoni et al., 1998

Sample of boys and girls from the town of Corsico 11 Single 24-h dietary recall

65 girls 3266 mg/d SD 1058 mg/d

Single overnight urine collection

169 boys & 153 girls 25.2 mmol SD 14.0 mmol Urine collections not adjusted to 24-h

Japan (NS)

Yamauchi et al., 1994

Non-random sample from city of Nagoya 6–11

7-d diet diary 169 boys & 153 girls 2953 mg/d SD 1051 mg/d

108 boys 140.8 mmol/d NS Netherlands (1975–1978)

Geleijnse et al., 1990

Random sub-sample of population study of a suburban town in western Netherlands

5–17 > 6 overnight urine collections

125 girls 131.1 mmol/d NS

Netherlands (1986)

Knuiman et al., 1988

Random sample of boys from selected schools in Wageningen

8–9 Single 24-h urine collection

43 boys 91.0 mmol/d SE 5.0 mmol/d

Poland (1986)

Knuiman et al., 1988

Random sample of boys from selected schools in Warsaw

8–9 Single 24-h urine collection

60 boys 101.0 mmol/d SE 5.0 mmol/d

Boys: 1950 mg/d SD 579 mg/d Poland (1996–1998)

Hamulka & Gronowska-Senger 2000*

Regional 9–11 Single 24-h dietary recall & FFQ

224 boys & girls

Girls: 2638 mg/d SD 749 mg/d

Portugal (1986)

Knuiman et al., 1988

Random sample of boys from selected schools in Lisbon

8–9 Single 24-h urine collection

52 boys 128.0 mmol/d SE 6.0 mmol/d

Madrid: 57 boys 122.0 mmol/d SE 5.3 mmol/d Spain (1886)

Knuiman et al., 1988

Random sample of boys from selected schools in Madrid & Santiago

8–9 Single 24-h urine collection

Santiago: 57 boys 127.0 mm/d SE 5.3 mmol/d

Sweden (1986)

Knuiman et al., 1988

Random sample of boys from selected schools in Lund

8–9 Single 24-h urine collection

40 boys 97.0 mmol/d SE 5.2 mmol/d

14 yr: 155 boys 3005 mg/d SD 842 mg/d

14 yr: 189 girls 2226 mg/d SD 538 mg/d

17 yr: 211 boys 3499 mg/d SD 910 mg/d

Sweden

(1989–1990)

Bergstrom et al., 1993

Non-random sample of boys & girls from four schools in the city of Umea

14–17 7-d diet diary

17 yr: 176 girls 2246 mg/d SD 651 mg/d

Uppsala: 99 boys 3573 mg/d SD 964 mg/d

Uppsala: 104 girls 2694 mg/d SD 616 mg/d

Trollhattan: 85 boys 3288 mg/d SD 771 mg/d

Sweden (1993–1994)

Samuelson et al., 1996

Random sample of boys & girls from Uppsala and Trollhattan

15 7-d diet diary

Trollhatan: 110 girls 2278 mg/d SD 544 mg/d

Country (survey year)

Reference Sampling Age (yr) Measurement Number of persons

Mean sodium intake

a or

excretionb

Variabilityc Notes

848 boys 1532 mg/d SE 16.0 mg/d United Kingdom (1992-1993)

Gregory et al., 1995

Nationally representative sample 1.5–4.5 4-d weighed record

827 girls 1480 mg/d SE 16.5 mg/d

856 boys 2630 mg/d SD 828 mg/d 7-d weighed record

845 girls 2156 mg/d SD 579 mg/d

942 boys 147.1 mmol/L SD 59.1 mmol/L

United Kingdom (1997)

Gregory & Lowe 2000

Nationally representative sample 4–18

Single spot urine collection

909 girls 143.9 mmol/L SD 57.7 mmol/L

No volume or duration data for urine, so excretion rate cannot be calculated

356 black girls 112.8 mmol/d SD 48.0 mmol/d USA

(1968–1970)

Watson et al., 1980

Random sample, stratified by race, of black and white girls from schools in Hinds county, MS

14–18 1–6 24-h urine collections

104 white girls 98.4 mmol/d SD 50.4 mmol/d

45 black children 140.0 mmol/d SD 47.3 mmol/d

28 white children 121.1 mmol/d SD 34.3 mmol/d

31 boys 149.2 mmol/d SD 46.0 mmol/d

USA (NS)

Cooper et al., 1980

Non-random sample of black and white children from two Chicago, MI schools

11–14 7 24-h urine collections

42 girls 120.6 mmol/d SD 37.6 mmol/d

Black children were one school year older than white children

130 boys 43.4 mmol - USA (NS)

Ellison et al., 1980

Non-random sample of participants from the Collaborative Perinatal Study cohort, Boston, MA

16–17 3 overnight urine samples

118 girls 30.8 mmol -

Urine collections not adjusted to 24-h, mean collection period 9.2 h

3 overnight urines combined to give 24-h estimate

36 boys & girls 103.9 mmol/d SD 69.2 mmol/d USA (NS)

Faust et al., 1982

Non-random sample of residents from a rural area of Michigan

< 18

FFQ 18 boys & girls 1980 mg/d SD 1041 mg/d

3 schools: 97 children

126.8 mmol/d SD 36.9 USA

(NS)

Cooper et al., 1983

Non-random sample of black children from five schools in Chicago, MI

11–14 7 24-h urine collections

2 schools: 72 children

107.2 mmol/d SD 35.5

USA (1978–1979)

Connor et al., 1984

Random sample of households in a suburb of Portland, OR

6–15 Single 24-h urine collection

115 boys & girls 102.0 mmol/d SD 54.0 mmol/d

987 black girls 3073 mg/d SD 1072 mg/d USA (1987–1999)

Simon et al., 1994

Non-random sample of girls from schools in Richmond, CA and Cincinnati, OH. A random age–race stratified sample from families of the Group Health Association, Washington, DC

9–10 3-d diet diary

1043 white girls 2803 mg/d SD 833 mg/d

USA (NS)

Gillman et al., 1992

Non-random sample of children: The Framingham Children’s Study

3–5 4 3-d diet diaries during a 1-yr period

89 boys & girls 2045 mg/d SD 442 mg/d Unequal number of boys (n = 55) & girls (n = 34)

66 black children 144.4 mmol/d SD 48 mmol/d USA (NS)

Harshfield et al., 1991

Non-random sample of black & white children recruited from churches, schools & social organisations in Tennessee

10–18 Single 24-h urine collection

74 white children 129.4 mmol/d SD 54 mmol/d

aSodium intake expressed in mg/d;1,000 mg sodium = 43.5 mmol;

bSodium excretion expressed in mmol/d; 1 mmol = 23 mg sodium;

c SD, standard deviation; SE, standard error

NS, not stated ; FFQ, food frequency questionnaire

*Cited in Lambert et al. 2004

Table 11

Mean sodium intake of children and adolescents in the USA (United States Third National Health and Nutrition Examination Survey, 1988–1994)

Sodium (mg/d)a Sex/age

Number of persons

Mean SE

Both sexes

2–6 months 793 282 -

7–12 months 827 846 -

1–3 years 3309 2114 -

4–8 years 3448 2864 47

Boys

9–13 years 1219 3809 141

14–18 years 909 4598 135

Girls

9–13 years 1216 3178 79

14–18 years 949 3083 114 a1000 mg = 43.5 mmol

Adapted from Institute of Medicine 2004, http://www.nap.edu/catalog.php?record_id=10925.

Table 12

Comparison of the sodium content of ‘natural’ and processed foods

Food item Description Sodium content (mg per 100 g)

a

Beef Topside, roast, lean and fat 48

Corned beef, canned 950

Bran Bran, wheat 28

Bran flakes 1000

Cheese Hard cheese, average 620

Processed 1320

Chick-peas Dried, boiled in unsalted water 5

Canned, re-heated, drained 220

Crab Boiled 370

Canned 550

Cod Cod, in batter, fried in blended oil 100

Fish fingers, fried in blended oil 350

New potatoes Raw, boiled in unsalted water 9

Canned, re-heated, drained 250

Peanuts Plain 2

Dry roasted 790

Roasted and salted 400

Peas Raw, boiled in unsalted water Trace

Canned, re-heated, drained 250

Potato chips Homemade, fried in blended oil 12

(French fries) Oven chips, frozen, baked 53

Salmon Raw, steamed 110

Canned 570

Smoked 1880

Sweet corn On-the-cob, whole, boiled in unsalted water 1

Kernels, canned, re-heated, drained 270

Tuna Raw 47

Canned in oil, drained 290

Canned in brine, drained 320

a1000 mg = 43.5 mmol

Adapted, by permission of the publisher, from Holland et al., 1991.

Table 13

Amount of sodium and percentage contributions that different foods make to average intake of sodium per person per daya in about 6000 households in the United Kingdom

Food

Sodium mg

b

%

Cereals and cereal products (e.g. bread, breakfast cereals, biscuits, cakes, pastries)

980

37.7

Meat and meat products 540 20.8

Other foods (e.g. soups, pickles, sauces, baked beans)

330

12.7

Processed vegetables (including crisps and snacks)

220

8.5

Milk and cream 140 5.4

Fats and oils 120 4.6

Cheese 110 4.2

Fish 70 2.7

Eggs 20 0.8

Fresh vegetables 20 0.8

Fruit 10 0.4

Total (average daily intake) 2560 98.6

aAssessed from household food only, excluding salt added at the table or during

cooking, and sodium eaten away from the home. b1000 mg = 43.5 mmol

Adapted from Scientific Advisory Committee on Nutrition 2003, http://www.sacn.gov.uk/pdfs?sacn_salt_final.pdf.

Table 14

Food sources of sodium among adults in the USA

Sodium 1994-1996ab

(mean=3,393 mg)

Sodium 1989-1991c

(mean=3,153 mg) Food group

Ranking % Total Cumulative % Ranking % Total Cumulative %

Other foodsd

1 25.4 25.4 1 23.4 23.4

Yeast bread 2 10.7 36.1 2 10.9 34.3

Cheese 3 5.5 41.6 3 5.6 39.9

Ham 4 3.4 45.0 4 4.1 44.0

Salad dressings/mayonnaise

5 3.2 48.2 7 3.1 47.1

Cakes/cookies/quick-breads/doughnuts

6 3.1 51.3 10 2.5 49.6

Beef 7 3.0 54.3 8 3.0 52.6

Milk 8 2.6 56.9 6 3.2 55.8

Cold cuts (excluding ham) 9 2.6 59.5 13 <2.0 …

Ready-to-eat cereal 10 2.5 62.0 9 2.8 58.6

Condiments/other sauces 11 2.4 64.4 15 <2.0 …

Sausage 12 2.3 66.7 12 2.4 61.0

Poultry 13 2.0 68.7 16 <2.0 …

Margarine 16 <2.0 … 11 2.4 63.4

Tomatoes 25 <1.0 … 5 3.7 67.1

a Food groups (n=10) contributing

at least 1% in descending order: potato chips/com chips/popcorn, crackers/pretzels, margarine, hot dogs,

consommé/broth/bouillon, rice/cooked grains, biscuits, pasta, cucumbers/pickles, and bacon b

Data are for persons aged 19 years and older, Day 1 intakes (see US Dept of Agriculture, 2000) c

Source: Subar AF et al. 1998 d

Includes (salt from disaggregated food mixtures), monosodium glutamate, spices, herbs, plain gelatine, gums, seaweed, grain-based beverages, and cocoa

powder.

Adapted, by permission of the publisher, from Cotton et al. 2004, Table 23.

Table 15

Sodium content of selected foods available in restaurants in the USA

Food item

Sodium (mg)

a

Cheese Fries with ranch dressing 4890

Schlotzky’s Large Original sandwich 4590

Dunkin’ Donuts Salt Bagel 4520

Denny’s Lumberjack Slam (two eggs, three hotcakes with margarine & syrup, ham, two strips of bacon, & two sausage links

4460

Fried whole onion with dipping sauce 3840

House lo mein 3460

Denny’s Meat Lover’s Breakfast (two eggs, bacon, two sausages, hash brown potatoes, & toast)

3460

Reuben sandwich 3270

Beef with broccoli and rice 3150

General Tso’s chicken with rice 3150

Orange (crispy) beef with rice 3140

Overstuffed corned beef sandwich with mustard 3130

Shrimp with garlic sauce and rice 2950

Denny’s Moons Over My Hammy (ham & egg sandwich with Swiss & American cheese on sourdough

2700

House fried rice 2680

Kung pao chicken with rice 2610

Moo shu pork with rice 2590

Buffalo wings with blue cheese dressing & celery sticks 2460

Spaghetti with sausage 2440

Beef & cheese nachos with sour cream and guacamole 2430

a1000 mg = 43.5 mmol

Adapted from Center for Science in the Public Interest, 2005, http://www.cspinet.org/new/pdf/salt_report_update.pdf

Table 16

Mean intake of total sodium, sodium from cooking salt, and sodium from soy sauce by area, for the participants of the China Health and Nutrition Survey, 2002

Sodium from cooking salt

Sodium from soy sauce

b

Area Mean total sodium intake (mg/d)

a

mg/d % total mg/d % total

Urban 6007 4291 71.4 610 10.2

Rural 6368 4882 76.7 472 7.4

All (urban + rural) 6268 4724 75.4 512 8.2

a1000 mg = 43.5 mmol

bCalculated from the INTERMAP value (Stamler et al., 2003b) for ‘Common Soy Sauce’: 5757 mg

sodium per 100g

Source: Zhao, L, personal communication

Table 17

Main dietary sources (>1%) of sodium for INTERMAP Study participants from Japan and China

Dietary sources Sodium

mg/da % total

China (no. of persons = 839)

1 Salt added during cooking 3,025 77.5

2 Soy sauce 255 6.5

3 Vegetablesb 191 4.9

4 Sodium bicarbonate (tenderizer) 98 2.5

5 Noodles 89 2.3

6 Bread 88 2.3

Total 3746 96.9

Japan (no. of persons = 1145)

1 Soy sauce 931 20.9

2 Fish and other sea foodb 722 16.2

3 Soup (Miso, Soy, Salt) 682 15.3

4 Vegetablesb 612 13.8

5 Salt added during cooking 441 9.9

6 Other sauces (cooking and table, incl. soy bean paste)

299 6.7

7 Bread 177 4.0

8 Meatb 93 2.1

9 Noodles 72 1.6

10 Milk 54 1.2

Total 4132 91.8 a1000 mg = 43.5 mmol

bIt was not possible to disaggregate vegetables, meat or fish entirely in to fresh and

preserved foods. Inspection of individual food diaries indicated that pickled, salted and canned goods were responsible for the high contributions to sodium intake.

Unpublished data reproduced by permission from the International Co-operative INTERMAP Study.

Table 18

Sodium content of foods consumed commonly in Malaysia

Food item Serving Sodium (mg)a

Sauces and seasonings

Mono-sodium glutamate 1 tablespoon 1845

Light soya sauce 1 tablespoon 1255

Dark soya sauce 1 tablespoon 564

Fish sauce 1 tablespoon 1032

Oyster sauce 1 tablespoon 779

Chilli sauce 1 tablespoon 224

Prawn paste 1 tablespoon 286

Shrimp paste (belacan) 1 piece (40g) 629

Processed fish/seafood items

Dried cuttlefish 1 serving 799

Fish curry, canned 1 tin 1056

Fish rice porridge 1 packet 294

Dried anchovies 1/2 cup 758

Prawns dried and salted 1/2 cup 1586

Fishball 4 pieces 756

Bread products & biscuits

Ryemeal bread 2 slices 242

White bread 2 slices 194

Wholemeal bread 2 slices 156

Roti cani 1 piece 509

Dosai 1 piece 132

Fish satay snack 5 sticks 380

Prawn crackers 5 pieces 253

Plain biscuits 5 pieces 206

Preserved items

Dried seaweed 1 cup 616

Salted egg 1 whole 249

Salted cabbage 1 cup 2763

Pickled bamboo shoot 1 cup 938

French fries 1 cup 209

Fried fishcake with bun 1 854

Beef burger 1 554

Cheese burger 1 864

Pizza (chicken, tomato, mushroom) ¼ of pizza 805

Fried chicken 1 piece 504

Local dishes from ‘Hawker’ markets

Mee curry 1 bowl 2456

Mee soup 1 bowl 1695

Mee goring 1 plate 1112

Kuih-teow, Bandung style 1 plate 1143

Fried rice 1 plate 1465

Chicken rice 1 plate 702

Egg banjo 1 piece 412

Nasi Lemak 1 plate 777

Rojak 1 plate 901

Nasi Dagang 1 plate 428 a1000 mg = 43.5 mmol

Adapted, by permission of the publisher, from Campbell et al., 2006, pp35-37.

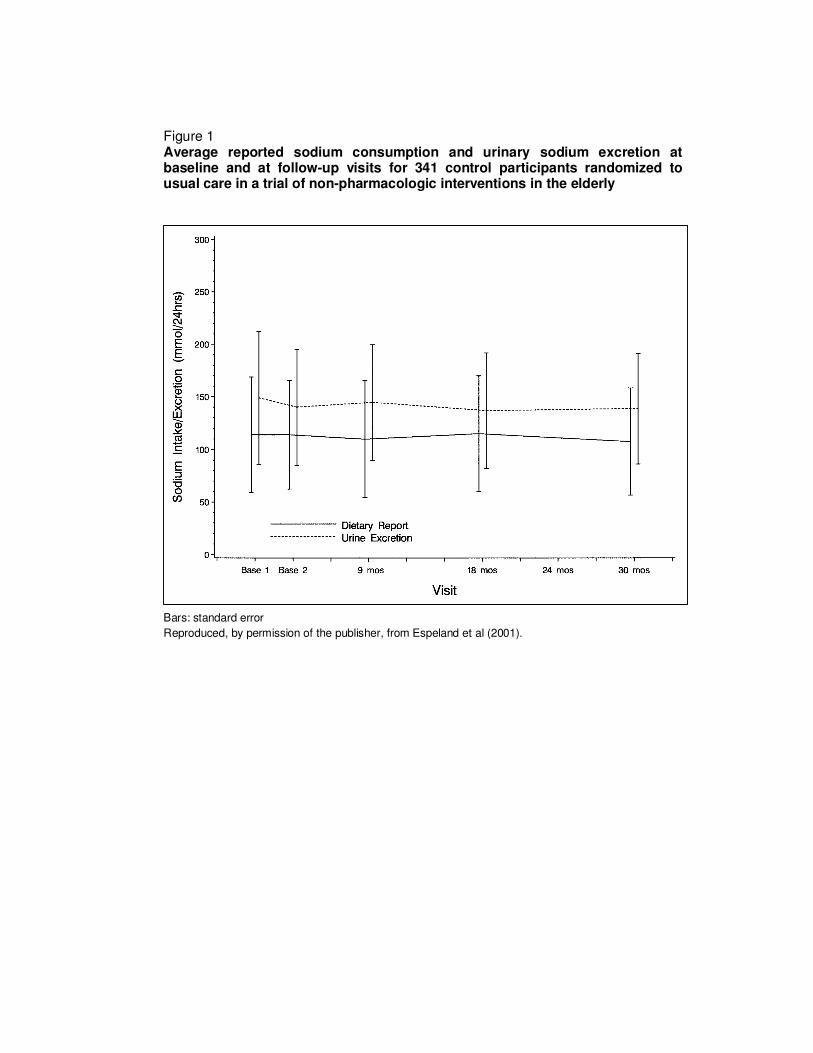
Figure 1 Average reported sodium consumption and urinary sodium excretion at baseline and at follow-up visits for 341 control participants randomized to usual care in a trial of non-pharmacologic interventions in the elderly

Bars: standard error

Reproduced, by permission of the publisher, from Espeland et al (2001).
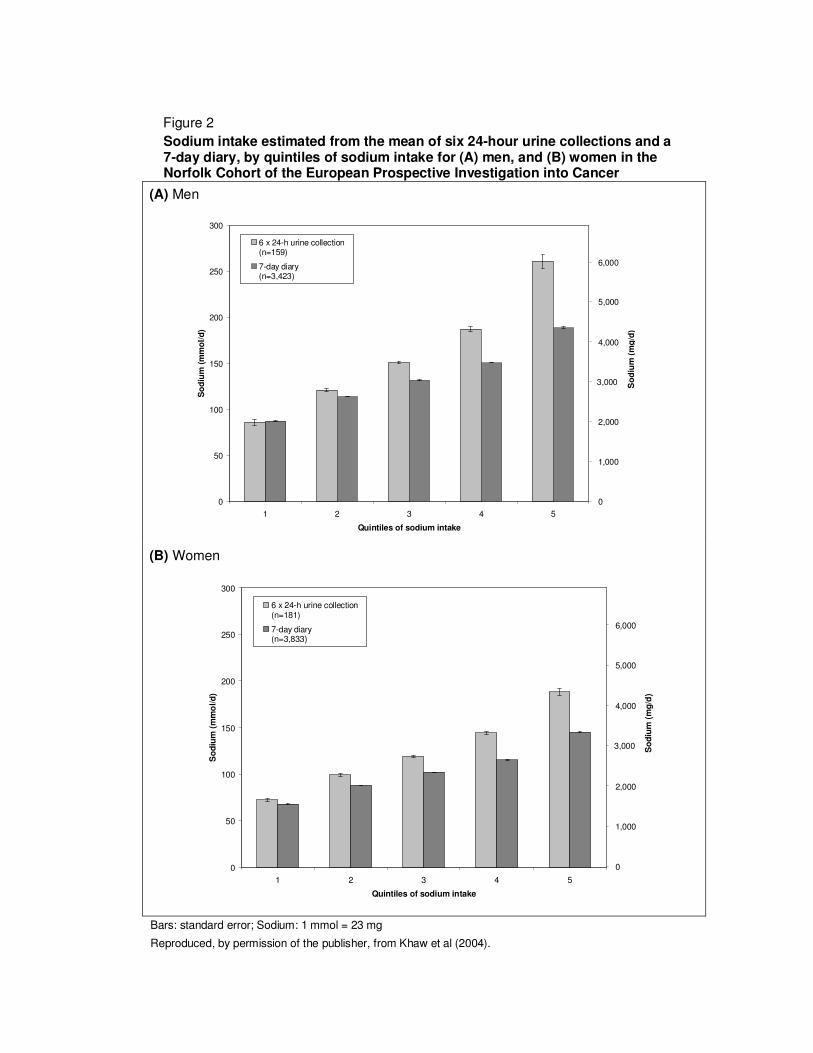
Figure 2

Sodium intake estimated from the mean of six 24-hour urine collections and a 7-day diary, by quintiles of sodium intake for (A) men, and (B) women in the Norfolk Cohort of the European Prospective Investigation into Cancer

(A) Men

(B) Women

Bars: standard error; Sodium: 1 mmol = 23 mg

Reproduced, by permission of the publisher, from Khaw et al (2004).

0

50

100

150

200

250

300

1 2 3 4 5

Quintiles of sodium intake

So

diu

m (

mm

ol/

d)

6 x 24-h urine collection(n=159)

7-day diary(n=3,423)

So

diu

m (

mg

/d)

0

1,000

2,000

3,000

4,000

5,000

6,000

0

50

100

150

200

250

300

1 2 3 4 5

Quintiles of sodium intake

So

diu

m (

mm

ol/d

)

6 x 24-h urine collection(n=181)

7-day diary(n=3,833)

So

diu

m (

mg

/d)

0

1,000

2,000

3,000

4,000

5,000

6,000

Fig 3

Sodium intake estimated from the mean of two 24-hour urine collections and the mean of four 24-hour dietary recalls for (A) men, and (B) women in the INTERMAP Study, 1996–1999

(A) Men

(B) Women

Bars: standard error Reproduced, by permission of the publisher, from International Co-operative INTERMAP Study

0

50

100

150

200

250

300

350

Japan

(n=574)

PR of China: North

(n=276)

PR of China:

South

(n=141)

UK

(n=266)

USA

(n=1,103)

So

diu

m (

mm

ol/d

)2 x 24-h urine collection

4 x 24-h dietary recall

So

diu

m (

mg

/d)

0

1,000

2,000

3,000

4,000

5,000

6,000

0

50

100

150

200

250

300

Japan

(n=571)

PR of China: North

(n=285)

PR of China:

South

(n=138)

UK

(n=235)

USA

(n=1,092)

Sodiu

m (m

mol/d)

2 x 24-h urine collection

4 x 24-h dietary recall

Sodiu

m (m

g/d

)

0

1,000

2,000

3,000

4,000

5,000

6,000

Figure 4 Correlation of average daily salt (sodium chloride) intakes with prevalence of hypertension in different geographic areas and among different races

Sodium chloride: 1 g = 393.4 mg sodium

Reproduced, by permission of the publisher, from Dahl (1960).

Figure 5 Distribution of death rate (per 100 000 males aged 30–59 years) from cerebral haemorrhage, in various regions of Japan. Average daily salt intakes of farmers in four regions added to original figure

Adapted, by permission of the publisher, from Dahl (1960).

Figure 6

Frequency distribution of mean urinary sodium excretion among 28 populations from around the world

Sodium: 1 mmol = 23 mg Reproduced, by permission of the publisher, from Froment, Milon & Gravier (1979).

0

10

20

30

40

50

60

0 - 4

9

50 -

99

100

- 149

150 - 1

99

200

- 249

250 - 2

99

300

- 349

350 - 4

00

Sodium (mmol/d)

Fre

qu

en

cy (

%)

Figure 7

Frequency distribution of mean urinary sodium excretion among 52 population samples of (A) men and (B) women of the INTERSALT Study, 1985–1987

(A) Men

(B) Women

Sodium: 1 mmol = 23 mg

Reproduced, by permission of the publisher, from INTERSALT (1989).

0

10

20

30

40

50

60

0 - 4

9

50 -

99

100

- 149

150

- 199

200

- 249

250

- 299

300

- 349

350

- 400

Sodium (mmol/d)

Fre

qu

en

cy

(%

)

0

10

20

30

40

50

60

0 - 4

9

50 -

99

100

- 149

150

- 199

200

- 249

250

- 299

300

- 349

350

- 400

Sodium (mmol/d)

Fre

qu

en

cy

(%

)

Figure 8 Frequency distribution of mean urinary sodium excretion for men and women: INTERMAP Study, 1996–1999

(A) Japan: men (n=574) (B) Japan: women (n=571)

0

2

4

6

8

10

12

14

16

18

20

22

24

10 30 50 70 90 110 130 150 170 190 210 230 250 270 290 310 330 350 370 390 410 430 450 470 490 510 530 550 570 590 610 630

Sodium (mmol/d)

Fre

qu

en

cy

(%

)

0

2

4

6

8

10

12

14

16

18

20

22

24

10 30 50 70 90 110 130 150 170 190 210 230 250 270 290 310 330 350 370 390 410 430 450 470 490 510 530 550 570 590 610 630

Sodium (mmol/d)

Fre

qu

en

cy

(%

)

(C) People’s Republic of China, North: men (n=276) (D) People’s Republic of China, North: women (n=285)

(E) People’s Republic of China, South: men (n=140) (F) People’s Republic of China, South: women (n=138)

0

2

4

6

8

10

12

14

16

18

20

22

24

10 30 50 70 90 110 130 150 170 190 210 230 250 270 290 310 330 350 370 390 410 430 450 470 490 510 530 550 570 590 610 630

Sodium (mmol/d)

Fre

qu

en

cy

(%

)

0

2

4

6

8

10

12

14

16

18

20

22

24

10 30 50 70 90 110 130 150 170 190 210 230 250 270 290 310 330 350 370 390 410 430 450 470 490 510 530 550 570 590 610 630

Sodium (mmol/d)

Fre

qu

en

cy

(%

)

0

2

4

6

8

10

12

14

16

18

20

22

24

10 30 50 70 90 110 130 150 170 190 210 230 250 270 290 310 330 350 370 390 410 430 450 470 490 510 530 550 570 590 610 630

Sodium (mmol/d)

Fre

qu

en

cy

(%

)

0

2

4

6

8

10

12

14

16

18

20

22

24

10 30 50 70 90 110 130 150 170 190 210 230 250 270 290 310 330 350 370 390 410 430 450 470 490 510 530 550 570 590 610 630

Sodium (mmol/d)

Fre

qu

en

cy

(%

)

(G) UK: men (n=266) (H) UK: women (n=266)

(I) USA: men (n=1,103) (J) USA: women (n=1,103)

Sodium: 1 mmol = 23 mg

Unpublished data reproduced by permission from the International Co-operative INTERMAP Study.

0

2

4

6

8

10

12

14

16

18

20

22

24

10 30 50 70 90 110 130 150 170 190 210 230 250 270 290 310 330 350 370 390 410 430 450 470 490 510 530 550 570 590 610 630

Sodium (mmol/d)

Fre

qu

en

cy

(%

)

0

2

4

6

8

10

12

14

16

18

20

22

24

10 30 50 70 90 110 130 150 170 190 210 230 250 270 290 310 330 350 370 390 410 430 450 470 490 510 530 550 570 590 610 630

Sodium (mmol/d)

Fre

qu

en

cy

(%

)

0

2

4

6

8

10

12

14

16

18

20

22

24

10 30 50 70 90 110 130 150 170 190 210 230 250 270 290 310 330 350 370 390 410 430 450 470 490 510 530 550 570 590 610 630

Sodium (mmol/d)

Fre

qu

en

cy

(%

)

0

2

4

6

8

10

12

14

16

18

20

22

24

10 30 50 70 90 110 130 150 170 190 210 230 250 270 290 310 330 350 370 390 410 430 450 470 490 510 530 550 570 590 610 630

Sodium (mmol/d)

Fre

qu

en

cy

(%

)

Figure 9

Mean sodium intakes among (A) males and (B) females in the US National Health and Nutrition Examination Surveys (NHANES) and (C) males and (D) females in the US Continuing Survey of Food Intake by Individuals (CSFII)

Sodium: 1 mmol = 23 mg Reproduced, by permission of the publisher from Loria, Obarzanek & Ernst (2001)

Fig 10 (A) Men (B) Women

Figure 10

Comparison of mean 24-hour urinary sodium excretion for (A) men and (B) women from two nationally representative surveys of the United Kingdom population: the Dietary and Nutritional Survey of British Adults,1986–1987, and the National Diet and Nutrition Survey: Adults, 2000–2001

Sodium: 1 mmol = 23 mg

Bars: standard error

*mean, standard error and n are weighted to compensate for the differential probabilities of selection and non-response

†Lower cut-off was 16 years in the first survey, and 19 years in the second Reproduced, by permission of the publisher, from Henderson et al (2003).

0

20

40

60

80

100

120

140

160

180

200

220

240

16/19-24† 25-34 35-49 50-64 All

Age group (years)

So

diu

m (

mm

ol/d

)

Dietary and Nutritional Survey of British Adults(1986-1987, n=842)

National Diet and Nutrition Survey: Adults(2000-2001, n=568)

0

20

40

60

80

100

120

140

160

180

200

220

240

16/19-24† 25-34 35-49 50-64 All

Age group (years)S

odiu

m (m

mol/d)

Dietary and Nutritional Survey of British Adults(1986-1987, n=865)

National Diet and Nutrition Survey: Adults(2000-2001, n=580)

Figure 11

Mean sodium intake among the participants* of the Japanese National

Nutrition Survey: 1973–2000

Sodium: 1,000 mg = 43.5 mmol

*n not reported

†Takemori (1997; cited by Nakagawa et al., 1999) hypothesized that the rise in sodium intake observed in the 1990s was an artefact due to a revision to the food composition tables in 1988.

‡In 1995 the survey changed from a 3-day semi-weighed record to a 1-day semi-weighed record.

Reproduced, by permission of the publisher, from Katanoda & Matsumura (2002).

Figure 12

Decrease in sodium chloride intake calculated from urinary sodium excretion among Finnish men and women, 1979–2002

Sodium chloride: 1 g = 393.4 mg sodium

Reproduced, by permission of the publisher, from Laatikainen et al (2006).

Figure 13

Sodium excretion (mmol/d) among Japanese men and women of the INTERSALT Study in 1985 and 1993

(A) Men, ages 20-39 yr (B) Men, ages 40-59 yr

(C) Women, ages 20-39 yr (D) Women, ages 40-59 yr

Sodium: 1 mmol = 23 mg

Bars: standard error

Numbers within the bars indicate sample size

Reproduced, by permission of the publisher, from Nakagawa et al (1999).

0

50

100

150

200

250

Osaka Tochigi Toyama

Sample

So

diu

m (

mm

ol/

d)

1985

1993

50 505050 32500

50

100

150

200

250

Osaka Tochigi Toyama

Sample

So

diu

m (

mm

ol/

d)

1985

1993

50 50 45 14 50 50

0

50

100

150

200

250

Osaka Tochigi Toyama

Sample

So

diu

m (

mm

ol/

d)

1985

1993

50 504950 23460

50

100

150

200

250

Osaka Tochigi Toyama

Sample

So

diu

m (

mm

ol/

d)

1985

1993

50 505047 4147

Figure 14 Comparison of mean urinary sodium excretion for corresponding samples of the INTERSALT Study, 1985–1987, and the INTERMAP Study, 1996–1999, for (A) men ages 40–49 years, (B) men ages 50–59 years, (C) women ages 40–49 years, and (D) women ages 50–59 years

(A) Men, 40-49 yr (B) Men, 50-59 yr

(C) Women, 40-49 yr (D) Women, 50-59 yr

Bars: standard error

Adapted, by permission of the publishers, from INTERSALT Co-operative Research Group (1988) and Stamler et al (2003a).

0

50

100

150

200

250

300

350

Toyama,

Japan

Beijing,

PRC

Belfast,

UK

Birmingham,

UK

Chicago,

USA

Hawaii,

USA

So

diu

m (

mm

ol/

d)

INTERSALT Study(1985-1987)

INTERMAP Study(1996-1999)

0

50

100

150

200

250

300

350

Toyama,

Japan

Beijing,

PRC

Belfast,

UK

Birmingham,

UK

Chicago,

USA

Hawaii,

USA

So

diu

m (

mm

ol/

d)

INTERSALT Study(1985-1987)

INTERMAP Study(1996-1999)

0

50

100

150

200

250

300

350

Toyama,

Japan

Beijing,

PRC

Belfast,

UK

Birmingham,

UK

Chicago,

USA

Hawaii,

USA

So

diu

m (

mm

ol/

d)

INTERSALT Study(1985-1987)

INTERMAP Study(1996-1999)

0

50

100

150

200

250

300

350

Toyama,

Japan

Beijing,

PRC

Belfast,

UK

Birmingham,

UK

Chicago,

USA

Hawaii,

USA

So

diu

m (

mm

ol/

d)

INTERSALT Study(1985-1987)

INTERMAP Study(1996-1999)

Figure 15 Mean sodium chloride intake (g/d) in children and adolescents in the United Kingdom

Sodium chloride: 1 g = 393.4 mg sodium

Dashed lines represents national salt targets. Data for 1.5–4.5 year olds from UK National Diet and Dentition Survey, 1992–1993. Data for 4–18 year olds from UK National Diet and Nutrition Survey: young people aged 4 to 18 years, 1997. Reproduced, by permission of the publisher, from Medical Research Council (2005).

Figure 16 Mean intake of sodium (mg/d) among the children and adolescents of the Japanese National Nutrition Survey, 2003

Sodium: 1,000 mg = 43.5 mmol Bars: standard error Source: H Ueshima, Shiga, Japan (personal communication).

0

1000

2000

3000

4000

5000

6000

1-2 3-5 6-8 9-11 12-14 15-17

Age group (years)

So

diu

m (

mg

/d)

Boys (n=992)

Girls (n=938)

Figure 17 The sodium content of manufactured (A, C) and homemade (B, D) meals

Sodium: 1,000 mg = 43.5 mmol

(A) Takeaway cheeseburgerand chips: 1,242 mg sodium

(D) Homemade risotto:

<2.3 mg sodium

(C) Manufactured ‘ready-meal’

risotto: 1,196 mg sodium

(B) Homemade steak and chips:92 mg sodium

(A) Takeaway cheeseburger and chips: 1242 mg sodium

(B) Homemade steak and chips: 92 mg sodium

(C) Manufactured ‘ready-meal’ risotto: 1196 mg sodium

(D) Homemade risotto: < 2.3 mg sodium

Figure 18 Sodium chloride content of selected children’s foods

Sodium chloride: 1 g = 393.4 mg sodium Reproduced, by permission of the publisher, from Medical Research Council (2005).

Figure 19 Food sources of sodium among children and adolescents (n = 1699) from the United Kingdom Diet and Nutrition Survey,1992

Values in pie sectors indicate percentage contribution.

*Includes egg and egg dishes, fat spreads, fish and fish dishes, sugar, preserves and confectionery, drinks and miscellaneous foods such as powdered drinks, soups and sauces.

Reproduced, by permission of the publisher, from Medical Research Council (2005).

Figure 20

Sodium consumption of (A) black girls (n = 1213) and (B) white girls (n = 1166) by age and frequency of fast food consumption

Sodium: 1,000 mg = 43.5 mmol

Reproduced, by permission of the publisher, from Schmidt et al (2005).

ISBN 978 92 4 159593 5


Recommended