Elliott Wave Scan Results * ETFs with good volume * 160213 To search for a ticker, use Ctrl F and search for (TIKR .. that is, use a ( before the ticker symbol. For summary sorted by Ticker, go to page 22. For summary sorted by Patterns, go to page 44. For summary sorted by Trade Type and Rating, go to page 66. For summary sorted by Better Than Random, go to page 88. Use Ctrl N to jump to page number. Note: Any ticker for which there is no chart indicates that the Elliott Wave analyzer found "no incomplete wave patterns" and therefore recommends you "stay out of the market" with that ticker. A word of CAUTION about these Elliott Wave forecast charts -- keep in mind that these chart sets are produced by a "scanner" feature that does not optimize the wave pattern selection beyond a very basic level. The scanner picks what it considers the "best fit" from the various possible pattern sequences. When you do a manual analysis, you would normally evaluate long term wave patterns, then shorter and shorter patterns and - most importantly - you would then match the short term pattern choices so they fit properly with the longer term patterns. Using the scanner feature to create "short term" predictions (from days to a few weeks), we are using only a small sample of the most recent data. Otherwise, the chart and patterns become congested and difficult to read. So, IF the scanner starts the short term wave count at an appropriate point and with the appropriate starting pattern, then the resulting prediction will be quite accurate. Otherwise, it is just one of many possibilities. Remember, also, that we provide a sorted list at the front of the chart sets where the Longs and Shorts are sorted based on the Rating. Ratings under 80 are not considered valid. The higher the rating, over 80, the more likely it is to be valid and important. Refer also to the BTR (Better Than Random) rating, which gives another measure of how relevant the forecast may be. Pattern sort is first by pattern (ascending), then by degree (ascending) and then by wave (descending, that is - latest waves first). Rating sort is by rating (descending) with Longs grouped first, then Shorts grouped; high numbers better, below 80 is "suspect." BTR sort is "Better Than Random" and shows the statistical probability that the prediction is better than random. WAVE DEGREES (from longer to shorter times): Grand, Supercycle, Cycle, Primary, Intermediate, Minor, Minute, Minuette, SubMinuette, Micro For some guidance on interpreting the EW charts provided here, download this file: http://jimcooper.biz/stockcharts/Interpreting_ewa_charts_02.pdf See next page for hyperlinked Table of Contents listed by Security name.
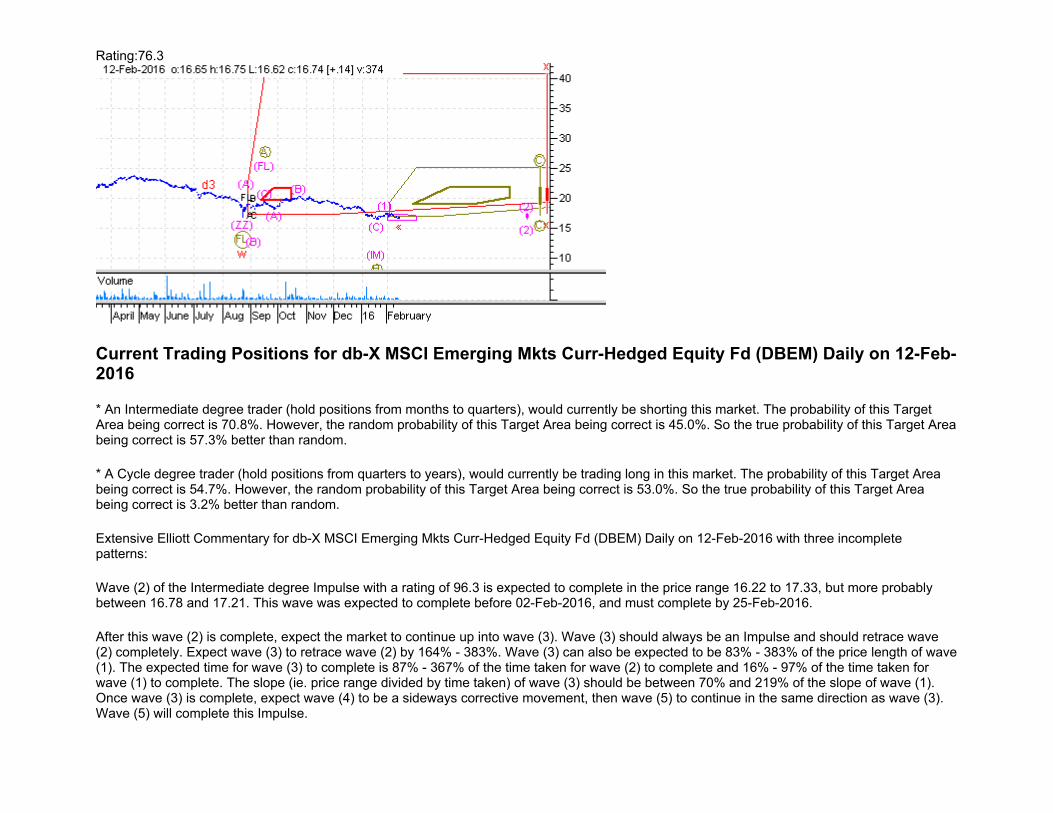
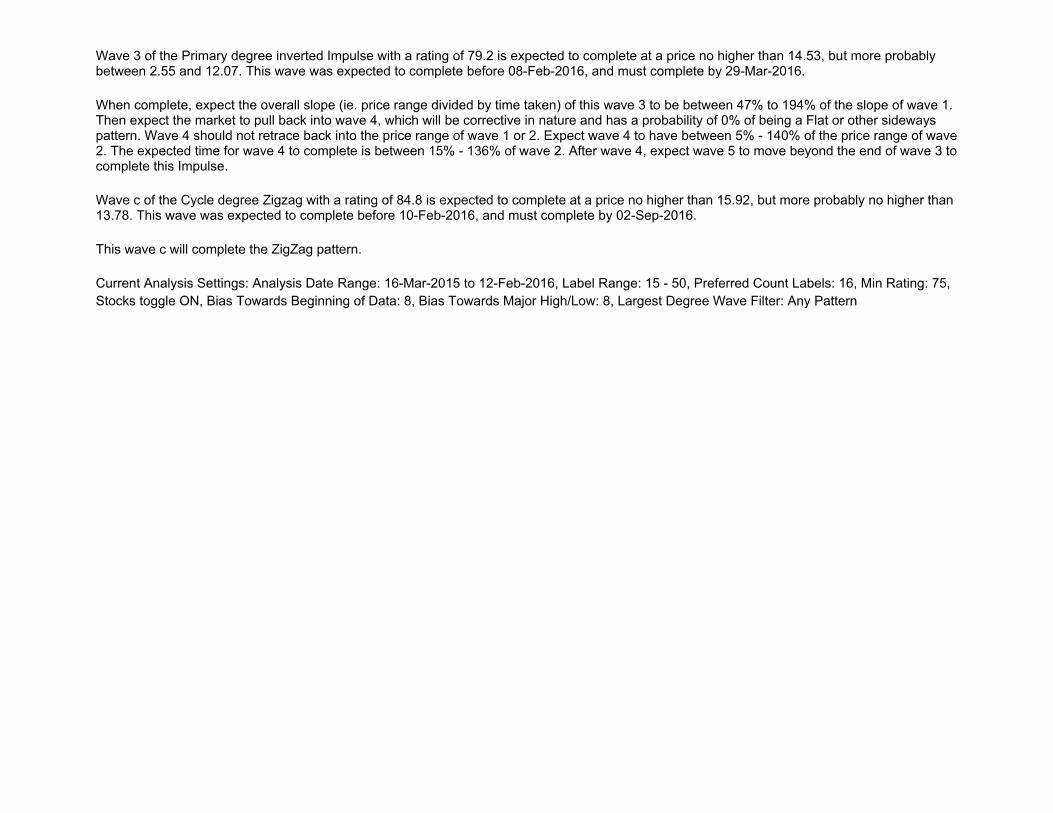
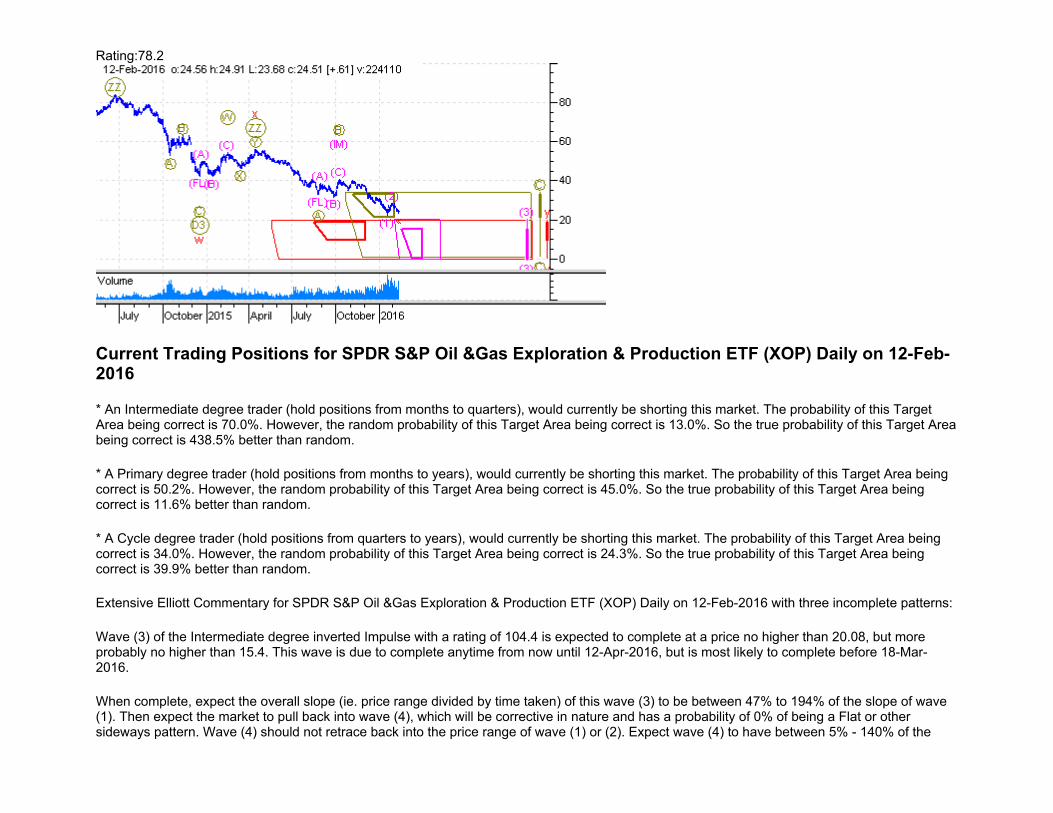
Transcript
Elliott Wave Scan Results * ETFs with good volume * 160213
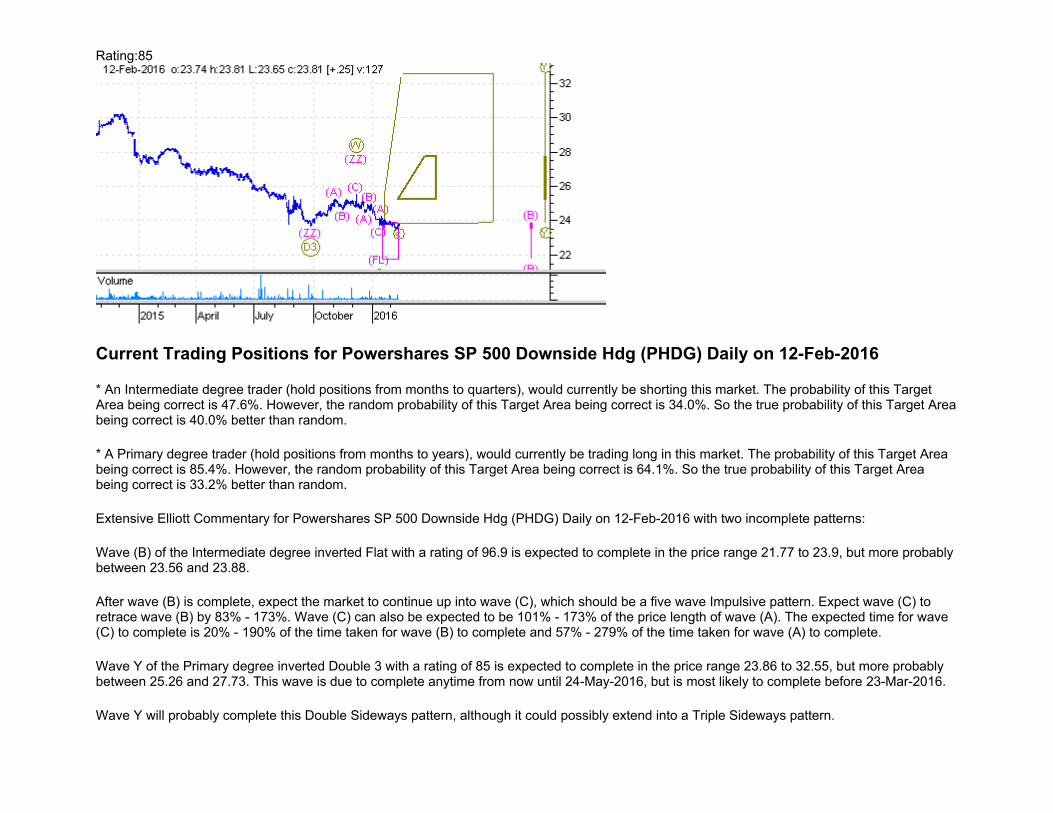
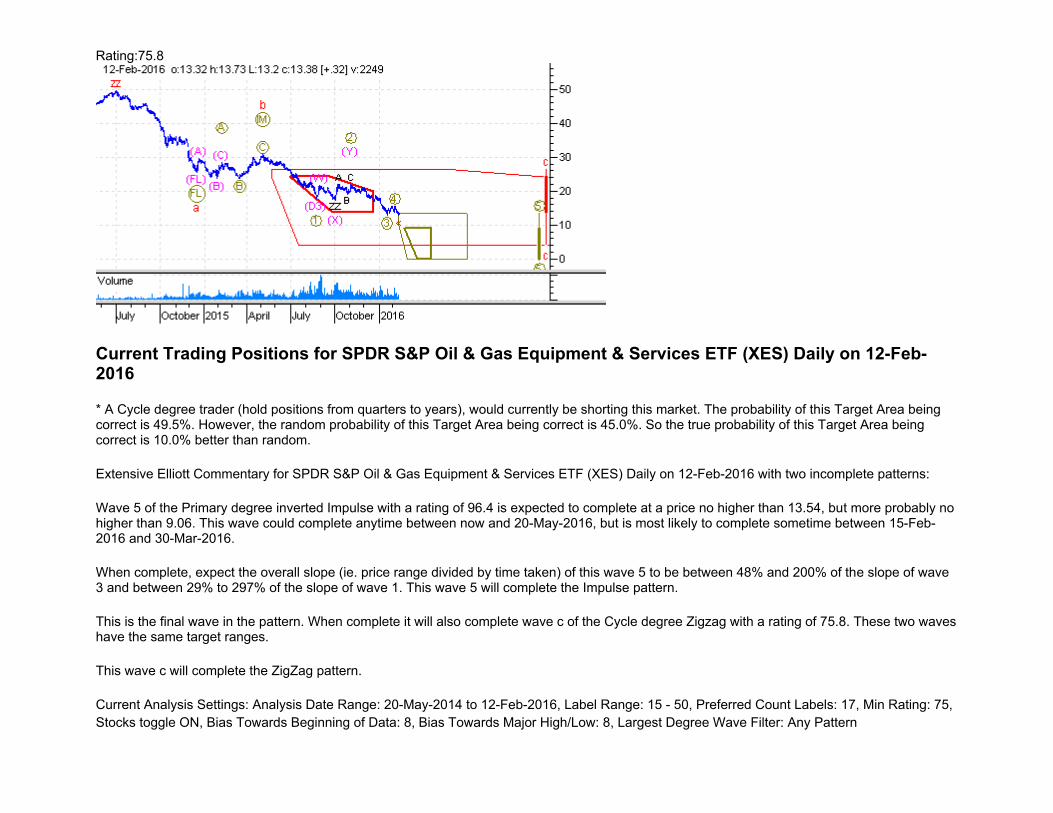
To search for a ticker, use Ctrl F and search for (TIKR .. that is, use a ( before the ticker symbol. For summary sorted by Ticker, go to page 22.
For summary sorted by Patterns, go to page 44.
For summary sorted by Trade Type and Rating, go to page 66.
For summary sorted by Better Than Random, go to page 88.
Use Ctrl N to jump to page number.
Note: Any ticker for which there is no chart indicates that the Elliott Wave analyzer found "no incomplete wave patterns" and therefore recommends you "stay out of the market" with that ticker.
A word of CAUTION about these Elliott Wave forecast charts -- keep in mind that these chart sets are produced by a "scanner" feature that does not optimize the wave pattern selection beyond a very basic level. The scanner picks what it considers the "best fit" from the various possible pattern sequences. When you do a manual analysis, you would normally evaluate long term wave patterns, then shorter and shorter patterns and - most importantly - you would then match the short term pattern choices so they fit properly with the longer term patterns. Using the scanner feature to create "short term" predictions (from days to a few weeks), we are using only a small sample of the most recent data. Otherwise, the chart and patterns become congested and difficult to read. So, IF the scanner starts the short term wave count at an appropriate point and with the appropriate starting pattern, then the resulting prediction will be quite accurate. Otherwise, it is just one of many possibilities. Remember, also, that we provide a sorted list at the front of the chart sets where the Longs and Shorts are sorted based on the Rating. Ratings under 80 are not considered valid. The higher the rating, over 80, the more likely it is to be valid and important. Refer also to the BTR (Better Than Random) rating, which gives another measure of how relevant the forecast may be.
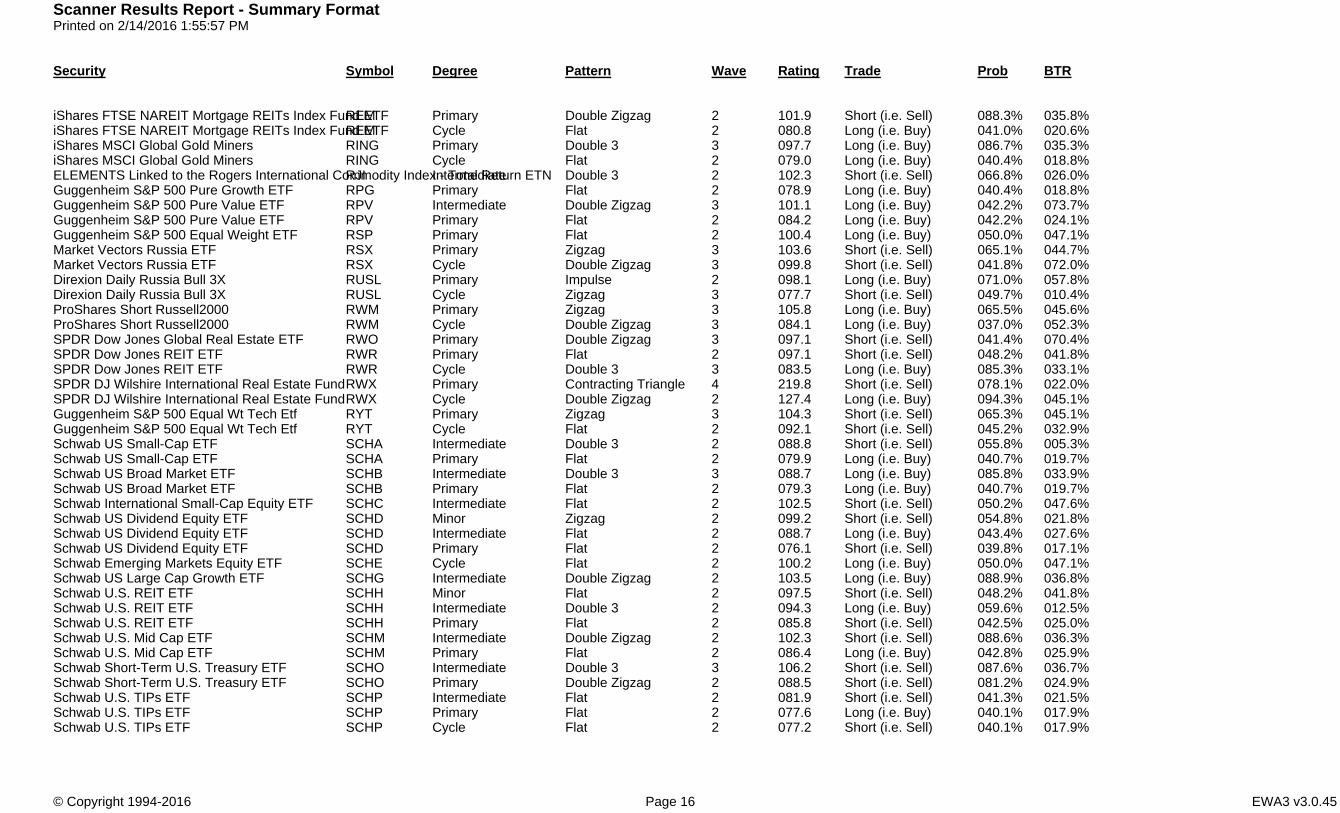
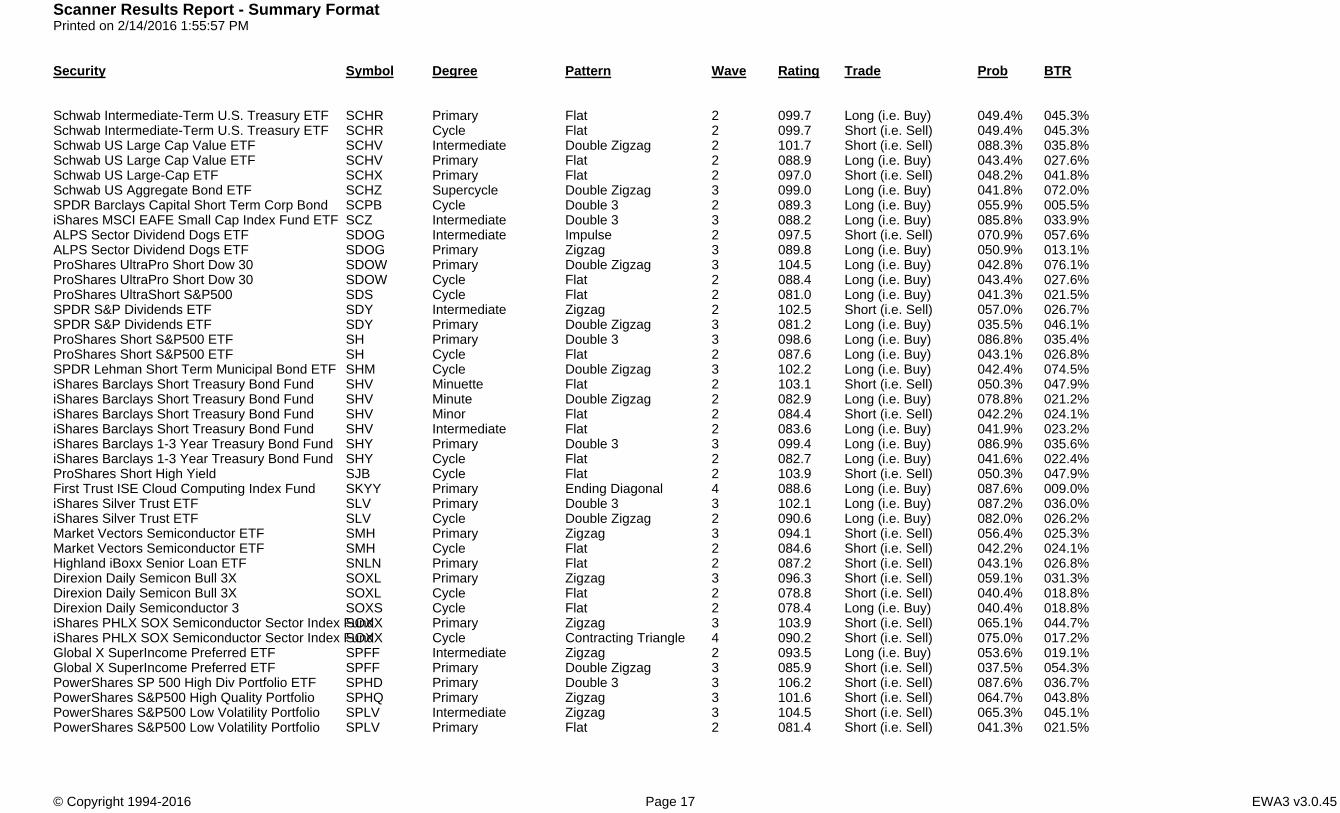
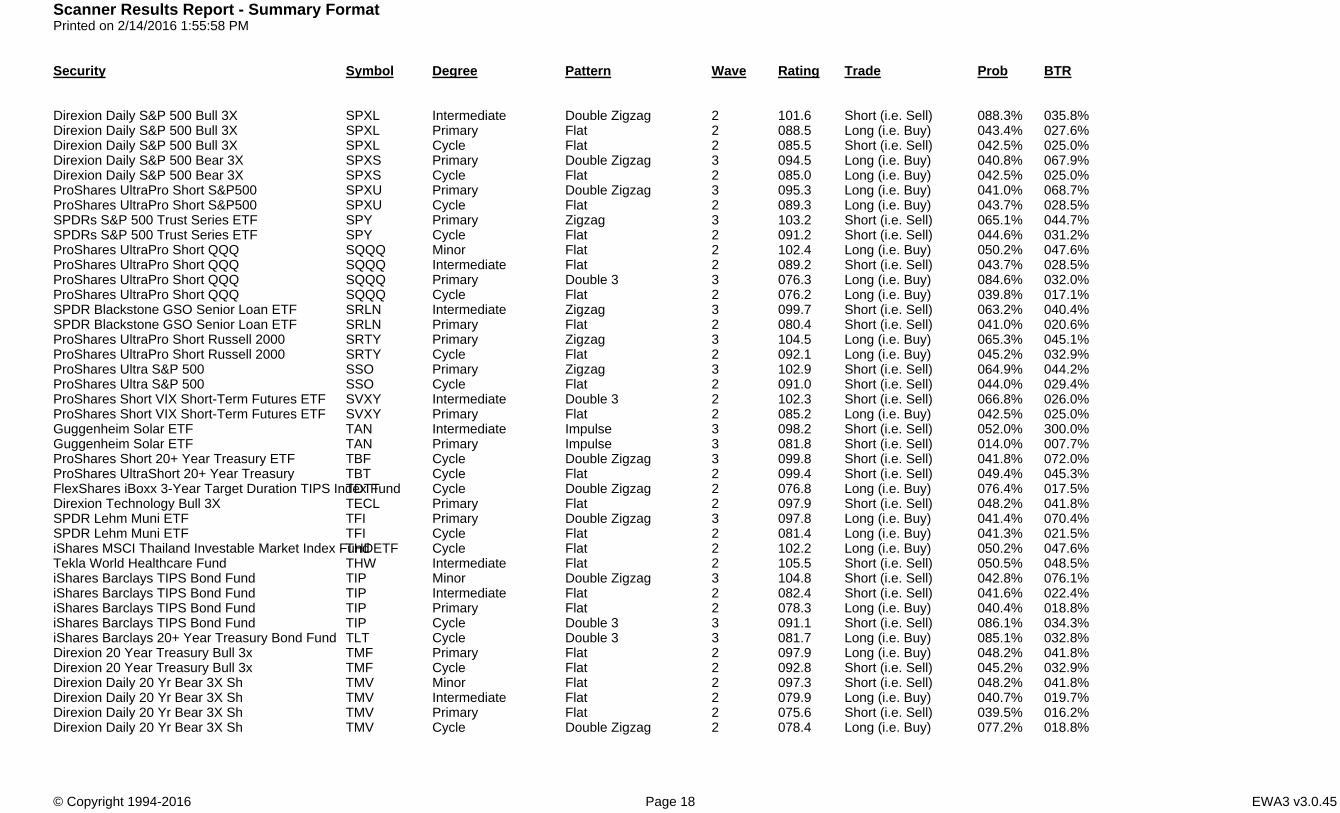
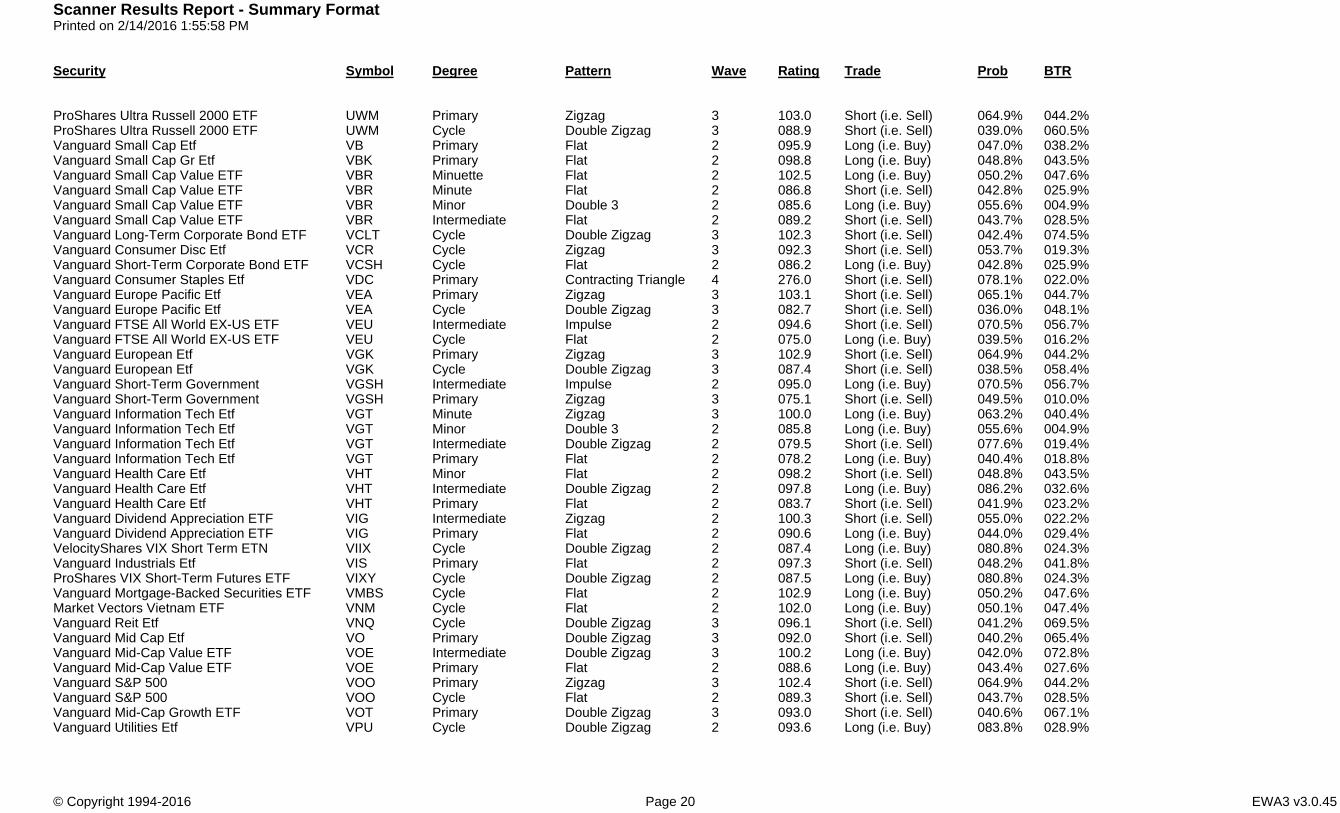
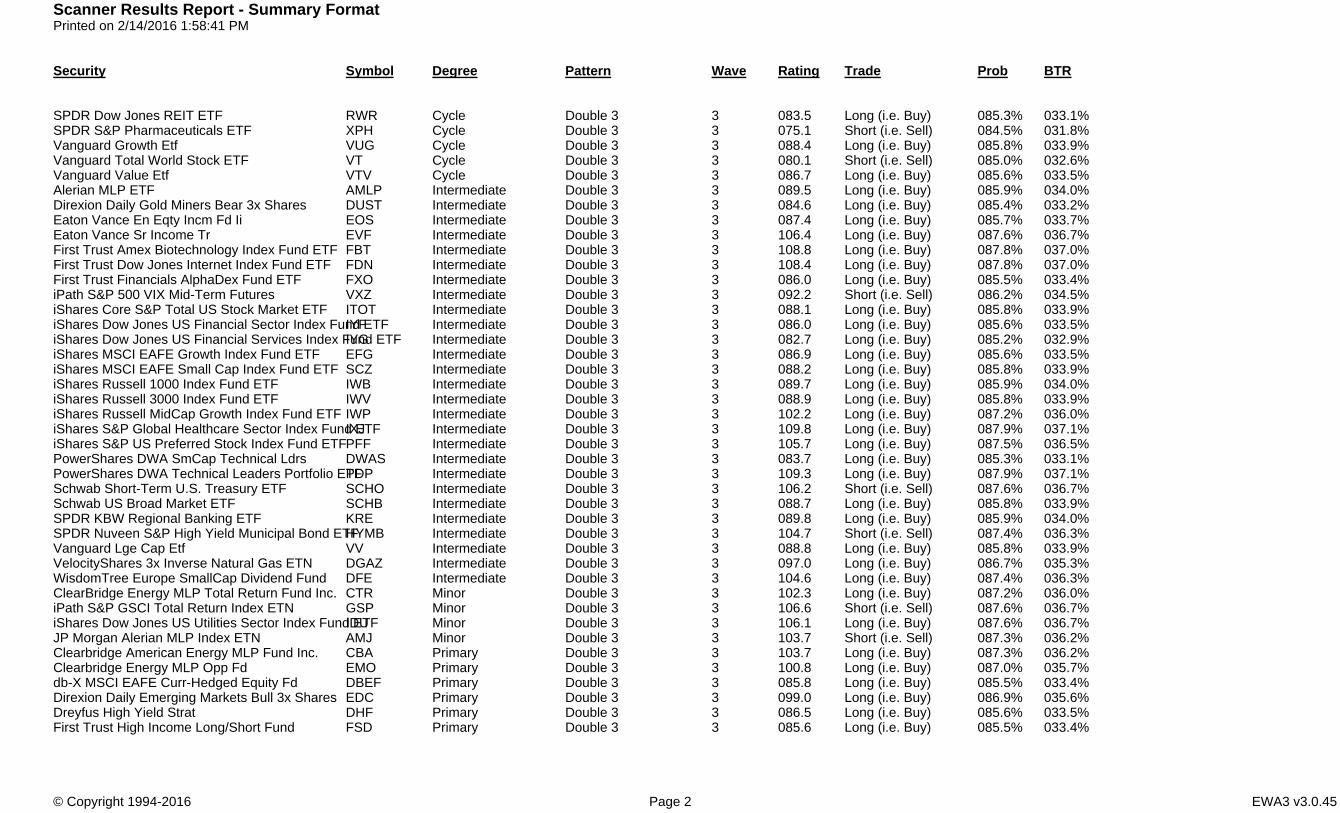
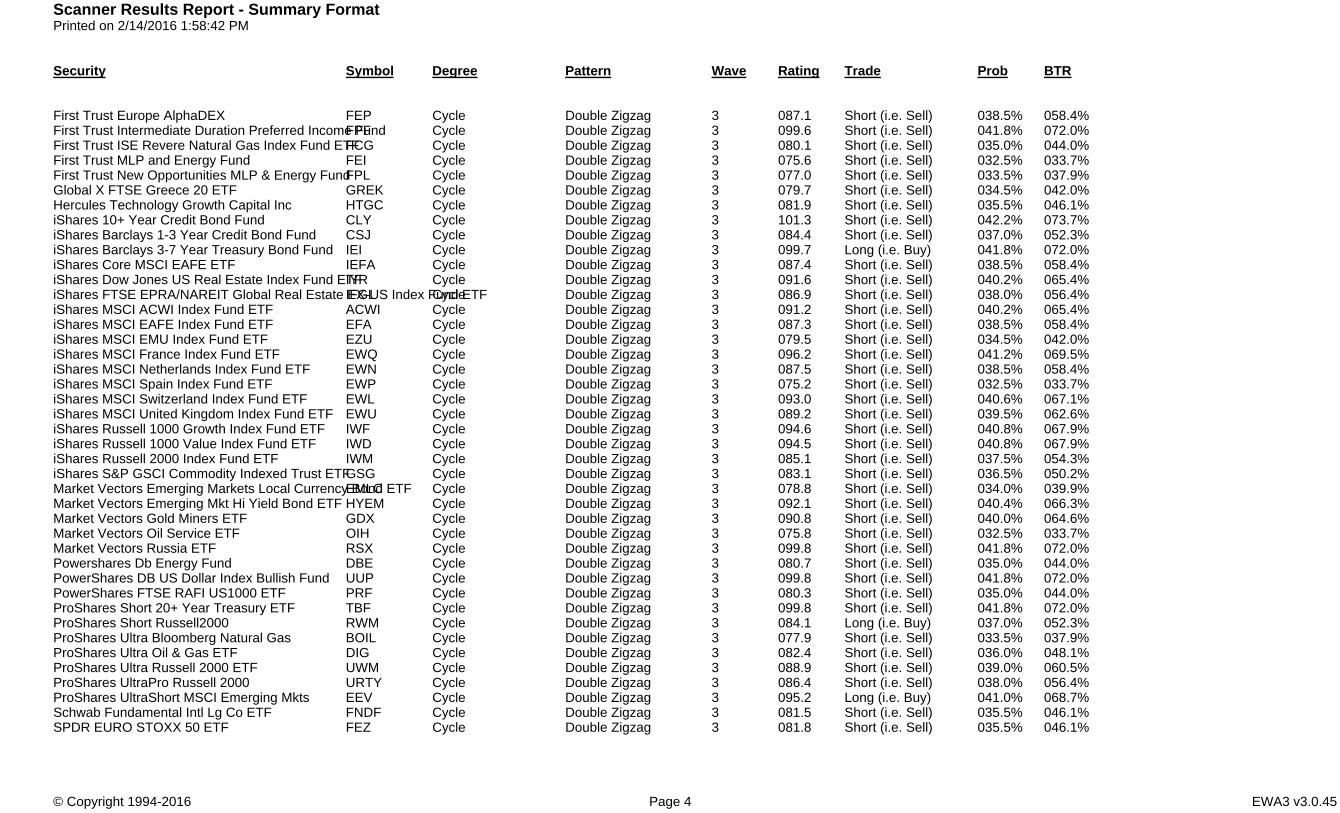
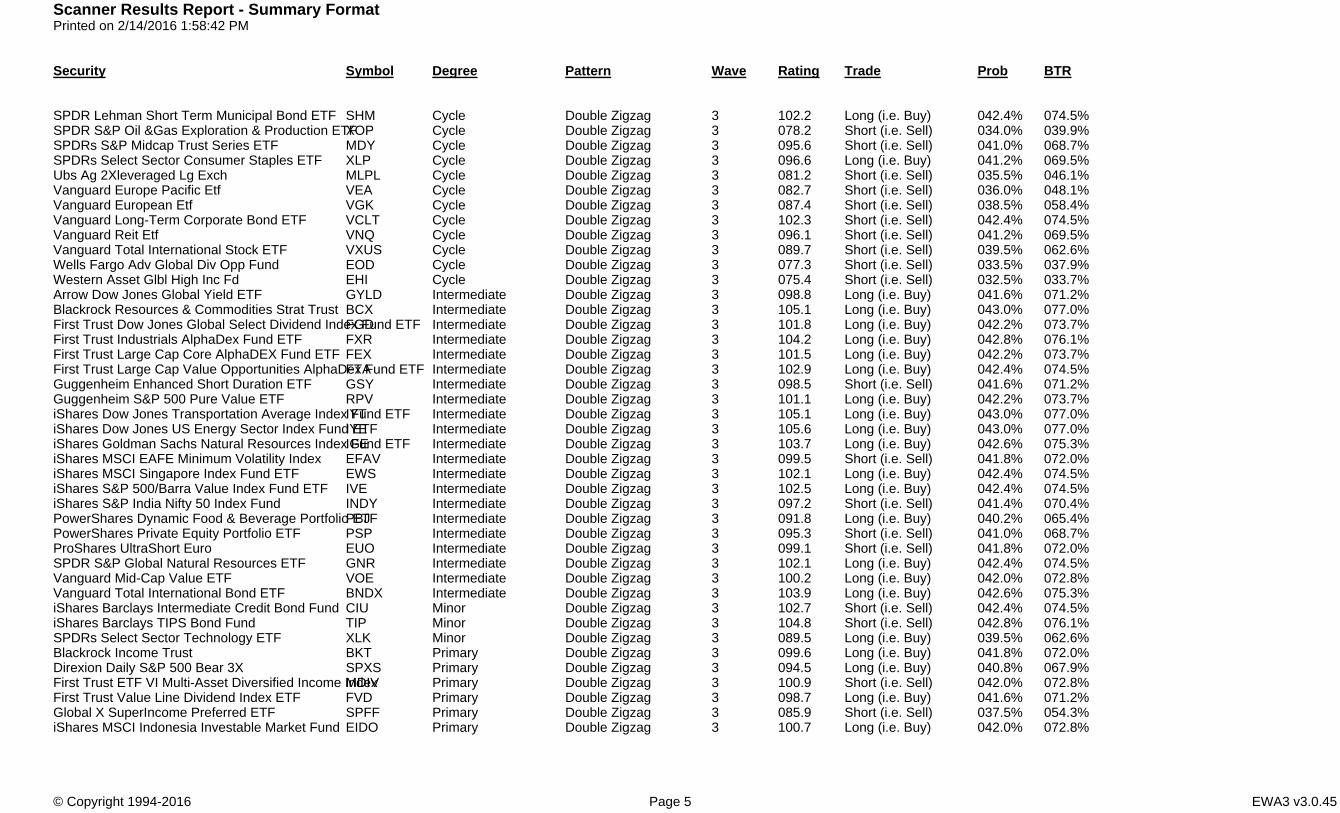
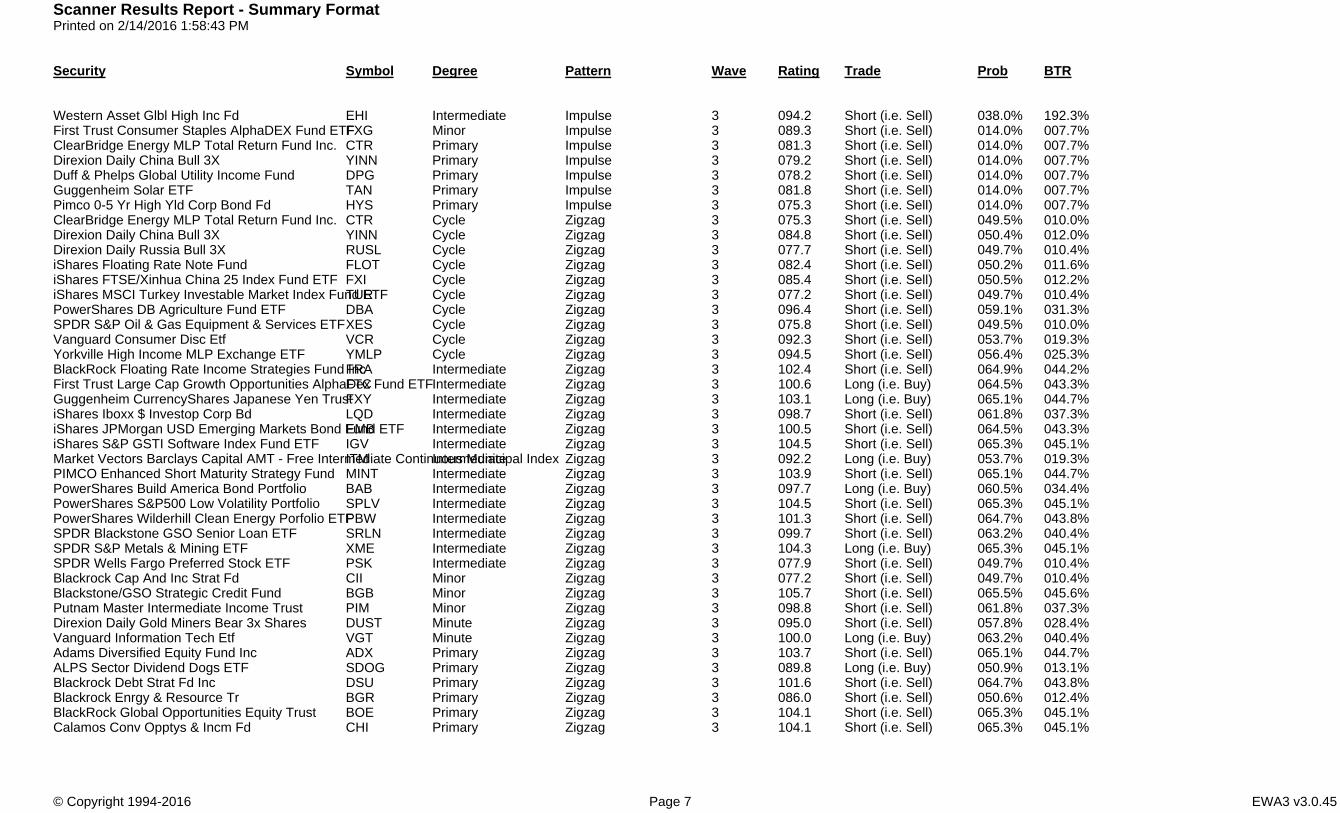
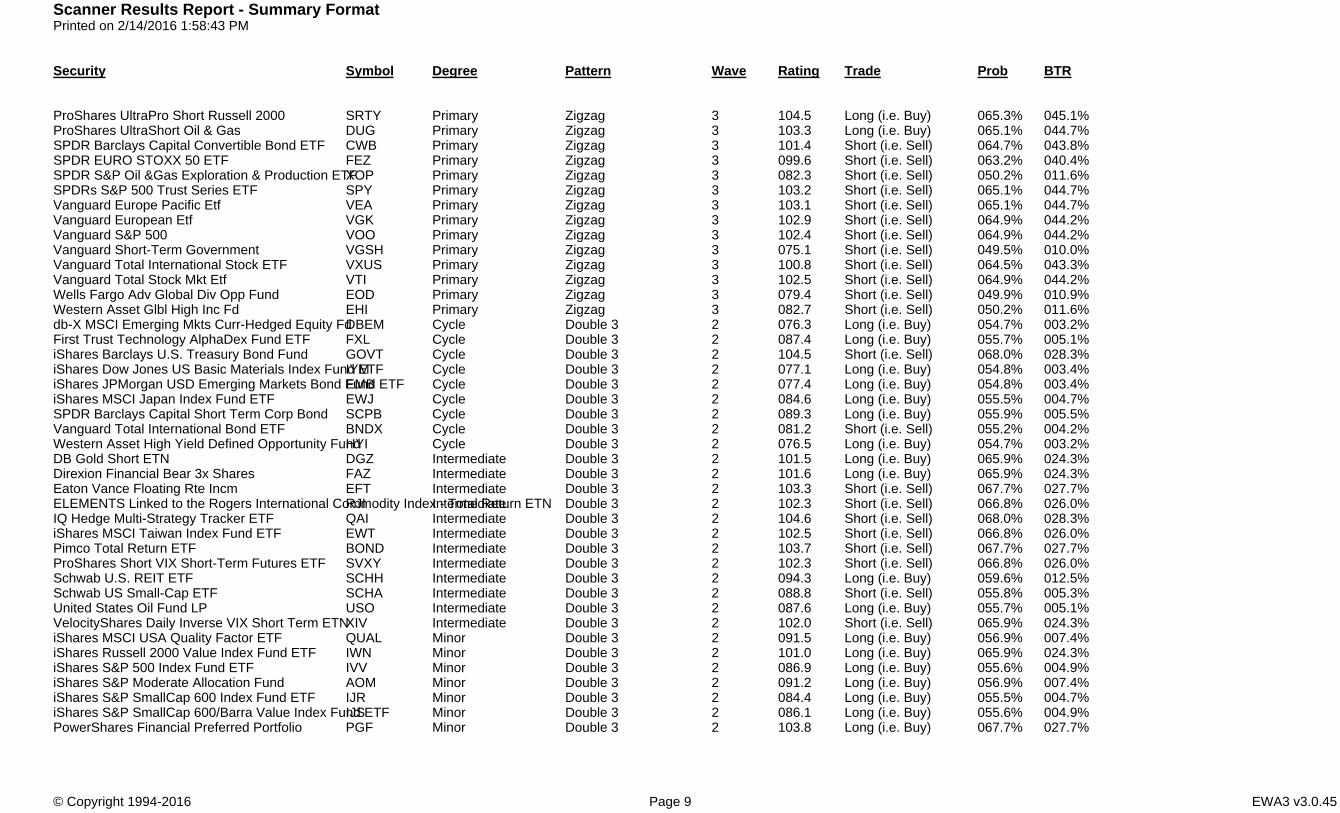
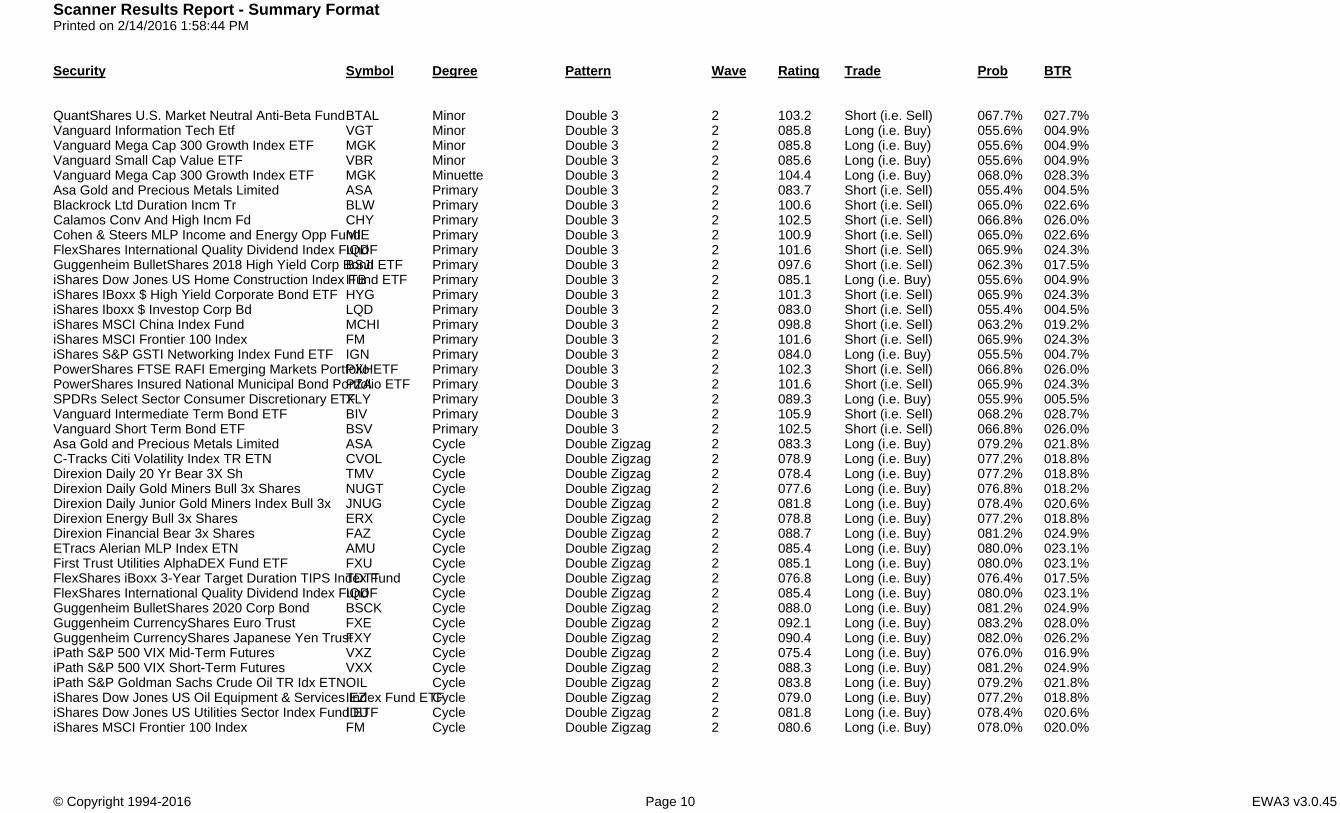
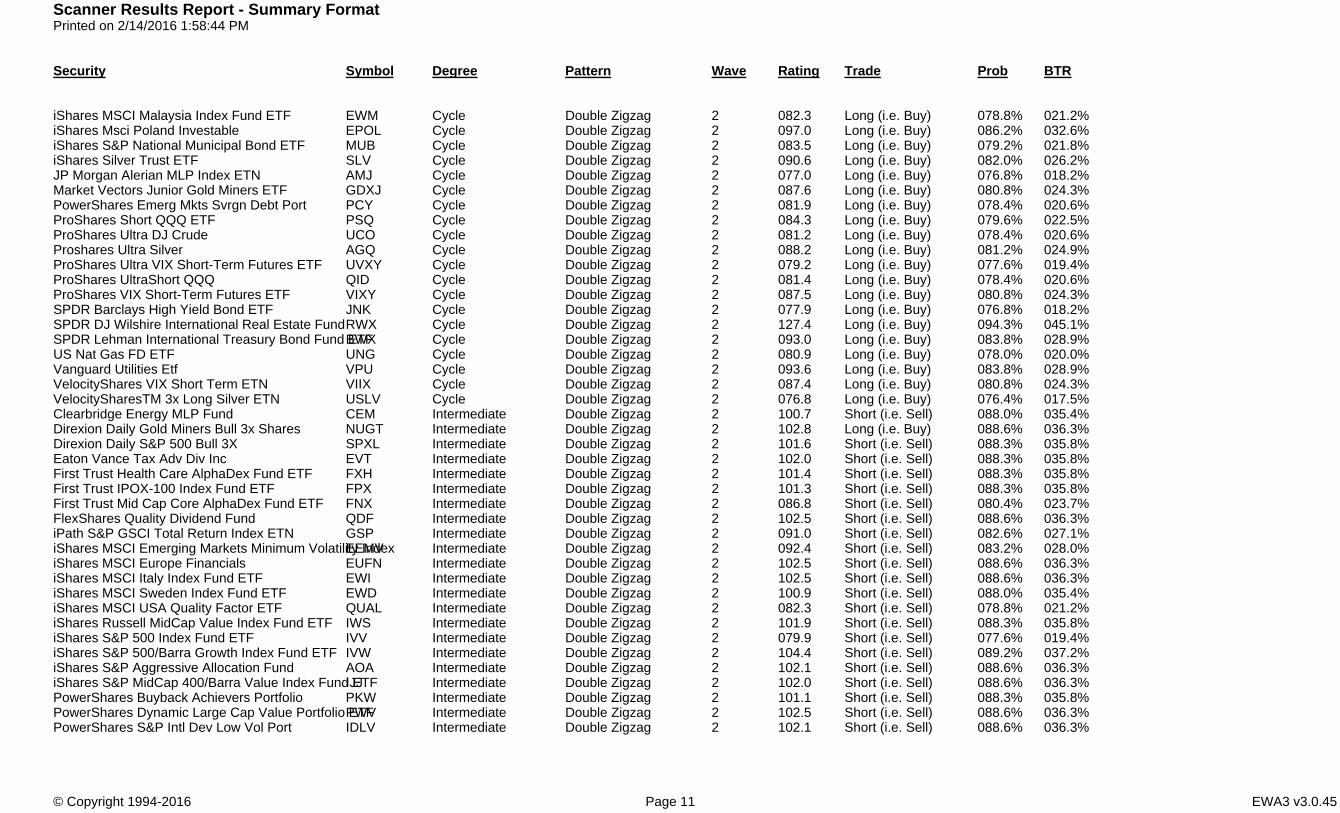
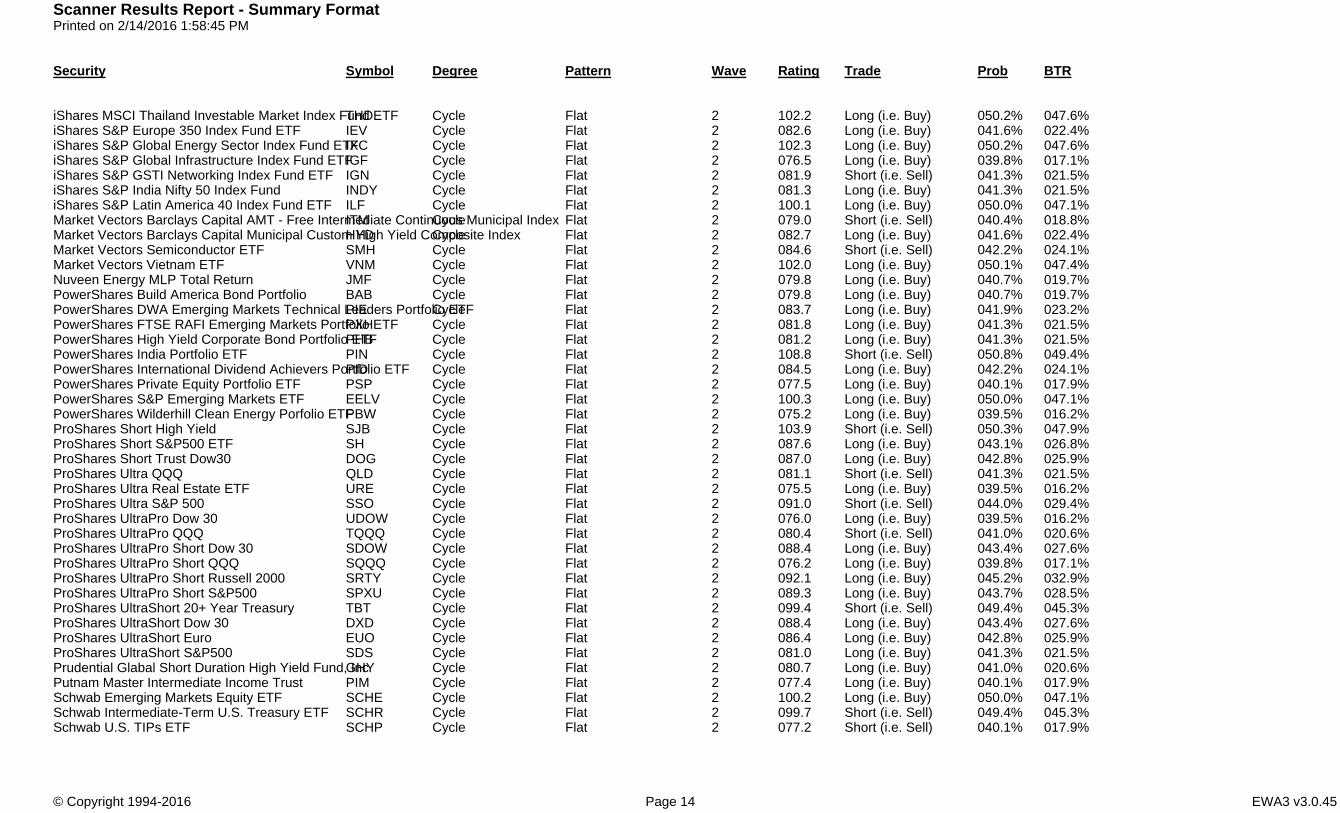
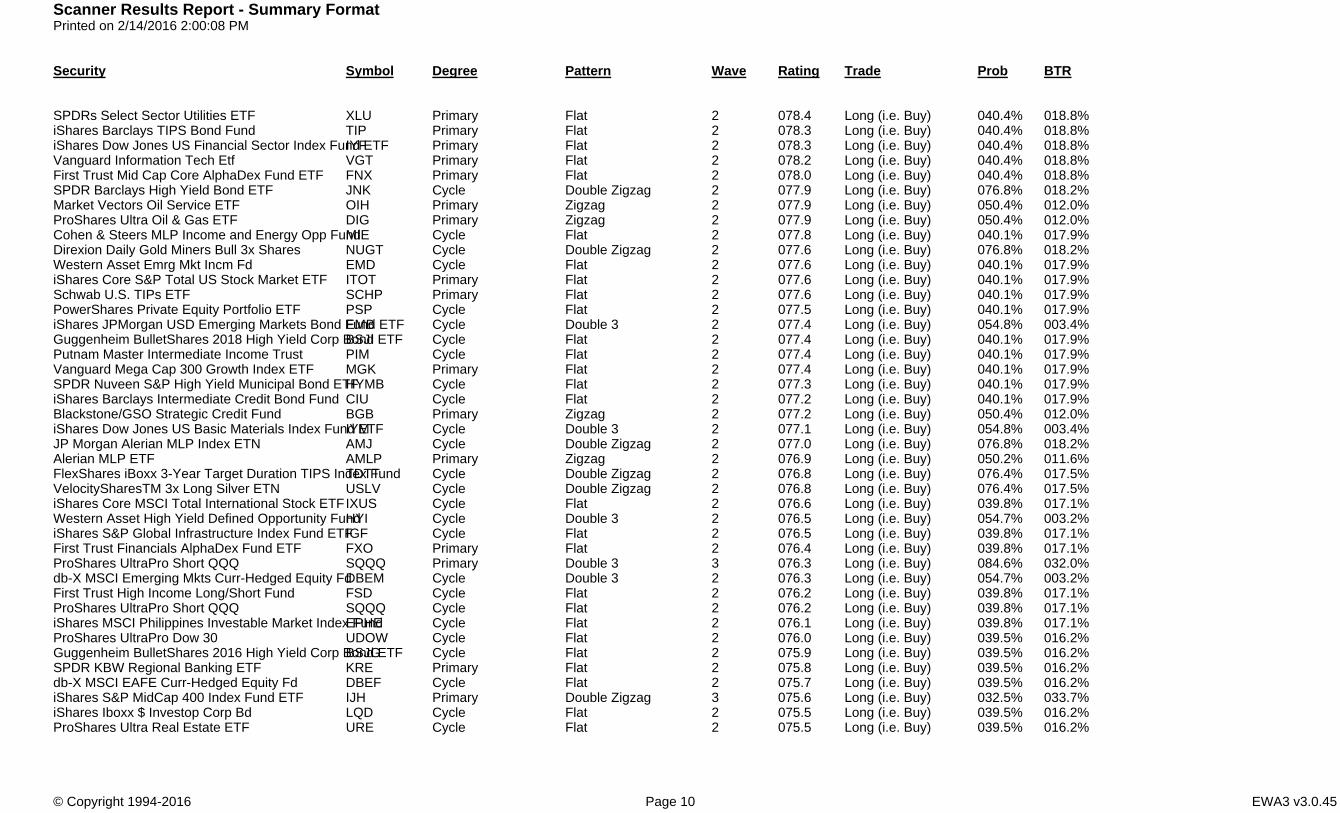
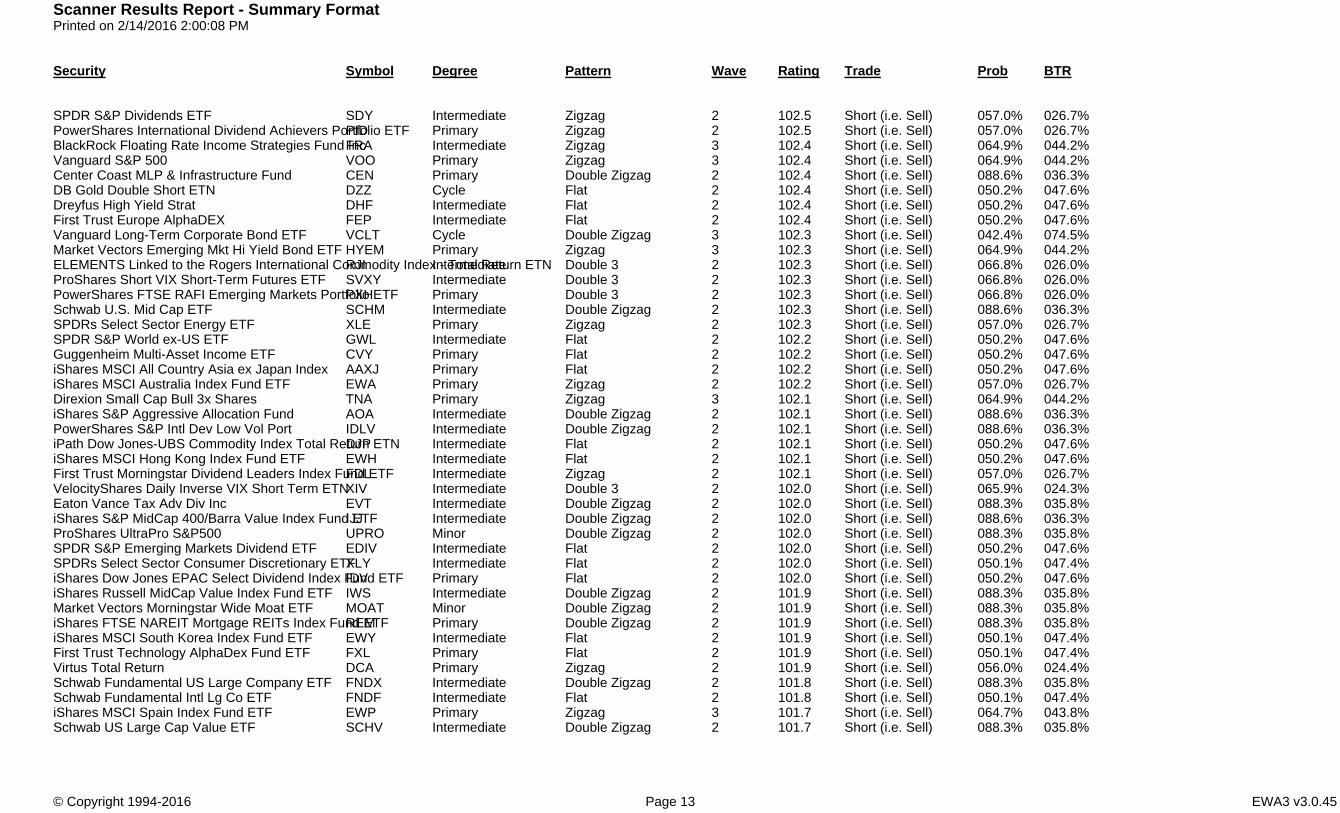
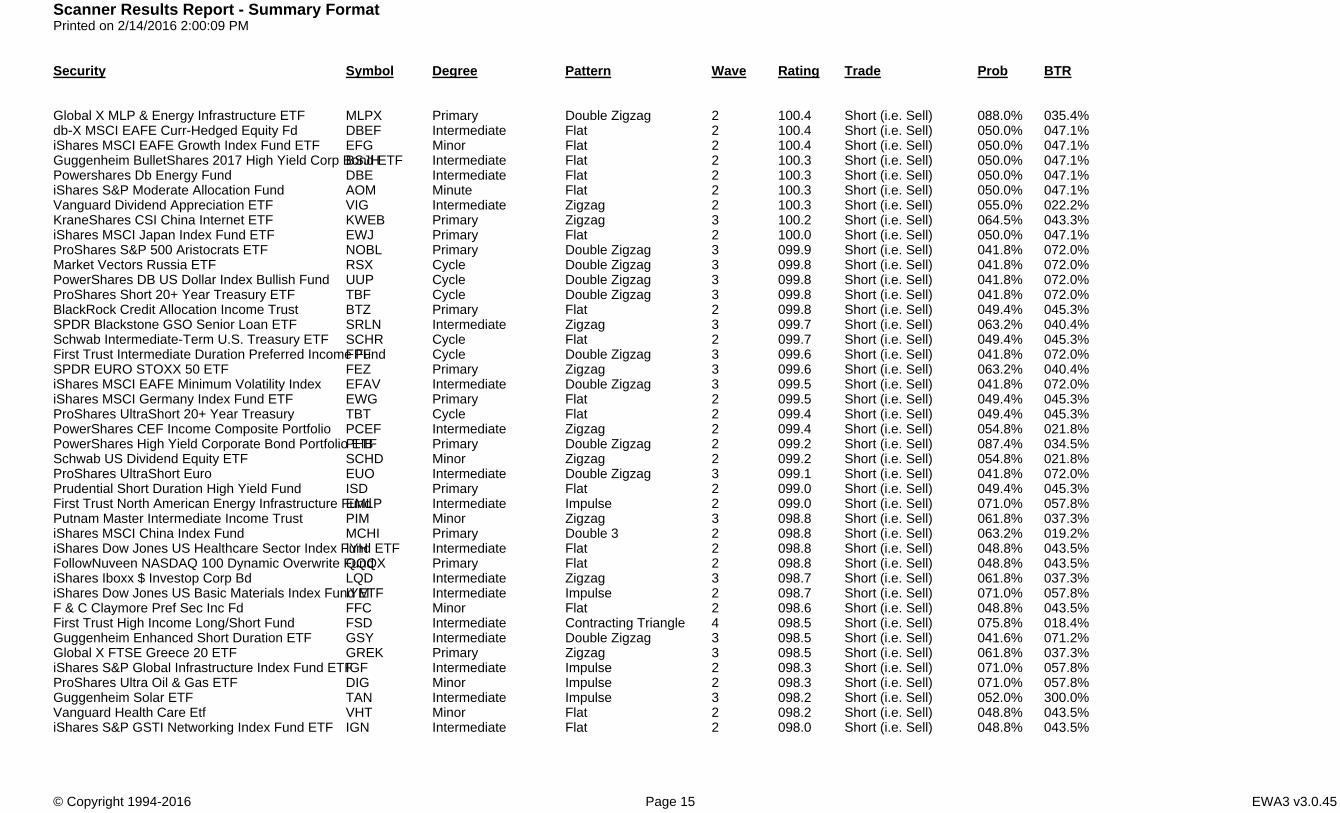
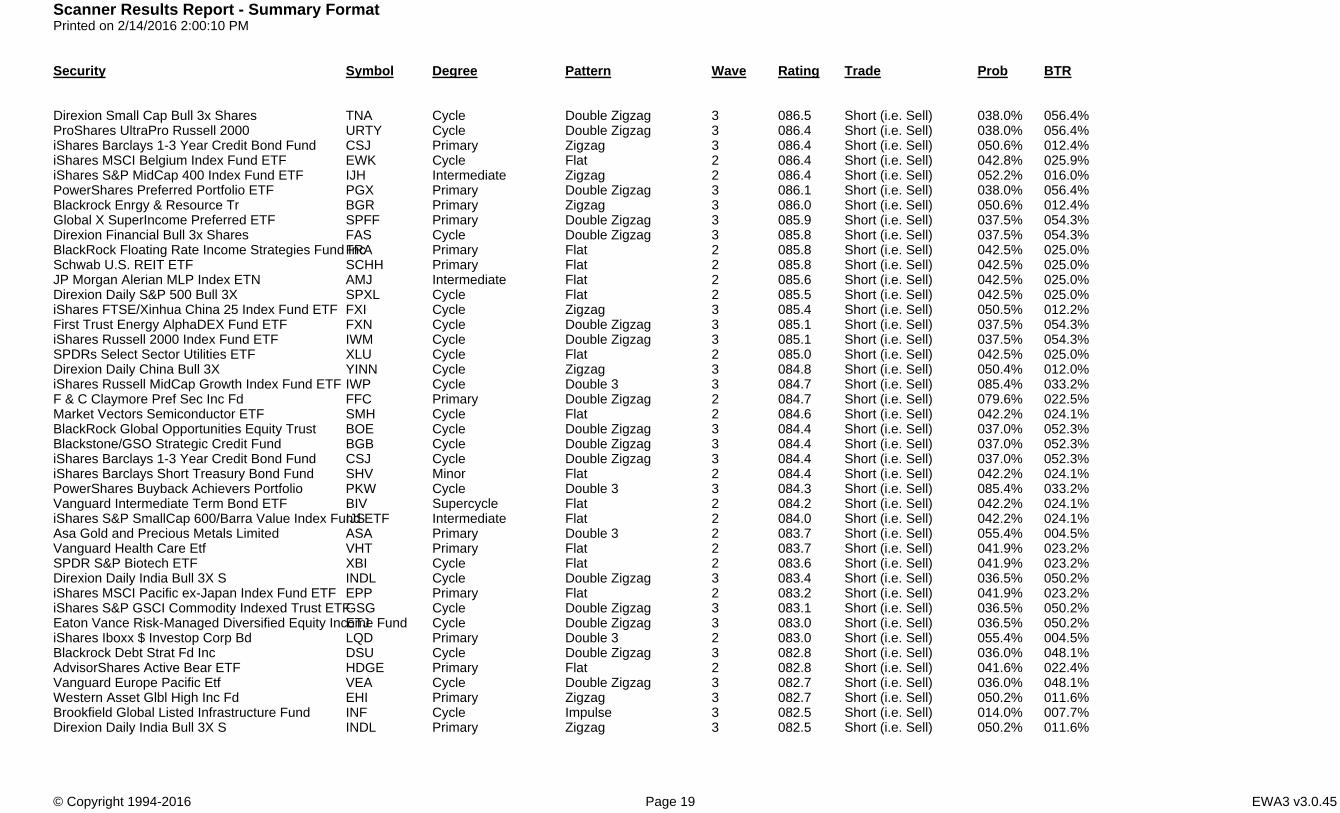
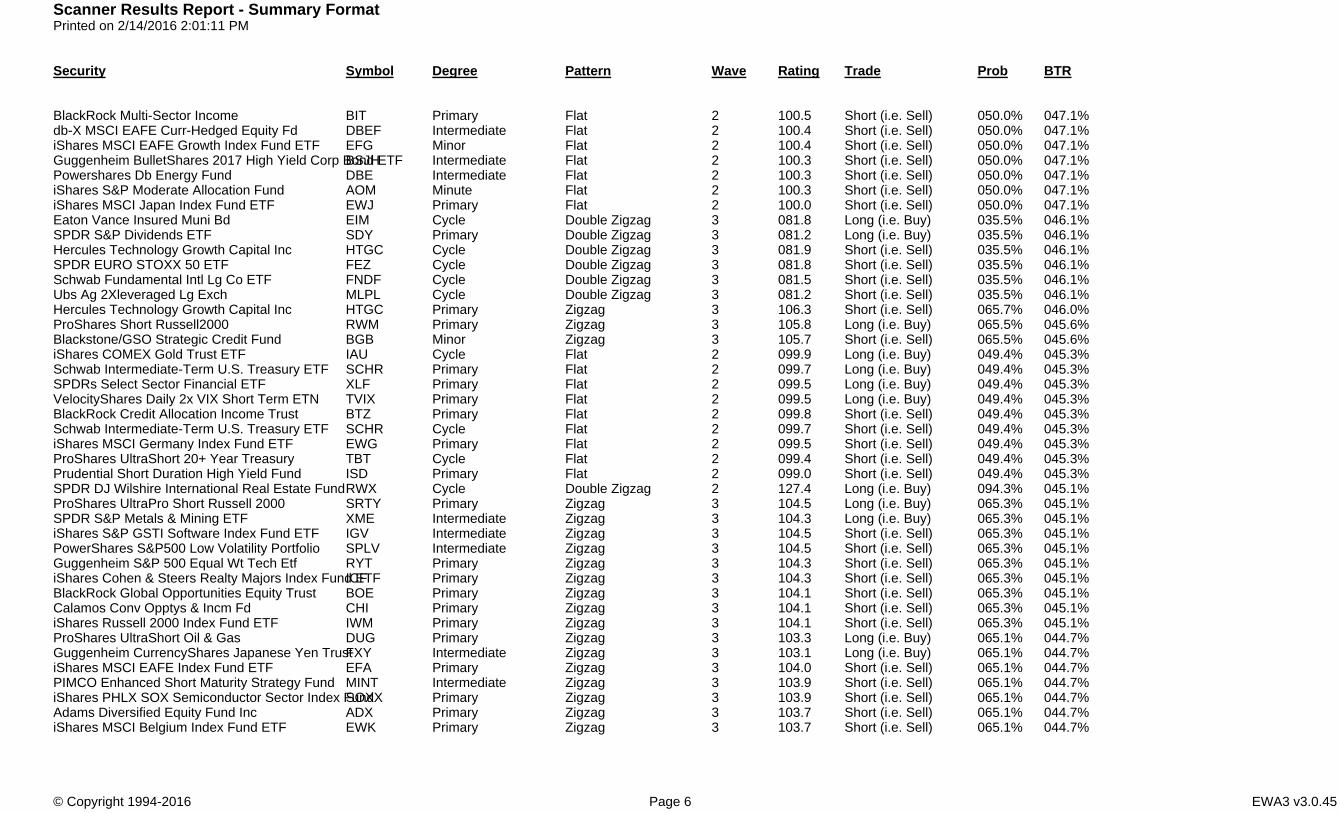
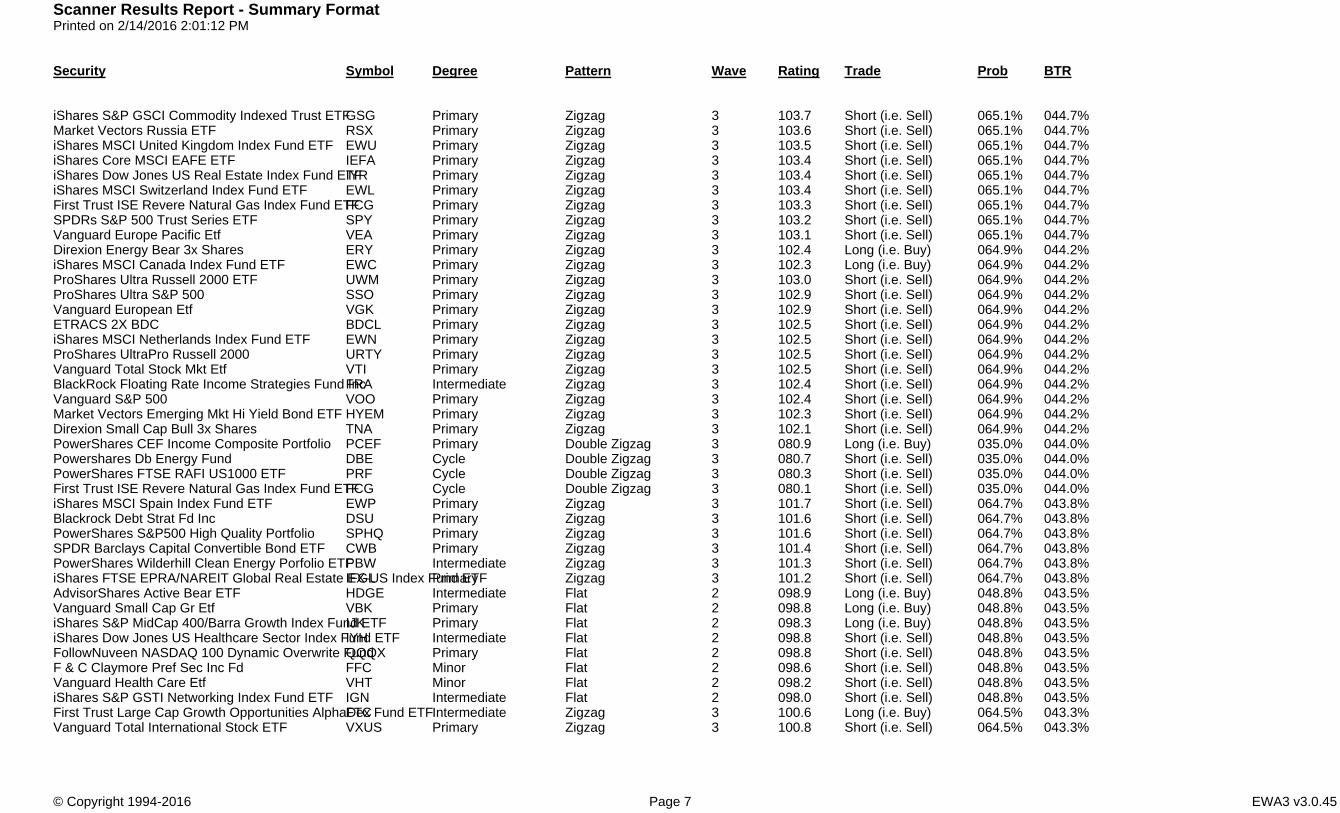
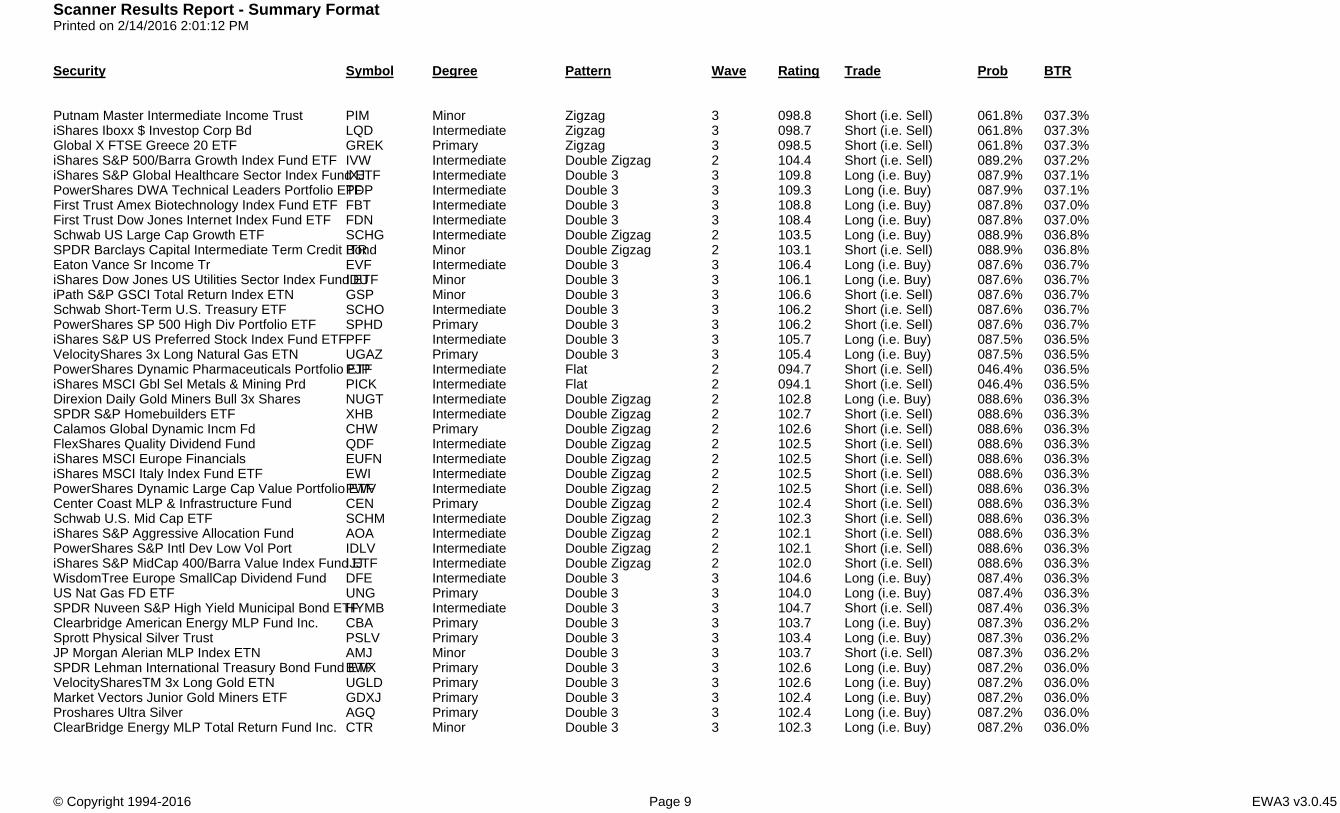
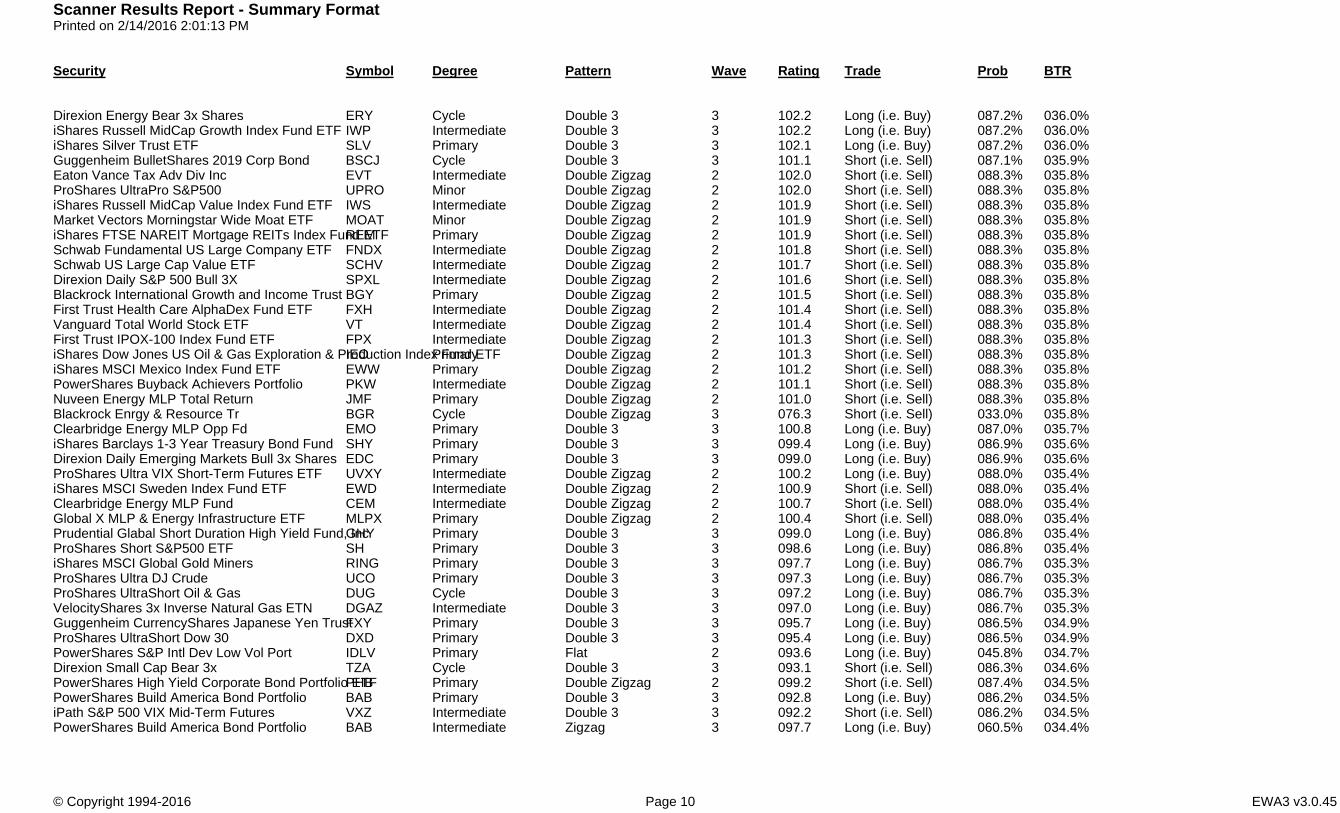
Pattern sort is first by pattern (ascending), then by degree (ascending) and then by wave (descending, that is - latest waves first).
Rating sort is by rating (descending) with Longs grouped first, then Shorts grouped; high numbers better, below 80 is "suspect."
BTR sort is "Better Than Random" and shows the statistical probability that the prediction is better than random.
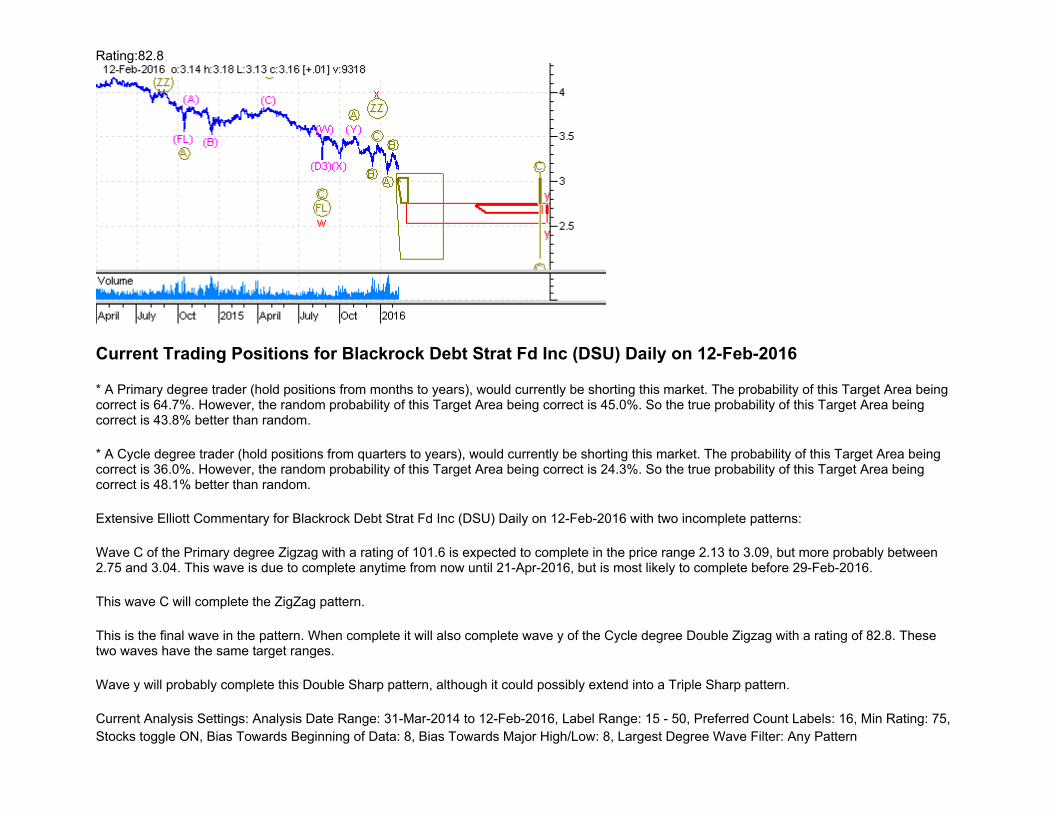
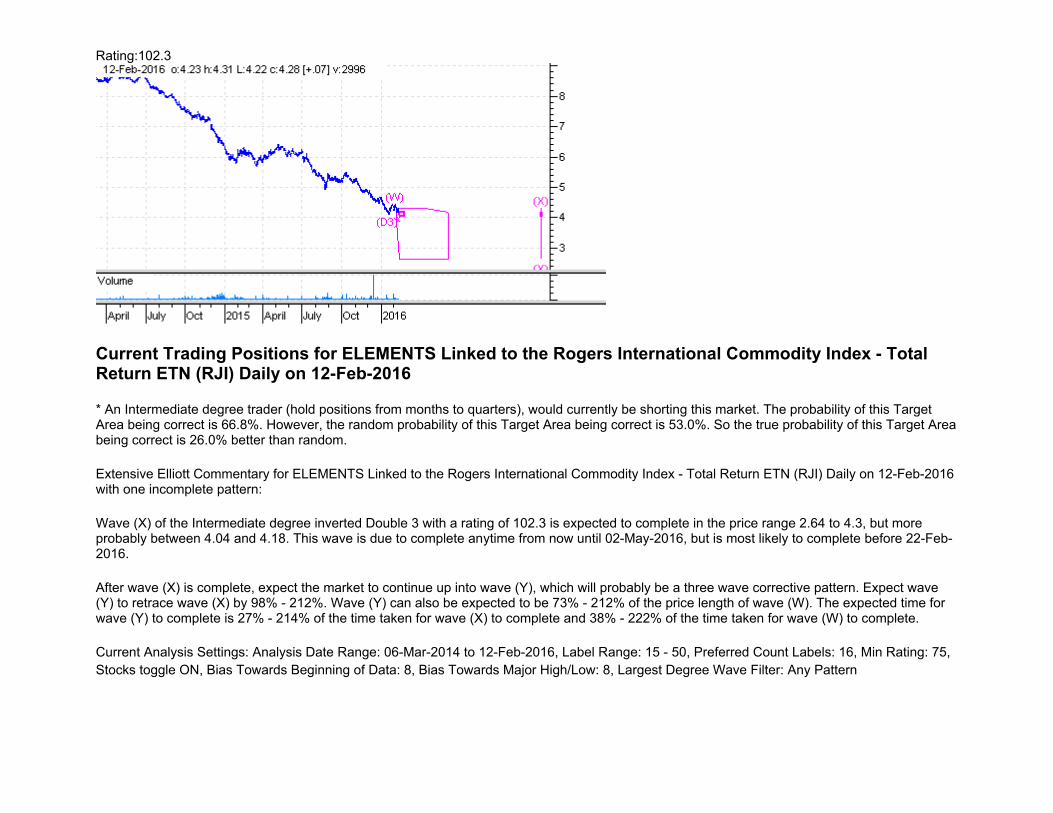
Current Trading Positions for ELEMENTS Linked to the Rogers International Commodity Index - Total Return ETN (RJI) Daily
on 12-Feb-2016....................................................................................................................................................................230
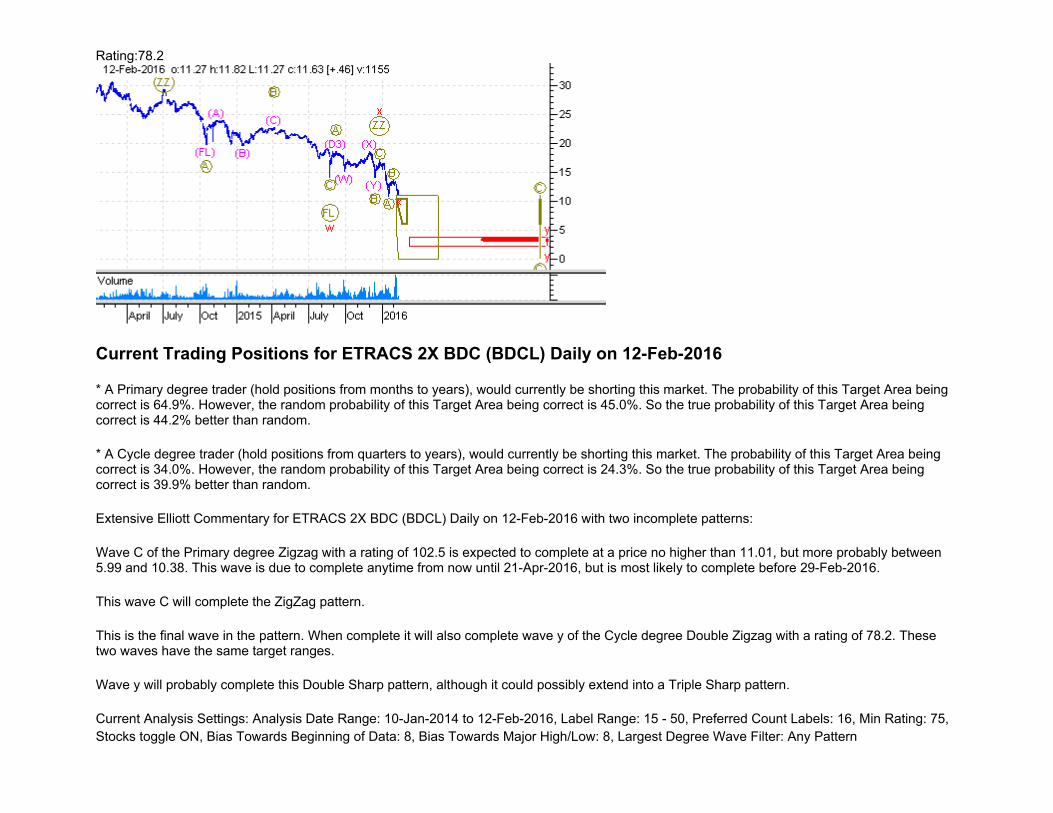
Current Trading Positions for ETRACS 2X BDC (BDCL) Daily on 12-Feb-2016 ............................................................231
Current Trading Positions for ETracs Alerian MLP Index ETN (AMU) Daily on 12-Feb-2016 .......................................232
Current Trading Positions for F & C Claymore Pref Sec Inc Fd (FFC) Daily on 12-Feb-2016..........................................233
Current Trading Positions for Fiduciary/Claymore MLP Opportunity (FMO) Daily on 12-Feb-2016...............................235
Current Trading Positions for First Trust Amex Biotechnology Index Fund ETF (FBT) Daily on 12-Feb-2016 ..............237
Current Trading Positions for First Trust Consumer Staples AlphaDEX Fund ETF (FXG) Daily on 12-Feb-2016 ..........238
Current Trading Positions for First Trust Dow Jones Global Select Dividend Index Fund ETF (FGD) Daily on 12-Feb-2016
Current Trading Positions for iShares MSCI EMU Index Fund ETF (EZU) Daily on 12-Feb-2016..................................416
Current Trading Positions for iShares MSCI Europe Financials (EUFN) Daily on 12-Feb-2016 ......................................418
Current Trading Positions for iShares MSCI France Index Fund ETF (EWQ) Daily on 12-Feb-2016 ..............................419
Current Trading Positions for iShares MSCI Frontier 100 Index (FM) Daily on 12-Feb-2016..........................................421
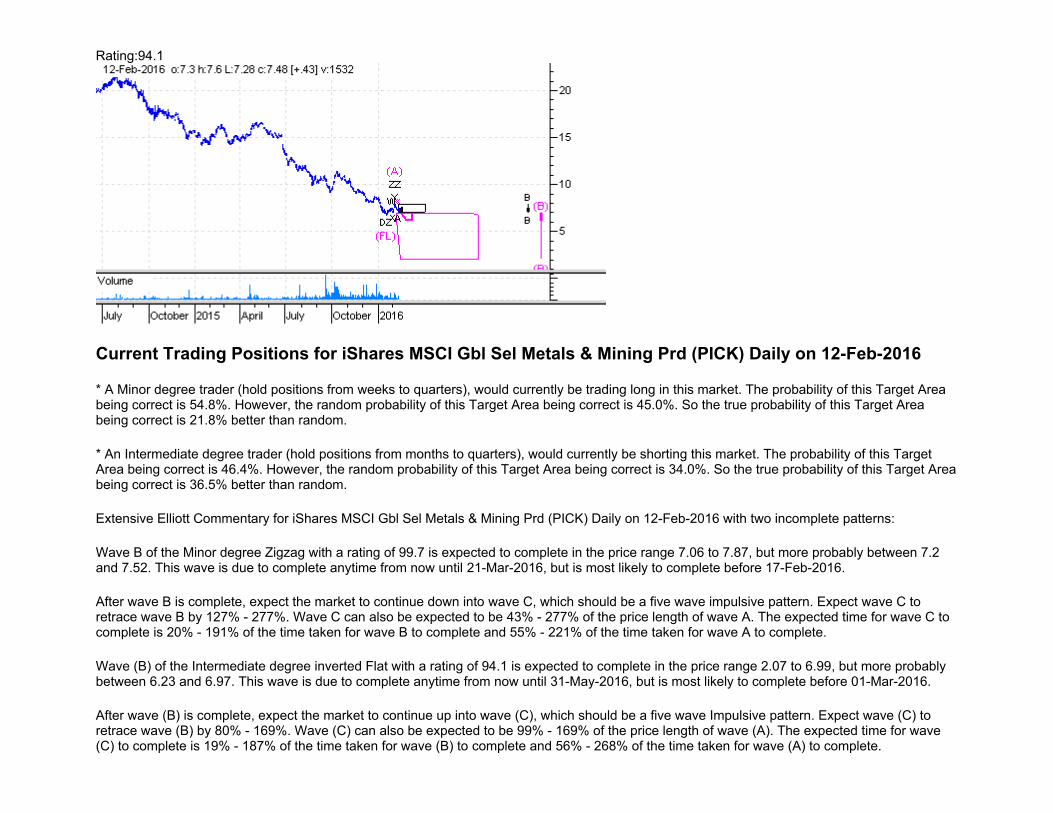
Current Trading Positions for iShares MSCI Gbl Sel Metals & Mining Prd (PICK) Daily on 12-Feb-2016 .....................423
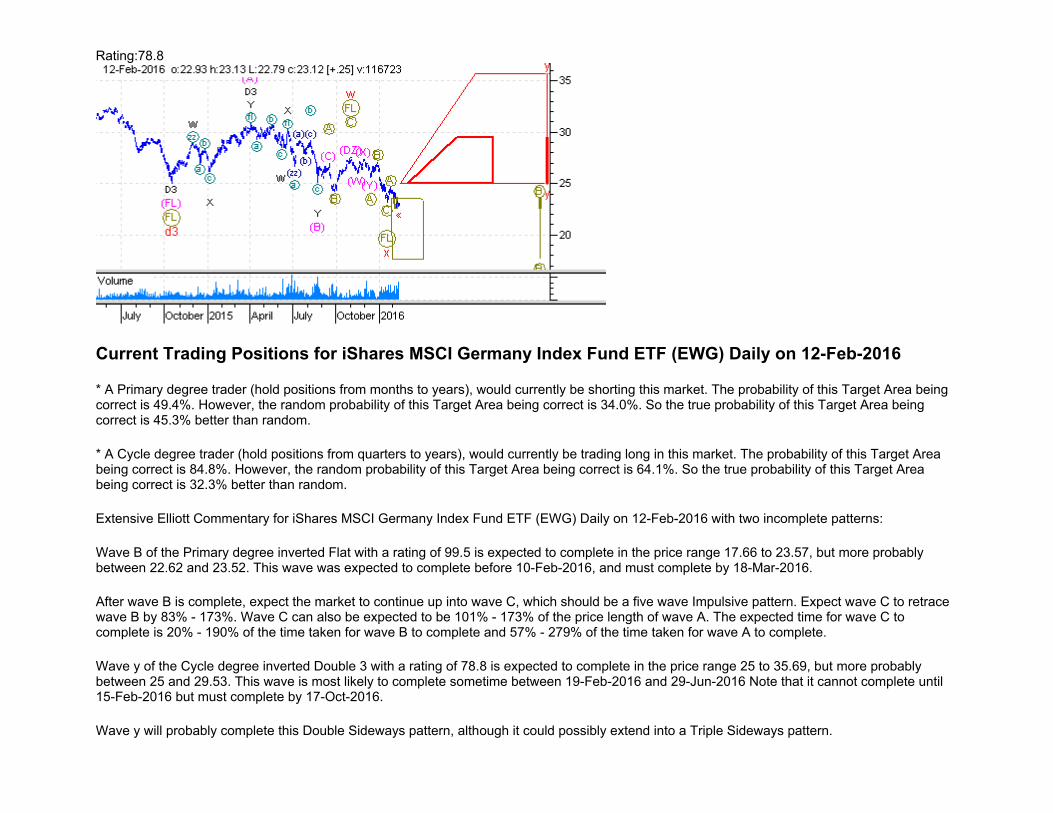
Current Trading Positions for iShares MSCI Germany Index Fund ETF (EWG) Daily on 12-Feb-2016 ..........................425
Current Trading Positions for iShares MSCI Global Gold Miners (RING) Daily on 12-Feb-2016....................................427
Current Trading Positions for iShares MSCI Hong Kong Index Fund ETF (EWH) Daily on 12-Feb-2016 ......................429
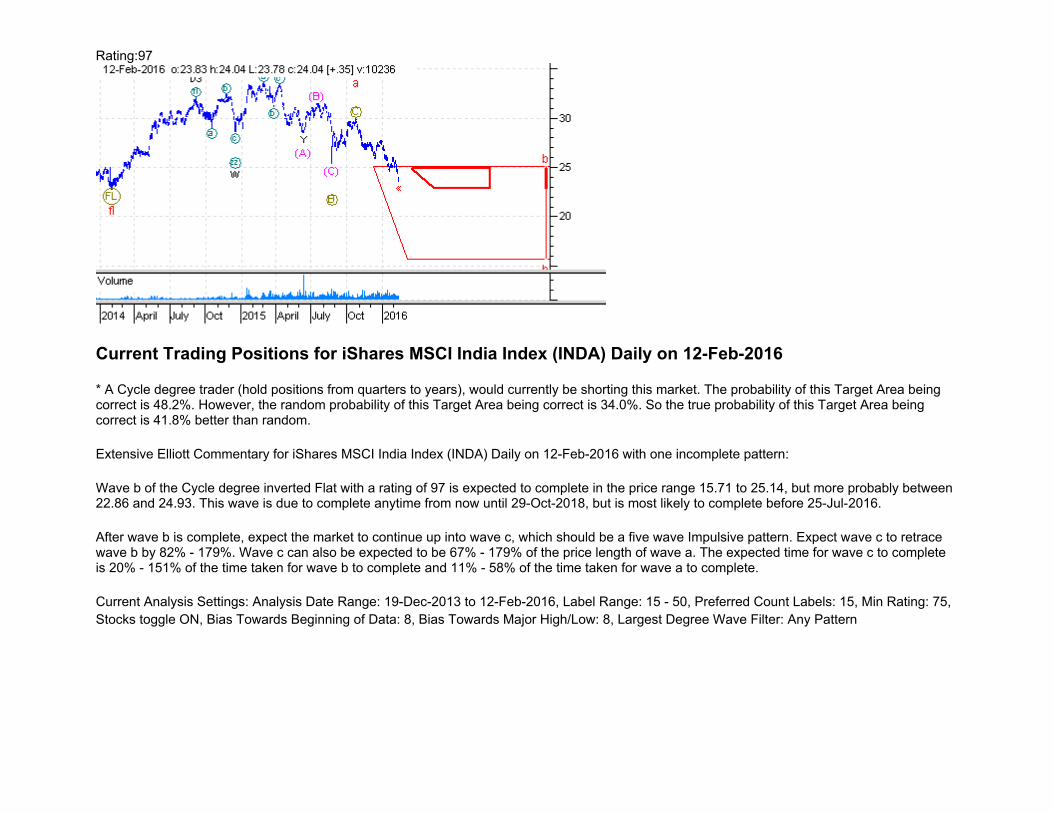
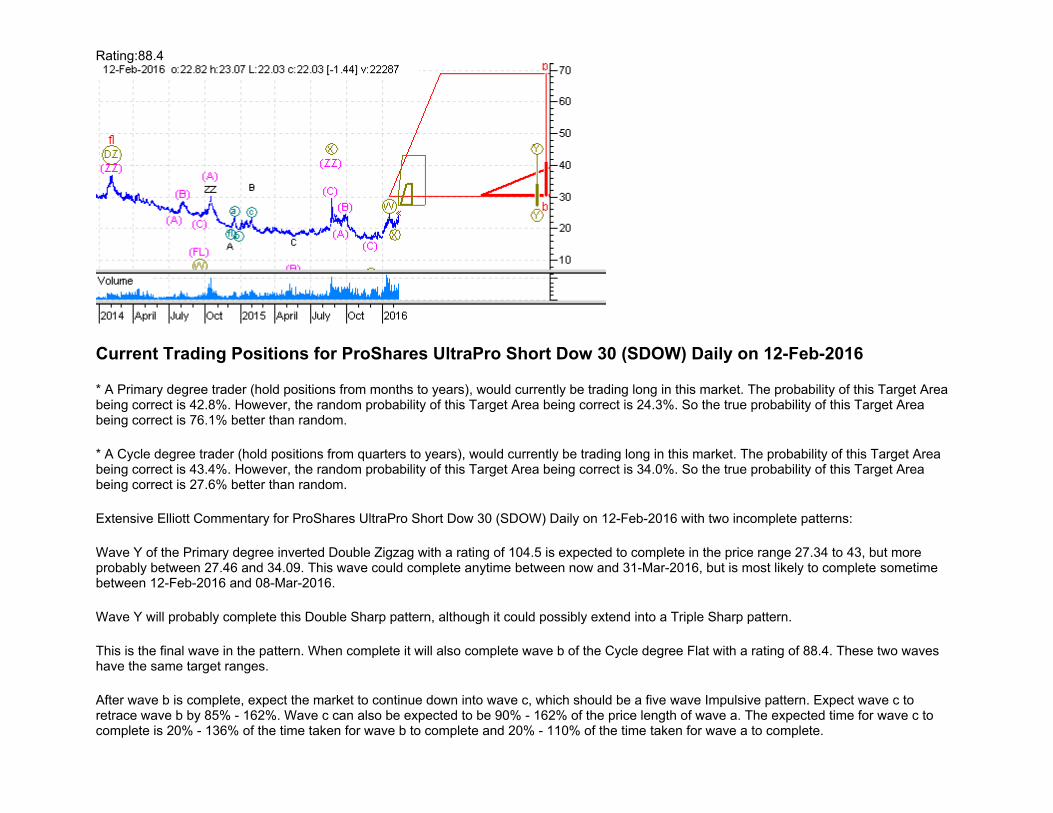
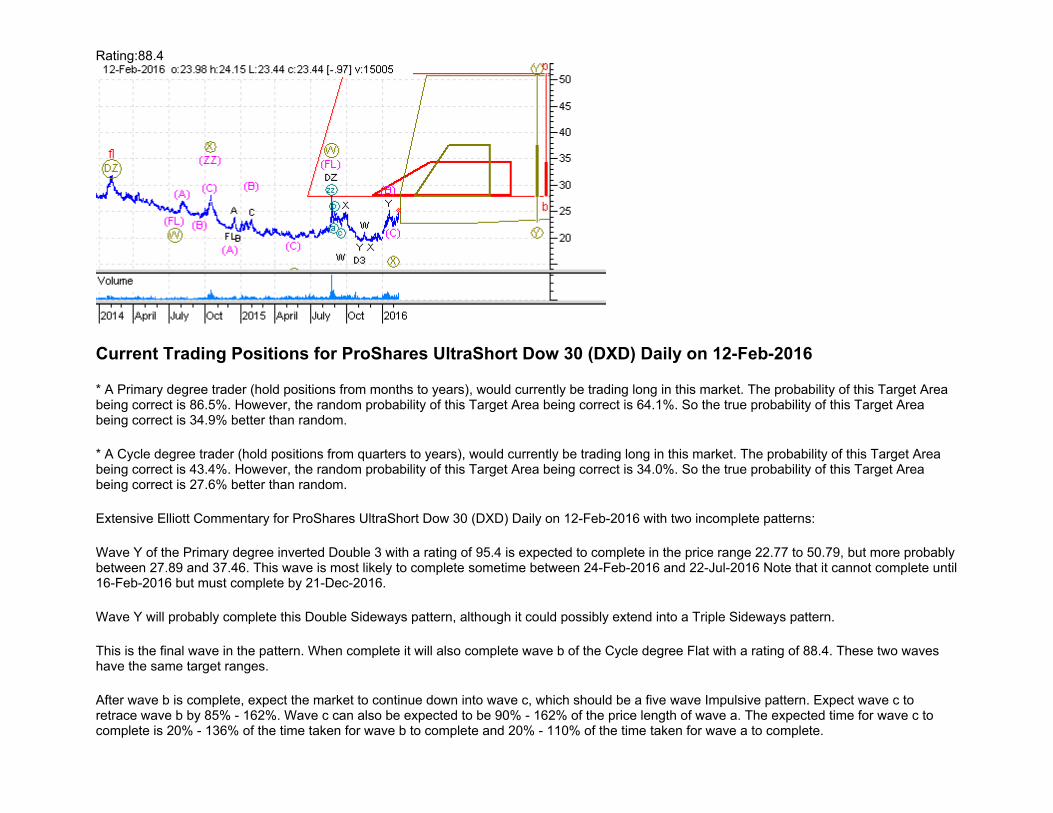
Current Trading Positions for iShares MSCI India Index (INDA) Daily on 12-Feb-2016 .................................................430
Current Trading Positions for iShares MSCI Indonesia Investable Market Fund (EIDO) Daily on 12-Feb-2016 .............431
Current Trading Positions for iShares MSCI Italy Index Fund ETF (EWI) Daily on 12-Feb-2016 ...................................433
Current Trading Positions for iShares MSCI Japan Index Fund ETF (EWJ) Daily on 12-Feb-2016 .................................434
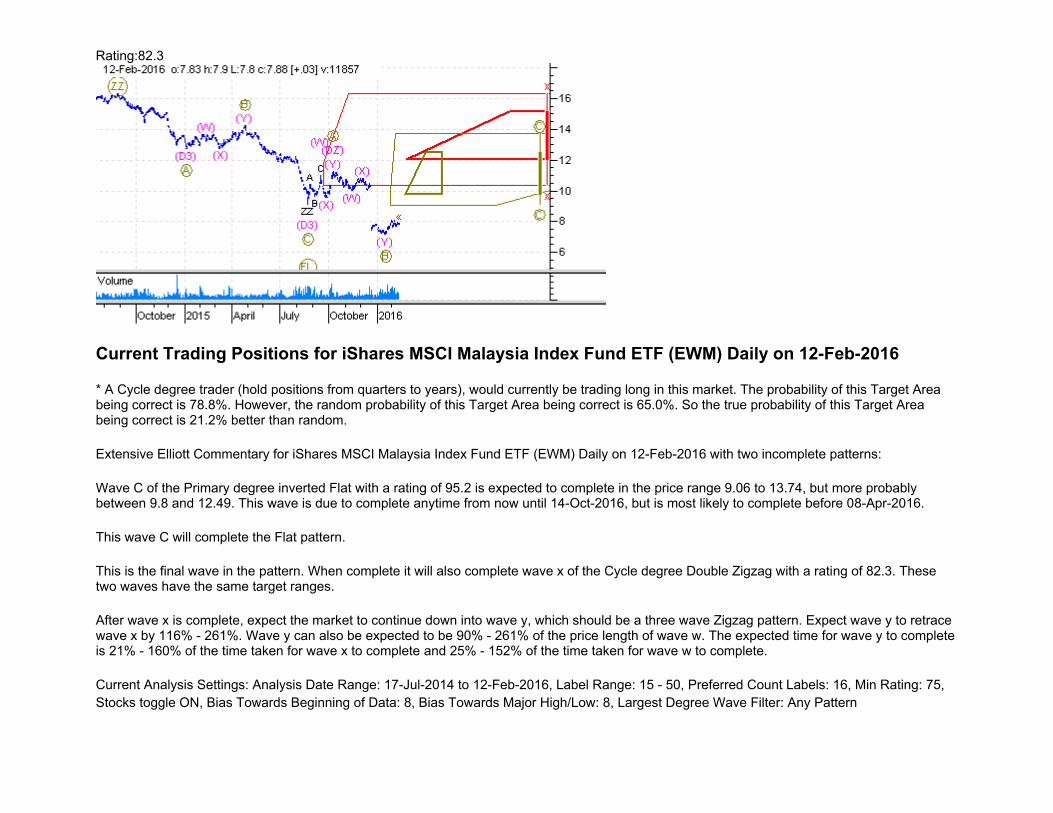
Current Trading Positions for iShares MSCI Malaysia Index Fund ETF (EWM) Daily on 12-Feb-2016..........................436
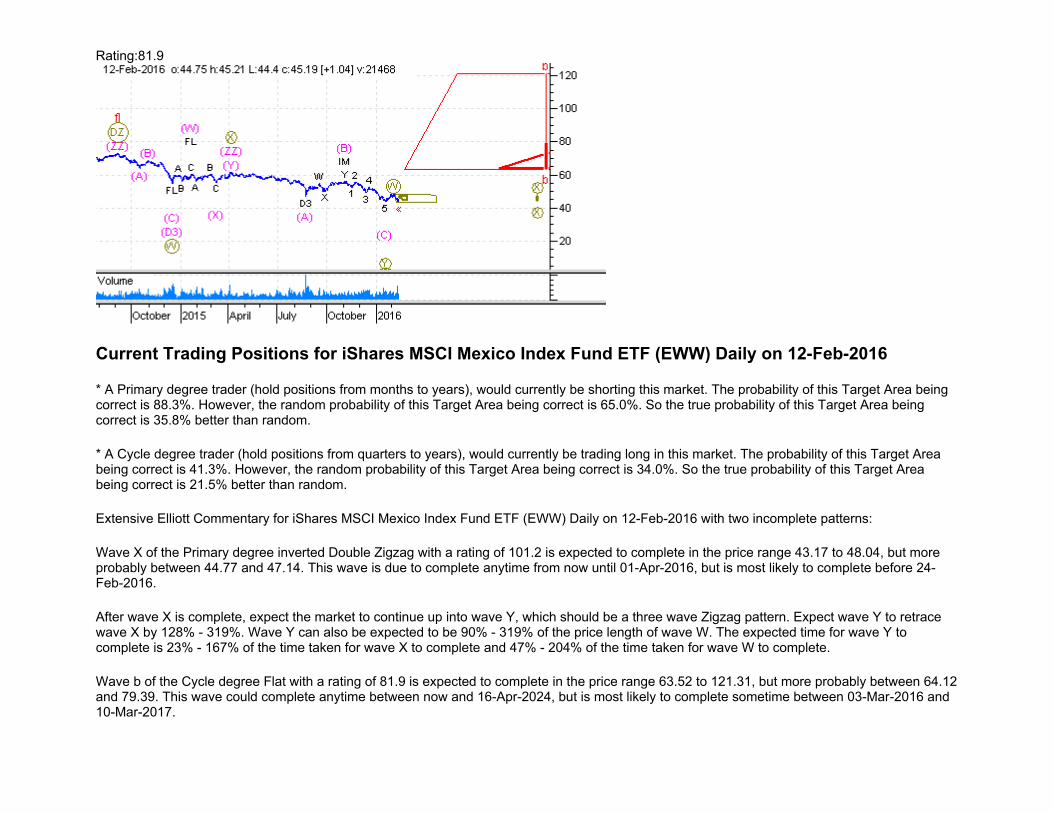
Current Trading Positions for iShares MSCI Mexico Index Fund ETF (EWW) Daily on 12-Feb-2016 ............................437
Current Trading Positions for iShares MSCI Netherlands Index Fund ETF (EWN) Daily on 12-Feb-2016......................439
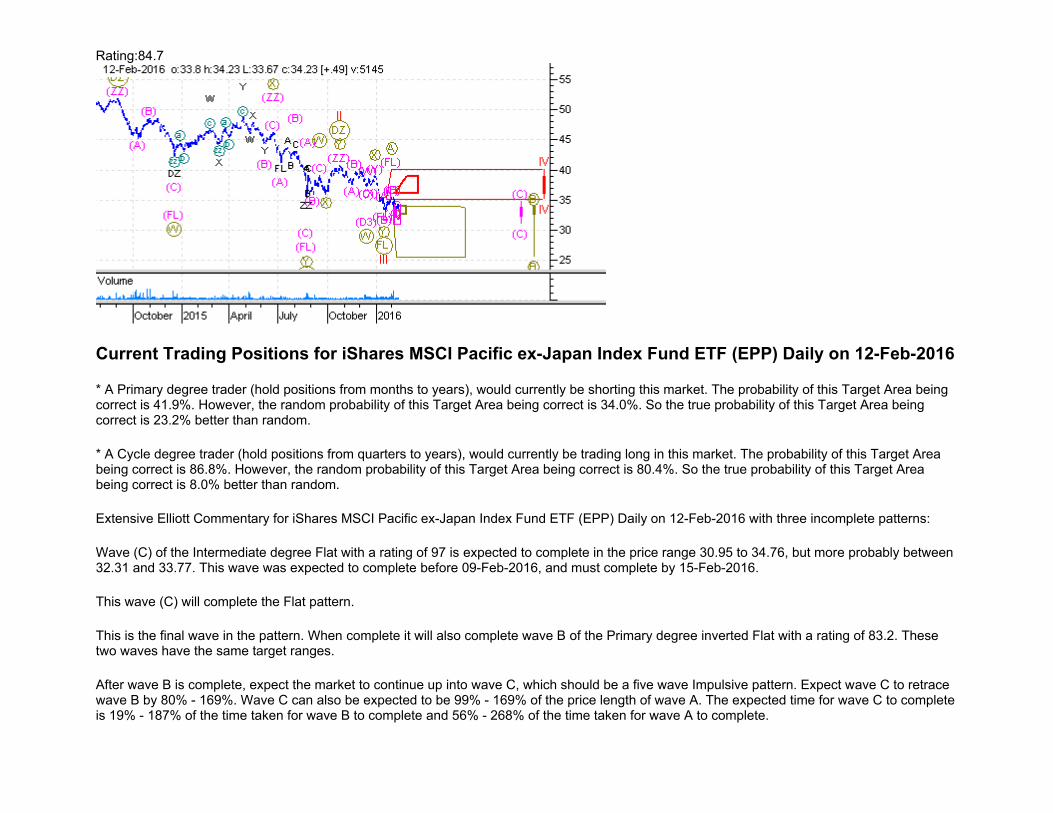
Current Trading Positions for iShares MSCI Pacific ex-Japan Index Fund ETF (EPP) Daily on 12-Feb-2016.................440
Current Trading Positions for iShares MSCI Philippines Investable Market Index Fund (EPHE) Daily on 12-Feb-2016 442
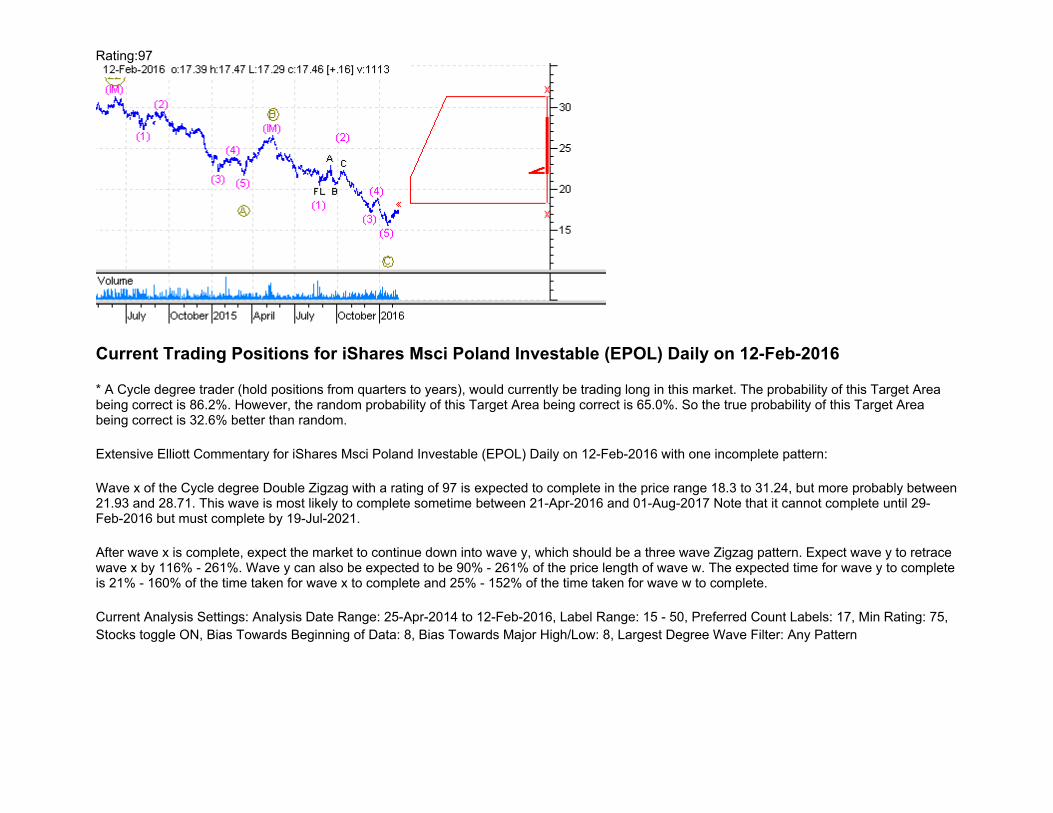
Current Trading Positions for iShares Msci Poland Investable (EPOL) Daily on 12-Feb-2016.........................................443
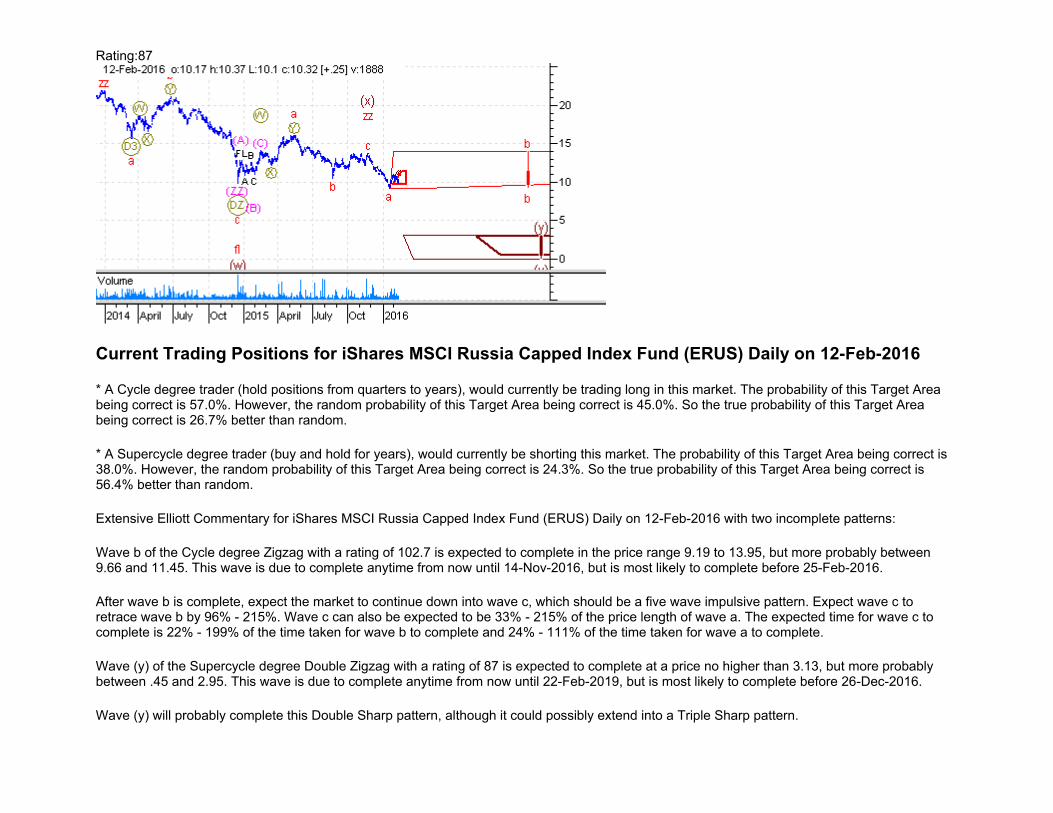
Current Trading Positions for iShares MSCI Russia Capped Index Fund (ERUS) Daily on 12-Feb-2016 ........................444
Current Trading Positions for iShares MSCI Singapore Index Fund ETF (EWS) Daily on 12-Feb-2016 .........................446
Current Trading Positions for iShares MSCI South Africa Index Fund ETF (EZA) Daily on 12-Feb-2016......................447
Current Trading Positions for iShares MSCI South Korea Index Fund ETF (EWY) Daily on 12-Feb-2016.....................448
Current Trading Positions for iShares MSCI Spain Index Fund ETF (EWP) Daily on 12-Feb-2016.................................449
Current Trading Positions for iShares MSCI Sweden Index Fund ETF (EWD) Daily on 12-Feb-2016 ............................450
Current Trading Positions for iShares MSCI Switzerland Index Fund ETF (EWL) Daily on 12-Feb-2016 ......................452
Current Trading Positions for iShares MSCI Taiwan Index Fund ETF (EWT) Daily on 12-Feb-2016..............................453
Current Trading Positions for iShares MSCI Thailand Investable Market Index Fund ETF (THD) Daily on 12-Feb-2016454
Current Trading Positions for iShares MSCI Turkey Investable Market Index Fund ETF (TUR) Daily on 12-Feb-2016.455
Current Trading Positions for iShares MSCI United Kingdom Index Fund ETF (EWU) Daily on 12-Feb-2016 ..............457
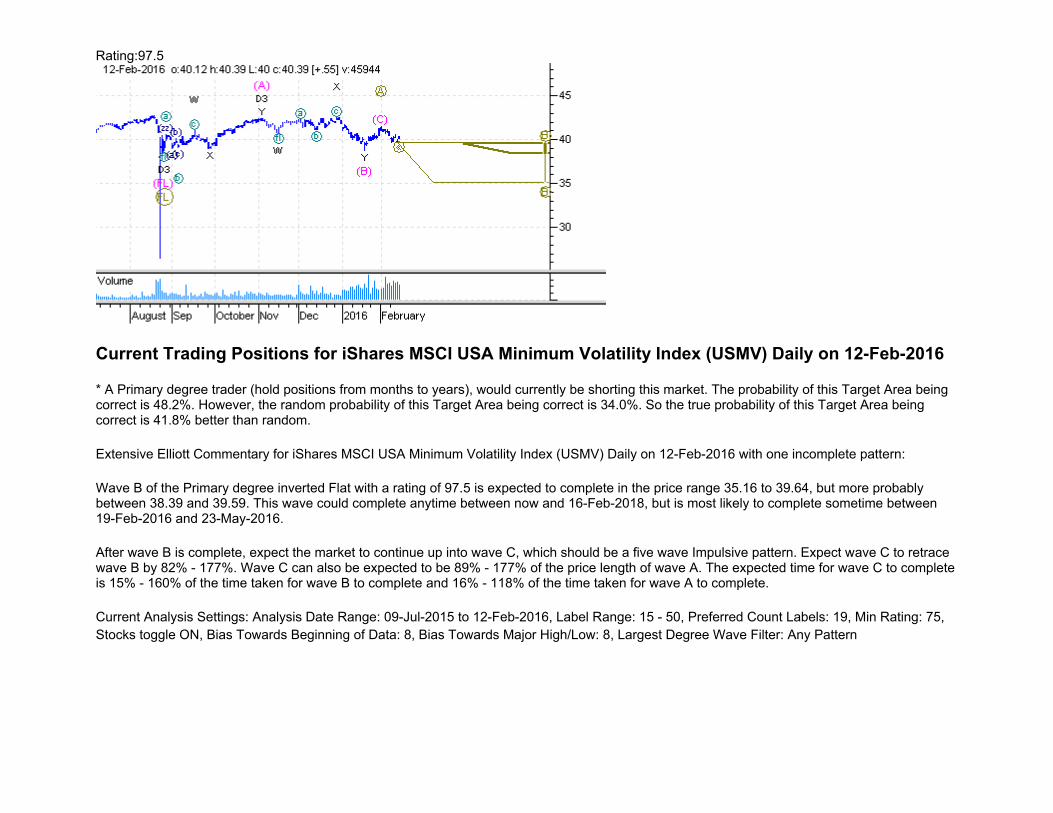
Current Trading Positions for iShares MSCI USA Minimum Volatility Index (USMV) Daily on 12-Feb-2016...............458
Current Trading Positions for iShares MSCI USA Momentum Factor ETF (MTUM) Daily on 12-Feb-2016 ..................459
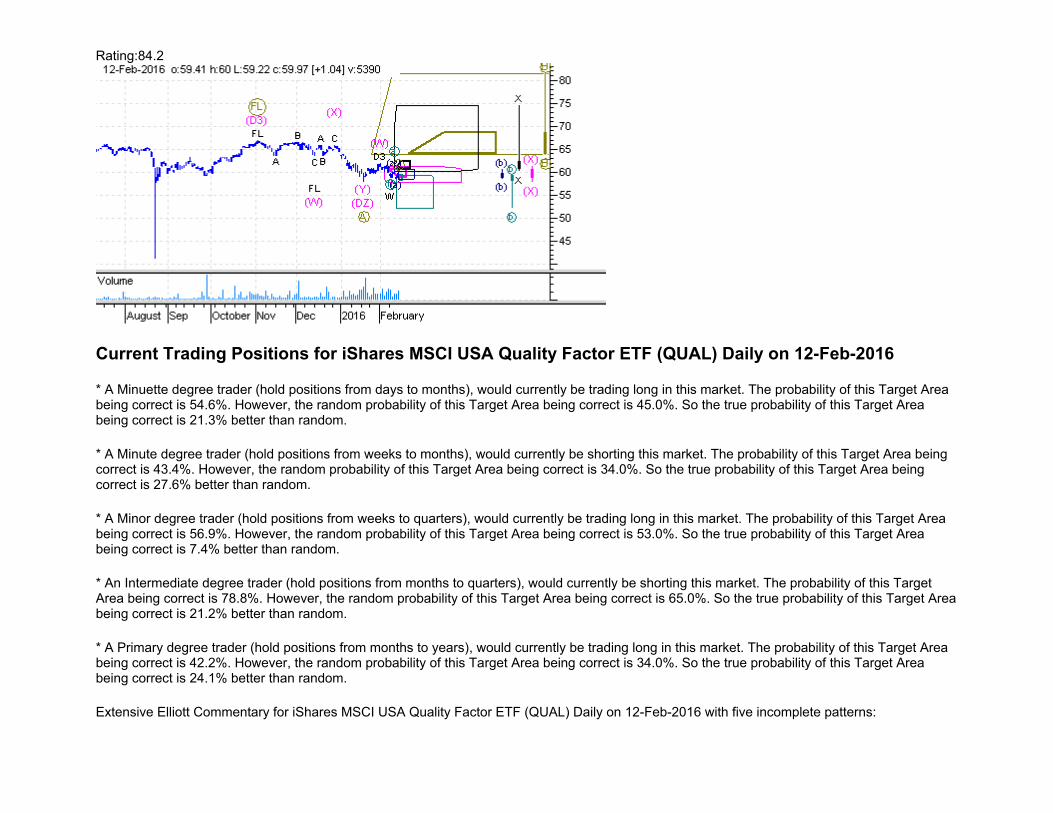
Current Trading Positions for iShares MSCI USA Quality Factor ETF (QUAL) Daily on 12-Feb-2016 ..........................460
Current Trading Positions for iShares Nasdaq Biotechnology Index Fund ETF (IBB) Daily on 12-Feb-2016..................462
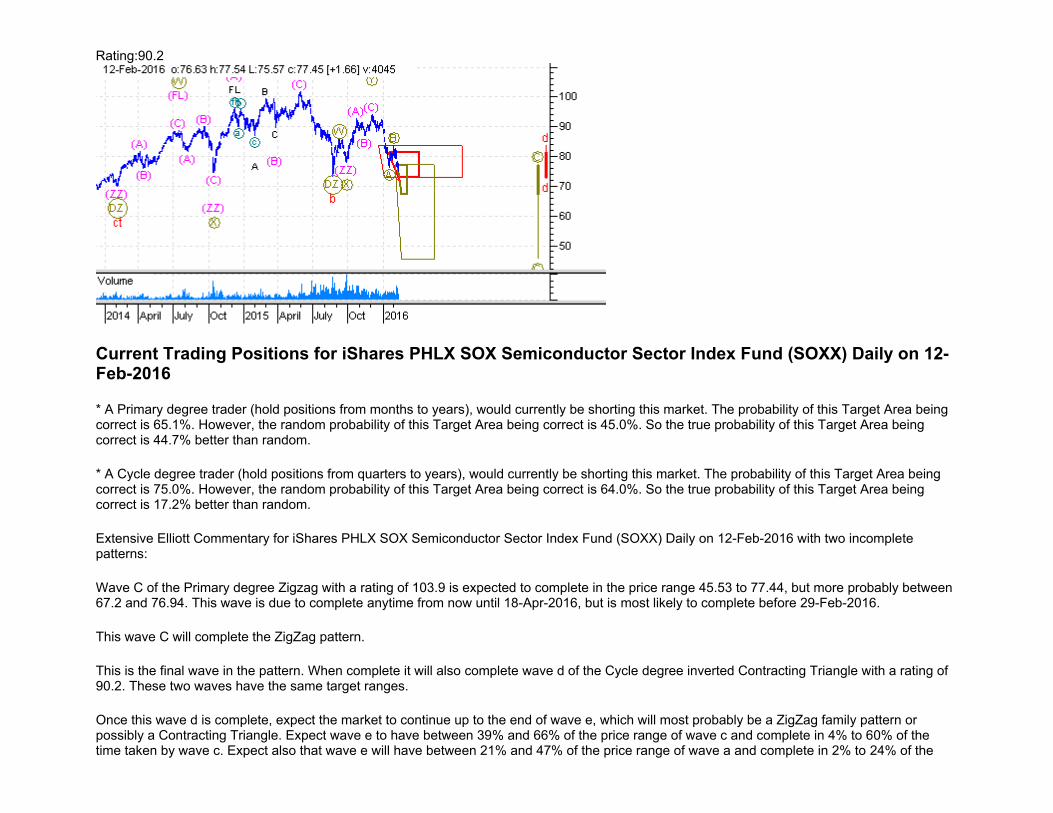
Current Trading Positions for iShares PHLX SOX Semiconductor Sector Index Fund (SOXX) Daily on 12-Feb-2016 ..464
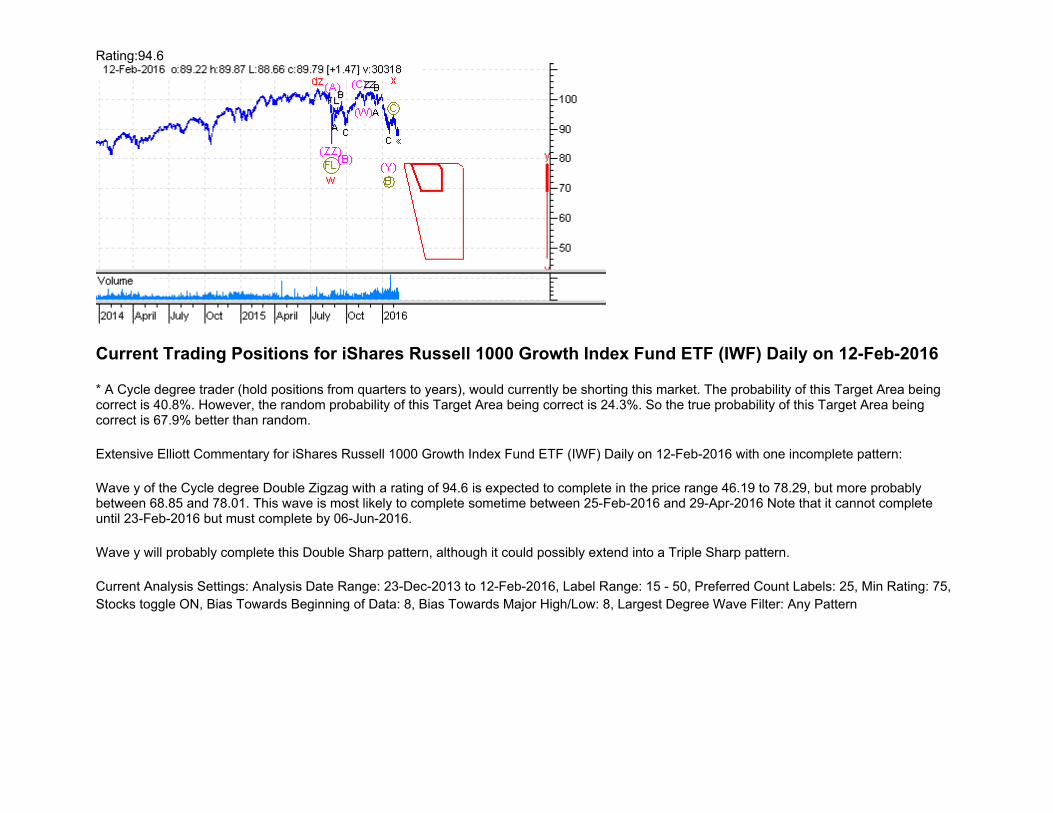
Current Trading Positions for iShares Russell 1000 Growth Index Fund ETF (IWF) Daily on 12-Feb-2016....................466
Current Trading Positions for iShares Russell 1000 Index Fund ETF (IWB) Daily on 12-Feb-2016 ................................467
Current Trading Positions for iShares Russell 1000 Value Index Fund ETF (IWD) Daily on 12-Feb-2016......................469
Current Trading Positions for iShares Russell 2000 Index Fund ETF (IWM) Daily on 12-Feb-2016 ...............................470
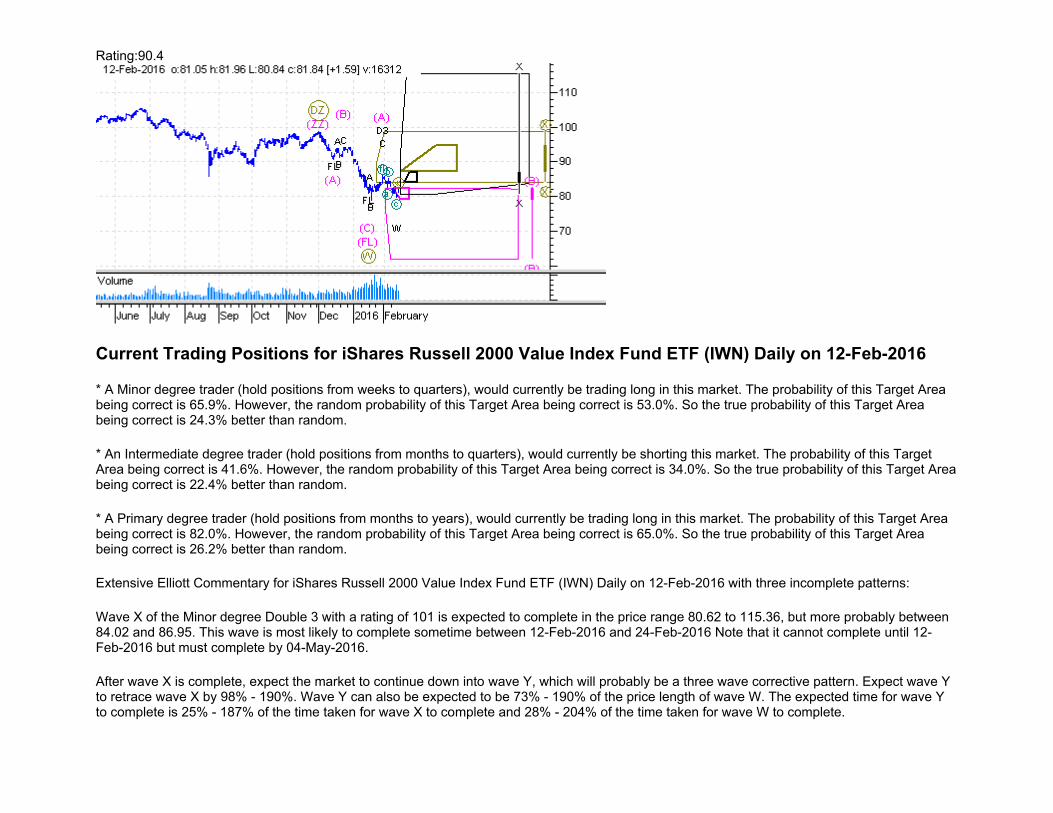
Current Trading Positions for iShares Russell 2000 Value Index Fund ETF (IWN) Daily on 12-Feb-2016......................471
Current Trading Positions for iShares Russell 3000 Index Fund ETF (IWV) Daily on 12-Feb-2016 ................................473
Current Trading Positions for iShares Russell MidCap Growth Index Fund ETF (IWP) Daily on 12-Feb-2016...............475
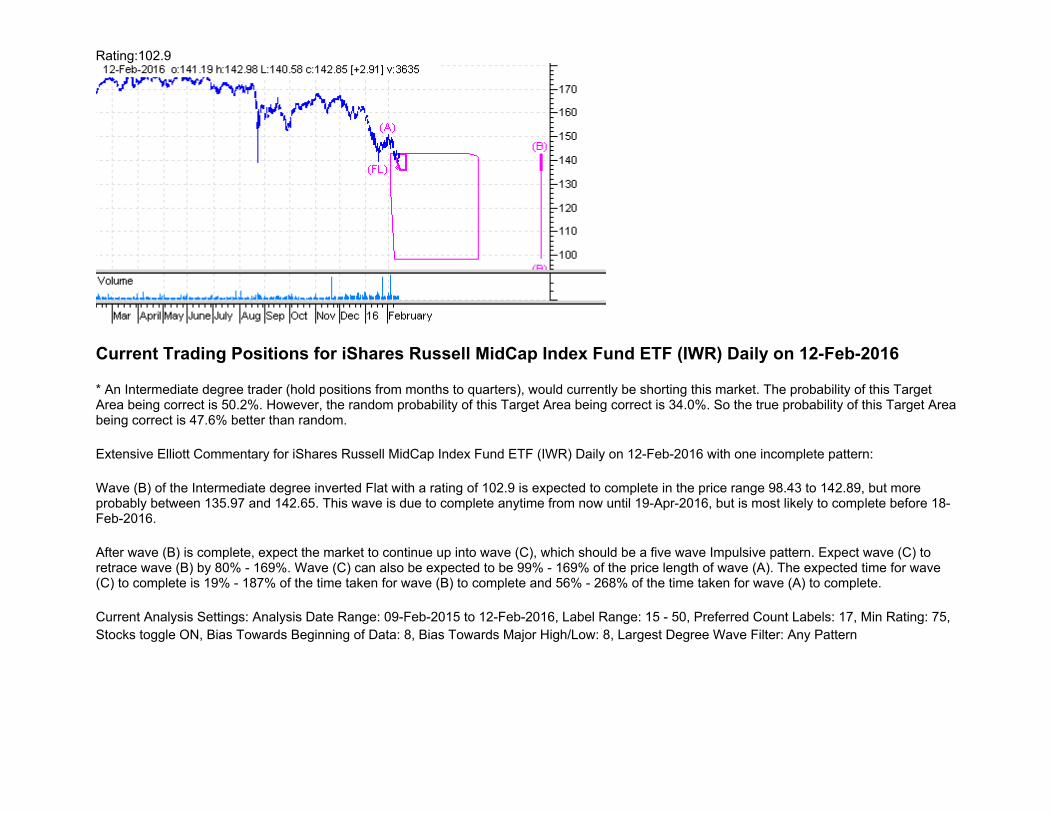
Current Trading Positions for iShares Russell MidCap Index Fund ETF (IWR) Daily on 12-Feb-2016 ...........................477
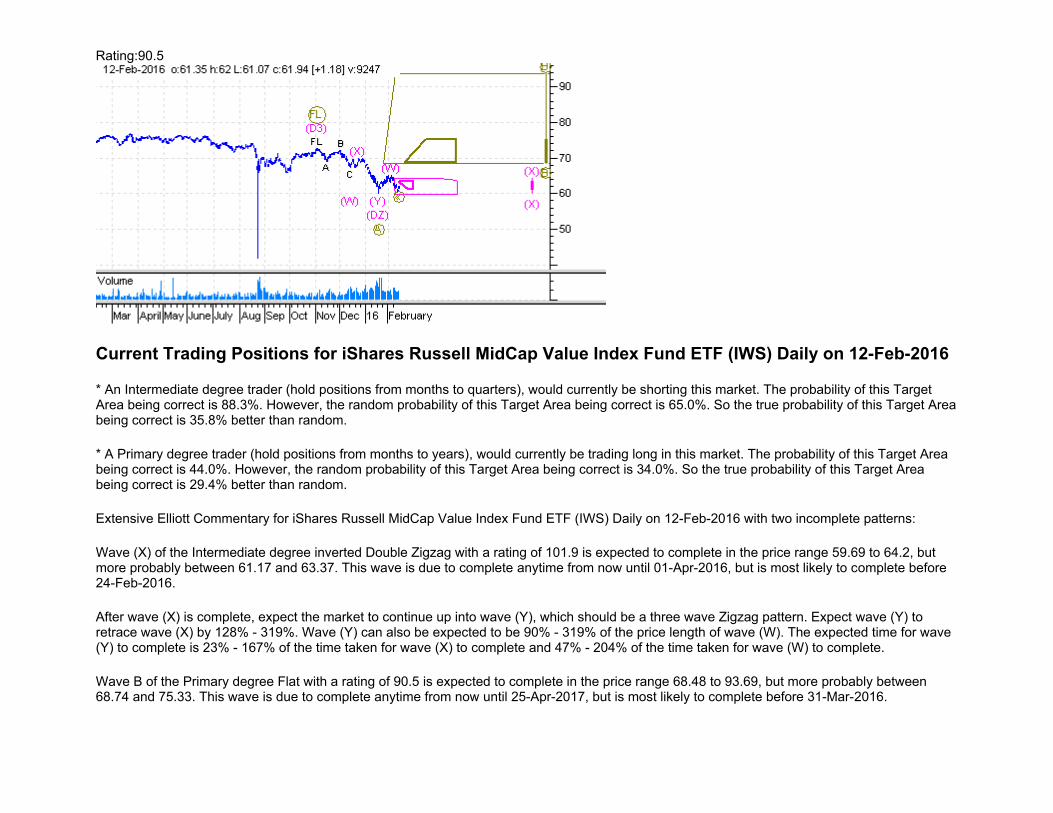
Current Trading Positions for iShares Russell MidCap Value Index Fund ETF (IWS) Daily on 12-Feb-2016 .................478
Current Trading Positions for iShares S&P 100 Index Fund ETF (OEF) Daily on 12-Feb-2016.......................................480
Current Trading Positions for iShares S&P 500 Index Fund ETF (IVV) Daily on 12-Feb-2016 .......................................481
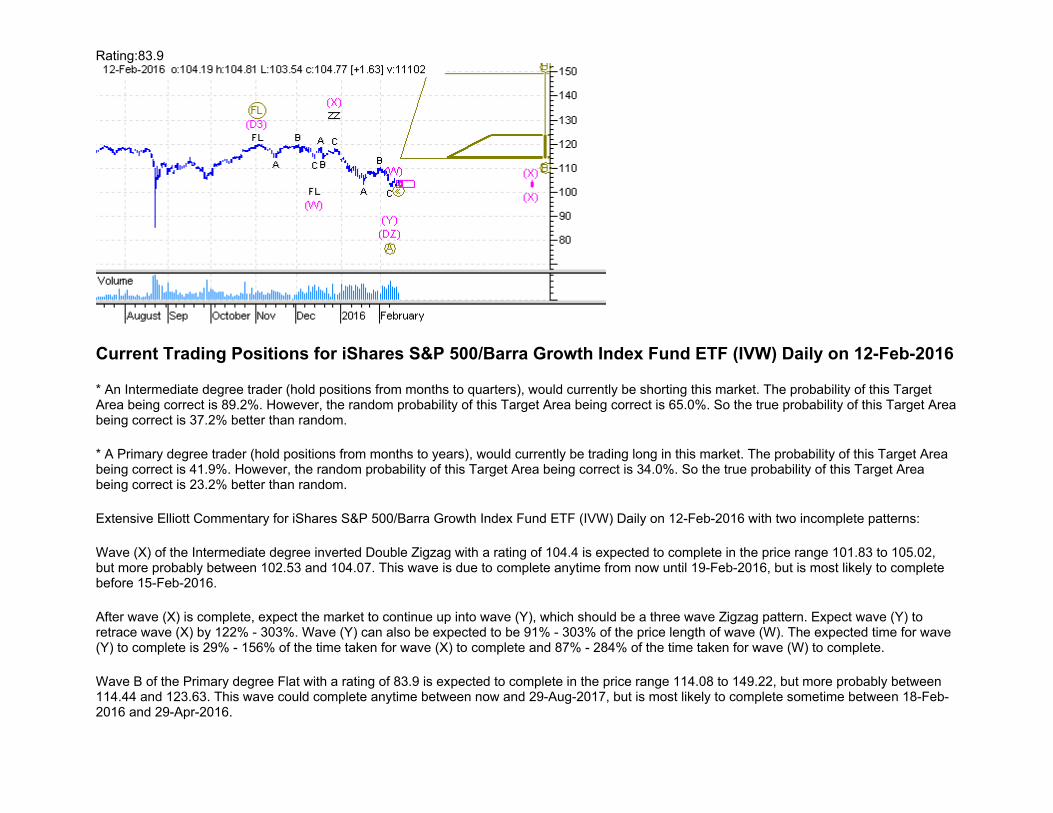
Current Trading Positions for iShares S&P 500/Barra Growth Index Fund ETF (IVW) Daily on 12-Feb-2016 ...............483
Current Trading Positions for iShares S&P 500/Barra Value Index Fund ETF (IVE) Daily on 12-Feb-2016 ...................485
Current Trading Positions for iShares S&P Aggressive Allocation Fund (AOA) Daily on 12-Feb-2016 ..........................487
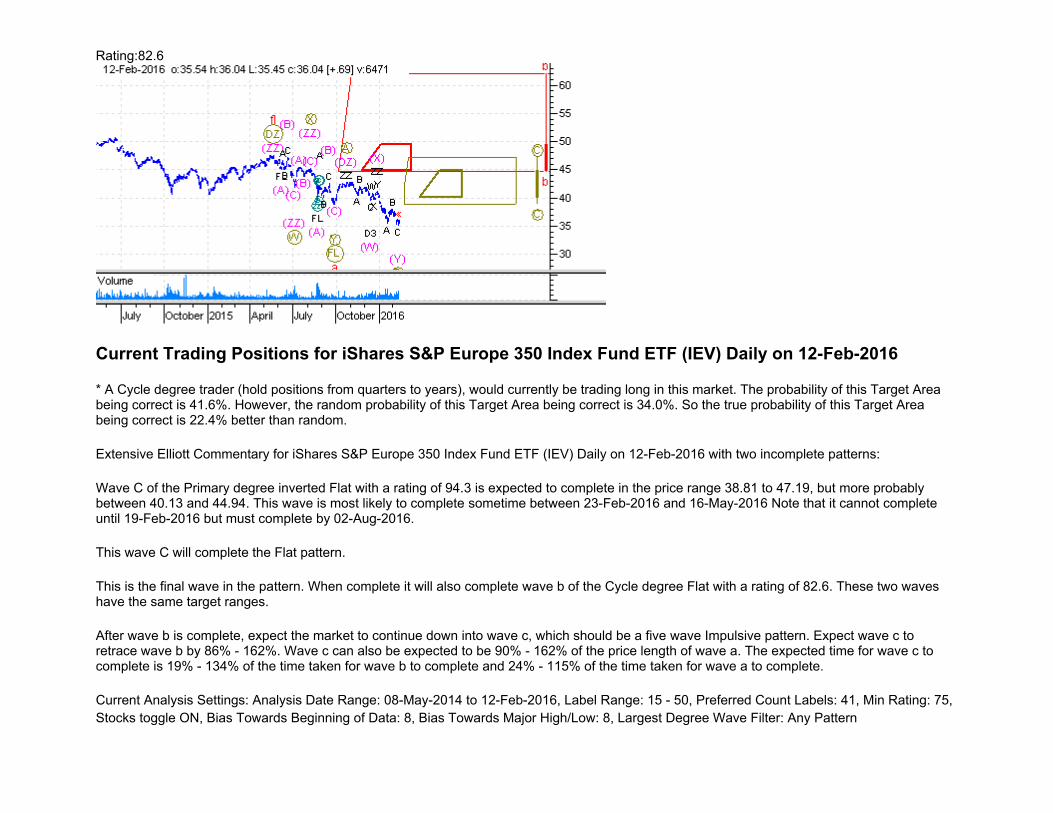
Current Trading Positions for iShares S&P Europe 350 Index Fund ETF (IEV) Daily on 12-Feb-2016 ...........................489
Current Trading Positions for iShares S&P Global Energy Sector Index Fund ETF (IXC) Daily on 12-Feb-2016...........490
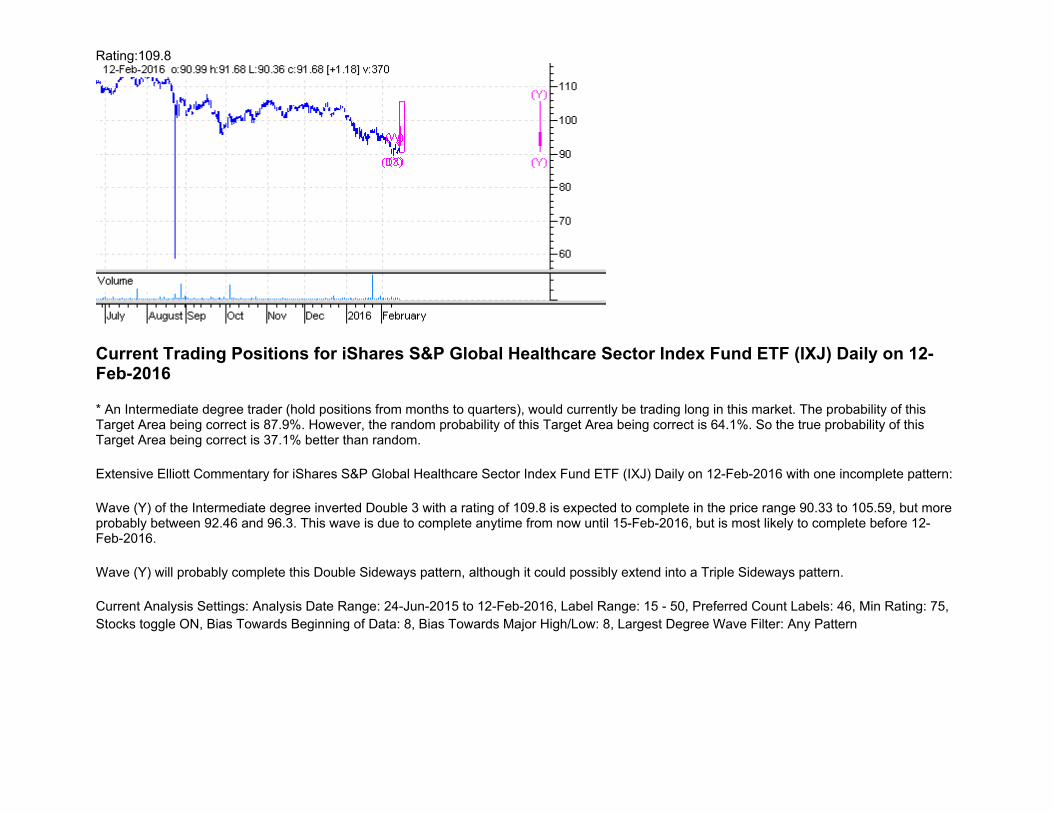
Current Trading Positions for iShares S&P Global Healthcare Sector Index Fund ETF (IXJ) Daily on 12-Feb-2016 ......491
Current Trading Positions for iShares S&P Global Infrastructure Index Fund ETF (IGF) Daily on 12-Feb-2016 ............492
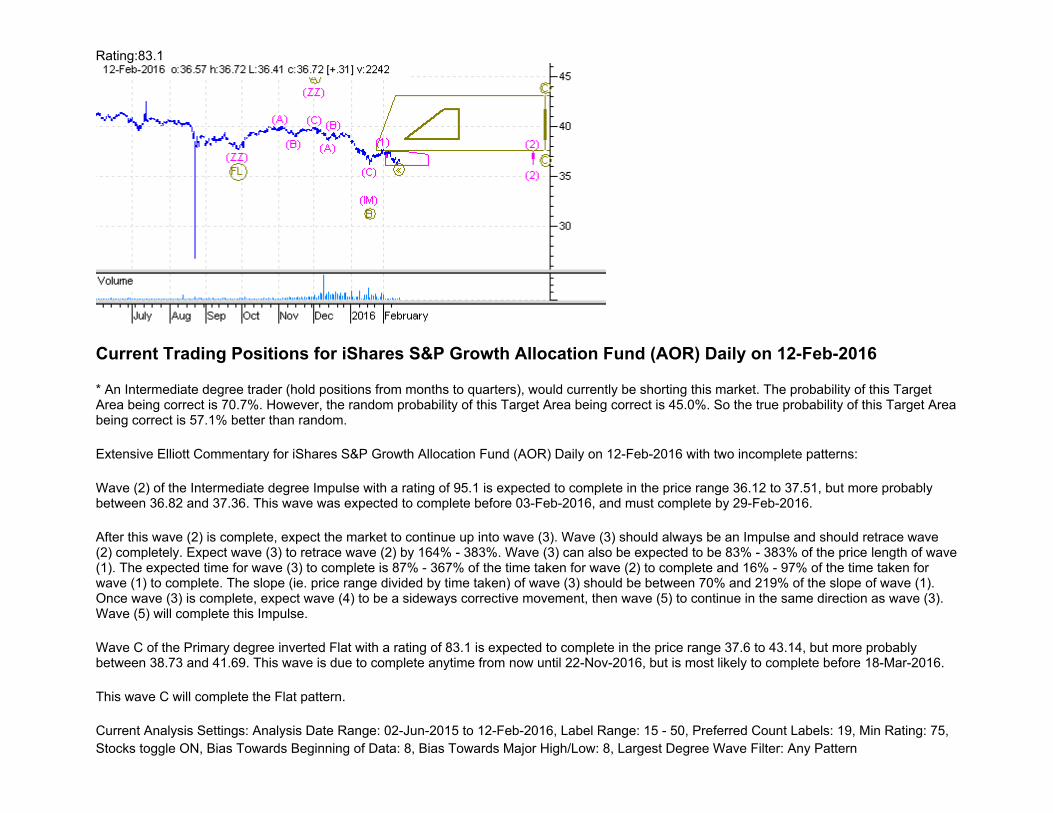
Current Trading Positions for iShares S&P Growth Allocation Fund (AOR) Daily on 12-Feb-2016 ................................494
Current Trading Positions for iShares S&P GSCI Commodity Indexed Trust ETF (GSG) Daily on 12-Feb-2016 ...........495
Current Trading Positions for iShares S&P GSTI Networking Index Fund ETF (IGN) Daily on 12-Feb-2016 ................497
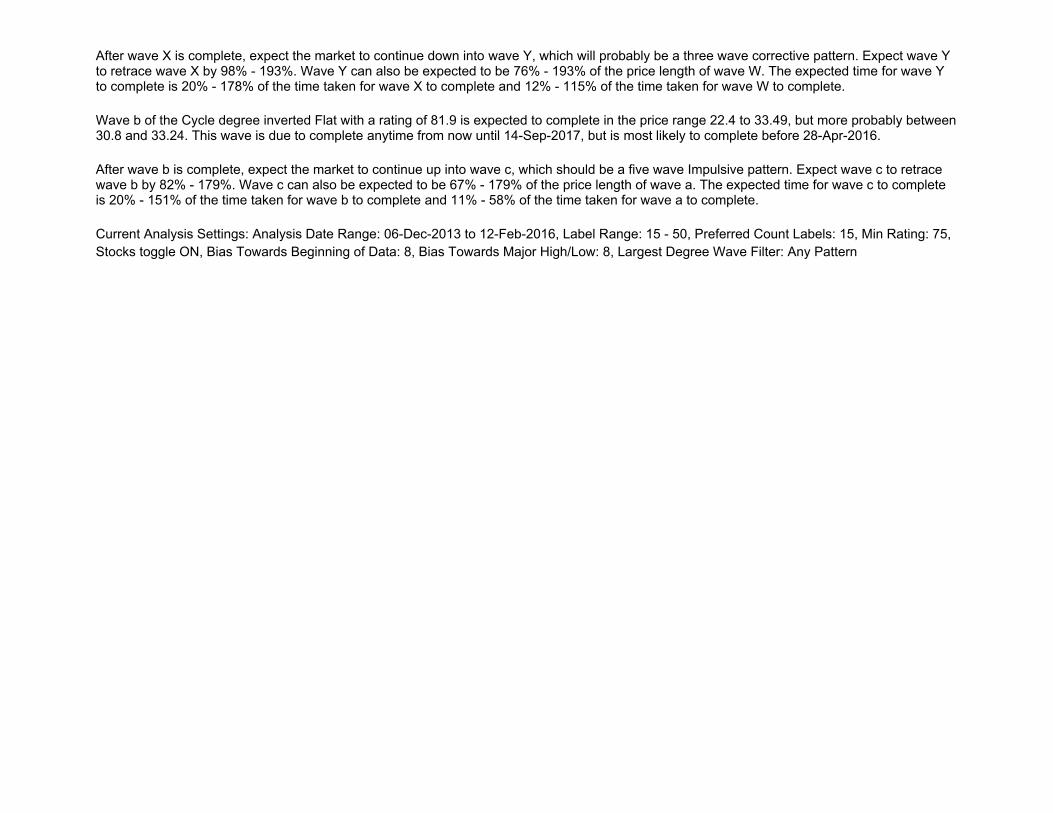
Current Trading Positions for iShares S&P GSTI Software Index Fund ETF (IGV) Daily on 12-Feb-2016.....................499
Current Trading Positions for iShares S&P India Nifty 50 Index Fund (INDY) Daily on 12-Feb-2016............................500
Current Trading Positions for iShares S&P Latin America 40 Index Fund ETF (ILF) Daily on 12-Feb-2016 ..................502
Current Trading Positions for iShares S&P MidCap 400 Index Fund ETF (IJH) Daily on 12-Feb-2016...........................503
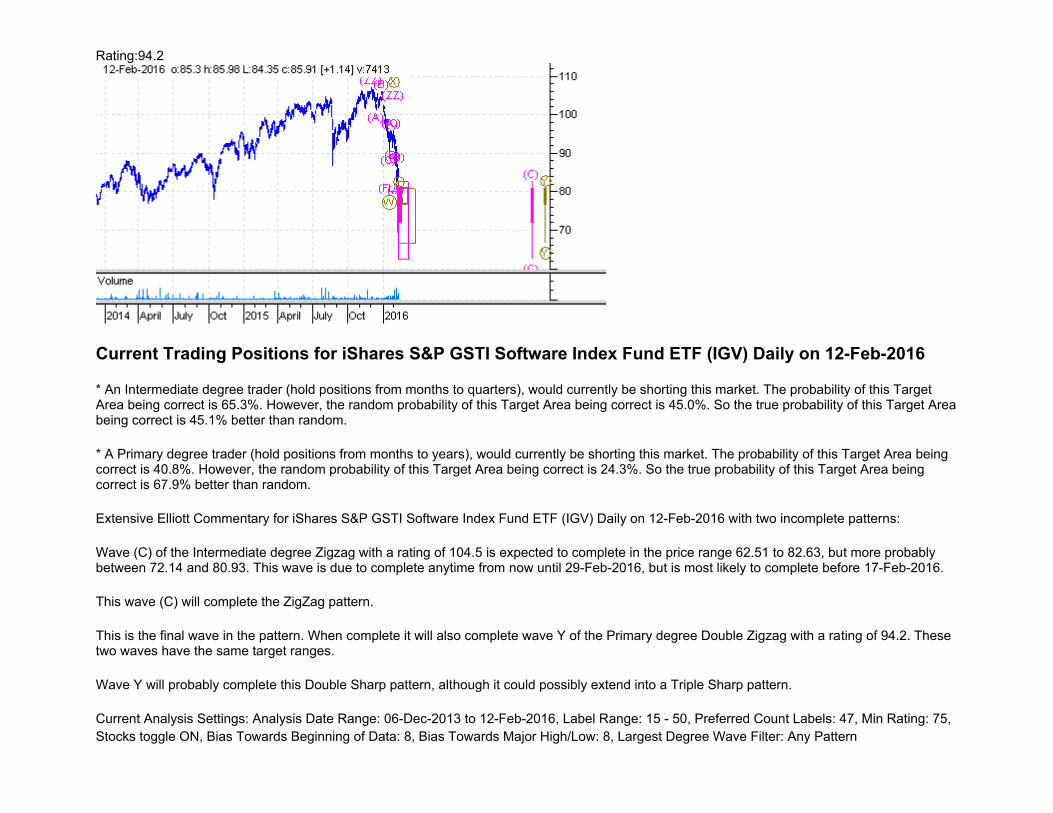
Current Trading Positions for iShares S&P MidCap 400/Barra Growth Index Fund ETF (IJK) Daily on 12-Feb-2016 ...505
Current Trading Positions for iShares S&P MidCap 400/Barra Value Index Fund ETF (IJJ) Daily on 12-Feb-2016 .......506
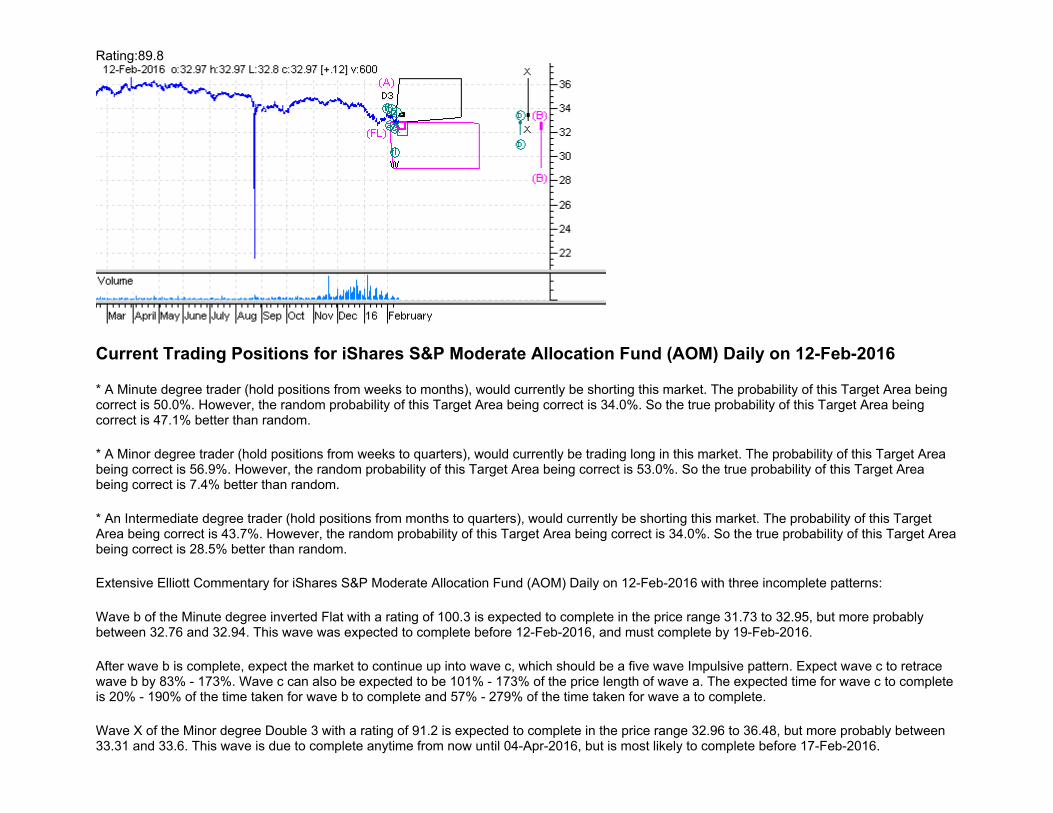
Current Trading Positions for iShares S&P Moderate Allocation Fund (AOM) Daily on 12-Feb-2016 ............................508
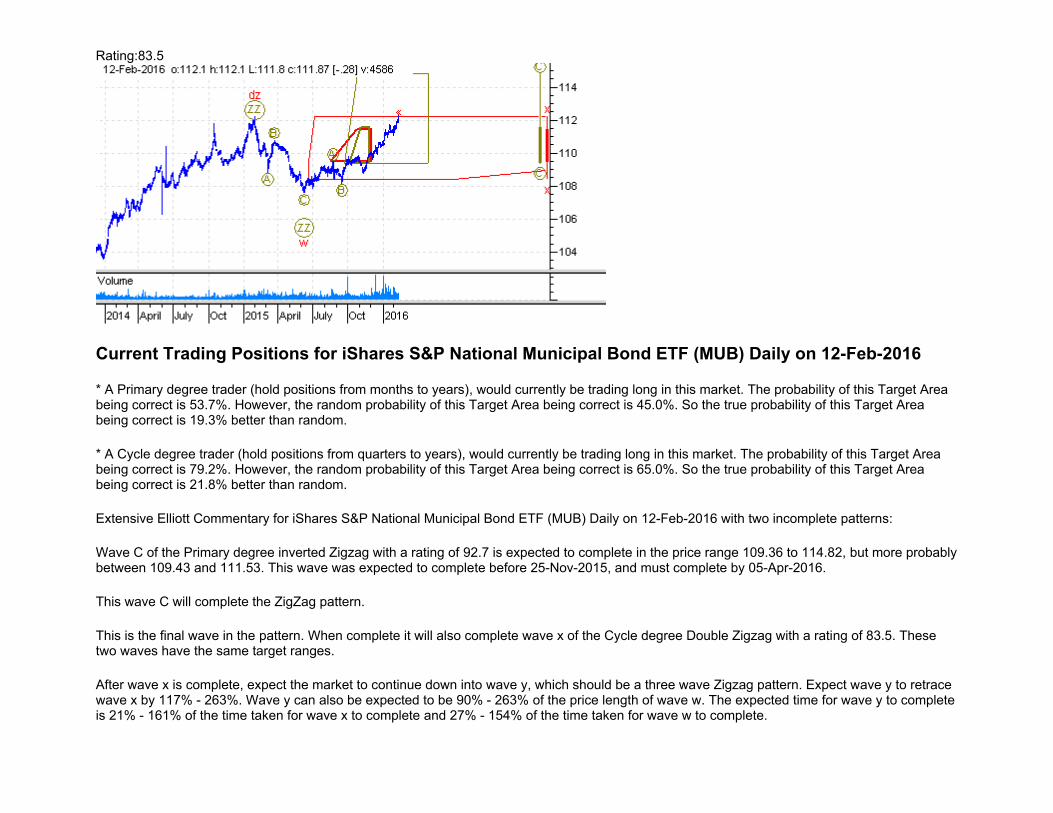
Current Trading Positions for iShares S&P National Municipal Bond ETF (MUB) Daily on 12-Feb-2016......................510
Current Trading Positions for iShares S&P SmallCap 600 Index Fund ETF (IJR) Daily on 12-Feb-2016 ........................512
Current Trading Positions for iShares S&P SmallCap 600/Barra Value Index Fund ETF (IJS) Daily on 12-Feb-2016 ....514
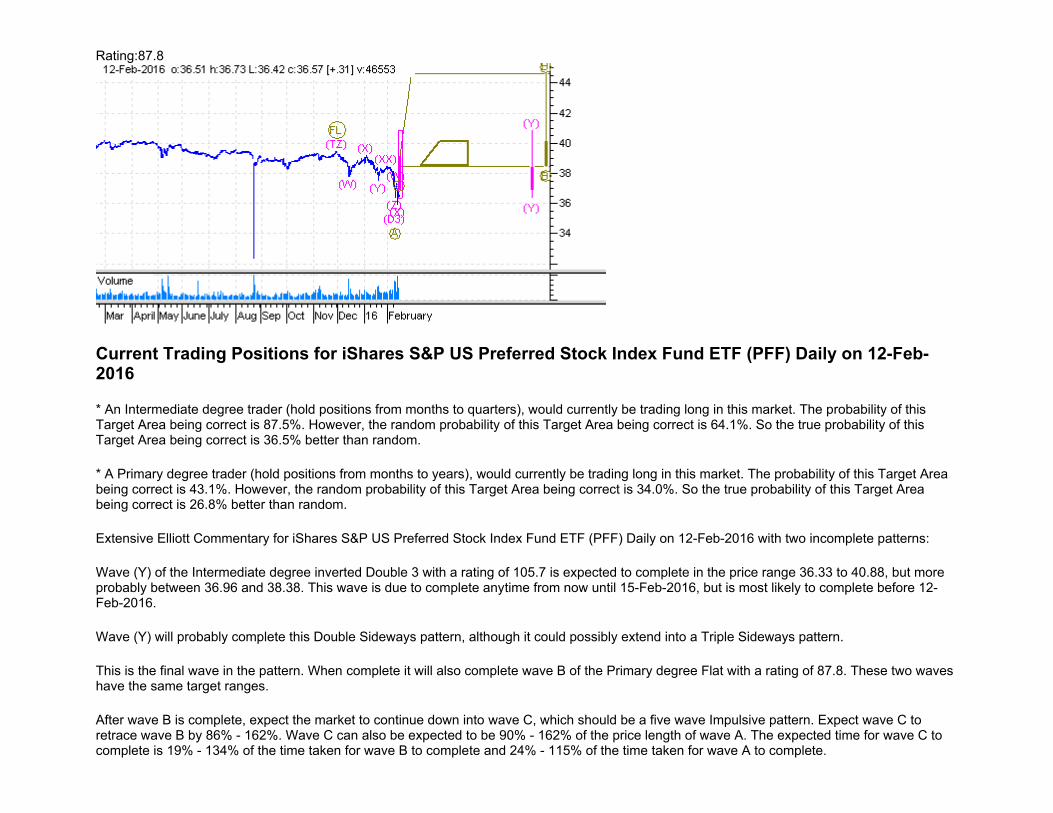
Current Trading Positions for iShares S&P US Preferred Stock Index Fund ETF (PFF) Daily on 12-Feb-2016...............516
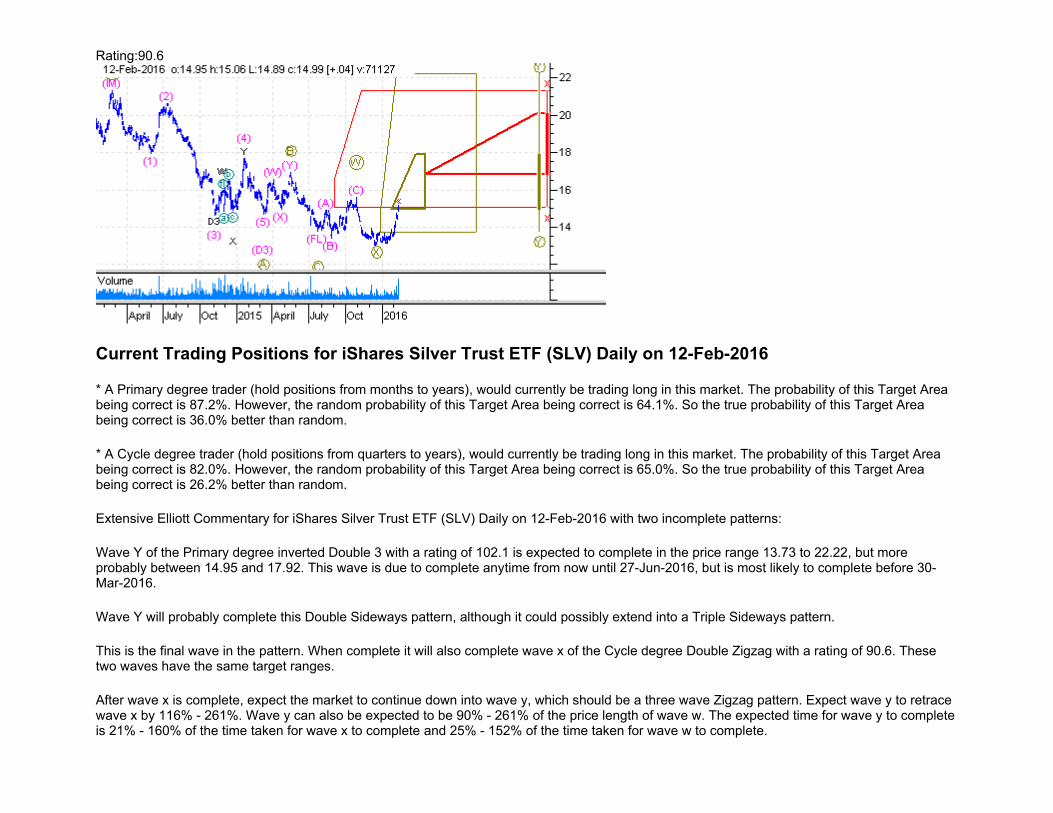
Current Trading Positions for iShares Silver Trust ETF (SLV) Daily on 12-Feb-2016......................................................518
Current Trading Positions for JP Morgan Alerian MLP Index ETN (AMJ) Daily on 12-Feb-2016...................................520
Current Trading Positions for KraneShares CSI China Internet ETF (KWEB) Daily on 12-Feb-2016..............................522
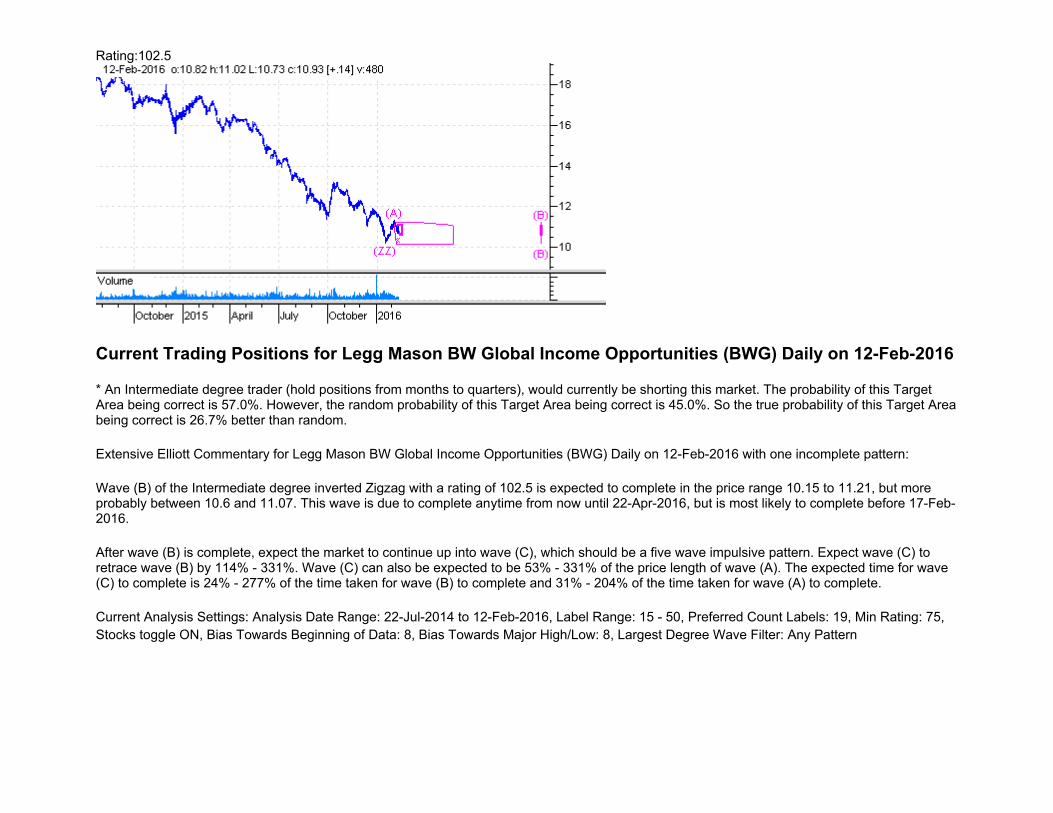
Current Trading Positions for Legg Mason BW Global Income Opportunities (BWG) Daily on 12-Feb-2016 ................523
Current Trading Positions for Market Vectors Agribusiness ETF (MOO) Daily on 12-Feb-2016.....................................524
Current Trading Positions for Market Vectors Barclays Capital AMT - Free Intermediate Continuous Municipal Index (ITM)
Daily on 12-Feb-2016 ..........................................................................................................................................................525
Current Trading Positions for Market Vectors Barclays Capital Municipal Custom High Yield Composite Index (HYD) Daily on
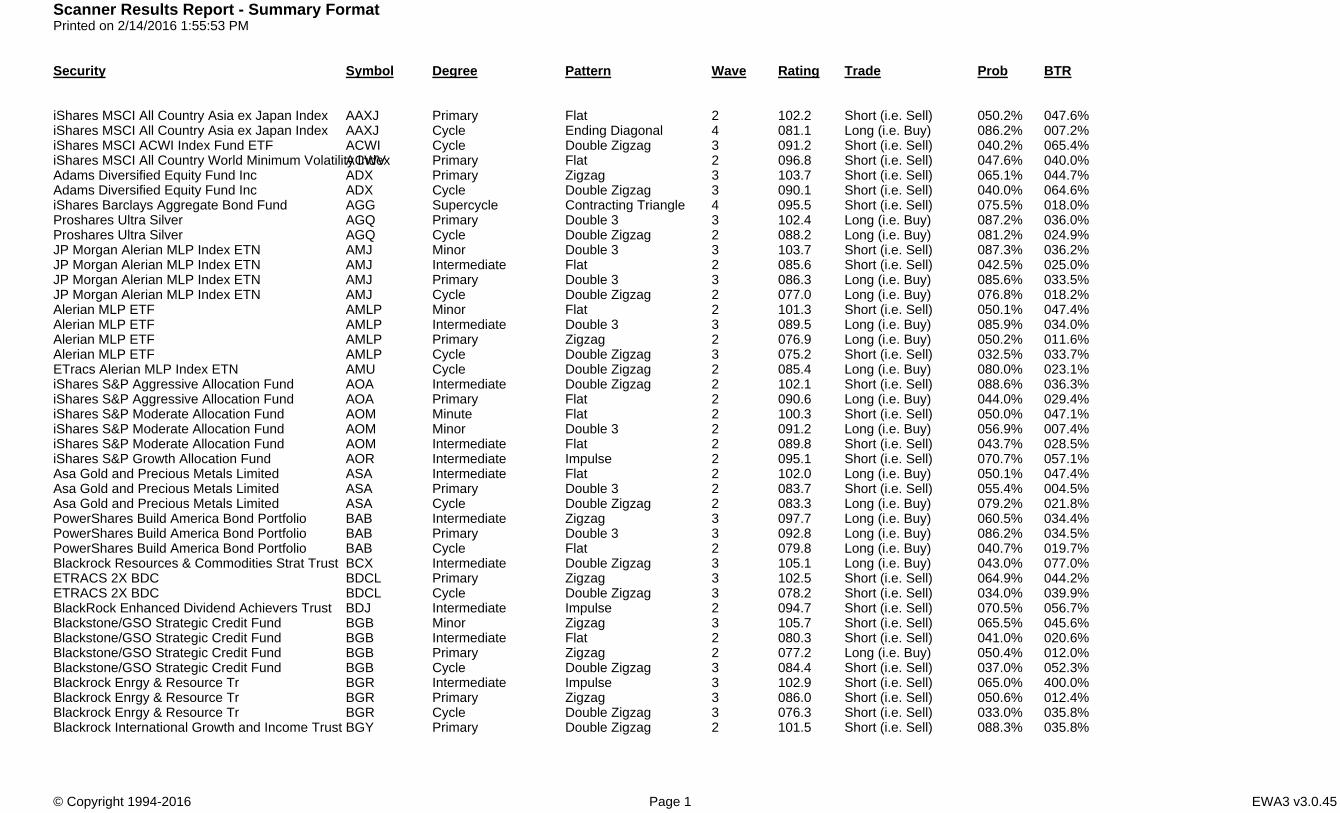
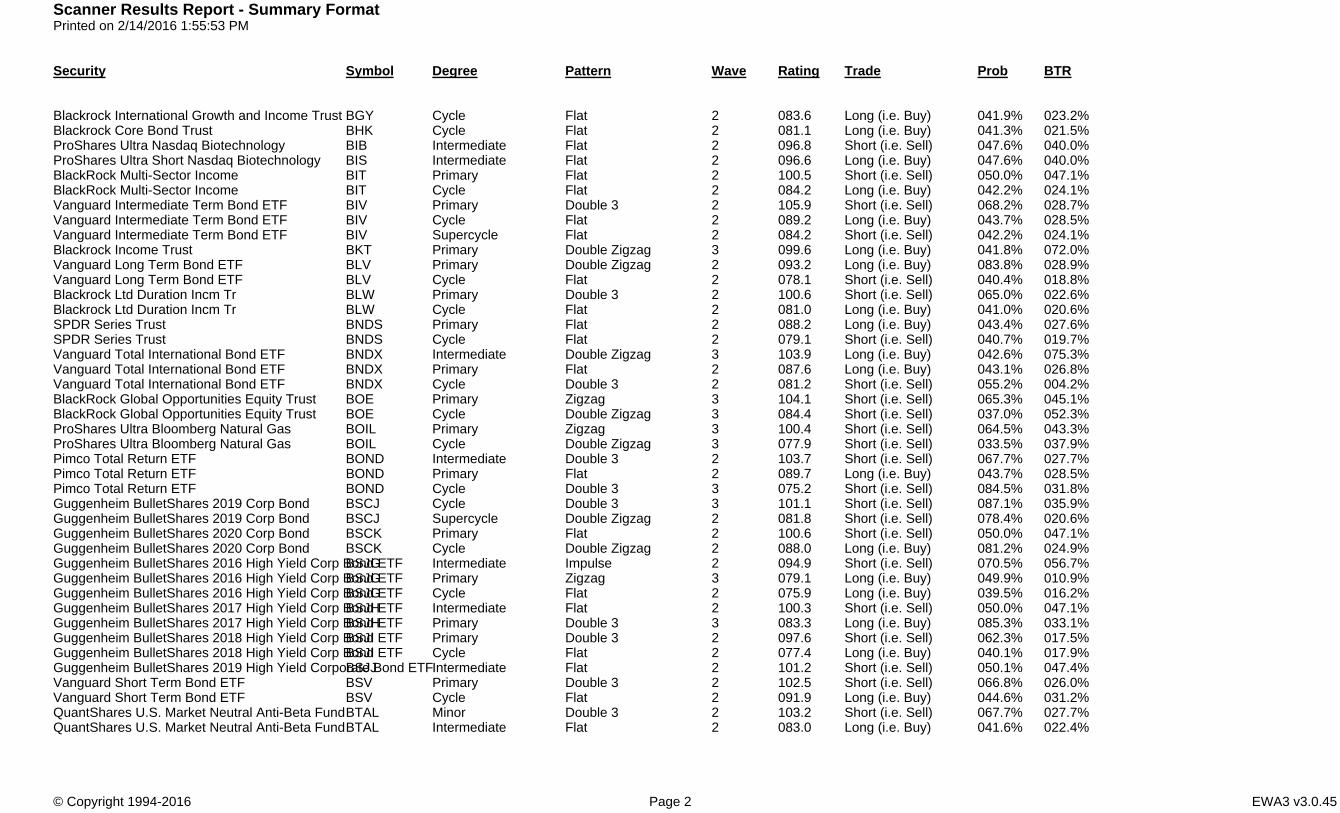
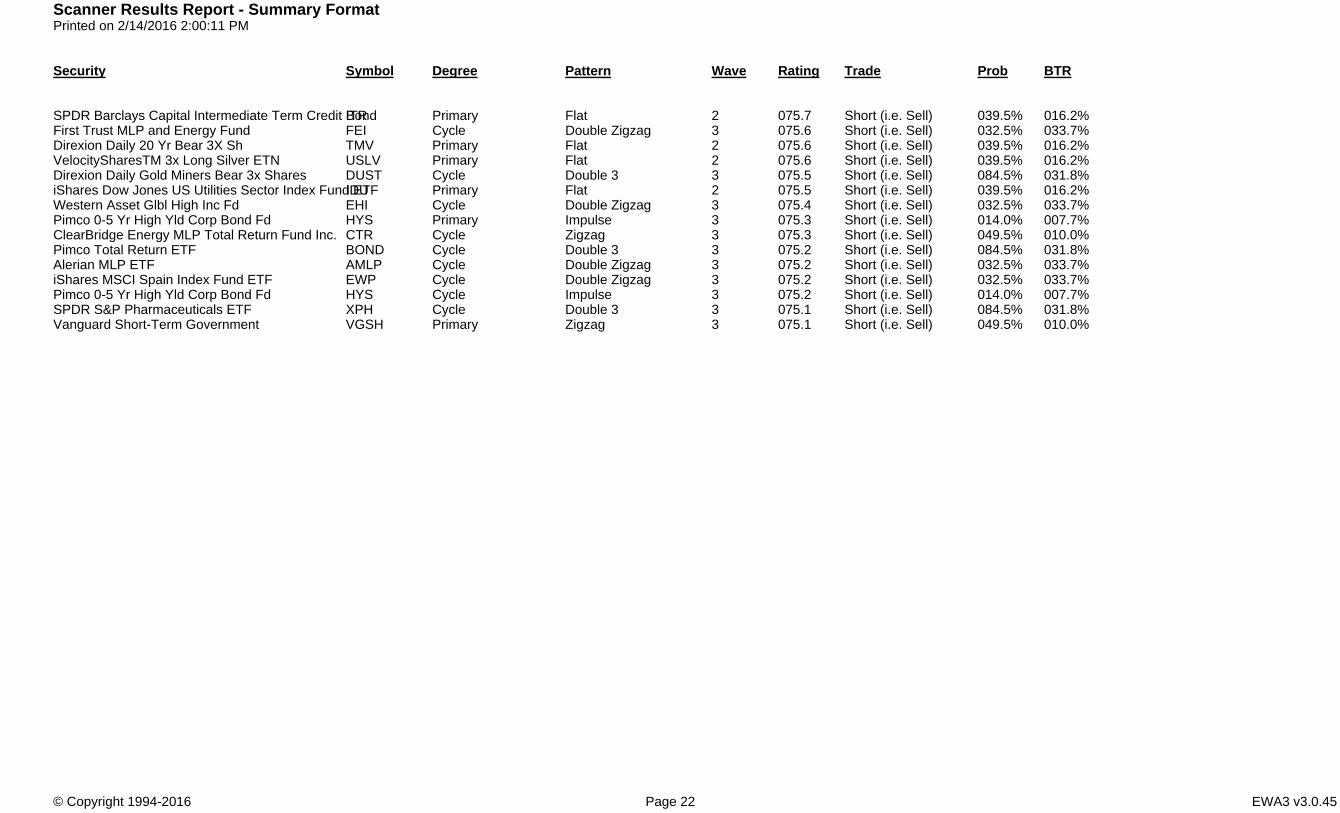
Scanner Results Report - Summary FormatPrinted on 2/14/2016 1:55:53 PM
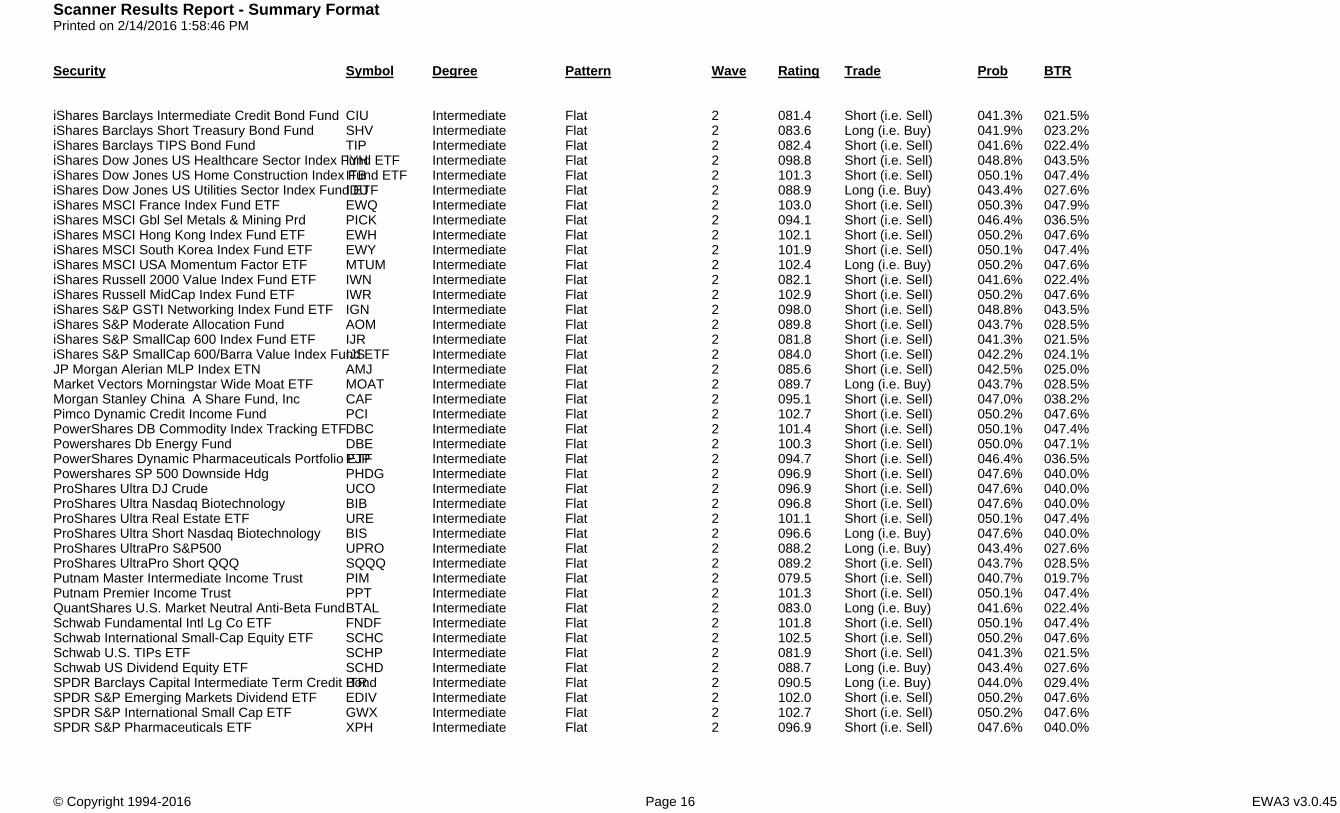
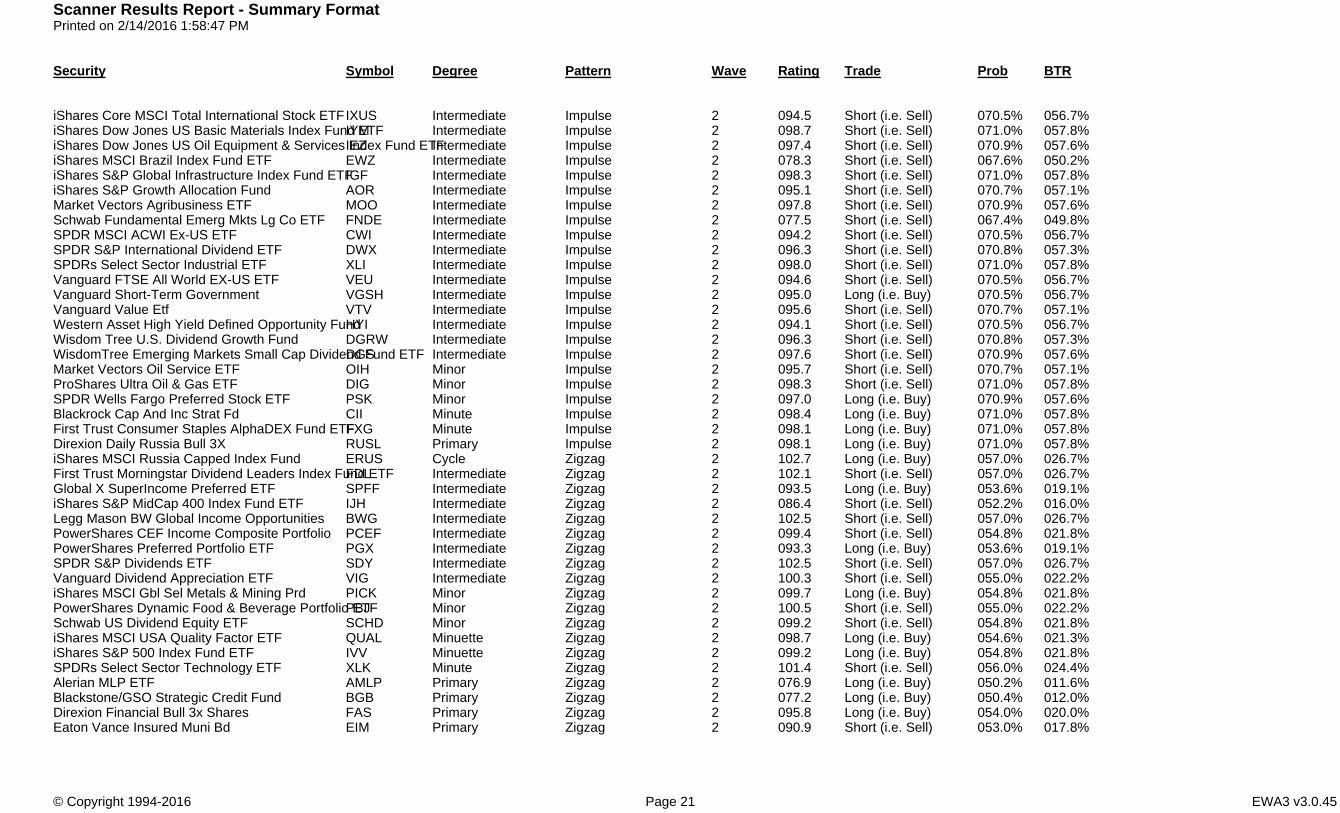
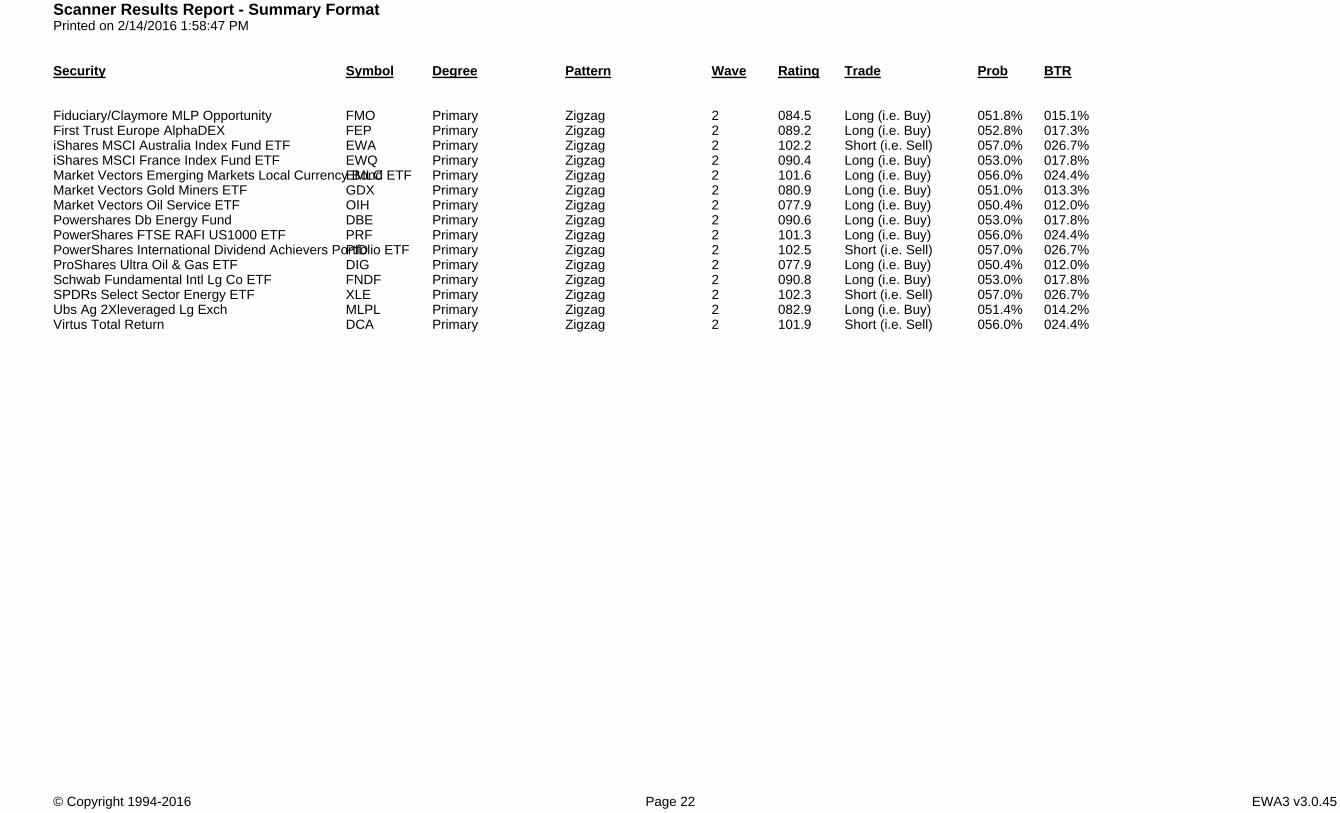
Security Symbol Degree Pattern Wave Rating Trade Prob BTR
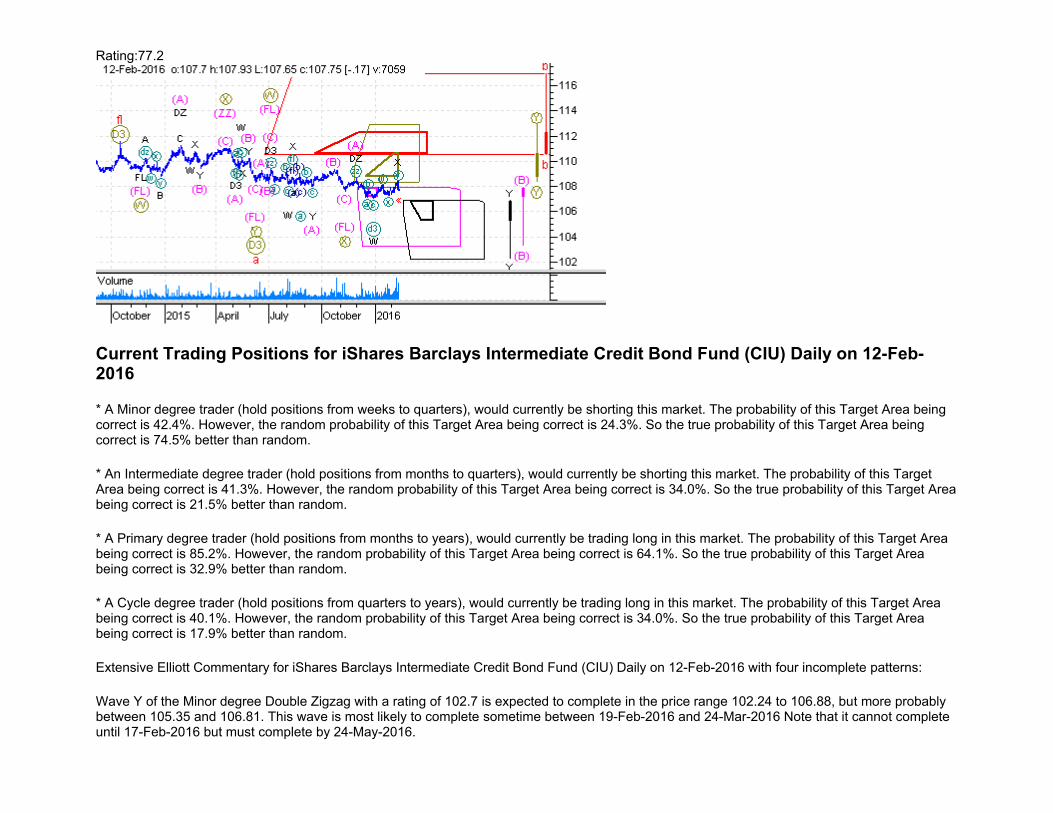
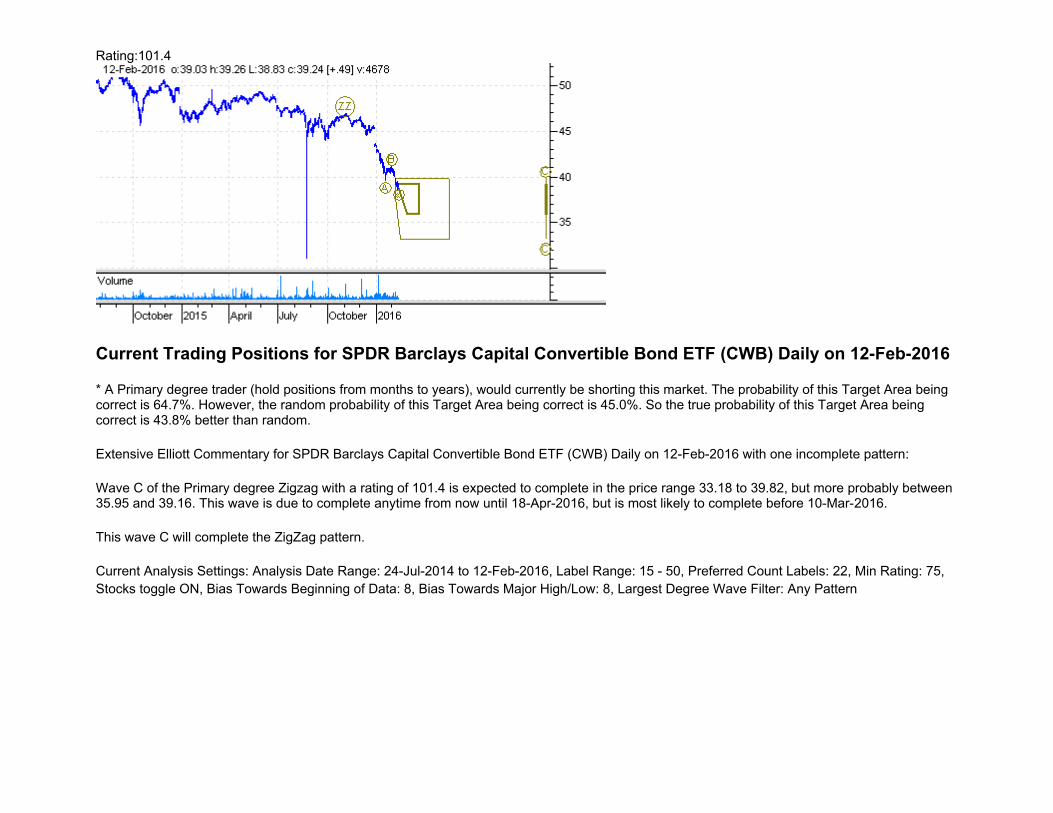
Blackrock Municipal Target Term Trust BTT Supercycle Double Zigzag 3 103.5 Long (i.e. Buy) 042.6% 075.3%BlackRock Credit Allocation Income Trust BTZ Primary Flat 2 099.8 Short (i.e. Sell) 049.4% 045.3%BlackRock Credit Allocation Income Trust BTZ Cycle Flat 2 081.8 Long (i.e. Buy) 041.3% 021.5%Legg Mason BW Global Income Opportunities BWG Intermediate Zigzag 2 102.5 Short (i.e. Sell) 057.0% 026.7%SPDR Lehman International Treasury Bond Fund ETFBWX Primary Double 3 3 102.6 Long (i.e. Buy) 087.2% 036.0%SPDR Lehman International Treasury Bond Fund ETFBWX Cycle Double Zigzag 2 093.0 Long (i.e. Buy) 083.8% 028.9%Morgan Stanley China A Share Fund, Inc CAF Intermediate Flat 2 095.1 Short (i.e. Sell) 047.0% 038.2%Clearbridge American Energy MLP Fund Inc. CBA Primary Double 3 3 103.7 Long (i.e. Buy) 087.3% 036.2%Clearbridge American Energy MLP Fund Inc. CBA Cycle Flat 2 080.2 Long (i.e. Buy) 041.0% 020.6%Clearbridge Energy MLP Fund CEM Intermediate Double Zigzag 2 100.7 Short (i.e. Sell) 088.0% 035.4%Clearbridge Energy MLP Fund CEM Primary Flat 2 083.1 Long (i.e. Buy) 041.9% 023.2%Center Coast MLP & Infrastructure Fund CEN Primary Double Zigzag 2 102.4 Short (i.e. Sell) 088.6% 036.3%Center Coast MLP & Infrastructure Fund CEN Cycle Flat 2 081.8 Long (i.e. Buy) 041.3% 021.5%Calamos Conv Opptys & Incm Fd CHI Primary Zigzag 3 104.1 Short (i.e. Sell) 065.3% 045.1%Calamos Conv Opptys & Incm Fd CHI Cycle Double Zigzag 3 077.2 Short (i.e. Sell) 033.5% 037.9%Calamos Global Dynamic Incm Fd CHW Primary Double Zigzag 2 102.6 Short (i.e. Sell) 088.6% 036.3%Calamos Global Dynamic Incm Fd CHW Cycle Flat 2 080.3 Long (i.e. Buy) 041.0% 020.6%Calamos Conv And High Incm Fd CHY Primary Double 3 2 102.5 Short (i.e. Sell) 066.8% 026.0%Calamos Conv And High Incm Fd CHY Cycle Flat 2 080.1 Long (i.e. Buy) 041.0% 020.6%Blackrock Cap And Inc Strat Fd CII Minute Impulse 2 098.4 Long (i.e. Buy) 071.0% 057.8%Blackrock Cap And Inc Strat Fd CII Minor Zigzag 3 077.2 Short (i.e. Sell) 049.7% 010.4%Blackrock Cap And Inc Strat Fd CII Intermediate Flat 2 078.5 Short (i.e. Sell) 040.4% 018.8%iShares Barclays Intermediate Credit Bond Fund CIU Minor Double Zigzag 3 102.7 Short (i.e. Sell) 042.4% 074.5%iShares Barclays Intermediate Credit Bond Fund CIU Intermediate Flat 2 081.4 Short (i.e. Sell) 041.3% 021.5%iShares Barclays Intermediate Credit Bond Fund CIU Primary Double 3 3 082.3 Long (i.e. Buy) 085.2% 032.9%iShares Barclays Intermediate Credit Bond Fund CIU Cycle Flat 2 077.2 Long (i.e. Buy) 040.1% 017.9%iShares 10+ Year Credit Bond Fund CLY Cycle Double Zigzag 3 101.3 Short (i.e. Sell) 042.2% 073.7%iShares Barclays 1-3 Year Credit Bond Fund CSJ Intermediate Impulse 2 094.4 Long (i.e. Buy) 070.5% 056.7%iShares Barclays 1-3 Year Credit Bond Fund CSJ Primary Zigzag 3 086.4 Short (i.e. Sell) 050.6% 012.4%iShares Barclays 1-3 Year Credit Bond Fund CSJ Cycle Double Zigzag 3 084.4 Short (i.e. Sell) 037.0% 052.3%ClearBridge Energy MLP Total Return Fund Inc. CTR Minor Double 3 3 102.3 Long (i.e. Buy) 087.2% 036.0%ClearBridge Energy MLP Total Return Fund Inc. CTR Intermediate Impulse 2 078.7 Long (i.e. Buy) 067.6% 050.2%ClearBridge Energy MLP Total Return Fund Inc. CTR Primary Impulse 3 081.3 Short (i.e. Sell) 014.0% 007.7%ClearBridge Energy MLP Total Return Fund Inc. CTR Cycle Zigzag 3 075.3 Short (i.e. Sell) 049.5% 010.0%C-Tracks Citi Volatility Index TR ETN CVOL Intermediate Impulse 3 095.7 Long (i.e. Buy) 044.0% 238.5%C-Tracks Citi Volatility Index TR ETN CVOL Cycle Double Zigzag 2 078.9 Long (i.e. Buy) 077.2% 018.8%Guggenheim Multi-Asset Income ETF CVY Primary Flat 2 102.2 Short (i.e. Sell) 050.2% 047.6%Guggenheim Multi-Asset Income ETF CVY Cycle Ending Diagonal 4 087.9 Long (i.e. Buy) 087.4% 008.7%SPDR Barclays Capital Convertible Bond ETF CWB Primary Zigzag 3 101.4 Short (i.e. Sell) 064.7% 043.8%SPDR MSCI ACWI Ex-US ETF CWI Intermediate Impulse 2 094.2 Short (i.e. Sell) 070.5% 056.7%PowerShares DB Agriculture Fund ETF DBA Cycle Zigzag 3 096.4 Short (i.e. Sell) 059.1% 031.3%PowerShares DB Base Metals Fund DBB Primary Flat 2 101.2 Short (i.e. Sell) 050.1% 047.4%
Scanner Results Report - Summary FormatPrinted on 2/14/2016 1:55:55 PM
Security Symbol Degree Pattern Wave Rating Trade Prob BTR
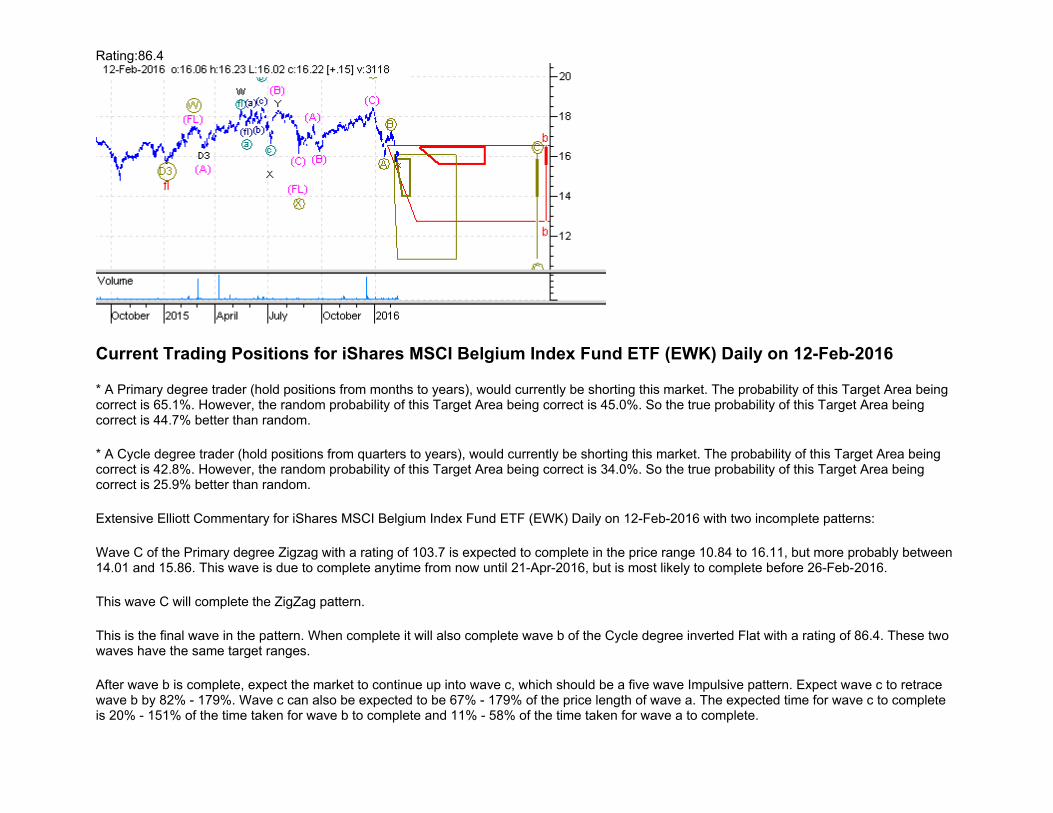
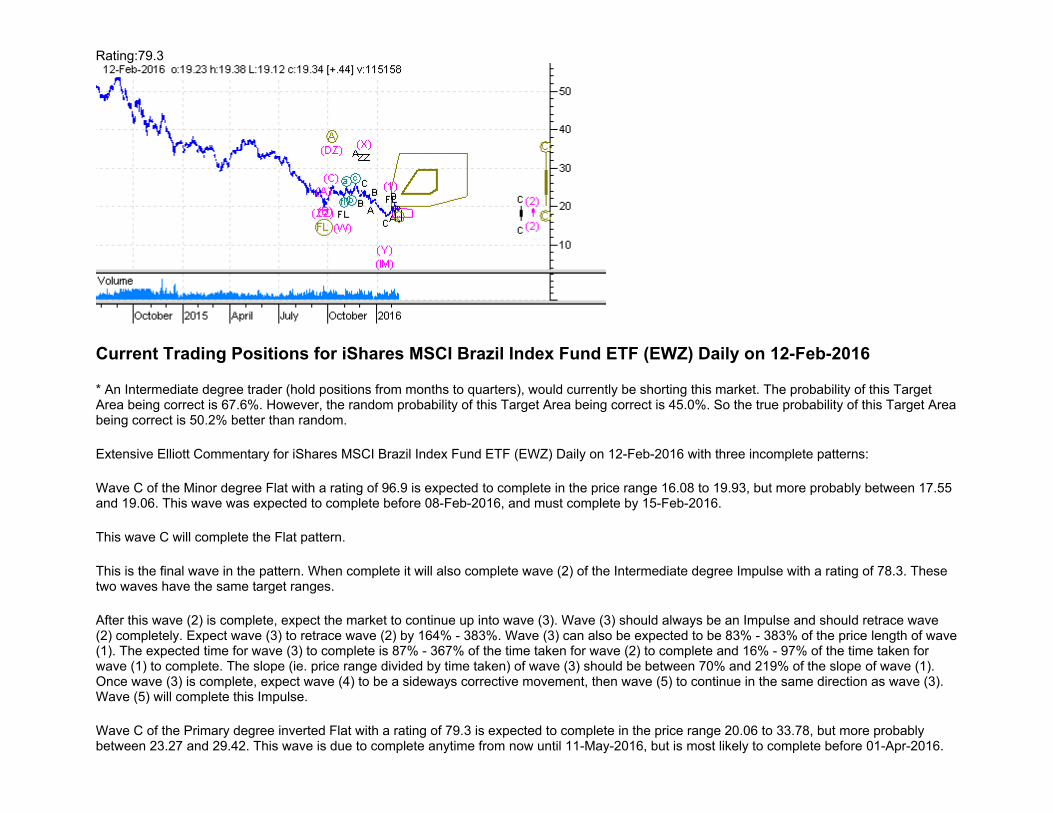
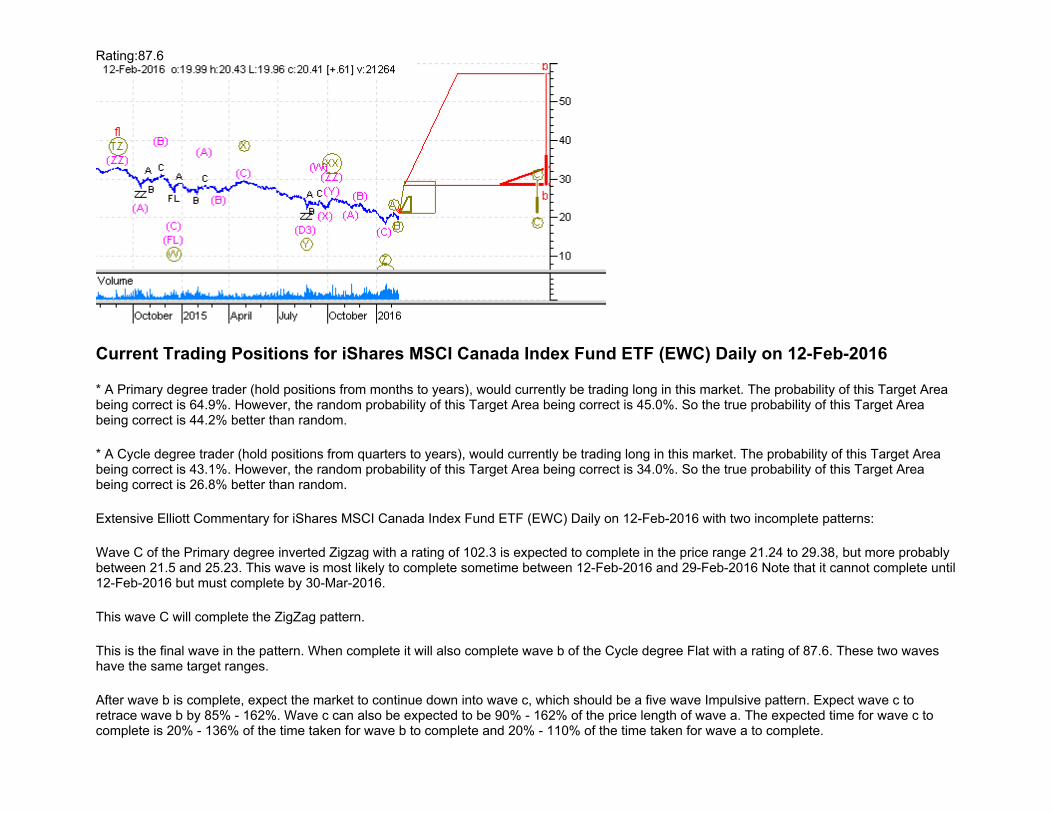
iShares MSCI Hong Kong Index Fund ETF EWH Intermediate Flat 2 102.1 Short (i.e. Sell) 050.2% 047.6%iShares MSCI Italy Index Fund ETF EWI Intermediate Double Zigzag 2 102.5 Short (i.e. Sell) 088.6% 036.3%iShares MSCI Japan Index Fund ETF EWJ Primary Flat 2 100.0 Short (i.e. Sell) 050.0% 047.1%iShares MSCI Japan Index Fund ETF EWJ Cycle Double 3 2 084.6 Long (i.e. Buy) 055.5% 004.7%iShares MSCI Belgium Index Fund ETF EWK Primary Zigzag 3 103.7 Short (i.e. Sell) 065.1% 044.7%iShares MSCI Belgium Index Fund ETF EWK Cycle Flat 2 086.4 Short (i.e. Sell) 042.8% 025.9%iShares MSCI Switzerland Index Fund ETF EWL Primary Zigzag 3 103.4 Short (i.e. Sell) 065.1% 044.7%iShares MSCI Switzerland Index Fund ETF EWL Cycle Double Zigzag 3 093.0 Short (i.e. Sell) 040.6% 067.1%iShares MSCI Malaysia Index Fund ETF EWM Cycle Double Zigzag 2 082.3 Long (i.e. Buy) 078.8% 021.2%iShares MSCI Netherlands Index Fund ETF EWN Primary Zigzag 3 102.5 Short (i.e. Sell) 064.9% 044.2%iShares MSCI Netherlands Index Fund ETF EWN Cycle Double Zigzag 3 087.5 Short (i.e. Sell) 038.5% 058.4%iShares MSCI Spain Index Fund ETF EWP Primary Zigzag 3 101.7 Short (i.e. Sell) 064.7% 043.8%iShares MSCI Spain Index Fund ETF EWP Cycle Double Zigzag 3 075.2 Short (i.e. Sell) 032.5% 033.7%iShares MSCI France Index Fund ETF EWQ Intermediate Flat 2 103.0 Short (i.e. Sell) 050.3% 047.9%iShares MSCI France Index Fund ETF EWQ Primary Zigzag 2 090.4 Long (i.e. Buy) 053.0% 017.8%iShares MSCI France Index Fund ETF EWQ Cycle Double Zigzag 3 096.2 Short (i.e. Sell) 041.2% 069.5%iShares MSCI Singapore Index Fund ETF EWS Intermediate Double Zigzag 3 102.1 Long (i.e. Buy) 042.4% 074.5%iShares MSCI Taiwan Index Fund ETF EWT Intermediate Double 3 2 102.5 Short (i.e. Sell) 066.8% 026.0%iShares MSCI United Kingdom Index Fund ETF EWU Primary Zigzag 3 103.5 Short (i.e. Sell) 065.1% 044.7%iShares MSCI United Kingdom Index Fund ETF EWU Cycle Double Zigzag 3 089.2 Short (i.e. Sell) 039.5% 062.6%iShares MSCI Mexico Index Fund ETF EWW Primary Double Zigzag 2 101.2 Short (i.e. Sell) 088.3% 035.8%iShares MSCI Mexico Index Fund ETF EWW Cycle Flat 2 081.9 Long (i.e. Buy) 041.3% 021.5%iShares MSCI South Korea Index Fund ETF EWY Intermediate Flat 2 101.9 Short (i.e. Sell) 050.1% 047.4%iShares MSCI Brazil Index Fund ETF EWZ Intermediate Impulse 2 078.3 Short (i.e. Sell) 067.6% 050.2%iShares MSCI South Africa Index Fund ETF EZA Cycle Flat 2 103.2 Long (i.e. Buy) 050.3% 047.9%iShares MSCI EMU Index Fund ETF EZU Primary Zigzag 3 077.5 Short (i.e. Sell) 049.7% 010.4%iShares MSCI EMU Index Fund ETF EZU Cycle Double Zigzag 3 079.5 Short (i.e. Sell) 034.5% 042.0%Direxion Financial Bull 3x Shares FAS Primary Zigzag 2 095.8 Long (i.e. Buy) 054.0% 020.0%Direxion Financial Bull 3x Shares FAS Cycle Double Zigzag 3 085.8 Short (i.e. Sell) 037.5% 054.3%Direxion Financial Bear 3x Shares FAZ Intermediate Double 3 2 101.6 Long (i.e. Buy) 065.9% 024.3%Direxion Financial Bear 3x Shares FAZ Primary Flat 2 087.3 Short (i.e. Sell) 043.1% 026.8%Direxion Financial Bear 3x Shares FAZ Cycle Double Zigzag 2 088.7 Long (i.e. Buy) 081.2% 024.9%First Trust Amex Biotechnology Index Fund ETF FBT Intermediate Double 3 3 108.8 Long (i.e. Buy) 087.8% 037.0%First Trust ISE Revere Natural Gas Index Fund ETFFCG Primary Zigzag 3 103.3 Short (i.e. Sell) 065.1% 044.7%First Trust ISE Revere Natural Gas Index Fund ETFFCG Cycle Double Zigzag 3 080.1 Short (i.e. Sell) 035.0% 044.0%First Trust Morningstar Dividend Leaders Index Fund ETFFDL Intermediate Zigzag 2 102.1 Short (i.e. Sell) 057.0% 026.7%First Trust Dow Jones Internet Index Fund ETF FDN Intermediate Double 3 3 108.4 Long (i.e. Buy) 087.8% 037.0%First Trust MLP and Energy Fund FEI Intermediate Impulse 3 096.8 Short (i.e. Sell) 046.0% 253.8%First Trust MLP and Energy Fund FEI Primary Zigzag 3 078.0 Short (i.e. Sell) 049.8% 010.7%First Trust MLP and Energy Fund FEI Cycle Double Zigzag 3 075.6 Short (i.e. Sell) 032.5% 033.7%First Trust Europe AlphaDEX FEP Intermediate Flat 2 102.4 Short (i.e. Sell) 050.2% 047.6%First Trust Europe AlphaDEX FEP Primary Zigzag 2 089.2 Long (i.e. Buy) 052.8% 017.3%
Scanner Results Report - Summary FormatPrinted on 2/14/2016 1:55:55 PM
Security Symbol Degree Pattern Wave Rating Trade Prob BTR
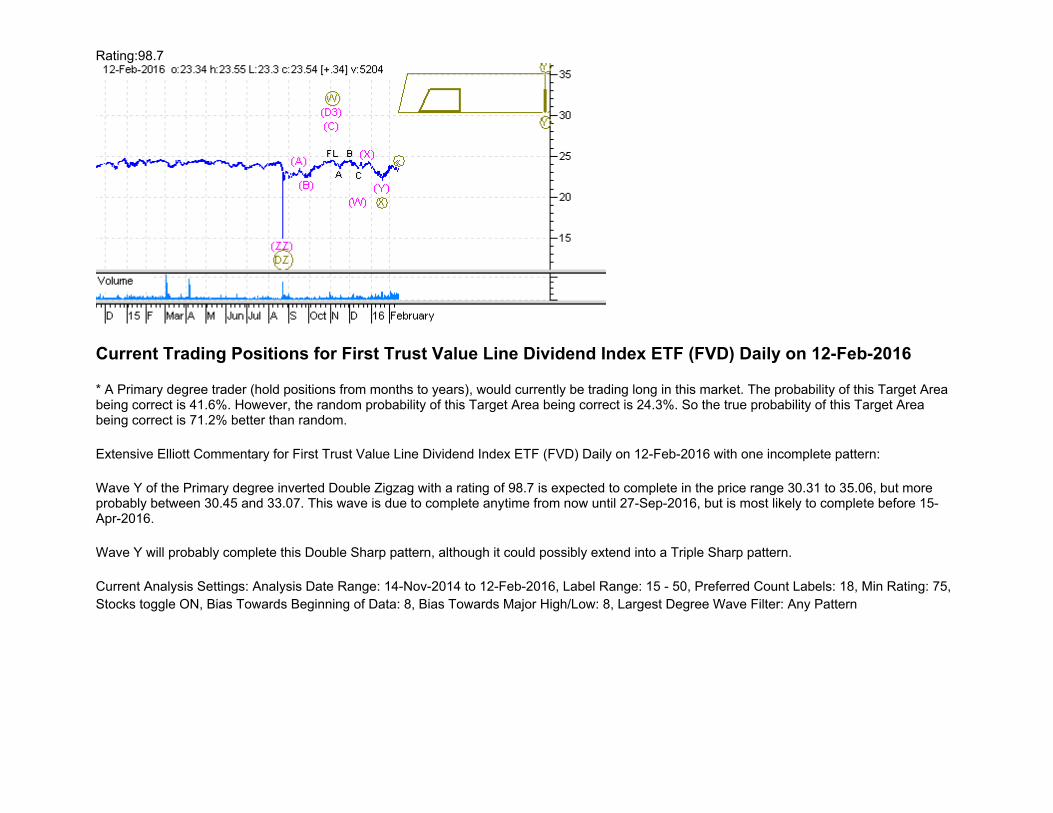
First Trust Europe AlphaDEX FEP Cycle Double Zigzag 3 087.1 Short (i.e. Sell) 038.5% 058.4%First Trust Large Cap Core AlphaDEX Fund ETF FEX Intermediate Double Zigzag 3 101.5 Long (i.e. Buy) 042.2% 073.7%First Trust Large Cap Core AlphaDEX Fund ETF FEX Primary Flat 2 089.0 Long (i.e. Buy) 043.7% 028.5%SPDR EURO STOXX 50 ETF FEZ Primary Zigzag 3 099.6 Short (i.e. Sell) 063.2% 040.4%SPDR EURO STOXX 50 ETF FEZ Cycle Double Zigzag 3 081.8 Short (i.e. Sell) 035.5% 046.1%F & C Claymore Pref Sec Inc Fd FFC Minor Flat 2 098.6 Short (i.e. Sell) 048.8% 043.5%F & C Claymore Pref Sec Inc Fd FFC Intermediate Flat 2 084.3 Long (i.e. Buy) 042.2% 024.1%F & C Claymore Pref Sec Inc Fd FFC Primary Double Zigzag 2 084.7 Short (i.e. Sell) 079.6% 022.5%First Trust Dow Jones Global Select Dividend Index Fund ETFFGD Intermediate Double Zigzag 3 101.8 Long (i.e. Buy) 042.2% 073.7%iShares Floating Rate Note Fund FLOT Primary Ending Diagonal 4 093.5 Long (i.e. Buy) 088.6% 010.2%iShares Floating Rate Note Fund FLOT Cycle Zigzag 3 082.4 Short (i.e. Sell) 050.2% 011.6%iShares MSCI Frontier 100 Index FM Primary Double 3 2 101.6 Short (i.e. Sell) 065.9% 024.3%iShares MSCI Frontier 100 Index FM Cycle Double Zigzag 2 080.6 Long (i.e. Buy) 078.0% 020.0%Fiduciary/Claymore MLP Opportunity FMO Primary Zigzag 2 084.5 Long (i.e. Buy) 051.8% 015.1%Fiduciary/Claymore MLP Opportunity FMO Cycle Double Zigzag 3 077.5 Short (i.e. Sell) 033.5% 037.9%Schwab Fundamental US Small Company ETF FNDA Intermediate Double Zigzag 2 087.2 Short (i.e. Sell) 080.8% 024.3%Schwab Fundamental US Small Company ETF FNDA Primary Flat 2 081.4 Long (i.e. Buy) 041.3% 021.5%Schwab Fundamental Emerg Mkts Lg Co ETF FNDE Intermediate Impulse 2 077.5 Short (i.e. Sell) 067.4% 049.8%Schwab Fundamental Intl Lg Co ETF FNDF Intermediate Flat 2 101.8 Short (i.e. Sell) 050.1% 047.4%Schwab Fundamental Intl Lg Co ETF FNDF Primary Zigzag 2 090.8 Long (i.e. Buy) 053.0% 017.8%Schwab Fundamental Intl Lg Co ETF FNDF Cycle Double Zigzag 3 081.5 Short (i.e. Sell) 035.5% 046.1%Schwab Fundamental US Large Company ETF FNDX Intermediate Double Zigzag 2 101.8 Short (i.e. Sell) 088.3% 035.8%Schwab Fundamental US Large Company ETF FNDX Primary Flat 2 089.4 Long (i.e. Buy) 043.7% 028.5%First Trust Mid Cap Core AlphaDex Fund ETF FNX Intermediate Double Zigzag 2 086.8 Short (i.e. Sell) 080.4% 023.7%First Trust Mid Cap Core AlphaDex Fund ETF FNX Primary Flat 2 078.0 Long (i.e. Buy) 040.4% 018.8%First Trust Intermediate Duration Preferred Income FundFPF Cycle Double Zigzag 3 099.6 Short (i.e. Sell) 041.8% 072.0%First Trust New Opportunities MLP & Energy FundFPL Intermediate Impulse 3 094.0 Short (i.e. Sell) 038.0% 192.3%First Trust New Opportunities MLP & Energy FundFPL Primary Zigzag 3 080.0 Short (i.e. Sell) 049.9% 010.9%First Trust New Opportunities MLP & Energy FundFPL Cycle Double Zigzag 3 077.0 Short (i.e. Sell) 033.5% 037.9%First Trust IPOX-100 Index Fund ETF FPX Intermediate Double Zigzag 2 101.3 Short (i.e. Sell) 088.3% 035.8%First Trust IPOX-100 Index Fund ETF FPX Primary Flat 2 081.0 Long (i.e. Buy) 041.0% 020.6%BlackRock Floating Rate Income Strategies Fund IncFRA Intermediate Zigzag 3 102.4 Short (i.e. Sell) 064.9% 044.2%BlackRock Floating Rate Income Strategies Fund IncFRA Primary Flat 2 085.8 Short (i.e. Sell) 042.5% 025.0%First Trust High Income Long/Short Fund FSD Intermediate Contracting Triangle 4 098.5 Short (i.e. Sell) 075.8% 018.4%First Trust High Income Long/Short Fund FSD Primary Double 3 3 085.6 Long (i.e. Buy) 085.5% 033.4%First Trust High Income Long/Short Fund FSD Cycle Flat 2 076.2 Long (i.e. Buy) 039.8% 017.1%First Trust Large Cap Value Opportunities AlphaDex Fund ETFFTA Intermediate Double Zigzag 3 102.9 Long (i.e. Buy) 042.4% 074.5%First Trust Large Cap Value Opportunities AlphaDex Fund ETFFTA Primary Flat 2 088.2 Long (i.e. Buy) 043.4% 027.6%First Trust Large Cap Growth Opportunities AlphaDex Fund ETFFTC Intermediate Zigzag 3 100.6 Long (i.e. Buy) 064.5% 043.3%First Trust Large Cap Growth Opportunities AlphaDex Fund ETFFTC Primary Flat 2 080.2 Long (i.e. Buy) 041.0% 020.6%First Trust Value Line Dividend Index ETF FVD Primary Double Zigzag 3 098.7 Long (i.e. Buy) 041.6% 071.2%Guggenheim CurrencyShares Euro Trust FXE Cycle Double Zigzag 2 092.1 Long (i.e. Buy) 083.2% 028.0%
Scanner Results Report - Summary FormatPrinted on 2/14/2016 1:55:55 PM
Security Symbol Degree Pattern Wave Rating Trade Prob BTR
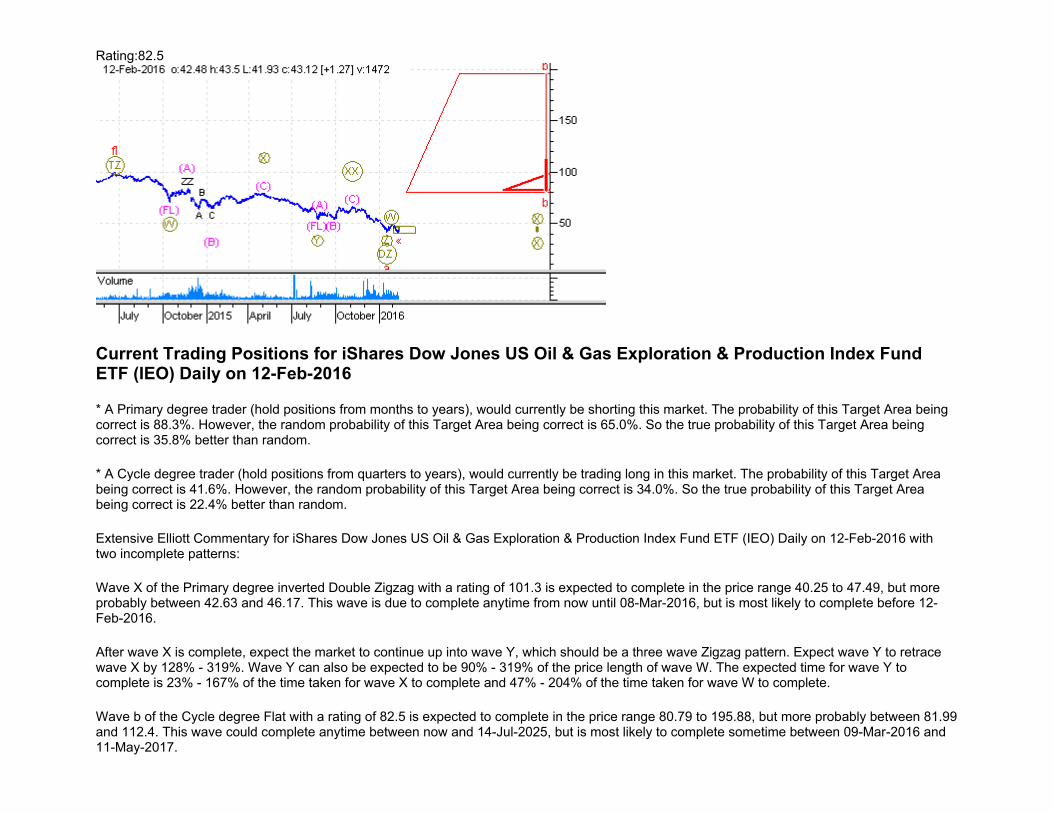
Western Asset Hi Inc Opp Fd HIO Primary Flat 2 101.4 Short (i.e. Sell) 050.1% 047.4%Western Asset Hi Inc Opp Fd HIO Cycle Ending Diagonal 4 088.5 Long (i.e. Buy) 087.6% 009.0%Hercules Technology Growth Capital Inc HTGC Primary Zigzag 3 106.3 Short (i.e. Sell) 065.7% 046.0%Hercules Technology Growth Capital Inc HTGC Cycle Double Zigzag 3 081.9 Short (i.e. Sell) 035.5% 046.1%Market Vectors Barclays Capital Municipal Custom High Yield Composite IndexHYD Primary Double Zigzag 3 100.8 Long (i.e. Buy) 042.0% 072.8%Market Vectors Barclays Capital Municipal Custom High Yield Composite IndexHYD Cycle Flat 2 082.7 Long (i.e. Buy) 041.6% 022.4%Market Vectors Emerging Mkt Hi Yield Bond ETF HYEM Primary Zigzag 3 102.3 Short (i.e. Sell) 064.9% 044.2%Market Vectors Emerging Mkt Hi Yield Bond ETF HYEM Cycle Double Zigzag 3 092.1 Short (i.e. Sell) 040.4% 066.3%iShares IBoxx $ High Yield Corporate Bond ETF HYG Primary Double 3 2 101.3 Short (i.e. Sell) 065.9% 024.3%iShares IBoxx $ High Yield Corporate Bond ETF HYG Cycle Flat 2 079.8 Long (i.e. Buy) 040.7% 019.7%Western Asset High Yield Defined Opportunity FundHYI Intermediate Impulse 2 094.1 Short (i.e. Sell) 070.5% 056.7%Western Asset High Yield Defined Opportunity FundHYI Cycle Double 3 2 076.5 Long (i.e. Buy) 054.7% 003.2%SPDR Nuveen S&P High Yield Municipal Bond ETFHYMB Intermediate Double 3 3 104.7 Short (i.e. Sell) 087.4% 036.3%SPDR Nuveen S&P High Yield Municipal Bond ETFHYMB Primary Flat 2 091.1 Short (i.e. Sell) 044.6% 031.2%SPDR Nuveen S&P High Yield Municipal Bond ETFHYMB Cycle Flat 2 077.3 Long (i.e. Buy) 040.1% 017.9%Pimco 0-5 Yr High Yld Corp Bond Fd HYS Intermediate Impulse 3 095.0 Short (i.e. Sell) 038.0% 192.3%Pimco 0-5 Yr High Yld Corp Bond Fd HYS Primary Impulse 3 075.3 Short (i.e. Sell) 014.0% 007.7%Pimco 0-5 Yr High Yld Corp Bond Fd HYS Cycle Impulse 3 075.2 Short (i.e. Sell) 014.0% 007.7%iShares Dow Jones US Regional Banks Index Fund ETFIAT Primary Ending Diagonal 4 095.1 Long (i.e. Buy) 089.0% 010.7%iShares COMEX Gold Trust ETF IAU Cycle Flat 2 099.9 Long (i.e. Buy) 049.4% 045.3%iShares Nasdaq Biotechnology Index Fund ETF IBB Primary Flat 2 077.6 Short (i.e. Sell) 040.1% 017.9%iShares Nasdaq Biotechnology Index Fund ETF IBB Cycle Double 3 3 086.1 Long (i.e. Buy) 085.6% 033.5%iShares Cohen & Steers Realty Majors Index Fund ETFICF Primary Zigzag 3 104.3 Short (i.e. Sell) 065.3% 045.1%PowerShares S&P Intl Dev Low Vol Port IDLV Intermediate Double Zigzag 2 102.1 Short (i.e. Sell) 088.6% 036.3%PowerShares S&P Intl Dev Low Vol Port IDLV Primary Flat 2 093.6 Long (i.e. Buy) 045.8% 034.7%iShares Dow Jones US Utilities Sector Index Fund ETFIDU Minor Double 3 3 106.1 Long (i.e. Buy) 087.6% 036.7%iShares Dow Jones US Utilities Sector Index Fund ETFIDU Intermediate Flat 2 088.9 Long (i.e. Buy) 043.4% 027.6%iShares Dow Jones US Utilities Sector Index Fund ETFIDU Primary Flat 2 075.5 Short (i.e. Sell) 039.5% 016.2%iShares Dow Jones US Utilities Sector Index Fund ETFIDU Cycle Double Zigzag 2 081.8 Long (i.e. Buy) 078.4% 020.6%iShares Dow Jones EPAC Select Dividend Index Fund ETFIDV Primary Flat 2 102.0 Short (i.e. Sell) 050.2% 047.6%iShares Dow Jones EPAC Select Dividend Index Fund ETFIDV Cycle Ending Diagonal 4 086.5 Long (i.e. Buy) 087.2% 008.5%iShares Barclays 7-10 Year Treasury Bond Fund IEF Primary Flat 2 100.4 Long (i.e. Buy) 050.0% 047.1%iShares Barclays 7-10 Year Treasury Bond Fund IEF Cycle Flat 2 095.6 Short (i.e. Sell) 047.0% 038.2%iShares Core MSCI EAFE ETF IEFA Primary Zigzag 3 103.4 Short (i.e. Sell) 065.1% 044.7%iShares Core MSCI EAFE ETF IEFA Cycle Double Zigzag 3 087.4 Short (i.e. Sell) 038.5% 058.4%iShares Barclays 3-7 Year Treasury Bond Fund IEI Cycle Double Zigzag 3 099.7 Long (i.e. Buy) 041.8% 072.0%iShares Dow Jones US Oil & Gas Exploration & Production Index Fund ETFIEO Primary Double Zigzag 2 101.3 Short (i.e. Sell) 088.3% 035.8%iShares Dow Jones US Oil & Gas Exploration & Production Index Fund ETFIEO Cycle Flat 2 082.5 Long (i.e. Buy) 041.6% 022.4%iShares S&P Europe 350 Index Fund ETF IEV Cycle Flat 2 082.6 Long (i.e. Buy) 041.6% 022.4%iShares Dow Jones US Oil Equipment & Services Index Fund ETFIEZ Intermediate Impulse 2 097.4 Short (i.e. Sell) 070.9% 057.6%iShares Dow Jones US Oil Equipment & Services Index Fund ETFIEZ Cycle Double Zigzag 2 079.0 Long (i.e. Buy) 077.2% 018.8%iShares FTSE EPRA/NAREIT Global Real Estate EX-US Index Fund ETFIFGL Primary Zigzag 3 101.2 Short (i.e. Sell) 064.7% 043.8%
Scanner Results Report - Summary FormatPrinted on 2/14/2016 1:55:56 PM
Security Symbol Degree Pattern Wave Rating Trade Prob BTR
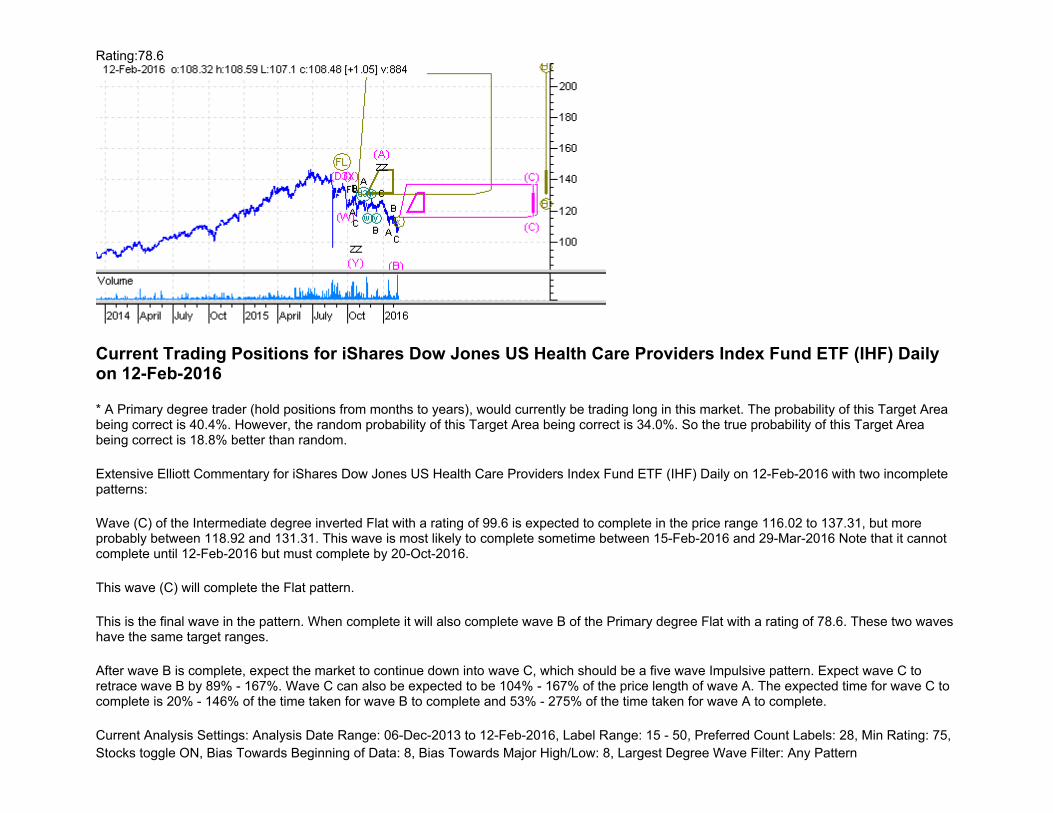
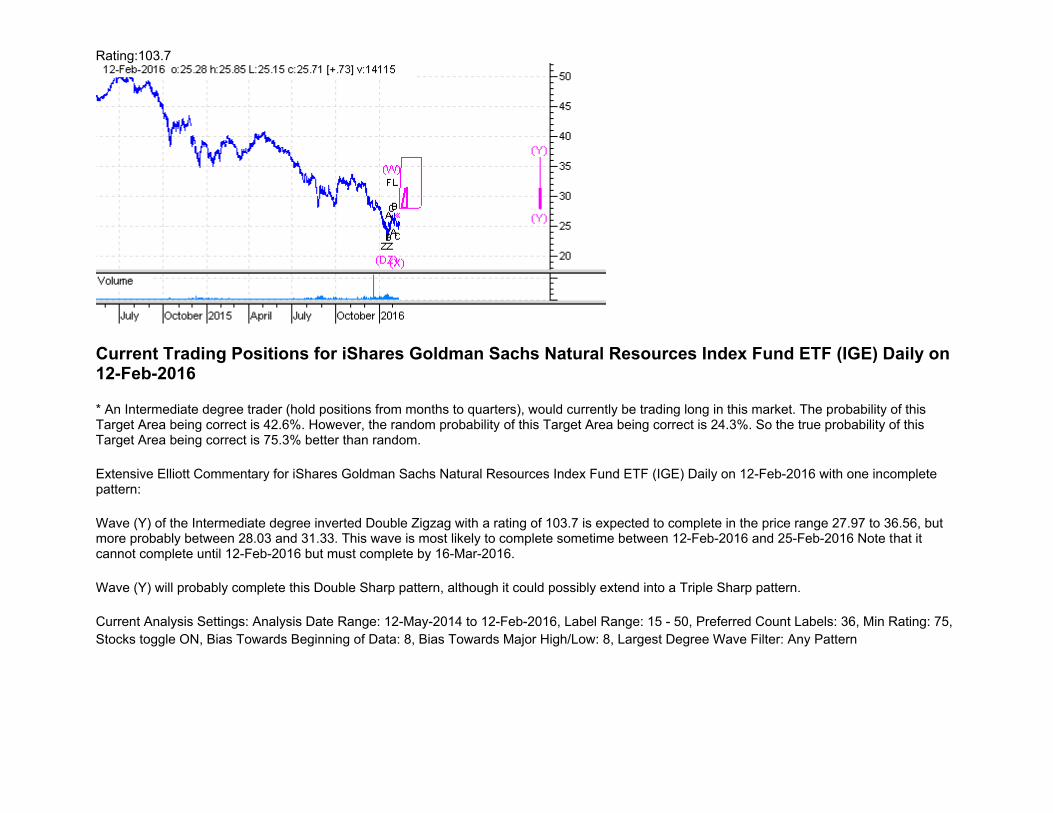
iShares FTSE EPRA/NAREIT Global Real Estate EX-US Index Fund ETFIFGL Cycle Double Zigzag 3 086.9 Short (i.e. Sell) 038.0% 056.4%iShares Goldman Sachs Natural Resources Index Fund ETFIGE Intermediate Double Zigzag 3 103.7 Long (i.e. Buy) 042.6% 075.3%iShares S&P Global Infrastructure Index Fund ETFIGF Intermediate Impulse 2 098.3 Short (i.e. Sell) 071.0% 057.8%iShares S&P Global Infrastructure Index Fund ETFIGF Cycle Flat 2 076.5 Long (i.e. Buy) 039.8% 017.1%iShares S&P GSTI Networking Index Fund ETF IGN Intermediate Flat 2 098.0 Short (i.e. Sell) 048.8% 043.5%iShares S&P GSTI Networking Index Fund ETF IGN Primary Double 3 2 084.0 Long (i.e. Buy) 055.5% 004.7%iShares S&P GSTI Networking Index Fund ETF IGN Cycle Flat 2 081.9 Short (i.e. Sell) 041.3% 021.5%iShares S&P GSTI Software Index Fund ETF IGV Intermediate Zigzag 3 104.5 Short (i.e. Sell) 065.3% 045.1%iShares S&P GSTI Software Index Fund ETF IGV Primary Double Zigzag 3 094.2 Short (i.e. Sell) 040.8% 067.9%iShares Dow Jones US Health Care Providers Index Fund ETFIHF Primary Flat 2 078.6 Long (i.e. Buy) 040.4% 018.8%iShares S&P MidCap 400 Index Fund ETF IJH Intermediate Zigzag 2 086.4 Short (i.e. Sell) 052.2% 016.0%iShares S&P MidCap 400 Index Fund ETF IJH Primary Double Zigzag 3 075.6 Long (i.e. Buy) 032.5% 033.7%iShares S&P MidCap 400/Barra Value Index Fund ETFIJJ Intermediate Double Zigzag 2 102.0 Short (i.e. Sell) 088.6% 036.3%iShares S&P MidCap 400/Barra Value Index Fund ETFIJJ Primary Flat 2 087.5 Long (i.e. Buy) 043.1% 026.8%iShares S&P MidCap 400/Barra Growth Index Fund ETFIJK Primary Flat 2 098.3 Long (i.e. Buy) 048.8% 043.5%iShares S&P SmallCap 600 Index Fund ETF IJR Minor Double 3 2 084.4 Long (i.e. Buy) 055.5% 004.7%iShares S&P SmallCap 600 Index Fund ETF IJR Intermediate Flat 2 081.8 Short (i.e. Sell) 041.3% 021.5%iShares S&P SmallCap 600 Index Fund ETF IJR Primary Double Zigzag 2 085.6 Long (i.e. Buy) 080.0% 023.1%iShares S&P SmallCap 600/Barra Value Index Fund ETFIJS Minute Flat 2 097.1 Short (i.e. Sell) 048.2% 041.8%iShares S&P SmallCap 600/Barra Value Index Fund ETFIJS Minor Double 3 2 086.1 Long (i.e. Buy) 055.6% 004.9%iShares S&P SmallCap 600/Barra Value Index Fund ETFIJS Intermediate Flat 2 084.0 Short (i.e. Sell) 042.2% 024.1%iShares S&P SmallCap 600/Barra Value Index Fund ETFIJS Primary Double Zigzag 2 085.8 Long (i.e. Buy) 080.0% 023.1%iShares S&P Latin America 40 Index Fund ETF ILF Cycle Flat 2 100.1 Long (i.e. Buy) 050.0% 047.1%iShares MSCI India Index INDA Cycle Flat 2 097.0 Short (i.e. Sell) 048.2% 041.8%Direxion Daily India Bull 3X S INDL Primary Zigzag 3 082.5 Short (i.e. Sell) 050.2% 011.6%Direxion Daily India Bull 3X S INDL Cycle Double Zigzag 3 083.4 Short (i.e. Sell) 036.5% 050.2%iShares S&P India Nifty 50 Index Fund INDY Intermediate Double Zigzag 3 097.2 Short (i.e. Sell) 041.4% 070.4%iShares S&P India Nifty 50 Index Fund INDY Primary Flat 2 077.7 Short (i.e. Sell) 040.1% 017.9%iShares S&P India Nifty 50 Index Fund INDY Cycle Flat 2 081.3 Long (i.e. Buy) 041.3% 021.5%Brookfield Global Listed Infrastructure Fund INF Cycle Impulse 3 082.5 Short (i.e. Sell) 014.0% 007.7%FlexShares International Quality Dividend Index FundIQDF Primary Double 3 2 101.6 Short (i.e. Sell) 065.9% 024.3%FlexShares International Quality Dividend Index FundIQDF Cycle Double Zigzag 2 085.4 Long (i.e. Buy) 080.0% 023.1%Prudential Short Duration High Yield Fund ISD Primary Flat 2 099.0 Short (i.e. Sell) 049.4% 045.3%iShares Dow Jones US Home Construction Index Fund ETFITB Intermediate Flat 2 101.3 Short (i.e. Sell) 050.1% 047.4%iShares Dow Jones US Home Construction Index Fund ETFITB Primary Double 3 2 085.1 Long (i.e. Buy) 055.6% 004.9%SPDR Lehman Intermediate Term Treasury ETF ITE Primary Flat 2 083.4 Long (i.e. Buy) 041.9% 023.2%SPDR Lehman Intermediate Term Treasury ETF ITE Cycle Flat 2 087.1 Short (i.e. Sell) 043.1% 026.8%Market Vectors Barclays Capital AMT - Free Intermediate Continuous Municipal IndexITM Intermediate Zigzag 3 092.2 Long (i.e. Buy) 053.7% 019.3%Market Vectors Barclays Capital AMT - Free Intermediate Continuous Municipal IndexITM Primary Flat 2 086.7 Long (i.e. Buy) 042.8% 025.9%Market Vectors Barclays Capital AMT - Free Intermediate Continuous Municipal IndexITM Cycle Flat 2 079.0 Short (i.e. Sell) 040.4% 018.8%iShares Core S&P Total US Stock Market ETF ITOT Intermediate Double 3 3 088.1 Long (i.e. Buy) 085.8% 033.9%iShares Core S&P Total US Stock Market ETF ITOT Primary Flat 2 077.6 Long (i.e. Buy) 040.1% 017.9%
Scanner Results Report - Summary FormatPrinted on 2/14/2016 1:55:56 PM
Security Symbol Degree Pattern Wave Rating Trade Prob BTR
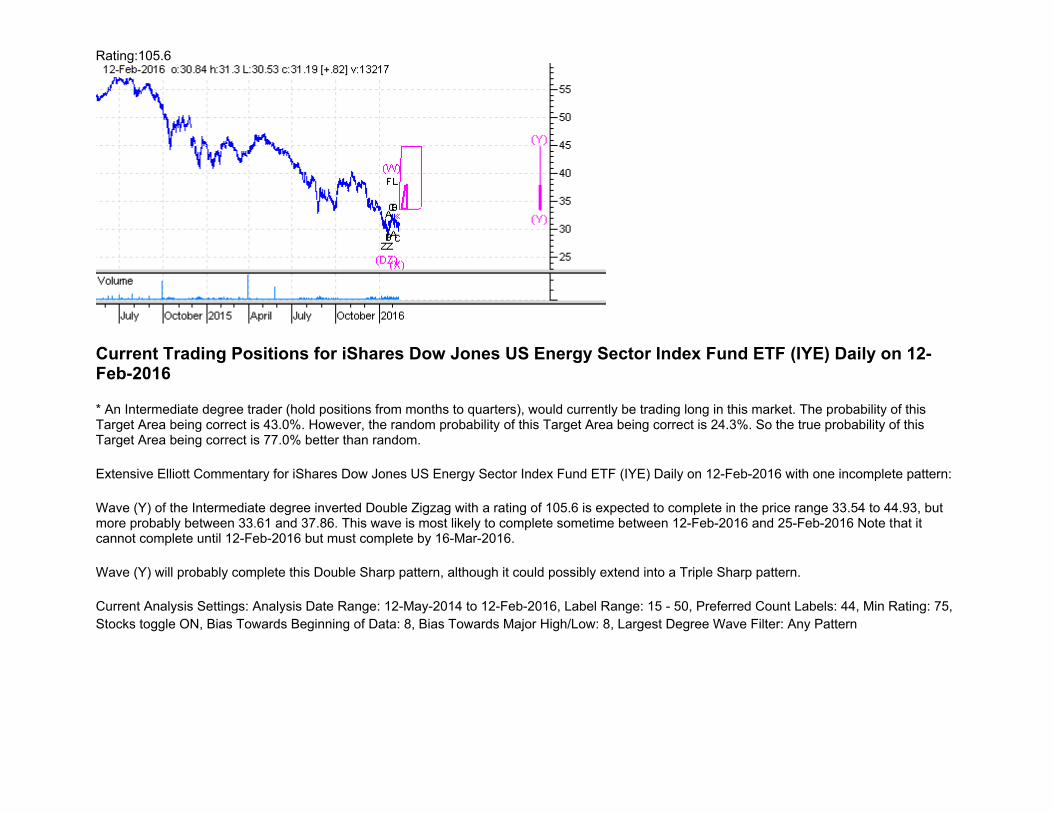
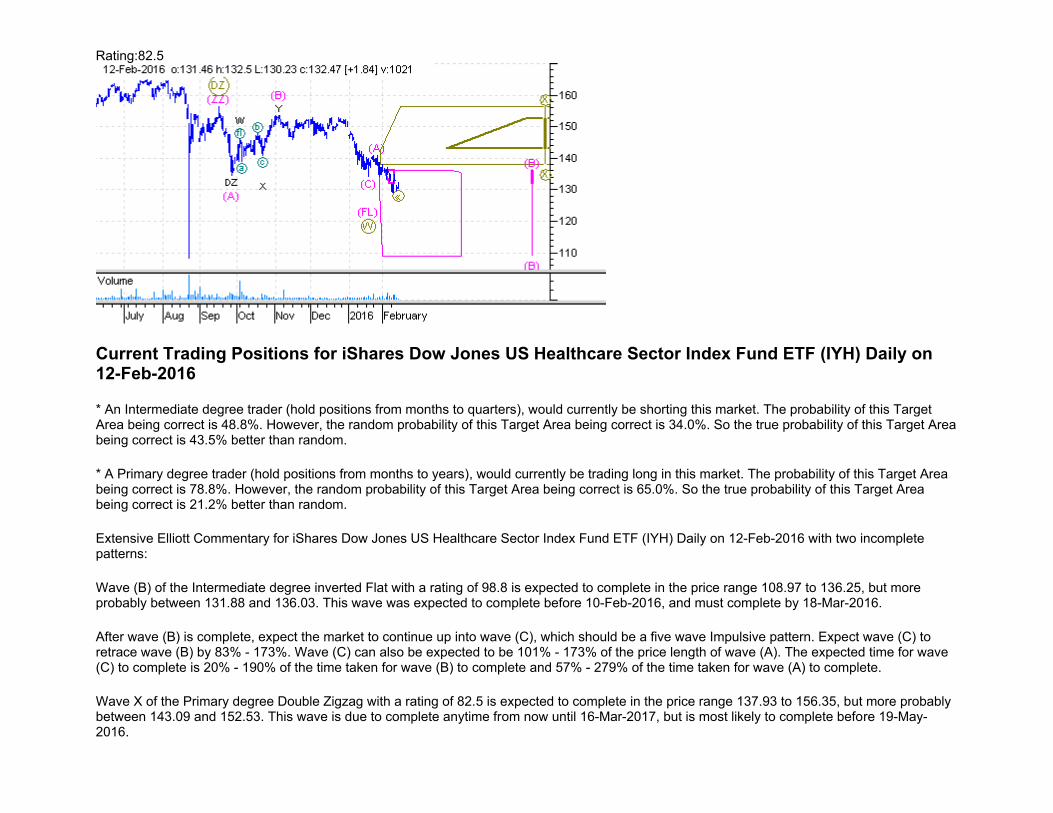
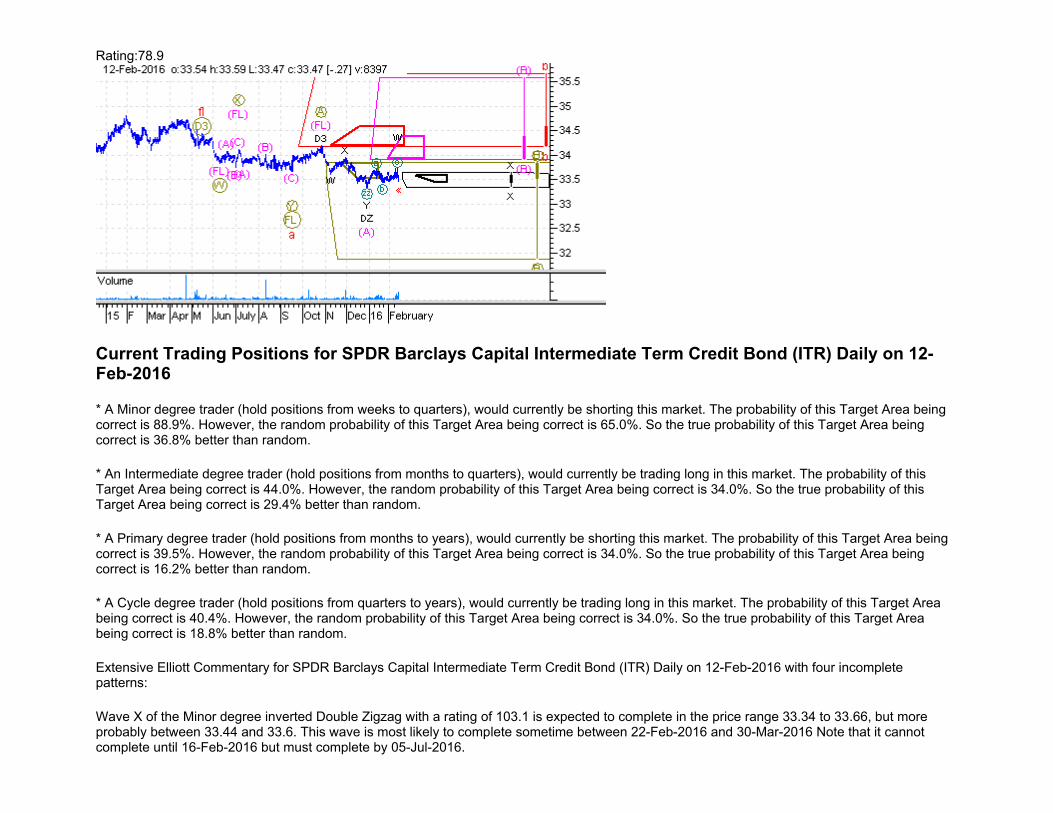
SPDR Barclays Capital Intermediate Term Credit BondITR Minor Double Zigzag 2 103.1 Short (i.e. Sell) 088.9% 036.8%SPDR Barclays Capital Intermediate Term Credit BondITR Intermediate Flat 2 090.5 Long (i.e. Buy) 044.0% 029.4%SPDR Barclays Capital Intermediate Term Credit BondITR Primary Flat 2 075.7 Short (i.e. Sell) 039.5% 016.2%SPDR Barclays Capital Intermediate Term Credit BondITR Cycle Flat 2 078.9 Long (i.e. Buy) 040.4% 018.8%iShares S&P 500/Barra Value Index Fund ETF IVE Intermediate Double Zigzag 3 102.5 Long (i.e. Buy) 042.4% 074.5%iShares S&P 500/Barra Value Index Fund ETF IVE Primary Flat 2 091.1 Long (i.e. Buy) 044.6% 031.2%iShares S&P 500 Index Fund ETF IVV Minuette Zigzag 2 099.2 Long (i.e. Buy) 054.8% 021.8%iShares S&P 500 Index Fund ETF IVV Minute Flat 2 089.2 Short (i.e. Sell) 043.7% 028.5%iShares S&P 500 Index Fund ETF IVV Minor Double 3 2 086.9 Long (i.e. Buy) 055.6% 004.9%iShares S&P 500 Index Fund ETF IVV Intermediate Double Zigzag 2 079.9 Short (i.e. Sell) 077.6% 019.4%iShares S&P 500 Index Fund ETF IVV Primary Flat 2 082.7 Long (i.e. Buy) 041.6% 022.4%iShares S&P 500/Barra Growth Index Fund ETF IVW Intermediate Double Zigzag 2 104.4 Short (i.e. Sell) 089.2% 037.2%iShares S&P 500/Barra Growth Index Fund ETF IVW Primary Flat 2 083.9 Long (i.e. Buy) 041.9% 023.2%iShares Russell 1000 Index Fund ETF IWB Intermediate Double 3 3 089.7 Long (i.e. Buy) 085.9% 034.0%iShares Russell 1000 Index Fund ETF IWB Primary Flat 2 079.3 Long (i.e. Buy) 040.7% 019.7%iShares Russell 1000 Value Index Fund ETF IWD Cycle Double Zigzag 3 094.5 Short (i.e. Sell) 040.8% 067.9%iShares Russell 1000 Growth Index Fund ETF IWF Cycle Double Zigzag 3 094.6 Short (i.e. Sell) 040.8% 067.9%iShares Russell 2000 Index Fund ETF IWM Primary Zigzag 3 104.1 Short (i.e. Sell) 065.3% 045.1%iShares Russell 2000 Index Fund ETF IWM Cycle Double Zigzag 3 085.1 Short (i.e. Sell) 037.5% 054.3%iShares Russell 2000 Value Index Fund ETF IWN Minor Double 3 2 101.0 Long (i.e. Buy) 065.9% 024.3%iShares Russell 2000 Value Index Fund ETF IWN Intermediate Flat 2 082.1 Short (i.e. Sell) 041.6% 022.4%iShares Russell 2000 Value Index Fund ETF IWN Primary Double Zigzag 2 090.4 Long (i.e. Buy) 082.0% 026.2%iShares Russell MidCap Growth Index Fund ETF IWP Intermediate Double 3 3 102.2 Long (i.e. Buy) 087.2% 036.0%iShares Russell MidCap Growth Index Fund ETF IWP Primary Flat 2 080.3 Long (i.e. Buy) 041.0% 020.6%iShares Russell MidCap Growth Index Fund ETF IWP Cycle Double 3 3 084.7 Short (i.e. Sell) 085.4% 033.2%iShares Russell MidCap Index Fund ETF IWR Intermediate Flat 2 102.9 Short (i.e. Sell) 050.2% 047.6%iShares Russell MidCap Value Index Fund ETF IWS Intermediate Double Zigzag 2 101.9 Short (i.e. Sell) 088.3% 035.8%iShares Russell MidCap Value Index Fund ETF IWS Primary Flat 2 090.5 Long (i.e. Buy) 044.0% 029.4%iShares Russell 3000 Index Fund ETF IWV Intermediate Double 3 3 088.9 Long (i.e. Buy) 085.8% 033.9%iShares Russell 3000 Index Fund ETF IWV Primary Flat 2 081.2 Long (i.e. Buy) 041.3% 021.5%iShares S&P Global Energy Sector Index Fund ETFIXC Cycle Flat 2 102.3 Long (i.e. Buy) 050.2% 047.6%iShares S&P Global Healthcare Sector Index Fund ETFIXJ Intermediate Double 3 3 109.8 Long (i.e. Buy) 087.9% 037.1%iShares Core MSCI Total International Stock ETFIXUS Intermediate Impulse 2 094.5 Short (i.e. Sell) 070.5% 056.7%iShares Core MSCI Total International Stock ETFIXUS Cycle Flat 2 076.6 Long (i.e. Buy) 039.8% 017.1%iShares Dow Jones US Energy Sector Index Fund ETFIYE Intermediate Double Zigzag 3 105.6 Long (i.e. Buy) 043.0% 077.0%iShares Dow Jones US Financial Sector Index Fund ETFIYF Intermediate Double 3 3 086.0 Long (i.e. Buy) 085.6% 033.5%iShares Dow Jones US Financial Sector Index Fund ETFIYF Primary Flat 2 078.3 Long (i.e. Buy) 040.4% 018.8%iShares Dow Jones US Financial Services Index Fund ETFIYG Minute Double Zigzag 2 098.5 Long (i.e. Buy) 086.8% 033.5%iShares Dow Jones US Financial Services Index Fund ETFIYG Minor Flat 2 079.4 Short (i.e. Sell) 040.7% 019.7%iShares Dow Jones US Financial Services Index Fund ETFIYG Intermediate Double 3 3 082.7 Long (i.e. Buy) 085.2% 032.9%iShares Dow Jones US Healthcare Sector Index Fund ETFIYH Intermediate Flat 2 098.8 Short (i.e. Sell) 048.8% 043.5%iShares Dow Jones US Healthcare Sector Index Fund ETFIYH Primary Double Zigzag 2 082.5 Long (i.e. Buy) 078.8% 021.2%
Scanner Results Report - Summary FormatPrinted on 2/14/2016 1:55:56 PM
Security Symbol Degree Pattern Wave Rating Trade Prob BTR
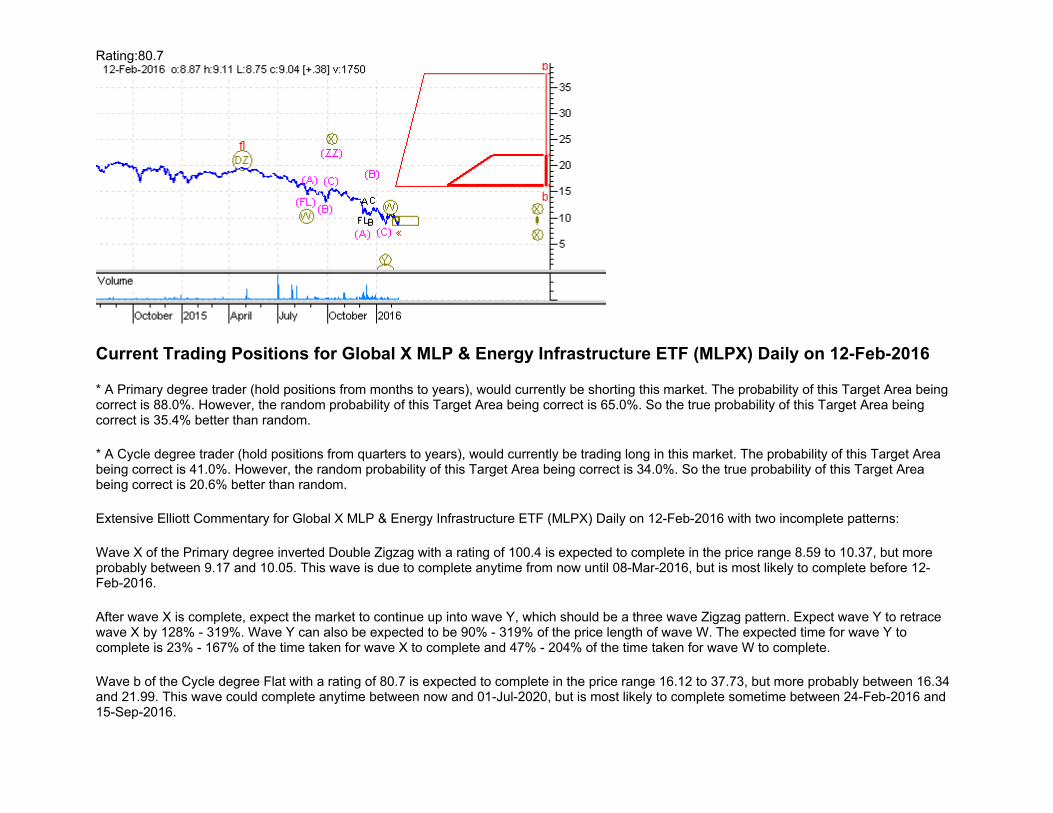
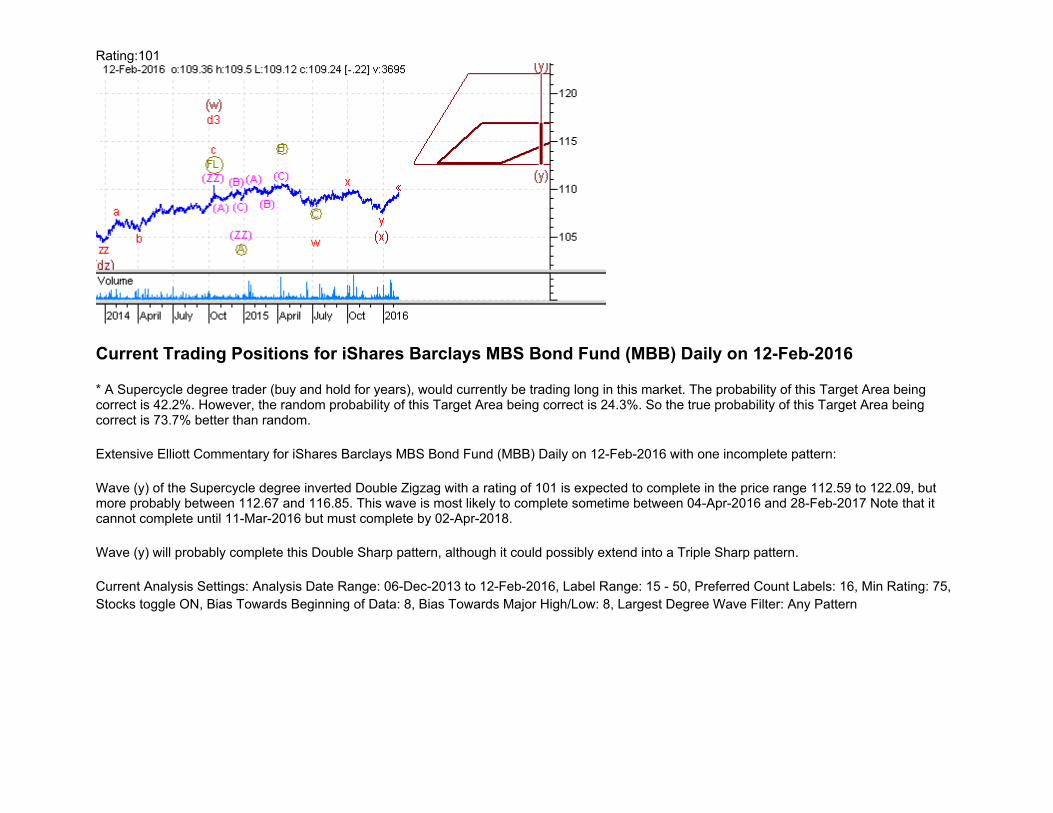
iShares Dow Jones US Basic Materials Index Fund ETFIYM Intermediate Impulse 2 098.7 Short (i.e. Sell) 071.0% 057.8%iShares Dow Jones US Basic Materials Index Fund ETFIYM Cycle Double 3 2 077.1 Long (i.e. Buy) 054.8% 003.4%iShares Dow Jones US Real Estate Index Fund ETFIYR Primary Zigzag 3 103.4 Short (i.e. Sell) 065.1% 044.7%iShares Dow Jones US Real Estate Index Fund ETFIYR Cycle Double Zigzag 3 091.6 Short (i.e. Sell) 040.2% 065.4%iShares Dow Jones Transportation Average Index Fund ETFIYT Intermediate Double Zigzag 3 105.1 Long (i.e. Buy) 043.0% 077.0%iShares Dow Jones US Telecommunications Sector Index Fund ETFIYZ Primary Contracting Triangle 4 571.3 Short (i.e. Sell) 078.1% 022.0%Nuveen Energy MLP Total Return JMF Primary Double Zigzag 2 101.0 Short (i.e. Sell) 088.3% 035.8%Nuveen Energy MLP Total Return JMF Cycle Flat 2 079.8 Long (i.e. Buy) 040.7% 019.7%SPDR Barclays High Yield Bond ETF JNK Cycle Double Zigzag 2 077.9 Long (i.e. Buy) 076.8% 018.2%Direxion Daily Junior Gold Miners Index Bull 3x JNUG Cycle Double Zigzag 2 081.8 Long (i.e. Buy) 078.4% 020.6%iPath Dow Jones-UBS Coffee Total Return Sub-Index ETNJO Primary Contracting Triangle 4 228.5 Short (i.e. Sell) 078.1% 022.0%Nuveen Preferred Income Opportunities Fund JPC Primary Double Zigzag 3 101.0 Long (i.e. Buy) 042.2% 073.7%SPDR KBW Bank ETF KBE Cycle Flat 2 100.4 Long (i.e. Buy) 050.0% 047.1%SPDR KBW Insurance ETF KIE Primary Ending Diagonal 4 094.0 Long (i.e. Buy) 088.8% 010.4%SPDR KBW Regional Banking ETF KRE Minute Flat 2 101.9 Long (i.e. Buy) 050.1% 047.4%SPDR KBW Regional Banking ETF KRE Minor Flat 2 078.0 Short (i.e. Sell) 040.4% 018.8%SPDR KBW Regional Banking ETF KRE Intermediate Double 3 3 089.8 Long (i.e. Buy) 085.9% 034.0%SPDR KBW Regional Banking ETF KRE Primary Flat 2 075.8 Long (i.e. Buy) 039.5% 016.2%KraneShares CSI China Internet ETF KWEB Primary Zigzag 3 100.2 Short (i.e. Sell) 064.5% 043.3%iShares Iboxx $ Investop Corp Bd LQD Intermediate Zigzag 3 098.7 Short (i.e. Sell) 061.8% 037.3%iShares Iboxx $ Investop Corp Bd LQD Primary Double 3 2 083.0 Short (i.e. Sell) 055.4% 004.5%iShares Iboxx $ Investop Corp Bd LQD Cycle Flat 2 075.5 Long (i.e. Buy) 039.5% 016.2%iShares Barclays MBS Bond Fund MBB Supercycle Double Zigzag 3 101.0 Long (i.e. Buy) 042.2% 073.7%iShares MSCI China Index Fund MCHI Primary Double 3 2 098.8 Short (i.e. Sell) 063.2% 019.2%iShares MSCI China Index Fund MCHI Cycle Ending Diagonal 4 083.3 Long (i.e. Buy) 086.6% 007.7%First Trust ETF VI Multi-Asset Diversified Income IndexMDIV Primary Double Zigzag 3 100.9 Short (i.e. Sell) 042.0% 072.8%SPDRs S&P Midcap Trust Series ETF MDY Cycle Double Zigzag 3 095.6 Short (i.e. Sell) 041.0% 068.7%Vanguard Mega Cap 300 Growth Index ETF MGK Minuette Double 3 2 104.4 Long (i.e. Buy) 068.0% 028.3%Vanguard Mega Cap 300 Growth Index ETF MGK Minute Flat 2 091.0 Short (i.e. Sell) 044.6% 031.2%Vanguard Mega Cap 300 Growth Index ETF MGK Minor Double 3 2 085.8 Long (i.e. Buy) 055.6% 004.9%Vanguard Mega Cap 300 Growth Index ETF MGK Intermediate Double Zigzag 2 078.6 Short (i.e. Sell) 077.2% 018.8%Vanguard Mega Cap 300 Growth Index ETF MGK Primary Flat 2 077.4 Long (i.e. Buy) 040.1% 017.9%Cohen & Steers MLP Income and Energy Opp FundMIE Primary Double 3 2 100.9 Short (i.e. Sell) 065.0% 022.6%Cohen & Steers MLP Income and Energy Opp FundMIE Cycle Flat 2 077.8 Long (i.e. Buy) 040.1% 017.9%PIMCO Enhanced Short Maturity Strategy Fund MINT Intermediate Zigzag 3 103.9 Short (i.e. Sell) 065.1% 044.7%PIMCO Enhanced Short Maturity Strategy Fund MINT Primary Flat 2 081.4 Short (i.e. Sell) 041.3% 021.5%Ubs Ag 2Xleveraged Lg Exch MLPL Primary Zigzag 2 082.9 Long (i.e. Buy) 051.4% 014.2%Ubs Ag 2Xleveraged Lg Exch MLPL Cycle Double Zigzag 3 081.2 Short (i.e. Sell) 035.5% 046.1%Global X MLP & Energy Infrastructure ETF MLPX Primary Double Zigzag 2 100.4 Short (i.e. Sell) 088.0% 035.4%Global X MLP & Energy Infrastructure ETF MLPX Cycle Flat 2 080.7 Long (i.e. Buy) 041.0% 020.6%Market Vectors Morningstar Wide Moat ETF MOAT Minor Double Zigzag 2 101.9 Short (i.e. Sell) 088.3% 035.8%Market Vectors Morningstar Wide Moat ETF MOAT Intermediate Flat 2 089.7 Long (i.e. Buy) 043.7% 028.5%
Scanner Results Report - Summary FormatPrinted on 2/14/2016 1:58:46 PM
Security Symbol Degree Pattern Wave Rating Trade Prob BTR
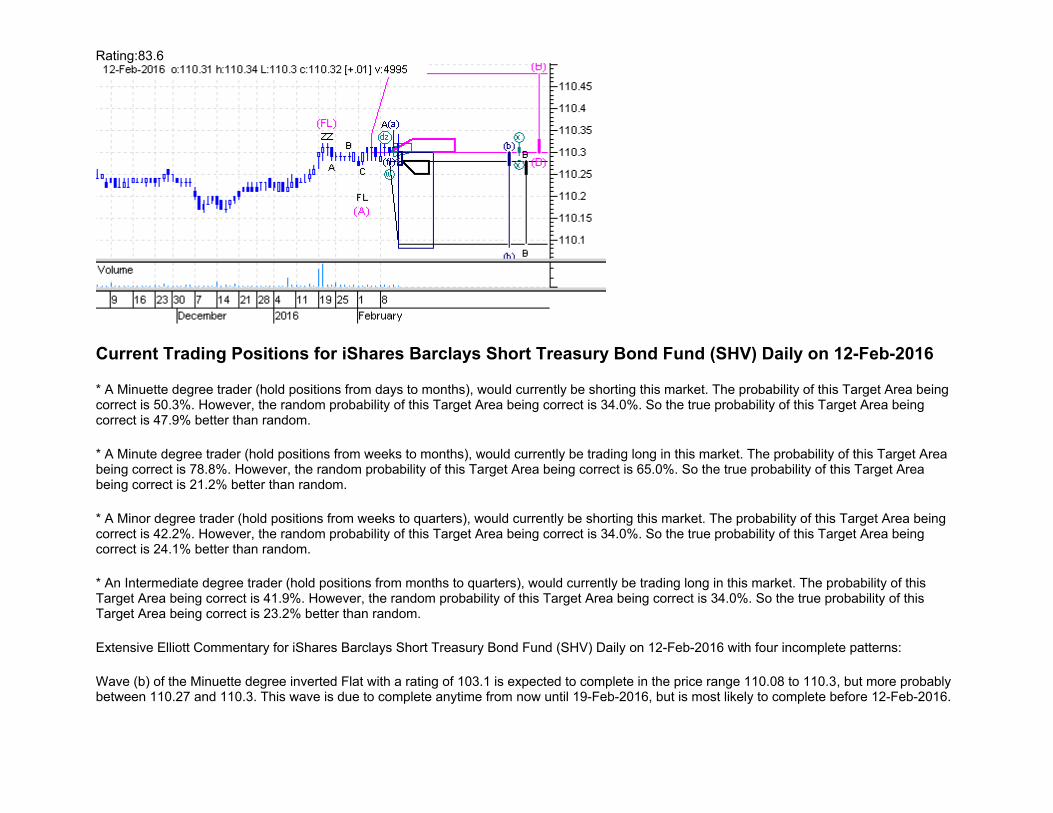
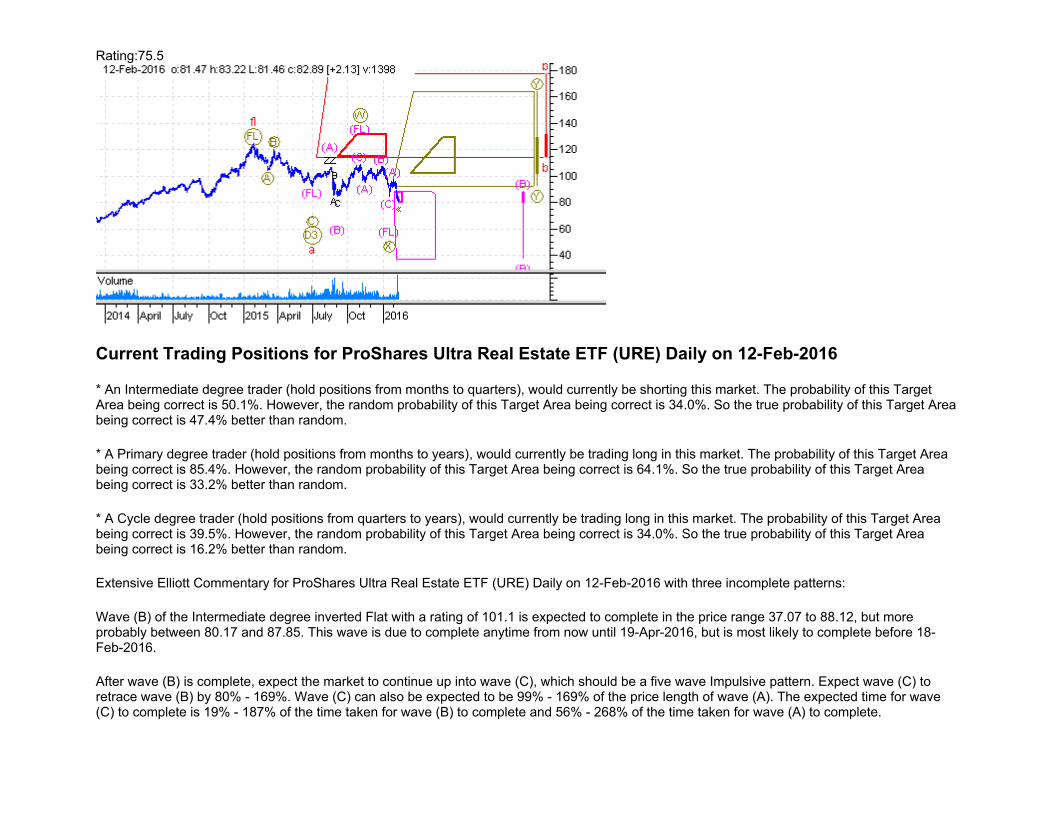
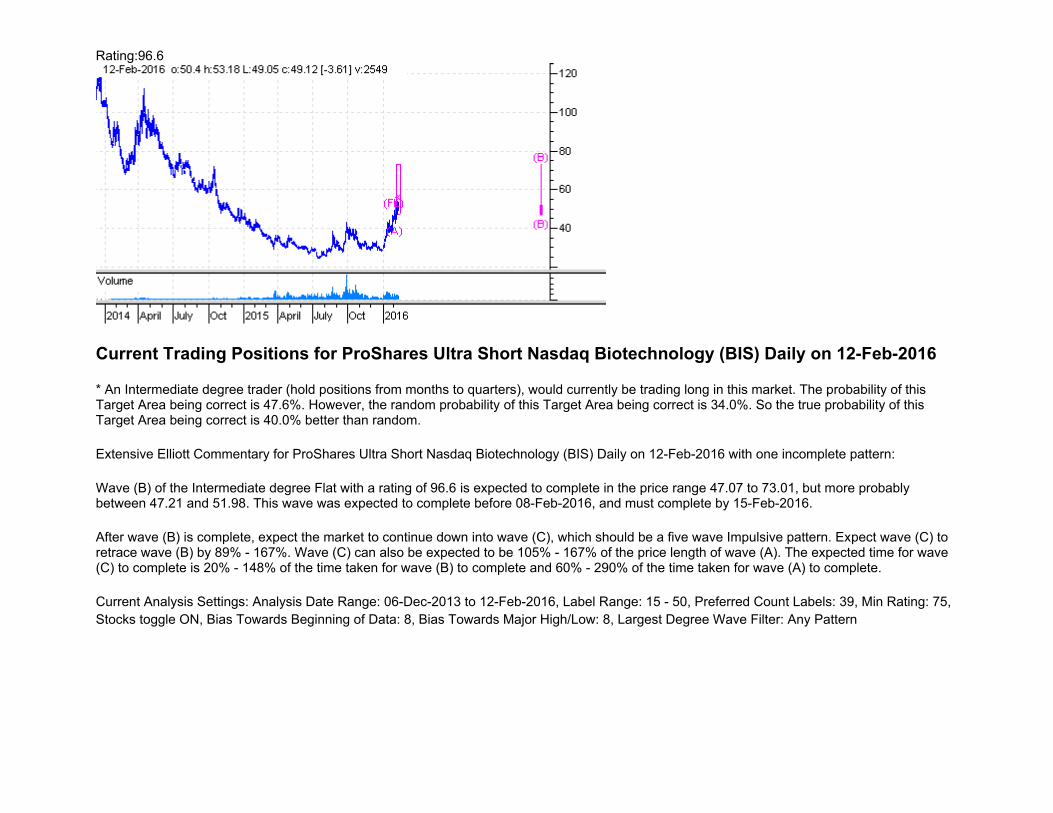
iShares Barclays Intermediate Credit Bond Fund CIU Intermediate Flat 2 081.4 Short (i.e. Sell) 041.3% 021.5%iShares Barclays Short Treasury Bond Fund SHV Intermediate Flat 2 083.6 Long (i.e. Buy) 041.9% 023.2%iShares Barclays TIPS Bond Fund TIP Intermediate Flat 2 082.4 Short (i.e. Sell) 041.6% 022.4%iShares Dow Jones US Healthcare Sector Index Fund ETFIYH Intermediate Flat 2 098.8 Short (i.e. Sell) 048.8% 043.5%iShares Dow Jones US Home Construction Index Fund ETFITB Intermediate Flat 2 101.3 Short (i.e. Sell) 050.1% 047.4%iShares Dow Jones US Utilities Sector Index Fund ETFIDU Intermediate Flat 2 088.9 Long (i.e. Buy) 043.4% 027.6%iShares MSCI France Index Fund ETF EWQ Intermediate Flat 2 103.0 Short (i.e. Sell) 050.3% 047.9%iShares MSCI Gbl Sel Metals & Mining Prd PICK Intermediate Flat 2 094.1 Short (i.e. Sell) 046.4% 036.5%iShares MSCI Hong Kong Index Fund ETF EWH Intermediate Flat 2 102.1 Short (i.e. Sell) 050.2% 047.6%iShares MSCI South Korea Index Fund ETF EWY Intermediate Flat 2 101.9 Short (i.e. Sell) 050.1% 047.4%iShares MSCI USA Momentum Factor ETF MTUM Intermediate Flat 2 102.4 Long (i.e. Buy) 050.2% 047.6%iShares Russell 2000 Value Index Fund ETF IWN Intermediate Flat 2 082.1 Short (i.e. Sell) 041.6% 022.4%iShares Russell MidCap Index Fund ETF IWR Intermediate Flat 2 102.9 Short (i.e. Sell) 050.2% 047.6%iShares S&P GSTI Networking Index Fund ETF IGN Intermediate Flat 2 098.0 Short (i.e. Sell) 048.8% 043.5%iShares S&P Moderate Allocation Fund AOM Intermediate Flat 2 089.8 Short (i.e. Sell) 043.7% 028.5%iShares S&P SmallCap 600 Index Fund ETF IJR Intermediate Flat 2 081.8 Short (i.e. Sell) 041.3% 021.5%iShares S&P SmallCap 600/Barra Value Index Fund ETFIJS Intermediate Flat 2 084.0 Short (i.e. Sell) 042.2% 024.1%JP Morgan Alerian MLP Index ETN AMJ Intermediate Flat 2 085.6 Short (i.e. Sell) 042.5% 025.0%Market Vectors Morningstar Wide Moat ETF MOAT Intermediate Flat 2 089.7 Long (i.e. Buy) 043.7% 028.5%Morgan Stanley China A Share Fund, Inc CAF Intermediate Flat 2 095.1 Short (i.e. Sell) 047.0% 038.2%Pimco Dynamic Credit Income Fund PCI Intermediate Flat 2 102.7 Short (i.e. Sell) 050.2% 047.6%PowerShares DB Commodity Index Tracking ETFDBC Intermediate Flat 2 101.4 Short (i.e. Sell) 050.1% 047.4%Powershares Db Energy Fund DBE Intermediate Flat 2 100.3 Short (i.e. Sell) 050.0% 047.1%PowerShares Dynamic Pharmaceuticals Portfolio ETFPJP Intermediate Flat 2 094.7 Short (i.e. Sell) 046.4% 036.5%Powershares SP 500 Downside Hdg PHDG Intermediate Flat 2 096.9 Short (i.e. Sell) 047.6% 040.0%ProShares Ultra DJ Crude UCO Intermediate Flat 2 096.9 Short (i.e. Sell) 047.6% 040.0%ProShares Ultra Nasdaq Biotechnology BIB Intermediate Flat 2 096.8 Short (i.e. Sell) 047.6% 040.0%ProShares Ultra Real Estate ETF URE Intermediate Flat 2 101.1 Short (i.e. Sell) 050.1% 047.4%ProShares Ultra Short Nasdaq Biotechnology BIS Intermediate Flat 2 096.6 Long (i.e. Buy) 047.6% 040.0%ProShares UltraPro S&P500 UPRO Intermediate Flat 2 088.2 Long (i.e. Buy) 043.4% 027.6%ProShares UltraPro Short QQQ SQQQ Intermediate Flat 2 089.2 Short (i.e. Sell) 043.7% 028.5%Putnam Master Intermediate Income Trust PIM Intermediate Flat 2 079.5 Short (i.e. Sell) 040.7% 019.7%Putnam Premier Income Trust PPT Intermediate Flat 2 101.3 Short (i.e. Sell) 050.1% 047.4%QuantShares U.S. Market Neutral Anti-Beta FundBTAL Intermediate Flat 2 083.0 Long (i.e. Buy) 041.6% 022.4%Schwab Fundamental Intl Lg Co ETF FNDF Intermediate Flat 2 101.8 Short (i.e. Sell) 050.1% 047.4%Schwab International Small-Cap Equity ETF SCHC Intermediate Flat 2 102.5 Short (i.e. Sell) 050.2% 047.6%Schwab U.S. TIPs ETF SCHP Intermediate Flat 2 081.9 Short (i.e. Sell) 041.3% 021.5%Schwab US Dividend Equity ETF SCHD Intermediate Flat 2 088.7 Long (i.e. Buy) 043.4% 027.6%SPDR Barclays Capital Intermediate Term Credit BondITR Intermediate Flat 2 090.5 Long (i.e. Buy) 044.0% 029.4%SPDR S&P Emerging Markets Dividend ETF EDIV Intermediate Flat 2 102.0 Short (i.e. Sell) 050.2% 047.6%SPDR S&P International Small Cap ETF GWX Intermediate Flat 2 102.7 Short (i.e. Sell) 050.2% 047.6%SPDR S&P Pharmaceuticals ETF XPH Intermediate Flat 2 096.9 Short (i.e. Sell) 047.6% 040.0%
Scanner Results Report - Summary FormatPrinted on 2/14/2016 1:58:46 PM
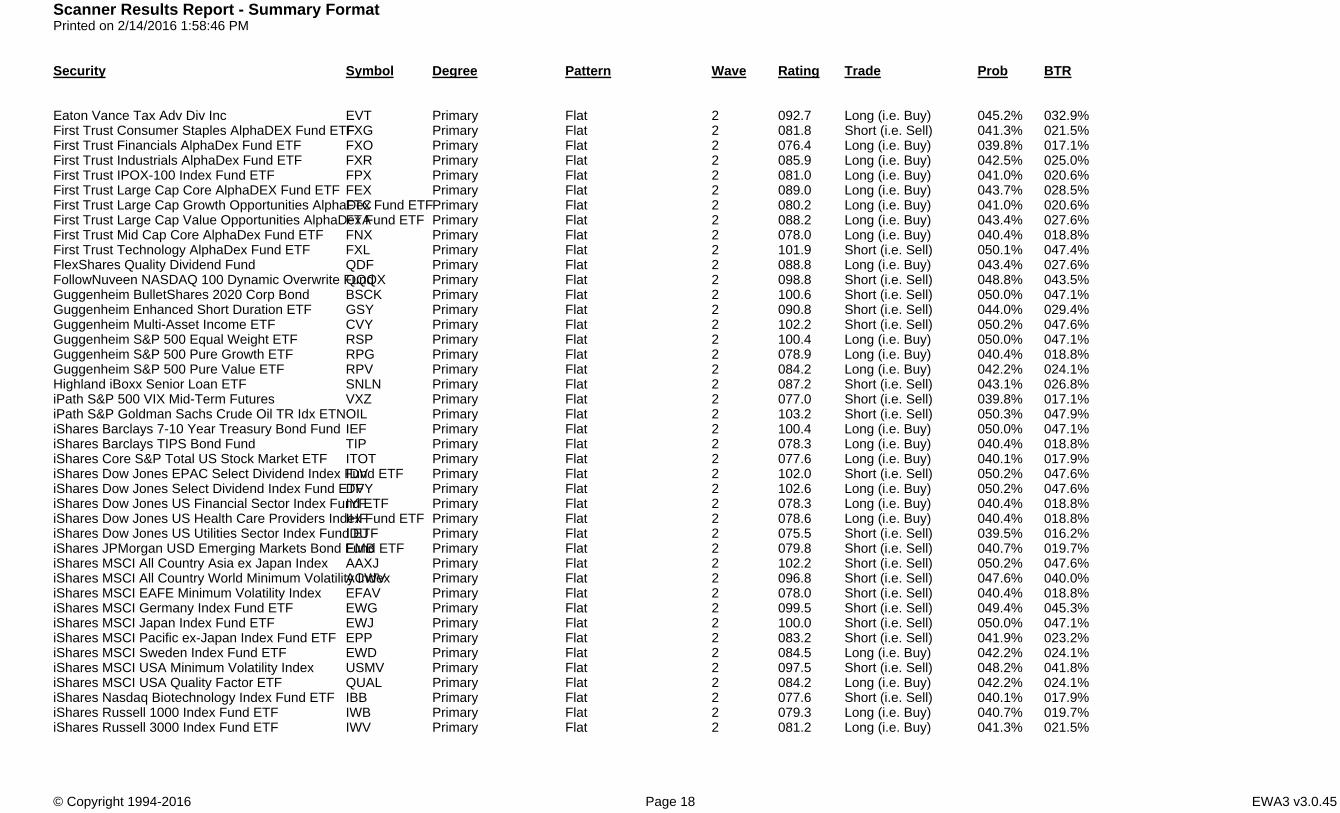
Security Symbol Degree Pattern Wave Rating Trade Prob BTR
Eaton Vance Tax Adv Div Inc EVT Primary Flat 2 092.7 Long (i.e. Buy) 045.2% 032.9%First Trust Consumer Staples AlphaDEX Fund ETFFXG Primary Flat 2 081.8 Short (i.e. Sell) 041.3% 021.5%First Trust Financials AlphaDex Fund ETF FXO Primary Flat 2 076.4 Long (i.e. Buy) 039.8% 017.1%First Trust Industrials AlphaDex Fund ETF FXR Primary Flat 2 085.9 Long (i.e. Buy) 042.5% 025.0%First Trust IPOX-100 Index Fund ETF FPX Primary Flat 2 081.0 Long (i.e. Buy) 041.0% 020.6%First Trust Large Cap Core AlphaDEX Fund ETF FEX Primary Flat 2 089.0 Long (i.e. Buy) 043.7% 028.5%First Trust Large Cap Growth Opportunities AlphaDex Fund ETFFTC Primary Flat 2 080.2 Long (i.e. Buy) 041.0% 020.6%First Trust Large Cap Value Opportunities AlphaDex Fund ETFFTA Primary Flat 2 088.2 Long (i.e. Buy) 043.4% 027.6%First Trust Mid Cap Core AlphaDex Fund ETF FNX Primary Flat 2 078.0 Long (i.e. Buy) 040.4% 018.8%First Trust Technology AlphaDex Fund ETF FXL Primary Flat 2 101.9 Short (i.e. Sell) 050.1% 047.4%FlexShares Quality Dividend Fund QDF Primary Flat 2 088.8 Long (i.e. Buy) 043.4% 027.6%FollowNuveen NASDAQ 100 Dynamic Overwrite FundQQQX Primary Flat 2 098.8 Short (i.e. Sell) 048.8% 043.5%Guggenheim BulletShares 2020 Corp Bond BSCK Primary Flat 2 100.6 Short (i.e. Sell) 050.0% 047.1%Guggenheim Enhanced Short Duration ETF GSY Primary Flat 2 090.8 Short (i.e. Sell) 044.0% 029.4%Guggenheim Multi-Asset Income ETF CVY Primary Flat 2 102.2 Short (i.e. Sell) 050.2% 047.6%Guggenheim S&P 500 Equal Weight ETF RSP Primary Flat 2 100.4 Long (i.e. Buy) 050.0% 047.1%Guggenheim S&P 500 Pure Growth ETF RPG Primary Flat 2 078.9 Long (i.e. Buy) 040.4% 018.8%Guggenheim S&P 500 Pure Value ETF RPV Primary Flat 2 084.2 Long (i.e. Buy) 042.2% 024.1%Highland iBoxx Senior Loan ETF SNLN Primary Flat 2 087.2 Short (i.e. Sell) 043.1% 026.8%iPath S&P 500 VIX Mid-Term Futures VXZ Primary Flat 2 077.0 Short (i.e. Sell) 039.8% 017.1%iPath S&P Goldman Sachs Crude Oil TR Idx ETNOIL Primary Flat 2 103.2 Short (i.e. Sell) 050.3% 047.9%iShares Barclays 7-10 Year Treasury Bond Fund IEF Primary Flat 2 100.4 Long (i.e. Buy) 050.0% 047.1%iShares Barclays TIPS Bond Fund TIP Primary Flat 2 078.3 Long (i.e. Buy) 040.4% 018.8%iShares Core S&P Total US Stock Market ETF ITOT Primary Flat 2 077.6 Long (i.e. Buy) 040.1% 017.9%iShares Dow Jones EPAC Select Dividend Index Fund ETFIDV Primary Flat 2 102.0 Short (i.e. Sell) 050.2% 047.6%iShares Dow Jones Select Dividend Index Fund ETFDVY Primary Flat 2 102.6 Long (i.e. Buy) 050.2% 047.6%iShares Dow Jones US Financial Sector Index Fund ETFIYF Primary Flat 2 078.3 Long (i.e. Buy) 040.4% 018.8%iShares Dow Jones US Health Care Providers Index Fund ETFIHF Primary Flat 2 078.6 Long (i.e. Buy) 040.4% 018.8%iShares Dow Jones US Utilities Sector Index Fund ETFIDU Primary Flat 2 075.5 Short (i.e. Sell) 039.5% 016.2%iShares JPMorgan USD Emerging Markets Bond Fund ETFEMB Primary Flat 2 079.8 Short (i.e. Sell) 040.7% 019.7%iShares MSCI All Country Asia ex Japan Index AAXJ Primary Flat 2 102.2 Short (i.e. Sell) 050.2% 047.6%iShares MSCI All Country World Minimum Volatility IndexACWV Primary Flat 2 096.8 Short (i.e. Sell) 047.6% 040.0%iShares MSCI EAFE Minimum Volatility Index EFAV Primary Flat 2 078.0 Short (i.e. Sell) 040.4% 018.8%iShares MSCI Germany Index Fund ETF EWG Primary Flat 2 099.5 Short (i.e. Sell) 049.4% 045.3%iShares MSCI Japan Index Fund ETF EWJ Primary Flat 2 100.0 Short (i.e. Sell) 050.0% 047.1%iShares MSCI Pacific ex-Japan Index Fund ETF EPP Primary Flat 2 083.2 Short (i.e. Sell) 041.9% 023.2%iShares MSCI Sweden Index Fund ETF EWD Primary Flat 2 084.5 Long (i.e. Buy) 042.2% 024.1%iShares MSCI USA Minimum Volatility Index USMV Primary Flat 2 097.5 Short (i.e. Sell) 048.2% 041.8%iShares MSCI USA Quality Factor ETF QUAL Primary Flat 2 084.2 Long (i.e. Buy) 042.2% 024.1%iShares Nasdaq Biotechnology Index Fund ETF IBB Primary Flat 2 077.6 Short (i.e. Sell) 040.1% 017.9%iShares Russell 1000 Index Fund ETF IWB Primary Flat 2 079.3 Long (i.e. Buy) 040.7% 019.7%iShares Russell 3000 Index Fund ETF IWV Primary Flat 2 081.2 Long (i.e. Buy) 041.3% 021.5%
Scanner Results Report - Summary FormatPrinted on 2/14/2016 2:00:07 PM
Security Symbol Degree Pattern Wave Rating Trade Prob BTR
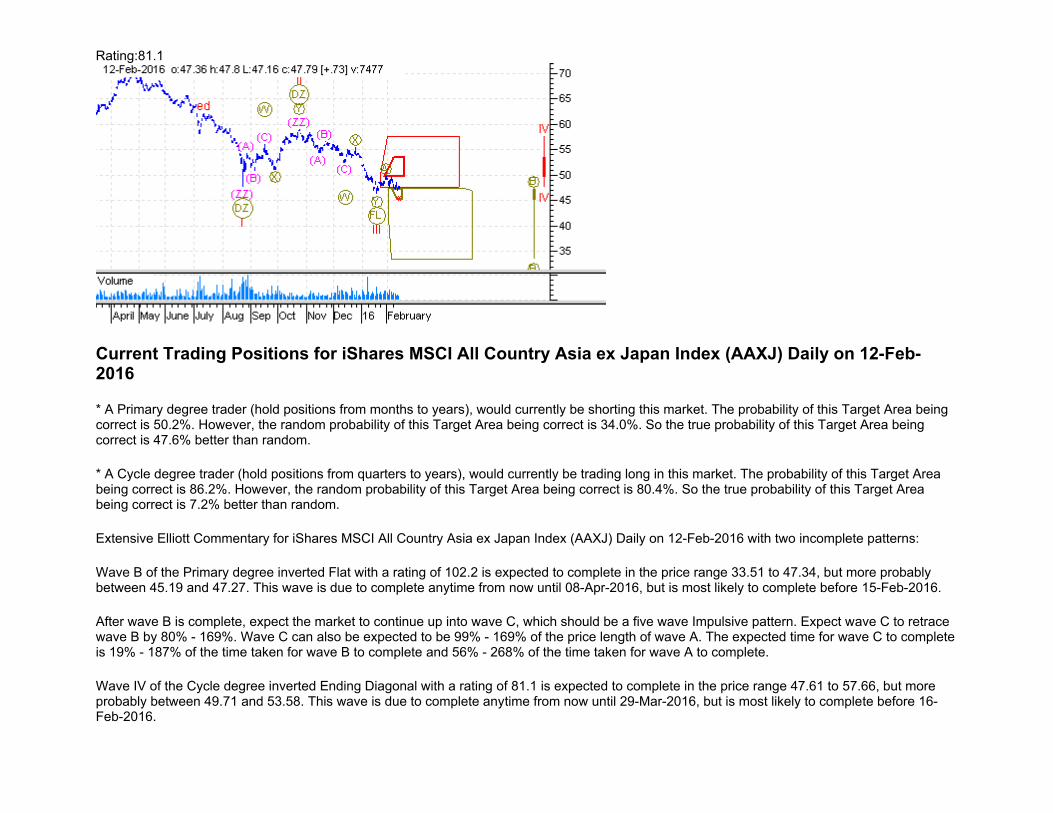
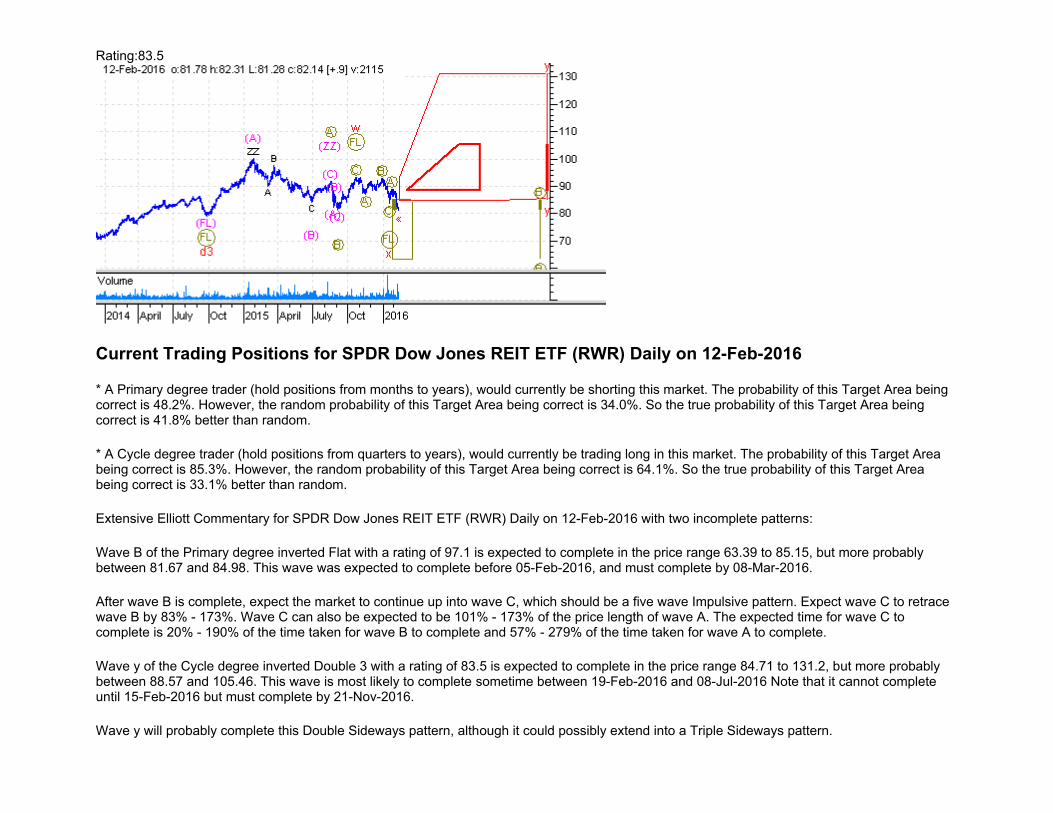
iShares Barclays Short Treasury Bond Fund SHV Intermediate Flat 2 083.6 Long (i.e. Buy) 041.9% 023.2%SPDR Dow Jones REIT ETF RWR Cycle Double 3 3 083.5 Long (i.e. Buy) 085.3% 033.1%iShares S&P National Municipal Bond ETF MUB Cycle Double Zigzag 2 083.5 Long (i.e. Buy) 079.2% 021.8%SPDR Lehman Intermediate Term Treasury ETF ITE Primary Flat 2 083.4 Long (i.e. Buy) 041.9% 023.2%iShares MSCI China Index Fund MCHI Cycle Ending Diagonal 4 083.3 Long (i.e. Buy) 086.6% 007.7%Guggenheim BulletShares 2017 High Yield Corp Bond ETFBSJH Primary Double 3 3 083.3 Long (i.e. Buy) 085.3% 033.1%Asa Gold and Precious Metals Limited ASA Cycle Double Zigzag 2 083.3 Long (i.e. Buy) 079.2% 021.8%Virtus Total Return DCA Cycle Flat 2 083.2 Long (i.e. Buy) 041.9% 023.2%Clearbridge Energy MLP Fund CEM Primary Flat 2 083.1 Long (i.e. Buy) 041.9% 023.2%QuantShares U.S. Market Neutral Anti-Beta FundBTAL Intermediate Flat 2 083.0 Long (i.e. Buy) 041.6% 022.4%iShares Barclays Short Treasury Bond Fund SHV Minute Double Zigzag 2 082.9 Long (i.e. Buy) 078.8% 021.2%Ubs Ag 2Xleveraged Lg Exch MLPL Primary Zigzag 2 082.9 Long (i.e. Buy) 051.4% 014.2%iShares Dow Jones US Financial Services Index Fund ETFIYG Intermediate Double 3 3 082.7 Long (i.e. Buy) 085.2% 032.9%iShares Barclays 1-3 Year Treasury Bond Fund SHY Cycle Flat 2 082.7 Long (i.e. Buy) 041.6% 022.4%Market Vectors Barclays Capital Municipal Custom High Yield Composite IndexHYD Cycle Flat 2 082.7 Long (i.e. Buy) 041.6% 022.4%iShares S&P 500 Index Fund ETF IVV Primary Flat 2 082.7 Long (i.e. Buy) 041.6% 022.4%iShares S&P Europe 350 Index Fund ETF IEV Cycle Flat 2 082.6 Long (i.e. Buy) 041.6% 022.4%iShares Dow Jones US Healthcare Sector Index Fund ETFIYH Primary Double Zigzag 2 082.5 Long (i.e. Buy) 078.8% 021.2%iShares Dow Jones US Oil & Gas Exploration & Production Index Fund ETFIEO Cycle Flat 2 082.5 Long (i.e. Buy) 041.6% 022.4%iShares Barclays Intermediate Credit Bond Fund CIU Primary Double 3 3 082.3 Long (i.e. Buy) 085.2% 032.9%iShares MSCI Malaysia Index Fund ETF EWM Cycle Double Zigzag 2 082.3 Long (i.e. Buy) 078.8% 021.2%PowerShares Emerg Mkts Svrgn Debt Port PCY Cycle Double Zigzag 2 081.9 Long (i.e. Buy) 078.4% 020.6%iShares MSCI Mexico Index Fund ETF EWW Cycle Flat 2 081.9 Long (i.e. Buy) 041.3% 021.5%Eaton Vance Insured Muni Bd EIM Cycle Double Zigzag 3 081.8 Long (i.e. Buy) 035.5% 046.1%Direxion Daily Junior Gold Miners Index Bull 3x JNUG Cycle Double Zigzag 2 081.8 Long (i.e. Buy) 078.4% 020.6%iShares Dow Jones US Utilities Sector Index Fund ETFIDU Cycle Double Zigzag 2 081.8 Long (i.e. Buy) 078.4% 020.6%BlackRock Credit Allocation Income Trust BTZ Cycle Flat 2 081.8 Long (i.e. Buy) 041.3% 021.5%Center Coast MLP & Infrastructure Fund CEN Cycle Flat 2 081.8 Long (i.e. Buy) 041.3% 021.5%PowerShares FTSE RAFI Emerging Markets Portfolio ETFPXH Cycle Flat 2 081.8 Long (i.e. Buy) 041.3% 021.5%iShares Barclays 20+ Year Treasury Bond Fund TLT Cycle Double 3 3 081.7 Long (i.e. Buy) 085.1% 032.8%ProShares UltraShort QQQ QID Cycle Double Zigzag 2 081.4 Long (i.e. Buy) 078.4% 020.6%SPDR Lehm Muni ETF TFI Cycle Flat 2 081.4 Long (i.e. Buy) 041.3% 021.5%Schwab Fundamental US Small Company ETF FNDA Primary Flat 2 081.4 Long (i.e. Buy) 041.3% 021.5%iShares S&P India Nifty 50 Index Fund INDY Cycle Flat 2 081.3 Long (i.e. Buy) 041.3% 021.5%Vanguard Lge Cap Etf VV Primary Flat 2 081.3 Long (i.e. Buy) 041.3% 021.5%SPDR S&P Dividends ETF SDY Primary Double Zigzag 3 081.2 Long (i.e. Buy) 035.5% 046.1%ProShares Ultra DJ Crude UCO Cycle Double Zigzag 2 081.2 Long (i.e. Buy) 078.4% 020.6%PowerShares High Yield Corporate Bond Portfolio ETFPHB Cycle Flat 2 081.2 Long (i.e. Buy) 041.3% 021.5%iShares Russell 3000 Index Fund ETF IWV Primary Flat 2 081.2 Long (i.e. Buy) 041.3% 021.5%iShares MSCI All Country Asia ex Japan Index AAXJ Cycle Ending Diagonal 4 081.1 Long (i.e. Buy) 086.2% 007.2%Blackrock Core Bond Trust BHK Cycle Flat 2 081.1 Long (i.e. Buy) 041.3% 021.5%Global X InterBolsa FTSE Colombia 20 ETF GXG Cycle Flat 2 081.1 Long (i.e. Buy) 041.3% 021.5%
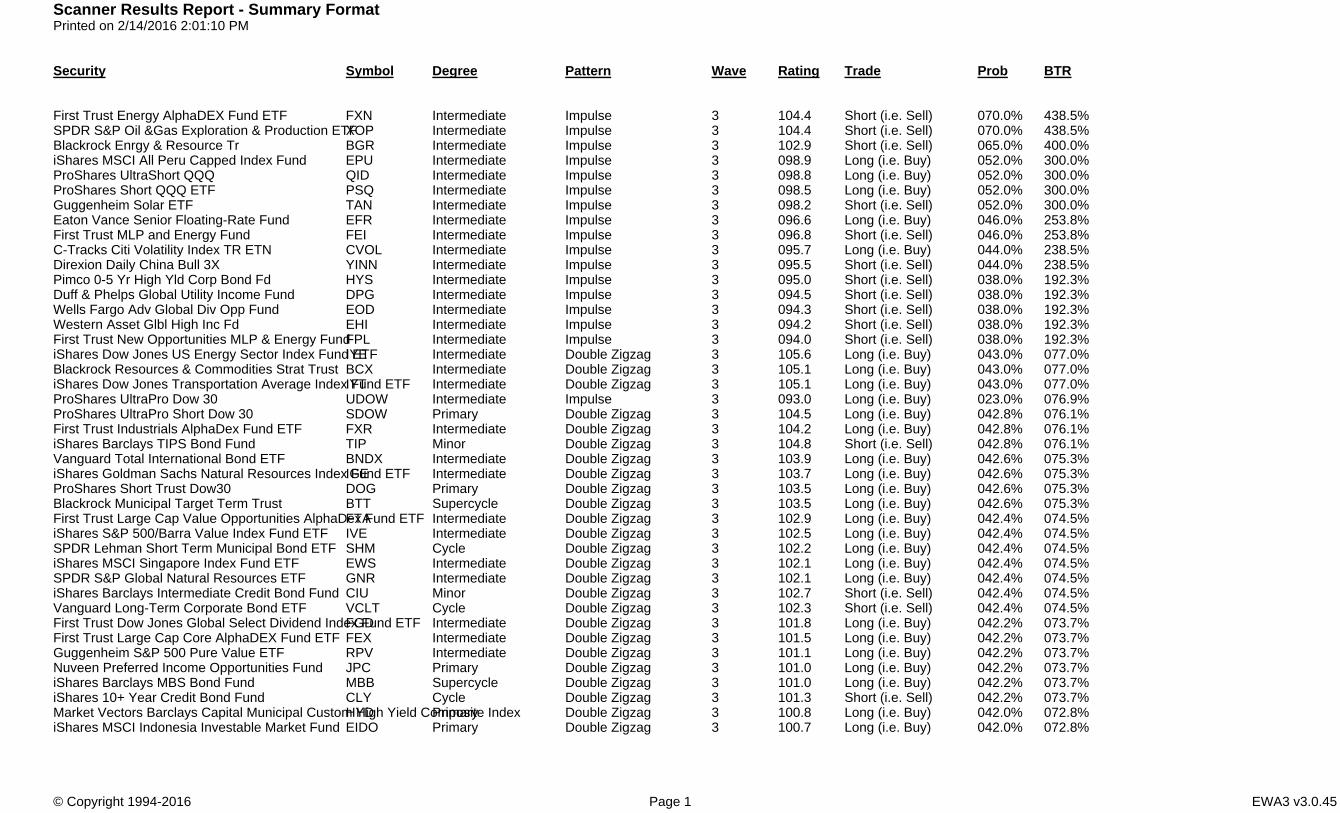
Scanner Results Report - Summary FormatPrinted on 2/14/2016 2:01:10 PM
Security Symbol Degree Pattern Wave Rating Trade Prob BTR
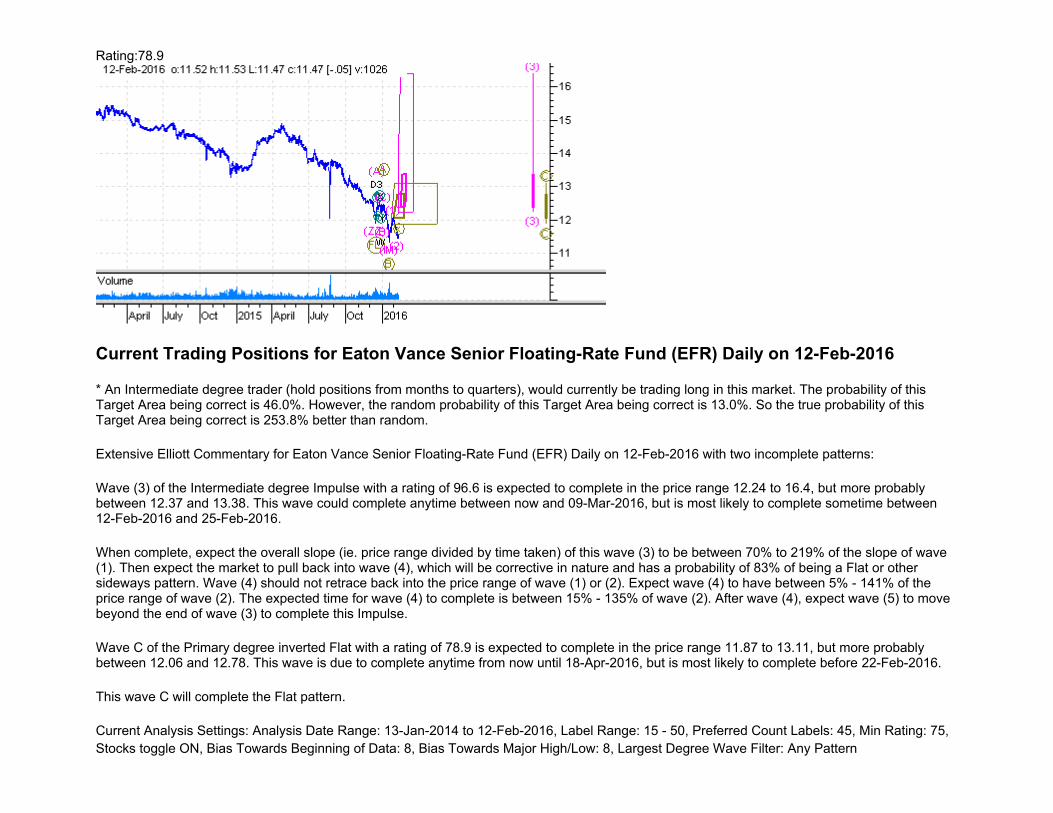
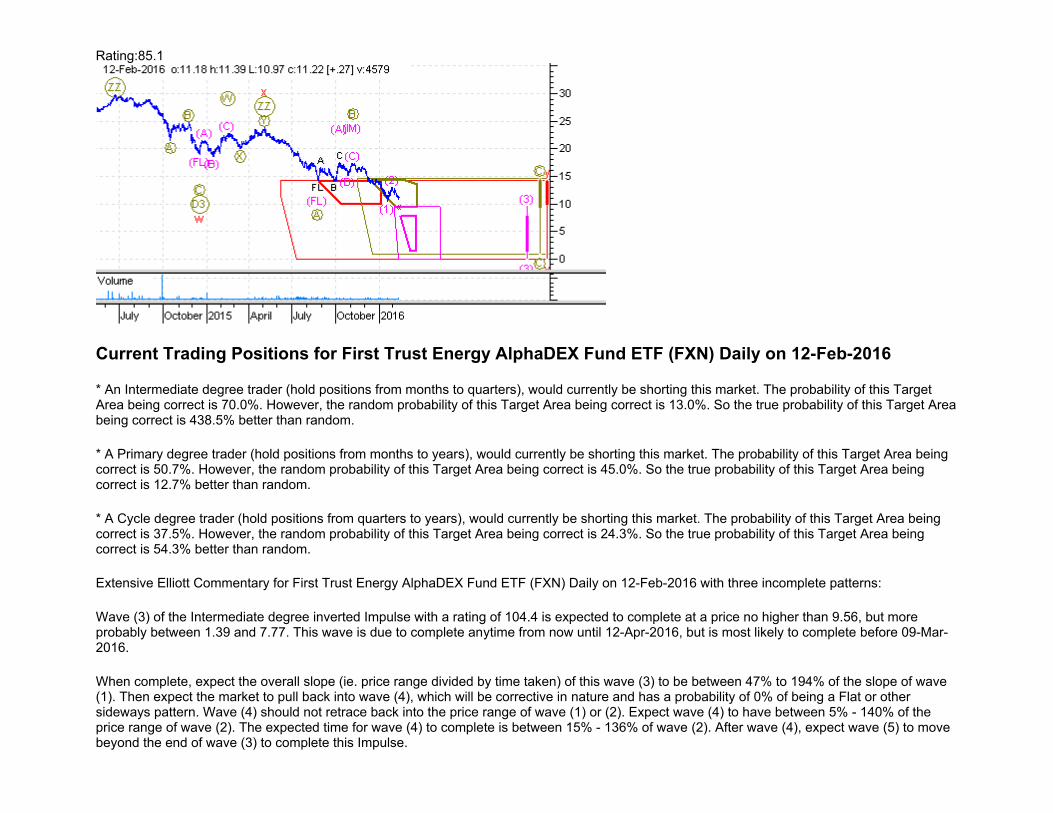
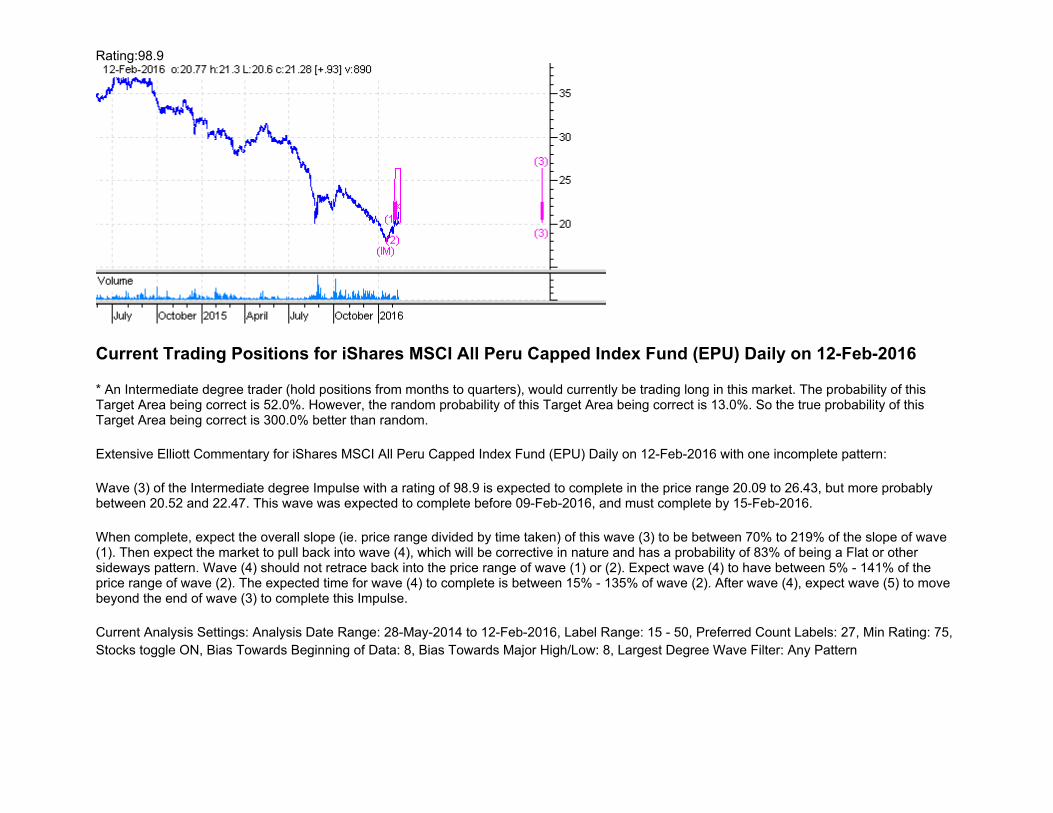
First Trust Energy AlphaDEX Fund ETF FXN Intermediate Impulse 3 104.4 Short (i.e. Sell) 070.0% 438.5%SPDR S&P Oil &Gas Exploration & Production ETFXOP Intermediate Impulse 3 104.4 Short (i.e. Sell) 070.0% 438.5%Blackrock Enrgy & Resource Tr BGR Intermediate Impulse 3 102.9 Short (i.e. Sell) 065.0% 400.0%iShares MSCI All Peru Capped Index Fund EPU Intermediate Impulse 3 098.9 Long (i.e. Buy) 052.0% 300.0%ProShares UltraShort QQQ QID Intermediate Impulse 3 098.8 Long (i.e. Buy) 052.0% 300.0%ProShares Short QQQ ETF PSQ Intermediate Impulse 3 098.5 Long (i.e. Buy) 052.0% 300.0%Guggenheim Solar ETF TAN Intermediate Impulse 3 098.2 Short (i.e. Sell) 052.0% 300.0%Eaton Vance Senior Floating-Rate Fund EFR Intermediate Impulse 3 096.6 Long (i.e. Buy) 046.0% 253.8%First Trust MLP and Energy Fund FEI Intermediate Impulse 3 096.8 Short (i.e. Sell) 046.0% 253.8%C-Tracks Citi Volatility Index TR ETN CVOL Intermediate Impulse 3 095.7 Long (i.e. Buy) 044.0% 238.5%Direxion Daily China Bull 3X YINN Intermediate Impulse 3 095.5 Short (i.e. Sell) 044.0% 238.5%Pimco 0-5 Yr High Yld Corp Bond Fd HYS Intermediate Impulse 3 095.0 Short (i.e. Sell) 038.0% 192.3%Duff & Phelps Global Utility Income Fund DPG Intermediate Impulse 3 094.5 Short (i.e. Sell) 038.0% 192.3%Wells Fargo Adv Global Div Opp Fund EOD Intermediate Impulse 3 094.3 Short (i.e. Sell) 038.0% 192.3%Western Asset Glbl High Inc Fd EHI Intermediate Impulse 3 094.2 Short (i.e. Sell) 038.0% 192.3%First Trust New Opportunities MLP & Energy FundFPL Intermediate Impulse 3 094.0 Short (i.e. Sell) 038.0% 192.3%iShares Dow Jones US Energy Sector Index Fund ETFIYE Intermediate Double Zigzag 3 105.6 Long (i.e. Buy) 043.0% 077.0%Blackrock Resources & Commodities Strat Trust BCX Intermediate Double Zigzag 3 105.1 Long (i.e. Buy) 043.0% 077.0%iShares Dow Jones Transportation Average Index Fund ETFIYT Intermediate Double Zigzag 3 105.1 Long (i.e. Buy) 043.0% 077.0%ProShares UltraPro Dow 30 UDOW Intermediate Impulse 3 093.0 Long (i.e. Buy) 023.0% 076.9%ProShares UltraPro Short Dow 30 SDOW Primary Double Zigzag 3 104.5 Long (i.e. Buy) 042.8% 076.1%First Trust Industrials AlphaDex Fund ETF FXR Intermediate Double Zigzag 3 104.2 Long (i.e. Buy) 042.8% 076.1%iShares Barclays TIPS Bond Fund TIP Minor Double Zigzag 3 104.8 Short (i.e. Sell) 042.8% 076.1%Vanguard Total International Bond ETF BNDX Intermediate Double Zigzag 3 103.9 Long (i.e. Buy) 042.6% 075.3%iShares Goldman Sachs Natural Resources Index Fund ETFIGE Intermediate Double Zigzag 3 103.7 Long (i.e. Buy) 042.6% 075.3%ProShares Short Trust Dow30 DOG Primary Double Zigzag 3 103.5 Long (i.e. Buy) 042.6% 075.3%Blackrock Municipal Target Term Trust BTT Supercycle Double Zigzag 3 103.5 Long (i.e. Buy) 042.6% 075.3%First Trust Large Cap Value Opportunities AlphaDex Fund ETFFTA Intermediate Double Zigzag 3 102.9 Long (i.e. Buy) 042.4% 074.5%iShares S&P 500/Barra Value Index Fund ETF IVE Intermediate Double Zigzag 3 102.5 Long (i.e. Buy) 042.4% 074.5%SPDR Lehman Short Term Municipal Bond ETF SHM Cycle Double Zigzag 3 102.2 Long (i.e. Buy) 042.4% 074.5%iShares MSCI Singapore Index Fund ETF EWS Intermediate Double Zigzag 3 102.1 Long (i.e. Buy) 042.4% 074.5%SPDR S&P Global Natural Resources ETF GNR Intermediate Double Zigzag 3 102.1 Long (i.e. Buy) 042.4% 074.5%iShares Barclays Intermediate Credit Bond Fund CIU Minor Double Zigzag 3 102.7 Short (i.e. Sell) 042.4% 074.5%Vanguard Long-Term Corporate Bond ETF VCLT Cycle Double Zigzag 3 102.3 Short (i.e. Sell) 042.4% 074.5%First Trust Dow Jones Global Select Dividend Index Fund ETFFGD Intermediate Double Zigzag 3 101.8 Long (i.e. Buy) 042.2% 073.7%First Trust Large Cap Core AlphaDEX Fund ETF FEX Intermediate Double Zigzag 3 101.5 Long (i.e. Buy) 042.2% 073.7%Guggenheim S&P 500 Pure Value ETF RPV Intermediate Double Zigzag 3 101.1 Long (i.e. Buy) 042.2% 073.7%Nuveen Preferred Income Opportunities Fund JPC Primary Double Zigzag 3 101.0 Long (i.e. Buy) 042.2% 073.7%iShares Barclays MBS Bond Fund MBB Supercycle Double Zigzag 3 101.0 Long (i.e. Buy) 042.2% 073.7%iShares 10+ Year Credit Bond Fund CLY Cycle Double Zigzag 3 101.3 Short (i.e. Sell) 042.2% 073.7%Market Vectors Barclays Capital Municipal Custom High Yield Composite IndexHYD Primary Double Zigzag 3 100.8 Long (i.e. Buy) 042.0% 072.8%iShares MSCI Indonesia Investable Market Fund EIDO Primary Double Zigzag 3 100.7 Long (i.e. Buy) 042.0% 072.8%
Scanner Results Report - Summary FormatPrinted on 2/14/2016 2:01:16 PM
Security Symbol Degree Pattern Wave Rating Trade Prob BTR
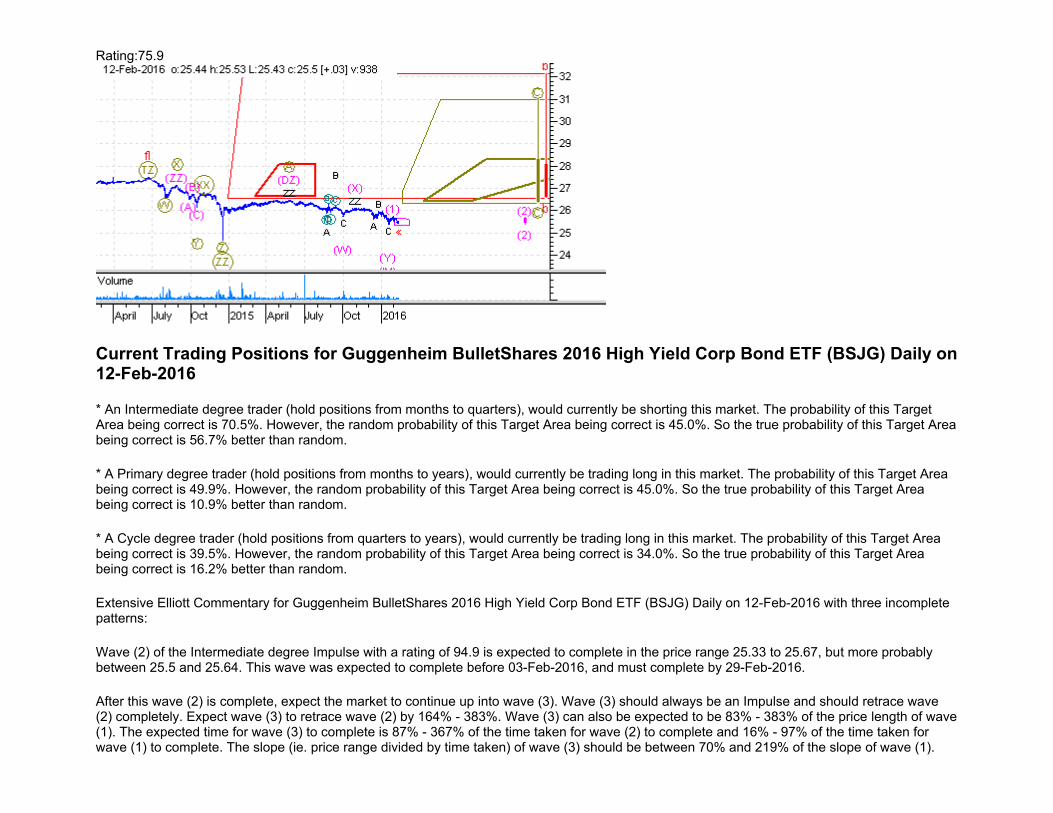
SPDR S&P Oil &Gas Exploration & Production ETFXOP Primary Zigzag 3 082.3 Short (i.e. Sell) 050.2% 011.6%Guggenheim BulletShares 2016 High Yield Corp Bond ETFBSJG Primary Zigzag 3 079.1 Long (i.e. Buy) 049.9% 010.9%First Trust New Opportunities MLP & Energy FundFPL Primary Zigzag 3 080.0 Short (i.e. Sell) 049.9% 010.9%Wells Fargo Adv Global Div Opp Fund EOD Primary Zigzag 3 079.4 Short (i.e. Sell) 049.9% 010.9%iShares Dow Jones US Regional Banks Index Fund ETFIAT Primary Ending Diagonal 4 095.1 Long (i.e. Buy) 089.0% 010.7%First Trust MLP and Energy Fund FEI Primary Zigzag 3 078.0 Short (i.e. Sell) 049.8% 010.7%SPDR KBW Insurance ETF KIE Primary Ending Diagonal 4 094.0 Long (i.e. Buy) 088.8% 010.4%SPDR Wells Fargo Preferred Stock ETF PSK Intermediate Zigzag 3 077.9 Short (i.e. Sell) 049.7% 010.4%Direxion Daily Russia Bull 3X RUSL Cycle Zigzag 3 077.7 Short (i.e. Sell) 049.7% 010.4%iShares MSCI EMU Index Fund ETF EZU Primary Zigzag 3 077.5 Short (i.e. Sell) 049.7% 010.4%iShares MSCI Turkey Investable Market Index Fund ETFTUR Cycle Zigzag 3 077.2 Short (i.e. Sell) 049.7% 010.4%Blackrock Cap And Inc Strat Fd CII Minor Zigzag 3 077.2 Short (i.e. Sell) 049.7% 010.4%iShares Floating Rate Note Fund FLOT Primary Ending Diagonal 4 093.5 Long (i.e. Buy) 088.6% 010.2%SPDR S&P Oil & Gas Equipment & Services ETFXES Cycle Zigzag 3 075.8 Short (i.e. Sell) 049.5% 010.0%ClearBridge Energy MLP Total Return Fund Inc. CTR Cycle Zigzag 3 075.3 Short (i.e. Sell) 049.5% 010.0%Vanguard Short-Term Government VGSH Primary Zigzag 3 075.1 Short (i.e. Sell) 049.5% 010.0%iShares MSCI Turkey Investable Market Index Fund ETFTUR Primary Ending Diagonal 4 090.9 Long (i.e. Buy) 088.0% 009.5%First Trust ISE Cloud Computing Index Fund SKYY Primary Ending Diagonal 4 088.6 Long (i.e. Buy) 087.6% 009.0%Western Asset Hi Inc Opp Fd HIO Cycle Ending Diagonal 4 088.5 Long (i.e. Buy) 087.6% 009.0%Guggenheim Multi-Asset Income ETF CVY Cycle Ending Diagonal 4 087.9 Long (i.e. Buy) 087.4% 008.7%iShares Dow Jones EPAC Select Dividend Index Fund ETFIDV Cycle Ending Diagonal 4 086.5 Long (i.e. Buy) 087.2% 008.5%iShares MSCI Pacific ex-Japan Index Fund ETF EPP Cycle Ending Diagonal 4 084.7 Long (i.e. Buy) 086.8% 008.0%SPDR S&P Retail ETF XRT Cycle Ending Diagonal 4 083.6 Long (i.e. Buy) 086.6% 007.7%iShares MSCI China Index Fund MCHI Cycle Ending Diagonal 4 083.3 Long (i.e. Buy) 086.6% 007.7%First Trust Consumer Staples AlphaDEX Fund ETFFXG Minor Impulse 3 089.3 Short (i.e. Sell) 014.0% 007.7%Brookfield Global Listed Infrastructure Fund INF Cycle Impulse 3 082.5 Short (i.e. Sell) 014.0% 007.7%Guggenheim Solar ETF TAN Primary Impulse 3 081.8 Short (i.e. Sell) 014.0% 007.7%ClearBridge Energy MLP Total Return Fund Inc. CTR Primary Impulse 3 081.3 Short (i.e. Sell) 014.0% 007.7%Direxion Daily China Bull 3X YINN Primary Impulse 3 079.2 Short (i.e. Sell) 014.0% 007.7%Duff & Phelps Global Utility Income Fund DPG Cycle Impulse 3 078.4 Short (i.e. Sell) 014.0% 007.7%Duff & Phelps Global Utility Income Fund DPG Primary Impulse 3 078.2 Short (i.e. Sell) 014.0% 007.7%Pimco 0-5 Yr High Yld Corp Bond Fd HYS Primary Impulse 3 075.3 Short (i.e. Sell) 014.0% 007.7%Pimco 0-5 Yr High Yld Corp Bond Fd HYS Cycle Impulse 3 075.2 Short (i.e. Sell) 014.0% 007.7%iShares MSCI USA Quality Factor ETF QUAL Minor Double 3 2 091.5 Long (i.e. Buy) 056.9% 007.4%iShares S&P Moderate Allocation Fund AOM Minor Double 3 2 091.2 Long (i.e. Buy) 056.9% 007.4%iShares MSCI All Country Asia ex Japan Index AAXJ Cycle Ending Diagonal 4 081.1 Long (i.e. Buy) 086.2% 007.2%SPDR Barclays Capital Short Term Corp Bond SCPB Cycle Double 3 2 089.3 Long (i.e. Buy) 055.9% 005.5%SPDRs Select Sector Consumer Discretionary ETFXLY Primary Double 3 2 089.3 Long (i.e. Buy) 055.9% 005.5%Schwab US Small-Cap ETF SCHA Intermediate Double 3 2 088.8 Short (i.e. Sell) 055.8% 005.3%United States Oil Fund LP USO Intermediate Double 3 2 087.6 Long (i.e. Buy) 055.7% 005.1%First Trust Technology AlphaDex Fund ETF FXL Cycle Double 3 2 087.4 Long (i.e. Buy) 055.7% 005.1%iShares S&P 500 Index Fund ETF IVV Minor Double 3 2 086.9 Long (i.e. Buy) 055.6% 004.9%
Scanner Results Report - Summary FormatPrinted on 2/14/2016 2:01:16 PM
Security Symbol Degree Pattern Wave Rating Trade Prob BTR
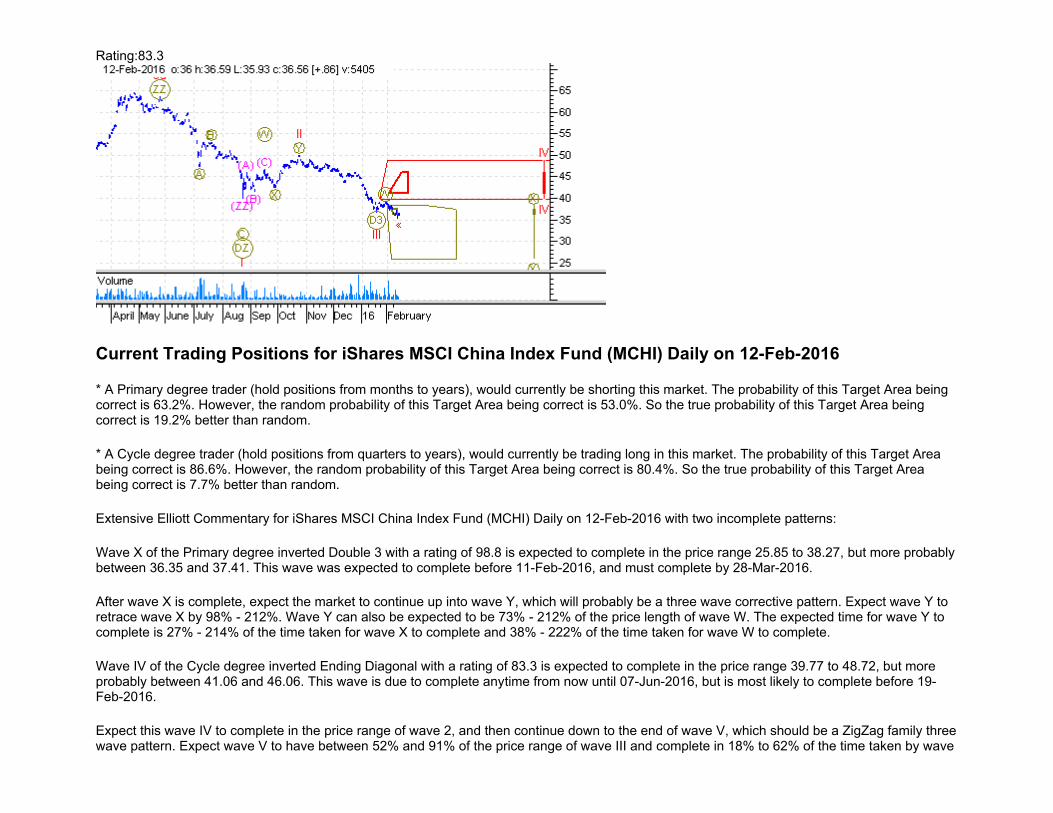
iShares S&P SmallCap 600/Barra Value Index Fund ETFIJS Minor Double 3 2 086.1 Long (i.e. Buy) 055.6% 004.9%Vanguard Information Tech Etf VGT Minor Double 3 2 085.8 Long (i.e. Buy) 055.6% 004.9%Vanguard Mega Cap 300 Growth Index ETF MGK Minor Double 3 2 085.8 Long (i.e. Buy) 055.6% 004.9%Vanguard Small Cap Value ETF VBR Minor Double 3 2 085.6 Long (i.e. Buy) 055.6% 004.9%iShares Dow Jones US Home Construction Index Fund ETFITB Primary Double 3 2 085.1 Long (i.e. Buy) 055.6% 004.9%iShares MSCI Japan Index Fund ETF EWJ Cycle Double 3 2 084.6 Long (i.e. Buy) 055.5% 004.7%iShares S&P SmallCap 600 Index Fund ETF IJR Minor Double 3 2 084.4 Long (i.e. Buy) 055.5% 004.7%iShares S&P GSTI Networking Index Fund ETF IGN Primary Double 3 2 084.0 Long (i.e. Buy) 055.5% 004.7%Asa Gold and Precious Metals Limited ASA Primary Double 3 2 083.7 Short (i.e. Sell) 055.4% 004.5%iShares Iboxx $ Investop Corp Bd LQD Primary Double 3 2 083.0 Short (i.e. Sell) 055.4% 004.5%Vanguard Total International Bond ETF BNDX Cycle Double 3 2 081.2 Short (i.e. Sell) 055.2% 004.2%iShares JPMorgan USD Emerging Markets Bond Fund ETFEMB Cycle Double 3 2 077.4 Long (i.e. Buy) 054.8% 003.4%iShares Dow Jones US Basic Materials Index Fund ETFIYM Cycle Double 3 2 077.1 Long (i.e. Buy) 054.8% 003.4%Western Asset High Yield Defined Opportunity FundHYI Cycle Double 3 2 076.5 Long (i.e. Buy) 054.7% 003.2%db-X MSCI Emerging Mkts Curr-Hedged Equity FdDBEM Cycle Double 3 2 076.3 Long (i.e. Buy) 054.7% 003.2%
Current Trading Positions for Adams Diversified Equity Fund Inc (ADX) Daily on 12-Feb-2016
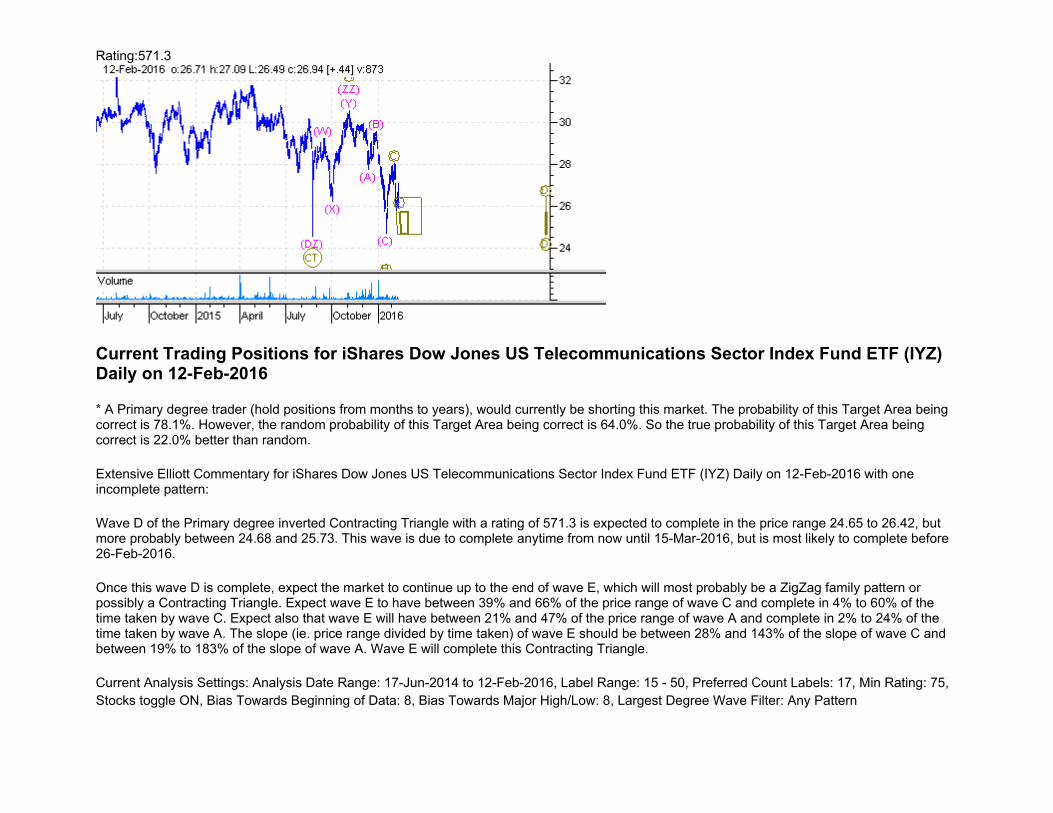
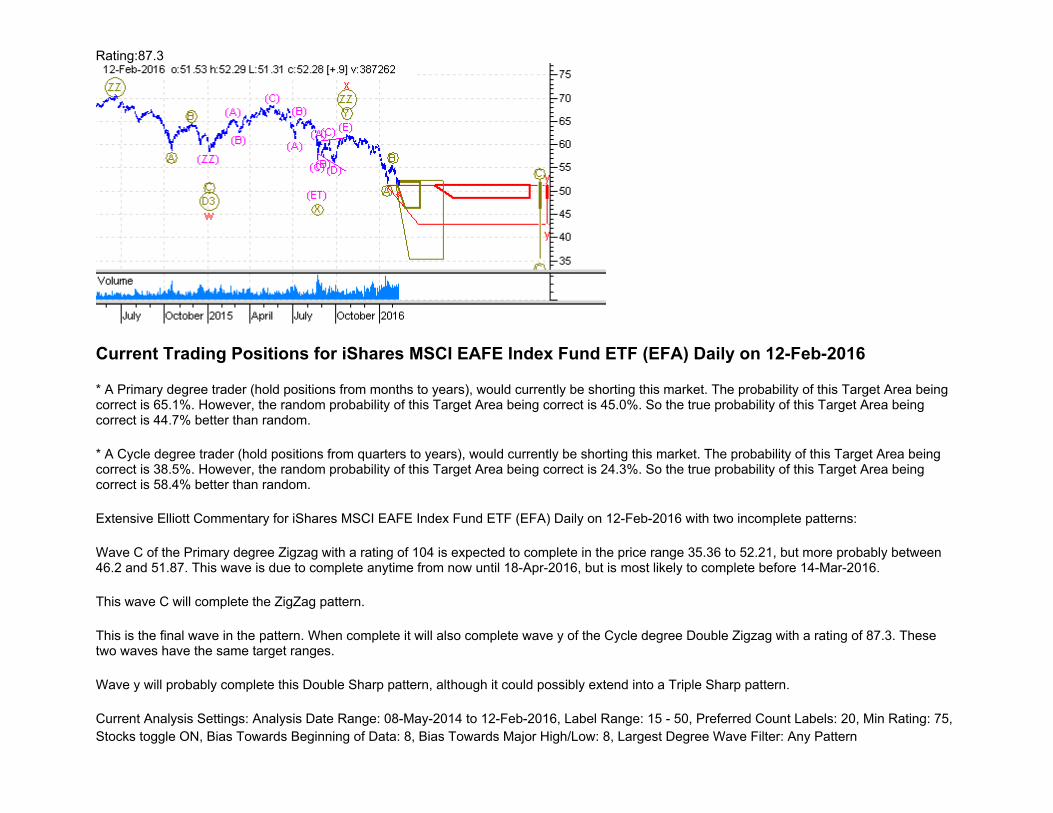
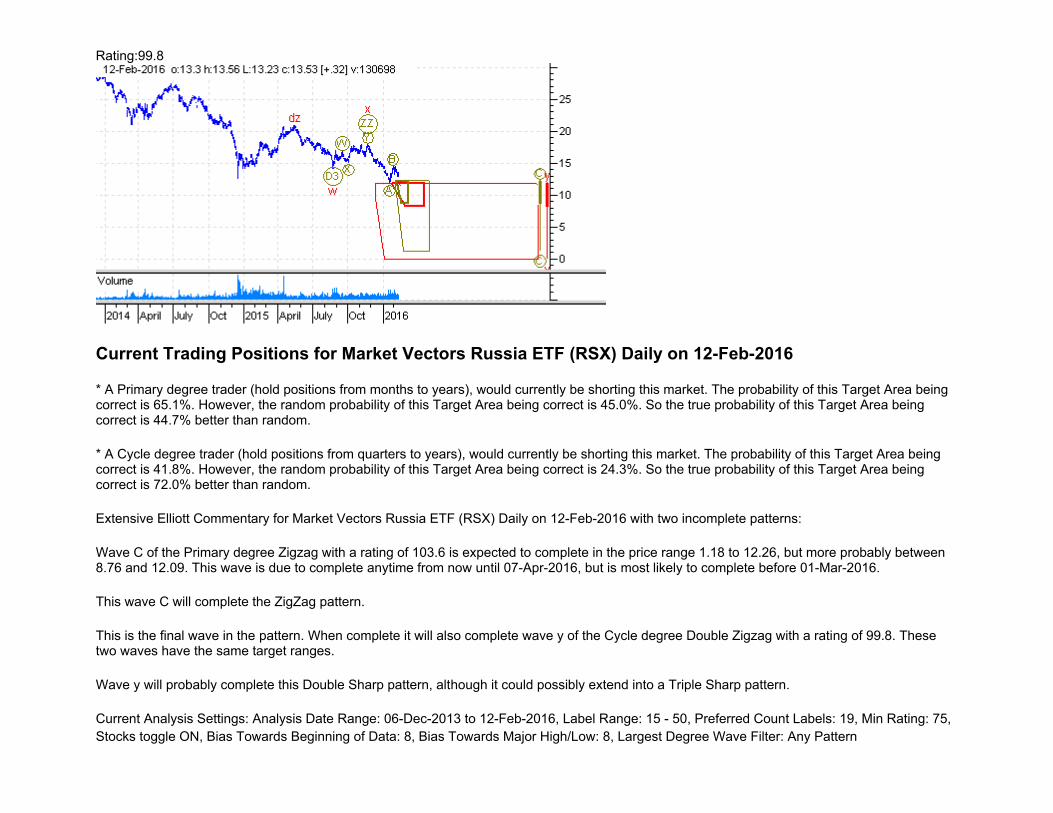
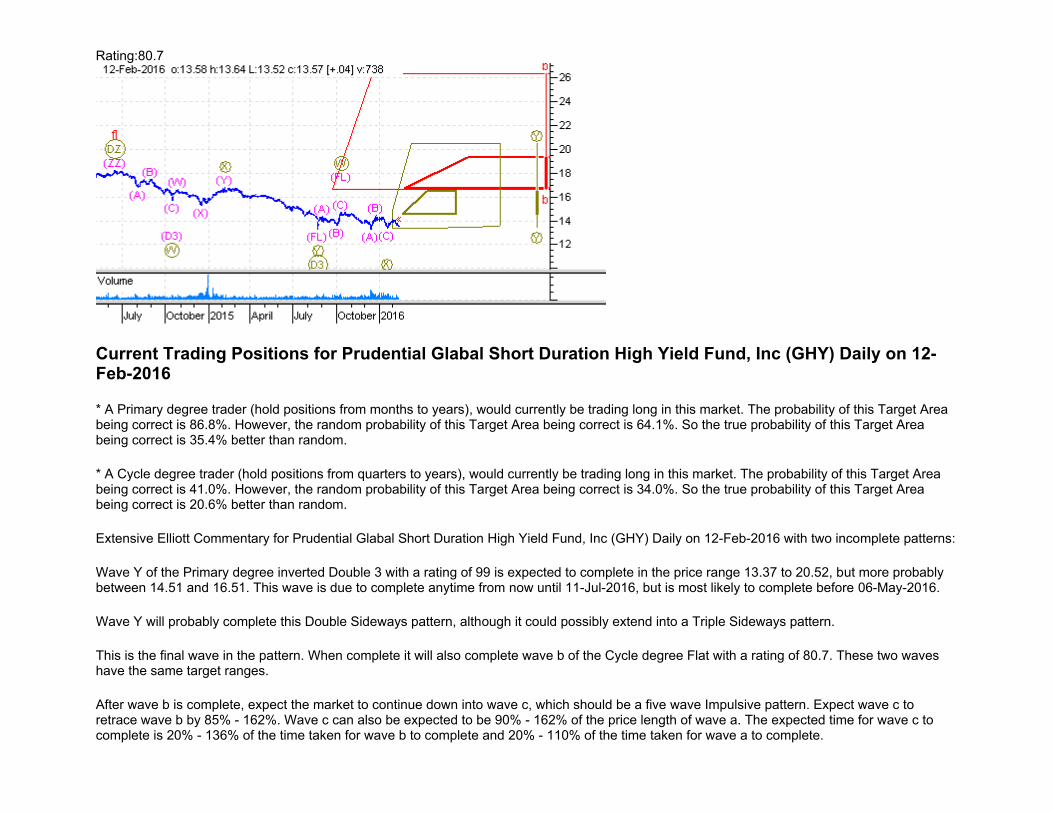
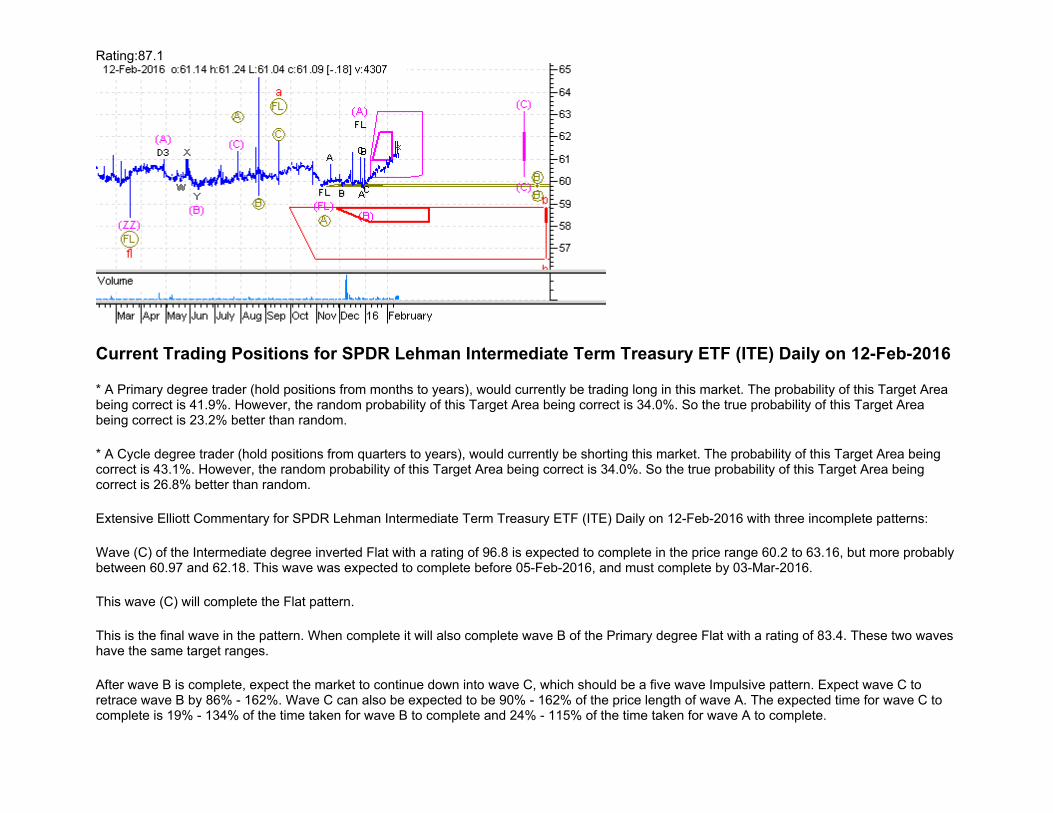
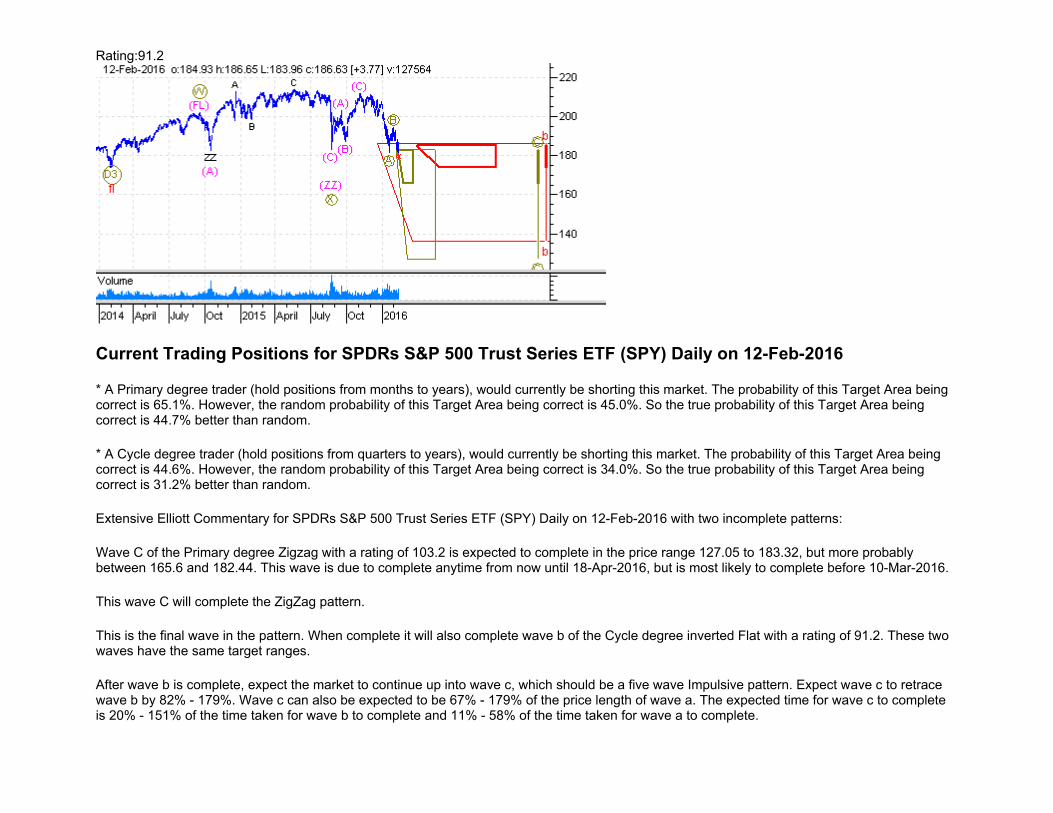
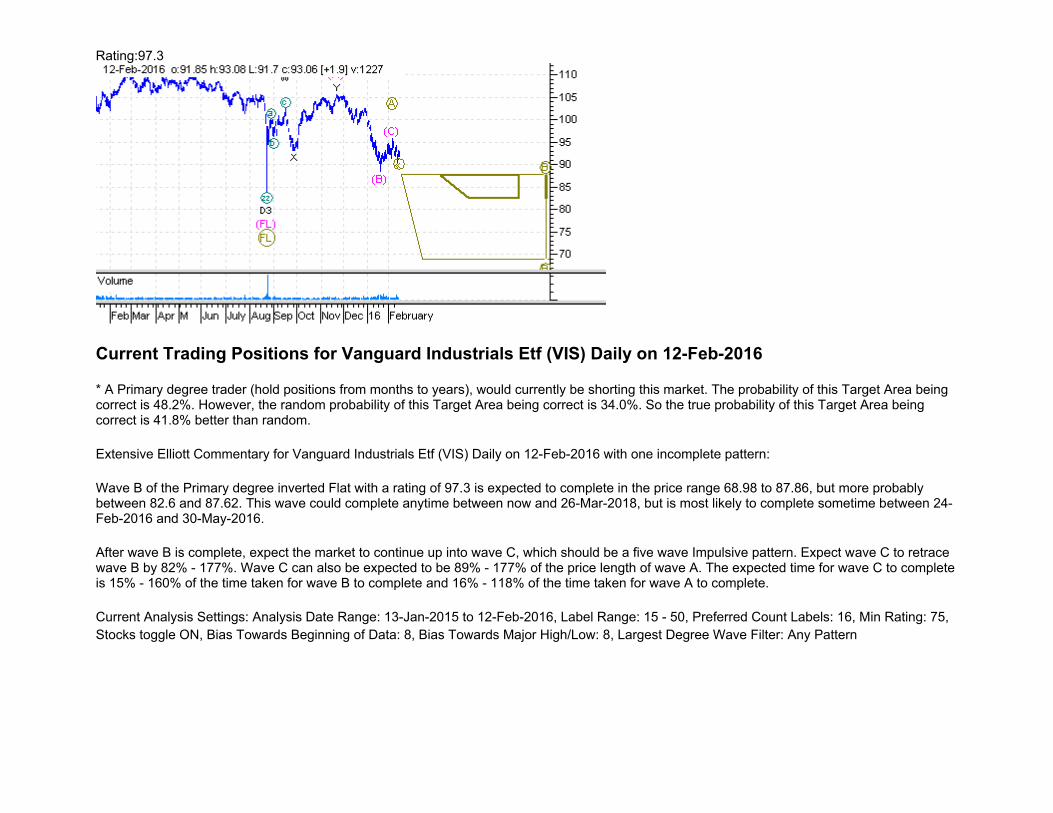
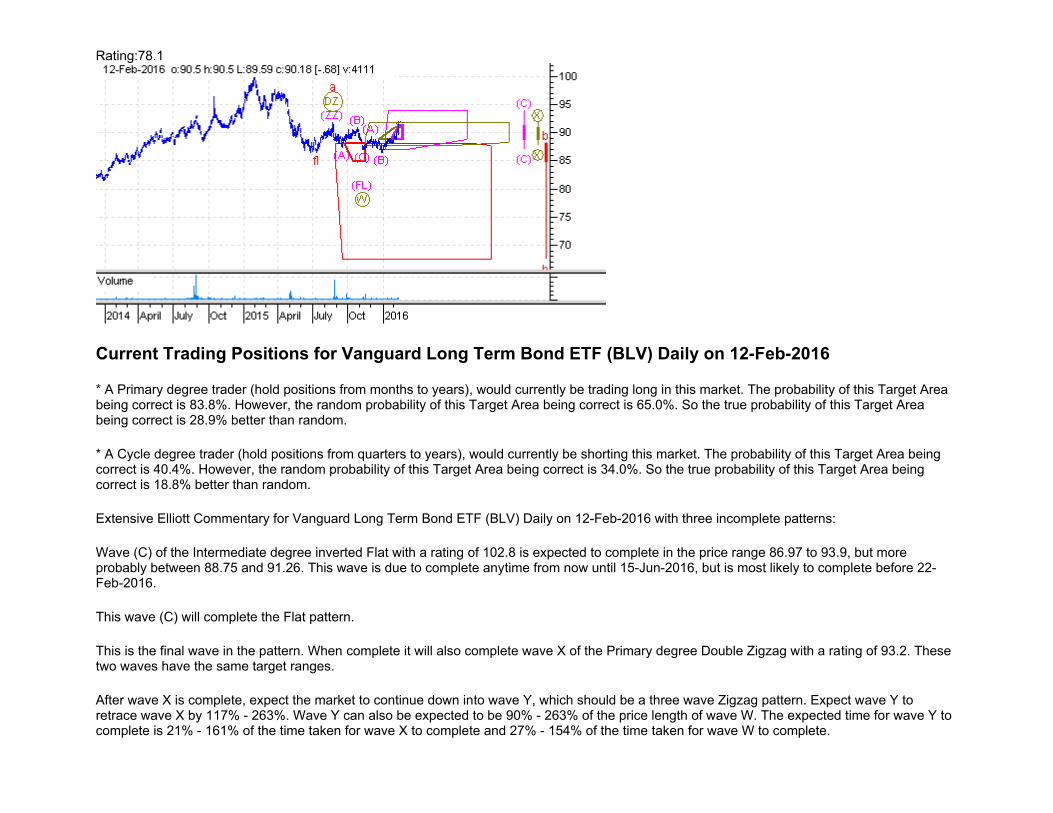
* A Primary degree trader (hold positions from months to years), would currently be shorting this market. The probability of this Target Area being correct is 65.1%. However, the random probability of this Target Area being correct is 45.0%. So the true probability of this Target Area being correct is 44.7% better than random.
* A Cycle degree trader (hold positions from quarters to years), would currently be shorting this market. The probability of this Target Area being correct is 40.0%. However, the random probability of this Target Area being correct is 24.3%. So the true probability of this Target Area being correct is 64.6% better than random.
Extensive Elliott Commentary for Adams Diversified Equity Fund Inc (ADX) Daily on 12-Feb-2016 with two incomplete patterns:
Wave C of the Primary degree Zigzag with a rating of 103.7 is expected to complete in the price range 6.99 to 11.11, but more probably between 9.41 and 10.91. This wave is due to complete anytime from now until 21-Apr-2016, but is most likely to complete before 26-Feb-2016.
This wave C will complete the ZigZag pattern.
This is the final wave in the pattern. When complete it will also complete wave y of the Cycle degree Double Zigzag with a rating of 90.1. These two waves have the same target ranges.
Wave y will probably complete this Double Sharp pattern, although it could possibly extend into a Triple Sharp pattern.
Current Analysis Settings: Analysis Date Range: 08-Oct-2014 to 12-Feb-2016, Label Range: 15 - 50, Preferred Count Labels: 20, Min Rating: 75, Stocks toggle ON, Bias Towards Beginning of Data: 8, Bias Towards Major High/Low: 8, Largest Degree Wave Filter: Any Pattern
Rating:86.2
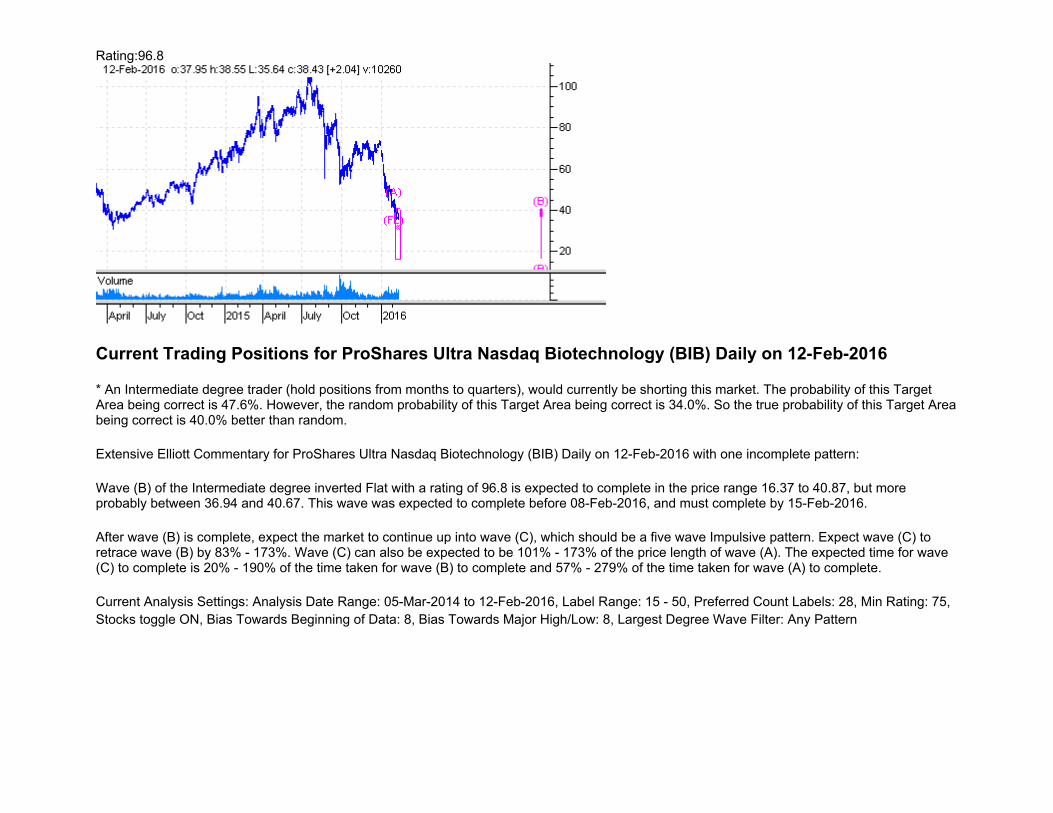
Current Trading Positions for AdvisorShares Active Bear ETF (HDGE) Daily on 12-Feb-2016
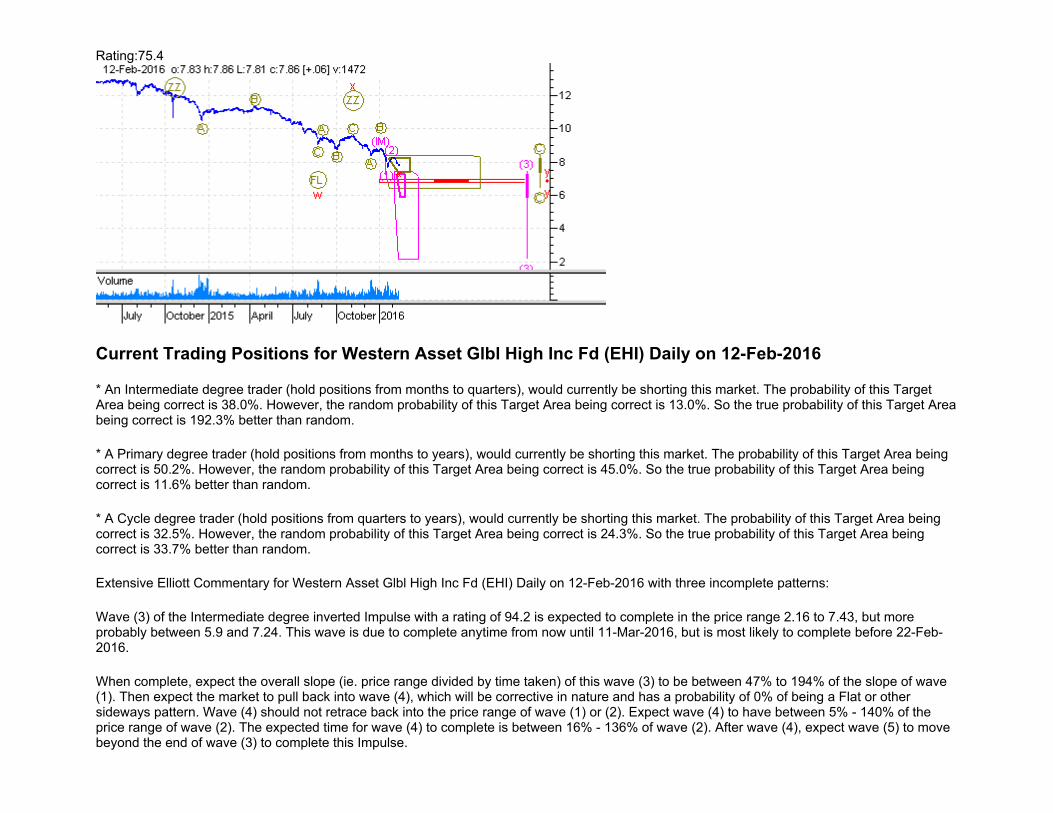
* An Intermediate degree trader (hold positions from months to quarters), would currently be trading long in this market. The probability of this Target Area being correct is 48.8%. However, the random probability of this Target Area being correct is 34.0%. So the true probability of this Target Area being correct is 43.5% better than random.
* A Primary degree trader (hold positions from months to years), would currently be shorting this market. The probability of this Target Area being correct is 41.6%. However, the random probability of this Target Area being correct is 34.0%. So the true probability of this Target Area being correct is 22.4% better than random.
* A Cycle degree trader (hold positions from quarters to years), would currently be trading long in this market. The probability of this Target Area being correct is 42.8%. However, the random probability of this Target Area being correct is 34.0%. So the true probability of this Target Area being correct is 25.9% better than random.
Extensive Elliott Commentary for AdvisorShares Active Bear ETF (HDGE) Daily on 12-Feb-2016 with three incomplete patterns:
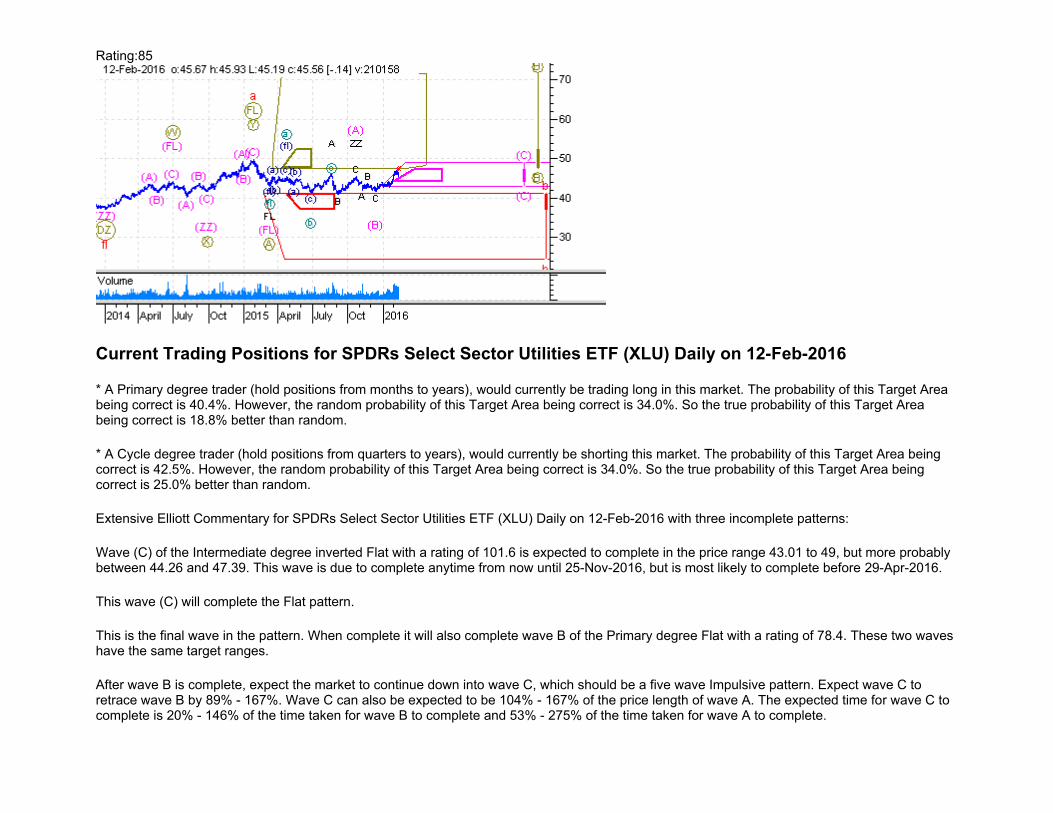
Wave (B) of the Intermediate degree Flat with a rating of 98.9 is expected to complete in the price range 12.43 to 15.79, but more probably between 12.45 and 13.09. This wave is due to complete anytime from now until 23-May-2016, but is most likely to complete before 07-Mar-2016.
After wave (B) is complete, expect the market to continue down into wave (C), which should be a five wave Impulsive pattern. Expect wave (C) to retrace wave (B) by 89% - 167%. Wave (C) can also be expected to be 104% - 167% of the price length of wave (A). The expected time for wave (C) to complete is 20% - 146% of the time taken for wave (B) to complete and 53% - 275% of the time taken for wave (A) to complete.
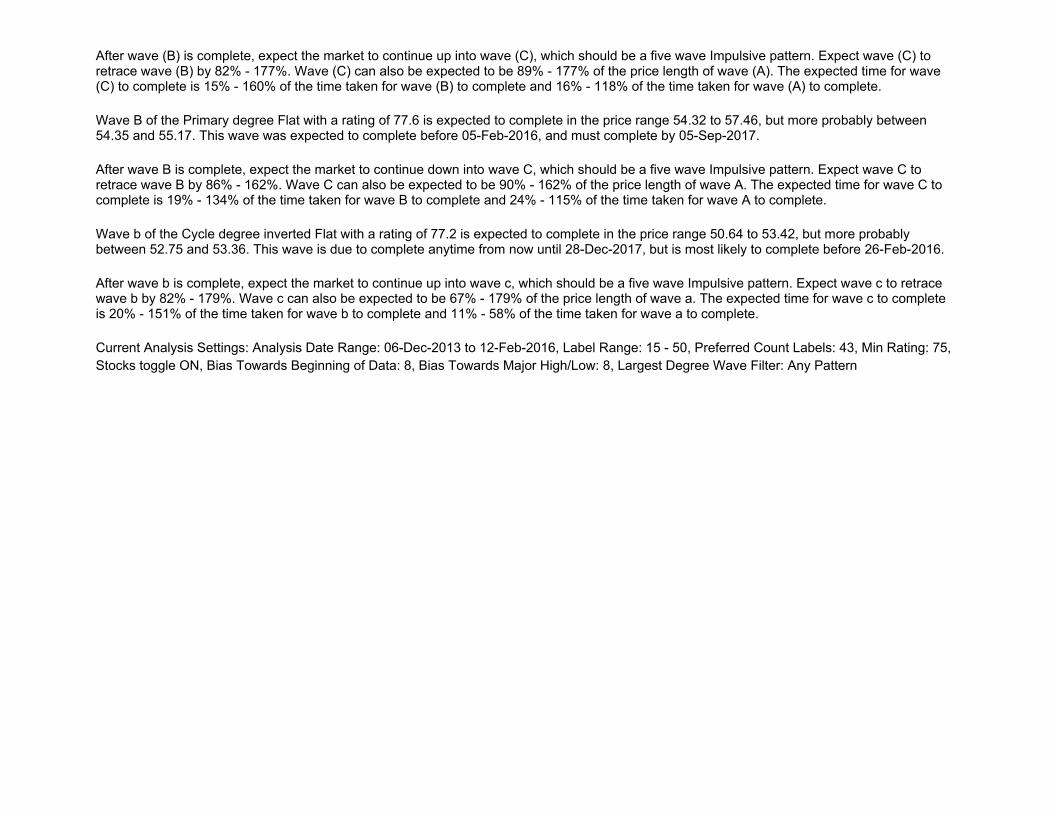
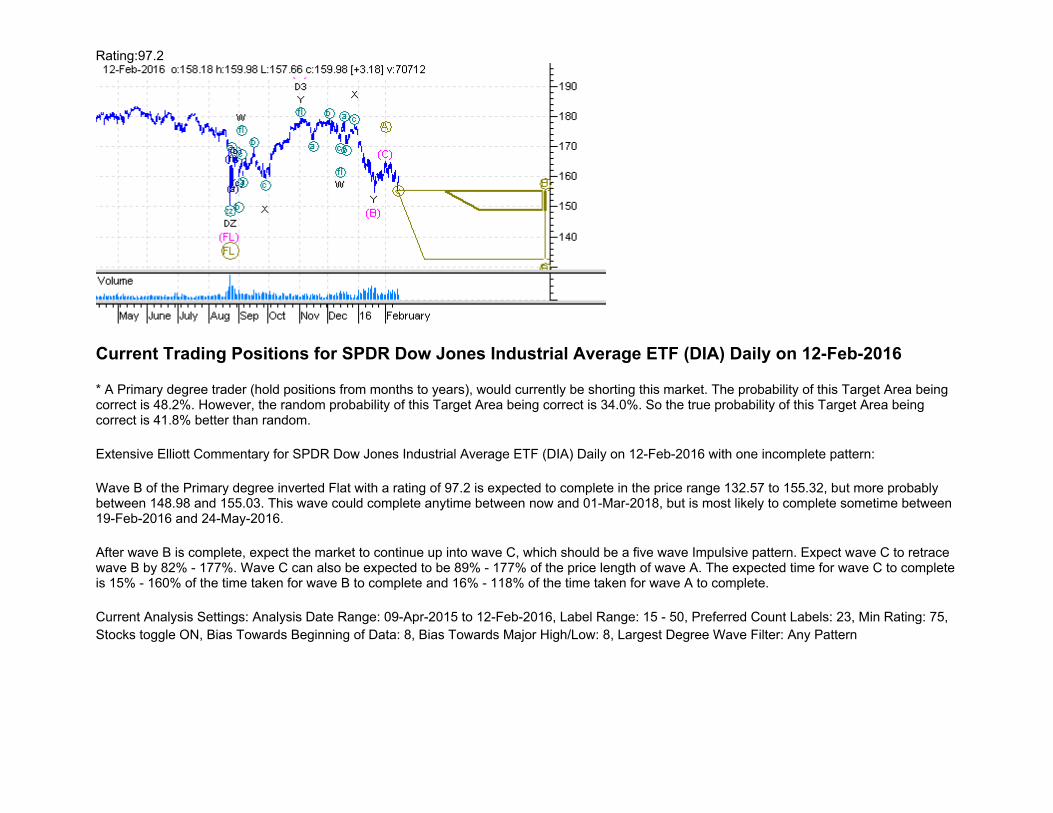
Wave B of the Primary degree inverted Flat with a rating of 82.8 is expected to complete in the price range 7.31 to 11.12, but more probably between 10.06 and 11.07. This wave could complete anytime between now and 26-Oct-2018, but is most likely to complete sometime between 18-Feb-2016 and 21-Jun-2016.
After wave B is complete, expect the market to continue up into wave C, which should be a five wave Impulsive pattern. Expect wave C to retrace wave B by 82% - 177%. Wave C can also be expected to be 89% - 177% of the price length of wave A. The expected time for wave C to complete is 15% - 160% of the time taken for wave B to complete and 16% - 118% of the time taken for wave A to complete.
Wave b of the Cycle degree Flat with a rating of 86.2 is expected to complete in the price range 12.64 to 19.2, but more probably between 12.71 and 14.44. This wave is due to complete anytime from now until 08-Dec-2023, but is most likely to complete before 17-Oct-2016.
After wave b is complete, expect the market to continue down into wave c, which should be a five wave Impulsive pattern. Expect wave c to retrace wave b by 85% - 162%. Wave c can also be expected to be 90% - 162% of the price length of wave a. The expected time for wave c to complete is 20% - 136% of the time taken for wave b to complete and 20% - 110% of the time taken for wave a to complete.
Current Analysis Settings: Analysis Date Range: 23-Dec-2013 to 12-Feb-2016, Label Range: 15 - 50, Preferred Count Labels: 23, Min Rating: 75, Stocks toggle ON, Bias Towards Beginning of Data: 8, Bias Towards Major High/Low: 8, Largest Degree Wave Filter: Any Pattern
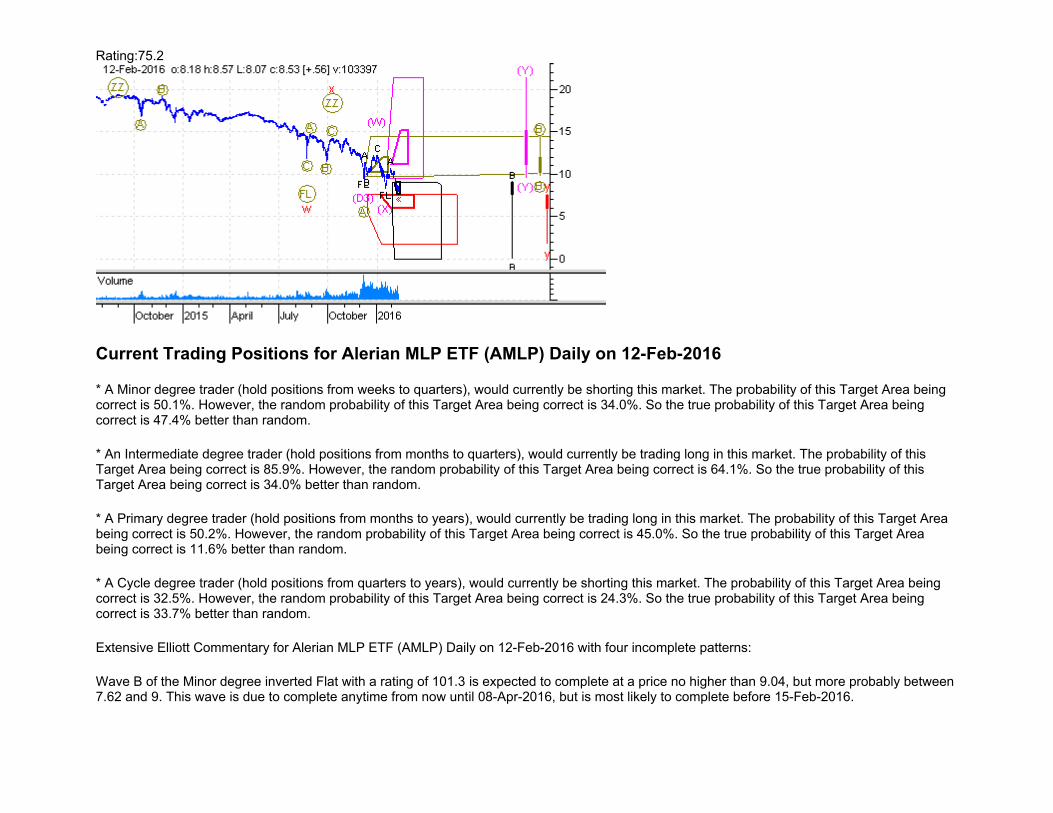
Rating:75.2
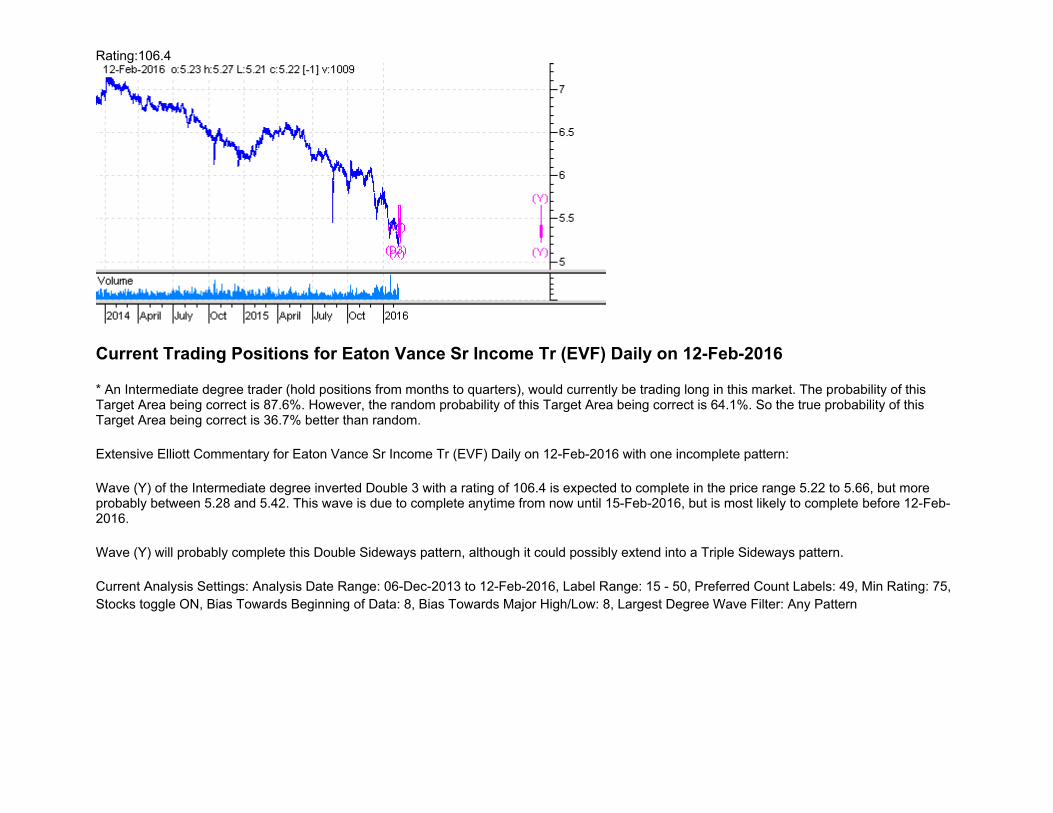
Current Trading Positions for Alerian MLP ETF (AMLP) Daily on 12-Feb-2016
* A Minor degree trader (hold positions from weeks to quarters), would currently be shorting this market. The probability of this Target Area being correct is 50.1%. However, the random probability of this Target Area being correct is 34.0%. So the true probability of this Target Area being correct is 47.4% better than random.
* An Intermediate degree trader (hold positions from months to quarters), would currently be trading long in this market. The probability of this Target Area being correct is 85.9%. However, the random probability of this Target Area being correct is 64.1%. So the true probability of this Target Area being correct is 34.0% better than random.
* A Primary degree trader (hold positions from months to years), would currently be trading long in this market. The probability of this Target Area being correct is 50.2%. However, the random probability of this Target Area being correct is 45.0%. So the true probability of this Target Area being correct is 11.6% better than random.
* A Cycle degree trader (hold positions from quarters to years), would currently be shorting this market. The probability of this Target Area being correct is 32.5%. However, the random probability of this Target Area being correct is 24.3%. So the true probability of this Target Area being correct is 33.7% better than random.
Extensive Elliott Commentary for Alerian MLP ETF (AMLP) Daily on 12-Feb-2016 with four incomplete patterns:
Wave B of the Minor degree inverted Flat with a rating of 101.3 is expected to complete at a price no higher than 9.04, but more probably between 7.62 and 9. This wave is due to complete anytime from now until 08-Apr-2016, but is most likely to complete before 15-Feb-2016.
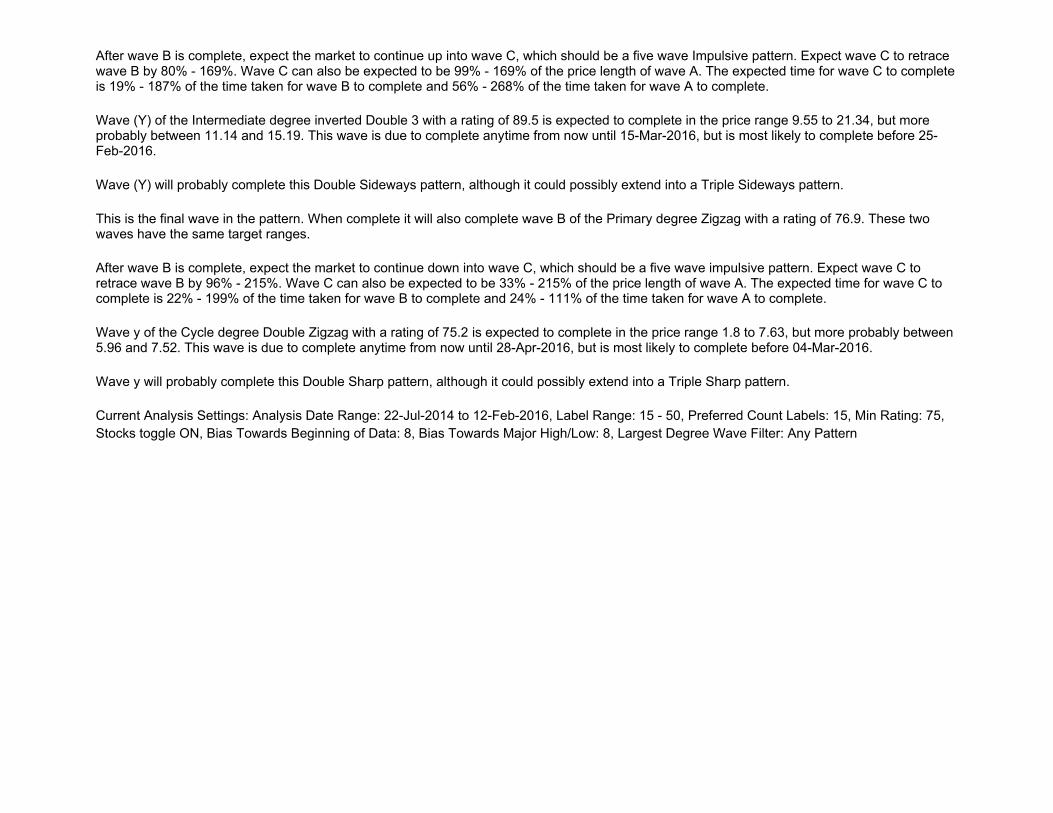
After wave B is complete, expect the market to continue up into wave C, which should be a five wave Impulsive pattern. Expect wave C to retrace wave B by 80% - 169%. Wave C can also be expected to be 99% - 169% of the price length of wave A. The expected time for wave C to complete is 19% - 187% of the time taken for wave B to complete and 56% - 268% of the time taken for wave A to complete.
Wave (Y) of the Intermediate degree inverted Double 3 with a rating of 89.5 is expected to complete in the price range 9.55 to 21.34, but more probably between 11.14 and 15.19. This wave is due to complete anytime from now until 15-Mar-2016, but is most likely to complete before 25-Feb-2016.
Wave (Y) will probably complete this Double Sideways pattern, although it could possibly extend into a Triple Sideways pattern.
This is the final wave in the pattern. When complete it will also complete wave B of the Primary degree Zigzag with a rating of 76.9. These two waves have the same target ranges.
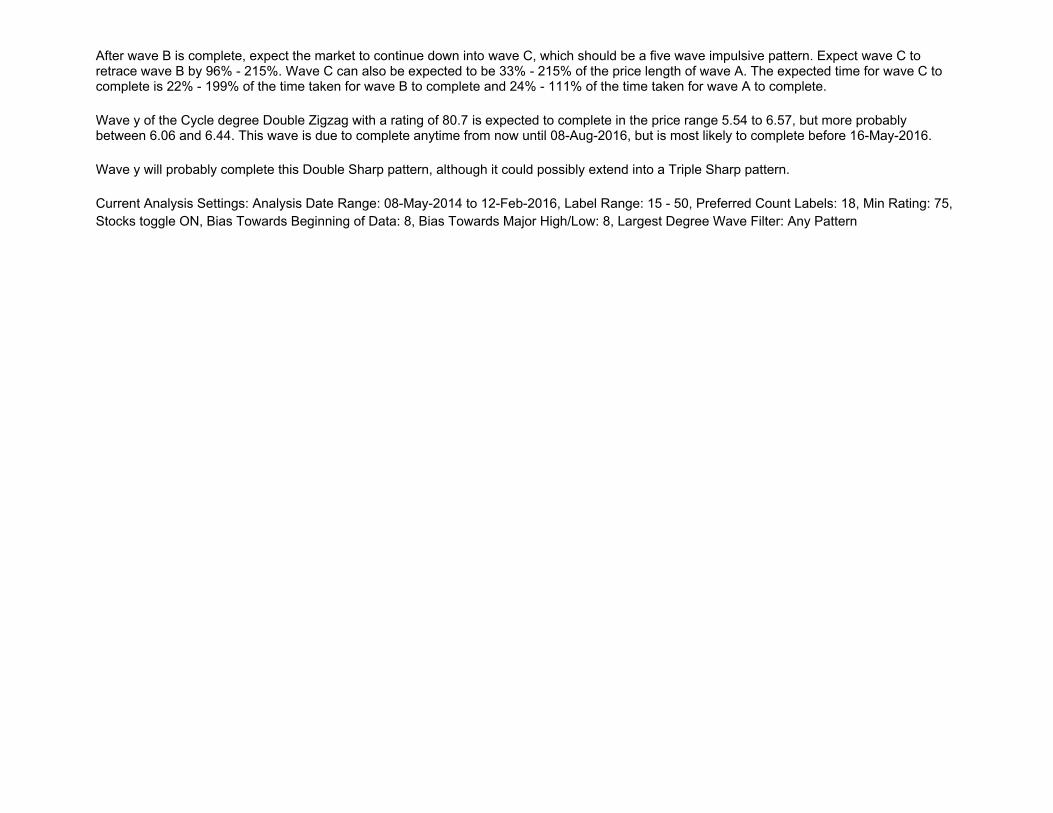
After wave B is complete, expect the market to continue down into wave C, which should be a five wave impulsive pattern. Expect wave C to retrace wave B by 96% - 215%. Wave C can also be expected to be 33% - 215% of the price length of wave A. The expected time for wave C to complete is 22% - 199% of the time taken for wave B to complete and 24% - 111% of the time taken for wave A to complete.
Wave y of the Cycle degree Double Zigzag with a rating of 75.2 is expected to complete in the price range 1.8 to 7.63, but more probably between 5.96 and 7.52. This wave is due to complete anytime from now until 28-Apr-2016, but is most likely to complete before 04-Mar-2016.
Wave y will probably complete this Double Sharp pattern, although it could possibly extend into a Triple Sharp pattern.
Current Analysis Settings: Analysis Date Range: 22-Jul-2014 to 12-Feb-2016, Label Range: 15 - 50, Preferred Count Labels: 15, Min Rating: 75, Stocks toggle ON, Bias Towards Beginning of Data: 8, Bias Towards Major High/Low: 8, Largest Degree Wave Filter: Any Pattern
Rating:89.8
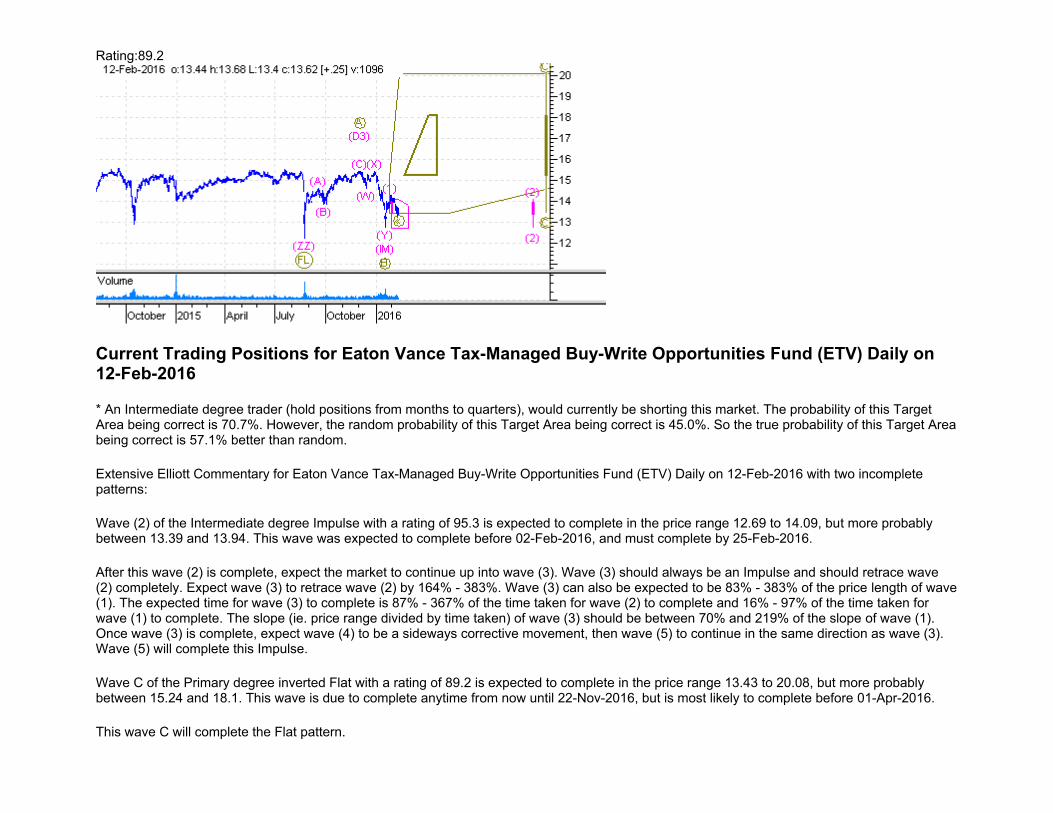
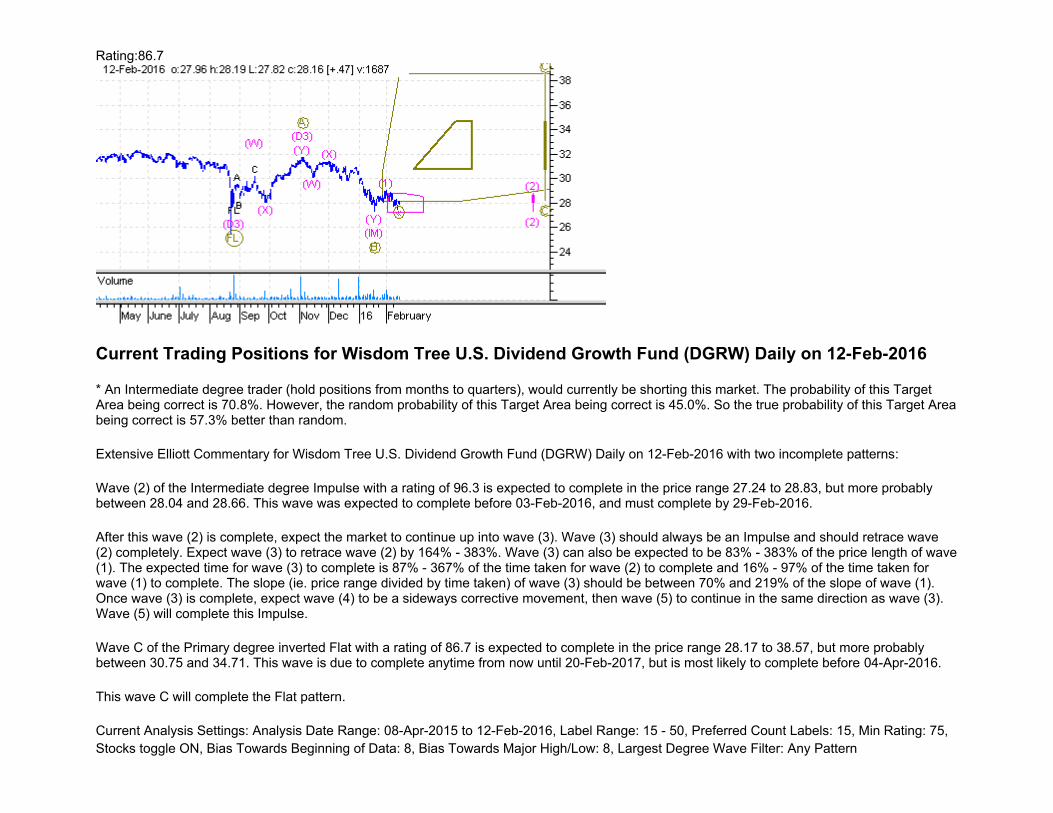
Current Trading Positions for ALPS Sector Dividend Dogs ETF (SDOG) Daily on 12-Feb-2016
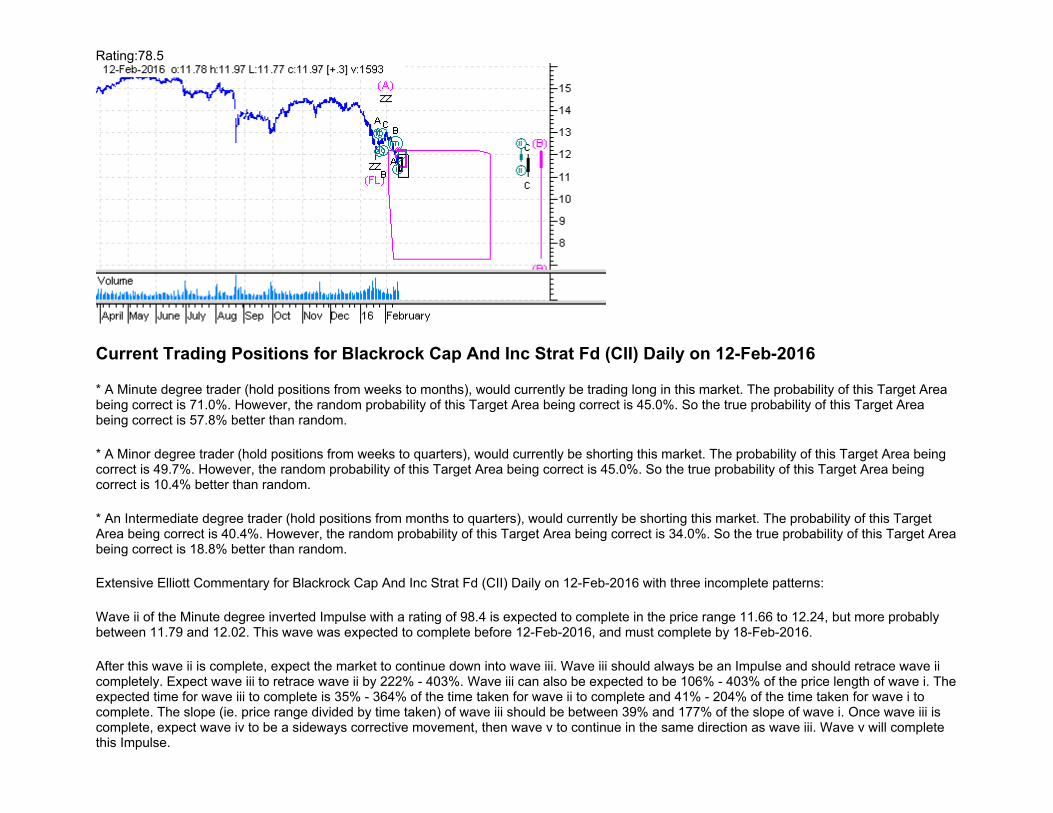
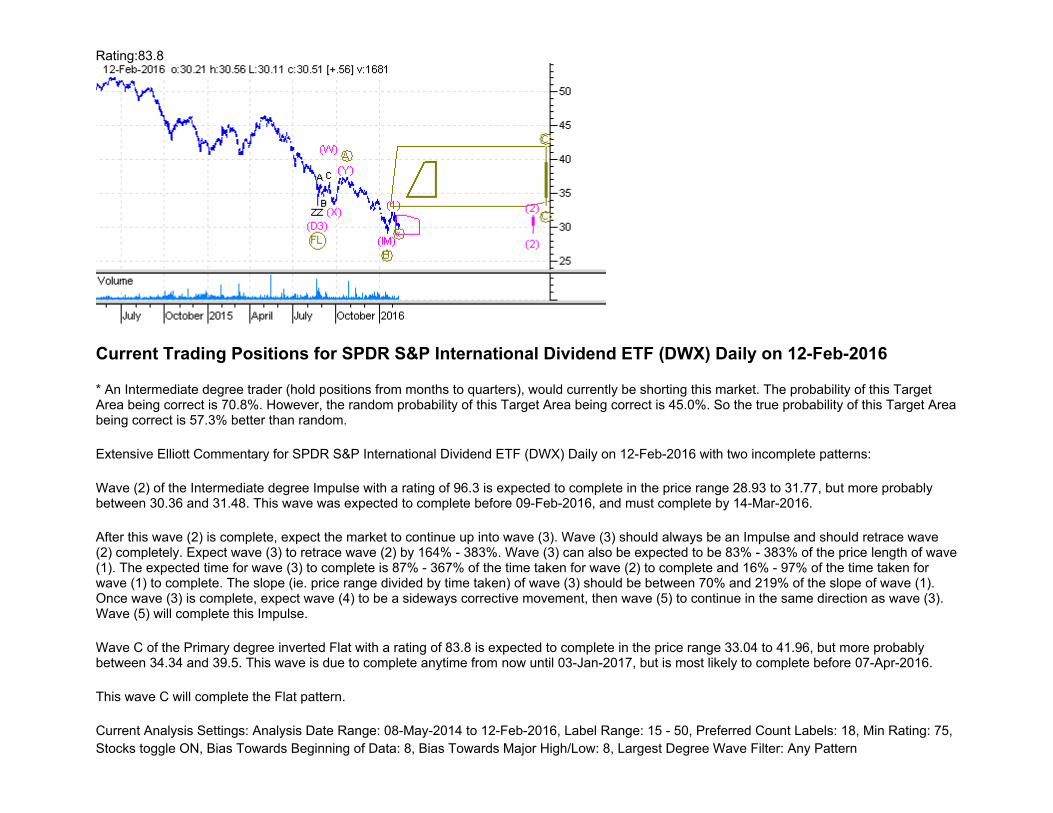
* An Intermediate degree trader (hold positions from months to quarters), would currently be shorting this market. The probability of this Target Area being correct is 70.9%. However, the random probability of this Target Area being correct is 45.0%. So the true probability of this Target Area being correct is 57.6% better than random.
* A Primary degree trader (hold positions from months to years), would currently be trading long in this market. The probability of this Target Area being correct is 50.9%. However, the random probability of this Target Area being correct is 45.0%. So the true probability of this Target Area being correct is 13.1% better than random.
Extensive Elliott Commentary for ALPS Sector Dividend Dogs ETF (SDOG) Daily on 12-Feb-2016 with two incomplete patterns:
Wave (2) of the Intermediate degree Impulse with a rating of 97.5 is expected to complete in the price range 30.77 to 34.38, but more probably between 32.59 and 34. This wave was expected to complete before 09-Feb-2016, and must complete by 14-Mar-2016.
After this wave (2) is complete, expect the market to continue up into wave (3). Wave (3) should always be an Impulse and should retrace wave (2) completely. Expect wave (3) to retrace wave (2) by 164% - 383%. Wave (3) can also be expected to be 83% - 383% of the price length of wave (1). The expected time for wave (3) to complete is 87% - 367% of the time taken for wave (2) to complete and 16% - 97% of the time taken for wave (1) to complete. The slope (ie. price range divided by time taken) of wave (3) should be between 70% and 219% of the slope of wave (1). Once wave (3) is complete, expect wave (4) to be a sideways corrective movement, then wave (5) to continue in the same direction as wave (3). Wave (5) will complete this Impulse.
Wave C of the Primary degree inverted Zigzag with a rating of 89.8 is expected to complete in the price range 35.62 to 58.02, but more probably between 38.41 and 52.28. This wave is due to complete anytime from now until 06-Jul-2016, but is most likely to complete before 03-May-2016.
This wave C will complete the ZigZag pattern.
Current Analysis Settings: Analysis Date Range: 13-Oct-2014 to 12-Feb-2016, Label Range: 15 - 50, Preferred Count Labels: 15, Min Rating: 75, Stocks toggle ON, Bias Towards Beginning of Data: 8, Bias Towards Major High/Low: 8, Largest Degree Wave Filter: Any Pattern
Rating:98.8
Current Trading Positions for Arrow Dow Jones Global Yield ETF (GYLD) Daily on 12-Feb-2016
* An Intermediate degree trader (hold positions from months to quarters), would currently be trading long in this market. The probability of this Target Area being correct is 41.6%. However, the random probability of this Target Area being correct is 24.3%. So the true probability of this Target Area being correct is 71.2% better than random.
Extensive Elliott Commentary for Arrow Dow Jones Global Yield ETF (GYLD) Daily on 12-Feb-2016 with one incomplete pattern:
Wave (Y) of the Intermediate degree inverted Double Zigzag with a rating of 98.8 is expected to complete in the price range 16.7 to 21.71, but more probably between 16.75 and 18.59. This wave is most likely to complete sometime between 15-Feb-2016 and 26-Feb-2016 Note that it cannot complete until 15-Feb-2016 but must complete by 07-Mar-2016.
Wave (Y) will probably complete this Double Sharp pattern, although it could possibly extend into a Triple Sharp pattern.
Current Analysis Settings: Analysis Date Range: 12-Jun-2014 to 12-Feb-2016, Label Range: 15 - 50, Preferred Count Labels: 34, Min Rating: 75, Stocks toggle ON, Bias Towards Beginning of Data: 8, Bias Towards Major High/Low: 8, Largest Degree Wave Filter: Any Pattern
Rating:83.3
Current Trading Positions for Asa Gold and Precious Metals Limited (ASA) Daily on 12-Feb-2016
* An Intermediate degree trader (hold positions from months to quarters), would currently be trading long in this market. The probability of this Target Area being correct is 50.1%. However, the random probability of this Target Area being correct is 34.0%. So the true probability of this Target Area being correct is 47.4% better than random.
* A Primary degree trader (hold positions from months to years), would currently be shorting this market. The probability of this Target Area being correct is 55.4%. However, the random probability of this Target Area being correct is 53.0%. So the true probability of this Target Area being correct is 4.5% better than random.
* A Cycle degree trader (hold positions from quarters to years), would currently be trading long in this market. The probability of this Target Area being correct is 79.2%. However, the random probability of this Target Area being correct is 65.0%. So the true probability of this Target Area being correct is 21.8% better than random.
Extensive Elliott Commentary for Asa Gold and Precious Metals Limited (ASA) Daily on 12-Feb-2016 with three incomplete patterns:
Wave (B) of the Intermediate degree Flat with a rating of 102 is expected to complete in the price range 9.06 to 12.5, but more probably between 9.08 and 9.71. This wave is due to complete anytime from now until 29-Feb-2016, but is most likely to complete before 15-Feb-2016.
After wave (B) is complete, expect the market to continue down into wave (C), which should be a five wave Impulsive pattern. Expect wave (C) to retrace wave (B) by 89% - 167%. Wave (C) can also be expected to be 105% - 167% of the price length of wave (A). The expected time for wave (C) to complete is 20% - 148% of the time taken for wave (B) to complete and 60% - 290% of the time taken for wave (A) to complete.
Wave X of the Primary degree inverted Double 3 with a rating of 83.7 is expected to complete in the price range 1.28 to 8.16, but more probably between 7.49 and 8.1. This wave is most likely to complete sometime between 29-Feb-2016 and 27-May-2016 Note that it cannot complete until 15-Feb-2016 but must complete by 27-Dec-2017.
After wave X is complete, expect the market to continue up into wave Y, which will probably be a three wave corrective pattern. Expect wave Y to retrace wave X by 98% - 227%. Wave Y can also be expected to be 71% - 227% of the price length of wave W. The expected time for wave Y to complete is 28% - 231% of the time taken for wave X to complete and 16% - 135% of the time taken for wave W to complete.
Wave x of the Cycle degree Double Zigzag with a rating of 83.3 is expected to complete in the price range 8.97 to 15.36, but more probably between 10.76 and 14.11. This wave is due to complete anytime from now until 15-May-2019, but is most likely to complete before 30-Sep-2016.
After wave x is complete, expect the market to continue down into wave y, which should be a three wave Zigzag pattern. Expect wave y to retrace wave x by 116% - 261%. Wave y can also be expected to be 90% - 261% of the price length of wave w. The expected time for wave y to complete is 21% - 160% of the time taken for wave x to complete and 25% - 152% of the time taken for wave w to complete.
Current Analysis Settings: Analysis Date Range: 29-May-2014 to 12-Feb-2016, Label Range: 15 - 50, Preferred Count Labels: 25, Min Rating: 75, Stocks toggle ON, Bias Towards Beginning of Data: 8, Bias Towards Major High/Low: 8, Largest Degree Wave Filter: Any Pattern
Rating:78.5
Current Trading Positions for Blackrock Cap And Inc Strat Fd (CII) Daily on 12-Feb-2016
* A Minute degree trader (hold positions from weeks to months), would currently be trading long in this market. The probability of this Target Area being correct is 71.0%. However, the random probability of this Target Area being correct is 45.0%. So the true probability of this Target Area being correct is 57.8% better than random.
* A Minor degree trader (hold positions from weeks to quarters), would currently be shorting this market. The probability of this Target Area being correct is 49.7%. However, the random probability of this Target Area being correct is 45.0%. So the true probability of this Target Area being correct is 10.4% better than random.
* An Intermediate degree trader (hold positions from months to quarters), would currently be shorting this market. The probability of this Target Area being correct is 40.4%. However, the random probability of this Target Area being correct is 34.0%. So the true probability of this Target Area being correct is 18.8% better than random.
Extensive Elliott Commentary for Blackrock Cap And Inc Strat Fd (CII) Daily on 12-Feb-2016 with three incomplete patterns:
Wave ii of the Minute degree inverted Impulse with a rating of 98.4 is expected to complete in the price range 11.66 to 12.24, but more probably between 11.79 and 12.02. This wave was expected to complete before 12-Feb-2016, and must complete by 18-Feb-2016.
After this wave ii is complete, expect the market to continue down into wave iii. Wave iii should always be an Impulse and should retrace wave ii completely. Expect wave iii to retrace wave ii by 222% - 403%. Wave iii can also be expected to be 106% - 403% of the price length of wave i. The expected time for wave iii to complete is 35% - 364% of the time taken for wave ii to complete and 41% - 204% of the time taken for wave i to complete. The slope (ie. price range divided by time taken) of wave iii should be between 39% and 177% of the slope of wave i. Once wave iii is complete, expect wave iv to be a sideways corrective movement, then wave v to continue in the same direction as wave iii. Wave v will complete this Impulse.
Wave C of the Minor degree Zigzag with a rating of 77.2 is expected to complete in the price range 10.99 to 12.01, but more probably between 11.27 and 11.85. This wave is due to complete anytime from now until 19-Feb-2016, but is most likely to complete before 15-Feb-2016.
This wave C will complete the ZigZag pattern.
This is the final wave in the pattern. When complete it will also complete wave (B) of the Intermediate degree inverted Flat with a rating of 78.5. These two waves have the same target ranges.
After wave (B) is complete, expect the market to continue up into wave (C), which should be a five wave Impulsive pattern. Expect wave (C) to retrace wave (B) by 80% - 169%. Wave (C) can also be expected to be 99% - 169% of the price length of wave (A). The expected time for wave (C) to complete is 19% - 187% of the time taken for wave (B) to complete and 56% - 268% of the time taken for wave (A) to complete.
Current Analysis Settings: Analysis Date Range: 27-Mar-2015 to 12-Feb-2016, Label Range: 15 - 50, Preferred Count Labels: 40, Min Rating: 75, Stocks toggle ON, Bias Towards Beginning of Data: 8, Bias Towards Major High/Low: 8, Largest Degree Wave Filter: Any Pattern
Rating:81.1
Current Trading Positions for Blackrock Core Bond Trust (BHK) Daily on 12-Feb-2016
* A Cycle degree trader (hold positions from quarters to years), would currently be trading long in this market. The probability of this Target Area being correct is 41.3%. However, the random probability of this Target Area being correct is 34.0%. So the true probability of this Target Area being correct is 21.5% better than random.
Extensive Elliott Commentary for Blackrock Core Bond Trust (BHK) Daily on 12-Feb-2016 with two incomplete patterns:
Wave C of the Primary degree inverted Flat with a rating of 104.8 is expected to complete in the price range 12.51 to 14.18, but more probably between 12.93 and 13.61. This wave is due to complete anytime from now until 14-Jul-2017, but is most likely to complete before 29-Apr-2016.
This wave C will complete the Flat pattern.
This is the final wave in the pattern. When complete it will also complete wave b of the Cycle degree Flat with a rating of 81.1. These two waves have the same target ranges.
After wave b is complete, expect the market to continue down into wave c, which should be a five wave Impulsive pattern. Expect wave c to retrace wave b by 86% - 162%. Wave c can also be expected to be 90% - 162% of the price length of wave a. The expected time for wave c to complete is 19% - 134% of the time taken for wave b to complete and 24% - 115% of the time taken for wave a to complete.
Current Analysis Settings: Analysis Date Range: 18-Dec-2014 to 12-Feb-2016, Label Range: 15 - 50, Preferred Count Labels: 18, Min Rating: 75, Stocks toggle ON, Bias Towards Beginning of Data: 8, Bias Towards Major High/Low: 8, Largest Degree Wave Filter: Any Pattern
Rating:81.8
Current Trading Positions for BlackRock Credit Allocation Income Trust (BTZ) Daily on 12-Feb-2016
* A Primary degree trader (hold positions from months to years), would currently be shorting this market. The probability of this Target Area being correct is 49.4%. However, the random probability of this Target Area being correct is 34.0%. So the true probability of this Target Area being correct is 45.3% better than random.
* A Cycle degree trader (hold positions from quarters to years), would currently be trading long in this market. The probability of this Target Area being correct is 41.3%. However, the random probability of this Target Area being correct is 34.0%. So the true probability of this Target Area being correct is 21.5% better than random.
Extensive Elliott Commentary for BlackRock Credit Allocation Income Trust (BTZ) Daily on 12-Feb-2016 with two incomplete patterns:
Wave B of the Primary degree inverted Flat with a rating of 99.8 is expected to complete in the price range 10.94 to 11.86, but more probably between 11.6 and 11.84. This wave is due to complete anytime from now until 02-Sep-2016, but is most likely to complete before 04-Mar-2016.
After wave B is complete, expect the market to continue up into wave C, which should be a five wave Impulsive pattern. Expect wave C to retrace wave B by 82% - 177%. Wave C can also be expected to be 89% - 177% of the price length of wave A. The expected time for wave C to complete is 15% - 160% of the time taken for wave B to complete and 16% - 118% of the time taken for wave A to complete.
Wave b of the Cycle degree Flat with a rating of 81.8 is expected to complete in the price range 13.13 to 17.3, but more probably between 13.18 and 14.28. This wave could complete anytime between now and 18-Apr-2025, but is most likely to complete sometime between 12-Feb-2016 and 07-Apr-2017.
After wave b is complete, expect the market to continue down into wave c, which should be a five wave Impulsive pattern. Expect wave c to retrace wave b by 85% - 162%. Wave c can also be expected to be 90% - 162% of the price length of wave a. The expected time for wave c to complete is 20% - 136% of the time taken for wave b to complete and 20% - 110% of the time taken for wave a to complete.
Current Analysis Settings: Analysis Date Range: 17-Apr-2014 to 12-Feb-2016, Label Range: 15 - 50, Preferred Count Labels: 17, Min Rating: 75, Stocks toggle ON, Bias Towards Beginning of Data: 8, Bias Towards Major High/Low: 8, Largest Degree Wave Filter: Any Pattern
Rating:82.8
Current Trading Positions for Blackrock Debt Strat Fd Inc (DSU) Daily on 12-Feb-2016
* A Primary degree trader (hold positions from months to years), would currently be shorting this market. The probability of this Target Area being correct is 64.7%. However, the random probability of this Target Area being correct is 45.0%. So the true probability of this Target Area being correct is 43.8% better than random.
* A Cycle degree trader (hold positions from quarters to years), would currently be shorting this market. The probability of this Target Area being correct is 36.0%. However, the random probability of this Target Area being correct is 24.3%. So the true probability of this Target Area being correct is 48.1% better than random.
Extensive Elliott Commentary for Blackrock Debt Strat Fd Inc (DSU) Daily on 12-Feb-2016 with two incomplete patterns:
Wave C of the Primary degree Zigzag with a rating of 101.6 is expected to complete in the price range 2.13 to 3.09, but more probably between 2.75 and 3.04. This wave is due to complete anytime from now until 21-Apr-2016, but is most likely to complete before 29-Feb-2016.
This wave C will complete the ZigZag pattern.
This is the final wave in the pattern. When complete it will also complete wave y of the Cycle degree Double Zigzag with a rating of 82.8. These two waves have the same target ranges.
Wave y will probably complete this Double Sharp pattern, although it could possibly extend into a Triple Sharp pattern.
Current Analysis Settings: Analysis Date Range: 31-Mar-2014 to 12-Feb-2016, Label Range: 15 - 50, Preferred Count Labels: 16, Min Rating: 75, Stocks toggle ON, Bias Towards Beginning of Data: 8, Bias Towards Major High/Low: 8, Largest Degree Wave Filter: Any Pattern
Rating:84.6
Current Trading Positions for BlackRock Enhanced Dividend Achievers Trust (BDJ) Daily on 12-Feb-2016
* An Intermediate degree trader (hold positions from months to quarters), would currently be shorting this market. The probability of this Target Area being correct is 70.5%. However, the random probability of this Target Area being correct is 45.0%. So the true probability of this Target Area being correct is 56.7% better than random.
Extensive Elliott Commentary for BlackRock Enhanced Dividend Achievers Trust (BDJ) Daily on 12-Feb-2016 with two incomplete patterns:
Wave (2) of the Intermediate degree Impulse with a rating of 94.7 is expected to complete in the price range 6.42 to 7.14, but more probably between 6.78 and 7.06. This wave was expected to complete before 02-Feb-2016, and must complete by 25-Feb-2016.
After this wave (2) is complete, expect the market to continue up into wave (3). Wave (3) should always be an Impulse and should retrace wave (2) completely. Expect wave (3) to retrace wave (2) by 164% - 383%. Wave (3) can also be expected to be 83% - 383% of the price length of wave (1). The expected time for wave (3) to complete is 87% - 367% of the time taken for wave (2) to complete and 16% - 97% of the time taken for wave (1) to complete. The slope (ie. price range divided by time taken) of wave (3) should be between 70% and 219% of the slope of wave (1). Once wave (3) is complete, expect wave (4) to be a sideways corrective movement, then wave (5) to continue in the same direction as wave (3). Wave (5) will complete this Impulse.
Wave C of the Primary degree inverted Flat with a rating of 84.6 is expected to complete in the price range 6.71 to 9.46, but more probably between 7.41 and 8.52. This wave is due to complete anytime from now until 16-Mar-2017, but is most likely to complete before 05-Apr-2016.
This wave C will complete the Flat pattern.
Current Analysis Settings: Analysis Date Range: 01-Oct-2014 to 12-Feb-2016, Label Range: 15 - 50, Preferred Count Labels: 32, Min Rating: 75, Stocks toggle ON, Bias Towards Beginning of Data: 8, Bias Towards Major High/Low: 8, Largest Degree Wave Filter: Any Pattern
Rating:76.3
Current Trading Positions for Blackrock Enrgy & Resource Tr (BGR) Daily on 12-Feb-2016
* An Intermediate degree trader (hold positions from months to quarters), would currently be shorting this market. The probability of this Target Area being correct is 65.0%. However, the random probability of this Target Area being correct is 13.0%. So the true probability of this Target Area being correct is 400.0% better than random.
* A Primary degree trader (hold positions from months to years), would currently be shorting this market. The probability of this Target Area being correct is 50.6%. However, the random probability of this Target Area being correct is 45.0%. So the true probability of this Target Area being correct is 12.4% better than random.
* A Cycle degree trader (hold positions from quarters to years), would currently be shorting this market. The probability of this Target Area being correct is 33.0%. However, the random probability of this Target Area being correct is 24.3%. So the true probability of this Target Area being correct is 35.8% better than random.
Extensive Elliott Commentary for Blackrock Enrgy & Resource Tr (BGR) Daily on 12-Feb-2016 with three incomplete patterns:
Wave (3) of the Intermediate degree inverted Impulse with a rating of 102.9 is expected to complete at a price no higher than 9.42, but more probably between 2.3 and 7.81. This wave could complete anytime between now and 26-May-2016, but is most likely to complete sometime between 15-Feb-2016 and 29-Mar-2016.
When complete, expect the overall slope (ie. price range divided by time taken) of this wave (3) to be between 47% to 194% of the slope of wave (1). Then expect the market to pull back into wave (4), which will be corrective in nature and has a probability of 0% of being a Flat or other sideways pattern. Wave (4) should not retrace back into the price range of wave (1) or (2). Expect wave (4) to have between 5% - 140% of the price range of wave (2). The expected time for wave (4) to complete is between 15% - 136% of wave (2). After wave (4), expect wave (5) to move beyond the end of wave (3) to complete this Impulse.
Wave C of the Primary degree Zigzag with a rating of 86 is expected to complete at a price no higher than 13.56, but more probably between 8.65 and 13.28. This wave was expected to complete before 01-Feb-2016, and must complete by 21-Sep-2016.
This wave C will complete the ZigZag pattern.
This is the final wave in the pattern. When complete it will also complete wave y of the Cycle degree Double Zigzag with a rating of 76.3. These two waves have the same target ranges.
Wave y will probably complete this Double Sharp pattern, although it could possibly extend into a Triple Sharp pattern.
Current Analysis Settings: Analysis Date Range: 12-Jun-2014 to 12-Feb-2016, Label Range: 15 - 50, Preferred Count Labels: 15, Min Rating: 75, Stocks toggle ON, Bias Towards Beginning of Data: 8, Bias Towards Major High/Low: 8, Largest Degree Wave Filter: Any Pattern
Rating:85.8
Current Trading Positions for BlackRock Floating Rate Income Strategies Fund Inc (FRA) Daily on 12-Feb-2016
* An Intermediate degree trader (hold positions from months to quarters), would currently be shorting this market. The probability of this Target Area being correct is 64.9%. However, the random probability of this Target Area being correct is 45.0%. So the true probability of this Target Area being correct is 44.2% better than random.
* A Primary degree trader (hold positions from months to years), would currently be shorting this market. The probability of this Target Area being correct is 42.5%. However, the random probability of this Target Area being correct is 34.0%. So the true probability of this Target Area being correct is 25.0% better than random.
Extensive Elliott Commentary for BlackRock Floating Rate Income Strategies Fund Inc (FRA) Daily on 12-Feb-2016 with two incomplete patterns:
Wave (C) of the Intermediate degree Zigzag with a rating of 102.4 is expected to complete in the price range 9.34 to 12.04, but more probably between 11.12 and 11.91. This wave is due to complete anytime from now until 11-Apr-2016, but is most likely to complete before 22-Feb-2016.
This wave (C) will complete the ZigZag pattern.
This is the final wave in the pattern. When complete it will also complete wave B of the Primary degree inverted Flat with a rating of 85.8. These two waves have the same target ranges.
After wave B is complete, expect the market to continue up into wave C, which should be a five wave Impulsive pattern. Expect wave C to retrace wave B by 82% - 177%. Wave C can also be expected to be 89% - 177% of the price length of wave A. The expected time for wave C to complete is 15% - 160% of the time taken for wave B to complete and 16% - 118% of the time taken for wave A to complete.
Current Analysis Settings: Analysis Date Range: 06-Dec-2013 to 12-Feb-2016, Label Range: 15 - 50, Preferred Count Labels: 20, Min Rating: 75, Stocks toggle ON, Bias Towards Beginning of Data: 8, Bias Towards Major High/Low: 8, Largest Degree Wave Filter: Any Pattern
Rating:84.4
Current Trading Positions for BlackRock Global Opportunities Equity Trust (BOE) Daily on 12-Feb-2016
* A Primary degree trader (hold positions from months to years), would currently be shorting this market. The probability of this Target Area being correct is 65.3%. However, the random probability of this Target Area being correct is 45.0%. So the true probability of this Target Area being correct is 45.1% better than random.
* A Cycle degree trader (hold positions from quarters to years), would currently be shorting this market. The probability of this Target Area being correct is 37.0%. However, the random probability of this Target Area being correct is 24.3%. So the true probability of this Target Area being correct is 52.3% better than random.
Extensive Elliott Commentary for BlackRock Global Opportunities Equity Trust (BOE) Daily on 12-Feb-2016 with two incomplete patterns:
Wave C of the Primary degree Zigzag with a rating of 104.1 is expected to complete in the price range 7.2 to 10.71, but more probably between 8.99 and 10.45. This wave is due to complete anytime from now until 21-Apr-2016, but is most likely to complete before 23-Feb-2016.
This wave C will complete the ZigZag pattern.
This is the final wave in the pattern. When complete it will also complete wave y of the Cycle degree Double Zigzag with a rating of 84.4. These two waves have the same target ranges.
Wave y will probably complete this Double Sharp pattern, although it could possibly extend into a Triple Sharp pattern.
Current Analysis Settings: Analysis Date Range: 21-Apr-2014 to 12-Feb-2016, Label Range: 15 - 50, Preferred Count Labels: 19, Min Rating: 75, Stocks toggle ON, Bias Towards Beginning of Data: 8, Bias Towards Major High/Low: 8, Largest Degree Wave Filter: Any Pattern
Rating:99.6
Current Trading Positions for Blackrock Income Trust (BKT) Daily on 12-Feb-2016
* A Primary degree trader (hold positions from months to years), would currently be trading long in this market. The probability of this Target Area being correct is 41.8%. However, the random probability of this Target Area being correct is 24.3%. So the true probability of this Target Area being correct is 72.0% better than random.
Extensive Elliott Commentary for Blackrock Income Trust (BKT) Daily on 12-Feb-2016 with one incomplete pattern:
Wave Y of the Primary degree inverted Double Zigzag with a rating of 99.6 is expected to complete in the price range 6.66 to 7.08, but more probably between 6.67 and 6.88. This wave is due to complete anytime from now until 15-Jun-2016, but is most likely to complete before 09-Mar-2016.
Wave Y will probably complete this Double Sharp pattern, although it could possibly extend into a Triple Sharp pattern.
Current Analysis Settings: Analysis Date Range: 14-May-2014 to 12-Feb-2016, Label Range: 15 - 50, Preferred Count Labels: 16, Min Rating: 75, Stocks toggle ON, Bias Towards Beginning of Data: 8, Bias Towards Major High/Low: 8, Largest Degree Wave Filter: Any Pattern
Rating:83.6
Current Trading Positions for Blackrock International Growth and Income Trust (BGY) Daily on 12-Feb-2016
* A Primary degree trader (hold positions from months to years), would currently be shorting this market. The probability of this Target Area being correct is 88.3%. However, the random probability of this Target Area being correct is 65.0%. So the true probability of this Target Area being correct is 35.8% better than random.
* A Cycle degree trader (hold positions from quarters to years), would currently be trading long in this market. The probability of this Target Area being correct is 41.9%. However, the random probability of this Target Area being correct is 34.0%. So the true probability of this Target Area being correct is 23.2% better than random.
Extensive Elliott Commentary for Blackrock International Growth and Income Trust (BGY) Daily on 12-Feb-2016 with two incomplete patterns:
Wave X of the Primary degree inverted Double Zigzag with a rating of 101.5 is expected to complete in the price range 5.23 to 5.7, but more probably between 5.38 and 5.61. This wave is due to complete anytime from now until 07-Apr-2016, but is most likely to complete before 26-Feb-2016.
After wave X is complete, expect the market to continue up into wave Y, which should be a three wave Zigzag pattern. Expect wave Y to retrace wave X by 128% - 319%. Wave Y can also be expected to be 90% - 319% of the price length of wave W. The expected time for wave Y to complete is 23% - 167% of the time taken for wave X to complete and 47% - 204% of the time taken for wave W to complete.
Wave b of the Cycle degree Flat with a rating of 83.6 is expected to complete in the price range 7.38 to 13.5, but more probably between 7.44 and 9.06. This wave could complete anytime between now and 30-Sep-2025, but is most likely to complete sometime between 10-Mar-2016 and 22-May-2017.
After wave b is complete, expect the market to continue down into wave c, which should be a five wave Impulsive pattern. Expect wave c to retrace wave b by 85% - 162%. Wave c can also be expected to be 90% - 162% of the price length of wave a. The expected time for wave c to complete is 20% - 136% of the time taken for wave b to complete and 20% - 110% of the time taken for wave a to complete.
Current Analysis Settings: Analysis Date Range: 30-Apr-2014 to 12-Feb-2016, Label Range: 15 - 50, Preferred Count Labels: 15, Min Rating: 75, Stocks toggle ON, Bias Towards Beginning of Data: 8, Bias Towards Major High/Low: 8, Largest Degree Wave Filter: Any Pattern
Rating:81
Current Trading Positions for Blackrock Ltd Duration Incm Tr (BLW) Daily on 12-Feb-2016
* A Primary degree trader (hold positions from months to years), would currently be shorting this market. The probability of this Target Area being correct is 65.0%. However, the random probability of this Target Area being correct is 53.0%. So the true probability of this Target Area being correct is 22.6% better than random.
* A Cycle degree trader (hold positions from quarters to years), would currently be trading long in this market. The probability of this Target Area being correct is 41.0%. However, the random probability of this Target Area being correct is 34.0%. So the true probability of this Target Area being correct is 20.6% better than random.
Extensive Elliott Commentary for Blackrock Ltd Duration Incm Tr (BLW) Daily on 12-Feb-2016 with two incomplete patterns:
Wave X of the Primary degree inverted Double 3 with a rating of 100.6 is expected to complete in the price range 10.56 to 13.78, but more probably between 13.28 and 13.56. This wave was expected to complete before 11-Feb-2016, and must complete by 28-Mar-2016.
After wave X is complete, expect the market to continue up into wave Y, which will probably be a three wave corrective pattern. Expect wave Y to retrace wave X by 98% - 212%. Wave Y can also be expected to be 73% - 212% of the price length of wave W. The expected time for wave Y to complete is 27% - 214% of the time taken for wave X to complete and 38% - 222% of the time taken for wave W to complete.
Wave b of the Cycle degree Flat with a rating of 81 is expected to complete in the price range 16.25 to 24.49, but more probably between 16.33 and 18.51. This wave is most likely to complete sometime between 21-Mar-2016 and 12-Sep-2017 Note that it cannot complete until 16-Feb-2016 but must complete by 07-Jan-2028.
After wave b is complete, expect the market to continue down into wave c, which should be a five wave Impulsive pattern. Expect wave c to retrace wave b by 85% - 162%. Wave c can also be expected to be 90% - 162% of the price length of wave a. The expected time for wave c to complete is 20% - 136% of the time taken for wave b to complete and 20% - 110% of the time taken for wave a to complete.
Current Analysis Settings: Analysis Date Range: 11-Dec-2013 to 12-Feb-2016, Label Range: 15 - 50, Preferred Count Labels: 15, Min Rating: 75, Stocks toggle ON, Bias Towards Beginning of Data: 8, Bias Towards Major High/Low: 8, Largest Degree Wave Filter: Any Pattern
Rating:84.2
Current Trading Positions for BlackRock Multi-Sector Income (BIT) Daily on 12-Feb-2016
* A Primary degree trader (hold positions from months to years), would currently be shorting this market. The probability of this Target Area being correct is 50.0%. However, the random probability of this Target Area being correct is 34.0%. So the true probability of this Target Area being correct is 47.1% better than random.
* A Cycle degree trader (hold positions from quarters to years), would currently be trading long in this market. The probability of this Target Area being correct is 42.2%. However, the random probability of this Target Area being correct is 34.0%. So the true probability of this Target Area being correct is 24.1% better than random.
Extensive Elliott Commentary for BlackRock Multi-Sector Income (BIT) Daily on 12-Feb-2016 with two incomplete patterns:
Wave B of the Primary degree inverted Flat with a rating of 100.5 is expected to complete in the price range 13.86 to 15.48, but more probably between 15.03 and 15.46. This wave is due to complete anytime from now until 24-Aug-2017, but is most likely to complete before 05-Apr-2016.
After wave B is complete, expect the market to continue up into wave C, which should be a five wave Impulsive pattern. Expect wave C to retrace wave B by 82% - 177%. Wave C can also be expected to be 89% - 177% of the price length of wave A. The expected time for wave C to complete is 15% - 160% of the time taken for wave B to complete and 16% - 118% of the time taken for wave A to complete.
Wave b of the Cycle degree Flat with a rating of 84.2 is expected to complete in the price range 17.54 to 24.33, but more probably between 17.61 and 19.4. This wave is due to complete anytime from now until 14-Mar-2023, but is most likely to complete before 18-Oct-2016.
After wave b is complete, expect the market to continue down into wave c, which should be a five wave Impulsive pattern. Expect wave c to retrace wave b by 85% - 162%. Wave c can also be expected to be 90% - 162% of the price length of wave a. The expected time for wave c to complete is 20% - 136% of the time taken for wave b to complete and 20% - 110% of the time taken for wave a to complete.
Current Analysis Settings: Analysis Date Range: 21-Apr-2014 to 12-Feb-2016, Label Range: 15 - 50, Preferred Count Labels: 17, Min Rating: 75, Stocks toggle ON, Bias Towards Beginning of Data: 8, Bias Towards Major High/Low: 8, Largest Degree Wave Filter: Any Pattern
Rating:103.5
Current Trading Positions for Blackrock Municipal Target Term Trust (BTT) Daily on 12-Feb-2016
* A Supercycle degree trader (buy and hold for years), would currently be trading long in this market. The probability of this Target Area being correct is 42.6%. However, the random probability of this Target Area being correct is 24.3%. So the true probability of this Target Area being correct is 75.3% better than random.
Extensive Elliott Commentary for Blackrock Municipal Target Term Trust (BTT) Daily on 12-Feb-2016 with one incomplete pattern:
Wave (y) of the Supercycle degree inverted Double Zigzag with a rating of 103.5 is expected to complete in the price range 24.35 to 27.99, but more probably between 24.42 and 26.3. This wave is due to complete anytime from now until 27-Sep-2017, but is most likely to complete before 04-Jul-2016.
Wave (y) will probably complete this Double Sharp pattern, although it could possibly extend into a Triple Sharp pattern.
Current Analysis Settings: Analysis Date Range: 06-Dec-2013 to 12-Feb-2016, Label Range: 15 - 50, Preferred Count Labels: 16, Min Rating: 75, Stocks toggle ON, Bias Towards Beginning of Data: 8, Bias Towards Major High/Low: 8, Largest Degree Wave Filter: Any Pattern
Rating:105.1
Current Trading Positions for Blackrock Resources & Commodities Strat Trust (BCX) Daily on 12-Feb-2016
* An Intermediate degree trader (hold positions from months to quarters), would currently be trading long in this market. The probability of this Target Area being correct is 43.0%. However, the random probability of this Target Area being correct is 24.3%. So the true probability of this Target Area being correct is 77.0% better than random.
Extensive Elliott Commentary for Blackrock Resources & Commodities Strat Trust (BCX) Daily on 12-Feb-2016 with one incomplete pattern:
Wave (Y) of the Intermediate degree inverted Double Zigzag with a rating of 105.1 is expected to complete in the price range 6.84 to 7.83, but more probably between 6.85 and 7.29. This wave is most likely to complete sometime between 12-Feb-2016 and 25-Feb-2016 Note that it cannot complete until 12-Feb-2016 but must complete by 21-Mar-2016.
Wave (Y) will probably complete this Double Sharp pattern, although it could possibly extend into a Triple Sharp pattern.
Current Analysis Settings: Analysis Date Range: 22-May-2014 to 12-Feb-2016, Label Range: 15 - 50, Preferred Count Labels: 21, Min Rating: 75, Stocks toggle ON, Bias Towards Beginning of Data: 8, Bias Towards Major High/Low: 8, Largest Degree Wave Filter: Any Pattern
Rating:84.4
Current Trading Positions for Blackstone/GSO Strategic Credit Fund (BGB) Daily on 12-Feb-2016
* A Minor degree trader (hold positions from weeks to quarters), would currently be shorting this market. The probability of this Target Area being correct is 65.5%. However, the random probability of this Target Area being correct is 45.0%. So the true probability of this Target Area being correct is 45.6% better than random.
* An Intermediate degree trader (hold positions from months to quarters), would currently be shorting this market. The probability of this Target Area being correct is 41.0%. However, the random probability of this Target Area being correct is 34.0%. So the true probability of this Target Area being correct is 20.6% better than random.
* A Primary degree trader (hold positions from months to years), would currently be trading long in this market. The probability of this Target Area being correct is 50.4%. However, the random probability of this Target Area being correct is 45.0%. So the true probability of this Target Area being correct is 12.0% better than random.
* A Cycle degree trader (hold positions from quarters to years), would currently be shorting this market. The probability of this Target Area being correct is 37.0%. However, the random probability of this Target Area being correct is 24.3%. So the true probability of this Target Area being correct is 52.3% better than random.
Extensive Elliott Commentary for Blackstone/GSO Strategic Credit Fund (BGB) Daily on 12-Feb-2016 with four incomplete patterns:
Wave C of the Minor degree Zigzag with a rating of 105.7 is expected to complete in the price range 9.13 to 12.35, but more probably between 11.11 and 12.2. This wave is due to complete anytime from now until 11-Apr-2016, but is most likely to complete before 26-Feb-2016.
This wave C will complete the ZigZag pattern.
This is the final wave in the pattern. When complete it will also complete wave (B) of the Intermediate degree inverted Flat with a rating of 80.3. These two waves have the same target ranges.
After wave (B) is complete, expect the market to continue up into wave (C), which should be a five wave Impulsive pattern. Expect wave (C) to retrace wave (B) by 80% - 169%. Wave (C) can also be expected to be 99% - 169% of the price length of wave (A). The expected time for wave (C) to complete is 19% - 187% of the time taken for wave (B) to complete and 56% - 268% of the time taken for wave (A) to complete.
Wave B of the Primary degree Zigzag with a rating of 77.2 is expected to complete in the price range 13 to 14.59, but more probably between 13.28 and 13.91. This wave is due to complete anytime from now until 14-Sep-2016, but is most likely to complete before 15-Feb-2016.
After wave B is complete, expect the market to continue down into wave C, which should be a five wave impulsive pattern. Expect wave C to retrace wave B by 127% - 277%. Wave C can also be expected to be 43% - 277% of the price length of wave A. The expected time for wave C to complete is 19% - 191% of the time taken for wave B to complete and 55% - 222% of the time taken for wave A to complete.
Wave y of the Cycle degree Double Zigzag with a rating of 84.4 is expected to complete in the price range 10.6 to 12.28, but more probably between 11.68 and 12.24. This wave is due to complete anytime from now until 12-Aug-2016, but is most likely to complete before 25-Mar-2016.
Wave y will probably complete this Double Sharp pattern, although it could possibly extend into a Triple Sharp pattern.
Current Analysis Settings: Analysis Date Range: 06-Jan-2014 to 12-Feb-2016, Label Range: 15 - 50, Preferred Count Labels: 15, Min Rating: 75, Stocks toggle ON, Bias Towards Beginning of Data: 8, Bias Towards Major High/Low: 8, Largest Degree Wave Filter: Any Pattern
Rating:82.5
Current Trading Positions for Brookfield Global Listed Infrastructure Fund (INF) Daily on 12-Feb-2016
* A Cycle degree trader (hold positions from quarters to years), would currently be shorting this market. The probability of this Target Area being correct is 14.0%. However, the random probability of this Target Area being correct is 13.0%. So the true probability of this Target Area being correct is 7.7% better than random.
Extensive Elliott Commentary for Brookfield Global Listed Infrastructure Fund (INF) Daily on 12-Feb-2016 with two incomplete patterns:
Wave 5 of the Primary degree inverted Impulse with a rating of 92.6 is expected to complete at a price no higher than 9.49, but more probably between 4.83 and 8.48. This wave is due to complete anytime from now until 22-Apr-2016, but is most likely to complete before 22-Feb-2016.
When complete, expect the overall slope (ie. price range divided by time taken) of this wave 5 to be between 48% and 200% of the slope of wave 3 and between 29% to 297% of the slope of wave 1. This wave 5 will complete the Impulse pattern.
This is the final wave in the pattern. When complete it will also complete wave III of the Cycle degree inverted Impulse with a rating of 82.5. These two waves have the same target ranges.
When complete, expect the overall slope (ie. price range divided by time taken) of this wave III to be between 47% to 194% of the slope of wave I. Then expect the market to pull back into wave IV, which will be corrective in nature and has a probability of 0% of being a Flat or other sideways pattern. Wave IV should not retrace back into the price range of wave I or II. Expect wave IV to have between 5% - 140% of the price range of wave II. The expected time for wave IV to complete is between 15% - 136% of wave II. After wave IV, expect wave V to move beyond the end of wave III to complete this Impulse.
Current Analysis Settings: Analysis Date Range: 24-Jul-2014 to 12-Feb-2016, Label Range: 15 - 50, Preferred Count Labels: 17, Min Rating: 75, Stocks toggle ON, Bias Towards Beginning of Data: 8, Bias Towards Major High/Low: 8, Largest Degree Wave Filter: Any Pattern
Rating:80.1
Current Trading Positions for Calamos Conv And High Incm Fd (CHY) Daily on 12-Feb-2016
* A Primary degree trader (hold positions from months to years), would currently be shorting this market. The probability of this Target Area being correct is 66.8%. However, the random probability of this Target Area being correct is 53.0%. So the true probability of this Target Area being correct is 26.0% better than random.
* A Cycle degree trader (hold positions from quarters to years), would currently be trading long in this market. The probability of this Target Area being correct is 41.0%. However, the random probability of this Target Area being correct is 34.0%. So the true probability of this Target Area being correct is 20.6% better than random.
Extensive Elliott Commentary for Calamos Conv And High Incm Fd (CHY) Daily on 12-Feb-2016 with two incomplete patterns:
Wave X of the Primary degree inverted Double 3 with a rating of 102.5 is expected to complete in the price range 5.02 to 9.26, but more probably between 8.6 and 8.96. This wave is due to complete anytime from now until 05-Apr-2016, but is most likely to complete before 12-Feb-2016.
After wave X is complete, expect the market to continue up into wave Y, which will probably be a three wave corrective pattern. Expect wave Y to retrace wave X by 98% - 212%. Wave Y can also be expected to be 73% - 212% of the price length of wave W. The expected time for wave Y to complete is 27% - 214% of the time taken for wave X to complete and 38% - 222% of the time taken for wave W to complete.
Wave b of the Cycle degree Flat with a rating of 80.1 is expected to complete in the price range 13.06 to 25.49, but more probably between 13.19 and 16.48. This wave could complete anytime between now and 05-May-2025, but is most likely to complete sometime between 08-Mar-2016 and 01-May-2017.
After wave b is complete, expect the market to continue down into wave c, which should be a five wave Impulsive pattern. Expect wave c to retrace wave b by 85% - 162%. Wave c can also be expected to be 90% - 162% of the price length of wave a. The expected time for wave c to complete is 20% - 136% of the time taken for wave b to complete and 20% - 110% of the time taken for wave a to complete.
Current Analysis Settings: Analysis Date Range: 23-May-2014 to 12-Feb-2016, Label Range: 15 - 50, Preferred Count Labels: 20, Min Rating: 75, Stocks toggle ON, Bias Towards Beginning of Data: 8, Bias Towards Major High/Low: 8, Largest Degree Wave Filter: Any Pattern
Rating:77.2
Current Trading Positions for Calamos Conv Opptys & Incm Fd (CHI) Daily on 12-Feb-2016
* A Primary degree trader (hold positions from months to years), would currently be shorting this market. The probability of this Target Area being correct is 65.3%. However, the random probability of this Target Area being correct is 45.0%. So the true probability of this Target Area being correct is 45.1% better than random.
* A Cycle degree trader (hold positions from quarters to years), would currently be shorting this market. The probability of this Target Area being correct is 33.5%. However, the random probability of this Target Area being correct is 24.3%. So the true probability of this Target Area being correct is 37.9% better than random.
Extensive Elliott Commentary for Calamos Conv Opptys & Incm Fd (CHI) Daily on 12-Feb-2016 with two incomplete patterns:
Wave C of the Primary degree Zigzag with a rating of 104.1 is expected to complete in the price range 4.34 to 8.26, but more probably between 6.55 and 8.05. This wave is due to complete anytime from now until 21-Apr-2016, but is most likely to complete before 26-Feb-2016.
This wave C will complete the ZigZag pattern.
This is the final wave in the pattern. When complete it will also complete wave y of the Cycle degree Double Zigzag with a rating of 77.2. These two waves have the same target ranges.
Wave y will probably complete this Double Sharp pattern, although it could possibly extend into a Triple Sharp pattern.
Current Analysis Settings: Analysis Date Range: 23-Jan-2014 to 12-Feb-2016, Label Range: 15 - 50, Preferred Count Labels: 18, Min Rating: 75, Stocks toggle ON, Bias Towards Beginning of Data: 8, Bias Towards Major High/Low: 8, Largest Degree Wave Filter: Any Pattern
Rating:80.3
Current Trading Positions for Calamos Global Dynamic Incm Fd (CHW) Daily on 12-Feb-2016
* A Primary degree trader (hold positions from months to years), would currently be shorting this market. The probability of this Target Area being correct is 88.6%. However, the random probability of this Target Area being correct is 65.0%. So the true probability of this Target Area being correct is 36.3% better than random.
* A Cycle degree trader (hold positions from quarters to years), would currently be trading long in this market. The probability of this Target Area being correct is 41.0%. However, the random probability of this Target Area being correct is 34.0%. So the true probability of this Target Area being correct is 20.6% better than random.
Extensive Elliott Commentary for Calamos Global Dynamic Incm Fd (CHW) Daily on 12-Feb-2016 with two incomplete patterns:
Wave X of the Primary degree inverted Double Zigzag with a rating of 102.6 is expected to complete in the price range 5.86 to 6.45, but more probably between 6.05 and 6.34. This wave is due to complete anytime from now until 14-Mar-2016, but is most likely to complete before 16-Feb-2016.
After wave X is complete, expect the market to continue up into wave Y, which should be a three wave Zigzag pattern. Expect wave Y to retrace wave X by 128% - 319%. Wave Y can also be expected to be 90% - 319% of the price length of wave W. The expected time for wave Y to complete is 23% - 167% of the time taken for wave X to complete and 47% - 204% of the time taken for wave W to complete.
Wave b of the Cycle degree Flat with a rating of 80.3 is expected to complete in the price range 8.78 to 17.08, but more probably between 8.87 and 11.06. This wave could complete anytime between now and 25-Dec-2024, but is most likely to complete sometime between 07-Mar-2016 and 13-Apr-2017.
After wave b is complete, expect the market to continue down into wave c, which should be a five wave Impulsive pattern. Expect wave c to retrace wave b by 85% - 162%. Wave c can also be expected to be 90% - 162% of the price length of wave a. The expected time for wave c to complete is 20% - 136% of the time taken for wave b to complete and 20% - 110% of the time taken for wave a to complete.
Current Analysis Settings: Analysis Date Range: 16-Jun-2014 to 12-Feb-2016, Label Range: 15 - 50, Preferred Count Labels: 17, Min Rating: 75, Stocks toggle ON, Bias Towards Beginning of Data: 8, Bias Towards Major High/Low: 8, Largest Degree Wave Filter: Any Pattern
Rating:81.8
Current Trading Positions for Center Coast MLP & Infrastructure Fund (CEN) Daily on 12-Feb-2016
* A Primary degree trader (hold positions from months to years), would currently be shorting this market. The probability of this Target Area being correct is 88.6%. However, the random probability of this Target Area being correct is 65.0%. So the true probability of this Target Area being correct is 36.3% better than random.
* A Cycle degree trader (hold positions from quarters to years), would currently be trading long in this market. The probability of this Target Area being correct is 41.3%. However, the random probability of this Target Area being correct is 34.0%. So the true probability of this Target Area being correct is 21.5% better than random.
Extensive Elliott Commentary for Center Coast MLP & Infrastructure Fund (CEN) Daily on 12-Feb-2016 with two incomplete patterns:
Wave X of the Primary degree inverted Double Zigzag with a rating of 102.4 is expected to complete in the price range 6.21 to 8.94, but more probably between 7.11 and 8.44. This wave is due to complete anytime from now until 01-Apr-2016, but is most likely to complete before 24-Feb-2016.
After wave X is complete, expect the market to continue up into wave Y, which should be a three wave Zigzag pattern. Expect wave Y to retrace wave X by 128% - 319%. Wave Y can also be expected to be 90% - 319% of the price length of wave W. The expected time for wave Y to complete is 23% - 167% of the time taken for wave X to complete and 47% - 204% of the time taken for wave W to complete.
Wave b of the Cycle degree Flat with a rating of 81.8 is expected to complete in the price range 15.58 to 42.2, but more probably between 15.86 and 22.89. This wave could complete anytime between now and 26-Feb-2021, but is most likely to complete sometime between 18-Feb-2016 and 05-Oct-2016.
After wave b is complete, expect the market to continue down into wave c, which should be a five wave Impulsive pattern. Expect wave c to retrace wave b by 85% - 162%. Wave c can also be expected to be 90% - 162% of the price length of wave a. The expected time for wave c to complete is 20% - 136% of the time taken for wave b to complete and 20% - 110% of the time taken for wave a to complete.
Current Analysis Settings: Analysis Date Range: 18-Jul-2014 to 12-Feb-2016, Label Range: 15 - 50, Preferred Count Labels: 16, Min Rating: 75, Stocks toggle ON, Bias Towards Beginning of Data: 8, Bias Towards Major High/Low: 8, Largest Degree Wave Filter: Any Pattern
Rating:80.2
Current Trading Positions for Clearbridge American Energy MLP Fund Inc. (CBA) Daily on 12-Feb-2016
* A Primary degree trader (hold positions from months to years), would currently be trading long in this market. The probability of this Target Area being correct is 87.3%. However, the random probability of this Target Area being correct is 64.1%. So the true probability of this Target Area being correct is 36.2% better than random.
* A Cycle degree trader (hold positions from quarters to years), would currently be trading long in this market. The probability of this Target Area being correct is 41.0%. However, the random probability of this Target Area being correct is 34.0%. So the true probability of this Target Area being correct is 20.6% better than random.
Extensive Elliott Commentary for Clearbridge American Energy MLP Fund Inc. (CBA) Daily on 12-Feb-2016 with two incomplete patterns:
Wave Y of the Primary degree inverted Double 3 with a rating of 103.7 is expected to complete in the price range 4.81 to 15.94, but more probably between 6.61 and 9.53. This wave is most likely to complete sometime between 12-Feb-2016 and 29-Feb-2016 Note that it cannot complete until 12-Feb-2016 but must complete by 16-Mar-2016.
Wave Y will probably complete this Double Sideways pattern, although it could possibly extend into a Triple Sideways pattern.
This is the final wave in the pattern. When complete it will also complete wave b of the Cycle degree Flat with a rating of 80.2. These two waves have the same target ranges.
After wave b is complete, expect the market to continue down into wave c, which should be a five wave Impulsive pattern. Expect wave c to retrace wave b by 85% - 162%. Wave c can also be expected to be 90% - 162% of the price length of wave a. The expected time for wave c to complete is 20% - 136% of the time taken for wave b to complete and 20% - 110% of the time taken for wave a to complete.
Current Analysis Settings: Analysis Date Range: 08-Jul-2014 to 12-Feb-2016, Label Range: 15 - 50, Preferred Count Labels: 18, Min Rating: 75, Stocks toggle ON, Bias Towards Beginning of Data: 8, Bias Towards Major High/Low: 8, Largest Degree Wave Filter: Any Pattern
Rating:83.1
Current Trading Positions for Clearbridge Energy MLP Fund (CEM) Daily on 12-Feb-2016
* An Intermediate degree trader (hold positions from months to quarters), would currently be shorting this market. The probability of this Target Area being correct is 88.0%. However, the random probability of this Target Area being correct is 65.0%. So the true probability of this Target Area being correct is 35.4% better than random.
* A Primary degree trader (hold positions from months to years), would currently be trading long in this market. The probability of this Target Area being correct is 41.9%. However, the random probability of this Target Area being correct is 34.0%. So the true probability of this Target Area being correct is 23.2% better than random.
Extensive Elliott Commentary for Clearbridge Energy MLP Fund (CEM) Daily on 12-Feb-2016 with two incomplete patterns:
Wave (X) of the Intermediate degree inverted Double Zigzag with a rating of 100.7 is expected to complete in the price range 9.35 to 12.58, but more probably between 10.41 and 11.99. This wave is due to complete anytime from now until 01-Apr-2016, but is most likely to complete before 24-Feb-2016.
After wave (X) is complete, expect the market to continue up into wave (Y), which should be a three wave Zigzag pattern. Expect wave (Y) to retrace wave (X) by 128% - 319%. Wave (Y) can also be expected to be 90% - 319% of the price length of wave (W). The expected time for wave (Y) to complete is 23% - 167% of the time taken for wave (X) to complete and 47% - 204% of the time taken for wave (W) to complete.
Wave B of the Primary degree Flat with a rating of 83.1 is expected to complete in the price range 18.97 to 46.56, but more probably between 19.25 and 26.47. This wave is due to complete anytime from now until 10-Aug-2018, but is most likely to complete before 07-Jun-2016.
After wave B is complete, expect the market to continue down into wave C, which should be a five wave Impulsive pattern. Expect wave C to retrace wave B by 86% - 162%. Wave C can also be expected to be 90% - 162% of the price length of wave A. The expected time for wave C to complete is 19% - 134% of the time taken for wave B to complete and 24% - 115% of the time taken for wave A to complete.
Current Analysis Settings: Analysis Date Range: 11-Jun-2014 to 12-Feb-2016, Label Range: 15 - 50, Preferred Count Labels: 24, Min Rating: 75, Stocks toggle ON, Bias Towards Beginning of Data: 8, Bias Towards Major High/Low: 8, Largest Degree Wave Filter: Any Pattern
Rating:79.1
Current Trading Positions for Clearbridge Energy MLP Opp Fd (EMO) Daily on 12-Feb-2016
* A Primary degree trader (hold positions from months to years), would currently be trading long in this market. The probability of this Target Area being correct is 87.0%. However, the random probability of this Target Area being correct is 64.1%. So the true probability of this Target Area being correct is 35.7% better than random.
* A Cycle degree trader (hold positions from quarters to years), would currently be trading long in this market. The probability of this Target Area being correct is 40.7%. However, the random probability of this Target Area being correct is 34.0%. So the true probability of this Target Area being correct is 19.7% better than random.
Extensive Elliott Commentary for Clearbridge Energy MLP Opp Fd (EMO) Daily on 12-Feb-2016 with two incomplete patterns:
Wave Y of the Primary degree inverted Double 3 with a rating of 100.8 is expected to complete in the price range 6.99 to 24.41, but more probably between 9.88 and 14.5. This wave is most likely to complete sometime between 12-Feb-2016 and 29-Feb-2016 Note that it cannot complete until 12-Feb-2016 but must complete by 07-Mar-2016.
Wave Y will probably complete this Double Sideways pattern, although it could possibly extend into a Triple Sideways pattern.
This is the final wave in the pattern. When complete it will also complete wave b of the Cycle degree Flat with a rating of 79.1. These two waves have the same target ranges.
After wave b is complete, expect the market to continue down into wave c, which should be a five wave Impulsive pattern. Expect wave c to retrace wave b by 85% - 162%. Wave c can also be expected to be 90% - 162% of the price length of wave a. The expected time for wave c to complete is 20% - 136% of the time taken for wave b to complete and 20% - 110% of the time taken for wave a to complete.
Current Analysis Settings: Analysis Date Range: 21-Jul-2014 to 12-Feb-2016, Label Range: 15 - 50, Preferred Count Labels: 28, Min Rating: 75, Stocks toggle ON, Bias Towards Beginning of Data: 8, Bias Towards Major High/Low: 8, Largest Degree Wave Filter: Any Pattern
Rating:75.3
Current Trading Positions for ClearBridge Energy MLP Total Return Fund Inc. (CTR) Daily on 12-Feb-2016
* A Minor degree trader (hold positions from weeks to quarters), would currently be trading long in this market. The probability of this Target Area being correct is 87.2%. However, the random probability of this Target Area being correct is 64.1%. So the true probability of this Target Area being correct is 36.0% better than random.
* An Intermediate degree trader (hold positions from months to quarters), would currently be trading long in this market. The probability of this Target Area being correct is 67.6%. However, the random probability of this Target Area being correct is 45.0%. So the true probability of this Target Area being correct is 50.2% better than random.
* A Primary degree trader (hold positions from months to years), would currently be shorting this market. The probability of this Target Area being correct is 14.0%. However, the random probability of this Target Area being correct is 13.0%. So the true probability of this Target Area being correct is 7.7% better than random.
* A Cycle degree trader (hold positions from quarters to years), would currently be shorting this market. The probability of this Target Area being correct is 49.5%. However, the random probability of this Target Area being correct is 45.0%. So the true probability of this Target Area being correct is 10.0% better than random.
Extensive Elliott Commentary for ClearBridge Energy MLP Total Return Fund Inc. (CTR) Daily on 12-Feb-2016 with four incomplete patterns:
Wave Y of the Minor degree inverted Double 3 with a rating of 102.3 is expected to complete in the price range 6.87 to 24.43, but more probably between 9.68 and 14.23. This wave is most likely to complete sometime between 12-Feb-2016 and 29-Feb-2016 Note that it cannot complete until 12-Feb-2016 but must complete by 07-Mar-2016.
Wave Y will probably complete this Double Sideways pattern, although it could possibly extend into a Triple Sideways pattern.
This is the final wave in the pattern. When complete it will also complete wave (2) of the Intermediate degree inverted Impulse with a rating of 78.7. These two waves have the same target ranges.
After this wave (2) is complete, expect the market to continue down into wave (3). Wave (3) should always be an Impulse and should retrace wave (2) completely. Expect wave (3) to retrace wave (2) by 165% - 383%. Wave (3) can also be expected to be 83% - 383% of the price length of wave (1). The expected time for wave (3) to complete is 82% - 367% of the time taken for wave (2) to complete and 15% - 94% of the time taken for wave (1) to complete. The slope (ie. price range divided by time taken) of wave (3) should be between 47% and 194% of the slope of wave (1). Once wave (3) is complete, expect wave (4) to be a sideways corrective movement, then wave (5) to continue in the same direction as wave (3). Wave (5) will complete this Impulse.
Wave 3 of the Primary degree inverted Impulse with a rating of 81.3 is expected to complete at a price no higher than 9.07, but more probably between .98 and 7.53. This wave is due to complete anytime from now until 15-Apr-2016, but is most likely to complete before 24-Feb-2016.
When complete, expect the overall slope (ie. price range divided by time taken) of this wave 3 to be between 47% to 194% of the slope of wave 1. Then expect the market to pull back into wave 4, which will be corrective in nature and has a probability of 0% of being a Flat or other sideways pattern. Wave 4 should not retrace back into the price range of wave 1 or 2. Expect wave 4 to have between 5% - 140% of the price range of wave 2. The expected time for wave 4 to complete is between 15% - 136% of wave 2. After wave 4, expect wave 5 to move beyond the end of wave 3 to complete this Impulse.
Wave c of the Cycle degree Zigzag with a rating of 75.3 is expected to complete in the price range 5.17 to 14.8, but more probably between 10.71 and 14.38. This wave is due to complete anytime from now until 30-Sep-2016, but is most likely to complete before 25-Mar-2016.
This wave c will complete the ZigZag pattern.
Current Analysis Settings: Analysis Date Range: 21-Jul-2014 to 12-Feb-2016, Label Range: 15 - 50, Preferred Count Labels: 16, Min Rating: 75, Stocks toggle ON, Bias Towards Beginning of Data: 8, Bias Towards Major High/Low: 8, Largest Degree Wave Filter: Any Pattern
Rating:77.8
Current Trading Positions for Cohen & Steers MLP Income and Energy Opp Fund (MIE) Daily on 12-Feb-2016
* A Primary degree trader (hold positions from months to years), would currently be shorting this market. The probability of this Target Area being correct is 65.0%. However, the random probability of this Target Area being correct is 53.0%. So the true probability of this Target Area being correct is 22.6% better than random.
* A Cycle degree trader (hold positions from quarters to years), would currently be trading long in this market. The probability of this Target Area being correct is 40.1%. However, the random probability of this Target Area being correct is 34.0%. So the true probability of this Target Area being correct is 17.9% better than random.
Extensive Elliott Commentary for Cohen & Steers MLP Income and Energy Opp Fund (MIE) Daily on 12-Feb-2016 with two incomplete patterns:
Wave X of the Primary degree inverted Double 3 with a rating of 100.9 is expected to complete at a price no higher than 7.27, but more probably between 5.35 and 6.41. This wave was expected to complete before 11-Feb-2016, and must complete by 28-Mar-2016.
After wave X is complete, expect the market to continue up into wave Y, which will probably be a three wave corrective pattern. Expect wave Y to retrace wave X by 98% - 212%. Wave Y can also be expected to be 73% - 212% of the price length of wave W. The expected time for wave Y to complete is 27% - 214% of the time taken for wave X to complete and 38% - 222% of the time taken for wave W to complete.
Wave b of the Cycle degree Flat with a rating of 77.8 is expected to complete in the price range 16.99 to 49.31, but more probably between 17.32 and 25.86. This wave could complete anytime between now and 03-May-2024, but is most likely to complete sometime between 04-Mar-2016 and 13-Mar-2017.
After wave b is complete, expect the market to continue down into wave c, which should be a five wave Impulsive pattern. Expect wave c to retrace wave b by 85% - 162%. Wave c can also be expected to be 90% - 162% of the price length of wave a. The expected time for wave c to complete is 20% - 136% of the time taken for wave b to complete and 20% - 110% of the time taken for wave a to complete.
Current Analysis Settings: Analysis Date Range: 24-Jul-2014 to 12-Feb-2016, Label Range: 15 - 50, Preferred Count Labels: 17, Min Rating: 75, Stocks toggle ON, Bias Towards Beginning of Data: 8, Bias Towards Major High/Low: 8, Largest Degree Wave Filter: Any Pattern
Rating:78.9
Current Trading Positions for C-Tracks Citi Volatility Index TR ETN (CVOL) Daily on 12-Feb-2016
* An Intermediate degree trader (hold positions from months to quarters), would currently be trading long in this market. The probability of this Target Area being correct is 44.0%. However, the random probability of this Target Area being correct is 13.0%. So the true probability of this Target Area being correct is 238.5% better than random.
* A Cycle degree trader (hold positions from quarters to years), would currently be trading long in this market. The probability of this Target Area being correct is 77.2%. However, the random probability of this Target Area being correct is 65.0%. So the true probability of this Target Area being correct is 18.8% better than random.
Extensive Elliott Commentary for C-Tracks Citi Volatility Index TR ETN (CVOL) Daily on 12-Feb-2016 with three incomplete patterns:
Wave (3) of the Intermediate degree Impulse with a rating of 95.7 is expected to complete in the price range .93 to 3.5, but more probably between 1 and 1.58. This wave is due to complete anytime from now until 28-Mar-2016, but is most likely to complete before 23-Feb-2016.
When complete, expect the overall slope (ie. price range divided by time taken) of this wave (3) to be between 70% to 219% of the slope of wave (1). Then expect the market to pull back into wave (4), which will be corrective in nature and has a probability of 83% of being a Flat or other sideways pattern. Wave (4) should not retrace back into the price range of wave (1) or (2). Expect wave (4) to have between 5% - 141% of the price range of wave (2). The expected time for wave (4) to complete is between 15% - 135% of wave (2). After wave (4), expect wave (5) to move beyond the end of wave (3) to complete this Impulse.
Wave C of the Primary degree inverted Flat with a rating of 83.8 is expected to complete in the price range .51 to 1.83, but more probably between .83 and 1.29. This wave is due to complete anytime from now until 28-Oct-2016, but is most likely to complete before 22-Apr-2016.
This wave C will complete the Flat pattern.
This is the final wave in the pattern. When complete it will also complete wave x of the Cycle degree Double Zigzag with a rating of 78.9. These two waves have the same target ranges.
After wave x is complete, expect the market to continue down into wave y, which should be a three wave Zigzag pattern. Expect wave y to retrace wave x by 116% - 261%. Wave y can also be expected to be 90% - 261% of the price length of wave w. The expected time for wave y to complete is 21% - 160% of the time taken for wave x to complete and 25% - 152% of the time taken for wave w to complete.
Current Analysis Settings: Analysis Date Range: 23-Dec-2013 to 12-Feb-2016, Label Range: 15 - 50, Preferred Count Labels: 23, Min Rating: 75, Stocks toggle ON, Bias Towards Beginning of Data: 8, Bias Towards Major High/Low: 8, Largest Degree Wave Filter: Any Pattern
Rating:102.4
Current Trading Positions for DB Gold Double Short ETN (DZZ) Daily on 12-Feb-2016
* A Cycle degree trader (hold positions from quarters to years), would currently be shorting this market. The probability of this Target Area being correct is 50.2%. However, the random probability of this Target Area being correct is 34.0%. So the true probability of this Target Area being correct is 47.6% better than random.
Extensive Elliott Commentary for DB Gold Double Short ETN (DZZ) Daily on 12-Feb-2016 with one incomplete pattern:
Wave b of the Cycle degree inverted Flat with a rating of 102.4 is expected to complete in the price range 2.23 to 6.77, but more probably between 5.67 and 6.67. This wave could complete anytime between now and 31-Dec-2018, but is most likely to complete sometime between 15-Feb-2016 and 05-Sep-2016.
After wave b is complete, expect the market to continue up into wave c, which should be a five wave Impulsive pattern. Expect wave c to retrace wave b by 82% - 179%. Wave c can also be expected to be 67% - 179% of the price length of wave a. The expected time for wave c to complete is 20% - 151% of the time taken for wave b to complete and 11% - 58% of the time taken for wave a to complete.
Current Analysis Settings: Analysis Date Range: 31-Jan-2014 to 12-Feb-2016, Label Range: 15 - 50, Preferred Count Labels: 18, Min Rating: 75, Stocks toggle ON, Bias Towards Beginning of Data: 8, Bias Towards Major High/Low: 8, Largest Degree Wave Filter: Any Pattern
Rating:101.5
Current Trading Positions for DB Gold Short ETN (DGZ) Daily on 12-Feb-2016
* An Intermediate degree trader (hold positions from months to quarters), would currently be trading long in this market. The probability of this Target Area being correct is 65.9%. However, the random probability of this Target Area being correct is 53.0%. So the true probability of this Target Area being correct is 24.3% better than random.
Extensive Elliott Commentary for DB Gold Short ETN (DGZ) Daily on 12-Feb-2016 with one incomplete pattern:
Wave (X) of the Intermediate degree Double 3 with a rating of 101.5 is expected to complete in the price range 14.98 to 24.04, but more probably between 15.49 and 16.43. This wave is most likely to complete sometime between 12-Feb-2016 and 19-Feb-2016 Note that it cannot complete until 12-Feb-2016 but must complete by 16-Mar-2016.
After wave (X) is complete, expect the market to continue down into wave (Y), which will probably be a three wave corrective pattern. Expect wave (Y) to retrace wave (X) by 98% - 183%. Wave (Y) can also be expected to be 81% - 183% of the price length of wave (W). The expected time for wave (Y) to complete is 40% - 187% of the time taken for wave (X) to complete and 100% - 304% of the time taken for wave (W) to complete.
Current Analysis Settings: Analysis Date Range: 14-Jul-2015 to 12-Feb-2016, Label Range: 15 - 50, Preferred Count Labels: 16, Min Rating: 75, Stocks toggle ON, Bias Towards Beginning of Data: 8, Bias Towards Major High/Low: 8, Largest Degree Wave Filter: Any Pattern
Rating:75.7
Current Trading Positions for db-X MSCI EAFE Curr-Hedged Equity Fd (DBEF) Daily on 12-Feb-2016
* An Intermediate degree trader (hold positions from months to quarters), would currently be shorting this market. The probability of this Target Area being correct is 50.0%. However, the random probability of this Target Area being correct is 34.0%. So the true probability of this Target Area being correct is 47.1% better than random.
* A Primary degree trader (hold positions from months to years), would currently be trading long in this market. The probability of this Target Area being correct is 85.5%. However, the random probability of this Target Area being correct is 64.1%. So the true probability of this Target Area being correct is 33.4% better than random.
* A Cycle degree trader (hold positions from quarters to years), would currently be trading long in this market. The probability of this Target Area being correct is 39.5%. However, the random probability of this Target Area being correct is 34.0%. So the true probability of this Target Area being correct is 16.2% better than random.
Extensive Elliott Commentary for db-X MSCI EAFE Curr-Hedged Equity Fd (DBEF) Daily on 12-Feb-2016 with three incomplete patterns:
Wave (B) of the Intermediate degree inverted Flat with a rating of 100.4 is expected to complete in the price range 16.35 to 24.61, but more probably between 23.33 and 24.57. This wave is due to complete anytime from now until 08-Apr-2016, but is most likely to complete before 15-Feb-2016.
After wave (B) is complete, expect the market to continue up into wave (C), which should be a five wave Impulsive pattern. Expect wave (C) to retrace wave (B) by 80% - 169%. Wave (C) can also be expected to be 99% - 169% of the price length of wave (A). The expected time for wave (C) to complete is 19% - 187% of the time taken for wave (B) to complete and 56% - 268% of the time taken for wave (A) to complete.
Wave Y of the Primary degree inverted Double 3 with a rating of 85.8 is expected to complete in the price range 24.64 to 43.49, but more probably between 27.63 and 33.49. This wave is due to complete anytime from now until 01-Jul-2016, but is most likely to complete before 19-Apr-2016.
Wave Y will probably complete this Double Sideways pattern, although it could possibly extend into a Triple Sideways pattern.
This is the final wave in the pattern. When complete it will also complete wave b of the Cycle degree Flat with a rating of 75.7. These two waves have the same target ranges.
After wave b is complete, expect the market to continue down into wave c, which should be a five wave Impulsive pattern. Expect wave c to retrace wave b by 86% - 162%. Wave c can also be expected to be 90% - 162% of the price length of wave a. The expected time for wave c to complete is 19% - 134% of the time taken for wave b to complete and 24% - 115% of the time taken for wave a to complete.
Current Analysis Settings: Analysis Date Range: 04-Feb-2015 to 12-Feb-2016, Label Range: 15 - 50, Preferred Count Labels: 17, Min Rating: 75, Stocks toggle ON, Bias Towards Beginning of Data: 8, Bias Towards Major High/Low: 8, Largest Degree Wave Filter: Any Pattern
Rating:76.3
Current Trading Positions for db-X MSCI Emerging Mkts Curr-Hedged Equity Fd (DBEM) Daily on 12-Feb-2016
* An Intermediate degree trader (hold positions from months to quarters), would currently be shorting this market. The probability of this Target Area being correct is 70.8%. However, the random probability of this Target Area being correct is 45.0%. So the true probability of this Target Area being correct is 57.3% better than random.
* A Cycle degree trader (hold positions from quarters to years), would currently be trading long in this market. The probability of this Target Area being correct is 54.7%. However, the random probability of this Target Area being correct is 53.0%. So the true probability of this Target Area being correct is 3.2% better than random.
Extensive Elliott Commentary for db-X MSCI Emerging Mkts Curr-Hedged Equity Fd (DBEM) Daily on 12-Feb-2016 with three incomplete patterns:
Wave (2) of the Intermediate degree Impulse with a rating of 96.3 is expected to complete in the price range 16.22 to 17.33, but more probably between 16.78 and 17.21. This wave was expected to complete before 02-Feb-2016, and must complete by 25-Feb-2016.
After this wave (2) is complete, expect the market to continue up into wave (3). Wave (3) should always be an Impulse and should retrace wave (2) completely. Expect wave (3) to retrace wave (2) by 164% - 383%. Wave (3) can also be expected to be 83% - 383% of the price length of wave (1). The expected time for wave (3) to complete is 87% - 367% of the time taken for wave (2) to complete and 16% - 97% of the time taken for wave (1) to complete. The slope (ie. price range divided by time taken) of wave (3) should be between 70% and 219% of the slope of wave (1). Once wave (3) is complete, expect wave (4) to be a sideways corrective movement, then wave (5) to continue in the same direction as wave (3). Wave (5) will complete this Impulse.
Wave C of the Primary degree inverted Flat with a rating of 80.9 is expected to complete in the price range 17.01 to 25.12, but more probably between 18.98 and 21.79. This wave is due to complete anytime from now until 08-Jul-2016, but is most likely to complete before 06-May-2016.
This wave C will complete the Flat pattern.
This is the final wave in the pattern. When complete it will also complete wave x of the Cycle degree Double 3 with a rating of 76.3. These two waves have the same target ranges.
After wave x is complete, expect the market to continue down into wave y, which will probably be a three wave corrective pattern. Expect wave y to retrace wave x by 98% - 190%. Wave y can also be expected to be 73% - 190% of the price length of wave w. The expected time for wave y to complete is 25% - 187% of the time taken for wave x to complete and 28% - 204% of the time taken for wave w to complete.
Current Analysis Settings: Analysis Date Range: 16-Mar-2015 to 12-Feb-2016, Label Range: 15 - 50, Preferred Count Labels: 15, Min Rating: 75, Stocks toggle ON, Bias Towards Beginning of Data: 8, Bias Towards Major High/Low: 8, Largest Degree Wave Filter: Any Pattern
Rating:92.8
Current Trading Positions for Direxion 20 Year Treasury Bull 3x (TMF) Daily on 12-Feb-2016
* A Primary degree trader (hold positions from months to years), would currently be trading long in this market. The probability of this Target Area being correct is 48.2%. However, the random probability of this Target Area being correct is 34.0%. So the true probability of this Target Area being correct is 41.8% better than random.
* A Cycle degree trader (hold positions from quarters to years), would currently be shorting this market. The probability of this Target Area being correct is 45.2%. However, the random probability of this Target Area being correct is 34.0%. So the true probability of this Target Area being correct is 32.9% better than random.
Extensive Elliott Commentary for Direxion 20 Year Treasury Bull 3x (TMF) Daily on 12-Feb-2016 with two incomplete patterns:
Wave B of the Primary degree Flat with a rating of 97.9 is expected to complete in the price range 80.3 to 134.67, but more probably between 80.61 and 90.9. This wave is due to complete anytime from now until 19-Aug-2016, but is most likely to complete before 16-Feb-2016.
After wave B is complete, expect the market to continue down into wave C, which should be a five wave Impulsive pattern. Expect wave C to retrace wave B by 89% - 167%. Wave C can also be expected to be 104% - 167% of the price length of wave A. The expected time for wave C to complete is 20% - 146% of the time taken for wave B to complete and 53% - 275% of the time taken for wave A to complete.
Wave b of the Cycle degree inverted Flat with a rating of 92.8 is expected to complete in the price range 28.72 to 66.19, but more probably between 57.11 and 65.34. This wave is due to complete anytime from now until 22-Dec-2017, but is most likely to complete before 04-May-2016.
After wave b is complete, expect the market to continue up into wave c, which should be a five wave Impulsive pattern. Expect wave c to retrace wave b by 82% - 179%. Wave c can also be expected to be 67% - 179% of the price length of wave a. The expected time for wave c to complete is 20% - 151% of the time taken for wave b to complete and 11% - 58% of the time taken for wave a to complete.
Current Analysis Settings: Analysis Date Range: 06-Dec-2013 to 12-Feb-2016, Label Range: 15 - 50, Preferred Count Labels: 26, Min Rating: 75, Stocks toggle ON, Bias Towards Beginning of Data: 8, Bias Towards Major High/Low: 8, Largest Degree Wave Filter: Any Pattern
Rating:78.4
Current Trading Positions for Direxion Daily 20 Yr Bear 3X Sh (TMV) Daily on 12-Feb-2016
* A Minor degree trader (hold positions from weeks to quarters), would currently be shorting this market. The probability of this Target Area being correct is 48.2%. However, the random probability of this Target Area being correct is 34.0%. So the true probability of this Target Area being correct is 41.8% better than random.
* An Intermediate degree trader (hold positions from months to quarters), would currently be trading long in this market. The probability of this Target Area being correct is 40.7%. However, the random probability of this Target Area being correct is 34.0%. So the true probability of this Target Area being correct is 19.7% better than random.
* A Primary degree trader (hold positions from months to years), would currently be shorting this market. The probability of this Target Area being correct is 39.5%. However, the random probability of this Target Area being correct is 34.0%. So the true probability of this Target Area being correct is 16.2% better than random.
* A Cycle degree trader (hold positions from quarters to years), would currently be trading long in this market. The probability of this Target Area being correct is 77.2%. However, the random probability of this Target Area being correct is 65.0%. So the true probability of this Target Area being correct is 18.8% better than random.
Extensive Elliott Commentary for Direxion Daily 20 Yr Bear 3X Sh (TMV) Daily on 12-Feb-2016 with four incomplete patterns:
Wave B of the Minor degree inverted Flat with a rating of 97.3 is expected to complete in the price range 17.39 to 26.8, but more probably between 24.18 and 26.68. This wave was expected to complete before 28-Jan-2016, and must complete by 15-Dec-2016.
After wave B is complete, expect the market to continue up into wave C, which should be a five wave Impulsive pattern. Expect wave C to retrace wave B by 82% - 177%. Wave C can also be expected to be 89% - 177% of the price length of wave A. The expected time for wave C to complete is 15% - 160% of the time taken for wave B to complete and 16% - 118% of the time taken for wave A to complete.
Wave (B) of the Intermediate degree Flat with a rating of 79.9 is expected to complete in the price range 31.56 to 50.85, but more probably between 31.76 and 36.8. This wave was expected to complete before 22-Dec-2015, and must complete by 24-May-2017.
After wave (B) is complete, expect the market to continue down into wave (C), which should be a five wave Impulsive pattern. Expect wave (C) to retrace wave (B) by 86% - 162%. Wave (C) can also be expected to be 90% - 162% of the price length of wave (A). The expected time for wave (C) to complete is 19% - 134% of the time taken for wave (B) to complete and 24% - 115% of the time taken for wave (A) to complete.
Wave B of the Primary degree inverted Flat with a rating of 75.6 is expected to complete in the price range 9.28 to 27.15, but more probably between 22.17 and 26.92. This wave was expected to complete before 03-Sep-2015, and must complete by 06-Jan-2017.
After wave B is complete, expect the market to continue up into wave C, which should be a five wave Impulsive pattern. Expect wave C to retrace wave B by 82% - 177%. Wave C can also be expected to be 89% - 177% of the price length of wave A. The expected time for wave C to complete is 15% - 160% of the time taken for wave B to complete and 16% - 118% of the time taken for wave A to complete.
Wave x of the Cycle degree Double Zigzag with a rating of 78.4 is expected to complete in the price range 28.59 to 52.18, but more probably between 35.21 and 47.29. This wave was expected to complete before 10-Dec-2015, and must complete by 27-Jul-2017.
After wave x is complete, expect the market to continue down into wave y, which should be a three wave Zigzag pattern. Expect wave y to retrace wave x by 117% - 263%. Wave y can also be expected to be 90% - 263% of the price length of wave w. The expected time for wave y to complete is 21% - 161% of the time taken for wave x to complete and 27% - 154% of the time taken for wave w to complete.
Current Analysis Settings: Analysis Date Range: 06-Dec-2013 to 12-Feb-2016, Label Range: 15 - 50, Preferred Count Labels: 22, Min Rating: 75, Stocks toggle ON, Bias Towards Beginning of Data: 8, Bias Towards Major High/Low: 8, Largest Degree Wave Filter: Any Pattern
Rating:97.8
Current Trading Positions for Direxion Daily China Bear 3X (YANG) Daily on 12-Feb-2016
* A Primary degree trader (hold positions from months to years), would currently be trading long in this market. The probability of this Target Area being correct is 48.2%. However, the random probability of this Target Area being correct is 34.0%. So the true probability of this Target Area being correct is 41.8% better than random.
Extensive Elliott Commentary for Direxion Daily China Bear 3X (YANG) Daily on 12-Feb-2016 with one incomplete pattern:
Wave B of the Primary degree Flat with a rating of 97.8 is expected to complete in the price range 127.04 to 282.35, but more probably between 128.63 and 169.25. This wave was expected to complete before 12-Jan-2016, and must complete by 08-Dec-2016.
After wave B is complete, expect the market to continue down into wave C, which should be a five wave Impulsive pattern. Expect wave C to retrace wave B by 86% - 162%. Wave C can also be expected to be 90% - 162% of the price length of wave A. The expected time for wave C to complete is 19% - 134% of the time taken for wave B to complete and 24% - 115% of the time taken for wave A to complete.
Current Analysis Settings: Analysis Date Range: 06-Feb-2014 to 12-Feb-2016, Label Range: 15 - 50, Preferred Count Labels: 15, Min Rating: 75, Stocks toggle ON, Bias Towards Beginning of Data: 8, Bias Towards Major High/Low: 8, Largest Degree Wave Filter: Any Pattern
Rating:84.8
Current Trading Positions for Direxion Daily China Bull 3X (YINN) Daily on 12-Feb-2016
* An Intermediate degree trader (hold positions from months to quarters), would currently be shorting this market. The probability of this Target Area being correct is 44.0%. However, the random probability of this Target Area being correct is 13.0%. So the true probability of this Target Area being correct is 238.5% better than random.
* A Primary degree trader (hold positions from months to years), would currently be shorting this market. The probability of this Target Area being correct is 14.0%. However, the random probability of this Target Area being correct is 13.0%. So the true probability of this Target Area being correct is 7.7% better than random.
* A Cycle degree trader (hold positions from quarters to years), would currently be shorting this market. The probability of this Target Area being correct is 50.4%. However, the random probability of this Target Area being correct is 45.0%. So the true probability of this Target Area being correct is 12.0% better than random.
Extensive Elliott Commentary for Direxion Daily China Bull 3X (YINN) Daily on 12-Feb-2016 with three incomplete patterns:
Wave (3) of the Intermediate degree inverted Impulse with a rating of 95.5 is expected to complete at a price no higher than 7.14, but more probably no higher than 5.16. This wave is due to complete anytime from now until 12-Apr-2016, but is most likely to complete before 22-Feb-2016.
When complete, expect the overall slope (ie. price range divided by time taken) of this wave (3) to be between 47% to 194% of the slope of wave (1). Then expect the market to pull back into wave (4), which will be corrective in nature and has a probability of 0% of being a Flat or other sideways pattern. Wave (4) should not retrace back into the price range of wave (1) or (2). Expect wave (4) to have between 5% - 140% of the price range of wave (2). The expected time for wave (4) to complete is between 16% - 136% of wave (2). After wave (4), expect wave (5) to move beyond the end of wave (3) to complete this Impulse.
Wave 3 of the Primary degree inverted Impulse with a rating of 79.2 is expected to complete at a price no higher than 14.53, but more probably between 2.55 and 12.07. This wave was expected to complete before 08-Feb-2016, and must complete by 29-Mar-2016.
When complete, expect the overall slope (ie. price range divided by time taken) of this wave 3 to be between 47% to 194% of the slope of wave 1. Then expect the market to pull back into wave 4, which will be corrective in nature and has a probability of 0% of being a Flat or other sideways pattern. Wave 4 should not retrace back into the price range of wave 1 or 2. Expect wave 4 to have between 5% - 140% of the price range of wave 2. The expected time for wave 4 to complete is between 15% - 136% of wave 2. After wave 4, expect wave 5 to move beyond the end of wave 3 to complete this Impulse.
Wave c of the Cycle degree Zigzag with a rating of 84.8 is expected to complete at a price no higher than 15.92, but more probably no higher than 13.78. This wave was expected to complete before 10-Feb-2016, and must complete by 02-Sep-2016.
This wave c will complete the ZigZag pattern.
Current Analysis Settings: Analysis Date Range: 16-Mar-2015 to 12-Feb-2016, Label Range: 15 - 50, Preferred Count Labels: 16, Min Rating: 75, Stocks toggle ON, Bias Towards Beginning of Data: 8, Bias Towards Major High/Low: 8, Largest Degree Wave Filter: Any Pattern
Rating:91
Current Trading Positions for Direxion Daily Emerging Markets Bear 3x (EDZ) Daily on 12-Feb-2016
* An Intermediate degree trader (hold positions from months to quarters), would currently be trading long in this market. The probability of this Target Area being correct is 70.8%. However, the random probability of this Target Area being correct is 45.0%. So the true probability of this Target Area being correct is 57.3% better than random.
Extensive Elliott Commentary for Direxion Daily Emerging Markets Bear 3x (EDZ) Daily on 12-Feb-2016 with two incomplete patterns:
Wave (2) of the Intermediate degree inverted Impulse with a rating of 96.9 is expected to complete in the price range 53.11 to 71.59, but more probably between 56.68 and 64.03. This wave was expected to complete before 09-Feb-2016, and must complete by 14-Mar-2016.
After this wave (2) is complete, expect the market to continue down into wave (3). Wave (3) should always be an Impulse and should retrace wave (2) completely. Expect wave (3) to retrace wave (2) by 165% - 383%. Wave (3) can also be expected to be 83% - 383% of the price length of wave (1). The expected time for wave (3) to complete is 82% - 367% of the time taken for wave (2) to complete and 15% - 94% of the time taken for wave (1) to complete. The slope (ie. price range divided by time taken) of wave (3) should be between 47% and 194% of the slope of wave (1). Once wave (3) is complete, expect wave (4) to be a sideways corrective movement, then wave (5) to continue in the same direction as wave (3). Wave (5) will complete this Impulse.
Wave C of the Primary degree Flat with a rating of 91 is expected to complete in the price range 4.61 to 58, but more probably between 22.05 and 46.03. This wave is due to complete anytime from now until 12-Dec-2016, but is most likely to complete before 29-Mar-2016.
This wave C will complete the Flat pattern.
Current Analysis Settings: Analysis Date Range: 17-Mar-2015 to 12-Feb-2016, Label Range: 15 - 50, Preferred Count Labels: 15, Min Rating: 75, Stocks toggle ON, Bias Towards Beginning of Data: 8, Bias Towards Major High/Low: 8, Largest Degree Wave Filter: Any Pattern
Rating:87.2
Current Trading Positions for Direxion Daily Emerging Markets Bull 3x Shares (EDC) Daily on 12-Feb-2016
* A Primary degree trader (hold positions from months to years), would currently be trading long in this market. The probability of this Target Area being correct is 86.9%. However, the random probability of this Target Area being correct is 64.1%. So the true probability of this Target Area being correct is 35.6% better than random.
* A Cycle degree trader (hold positions from quarters to years), would currently be trading long in this market. The probability of this Target Area being correct is 43.1%. However, the random probability of this Target Area being correct is 34.0%. So the true probability of this Target Area being correct is 26.8% better than random.
Extensive Elliott Commentary for Direxion Daily Emerging Markets Bull 3x Shares (EDC) Daily on 12-Feb-2016 with two incomplete patterns:
Wave Y of the Primary degree inverted Double 3 with a rating of 99 is expected to complete in the price range 9.47 to 40.79, but more probably between 14.06 and 24.84. This wave is due to complete anytime from now until 23-Aug-2016, but is most likely to complete before 02-May-2016.
Wave Y will probably complete this Double Sideways pattern, although it could possibly extend into a Triple Sideways pattern.
This is the final wave in the pattern. When complete it will also complete wave b of the Cycle degree Flat with a rating of 87.2. These two waves have the same target ranges.
After wave b is complete, expect the market to continue down into wave c, which should be a five wave Impulsive pattern. Expect wave c to retrace wave b by 85% - 162%. Wave c can also be expected to be 90% - 162% of the price length of wave a. The expected time for wave c to complete is 20% - 136% of the time taken for wave b to complete and 20% - 110% of the time taken for wave a to complete.
Current Analysis Settings: Analysis Date Range: 25-Jul-2014 to 12-Feb-2016, Label Range: 15 - 50, Preferred Count Labels: 18, Min Rating: 75, Stocks toggle ON, Bias Towards Beginning of Data: 8, Bias Towards Major High/Low: 8, Largest Degree Wave Filter: Any Pattern
Rating:75.5
Current Trading Positions for Direxion Daily Gold Miners Bear 3x Shares (DUST) Daily on 12-Feb-2016
* A Minute degree trader (hold positions from weeks to months), would currently be shorting this market. The probability of this Target Area being correct is 57.8%. However, the random probability of this Target Area being correct is 45.0%. So the true probability of this Target Area being correct is 28.4% better than random.
* A Minor degree trader (hold positions from weeks to quarters), would currently be shorting this market. The probability of this Target Area being correct is 39.5%. However, the random probability of this Target Area being correct is 34.0%. So the true probability of this Target Area being correct is 16.2% better than random.
* An Intermediate degree trader (hold positions from months to quarters), would currently be trading long in this market. The probability of this Target Area being correct is 85.4%. However, the random probability of this Target Area being correct is 64.1%. So the true probability of this Target Area being correct is 33.2% better than random.
* A Primary degree trader (hold positions from months to years), would currently be trading long in this market. The probability of this Target Area being correct is 40.4%. However, the random probability of this Target Area being correct is 34.0%. So the true probability of this Target Area being correct is 18.8% better than random.
* A Cycle degree trader (hold positions from quarters to years), would currently be shorting this market. The probability of this Target Area being correct is 84.5%. However, the random probability of this Target Area being correct is 64.1%. So the true probability of this Target Area being correct is 31.8% better than random.
Extensive Elliott Commentary for Direxion Daily Gold Miners Bear 3x Shares (DUST) Daily on 12-Feb-2016 with five incomplete patterns:
Wave c of the Minute degree Zigzag with a rating of 95 is expected to complete at a price no higher than 6.06, but more probably no higher than 3.72. This wave is most likely to complete sometime between 15-Feb-2016 and 22-Feb-2016 Note that it cannot complete until 15-Feb-2016 but must complete by 29-Feb-2016.
This wave c will complete the ZigZag pattern.
This is the final wave in the pattern. When complete it will also complete wave B of the Minor degree inverted Flat with a rating of 75.9. These two waves have the same target ranges.
After wave B is complete, expect the market to continue up into wave C, which should be a five wave Impulsive pattern. Expect wave C to retrace wave B by 80% - 169%. Wave C can also be expected to be 99% - 169% of the price length of wave A. The expected time for wave C to complete is 19% - 187% of the time taken for wave B to complete and 56% - 268% of the time taken for wave A to complete.
Wave (Y) of the Intermediate degree inverted Double 3 with a rating of 84.6 is expected to complete in the price range 13.23 to 67.99, but more probably between 22.28 and 37.15. This wave is due to complete anytime from now until 01-Apr-2016, but is most likely to complete before 09-Mar-2016.
Wave (Y) will probably complete this Double Sideways pattern, although it could possibly extend into a Triple Sideways pattern.
This is the final wave in the pattern. When complete it will also complete wave B of the Primary degree Flat with a rating of 78.4. These two waves have the same target ranges.
After wave B is complete, expect the market to continue down into wave C, which should be a five wave Impulsive pattern. Expect wave C to retrace wave B by 86% - 162%. Wave C can also be expected to be 90% - 162% of the price length of wave A. The expected time for wave C to complete is 19% - 134% of the time taken for wave B to complete and 24% - 115% of the time taken for wave A to complete.
Wave y of the Cycle degree Double 3 with a rating of 75.5 is expected to complete at a price no higher than 37.97, but more probably no higher than 10.46. This wave is due to complete anytime from now until 06-Jun-2016, but is most likely to complete before 01-Mar-2016.
Wave y will probably complete this Double Sideways pattern, although it could possibly extend into a Triple Sideways pattern.
Current Analysis Settings: Analysis Date Range: 25-Sep-2014 to 12-Feb-2016, Label Range: 15 - 50, Preferred Count Labels: 17, Min Rating: 75, Stocks toggle ON, Bias Towards Beginning of Data: 8, Bias Towards Major High/Low: 8, Largest Degree Wave Filter: Any Pattern
Rating:77.6
Current Trading Positions for Direxion Daily Gold Miners Bull 3x Shares (NUGT) Daily on 12-Feb-2016
* An Intermediate degree trader (hold positions from months to quarters), would currently be trading long in this market. The probability of this Target Area being correct is 88.6%. However, the random probability of this Target Area being correct is 65.0%. So the true probability of this Target Area being correct is 36.3% better than random.
* A Primary degree trader (hold positions from months to years), would currently be shorting this market. The probability of this Target Area being correct is 39.5%. However, the random probability of this Target Area being correct is 34.0%. So the true probability of this Target Area being correct is 16.2% better than random.
* A Cycle degree trader (hold positions from quarters to years), would currently be trading long in this market. The probability of this Target Area being correct is 76.8%. However, the random probability of this Target Area being correct is 65.0%. So the true probability of this Target Area being correct is 18.2% better than random.
Extensive Elliott Commentary for Direxion Daily Gold Miners Bull 3x Shares (NUGT) Daily on 12-Feb-2016 with three incomplete patterns:
Wave (X) of the Intermediate degree Double Zigzag with a rating of 102.8 is expected to complete in the price range 43.33 to 141.9, but more probably between 70.98 and 121.46. This wave is due to complete anytime from now until 15-Sep-2017, but is most likely to complete before 09-Jun-2016.
After wave (X) is complete, expect the market to continue down into wave (Y), which should be a three wave Zigzag pattern. Expect wave (Y) to retrace wave (X) by 117% - 263%. Wave (Y) can also be expected to be 90% - 263% of the price length of wave (W). The expected time for wave (Y) to complete is 21% - 161% of the time taken for wave (X) to complete and 27% - 154% of the time taken for wave (W) to complete.
Wave B of the Primary degree inverted Flat with a rating of 75.9 is expected to complete in the price range 6.45 to 101.56, but more probably between 75.07 and 100.36. This wave was expected to complete before 20-Jul-2015, and must complete by 13-Jun-2016.
After wave B is complete, expect the market to continue up into wave C, which should be a five wave Impulsive pattern. Expect wave C to retrace wave B by 82% - 177%. Wave C can also be expected to be 89% - 177% of the price length of wave A. The expected time for wave C to complete is 15% - 160% of the time taken for wave B to complete and 16% - 118% of the time taken for wave A to complete.
Wave x of the Cycle degree Double Zigzag with a rating of 77.6 is expected to complete in the price range 162.79 to 532.2, but more probably between 266.4 and 455.61. This wave was expected to complete before 02-Feb-2016, and must complete by 21-Sep-2017.
After wave x is complete, expect the market to continue down into wave y, which should be a three wave Zigzag pattern. Expect wave y to retrace wave x by 117% - 263%. Wave y can also be expected to be 90% - 263% of the price length of wave w. The expected time for wave y to complete is 21% - 161% of the time taken for wave x to complete and 27% - 154% of the time taken for wave w to complete.
Current Analysis Settings: Analysis Date Range: 31-Jan-2014 to 12-Feb-2016, Label Range: 15 - 50, Preferred Count Labels: 16, Min Rating: 75, Stocks toggle ON, Bias Towards Beginning of Data: 8, Bias Towards Major High/Low: 8, Largest Degree Wave Filter: Any Pattern
Rating:83.4
Current Trading Positions for Direxion Daily India Bull 3X S (INDL) Daily on 12-Feb-2016
* A Primary degree trader (hold positions from months to years), would currently be shorting this market. The probability of this Target Area being correct is 50.2%. However, the random probability of this Target Area being correct is 45.0%. So the true probability of this Target Area being correct is 11.6% better than random.
* A Cycle degree trader (hold positions from quarters to years), would currently be shorting this market. The probability of this Target Area being correct is 36.5%. However, the random probability of this Target Area being correct is 24.3%. So the true probability of this Target Area being correct is 50.2% better than random.
Extensive Elliott Commentary for Direxion Daily India Bull 3X S (INDL) Daily on 12-Feb-2016 with three incomplete patterns:
Wave (5) of the Intermediate degree inverted Ending Diagonal with a rating of 95.4 is expected to complete at a price no higher than 10.07, but more probably between 7.16 and 9.34. This wave was expected to complete before 10-Feb-2016, and must complete by 04-Mar-2016.
When complete, expect the overall slope (ie. price range divided by time taken) of this wave (5) to be between 49% and 173% of the slope of wave (3) and between 77% to 312% of the slope of wave (1). Wave (5) will complete this Ending Diagonal pattern.
This is the final wave in the pattern. When complete it will also complete wave C of the Primary degree Zigzag with a rating of 82.5. These two waves have the same target ranges.
This wave C will complete the ZigZag pattern.
This is the final wave in the pattern. When complete it will also complete wave y of the Cycle degree Double Zigzag with a rating of 83.4. These two waves have the same target ranges.
Wave y will probably complete this Double Sharp pattern, although it could possibly extend into a Triple Sharp pattern.
Current Analysis Settings: Analysis Date Range: 28-Jul-2014 to 12-Feb-2016, Label Range: 15 - 50, Preferred Count Labels: 31, Min Rating: 75, Stocks toggle ON, Bias Towards Beginning of Data: 8, Bias Towards Major High/Low: 8, Largest Degree Wave Filter: Any Pattern
Rating:81.8
Current Trading Positions for Direxion Daily Junior Gold Miners Index Bull 3x (JNUG) Daily on 12-Feb-2016
* A Cycle degree trader (hold positions from quarters to years), would currently be trading long in this market. The probability of this Target Area being correct is 78.4%. However, the random probability of this Target Area being correct is 65.0%. So the true probability of this Target Area being correct is 20.6% better than random.
Extensive Elliott Commentary for Direxion Daily Junior Gold Miners Index Bull 3x (JNUG) Daily on 12-Feb-2016 with two incomplete patterns:
Wave C of the Primary degree inverted Flat with a rating of 101.2 is expected to complete in the price range 34.55 to 105.25, but more probably between 50.5 and 84.37. This wave is due to complete anytime from now until 03-May-2017, but is most likely to complete before 21-Apr-2016.
This wave C will complete the Flat pattern.
This is the final wave in the pattern. When complete it will also complete wave x of the Cycle degree Double Zigzag with a rating of 81.8. These two waves have the same target ranges.
After wave x is complete, expect the market to continue down into wave y, which should be a three wave Zigzag pattern. Expect wave y to retrace wave x by 117% - 263%. Wave y can also be expected to be 90% - 263% of the price length of wave w. The expected time for wave y to complete is 21% - 161% of the time taken for wave x to complete and 27% - 154% of the time taken for wave w to complete.
Current Analysis Settings: Analysis Date Range: 31-Jan-2014 to 12-Feb-2016, Label Range: 15 - 50, Preferred Count Labels: 16, Min Rating: 75, Stocks toggle ON, Bias Towards Beginning of Data: 8, Bias Towards Major High/Low: 8, Largest Degree Wave Filter: Any Pattern
Rating:95
Current Trading Positions for Direxion Daily Real Estate Bull 3X Shares (DRN) Daily on 12-Feb-2016
* A Cycle degree trader (hold positions from quarters to years), would currently be shorting this market. The probability of this Target Area being correct is 41.0%. However, the random probability of this Target Area being correct is 24.3%. So the true probability of this Target Area being correct is 68.7% better than random.
Extensive Elliott Commentary for Direxion Daily Real Estate Bull 3X Shares (DRN) Daily on 12-Feb-2016 with one incomplete pattern:
Wave y of the Cycle degree Double Zigzag with a rating of 95 is expected to complete in the price range 27.9 to 30.42, but more probably between 29.16 and 29.75. This wave is most likely to complete sometime between 03-Mar-2016 and 22-Aug-2016 Note that it cannot complete until 29-Feb-2016 but must complete by 14-Jul-2017.
Wave y will probably complete this Double Sharp pattern, although it could possibly extend into a Triple Sharp pattern.
Current Analysis Settings: Analysis Date Range: 06-Dec-2013 to 12-Feb-2016, Label Range: 15 - 50, Preferred Count Labels: 17, Min Rating: 75, Stocks toggle ON, Bias Towards Beginning of Data: 8, Bias Towards Major High/Low: 8, Largest Degree Wave Filter: Any Pattern
Rating:77.7
Current Trading Positions for Direxion Daily Russia Bull 3X (RUSL) Daily on 12-Feb-2016
* A Primary degree trader (hold positions from months to years), would currently be trading long in this market. The probability of this Target Area being correct is 71.0%. However, the random probability of this Target Area being correct is 45.0%. So the true probability of this Target Area being correct is 57.8% better than random.
* A Cycle degree trader (hold positions from quarters to years), would currently be shorting this market. The probability of this Target Area being correct is 49.7%. However, the random probability of this Target Area being correct is 45.0%. So the true probability of this Target Area being correct is 10.4% better than random.
Extensive Elliott Commentary for Direxion Daily Russia Bull 3X (RUSL) Daily on 12-Feb-2016 with two incomplete patterns:
Wave 2 of the Primary degree inverted Impulse with a rating of 98.1 is expected to complete in the price range 7.27 to 19.5, but more probably between 8.66 and 13.38. This wave is due to complete anytime from now until 29-Aug-2016, but is most likely to complete before 17-Feb-2016.
After this wave 2 is complete, expect the market to continue down into wave 3. Wave 3 should always be an Impulse and should retrace wave 2 completely. Expect wave 3 to retrace wave 2 by 165% - 383%. Wave 3 can also be expected to be 83% - 383% of the price length of wave 1. The expected time for wave 3 to complete is 84% - 367% of the time taken for wave 2 to complete and 14% - 94% of the time taken for wave 1 to complete. The slope (ie. price range divided by time taken) of wave 3 should be between 47% and 194% of the slope of wave 1. Once wave 3 is complete, expect wave 4 to be a sideways corrective movement, then wave 5 to continue in the same direction as wave 3. Wave 5 will complete this Impulse.
Wave c of the Cycle degree Zigzag with a rating of 77.7 is expected to complete at a price no higher than 5.46, but more probably no higher than 0. This wave is due to complete anytime from now until 01-Mar-2018, but is most likely to complete before 23-Aug-2016.
This wave c will complete the ZigZag pattern.
Current Analysis Settings: Analysis Date Range: 06-Dec-2013 to 12-Feb-2016, Label Range: 15 - 50, Preferred Count Labels: 16, Min Rating: 75, Stocks toggle ON, Bias Towards Beginning of Data: 8, Bias Towards Major High/Low: 8, Largest Degree Wave Filter: Any Pattern
Rating:85
Current Trading Positions for Direxion Daily S&P 500 Bear 3X (SPXS) Daily on 12-Feb-2016
* A Primary degree trader (hold positions from months to years), would currently be trading long in this market. The probability of this Target Area being correct is 40.8%. However, the random probability of this Target Area being correct is 24.3%. So the true probability of this Target Area being correct is 67.9% better than random.
* A Cycle degree trader (hold positions from quarters to years), would currently be trading long in this market. The probability of this Target Area being correct is 42.5%. However, the random probability of this Target Area being correct is 34.0%. So the true probability of this Target Area being correct is 25.0% better than random.
Extensive Elliott Commentary for Direxion Daily S&P 500 Bear 3X (SPXS) Daily on 12-Feb-2016 with two incomplete patterns:
Wave Y of the Primary degree inverted Double Zigzag with a rating of 94.5 is expected to complete in the price range 26.18 to 50.22, but more probably between 26.71 and 35.09. This wave is most likely to complete sometime between 25-Feb-2016 and 29-Apr-2016 Note that it cannot complete until 23-Feb-2016 but must complete by 06-Jun-2016.
Wave Y will probably complete this Double Sharp pattern, although it could possibly extend into a Triple Sharp pattern.
This is the final wave in the pattern. When complete it will also complete wave b of the Cycle degree Flat with a rating of 85. These two waves have the same target ranges.
After wave b is complete, expect the market to continue down into wave c, which should be a five wave Impulsive pattern. Expect wave c to retrace wave b by 85% - 162%. Wave c can also be expected to be 90% - 162% of the price length of wave a. The expected time for wave c to complete is 20% - 136% of the time taken for wave b to complete and 20% - 110% of the time taken for wave a to complete.
Current Analysis Settings: Analysis Date Range: 23-Dec-2013 to 12-Feb-2016, Label Range: 15 - 50, Preferred Count Labels: 25, Min Rating: 75, Stocks toggle ON, Bias Towards Beginning of Data: 8, Bias Towards Major High/Low: 8, Largest Degree Wave Filter: Any Pattern
Rating:85.5
Current Trading Positions for Direxion Daily S&P 500 Bull 3X (SPXL) Daily on 12-Feb-2016
* An Intermediate degree trader (hold positions from months to quarters), would currently be shorting this market. The probability of this Target Area being correct is 88.3%. However, the random probability of this Target Area being correct is 65.0%. So the true probability of this Target Area being correct is 35.8% better than random.
* A Primary degree trader (hold positions from months to years), would currently be trading long in this market. The probability of this Target Area being correct is 43.4%. However, the random probability of this Target Area being correct is 34.0%. So the true probability of this Target Area being correct is 27.6% better than random.
* A Cycle degree trader (hold positions from quarters to years), would currently be shorting this market. The probability of this Target Area being correct is 42.5%. However, the random probability of this Target Area being correct is 34.0%. So the true probability of this Target Area being correct is 25.0% better than random.
Extensive Elliott Commentary for Direxion Daily S&P 500 Bull 3X (SPXL) Daily on 12-Feb-2016 with three incomplete patterns:
Wave (X) of the Intermediate degree inverted Double Zigzag with a rating of 101.6 is expected to complete in the price range 57.18 to 68.39, but more probably between 60.87 and 66.34. This wave is due to complete anytime from now until 14-Mar-2016, but is most likely to complete before 16-Feb-2016.
After wave (X) is complete, expect the market to continue up into wave (Y), which should be a three wave Zigzag pattern. Expect wave (Y) to retrace wave (X) by 128% - 319%. Wave (Y) can also be expected to be 90% - 319% of the price length of wave (W). The expected time for wave (Y) to complete is 23% - 167% of the time taken for wave (X) to complete and 47% - 204% of the time taken for wave (W) to complete.
Wave B of the Primary degree Flat with a rating of 88.5 is expected to complete in the price range 81.14 to 149.86, but more probably between 81.84 and 99.82. This wave is due to complete anytime from now until 25-Apr-2017, but is most likely to complete before 31-Mar-2016.
After wave B is complete, expect the market to continue down into wave C, which should be a five wave Impulsive pattern. Expect wave C to retrace wave B by 86% - 162%. Wave C can also be expected to be 90% - 162% of the price length of wave A. The expected time for wave C to complete is 19% - 134% of the time taken for wave B to complete and 24% - 115% of the time taken for wave A to complete.
Wave b of the Cycle degree inverted Flat with a rating of 85.5 is expected to complete in the price range 13.33 to 65.79, but more probably between 53.07 and 64.6. This wave is due to complete anytime from now until 16-Nov-2018, but is most likely to complete before 03-Aug-2016.
After wave b is complete, expect the market to continue up into wave c, which should be a five wave Impulsive pattern. Expect wave c to retrace wave b by 82% - 179%. Wave c can also be expected to be 67% - 179% of the price length of wave a. The expected time for wave c to complete is 20% - 151% of the time taken for wave b to complete and 11% - 58% of the time taken for wave a to complete.
Current Analysis Settings: Analysis Date Range: 23-Dec-2013 to 12-Feb-2016, Label Range: 15 - 50, Preferred Count Labels: 21, Min Rating: 75, Stocks toggle ON, Bias Towards Beginning of Data: 8, Bias Towards Major High/Low: 8, Largest Degree Wave Filter: Any Pattern
Rating:78.8
Current Trading Positions for Direxion Daily Semicon Bull 3X (SOXL) Daily on 12-Feb-2016
* A Primary degree trader (hold positions from months to years), would currently be shorting this market. The probability of this Target Area being correct is 59.1%. However, the random probability of this Target Area being correct is 45.0%. So the true probability of this Target Area being correct is 31.3% better than random.
* A Cycle degree trader (hold positions from quarters to years), would currently be shorting this market. The probability of this Target Area being correct is 40.4%. However, the random probability of this Target Area being correct is 34.0%. So the true probability of this Target Area being correct is 18.8% better than random.
Extensive Elliott Commentary for Direxion Daily Semicon Bull 3X (SOXL) Daily on 12-Feb-2016 with two incomplete patterns:
Wave C of the Primary degree Zigzag with a rating of 96.3 is expected to complete at a price no higher than 16.09, but more probably between 1.72 and 13.69. This wave is most likely to complete sometime between 22-Feb-2016 and 24-Jun-2016 Note that it cannot complete until 18-Feb-2016 but must complete by 10-Mar-2017.
This wave C will complete the ZigZag pattern.
This is the final wave in the pattern. When complete it will also complete wave b of the Cycle degree inverted Flat with a rating of 78.8. These two waves have the same target ranges.
After wave b is complete, expect the market to continue up into wave c, which should be a five wave Impulsive pattern. Expect wave c to retrace wave b by 82% - 179%. Wave c can also be expected to be 67% - 179% of the price length of wave a. The expected time for wave c to complete is 20% - 151% of the time taken for wave b to complete and 11% - 58% of the time taken for wave a to complete.
Current Analysis Settings: Analysis Date Range: 06-Dec-2013 to 12-Feb-2016, Label Range: 15 - 50, Preferred Count Labels: 25, Min Rating: 75, Stocks toggle ON, Bias Towards Beginning of Data: 8, Bias Towards Major High/Low: 8, Largest Degree Wave Filter: Any Pattern
Rating:78.4
Current Trading Positions for Direxion Daily Semiconductor 3 (SOXS) Daily on 12-Feb-2016
* A Cycle degree trader (hold positions from quarters to years), would currently be trading long in this market. The probability of this Target Area being correct is 40.4%. However, the random probability of this Target Area being correct is 34.0%. So the true probability of this Target Area being correct is 18.8% better than random.
Extensive Elliott Commentary for Direxion Daily Semiconductor 3 (SOXS) Daily on 12-Feb-2016 with two incomplete patterns:
Wave C of the Primary degree inverted Flat with a rating of 96.7 is expected to complete in the price range 52.89 to 105.99, but more probably between 67.62 and 91.04. This wave is most likely to complete sometime between 22-Feb-2016 and 07-Jul-2016 Note that it cannot complete until 15-Feb-2016 but must complete by 11-May-2018.
This wave C will complete the Flat pattern.
This is the final wave in the pattern. When complete it will also complete wave b of the Cycle degree Flat with a rating of 78.4. These two waves have the same target ranges.
After wave b is complete, expect the market to continue down into wave c, which should be a five wave Impulsive pattern. Expect wave c to retrace wave b by 85% - 162%. Wave c can also be expected to be 90% - 162% of the price length of wave a. The expected time for wave c to complete is 20% - 136% of the time taken for wave b to complete and 20% - 110% of the time taken for wave a to complete.
Current Analysis Settings: Analysis Date Range: 06-Dec-2013 to 12-Feb-2016, Label Range: 15 - 50, Preferred Count Labels: 39, Min Rating: 75, Stocks toggle ON, Bias Towards Beginning of Data: 8, Bias Towards Major High/Low: 8, Largest Degree Wave Filter: Any Pattern
Rating:102.2
Current Trading Positions for Direxion Energy Bear 3x Shares (ERY) Daily on 12-Feb-2016
* A Primary degree trader (hold positions from months to years), would currently be trading long in this market. The probability of this Target Area being correct is 64.9%. However, the random probability of this Target Area being correct is 45.0%. So the true probability of this Target Area being correct is 44.2% better than random.
* A Cycle degree trader (hold positions from quarters to years), would currently be trading long in this market. The probability of this Target Area being correct is 87.2%. However, the random probability of this Target Area being correct is 64.1%. So the true probability of this Target Area being correct is 36.0% better than random.
Extensive Elliott Commentary for Direxion Energy Bear 3x Shares (ERY) Daily on 12-Feb-2016 with two incomplete patterns:
Wave C of the Primary degree inverted Zigzag with a rating of 102.4 is expected to complete in the price range 46.66 to 128.58, but more probably between 47.66 and 79.6. This wave is due to complete anytime from now until 23-May-2016, but is most likely to complete before 21-Mar-2016.
This wave C will complete the ZigZag pattern.
This is the final wave in the pattern. When complete it will also complete wave y of the Cycle degree inverted Double 3 with a rating of 102.2. These two waves have the same target ranges.
Wave y will probably complete this Double Sideways pattern, although it could possibly extend into a Triple Sideways pattern.
Current Analysis Settings: Analysis Date Range: 12-May-2014 to 12-Feb-2016, Label Range: 15 - 50, Preferred Count Labels: 17, Min Rating: 75, Stocks toggle ON, Bias Towards Beginning of Data: 8, Bias Towards Major High/Low: 8, Largest Degree Wave Filter: Any Pattern
Rating:78.8
Current Trading Positions for Direxion Energy Bull 3x Shares (ERX) Daily on 12-Feb-2016
* An Intermediate degree trader (hold positions from months to quarters), would currently be shorting this market. The probability of this Target Area being correct is 70.5%. However, the random probability of this Target Area being correct is 45.0%. So the true probability of this Target Area being correct is 56.7% better than random.
* A Cycle degree trader (hold positions from quarters to years), would currently be trading long in this market. The probability of this Target Area being correct is 77.2%. However, the random probability of this Target Area being correct is 65.0%. So the true probability of this Target Area being correct is 18.8% better than random.
Extensive Elliott Commentary for Direxion Energy Bull 3x Shares (ERX) Daily on 12-Feb-2016 with three incomplete patterns:
Wave (2) of the Intermediate degree Impulse with a rating of 95 is expected to complete in the price range 12.85 to 19.17, but more probably between 16.04 and 18.52. This wave was expected to complete before 09-Feb-2016, and must complete by 14-Mar-2016.
After this wave (2) is complete, expect the market to continue up into wave (3). Wave (3) should always be an Impulse and should retrace wave (2) completely. Expect wave (3) to retrace wave (2) by 164% - 383%. Wave (3) can also be expected to be 83% - 383% of the price length of wave (1). The expected time for wave (3) to complete is 87% - 367% of the time taken for wave (2) to complete and 16% - 97% of the time taken for wave (1) to complete. The slope (ie. price range divided by time taken) of wave (3) should be between 70% and 219% of the slope of wave (1). Once wave (3) is complete, expect wave (4) to be a sideways corrective movement, then wave (5) to continue in the same direction as wave (3). Wave (5) will complete this Impulse.
Wave C of the Primary degree inverted Flat with a rating of 83 is expected to complete in the price range 23.01 to 65.26, but more probably between 32 and 53.65. This wave is due to complete anytime from now until 28-Feb-2017, but is most likely to complete before 06-Apr-2016.
This wave C will complete the Flat pattern.
This is the final wave in the pattern. When complete it will also complete wave x of the Cycle degree Double Zigzag with a rating of 78.8. These two waves have the same target ranges.
After wave x is complete, expect the market to continue down into wave y, which should be a three wave Zigzag pattern. Expect wave y to retrace wave x by 116% - 261%. Wave y can also be expected to be 90% - 261% of the price length of wave w. The expected time for wave y to complete is 21% - 160% of the time taken for wave x to complete and 25% - 152% of the time taken for wave w to complete.
Current Analysis Settings: Analysis Date Range: 12-May-2014 to 12-Feb-2016, Label Range: 15 - 50, Preferred Count Labels: 19, Min Rating: 75, Stocks toggle ON, Bias Towards Beginning of Data: 8, Bias Towards Major High/Low: 8, Largest Degree Wave Filter: Any Pattern
Rating:88.7
Current Trading Positions for Direxion Financial Bear 3x Shares (FAZ) Daily on 12-Feb-2016
* An Intermediate degree trader (hold positions from months to quarters), would currently be trading long in this market. The probability of this Target Area being correct is 65.9%. However, the random probability of this Target Area being correct is 53.0%. So the true probability of this Target Area being correct is 24.3% better than random.
* A Primary degree trader (hold positions from months to years), would currently be shorting this market. The probability of this Target Area being correct is 43.1%. However, the random probability of this Target Area being correct is 34.0%. So the true probability of this Target Area being correct is 26.8% better than random.
* A Cycle degree trader (hold positions from quarters to years), would currently be trading long in this market. The probability of this Target Area being correct is 81.2%. However, the random probability of this Target Area being correct is 65.0%. So the true probability of this Target Area being correct is 24.9% better than random.
Extensive Elliott Commentary for Direxion Financial Bear 3x Shares (FAZ) Daily on 12-Feb-2016 with three incomplete patterns:
Wave (X) of the Intermediate degree Double 3 with a rating of 101.6 is expected to complete in the price range 53 to 109.66, but more probably between 58.54 and 63.33. This wave is due to complete anytime from now until 18-Apr-2016, but is most likely to complete before 15-Feb-2016.
After wave (X) is complete, expect the market to continue down into wave (Y), which will probably be a three wave corrective pattern. Expect wave (Y) to retrace wave (X) by 98% - 190%. Wave (Y) can also be expected to be 73% - 190% of the price length of wave (W). The expected time for wave (Y) to complete is 25% - 187% of the time taken for wave (X) to complete and 28% - 204% of the time taken for wave (W) to complete.
Wave B of the Primary degree inverted Flat with a rating of 87.3 is expected to complete in the price range 13.54 to 47.38, but more probably between 37.96 and 46.96. This wave could complete anytime between now and 29-May-2018, but is most likely to complete sometime between 15-Feb-2016 and 30-May-2016.
After wave B is complete, expect the market to continue up into wave C, which should be a five wave Impulsive pattern. Expect wave C to retrace wave B by 82% - 177%. Wave C can also be expected to be 89% - 177% of the price length of wave A. The expected time for wave C to complete is 15% - 160% of the time taken for wave B to complete and 16% - 118% of the time taken for wave A to complete.
Wave x of the Cycle degree Double Zigzag with a rating of 88.7 is expected to complete in the price range 47.39 to 79.64, but more probably between 56.44 and 73.34. This wave is due to complete anytime from now until 24-Apr-2018, but is most likely to complete before 10-Jun-2016.
After wave x is complete, expect the market to continue down into wave y, which should be a three wave Zigzag pattern. Expect wave y to retrace wave x by 116% - 261%. Wave y can also be expected to be 90% - 261% of the price length of wave w. The expected time for wave y to complete is 21% - 160% of the time taken for wave x to complete and 25% - 152% of the time taken for wave w to complete.
Current Analysis Settings: Analysis Date Range: 19-Dec-2013 to 12-Feb-2016, Label Range: 15 - 50, Preferred Count Labels: 19, Min Rating: 75, Stocks toggle ON, Bias Towards Beginning of Data: 8, Bias Towards Major High/Low: 8, Largest Degree Wave Filter: Any Pattern
Rating:85.8
Current Trading Positions for Direxion Financial Bull 3x Shares (FAS) Daily on 12-Feb-2016
* A Primary degree trader (hold positions from months to years), would currently be trading long in this market. The probability of this Target Area being correct is 54.0%. However, the random probability of this Target Area being correct is 45.0%. So the true probability of this Target Area being correct is 20.0% better than random.
* A Cycle degree trader (hold positions from quarters to years), would currently be shorting this market. The probability of this Target Area being correct is 37.5%. However, the random probability of this Target Area being correct is 24.3%. So the true probability of this Target Area being correct is 54.3% better than random.
Extensive Elliott Commentary for Direxion Financial Bull 3x Shares (FAS) Daily on 12-Feb-2016 with two incomplete patterns:
Wave B of the Primary degree Zigzag with a rating of 95.8 is expected to complete in the price range 16.62 to 33.33, but more probably between 18.28 and 24.56. This wave could complete anytime between now and 16-Feb-2017, but is most likely to complete sometime between 12-Feb-2016 and 21-Mar-2016.
After wave B is complete, expect the market to continue down into wave C, which should be a five wave impulsive pattern. Expect wave C to retrace wave B by 96% - 215%. Wave C can also be expected to be 33% - 215% of the price length of wave A. The expected time for wave C to complete is 22% - 199% of the time taken for wave B to complete and 24% - 111% of the time taken for wave A to complete.
Wave y of the Cycle degree Double Zigzag with a rating of 85.8 is expected to complete at a price no higher than 21.82, but more probably between 12.05 and 21.54. This wave is due to complete anytime from now until 18-Jul-2016, but is most likely to complete before 07-Mar-2016.
Wave y will probably complete this Double Sharp pattern, although it could possibly extend into a Triple Sharp pattern.
Current Analysis Settings: Analysis Date Range: 11-Jun-2015 to 12-Feb-2016, Label Range: 15 - 50, Preferred Count Labels: 25, Min Rating: 75, Stocks toggle ON, Bias Towards Beginning of Data: 8, Bias Towards Major High/Low: 8, Largest Degree Wave Filter: Any Pattern
Rating:93.1
Current Trading Positions for Direxion Small Cap Bear 3x (TZA) Daily on 12-Feb-2016
* A Primary degree trader (hold positions from months to years), would currently be trading long in this market. The probability of this Target Area being correct is 50.3%. However, the random probability of this Target Area being correct is 34.0%. So the true probability of this Target Area being correct is 47.9% better than random.
* A Cycle degree trader (hold positions from quarters to years), would currently be shorting this market. The probability of this Target Area being correct is 86.3%. However, the random probability of this Target Area being correct is 64.1%. So the true probability of this Target Area being correct is 34.6% better than random.
Extensive Elliott Commentary for Direxion Small Cap Bear 3x (TZA) Daily on 12-Feb-2016 with two incomplete patterns:
Wave B of the Primary degree Flat with a rating of 103.5 is expected to complete in the price range 67.25 to 124.42, but more probably between 67.57 and 78.39. This wave is due to complete anytime from now until 21-Apr-2016, but is most likely to complete before 24-Feb-2016.
After wave B is complete, expect the market to continue down into wave C, which should be a five wave Impulsive pattern. Expect wave C to retrace wave B by 89% - 167%. Wave C can also be expected to be 104% - 167% of the price length of wave A. The expected time for wave C to complete is 20% - 146% of the time taken for wave B to complete and 53% - 275% of the time taken for wave A to complete.
Wave y of the Cycle degree Double 3 with a rating of 93.1 is expected to complete at a price no higher than 70.06, but more probably no higher than 36.31. This wave is most likely to complete sometime between 01-Mar-2016 and 14-Dec-2016 Note that it cannot complete until 19-Feb-2016 but must complete by 03-Jan-2018.
Wave y will probably complete this Double Sideways pattern, although it could possibly extend into a Triple Sideways pattern.
Current Analysis Settings: Analysis Date Range: 23-Dec-2013 to 12-Feb-2016, Label Range: 15 - 50, Preferred Count Labels: 15, Min Rating: 75, Stocks toggle ON, Bias Towards Beginning of Data: 8, Bias Towards Major High/Low: 8, Largest Degree Wave Filter: Any Pattern
Rating:86.5
Current Trading Positions for Direxion Small Cap Bull 3x Shares (TNA) Daily on 12-Feb-2016
* A Primary degree trader (hold positions from months to years), would currently be shorting this market. The probability of this Target Area being correct is 64.9%. However, the random probability of this Target Area being correct is 45.0%. So the true probability of this Target Area being correct is 44.2% better than random.
* A Cycle degree trader (hold positions from quarters to years), would currently be shorting this market. The probability of this Target Area being correct is 38.0%. However, the random probability of this Target Area being correct is 24.3%. So the true probability of this Target Area being correct is 56.4% better than random.
Extensive Elliott Commentary for Direxion Small Cap Bull 3x Shares (TNA) Daily on 12-Feb-2016 with two incomplete patterns:
Wave C of the Primary degree Zigzag with a rating of 102.1 is expected to complete in the price range 12.3 to 41.35, but more probably between 21.58 and 37.2. This wave is due to complete anytime from now until 10-May-2016, but is most likely to complete before 24-Feb-2016.
This wave C will complete the ZigZag pattern.
This is the final wave in the pattern. When complete it will also complete wave y of the Cycle degree Double Zigzag with a rating of 86.5. These two waves have the same target ranges.
Wave y will probably complete this Double Sharp pattern, although it could possibly extend into a Triple Sharp pattern.
Current Analysis Settings: Analysis Date Range: 13-May-2015 to 12-Feb-2016, Label Range: 15 - 50, Preferred Count Labels: 17, Min Rating: 75, Stocks toggle ON, Bias Towards Beginning of Data: 8, Bias Towards Major High/Low: 8, Largest Degree Wave Filter: Any Pattern
Rating:97.9
Current Trading Positions for Direxion Technology Bull 3X (TECL) Daily on 12-Feb-2016
* A Primary degree trader (hold positions from months to years), would currently be shorting this market. The probability of this Target Area being correct is 48.2%. However, the random probability of this Target Area being correct is 34.0%. So the true probability of this Target Area being correct is 41.8% better than random.
Extensive Elliott Commentary for Direxion Technology Bull 3X (TECL) Daily on 12-Feb-2016 with one incomplete pattern:
Wave B of the Primary degree inverted Flat with a rating of 97.9 is expected to complete in the price range 8.83 to 25.47, but more probably between 20.84 and 25.26. This wave could complete anytime between now and 01-Mar-2018, but is most likely to complete sometime between 19-Feb-2016 and 24-May-2016.
After wave B is complete, expect the market to continue up into wave C, which should be a five wave Impulsive pattern. Expect wave C to retrace wave B by 82% - 177%. Wave C can also be expected to be 89% - 177% of the price length of wave A. The expected time for wave C to complete is 15% - 160% of the time taken for wave B to complete and 16% - 118% of the time taken for wave A to complete.
Current Analysis Settings: Analysis Date Range: 23-Dec-2013 to 12-Feb-2016, Label Range: 15 - 50, Preferred Count Labels: 15, Min Rating: 75, Stocks toggle ON, Bias Towards Beginning of Data: 8, Bias Towards Major High/Low: 8, Largest Degree Wave Filter: Any Pattern
Rating:96.3
Current Trading Positions for DoubleLine Income Solutions Fund (DSL) Daily on 12-Feb-2016
* A Primary degree trader (hold positions from months to years), would currently be shorting this market. The probability of this Target Area being correct is 75.6%. However, the random probability of this Target Area being correct is 64.0%. So the true probability of this Target Area being correct is 18.1% better than random.
Extensive Elliott Commentary for DoubleLine Income Solutions Fund (DSL) Daily on 12-Feb-2016 with one incomplete pattern:
Wave D of the Primary degree inverted Contracting Triangle with a rating of 96.3 is expected to complete in the price range 14.71 to 15.36, but more probably between 14.93 and 15.19. This wave was expected to complete before 05-Feb-2016, and must complete by 26-Feb-2016.
Once this wave D is complete, expect the market to continue up to the end of wave E, which will most probably be a ZigZag family pattern or possibly a Contracting Triangle. Expect wave E to have between 39% and 66% of the price range of wave C and complete in 4% to 60% of the time taken by wave C. Expect also that wave E will have between 21% and 47% of the price range of wave A and complete in 2% to 24% of the time taken by wave A. The slope (ie. price range divided by time taken) of wave E should be between 28% and 143% of the slope of wave C and between 19% to 183% of the slope of wave A. Wave E will complete this Contracting Triangle.
Current Analysis Settings: Analysis Date Range: 05-May-2014 to 12-Feb-2016, Label Range: 15 - 50, Preferred Count Labels: 48, Min Rating: 75, Stocks toggle ON, Bias Towards Beginning of Data: 8, Bias Towards Major High/Low: 8, Largest Degree Wave Filter: Any Pattern
Rating:75.1
Current Trading Positions for Dreyfus High Yield Strat (DHF) Daily on 12-Feb-2016
* An Intermediate degree trader (hold positions from months to quarters), would currently be shorting this market. The probability of this Target Area being correct is 50.2%. However, the random probability of this Target Area being correct is 34.0%. So the true probability of this Target Area being correct is 47.6% better than random.
* A Primary degree trader (hold positions from months to years), would currently be trading long in this market. The probability of this Target Area being correct is 85.6%. However, the random probability of this Target Area being correct is 64.1%. So the true probability of this Target Area being correct is 33.5% better than random.
* A Cycle degree trader (hold positions from quarters to years), would currently be trading long in this market. The probability of this Target Area being correct is 39.5%. However, the random probability of this Target Area being correct is 34.0%. So the true probability of this Target Area being correct is 16.2% better than random.
Extensive Elliott Commentary for Dreyfus High Yield Strat (DHF) Daily on 12-Feb-2016 with three incomplete patterns:
Wave (B) of the Intermediate degree inverted Flat with a rating of 102.4 is expected to complete in the price range 2.1 to 2.78, but more probably between 2.68 and 2.78. This wave is due to complete anytime from now until 20-Apr-2016, but is most likely to complete before 19-Feb-2016.
After wave (B) is complete, expect the market to continue up into wave (C), which should be a five wave Impulsive pattern. Expect wave (C) to retrace wave (B) by 80% - 169%. Wave (C) can also be expected to be 99% - 169% of the price length of wave (A). The expected time for wave (C) to complete is 19% - 187% of the time taken for wave (B) to complete and 56% - 268% of the time taken for wave (A) to complete.
Wave Y of the Primary degree inverted Double 3 with a rating of 86.5 is expected to complete in the price range 2.76 to 4.61, but more probably between 3.06 and 3.55. This wave is due to complete anytime from now until 25-Mar-2016, but is most likely to complete before 23-Feb-2016.
Wave Y will probably complete this Double Sideways pattern, although it could possibly extend into a Triple Sideways pattern.
This is the final wave in the pattern. When complete it will also complete wave b of the Cycle degree Flat with a rating of 75.1. These two waves have the same target ranges.
After wave b is complete, expect the market to continue down into wave c, which should be a five wave Impulsive pattern. Expect wave c to retrace wave b by 85% - 162%. Wave c can also be expected to be 90% - 162% of the price length of wave a. The expected time for wave c to complete is 20% - 136% of the time taken for wave b to complete and 20% - 110% of the time taken for wave a to complete.
Current Analysis Settings: Analysis Date Range: 20-May-2014 to 12-Feb-2016, Label Range: 15 - 50, Preferred Count Labels: 15, Min Rating: 75, Stocks toggle ON, Bias Towards Beginning of Data: 8, Bias Towards Major High/Low: 8, Largest Degree Wave Filter: Any Pattern
Rating:78.4
Current Trading Positions for Duff & Phelps Global Utility Income Fund (DPG) Daily on 12-Feb-2016
* An Intermediate degree trader (hold positions from months to quarters), would currently be shorting this market. The probability of this Target Area being correct is 38.0%. However, the random probability of this Target Area being correct is 13.0%. So the true probability of this Target Area being correct is 192.3% better than random.
* A Primary degree trader (hold positions from months to years), would currently be shorting this market. The probability of this Target Area being correct is 14.0%. However, the random probability of this Target Area being correct is 13.0%. So the true probability of this Target Area being correct is 7.7% better than random.
* A Cycle degree trader (hold positions from quarters to years), would currently be shorting this market. The probability of this Target Area being correct is 14.0%. However, the random probability of this Target Area being correct is 13.0%. So the true probability of this Target Area being correct is 7.7% better than random.
Extensive Elliott Commentary for Duff & Phelps Global Utility Income Fund (DPG) Daily on 12-Feb-2016 with three incomplete patterns:
Wave (3) of the Intermediate degree inverted Impulse with a rating of 94.5 is expected to complete at a price no higher than 11.05, but more probably between 6.51 and 10.57. This wave is due to complete anytime from now until 13-Apr-2016, but is most likely to complete before 02-Mar-2016.
When complete, expect the overall slope (ie. price range divided by time taken) of this wave (3) to be between 47% to 194% of the slope of wave (1). Then expect the market to pull back into wave (4), which will be corrective in nature and has a probability of 0% of being a Flat or other sideways pattern. Wave (4) should not retrace back into the price range of wave (1) or (2). Expect wave (4) to have between 5% - 140% of the price range of wave (2). The expected time for wave (4) to complete is between 16% - 136% of wave (2). After wave (4), expect wave (5) to move beyond the end of wave (3) to complete this Impulse.
Wave 3 of the Primary degree inverted Impulse with a rating of 78.2 is expected to complete in the price range .88 to 12.94, but more probably between 8.74 and 12.18. This wave is due to complete anytime from now until 11-Apr-2016, but is most likely to complete before 12-Feb-2016.
When complete, expect the overall slope (ie. price range divided by time taken) of this wave 3 to be between 47% to 194% of the slope of wave 1. Then expect the market to pull back into wave 4, which will be corrective in nature and has a probability of 0% of being a Flat or other sideways pattern. Wave 4 should not retrace back into the price range of wave 1 or 2. Expect wave 4 to have between 5% - 140% of the price range of wave 2. The expected time for wave 4 to complete is between 15% - 136% of wave 2. After wave 4, expect wave 5 to move beyond the end of wave 3 to complete this Impulse.
Wave III of the Cycle degree inverted Impulse with a rating of 78.4 is expected to complete in the price range 1.92 to 14.1, but more probably between 8.08 and 12.93. This wave is due to complete anytime from now until 20-Jan-2017, but is most likely to complete before 18-Apr-2016.
When complete, expect the overall slope (ie. price range divided by time taken) of this wave III to be between 47% to 194% of the slope of wave I. Then expect the market to pull back into wave IV, which will be corrective in nature and has a probability of 0% of being a Flat or other sideways pattern. Wave IV should not retrace back into the price range of wave I or II. Expect wave IV to have between 5% - 140% of the price range of wave II. The expected time for wave IV to complete is between 15% - 136% of wave II. After wave IV, expect wave V to move beyond the end of wave III to complete this Impulse.
Current Analysis Settings: Analysis Date Range: 24-Oct-2014 to 12-Feb-2016, Label Range: 15 - 50, Preferred Count Labels: 35, Min Rating: 75, Stocks toggle ON, Bias Towards Beginning of Data: 8, Bias Towards Major High/Low: 8, Largest Degree Wave Filter: Any Pattern
Rating:87.4
Current Trading Positions for Eaton Vance En Eqty Incm Fd Ii (EOS) Daily on 12-Feb-2016
* An Intermediate degree trader (hold positions from months to quarters), would currently be trading long in this market. The probability of this Target Area being correct is 85.7%. However, the random probability of this Target Area being correct is 64.1%. So the true probability of this Target Area being correct is 33.7% better than random.
Extensive Elliott Commentary for Eaton Vance En Eqty Incm Fd Ii (EOS) Daily on 12-Feb-2016 with two incomplete patterns:
Wave C of the Minor degree inverted Flat with a rating of 102.6 is expected to complete in the price range 11.36 to 12.08, but more probably between 11.53 and 11.88. This wave is due to complete anytime from now until 19-Feb-2016, but is most likely to complete before 12-Feb-2016.
This wave C will complete the Flat pattern.
This is the final wave in the pattern. When complete it will also complete wave (Y) of the Intermediate degree inverted Double 3 with a rating of 87.4. These two waves have the same target ranges.
Wave (Y) will probably complete this Double Sideways pattern, although it could possibly extend into a Triple Sideways pattern.
Current Analysis Settings: Analysis Date Range: 08-Jun-2015 to 12-Feb-2016, Label Range: 15 - 50, Preferred Count Labels: 27, Min Rating: 75, Stocks toggle ON, Bias Towards Beginning of Data: 8, Bias Towards Major High/Low: 8, Largest Degree Wave Filter: Any Pattern
Rating:109.2
Current Trading Positions for Eaton Vance Enhanced Eqty Incm (EOI) Daily on 12-Feb-2016
* A Primary degree trader (hold positions from months to years), would currently be trading long in this market. The probability of this Target Area being correct is 76.9%. However, the random probability of this Target Area being correct is 64.0%. So the true probability of this Target Area being correct is 20.2% better than random.
Extensive Elliott Commentary for Eaton Vance Enhanced Eqty Incm (EOI) Daily on 12-Feb-2016 with one incomplete pattern:
Wave D of the Primary degree Contracting Triangle with a rating of 109.2 is expected to complete in the price range 12.07 to 12.86, but more probably between 12.24 and 12.79. This wave is due to complete anytime from now until 25-Feb-2016, but is most likely to complete before 16-Feb-2016.
Once this wave D is complete, expect the market to continue down to the end of wave E, which will most probably be a ZigZag family pattern or possibly a Contracting Triangle. Expect wave E to have between 39% and 67% of the price range of wave C and complete in 6% to 60% of the time taken by wave C. Expect also that wave E will have between 22% and 49% of the price range of wave A and complete in 3% to 29% of the time taken by wave A. The slope (ie. price range divided by time taken) of wave E should be between 28% and 143% of the slope of wave C and between 19% to 183% of the slope of wave A. Wave E will complete this Contracting Triangle.
Current Analysis Settings: Analysis Date Range: 07-Aug-2014 to 12-Feb-2016, Label Range: 15 - 50, Preferred Count Labels: 22, Min Rating: 75, Stocks toggle ON, Bias Towards Beginning of Data: 8, Bias Towards Major High/Low: 8, Largest Degree Wave Filter: Any Pattern
Rating:103.3
Current Trading Positions for Eaton Vance Floating Rte Incm (EFT) Daily on 12-Feb-2016
* An Intermediate degree trader (hold positions from months to quarters), would currently be shorting this market. The probability of this Target Area being correct is 67.7%. However, the random probability of this Target Area being correct is 53.0%. So the true probability of this Target Area being correct is 27.7% better than random.
Extensive Elliott Commentary for Eaton Vance Floating Rte Incm (EFT) Daily on 12-Feb-2016 with one incomplete pattern:
Wave (X) of the Intermediate degree inverted Double 3 with a rating of 103.3 is expected to complete in the price range 8.85 to 11.98, but more probably between 11.49 and 11.76. This wave is due to complete anytime from now until 22-Apr-2016, but is most likely to complete before 18-Feb-2016.
After wave (X) is complete, expect the market to continue up into wave (Y), which will probably be a three wave corrective pattern. Expect wave (Y) to retrace wave (X) by 98% - 212%. Wave (Y) can also be expected to be 73% - 212% of the price length of wave (W). The expected time for wave (Y) to complete is 27% - 214% of the time taken for wave (X) to complete and 38% - 222% of the time taken for wave (W) to complete.
Current Analysis Settings: Analysis Date Range: 24-Jan-2014 to 12-Feb-2016, Label Range: 15 - 50, Preferred Count Labels: 16, Min Rating: 75, Stocks toggle ON, Bias Towards Beginning of Data: 8, Bias Towards Major High/Low: 8, Largest Degree Wave Filter: Any Pattern
Rating:81.8
Current Trading Positions for Eaton Vance Insured Muni Bd (EIM) Daily on 12-Feb-2016
* An Intermediate degree trader (hold positions from months to quarters), would currently be trading long in this market. The probability of this Target Area being correct is 50.1%. However, the random probability of this Target Area being correct is 34.0%. So the true probability of this Target Area being correct is 47.4% better than random.
* A Primary degree trader (hold positions from months to years), would currently be shorting this market. The probability of this Target Area being correct is 53.0%. However, the random probability of this Target Area being correct is 45.0%. So the true probability of this Target Area being correct is 17.8% better than random.
* A Cycle degree trader (hold positions from quarters to years), would currently be trading long in this market. The probability of this Target Area being correct is 35.5%. However, the random probability of this Target Area being correct is 24.3%. So the true probability of this Target Area being correct is 46.1% better than random.
Extensive Elliott Commentary for Eaton Vance Insured Muni Bd (EIM) Daily on 12-Feb-2016 with three incomplete patterns:
Wave (B) of the Intermediate degree Flat with a rating of 101.4 is expected to complete in the price range 13.06 to 14.58, but more probably between 13.07 and 13.35. This wave is due to complete anytime from now until 22-Apr-2016, but is most likely to complete before 19-Feb-2016.
After wave (B) is complete, expect the market to continue down into wave (C), which should be a five wave Impulsive pattern. Expect wave (C) to retrace wave (B) by 89% - 167%. Wave (C) can also be expected to be 104% - 167% of the price length of wave (A). The expected time for wave (C) to complete is 20% - 146% of the time taken for wave (B) to complete and 53% - 275% of the time taken for wave (A) to complete.
Wave B of the Primary degree inverted Zigzag with a rating of 90.9 is expected to complete in the price range 11.93 to 13.11, but more probably between 12.48 and 12.93. This wave is due to complete anytime from now until 28-Jun-2018, but is most likely to complete before 20-Apr-2016.
After wave B is complete, expect the market to continue up into wave C, which should be a five wave impulsive pattern. Expect wave C to retrace wave B by 100% - 312%. Wave C can also be expected to be 49% - 312% of the price length of wave A. The expected time for wave C to complete is 27% - 258% of the time taken for wave B to complete and 17% - 115% of the time taken for wave A to complete.
Wave y of the Cycle degree inverted Double Zigzag with a rating of 81.8 is expected to complete in the price range 13.9 to 19.03, but more probably between 14.13 and 16.08. This wave is due to complete anytime from now until 02-Nov-2016, but is most likely to complete before 07-Mar-2016.
Wave y will probably complete this Double Sharp pattern, although it could possibly extend into a Triple Sharp pattern.
Current Analysis Settings: Analysis Date Range: 06-Dec-2013 to 12-Feb-2016, Label Range: 15 - 50, Preferred Count Labels: 15, Min Rating: 75, Stocks toggle ON, Bias Towards Beginning of Data: 8, Bias Towards Major High/Low: 8, Largest Degree Wave Filter: Any Pattern
Rating:82.9
Current Trading Positions for Eaton Vance Ltd Duration Inc F (EVV) Daily on 12-Feb-2016
* An Intermediate degree trader (hold positions from months to quarters), would currently be shorting this market. The probability of this Target Area being correct is 70.5%. However, the random probability of this Target Area being correct is 45.0%. So the true probability of this Target Area being correct is 56.7% better than random.
Extensive Elliott Commentary for Eaton Vance Ltd Duration Inc F (EVV) Daily on 12-Feb-2016 with two incomplete patterns:
Wave (2) of the Intermediate degree Impulse with a rating of 94.2 is expected to complete in the price range 11.63 to 12.3, but more probably between 11.97 and 12.23. This wave was expected to complete before 02-Feb-2016, and must complete by 25-Feb-2016.
After this wave (2) is complete, expect the market to continue up into wave (3). Wave (3) should always be an Impulse and should retrace wave (2) completely. Expect wave (3) to retrace wave (2) by 164% - 383%. Wave (3) can also be expected to be 83% - 383% of the price length of wave (1). The expected time for wave (3) to complete is 87% - 367% of the time taken for wave (2) to complete and 16% - 97% of the time taken for wave (1) to complete. The slope (ie. price range divided by time taken) of wave (3) should be between 70% and 219% of the slope of wave (1). Once wave (3) is complete, expect wave (4) to be a sideways corrective movement, then wave (5) to continue in the same direction as wave (3). Wave (5) will complete this Impulse.
Wave C of the Primary degree inverted Flat with a rating of 82.9 is expected to complete in the price range 12.28 to 16.58, but more probably between 13.55 and 15.47. This wave is due to complete anytime from now until 02-May-2016, but is most likely to complete before 28-Mar-2016.
This wave C will complete the Flat pattern.
Current Analysis Settings: Analysis Date Range: 15-May-2014 to 12-Feb-2016, Label Range: 15 - 50, Preferred Count Labels: 18, Min Rating: 75, Stocks toggle ON, Bias Towards Beginning of Data: 8, Bias Towards Major High/Low: 8, Largest Degree Wave Filter: Any Pattern
Rating:83
Current Trading Positions for Eaton Vance Risk-Managed Diversified Equity Income Fund (ETJ) Daily on 12-Feb-2016
* A Primary degree trader (hold positions from months to years), would currently be shorting this market. The probability of this Target Area being correct is 64.5%. However, the random probability of this Target Area being correct is 45.0%. So the true probability of this Target Area being correct is 43.3% better than random.
* A Cycle degree trader (hold positions from quarters to years), would currently be shorting this market. The probability of this Target Area being correct is 36.5%. However, the random probability of this Target Area being correct is 24.3%. So the true probability of this Target Area being correct is 50.2% better than random.
Extensive Elliott Commentary for Eaton Vance Risk-Managed Diversified Equity Income Fund (ETJ) Daily on 12-Feb-2016 with two incomplete patterns:
Wave C of the Primary degree Zigzag with a rating of 100.5 is expected to complete in the price range 5.76 to 9.08, but more probably between 8.2 and 9.03. This wave is due to complete anytime from now until 18-Apr-2016, but is most likely to complete before 14-Mar-2016.
This wave C will complete the ZigZag pattern.
This is the final wave in the pattern. When complete it will also complete wave y of the Cycle degree Double Zigzag with a rating of 83. These two waves have the same target ranges.
Wave y will probably complete this Double Sharp pattern, although it could possibly extend into a Triple Sharp pattern.
Current Analysis Settings: Analysis Date Range: 07-Aug-2014 to 12-Feb-2016, Label Range: 15 - 50, Preferred Count Labels: 15, Min Rating: 75, Stocks toggle ON, Bias Towards Beginning of Data: 8, Bias Towards Major High/Low: 8, Largest Degree Wave Filter: Any Pattern
Rating:78.9
Current Trading Positions for Eaton Vance Senior Floating-Rate Fund (EFR) Daily on 12-Feb-2016
* An Intermediate degree trader (hold positions from months to quarters), would currently be trading long in this market. The probability of this Target Area being correct is 46.0%. However, the random probability of this Target Area being correct is 13.0%. So the true probability of this Target Area being correct is 253.8% better than random.
Extensive Elliott Commentary for Eaton Vance Senior Floating-Rate Fund (EFR) Daily on 12-Feb-2016 with two incomplete patterns:
Wave (3) of the Intermediate degree Impulse with a rating of 96.6 is expected to complete in the price range 12.24 to 16.4, but more probably between 12.37 and 13.38. This wave could complete anytime between now and 09-Mar-2016, but is most likely to complete sometime between 12-Feb-2016 and 25-Feb-2016.
When complete, expect the overall slope (ie. price range divided by time taken) of this wave (3) to be between 70% to 219% of the slope of wave (1). Then expect the market to pull back into wave (4), which will be corrective in nature and has a probability of 83% of being a Flat or other sideways pattern. Wave (4) should not retrace back into the price range of wave (1) or (2). Expect wave (4) to have between 5% - 141% of the price range of wave (2). The expected time for wave (4) to complete is between 15% - 135% of wave (2). After wave (4), expect wave (5) to move beyond the end of wave (3) to complete this Impulse.
Wave C of the Primary degree inverted Flat with a rating of 78.9 is expected to complete in the price range 11.87 to 13.11, but more probably between 12.06 and 12.78. This wave is due to complete anytime from now until 18-Apr-2016, but is most likely to complete before 22-Feb-2016.
This wave C will complete the Flat pattern.
Current Analysis Settings: Analysis Date Range: 13-Jan-2014 to 12-Feb-2016, Label Range: 15 - 50, Preferred Count Labels: 45, Min Rating: 75, Stocks toggle ON, Bias Towards Beginning of Data: 8, Bias Towards Major High/Low: 8, Largest Degree Wave Filter: Any Pattern
Rating:106.4
Current Trading Positions for Eaton Vance Sr Income Tr (EVF) Daily on 12-Feb-2016
* An Intermediate degree trader (hold positions from months to quarters), would currently be trading long in this market. The probability of this Target Area being correct is 87.6%. However, the random probability of this Target Area being correct is 64.1%. So the true probability of this Target Area being correct is 36.7% better than random.
Extensive Elliott Commentary for Eaton Vance Sr Income Tr (EVF) Daily on 12-Feb-2016 with one incomplete pattern:
Wave (Y) of the Intermediate degree inverted Double 3 with a rating of 106.4 is expected to complete in the price range 5.22 to 5.66, but more probably between 5.28 and 5.42. This wave is due to complete anytime from now until 15-Feb-2016, but is most likely to complete before 12-Feb-2016.
Wave (Y) will probably complete this Double Sideways pattern, although it could possibly extend into a Triple Sideways pattern.
Current Analysis Settings: Analysis Date Range: 06-Dec-2013 to 12-Feb-2016, Label Range: 15 - 50, Preferred Count Labels: 49, Min Rating: 75, Stocks toggle ON, Bias Towards Beginning of Data: 8, Bias Towards Major High/Low: 8, Largest Degree Wave Filter: Any Pattern
Rating:92.7
Current Trading Positions for Eaton Vance Tax Adv Div Inc (EVT) Daily on 12-Feb-2016
* An Intermediate degree trader (hold positions from months to quarters), would currently be shorting this market. The probability of this Target Area being correct is 88.3%. However, the random probability of this Target Area being correct is 65.0%. So the true probability of this Target Area being correct is 35.8% better than random.
* A Primary degree trader (hold positions from months to years), would currently be trading long in this market. The probability of this Target Area being correct is 45.2%. However, the random probability of this Target Area being correct is 34.0%. So the true probability of this Target Area being correct is 32.9% better than random.
Extensive Elliott Commentary for Eaton Vance Tax Adv Div Inc (EVT) Daily on 12-Feb-2016 with two incomplete patterns:
Wave (X) of the Intermediate degree inverted Double Zigzag with a rating of 102 is expected to complete in the price range 16.37 to 17.95, but more probably between 16.89 and 17.66. This wave is due to complete anytime from now until 01-Apr-2016, but is most likely to complete before 24-Feb-2016.
After wave (X) is complete, expect the market to continue up into wave (Y), which should be a three wave Zigzag pattern. Expect wave (Y) to retrace wave (X) by 128% - 319%. Wave (Y) can also be expected to be 90% - 319% of the price length of wave (W). The expected time for wave (Y) to complete is 23% - 167% of the time taken for wave (X) to complete and 47% - 204% of the time taken for wave (W) to complete.
Wave B of the Primary degree Flat with a rating of 92.7 is expected to complete in the price range 18.96 to 26.41, but more probably between 19.04 and 20.99. This wave is due to complete anytime from now until 17-Apr-2017, but is most likely to complete before 30-Mar-2016.
After wave B is complete, expect the market to continue down into wave C, which should be a five wave Impulsive pattern. Expect wave C to retrace wave B by 86% - 162%. Wave C can also be expected to be 90% - 162% of the price length of wave A. The expected time for wave C to complete is 19% - 134% of the time taken for wave B to complete and 24% - 115% of the time taken for wave A to complete.
Current Analysis Settings: Analysis Date Range: 13-Jan-2015 to 12-Feb-2016, Label Range: 15 - 50, Preferred Count Labels: 16, Min Rating: 75, Stocks toggle ON, Bias Towards Beginning of Data: 8, Bias Towards Major High/Low: 8, Largest Degree Wave Filter: Any Pattern
Rating:89.2
Current Trading Positions for Eaton Vance Tax-Managed Buy-Write Opportunities Fund (ETV) Daily on 12-Feb-2016
* An Intermediate degree trader (hold positions from months to quarters), would currently be shorting this market. The probability of this Target Area being correct is 70.7%. However, the random probability of this Target Area being correct is 45.0%. So the true probability of this Target Area being correct is 57.1% better than random.
Extensive Elliott Commentary for Eaton Vance Tax-Managed Buy-Write Opportunities Fund (ETV) Daily on 12-Feb-2016 with two incomplete patterns:
Wave (2) of the Intermediate degree Impulse with a rating of 95.3 is expected to complete in the price range 12.69 to 14.09, but more probably between 13.39 and 13.94. This wave was expected to complete before 02-Feb-2016, and must complete by 25-Feb-2016.
After this wave (2) is complete, expect the market to continue up into wave (3). Wave (3) should always be an Impulse and should retrace wave (2) completely. Expect wave (3) to retrace wave (2) by 164% - 383%. Wave (3) can also be expected to be 83% - 383% of the price length of wave (1). The expected time for wave (3) to complete is 87% - 367% of the time taken for wave (2) to complete and 16% - 97% of the time taken for wave (1) to complete. The slope (ie. price range divided by time taken) of wave (3) should be between 70% and 219% of the slope of wave (1). Once wave (3) is complete, expect wave (4) to be a sideways corrective movement, then wave (5) to continue in the same direction as wave (3). Wave (5) will complete this Impulse.
Wave C of the Primary degree inverted Flat with a rating of 89.2 is expected to complete in the price range 13.43 to 20.08, but more probably between 15.24 and 18.1. This wave is due to complete anytime from now until 22-Nov-2016, but is most likely to complete before 01-Apr-2016.
This wave C will complete the Flat pattern.
Current Analysis Settings: Analysis Date Range: 07-Aug-2014 to 12-Feb-2016, Label Range: 15 - 50, Preferred Count Labels: 15, Min Rating: 75, Stocks toggle ON, Bias Towards Beginning of Data: 8, Bias Towards Major High/Low: 8, Largest Degree Wave Filter: Any Pattern
Rating:94.9
Current Trading Positions for Eaton Vance Tax-Managed Div Equ Inc Fd (ETY) Daily on 12-Feb-2016
* A Cycle degree trader (hold positions from quarters to years), would currently be shorting this market. The probability of this Target Area being correct is 40.8%. However, the random probability of this Target Area being correct is 24.3%. So the true probability of this Target Area being correct is 67.9% better than random.
Extensive Elliott Commentary for Eaton Vance Tax-Managed Div Equ Inc Fd (ETY) Daily on 12-Feb-2016 with one incomplete pattern:
Wave y of the Cycle degree Double Zigzag with a rating of 94.9 is expected to complete in the price range 5.86 to 8.66, but more probably between 7.82 and 8.63. This wave is most likely to complete sometime between 25-Feb-2016 and 29-Apr-2016 Note that it cannot complete until 23-Feb-2016 but must complete by 06-Jun-2016.
Wave y will probably complete this Double Sharp pattern, although it could possibly extend into a Triple Sharp pattern.
Current Analysis Settings: Analysis Date Range: 08-May-2015 to 12-Feb-2016, Label Range: 15 - 50, Preferred Count Labels: 16, Min Rating: 75, Stocks toggle ON, Bias Towards Beginning of Data: 8, Bias Towards Major High/Low: 8, Largest Degree Wave Filter: Any Pattern
Rating:83
Current Trading Positions for Eaton Vance Tax-Managed Global Buy-Write Opportunities Fund (ETW) Daily on 12-Feb-2016
* An Intermediate degree trader (hold positions from months to quarters), would currently be shorting this market. The probability of this Target Area being correct is 70.7%. However, the random probability of this Target Area being correct is 45.0%. So the true probability of this Target Area being correct is 57.1% better than random.
Extensive Elliott Commentary for Eaton Vance Tax-Managed Global Buy-Write Opportunities Fund (ETW) Daily on 12-Feb-2016 with two incomplete patterns:
Wave (2) of the Intermediate degree Impulse with a rating of 95.9 is expected to complete in the price range 9.1 to 10.16, but more probably between 9.63 and 10.05. This wave was expected to complete before 02-Feb-2016, and must complete by 25-Feb-2016.
After this wave (2) is complete, expect the market to continue up into wave (3). Wave (3) should always be an Impulse and should retrace wave (2) completely. Expect wave (3) to retrace wave (2) by 164% - 383%. Wave (3) can also be expected to be 83% - 383% of the price length of wave (1). The expected time for wave (3) to complete is 87% - 367% of the time taken for wave (2) to complete and 16% - 97% of the time taken for wave (1) to complete. The slope (ie. price range divided by time taken) of wave (3) should be between 70% and 219% of the slope of wave (1). Once wave (3) is complete, expect wave (4) to be a sideways corrective movement, then wave (5) to continue in the same direction as wave (3). Wave (5) will complete this Impulse.
Wave C of the Primary degree inverted Flat with a rating of 83 is expected to complete in the price range 10.36 to 13.97, but more probably between 11.01 and 13.05. This wave is due to complete anytime from now until 03-Jan-2017, but is most likely to complete before 07-Apr-2016.
This wave C will complete the Flat pattern.
Current Analysis Settings: Analysis Date Range: 01-May-2014 to 12-Feb-2016, Label Range: 15 - 50, Preferred Count Labels: 25, Min Rating: 75, Stocks toggle ON, Bias Towards Beginning of Data: 8, Bias Towards Major High/Low: 8, Largest Degree Wave Filter: Any Pattern
Rating:102.3
Current Trading Positions for ELEMENTS Linked to the Rogers International Commodity Index - Total Return ETN (RJI) Daily on 12-Feb-2016
* An Intermediate degree trader (hold positions from months to quarters), would currently be shorting this market. The probability of this Target Area being correct is 66.8%. However, the random probability of this Target Area being correct is 53.0%. So the true probability of this Target Area being correct is 26.0% better than random.
Extensive Elliott Commentary for ELEMENTS Linked to the Rogers International Commodity Index - Total Return ETN (RJI) Daily on 12-Feb-2016 with one incomplete pattern:
Wave (X) of the Intermediate degree inverted Double 3 with a rating of 102.3 is expected to complete in the price range 2.64 to 4.3, but more probably between 4.04 and 4.18. This wave is due to complete anytime from now until 02-May-2016, but is most likely to complete before 22-Feb-2016.
After wave (X) is complete, expect the market to continue up into wave (Y), which will probably be a three wave corrective pattern. Expect wave (Y) to retrace wave (X) by 98% - 212%. Wave (Y) can also be expected to be 73% - 212% of the price length of wave (W). The expected time for wave (Y) to complete is 27% - 214% of the time taken for wave (X) to complete and 38% - 222% of the time taken for wave (W) to complete.
Current Analysis Settings: Analysis Date Range: 06-Mar-2014 to 12-Feb-2016, Label Range: 15 - 50, Preferred Count Labels: 16, Min Rating: 75, Stocks toggle ON, Bias Towards Beginning of Data: 8, Bias Towards Major High/Low: 8, Largest Degree Wave Filter: Any Pattern
Rating:78.2
Current Trading Positions for ETRACS 2X BDC (BDCL) Daily on 12-Feb-2016
* A Primary degree trader (hold positions from months to years), would currently be shorting this market. The probability of this Target Area being correct is 64.9%. However, the random probability of this Target Area being correct is 45.0%. So the true probability of this Target Area being correct is 44.2% better than random.
* A Cycle degree trader (hold positions from quarters to years), would currently be shorting this market. The probability of this Target Area being correct is 34.0%. However, the random probability of this Target Area being correct is 24.3%. So the true probability of this Target Area being correct is 39.9% better than random.
Extensive Elliott Commentary for ETRACS 2X BDC (BDCL) Daily on 12-Feb-2016 with two incomplete patterns:
Wave C of the Primary degree Zigzag with a rating of 102.5 is expected to complete at a price no higher than 11.01, but more probably between 5.99 and 10.38. This wave is due to complete anytime from now until 21-Apr-2016, but is most likely to complete before 29-Feb-2016.
This wave C will complete the ZigZag pattern.
This is the final wave in the pattern. When complete it will also complete wave y of the Cycle degree Double Zigzag with a rating of 78.2. These two waves have the same target ranges.
Wave y will probably complete this Double Sharp pattern, although it could possibly extend into a Triple Sharp pattern.
Current Analysis Settings: Analysis Date Range: 10-Jan-2014 to 12-Feb-2016, Label Range: 15 - 50, Preferred Count Labels: 16, Min Rating: 75, Stocks toggle ON, Bias Towards Beginning of Data: 8, Bias Towards Major High/Low: 8, Largest Degree Wave Filter: Any Pattern
Rating:85.4
Current Trading Positions for ETracs Alerian MLP Index ETN (AMU) Daily on 12-Feb-2016
* A Cycle degree trader (hold positions from quarters to years), would currently be trading long in this market. The probability of this Target Area being correct is 80.0%. However, the random probability of this Target Area being correct is 65.0%. So the true probability of this Target Area being correct is 23.1% better than random.
Extensive Elliott Commentary for ETracs Alerian MLP Index ETN (AMU) Daily on 12-Feb-2016 with two incomplete patterns:
Wave C of the Primary degree inverted Flat with a rating of 93.7 is expected to complete in the price range 17.39 to 27.07, but more probably between 18.87 and 24.44. This wave is most likely to complete sometime between 24-Feb-2016 and 18-May-2016 Note that it cannot complete until 19-Feb-2016 but must complete by 10-Oct-2016.
This wave C will complete the Flat pattern.
This is the final wave in the pattern. When complete it will also complete wave x of the Cycle degree Double Zigzag with a rating of 85.4. These two waves have the same target ranges.
After wave x is complete, expect the market to continue down into wave y, which should be a three wave Zigzag pattern. Expect wave y to retrace wave x by 117% - 263%. Wave y can also be expected to be 90% - 263% of the price length of wave w. The expected time for wave y to complete is 21% - 161% of the time taken for wave x to complete and 27% - 154% of the time taken for wave w to complete.
Current Analysis Settings: Analysis Date Range: 23-Jul-2014 to 12-Feb-2016, Label Range: 15 - 50, Preferred Count Labels: 21, Min Rating: 75, Stocks toggle ON, Bias Towards Beginning of Data: 8, Bias Towards Major High/Low: 8, Largest Degree Wave Filter: Any Pattern
Rating:84.7
Current Trading Positions for F & C Claymore Pref Sec Inc Fd (FFC) Daily on 12-Feb-2016
* A Minor degree trader (hold positions from weeks to quarters), would currently be shorting this market. The probability of this Target Area being correct is 48.8%. However, the random probability of this Target Area being correct is 34.0%. So the true probability of this Target Area being correct is 43.5% better than random.
* An Intermediate degree trader (hold positions from months to quarters), would currently be trading long in this market. The probability of this Target Area being correct is 42.2%. However, the random probability of this Target Area being correct is 34.0%. So the true probability of this Target Area being correct is 24.1% better than random.
* A Primary degree trader (hold positions from months to years), would currently be shorting this market. The probability of this Target Area being correct is 79.6%. However, the random probability of this Target Area being correct is 65.0%. So the true probability of this Target Area being correct is 22.5% better than random.
Extensive Elliott Commentary for F & C Claymore Pref Sec Inc Fd (FFC) Daily on 12-Feb-2016 with three incomplete patterns:
Wave B of the Minor degree inverted Flat with a rating of 98.6 is expected to complete in the price range 17.47 to 19.23, but more probably between 18.74 and 19.21. This wave is due to complete anytime from now until 09-Sep-2016, but is most likely to complete before 07-Mar-2016.
After wave B is complete, expect the market to continue up into wave C, which should be a five wave Impulsive pattern. Expect wave C to retrace wave B by 82% - 177%. Wave C can also be expected to be 89% - 177% of the price length of wave A. The expected time for wave C to complete is 15% - 160% of the time taken for wave B to complete and 16% - 118% of the time taken for wave A to complete.
Wave (B) of the Intermediate degree Flat with a rating of 84.3 is expected to complete in the price range 20.01 to 25.95, but more probably between 20.04 and 21.17. This wave is due to complete anytime from now until 27-Jun-2016, but is most likely to complete before 19-Feb-2016.
After wave (B) is complete, expect the market to continue down into wave (C), which should be a five wave Impulsive pattern. Expect wave (C) to retrace wave (B) by 89% - 167%. Wave (C) can also be expected to be 104% - 167% of the price length of wave (A). The expected time for wave (C) to complete is 20% - 146% of the time taken for wave (B) to complete and 53% - 275% of the time taken for wave (A) to complete.
Wave X of the Primary degree inverted Double Zigzag with a rating of 84.7 is expected to complete in the price range 16.75 to 19.86, but more probably between 18.04 and 19.44. This wave is due to complete anytime from now until 22-Sep-2016, but is most likely to complete before 15-Feb-2016.
After wave X is complete, expect the market to continue up into wave Y, which should be a three wave Zigzag pattern. Expect wave Y to retrace wave X by 149% - 348%. Wave Y can also be expected to be 90% - 348% of the price length of wave W. The expected time for wave Y to complete is 23% - 188% of the time taken for wave X to complete and 28% - 133% of the time taken for wave W to complete.
Current Analysis Settings: Analysis Date Range: 19-Dec-2014 to 12-Feb-2016, Label Range: 15 - 50, Preferred Count Labels: 18, Min Rating: 75, Stocks toggle ON, Bias Towards Beginning of Data: 8, Bias Towards Major High/Low: 8, Largest Degree Wave Filter: Any Pattern
Rating:77.5
Current Trading Positions for Fiduciary/Claymore MLP Opportunity (FMO) Daily on 12-Feb-2016
* A Primary degree trader (hold positions from months to years), would currently be trading long in this market. The probability of this Target Area being correct is 51.8%. However, the random probability of this Target Area being correct is 45.0%. So the true probability of this Target Area being correct is 15.1% better than random.
* A Cycle degree trader (hold positions from quarters to years), would currently be shorting this market. The probability of this Target Area being correct is 33.5%. However, the random probability of this Target Area being correct is 24.3%. So the true probability of this Target Area being correct is 37.9% better than random.
Extensive Elliott Commentary for Fiduciary/Claymore MLP Opportunity (FMO) Daily on 12-Feb-2016 with three incomplete patterns:
Wave (C) of the Intermediate degree inverted Flat with a rating of 96.9 is expected to complete in the price range 10.75 to 16.7, but more probably between 11.68 and 15.1. This wave is most likely to complete sometime between 18-Feb-2016 and 30-Mar-2016 Note that it cannot complete until 17-Feb-2016 but must complete by 02-Aug-2016.
This wave (C) will complete the Flat pattern.
This is the final wave in the pattern. When complete it will also complete wave B of the Primary degree Zigzag with a rating of 84.5. These two waves have the same target ranges.
After wave B is complete, expect the market to continue down into wave C, which should be a five wave impulsive pattern. Expect wave C to retrace wave B by 127% - 277%. Wave C can also be expected to be 43% - 277% of the price length of wave A. The expected time for wave C to complete is 19% - 191% of the time taken for wave B to complete and 55% - 222% of the time taken for wave A to complete.
Wave y of the Cycle degree Double Zigzag with a rating of 77.5 is expected to complete in the price range 4.05 to 7.44, but more probably between 5.75 and 7.27. This wave is due to complete anytime from now until 01-Apr-2016, but is most likely to complete before 22-Feb-2016.
Wave y will probably complete this Double Sharp pattern, although it could possibly extend into a Triple Sharp pattern.
Current Analysis Settings: Analysis Date Range: 21-Jul-2014 to 12-Feb-2016, Label Range: 15 - 50, Preferred Count Labels: 24, Min Rating: 75, Stocks toggle ON, Bias Towards Beginning of Data: 8, Bias Towards Major High/Low: 8, Largest Degree Wave Filter: Any Pattern
Rating:108.8
Current Trading Positions for First Trust Amex Biotechnology Index Fund ETF (FBT) Daily on 12-Feb-2016
* An Intermediate degree trader (hold positions from months to quarters), would currently be trading long in this market. The probability of this Target Area being correct is 87.8%. However, the random probability of this Target Area being correct is 64.1%. So the true probability of this Target Area being correct is 37.0% better than random.
Extensive Elliott Commentary for First Trust Amex Biotechnology Index Fund ETF (FBT) Daily on 12-Feb-2016 with one incomplete pattern:
Wave (Y) of the Intermediate degree inverted Double 3 with a rating of 108.8 is expected to complete in the price range 77.5 to 104.3, but more probably between 81.29 and 88.19. This wave is due to complete anytime from now until 15-Feb-2016, but is most likely to complete before 12-Feb-2016.
Wave (Y) will probably complete this Double Sideways pattern, although it could possibly extend into a Triple Sideways pattern.
Current Analysis Settings: Analysis Date Range: 08-Jun-2015 to 12-Feb-2016, Label Range: 15 - 50, Preferred Count Labels: 21, Min Rating: 75, Stocks toggle ON, Bias Towards Beginning of Data: 8, Bias Towards Major High/Low: 8, Largest Degree Wave Filter: Any Pattern
Rating:81.8
Current Trading Positions for First Trust Consumer Staples AlphaDEX Fund ETF (FXG) Daily on 12-Feb-2016
* A Minute degree trader (hold positions from weeks to months), would currently be trading long in this market. The probability of this Target Area being correct is 71.0%. However, the random probability of this Target Area being correct is 45.0%. So the true probability of this Target Area being correct is 57.8% better than random.
* A Minor degree trader (hold positions from weeks to quarters), would currently be shorting this market. The probability of this Target Area being correct is 14.0%. However, the random probability of this Target Area being correct is 13.0%. So the true probability of this Target Area being correct is 7.7% better than random.
* A Primary degree trader (hold positions from months to years), would currently be shorting this market. The probability of this Target Area being correct is 41.3%. However, the random probability of this Target Area being correct is 34.0%. So the true probability of this Target Area being correct is 21.5% better than random.
Extensive Elliott Commentary for First Trust Consumer Staples AlphaDEX Fund ETF (FXG) Daily on 12-Feb-2016 with four incomplete patterns:
Wave ii of the Minute degree inverted Impulse with a rating of 98.1 is expected to complete in the price range 41.91 to 43.31, but more probably between 42.23 and 42.79. This wave was expected to complete before 12-Feb-2016, and must complete by 18-Feb-2016.
After this wave ii is complete, expect the market to continue down into wave iii. Wave iii should always be an Impulse and should retrace wave ii completely. Expect wave iii to retrace wave ii by 222% - 403%. Wave iii can also be expected to be 106% - 403% of the price length of wave i. The expected time for wave iii to complete is 35% - 364% of the time taken for wave ii to complete and 41% - 204% of the time taken for wave i to complete. The slope (ie. price range divided by time taken) of wave iii should be between 39% and 177% of the slope of wave i. Once wave iii is
complete, expect wave iv to be a sideways corrective movement, then wave v to continue in the same direction as wave iii. Wave v will complete this Impulse.
Wave 3 of the Minor degree inverted Impulse with a rating of 89.3 is expected to complete in the price range 32.4 to 41.47, but more probably between 38.5 and 40.71. This wave is due to complete anytime from now until 29-Feb-2016, but is most likely to complete before 18-Feb-2016.
When complete, expect the overall slope (ie. price range divided by time taken) of this wave 3 to be between 39% to 179% of the slope of wave 1. Then expect the market to pull back into wave 4, which will be corrective in nature and has a probability of 0% of being a Flat or other sideways pattern. Wave 4 should not retrace back into the price range of wave 1 or 2. Expect wave 4 to have between 11% - 134% of the price range of wave 2. The expected time for wave 4 to complete is between 13% - 148% of wave 2. After wave 4, expect wave 5 to move beyond the end of wave 3 to complete this Impulse.
Wave (C) of the Intermediate degree Flat with a rating of 88.2 is expected to complete in the price range 34.65 to 42.45, but more probably between 36.66 and 40.22. This wave is due to complete anytime from now until 18-Apr-2016, but is most likely to complete before 29-Feb-2016.
This wave (C) will complete the Flat pattern.
This is the final wave in the pattern. When complete it will also complete wave B of the Primary degree inverted Flat with a rating of 81.8. These two waves have the same target ranges.
After wave B is complete, expect the market to continue up into wave C, which should be a five wave Impulsive pattern. Expect wave C to retrace wave B by 82% - 177%. Wave C can also be expected to be 89% - 177% of the price length of wave A. The expected time for wave C to complete is 15% - 160% of the time taken for wave B to complete and 16% - 118% of the time taken for wave A to complete.
Current Analysis Settings: Analysis Date Range: 25-Jun-2015 to 12-Feb-2016, Label Range: 15 - 50, Preferred Count Labels: 47, Min Rating: 75, Stocks toggle ON, Bias Towards Beginning of Data: 8, Bias Towards Major High/Low: 8, Largest Degree Wave Filter: Any Pattern
Rating:101.8
Current Trading Positions for First Trust Dow Jones Global Select Dividend Index Fund ETF (FGD) Daily on 12-Feb-2016
* An Intermediate degree trader (hold positions from months to quarters), would currently be trading long in this market. The probability of this Target Area being correct is 42.2%. However, the random probability of this Target Area being correct is 24.3%. So the true probability of this Target Area being correct is 73.7% better than random.
Extensive Elliott Commentary for First Trust Dow Jones Global Select Dividend Index Fund ETF (FGD) Daily on 12-Feb-2016 with one incomplete pattern:
Wave (Y) of the Intermediate degree inverted Double Zigzag with a rating of 101.8 is expected to complete in the price range 21.64 to 26.2, but more probably between 21.67 and 23.39. This wave is most likely to complete sometime between 12-Feb-2016 and 25-Feb-2016 Note that it cannot complete until 12-Feb-2016 but must complete by 21-Mar-2016.
Wave (Y) will probably complete this Double Sharp pattern, although it could possibly extend into a Triple Sharp pattern.
Current Analysis Settings: Analysis Date Range: 08-May-2014 to 12-Feb-2016, Label Range: 15 - 50, Preferred Count Labels: 49, Min Rating: 75, Stocks toggle ON, Bias Towards Beginning of Data: 8, Bias Towards Major High/Low: 8, Largest Degree Wave Filter: Any Pattern
Rating:108.4
Current Trading Positions for First Trust Dow Jones Internet Index Fund ETF (FDN) Daily on 12-Feb-2016
* An Intermediate degree trader (hold positions from months to quarters), would currently be trading long in this market. The probability of this Target Area being correct is 87.8%. However, the random probability of this Target Area being correct is 64.1%. So the true probability of this Target Area being correct is 37.0% better than random.
Extensive Elliott Commentary for First Trust Dow Jones Internet Index Fund ETF (FDN) Daily on 12-Feb-2016 with one incomplete pattern:
Wave (Y) of the Intermediate degree inverted Double 3 with a rating of 108.4 is expected to complete in the price range 57.98 to 68.94, but more probably between 59.67 and 62.98. This wave is due to complete anytime from now until 15-Feb-2016, but is most likely to complete before 12-Feb-2016.
Wave (Y) will probably complete this Double Sideways pattern, although it could possibly extend into a Triple Sideways pattern.
Current Analysis Settings: Analysis Date Range: 14-Jul-2015 to 12-Feb-2016, Label Range: 15 - 50, Preferred Count Labels: 27, Min Rating: 75, Stocks toggle ON, Bias Towards Beginning of Data: 8, Bias Towards Major High/Low: 8, Largest Degree Wave Filter: Any Pattern
Rating:85.1
Current Trading Positions for First Trust Energy AlphaDEX Fund ETF (FXN) Daily on 12-Feb-2016
* An Intermediate degree trader (hold positions from months to quarters), would currently be shorting this market. The probability of this Target Area being correct is 70.0%. However, the random probability of this Target Area being correct is 13.0%. So the true probability of this Target Area being correct is 438.5% better than random.
* A Primary degree trader (hold positions from months to years), would currently be shorting this market. The probability of this Target Area being correct is 50.7%. However, the random probability of this Target Area being correct is 45.0%. So the true probability of this Target Area being correct is 12.7% better than random.
* A Cycle degree trader (hold positions from quarters to years), would currently be shorting this market. The probability of this Target Area being correct is 37.5%. However, the random probability of this Target Area being correct is 24.3%. So the true probability of this Target Area being correct is 54.3% better than random.
Extensive Elliott Commentary for First Trust Energy AlphaDEX Fund ETF (FXN) Daily on 12-Feb-2016 with three incomplete patterns:
Wave (3) of the Intermediate degree inverted Impulse with a rating of 104.4 is expected to complete at a price no higher than 9.56, but more probably between 1.39 and 7.77. This wave is due to complete anytime from now until 12-Apr-2016, but is most likely to complete before 09-Mar-2016.
When complete, expect the overall slope (ie. price range divided by time taken) of this wave (3) to be between 47% to 194% of the slope of wave (1). Then expect the market to pull back into wave (4), which will be corrective in nature and has a probability of 0% of being a Flat or other sideways pattern. Wave (4) should not retrace back into the price range of wave (1) or (2). Expect wave (4) to have between 5% - 140% of the price range of wave (2). The expected time for wave (4) to complete is between 15% - 136% of wave (2). After wave (4), expect wave (5) to move beyond the end of wave (3) to complete this Impulse.
Wave C of the Primary degree Zigzag with a rating of 87.9 is expected to complete in the price range .94 to 14.68, but more probably between 9.31 and 14.24. This wave is due to complete anytime from now until 06-Apr-2017, but is most likely to complete before 10-Mar-2016.
This wave C will complete the ZigZag pattern.
This is the final wave in the pattern. When complete it will also complete wave y of the Cycle degree Double Zigzag with a rating of 85.1. These two waves have the same target ranges.
Wave y will probably complete this Double Sharp pattern, although it could possibly extend into a Triple Sharp pattern.
Current Analysis Settings: Analysis Date Range: 12-May-2014 to 12-Feb-2016, Label Range: 15 - 50, Preferred Count Labels: 19, Min Rating: 75, Stocks toggle ON, Bias Towards Beginning of Data: 8, Bias Towards Major High/Low: 8, Largest Degree Wave Filter: Any Pattern
Rating:100.9
Current Trading Positions for First Trust ETF VI Multi-Asset Diversified Income Index (MDIV) Daily on 12-Feb-2016
* A Primary degree trader (hold positions from months to years), would currently be shorting this market. The probability of this Target Area being correct is 42.0%. However, the random probability of this Target Area being correct is 24.3%. So the true probability of this Target Area being correct is 72.8% better than random.
Extensive Elliott Commentary for First Trust ETF VI Multi-Asset Diversified Income Index (MDIV) Daily on 12-Feb-2016 with one incomplete pattern:
Wave Y of the Primary degree Double Zigzag with a rating of 100.9 is expected to complete in the price range 10.46 to 14.79, but more probably between 13.58 and 14.74. This wave is most likely to complete sometime between 17-Feb-2016 and 11-Mar-2016 Note that it cannot complete until 16-Feb-2016 but must complete by 31-Mar-2016.
Wave Y will probably complete this Double Sharp pattern, although it could possibly extend into a Triple Sharp pattern.
Current Analysis Settings: Analysis Date Range: 20-May-2014 to 12-Feb-2016, Label Range: 15 - 50, Preferred Count Labels: 16, Min Rating: 75, Stocks toggle ON, Bias Towards Beginning of Data: 8, Bias Towards Major High/Low: 8, Largest Degree Wave Filter: Any Pattern
Rating:87.1
Current Trading Positions for First Trust Europe AlphaDEX (FEP) Daily on 12-Feb-2016
* An Intermediate degree trader (hold positions from months to quarters), would currently be shorting this market. The probability of this Target Area being correct is 50.2%. However, the random probability of this Target Area being correct is 34.0%. So the true probability of this Target Area being correct is 47.6% better than random.
* A Primary degree trader (hold positions from months to years), would currently be trading long in this market. The probability of this Target Area being correct is 52.8%. However, the random probability of this Target Area being correct is 45.0%. So the true probability of this Target Area being correct is 17.3% better than random.
* A Cycle degree trader (hold positions from quarters to years), would currently be shorting this market. The probability of this Target Area being correct is 38.5%. However, the random probability of this Target Area being correct is 24.3%. So the true probability of this Target Area being correct is 58.4% better than random.
Extensive Elliott Commentary for First Trust Europe AlphaDEX (FEP) Daily on 12-Feb-2016 with three incomplete patterns:
Wave (B) of the Intermediate degree inverted Flat with a rating of 102.4 is expected to complete in the price range 18.11 to 26.33, but more probably between 25.05 and 26.29. This wave is due to complete anytime from now until 19-Apr-2016, but is most likely to complete before 18-Feb-2016.
After wave (B) is complete, expect the market to continue up into wave (C), which should be a five wave Impulsive pattern. Expect wave (C) to retrace wave (B) by 80% - 169%. Wave (C) can also be expected to be 99% - 169% of the price length of wave (A). The expected time for wave (C) to complete is 19% - 187% of the time taken for wave (B) to complete and 56% - 268% of the time taken for wave (A) to complete.
Wave B of the Primary degree Zigzag with a rating of 89.2 is expected to complete in the price range 25.77 to 30.88, but more probably between 26.27 and 28.2. This wave is due to complete anytime from now until 10-Mar-2017, but is most likely to complete before 08-Mar-2016.
After wave B is complete, expect the market to continue down into wave C, which should be a five wave impulsive pattern. Expect wave C to retrace wave B by 96% - 215%. Wave C can also be expected to be 33% - 215% of the price length of wave A. The expected time for wave C to complete is 22% - 199% of the time taken for wave B to complete and 24% - 111% of the time taken for wave A to complete.
Wave y of the Cycle degree Double Zigzag with a rating of 87.1 is expected to complete in the price range 13.99 to 22.71, but more probably between 20.22 and 22.57. This wave is due to complete anytime from now until 02-Mar-2017, but is most likely to complete before 12-Sep-2016.
Wave y will probably complete this Double Sharp pattern, although it could possibly extend into a Triple Sharp pattern.
Current Analysis Settings: Analysis Date Range: 25-Apr-2014 to 12-Feb-2016, Label Range: 15 - 50, Preferred Count Labels: 18, Min Rating: 75, Stocks toggle ON, Bias Towards Beginning of Data: 8, Bias Towards Major High/Low: 8, Largest Degree Wave Filter: Any Pattern
Rating:76.4
Current Trading Positions for First Trust Financials AlphaDex Fund ETF (FXO) Daily on 12-Feb-2016
* An Intermediate degree trader (hold positions from months to quarters), would currently be trading long in this market. The probability of this Target Area being correct is 85.5%. However, the random probability of this Target Area being correct is 64.1%. So the true probability of this Target Area being correct is 33.4% better than random.
* A Primary degree trader (hold positions from months to years), would currently be trading long in this market. The probability of this Target Area being correct is 39.8%. However, the random probability of this Target Area being correct is 34.0%. So the true probability of this Target Area being correct is 17.1% better than random.
Extensive Elliott Commentary for First Trust Financials AlphaDex Fund ETF (FXO) Daily on 12-Feb-2016 with three incomplete patterns:
Wave C of the Minor degree inverted Flat with a rating of 103.4 is expected to complete in the price range 19.84 to 21.42, but more probably between 20.23 and 20.94. This wave is due to complete anytime from now until 19-Feb-2016, but is most likely to complete before 12-Feb-2016.
This wave C will complete the Flat pattern.
This is the final wave in the pattern. When complete it will also complete wave (Y) of the Intermediate degree inverted Double 3 with a rating of 86. These two waves have the same target ranges.
Wave (Y) will probably complete this Double Sideways pattern, although it could possibly extend into a Triple Sideways pattern.
This is the final wave in the pattern. When complete it will also complete wave B of the Primary degree Flat with a rating of 76.4. These two waves have the same target ranges.
After wave B is complete, expect the market to continue down into wave C, which should be a five wave Impulsive pattern. Expect wave C to retrace wave B by 86% - 162%. Wave C can also be expected to be 90% - 162% of the price length of wave A. The expected time for wave C to complete is 19% - 134% of the time taken for wave B to complete and 24% - 115% of the time taken for wave A to complete.
Current Analysis Settings: Analysis Date Range: 24-Jun-2015 to 12-Feb-2016, Label Range: 15 - 50, Preferred Count Labels: 25, Min Rating: 75, Stocks toggle ON, Bias Towards Beginning of Data: 8, Bias Towards Major High/Low: 8, Largest Degree Wave Filter: Any Pattern
Rating:101.4
Current Trading Positions for First Trust Health Care AlphaDex Fund ETF (FXH) Daily on 12-Feb-2016
* An Intermediate degree trader (hold positions from months to quarters), would currently be shorting this market. The probability of this Target Area being correct is 88.3%. However, the random probability of this Target Area being correct is 65.0%. So the true probability of this Target Area being correct is 35.8% better than random.
Extensive Elliott Commentary for First Trust Health Care AlphaDex Fund ETF (FXH) Daily on 12-Feb-2016 with one incomplete pattern:
Wave (X) of the Intermediate degree inverted Double Zigzag with a rating of 101.4 is expected to complete in the price range 48.81 to 51.11, but more probably between 49.32 and 50.42. This wave was expected to complete before 12-Feb-2016, and must complete by 15-Feb-2016.
After wave (X) is complete, expect the market to continue up into wave (Y), which should be a three wave Zigzag pattern. Expect wave (Y) to retrace wave (X) by 123% - 305%. Wave (Y) can also be expected to be 91% - 305% of the price length of wave (W). The expected time for wave (Y) to complete is 28% - 154% of the time taken for wave (X) to complete and 86% - 284% of the time taken for wave (W) to complete.
Current Analysis Settings: Analysis Date Range: 03-Jun-2015 to 12-Feb-2016, Label Range: 15 - 50, Preferred Count Labels: 46, Min Rating: 75, Stocks toggle ON, Bias Towards Beginning of Data: 8, Bias Towards Major High/Low: 8, Largest Degree Wave Filter: Any Pattern
Rating:76.2
Current Trading Positions for First Trust High Income Long/Short Fund (FSD) Daily on 12-Feb-2016
* An Intermediate degree trader (hold positions from months to quarters), would currently be shorting this market. The probability of this Target Area being correct is 75.8%. However, the random probability of this Target Area being correct is 64.0%. So the true probability of this Target Area being correct is 18.4% better than random.
* A Primary degree trader (hold positions from months to years), would currently be trading long in this market. The probability of this Target Area being correct is 85.5%. However, the random probability of this Target Area being correct is 64.1%. So the true probability of this Target Area being correct is 33.4% better than random.
* A Cycle degree trader (hold positions from quarters to years), would currently be trading long in this market. The probability of this Target Area being correct is 39.8%. However, the random probability of this Target Area being correct is 34.0%. So the true probability of this Target Area being correct is 17.1% better than random.
Extensive Elliott Commentary for First Trust High Income Long/Short Fund (FSD) Daily on 12-Feb-2016 with three incomplete patterns:
Wave (D) of the Intermediate degree inverted Contracting Triangle with a rating of 98.5 is expected to complete in the price range 12.91 to 13.35, but more probably between 13.01 and 13.24. This wave was expected to complete before 05-Feb-2016, and must complete by 25-Feb-2016.
Once this wave (D) is complete, expect the market to continue up to the end of wave (E), which will most probably be a ZigZag family pattern or possibly a Contracting Triangle. Expect wave (E) to have between 39% and 66% of the price range of wave (C) and complete in 4% to 60% of the time taken by wave (C). Expect also that wave (E) will have between 21% and 47% of the price range of wave (A) and complete in 2% to 24% of the time taken by wave (A). The slope (ie. price range divided by time taken) of wave (E) should be between 28% and 143% of the slope of wave (C) and between 19% to 183% of the slope of wave (A). Wave (E) will complete this Contracting Triangle.
Wave Y of the Primary degree inverted Double 3 with a rating of 85.6 is expected to complete in the price range 13.59 to 20.06, but more probably between 14.6 and 16.65. This wave is due to complete anytime from now until 30-May-2016, but is most likely to complete before 09-Mar-2016.
Wave Y will probably complete this Double Sideways pattern, although it could possibly extend into a Triple Sideways pattern.
This is the final wave in the pattern. When complete it will also complete wave b of the Cycle degree Flat with a rating of 76.2. These two waves have the same target ranges.
After wave b is complete, expect the market to continue down into wave c, which should be a five wave Impulsive pattern. Expect wave c to retrace wave b by 85% - 162%. Wave c can also be expected to be 90% - 162% of the price length of wave a. The expected time for wave c to complete is 20% - 136% of the time taken for wave b to complete and 20% - 110% of the time taken for wave a to complete.
Current Analysis Settings: Analysis Date Range: 13-May-2014 to 12-Feb-2016, Label Range: 15 - 50, Preferred Count Labels: 20, Min Rating: 75, Stocks toggle ON, Bias Towards Beginning of Data: 8, Bias Towards Major High/Low: 8, Largest Degree Wave Filter: Any Pattern
Rating:85.9
Current Trading Positions for First Trust Industrials AlphaDex Fund ETF (FXR) Daily on 12-Feb-2016
* An Intermediate degree trader (hold positions from months to quarters), would currently be trading long in this market. The probability of this Target Area being correct is 42.8%. However, the random probability of this Target Area being correct is 24.3%. So the true probability of this Target Area being correct is 76.1% better than random.
* A Primary degree trader (hold positions from months to years), would currently be trading long in this market. The probability of this Target Area being correct is 42.5%. However, the random probability of this Target Area being correct is 34.0%. So the true probability of this Target Area being correct is 25.0% better than random.
Extensive Elliott Commentary for First Trust Industrials AlphaDex Fund ETF (FXR) Daily on 12-Feb-2016 with two incomplete patterns:
Wave (Y) of the Intermediate degree inverted Double Zigzag with a rating of 104.2 is expected to complete in the price range 24.9 to 29.96, but more probably between 24.93 and 26.84. This wave is most likely to complete sometime between 12-Feb-2016 and 25-Feb-2016 Note that it cannot complete until 12-Feb-2016 but must complete by 21-Mar-2016.
Wave (Y) will probably complete this Double Sharp pattern, although it could possibly extend into a Triple Sharp pattern.
This is the final wave in the pattern. When complete it will also complete wave B of the Primary degree Flat with a rating of 85.9. These two waves have the same target ranges.
After wave B is complete, expect the market to continue down into wave C, which should be a five wave Impulsive pattern. Expect wave C to retrace wave B by 86% - 162%. Wave C can also be expected to be 90% - 162% of the price length of wave A. The expected time for wave C to complete is 19% - 134% of the time taken for wave B to complete and 24% - 115% of the time taken for wave A to complete.
Current Analysis Settings: Analysis Date Range: 13-Jan-2015 to 12-Feb-2016, Label Range: 15 - 50, Preferred Count Labels: 43, Min Rating: 75, Stocks toggle ON, Bias Towards Beginning of Data: 8, Bias Towards Major High/Low: 8, Largest Degree Wave Filter: Any Pattern
Rating:99.6
Current Trading Positions for First Trust Intermediate Duration Preferred Income Fund (FPF) Daily on 12-Feb-2016
* A Cycle degree trader (hold positions from quarters to years), would currently be shorting this market. The probability of this Target Area being correct is 41.8%. However, the random probability of this Target Area being correct is 24.3%. So the true probability of this Target Area being correct is 72.0% better than random.
Extensive Elliott Commentary for First Trust Intermediate Duration Preferred Income Fund (FPF) Daily on 12-Feb-2016 with one incomplete pattern:
Wave y of the Cycle degree Double Zigzag with a rating of 99.6 is expected to complete in the price range 17.32 to 20.45, but more probably between 19.59 and 20.42. This wave is most likely to complete sometime between 01-Mar-2016 and 04-Jul-2016 Note that it cannot complete until 29-Feb-2016 but must complete by 22-Sep-2016.
Wave y will probably complete this Double Sharp pattern, although it could possibly extend into a Triple Sharp pattern.
Current Analysis Settings: Analysis Date Range: 19-Mar-2015 to 12-Feb-2016, Label Range: 15 - 50, Preferred Count Labels: 17, Min Rating: 75, Stocks toggle ON, Bias Towards Beginning of Data: 8, Bias Towards Major High/Low: 8, Largest Degree Wave Filter: Any Pattern
Rating:81
Current Trading Positions for First Trust IPOX-100 Index Fund ETF (FPX) Daily on 12-Feb-2016
* An Intermediate degree trader (hold positions from months to quarters), would currently be shorting this market. The probability of this Target Area being correct is 88.3%. However, the random probability of this Target Area being correct is 65.0%. So the true probability of this Target Area being correct is 35.8% better than random.
* A Primary degree trader (hold positions from months to years), would currently be trading long in this market. The probability of this Target Area being correct is 41.0%. However, the random probability of this Target Area being correct is 34.0%. So the true probability of this Target Area being correct is 20.6% better than random.
Extensive Elliott Commentary for First Trust IPOX-100 Index Fund ETF (FPX) Daily on 12-Feb-2016 with two incomplete patterns:
Wave (X) of the Intermediate degree inverted Double Zigzag with a rating of 101.3 is expected to complete in the price range 42.35 to 43.74, but more probably between 42.65 and 43.33. This wave was expected to complete before 12-Feb-2016, and must complete by 15-Feb-2016.
After wave (X) is complete, expect the market to continue up into wave (Y), which should be a three wave Zigzag pattern. Expect wave (Y) to retrace wave (X) by 123% - 305%. Wave (Y) can also be expected to be 91% - 305% of the price length of wave (W). The expected time for wave (Y) to complete is 28% - 154% of the time taken for wave (X) to complete and 86% - 284% of the time taken for wave (W) to complete.
Wave B of the Primary degree Flat with a rating of 81 is expected to complete in the price range 49.86 to 71.41, but more probably between 50.08 and 55.72. This wave is most likely to complete sometime between 19-Feb-2016 and 29-Apr-2016 Note that it cannot complete until 12-Feb-2016 but must complete by 22-Aug-2017.
After wave B is complete, expect the market to continue down into wave C, which should be a five wave Impulsive pattern. Expect wave C to retrace wave B by 86% - 162%. Wave C can also be expected to be 90% - 162% of the price length of wave A. The expected time for wave C to complete is 19% - 134% of the time taken for wave B to complete and 24% - 115% of the time taken for wave A to complete.
Current Analysis Settings: Analysis Date Range: 11-Jun-2015 to 12-Feb-2016, Label Range: 15 - 50, Preferred Count Labels: 20, Min Rating: 75, Stocks toggle ON, Bias Towards Beginning of Data: 8, Bias Towards Major High/Low: 8, Largest Degree Wave Filter: Any Pattern
Rating:88.6
Current Trading Positions for First Trust ISE Cloud Computing Index Fund (SKYY) Daily on 12-Feb-2016
* A Primary degree trader (hold positions from months to years), would currently be trading long in this market. The probability of this Target Area being correct is 87.6%. However, the random probability of this Target Area being correct is 80.4%. So the true probability of this Target Area being correct is 9.0% better than random.
Extensive Elliott Commentary for First Trust ISE Cloud Computing Index Fund (SKYY) Daily on 12-Feb-2016 with two incomplete patterns:
Wave (C) of the Intermediate degree inverted Flat with a rating of 105.7 is expected to complete in the price range 25.07 to 27.74, but more probably between 25.84 and 26.94. This wave is due to complete anytime from now until 19-Feb-2016, but is most likely to complete before 12-Feb-2016.
This wave (C) will complete the Flat pattern.
This is the final wave in the pattern. When complete it will also complete wave 4 of the Primary degree inverted Ending Diagonal with a rating of 88.6. These two waves have the same target ranges.
Expect this wave 4 to complete in the price range of wave 2, and then continue down to the end of wave 5, which should be a ZigZag family three wave pattern. Expect wave 5 to have between 52% and 92% of the price range of wave 3 and complete in 20% to 64% of the time taken by wave 3. Expect also that wave 5 will have between 31% and 73% of the price range of wave 1 and complete in 3% to 22% of the time taken by wave 1. The slope (ie. price range divided by time taken) of wave 5 should be between 49% and 173% of the slope of wave 3 and between 77% to 312% of the slope of wave 1. Wave 5 will complete this Ending Diagonal pattern.
Current Analysis Settings: Analysis Date Range: 26-Oct-2015 to 12-Feb-2016, Label Range: 15 - 50, Preferred Count Labels: 19, Min Rating: 75, Stocks toggle ON, Bias Towards Beginning of Data: 8, Bias Towards Major High/Low: 8, Largest Degree Wave Filter: Any Pattern
Rating:80.1
Current Trading Positions for First Trust ISE Revere Natural Gas Index Fund ETF (FCG) Daily on 12-Feb-2016
* A Primary degree trader (hold positions from months to years), would currently be shorting this market. The probability of this Target Area being correct is 65.1%. However, the random probability of this Target Area being correct is 45.0%. So the true probability of this Target Area being correct is 44.7% better than random.
* A Cycle degree trader (hold positions from quarters to years), would currently be shorting this market. The probability of this Target Area being correct is 35.0%. However, the random probability of this Target Area being correct is 24.3%. So the true probability of this Target Area being correct is 44.0% better than random.
Extensive Elliott Commentary for First Trust ISE Revere Natural Gas Index Fund ETF (FCG) Daily on 12-Feb-2016 with two incomplete patterns:
Wave C of the Primary degree Zigzag with a rating of 103.3 is expected to complete at a price no higher than 3.14, but more probably between 1.04 and 2.97. This wave could complete anytime between now and 18-May-2016, but is most likely to complete sometime between 15-Feb-2016 and 15-Mar-2016.
This wave C will complete the ZigZag pattern.
This is the final wave in the pattern. When complete it will also complete wave y of the Cycle degree Double Zigzag with a rating of 80.1. These two waves have the same target ranges.
Wave y will probably complete this Double Sharp pattern, although it could possibly extend into a Triple Sharp pattern.
Current Analysis Settings: Analysis Date Range: 12-May-2014 to 12-Feb-2016, Label Range: 15 - 50, Preferred Count Labels: 21, Min Rating: 75, Stocks toggle ON, Bias Towards Beginning of Data: 8, Bias Towards Major High/Low: 8, Largest Degree Wave Filter: Any Pattern
Rating:89
Current Trading Positions for First Trust Large Cap Core AlphaDEX Fund ETF (FEX) Daily on 12-Feb-2016
* An Intermediate degree trader (hold positions from months to quarters), would currently be trading long in this market. The probability of this Target Area being correct is 42.2%. However, the random probability of this Target Area being correct is 24.3%. So the true probability of this Target Area being correct is 73.7% better than random.
* A Primary degree trader (hold positions from months to years), would currently be trading long in this market. The probability of this Target Area being correct is 43.7%. However, the random probability of this Target Area being correct is 34.0%. So the true probability of this Target Area being correct is 28.5% better than random.
Extensive Elliott Commentary for First Trust Large Cap Core AlphaDEX Fund ETF (FEX) Daily on 12-Feb-2016 with two incomplete patterns:
Wave (Y) of the Intermediate degree inverted Double Zigzag with a rating of 101.5 is expected to complete in the price range 41.07 to 51.06, but more probably between 41.48 and 45.24. This wave is most likely to complete sometime between 12-Feb-2016 and 25-Feb-2016 Note that it cannot complete until 12-Feb-2016 but must complete by 21-Mar-2016.
Wave (Y) will probably complete this Double Sharp pattern, although it could possibly extend into a Triple Sharp pattern.
This is the final wave in the pattern. When complete it will also complete wave B of the Primary degree Flat with a rating of 89. These two waves have the same target ranges.
After wave B is complete, expect the market to continue down into wave C, which should be a five wave Impulsive pattern. Expect wave C to retrace wave B by 86% - 162%. Wave C can also be expected to be 90% - 162% of the price length of wave A. The expected time for wave C to complete is 19% - 134% of the time taken for wave B to complete and 24% - 115% of the time taken for wave A to complete.
Current Analysis Settings: Analysis Date Range: 10-Apr-2015 to 12-Feb-2016, Label Range: 15 - 50, Preferred Count Labels: 21, Min Rating: 75, Stocks toggle ON, Bias Towards Beginning of Data: 8, Bias Towards Major High/Low: 8, Largest Degree Wave Filter: Any Pattern
Rating:80.2
Current Trading Positions for First Trust Large Cap Growth Opportunities AlphaDex Fund ETF (FTC) Daily on 12-Feb-2016
* An Intermediate degree trader (hold positions from months to quarters), would currently be trading long in this market. The probability of this Target Area being correct is 64.5%. However, the random probability of this Target Area being correct is 45.0%. So the true probability of this Target Area being correct is 43.3% better than random.
* A Primary degree trader (hold positions from months to years), would currently be trading long in this market. The probability of this Target Area being correct is 41.0%. However, the random probability of this Target Area being correct is 34.0%. So the true probability of this Target Area being correct is 20.6% better than random.
Extensive Elliott Commentary for First Trust Large Cap Growth Opportunities AlphaDex Fund ETF (FTC) Daily on 12-Feb-2016 with two incomplete patterns:
Wave (C) of the Intermediate degree inverted Zigzag with a rating of 100.6 is expected to complete in the price range 43.6 to 49.61, but more probably between 43.77 and 46. This wave is due to complete anytime from now until 19-Feb-2016, but is most likely to complete before 15-Feb-2016.
This wave (C) will complete the ZigZag pattern.
This is the final wave in the pattern. When complete it will also complete wave B of the Primary degree Flat with a rating of 80.2. These two waves have the same target ranges.
After wave B is complete, expect the market to continue down into wave C, which should be a five wave Impulsive pattern. Expect wave C to retrace wave B by 86% - 162%. Wave C can also be expected to be 90% - 162% of the price length of wave A. The expected time for wave C to complete is 19% - 134% of the time taken for wave B to complete and 24% - 115% of the time taken for wave A to complete.
Current Analysis Settings: Analysis Date Range: 24-Jun-2015 to 12-Feb-2016, Label Range: 15 - 50, Preferred Count Labels: 38, Min Rating: 75, Stocks toggle ON, Bias Towards Beginning of Data: 8, Bias Towards Major High/Low: 8, Largest Degree Wave Filter: Any Pattern
Rating:88.2
Current Trading Positions for First Trust Large Cap Value Opportunities AlphaDex Fund ETF (FTA) Daily on 12-Feb-2016
* An Intermediate degree trader (hold positions from months to quarters), would currently be trading long in this market. The probability of this Target Area being correct is 42.4%. However, the random probability of this Target Area being correct is 24.3%. So the true probability of this Target Area being correct is 74.5% better than random.
* A Primary degree trader (hold positions from months to years), would currently be trading long in this market. The probability of this Target Area being correct is 43.4%. However, the random probability of this Target Area being correct is 34.0%. So the true probability of this Target Area being correct is 27.6% better than random.
Extensive Elliott Commentary for First Trust Large Cap Value Opportunities AlphaDex Fund ETF (FTA) Daily on 12-Feb-2016 with two incomplete patterns:
Wave (Y) of the Intermediate degree inverted Double Zigzag with a rating of 102.9 is expected to complete in the price range 37.01 to 45.83, but more probably between 37.07 and 40.34. This wave is most likely to complete sometime between 12-Feb-2016 and 25-Feb-2016 Note that it cannot complete until 12-Feb-2016 but must complete by 21-Mar-2016.
Wave (Y) will probably complete this Double Sharp pattern, although it could possibly extend into a Triple Sharp pattern.
This is the final wave in the pattern. When complete it will also complete wave B of the Primary degree Flat with a rating of 88.2. These two waves have the same target ranges.
After wave B is complete, expect the market to continue down into wave C, which should be a five wave Impulsive pattern. Expect wave C to retrace wave B by 86% - 162%. Wave C can also be expected to be 90% - 162% of the price length of wave A. The expected time for wave C to complete is 19% - 134% of the time taken for wave B to complete and 24% - 115% of the time taken for wave A to complete.
Current Analysis Settings: Analysis Date Range: 24-Mar-2015 to 12-Feb-2016, Label Range: 15 - 50, Preferred Count Labels: 27, Min Rating: 75, Stocks toggle ON, Bias Towards Beginning of Data: 8, Bias Towards Major High/Low: 8, Largest Degree Wave Filter: Any Pattern
Rating:78
Current Trading Positions for First Trust Mid Cap Core AlphaDex Fund ETF (FNX) Daily on 12-Feb-2016
* An Intermediate degree trader (hold positions from months to quarters), would currently be shorting this market. The probability of this Target Area being correct is 80.4%. However, the random probability of this Target Area being correct is 65.0%. So the true probability of this Target Area being correct is 23.7% better than random.
* A Primary degree trader (hold positions from months to years), would currently be trading long in this market. The probability of this Target Area being correct is 40.4%. However, the random probability of this Target Area being correct is 34.0%. So the true probability of this Target Area being correct is 18.8% better than random.
Extensive Elliott Commentary for First Trust Mid Cap Core AlphaDex Fund ETF (FNX) Daily on 12-Feb-2016 with three incomplete patterns:
Wave C of the Minor degree Flat with a rating of 97.7 is expected to complete in the price range 40.17 to 44.25, but more probably between 41.4 and 43.12. This wave was expected to complete before 09-Feb-2016, and must complete by 15-Feb-2016.
This wave C will complete the Flat pattern.
This is the final wave in the pattern. When complete it will also complete wave (X) of the Intermediate degree inverted Double Zigzag with a rating of 86.8. These two waves have the same target ranges.
After wave (X) is complete, expect the market to continue up into wave (Y), which should be a three wave Zigzag pattern. Expect wave (Y) to retrace wave (X) by 128% - 319%. Wave (Y) can also be expected to be 90% - 319% of the price length of wave (W). The expected time for wave (Y) to complete is 23% - 167% of the time taken for wave (X) to complete and 47% - 204% of the time taken for wave (W) to complete.
Wave B of the Primary degree Flat with a rating of 78 is expected to complete in the price range 48.4 to 68.6, but more probably between 48.61 and 53.89. This wave is due to complete anytime from now until 25-Apr-2017, but is most likely to complete before 31-Mar-2016.
After wave B is complete, expect the market to continue down into wave C, which should be a five wave Impulsive pattern. Expect wave C to retrace wave B by 86% - 162%. Wave C can also be expected to be 90% - 162% of the price length of wave A. The expected time for wave C to complete is 19% - 134% of the time taken for wave B to complete and 24% - 115% of the time taken for wave A to complete.
Current Analysis Settings: Analysis Date Range: 04-Mar-2015 to 12-Feb-2016, Label Range: 15 - 50, Preferred Count Labels: 21, Min Rating: 75, Stocks toggle ON, Bias Towards Beginning of Data: 8, Bias Towards Major High/Low: 8, Largest Degree Wave Filter: Any Pattern
Rating:75.6
Current Trading Positions for First Trust MLP and Energy Fund (FEI) Daily on 12-Feb-2016
* An Intermediate degree trader (hold positions from months to quarters), would currently be shorting this market. The probability of this Target Area being correct is 46.0%. However, the random probability of this Target Area being correct is 13.0%. So the true probability of this Target Area being correct is 253.8% better than random.
* A Primary degree trader (hold positions from months to years), would currently be shorting this market. The probability of this Target Area being correct is 49.8%. However, the random probability of this Target Area being correct is 45.0%. So the true probability of this Target Area being correct is 10.7% better than random.
* A Cycle degree trader (hold positions from quarters to years), would currently be shorting this market. The probability of this Target Area being correct is 32.5%. However, the random probability of this Target Area being correct is 24.3%. So the true probability of this Target Area being correct is 33.7% better than random.
Extensive Elliott Commentary for First Trust MLP and Energy Fund (FEI) Daily on 12-Feb-2016 with three incomplete patterns:
Wave (3) of the Intermediate degree inverted Impulse with a rating of 96.8 is expected to complete at a price no higher than 7.39, but more probably between .09 and 6.68. This wave is due to complete anytime from now until 13-Apr-2016, but is most likely to complete before 04-Mar-2016.
When complete, expect the overall slope (ie. price range divided by time taken) of this wave (3) to be between 47% to 194% of the slope of wave (1). Then expect the market to pull back into wave (4), which will be corrective in nature and has a probability of 0% of being a Flat or other sideways pattern. Wave (4) should not retrace back into the price range of wave (1) or (2). Expect wave (4) to have between 5% - 140% of the price range of wave (2). The expected time for wave (4) to complete is between 16% - 136% of wave (2). After wave (4), expect wave (5) to move beyond the end of wave (3) to complete this Impulse.
Wave C of the Primary degree Zigzag with a rating of 78 is expected to complete at a price no higher than 11.28, but more probably between 7.36 and 11.07. This wave was expected to complete before 09-Feb-2016, and must complete by 24-Mar-2016.
This wave C will complete the ZigZag pattern.
This is the final wave in the pattern. When complete it will also complete wave y of the Cycle degree Double Zigzag with a rating of 75.6. These two waves have the same target ranges.
Wave y will probably complete this Double Sharp pattern, although it could possibly extend into a Triple Sharp pattern.
Current Analysis Settings: Analysis Date Range: 21-Jul-2014 to 12-Feb-2016, Label Range: 15 - 50, Preferred Count Labels: 15, Min Rating: 75, Stocks toggle ON, Bias Towards Beginning of Data: 8, Bias Towards Major High/Low: 8, Largest Degree Wave Filter: Any Pattern
Rating:102.1
Current Trading Positions for First Trust Morningstar Dividend Leaders Index Fund ETF (FDL) Daily on 12-Feb-2016
* An Intermediate degree trader (hold positions from months to quarters), would currently be shorting this market. The probability of this Target Area being correct is 57.0%. However, the random probability of this Target Area being correct is 45.0%. So the true probability of this Target Area being correct is 26.7% better than random.
Extensive Elliott Commentary for First Trust Morningstar Dividend Leaders Index Fund ETF (FDL) Daily on 12-Feb-2016 with one incomplete pattern:
Wave (B) of the Intermediate degree inverted Zigzag with a rating of 102.1 is expected to complete in the price range 22.25 to 24, but more probably between 22.99 and 23.77. This wave is due to complete anytime from now until 17-May-2016, but is most likely to complete before 23-Feb-2016.
After wave (B) is complete, expect the market to continue up into wave (C), which should be a five wave impulsive pattern. Expect wave (C) to retrace wave (B) by 114% - 331%. Wave (C) can also be expected to be 53% - 331% of the price length of wave (A). The expected time for wave (C) to complete is 24% - 277% of the time taken for wave (B) to complete and 31% - 204% of the time taken for wave (A) to complete.
Current Analysis Settings: Analysis Date Range: 09-Dec-2014 to 12-Feb-2016, Label Range: 15 - 50, Preferred Count Labels: 50, Min Rating: 75, Stocks toggle ON, Bias Towards Beginning of Data: 8, Bias Towards Major High/Low: 8, Largest Degree Wave Filter: Any Pattern
Rating:77
Current Trading Positions for First Trust New Opportunities MLP & Energy Fund (FPL) Daily on 12-Feb-2016
* An Intermediate degree trader (hold positions from months to quarters), would currently be shorting this market. The probability of this Target Area being correct is 38.0%. However, the random probability of this Target Area being correct is 13.0%. So the true probability of this Target Area being correct is 192.3% better than random.
* A Primary degree trader (hold positions from months to years), would currently be shorting this market. The probability of this Target Area being correct is 49.9%. However, the random probability of this Target Area being correct is 45.0%. So the true probability of this Target Area being correct is 10.9% better than random.
* A Cycle degree trader (hold positions from quarters to years), would currently be shorting this market. The probability of this Target Area being correct is 33.5%. However, the random probability of this Target Area being correct is 24.3%. So the true probability of this Target Area being correct is 37.9% better than random.
Extensive Elliott Commentary for First Trust New Opportunities MLP & Energy Fund (FPL) Daily on 12-Feb-2016 with three incomplete patterns:
Wave (3) of the Intermediate degree inverted Impulse with a rating of 94 is expected to complete at a price no higher than 6.1, but more probably no higher than 5.44. This wave is due to complete anytime from now until 13-Apr-2016, but is most likely to complete before 04-Mar-2016.
When complete, expect the overall slope (ie. price range divided by time taken) of this wave (3) to be between 47% to 194% of the slope of wave (1). Then expect the market to pull back into wave (4), which will be corrective in nature and has a probability of 0% of being a Flat or other sideways pattern. Wave (4) should not retrace back into the price range of wave (1) or (2). Expect wave (4) to have between 5% - 140% of the price range of wave (2). The expected time for wave (4) to complete is between 16% - 136% of wave (2). After wave (4), expect wave (5) to move beyond the end of wave (3) to complete this Impulse.
Wave C of the Primary degree Zigzag with a rating of 80 is expected to complete at a price no higher than 9.5, but more probably between 6 and 9.29. This wave is due to complete anytime from now until 02-May-2016, but is most likely to complete before 12-Feb-2016.
This wave C will complete the ZigZag pattern.
This is the final wave in the pattern. When complete it will also complete wave y of the Cycle degree Double Zigzag with a rating of 77. These two waves have the same target ranges.
Wave y will probably complete this Double Sharp pattern, although it could possibly extend into a Triple Sharp pattern.
Current Analysis Settings: Analysis Date Range: 27-Mar-2014 to 12-Feb-2016, Label Range: 15 - 50, Preferred Count Labels: 21, Min Rating: 75, Stocks toggle ON, Bias Towards Beginning of Data: 8, Bias Towards Major High/Low: 8, Largest Degree Wave Filter: Any Pattern
Rating:83.7
Current Trading Positions for First Trust North American Energy Infrastructure Fund (EMLP) Daily on 12-Feb-2016
* An Intermediate degree trader (hold positions from months to quarters), would currently be shorting this market. The probability of this Target Area being correct is 71.0%. However, the random probability of this Target Area being correct is 45.0%. So the true probability of this Target Area being correct is 57.8% better than random.
Extensive Elliott Commentary for First Trust North American Energy Infrastructure Fund (EMLP) Daily on 12-Feb-2016 with two incomplete patterns:
Wave (2) of the Intermediate degree Impulse with a rating of 99 is expected to complete in the price range 17.22 to 20.16, but more probably between 18.71 and 19.86. This wave was expected to complete before 09-Feb-2016, and must complete by 14-Mar-2016.
After this wave (2) is complete, expect the market to continue up into wave (3). Wave (3) should always be an Impulse and should retrace wave (2) completely. Expect wave (3) to retrace wave (2) by 164% - 383%. Wave (3) can also be expected to be 83% - 383% of the price length of wave (1). The expected time for wave (3) to complete is 87% - 367% of the time taken for wave (2) to complete and 16% - 97% of the time taken for wave (1) to complete. The slope (ie. price range divided by time taken) of wave (3) should be between 70% and 219% of the slope of wave (1). Once wave (3) is complete, expect wave (4) to be a sideways corrective movement, then wave (5) to continue in the same direction as wave (3). Wave (5) will complete this Impulse.
Wave C of the Primary degree inverted Flat with a rating of 83.7 is expected to complete in the price range 19.89 to 35.61, but more probably between 24.79 and 32.07. This wave is due to complete anytime from now until 29-Nov-2016, but is most likely to complete before 13-May-2016.
This wave C will complete the Flat pattern.
Current Analysis Settings: Analysis Date Range: 14-Nov-2014 to 12-Feb-2016, Label Range: 15 - 50, Preferred Count Labels: 15, Min Rating: 75, Stocks toggle ON, Bias Towards Beginning of Data: 8, Bias Towards Major High/Low: 8, Largest Degree Wave Filter: Any Pattern
Rating:87.4
Current Trading Positions for First Trust Technology AlphaDex Fund ETF (FXL) Daily on 12-Feb-2016
* A Primary degree trader (hold positions from months to years), would currently be shorting this market. The probability of this Target Area being correct is 50.1%. However, the random probability of this Target Area being correct is 34.0%. So the true probability of this Target Area being correct is 47.4% better than random.
* A Cycle degree trader (hold positions from quarters to years), would currently be trading long in this market. The probability of this Target Area being correct is 55.7%. However, the random probability of this Target Area being correct is 53.0%. So the true probability of this Target Area being correct is 5.1% better than random.
Extensive Elliott Commentary for First Trust Technology AlphaDex Fund ETF (FXL) Daily on 12-Feb-2016 with two incomplete patterns:
Wave B of the Primary degree inverted Flat with a rating of 101.9 is expected to complete in the price range 21.13 to 29.09, but more probably between 27.85 and 29.05. This wave is due to complete anytime from now until 19-Apr-2016, but is most likely to complete before 18-Feb-2016.
After wave B is complete, expect the market to continue up into wave C, which should be a five wave Impulsive pattern. Expect wave C to retrace wave B by 80% - 169%. Wave C can also be expected to be 99% - 169% of the price length of wave A. The expected time for wave C to complete is 19% - 187% of the time taken for wave B to complete and 56% - 268% of the time taken for wave A to complete.
Wave x of the Cycle degree Double 3 with a rating of 87.4 is expected to complete in the price range 33.29 to 68.76, but more probably between 33.51 and 36.94. This wave is due to complete anytime from now until 07-Dec-2017, but is most likely to complete before 19-May-2016.
After wave x is complete, expect the market to continue down into wave y, which will probably be a three wave corrective pattern. Expect wave y to retrace wave x by 98% - 193%. Wave y can also be expected to be 76% - 193% of the price length of wave w. The expected time for wave y to complete is 20% - 178% of the time taken for wave x to complete and 12% - 115% of the time taken for wave w to complete.
Current Analysis Settings: Analysis Date Range: 22-Apr-2015 to 12-Feb-2016, Label Range: 15 - 50, Preferred Count Labels: 15, Min Rating: 75, Stocks toggle ON, Bias Towards Beginning of Data: 8, Bias Towards Major High/Low: 8, Largest Degree Wave Filter: Any Pattern
Rating:85.1
Current Trading Positions for First Trust Utilities AlphaDEX Fund ETF (FXU) Daily on 12-Feb-2016
* A Cycle degree trader (hold positions from quarters to years), would currently be trading long in this market. The probability of this Target Area being correct is 80.0%. However, the random probability of this Target Area being correct is 65.0%. So the true probability of this Target Area being correct is 23.1% better than random.
Extensive Elliott Commentary for First Trust Utilities AlphaDEX Fund ETF (FXU) Daily on 12-Feb-2016 with two incomplete patterns:
Wave C of the Primary degree inverted Flat with a rating of 102.3 is expected to complete in the price range 21.33 to 25.52, but more probably between 22.4 and 23.91. This wave is due to complete anytime from now until 02-May-2016, but is most likely to complete before 22-Feb-2016.
This wave C will complete the Flat pattern.
This is the final wave in the pattern. When complete it will also complete wave x of the Cycle degree Double Zigzag with a rating of 85.1. These two waves have the same target ranges.
After wave x is complete, expect the market to continue down into wave y, which should be a three wave Zigzag pattern. Expect wave y to retrace wave x by 116% - 261%. Wave y can also be expected to be 90% - 261% of the price length of wave w. The expected time for wave y to complete is 21% - 160% of the time taken for wave x to complete and 25% - 152% of the time taken for wave w to complete.
Current Analysis Settings: Analysis Date Range: 06-Dec-2013 to 12-Feb-2016, Label Range: 15 - 50, Preferred Count Labels: 15, Min Rating: 75, Stocks toggle ON, Bias Towards Beginning of Data: 8, Bias Towards Major High/Low: 8, Largest Degree Wave Filter: Any Pattern
Rating:98.7
Current Trading Positions for First Trust Value Line Dividend Index ETF (FVD) Daily on 12-Feb-2016
* A Primary degree trader (hold positions from months to years), would currently be trading long in this market. The probability of this Target Area being correct is 41.6%. However, the random probability of this Target Area being correct is 24.3%. So the true probability of this Target Area being correct is 71.2% better than random.
Extensive Elliott Commentary for First Trust Value Line Dividend Index ETF (FVD) Daily on 12-Feb-2016 with one incomplete pattern:
Wave Y of the Primary degree inverted Double Zigzag with a rating of 98.7 is expected to complete in the price range 30.31 to 35.06, but more probably between 30.45 and 33.07. This wave is due to complete anytime from now until 27-Sep-2016, but is most likely to complete before 15-Apr-2016.
Wave Y will probably complete this Double Sharp pattern, although it could possibly extend into a Triple Sharp pattern.
Current Analysis Settings: Analysis Date Range: 14-Nov-2014 to 12-Feb-2016, Label Range: 15 - 50, Preferred Count Labels: 18, Min Rating: 75, Stocks toggle ON, Bias Towards Beginning of Data: 8, Bias Towards Major High/Low: 8, Largest Degree Wave Filter: Any Pattern
Rating:76.8
Current Trading Positions for FlexShares iBoxx 3-Year Target Duration TIPS Index Fund (TDTT) Daily on 12-Feb-2016
* A Cycle degree trader (hold positions from quarters to years), would currently be trading long in this market. The probability of this Target Area being correct is 76.4%. However, the random probability of this Target Area being correct is 65.0%. So the true probability of this Target Area being correct is 17.5% better than random.
Extensive Elliott Commentary for FlexShares iBoxx 3-Year Target Duration TIPS Index Fund (TDTT) Daily on 12-Feb-2016 with two incomplete patterns:
Wave C of the Primary degree inverted Flat with a rating of 99.2 is expected to complete in the price range 24.19 to 24.99, but more probably between 24.33 and 24.76. This wave is due to complete anytime from now until 16-Jun-2017, but is most likely to complete before 15-Apr-2016.
This wave C will complete the Flat pattern.
This is the final wave in the pattern. When complete it will also complete wave x of the Cycle degree Double Zigzag with a rating of 76.8. These two waves have the same target ranges.
After wave x is complete, expect the market to continue down into wave y, which should be a three wave Zigzag pattern. Expect wave y to retrace wave x by 117% - 263%. Wave y can also be expected to be 90% - 263% of the price length of wave w. The expected time for wave y to complete is 21% - 161% of the time taken for wave x to complete and 27% - 154% of the time taken for wave w to complete.
Current Analysis Settings: Analysis Date Range: 16-Apr-2014 to 12-Feb-2016, Label Range: 15 - 50, Preferred Count Labels: 22, Min Rating: 75, Stocks toggle ON, Bias Towards Beginning of Data: 8, Bias Towards Major High/Low: 8, Largest Degree Wave Filter: Any Pattern
Rating:85.4
Current Trading Positions for FlexShares International Quality Dividend Index Fund (IQDF) Daily on 12-Feb-2016
* A Primary degree trader (hold positions from months to years), would currently be shorting this market. The probability of this Target Area being correct is 65.9%. However, the random probability of this Target Area being correct is 53.0%. So the true probability of this Target Area being correct is 24.3% better than random.
* A Cycle degree trader (hold positions from quarters to years), would currently be trading long in this market. The probability of this Target Area being correct is 80.0%. However, the random probability of this Target Area being correct is 65.0%. So the true probability of this Target Area being correct is 23.1% better than random.
Extensive Elliott Commentary for FlexShares International Quality Dividend Index Fund (IQDF) Daily on 12-Feb-2016 with two incomplete patterns:
Wave X of the Primary degree inverted Double 3 with a rating of 101.6 is expected to complete in the price range 11.81 to 19.95, but more probably between 18.7 and 19.39. This wave was expected to complete before 11-Feb-2016, and must complete by 28-Mar-2016.
After wave X is complete, expect the market to continue up into wave Y, which will probably be a three wave corrective pattern. Expect wave Y to retrace wave X by 98% - 212%. Wave Y can also be expected to be 73% - 212% of the price length of wave W. The expected time for wave Y to complete is 27% - 214% of the time taken for wave X to complete and 38% - 222% of the time taken for wave W to complete.
Wave x of the Cycle degree Double Zigzag with a rating of 85.4 is expected to complete in the price range 20.31 to 26.97, but more probably between 22.18 and 25.59. This wave could complete anytime between now and 16-May-2018, but is most likely to complete sometime between 02-Mar-2016 and 14-Sep-2016.
After wave x is complete, expect the market to continue down into wave y, which should be a three wave Zigzag pattern. Expect wave y to retrace wave x by 117% - 263%. Wave y can also be expected to be 90% - 263% of the price length of wave w. The expected time for wave y to complete is 21% - 161% of the time taken for wave x to complete and 27% - 154% of the time taken for wave w to complete.
Current Analysis Settings: Analysis Date Range: 08-May-2014 to 12-Feb-2016, Label Range: 15 - 50, Preferred Count Labels: 16, Min Rating: 75, Stocks toggle ON, Bias Towards Beginning of Data: 8, Bias Towards Major High/Low: 8, Largest Degree Wave Filter: Any Pattern
Rating:88.8
Current Trading Positions for FlexShares Quality Dividend Fund (QDF) Daily on 12-Feb-2016
* An Intermediate degree trader (hold positions from months to quarters), would currently be shorting this market. The probability of this Target Area being correct is 88.6%. However, the random probability of this Target Area being correct is 65.0%. So the true probability of this Target Area being correct is 36.3% better than random.
* A Primary degree trader (hold positions from months to years), would currently be trading long in this market. The probability of this Target Area being correct is 43.4%. However, the random probability of this Target Area being correct is 34.0%. So the true probability of this Target Area being correct is 27.6% better than random.
Extensive Elliott Commentary for FlexShares Quality Dividend Fund (QDF) Daily on 12-Feb-2016 with two incomplete patterns:
Wave (X) of the Intermediate degree inverted Double Zigzag with a rating of 102.5 is expected to complete in the price range 31.09 to 33.14, but more probably between 31.76 and 32.77. This wave is due to complete anytime from now until 14-Mar-2016, but is most likely to complete before 16-Feb-2016.
After wave (X) is complete, expect the market to continue up into wave (Y), which should be a three wave Zigzag pattern. Expect wave (Y) to retrace wave (X) by 128% - 319%. Wave (Y) can also be expected to be 90% - 319% of the price length of wave (W). The expected time for wave (Y) to complete is 23% - 167% of the time taken for wave (X) to complete and 47% - 204% of the time taken for wave (W) to complete.
Wave B of the Primary degree Flat with a rating of 88.8 is expected to complete in the price range 34.87 to 45.71, but more probably between 34.98 and 37.81. This wave is due to complete anytime from now until 17-Apr-2017, but is most likely to complete before 30-Mar-2016.
After wave B is complete, expect the market to continue down into wave C, which should be a five wave Impulsive pattern. Expect wave C to retrace wave B by 86% - 162%. Wave C can also be expected to be 90% - 162% of the price length of wave A. The expected time for wave C to complete is 19% - 134% of the time taken for wave B to complete and 24% - 115% of the time taken for wave A to complete.
Current Analysis Settings: Analysis Date Range: 12-Jan-2015 to 12-Feb-2016, Label Range: 15 - 50, Preferred Count Labels: 15, Min Rating: 75, Stocks toggle ON, Bias Towards Beginning of Data: 8, Bias Towards Major High/Low: 8, Largest Degree Wave Filter: Any Pattern
Rating:98.8
Current Trading Positions for FollowNuveen NASDAQ 100 Dynamic Overwrite Fund (QQQX) Daily on 12-Feb-2016
* A Primary degree trader (hold positions from months to years), would currently be shorting this market. The probability of this Target Area being correct is 48.8%. However, the random probability of this Target Area being correct is 34.0%. So the true probability of this Target Area being correct is 43.5% better than random.
Extensive Elliott Commentary for FollowNuveen NASDAQ 100 Dynamic Overwrite Fund (QQQX) Daily on 12-Feb-2016 with one incomplete pattern:
Wave B of the Primary degree inverted Flat with a rating of 98.8 is expected to complete in the price range 12.32 to 15.51, but more probably between 14.62 and 15.47. This wave could complete anytime between now and 16-Mar-2018, but is most likely to complete sometime between 22-Feb-2016 and 27-May-2016.
After wave B is complete, expect the market to continue up into wave C, which should be a five wave Impulsive pattern. Expect wave C to retrace wave B by 82% - 177%. Wave C can also be expected to be 89% - 177% of the price length of wave A. The expected time for wave C to complete is 15% - 160% of the time taken for wave B to complete and 16% - 118% of the time taken for wave A to complete.
Current Analysis Settings: Analysis Date Range: 27-Oct-2014 to 12-Feb-2016, Label Range: 15 - 50, Preferred Count Labels: 15, Min Rating: 75, Stocks toggle ON, Bias Towards Beginning of Data: 8, Bias Towards Major High/Low: 8, Largest Degree Wave Filter: Any Pattern
Rating:79.7
Current Trading Positions for Global X FTSE Greece 20 ETF (GREK) Daily on 12-Feb-2016
* A Primary degree trader (hold positions from months to years), would currently be shorting this market. The probability of this Target Area being correct is 61.8%. However, the random probability of this Target Area being correct is 45.0%. So the true probability of this Target Area being correct is 37.3% better than random.
* A Cycle degree trader (hold positions from quarters to years), would currently be shorting this market. The probability of this Target Area being correct is 34.5%. However, the random probability of this Target Area being correct is 24.3%. So the true probability of this Target Area being correct is 42.0% better than random.
Extensive Elliott Commentary for Global X FTSE Greece 20 ETF (GREK) Daily on 12-Feb-2016 with two incomplete patterns:
Wave C of the Primary degree Zigzag with a rating of 98.5 is expected to complete at a price no higher than 8.44, but more probably between 4.84 and 7.9. This wave is due to complete anytime from now until 09-Sep-2016, but is most likely to complete before 24-Feb-2016.
This wave C will complete the ZigZag pattern.
This is the final wave in the pattern. When complete it will also complete wave y of the Cycle degree Double Zigzag with a rating of 79.7. These two waves have the same target ranges.
Wave y will probably complete this Double Sharp pattern, although it could possibly extend into a Triple Sharp pattern.
Current Analysis Settings: Analysis Date Range: 05-Feb-2014 to 12-Feb-2016, Label Range: 15 - 50, Preferred Count Labels: 19, Min Rating: 75, Stocks toggle ON, Bias Towards Beginning of Data: 8, Bias Towards Major High/Low: 8, Largest Degree Wave Filter: Any Pattern
Rating:81.1
Current Trading Positions for Global X InterBolsa FTSE Colombia 20 ETF (GXG) Daily on 12-Feb-2016
* A Cycle degree trader (hold positions from quarters to years), would currently be trading long in this market. The probability of this Target Area being correct is 41.3%. However, the random probability of this Target Area being correct is 34.0%. So the true probability of this Target Area being correct is 21.5% better than random.
Extensive Elliott Commentary for Global X InterBolsa FTSE Colombia 20 ETF (GXG) Daily on 12-Feb-2016 with two incomplete patterns:
Wave C of the Primary degree inverted Flat with a rating of 99.8 is expected to complete in the price range 7.34 to 13.16, but more probably between 8.76 and 11.27. This wave is due to complete anytime from now until 14-Oct-2016, but is most likely to complete before 08-Apr-2016.
This wave C will complete the Flat pattern.
This is the final wave in the pattern. When complete it will also complete wave b of the Cycle degree Flat with a rating of 81.1. These two waves have the same target ranges.
After wave b is complete, expect the market to continue down into wave c, which should be a five wave Impulsive pattern. Expect wave c to retrace wave b by 86% - 162%. Wave c can also be expected to be 90% - 162% of the price length of wave a. The expected time for wave c to complete is 19% - 134% of the time taken for wave b to complete and 24% - 115% of the time taken for wave a to complete.
Current Analysis Settings: Analysis Date Range: 17-Jun-2014 to 12-Feb-2016, Label Range: 15 - 50, Preferred Count Labels: 16, Min Rating: 75, Stocks toggle ON, Bias Towards Beginning of Data: 8, Bias Towards Major High/Low: 8, Largest Degree Wave Filter: Any Pattern
Rating:80.7
Current Trading Positions for Global X MLP & Energy Infrastructure ETF (MLPX) Daily on 12-Feb-2016
* A Primary degree trader (hold positions from months to years), would currently be shorting this market. The probability of this Target Area being correct is 88.0%. However, the random probability of this Target Area being correct is 65.0%. So the true probability of this Target Area being correct is 35.4% better than random.
* A Cycle degree trader (hold positions from quarters to years), would currently be trading long in this market. The probability of this Target Area being correct is 41.0%. However, the random probability of this Target Area being correct is 34.0%. So the true probability of this Target Area being correct is 20.6% better than random.
Extensive Elliott Commentary for Global X MLP & Energy Infrastructure ETF (MLPX) Daily on 12-Feb-2016 with two incomplete patterns:
Wave X of the Primary degree inverted Double Zigzag with a rating of 100.4 is expected to complete in the price range 8.59 to 10.37, but more probably between 9.17 and 10.05. This wave is due to complete anytime from now until 08-Mar-2016, but is most likely to complete before 12-Feb-2016.
After wave X is complete, expect the market to continue up into wave Y, which should be a three wave Zigzag pattern. Expect wave Y to retrace wave X by 128% - 319%. Wave Y can also be expected to be 90% - 319% of the price length of wave W. The expected time for wave Y to complete is 23% - 167% of the time taken for wave X to complete and 47% - 204% of the time taken for wave W to complete.
Wave b of the Cycle degree Flat with a rating of 80.7 is expected to complete in the price range 16.12 to 37.73, but more probably between 16.34 and 21.99. This wave could complete anytime between now and 01-Jul-2020, but is most likely to complete sometime between 24-Feb-2016 and 15-Sep-2016.
After wave b is complete, expect the market to continue down into wave c, which should be a five wave Impulsive pattern. Expect wave c to retrace wave b by 86% - 162%. Wave c can also be expected to be 90% - 162% of the price length of wave a. The expected time for wave c to complete is 19% - 134% of the time taken for wave b to complete and 24% - 115% of the time taken for wave a to complete.
Current Analysis Settings: Analysis Date Range: 24-Jul-2014 to 12-Feb-2016, Label Range: 15 - 50, Preferred Count Labels: 18, Min Rating: 75, Stocks toggle ON, Bias Towards Beginning of Data: 8, Bias Towards Major High/Low: 8, Largest Degree Wave Filter: Any Pattern
Rating:85.9
Current Trading Positions for Global X SuperIncome Preferred ETF (SPFF) Daily on 12-Feb-2016
* An Intermediate degree trader (hold positions from months to quarters), would currently be trading long in this market. The probability of this Target Area being correct is 53.6%. However, the random probability of this Target Area being correct is 45.0%. So the true probability of this Target Area being correct is 19.1% better than random.
* A Primary degree trader (hold positions from months to years), would currently be shorting this market. The probability of this Target Area being correct is 37.5%. However, the random probability of this Target Area being correct is 24.3%. So the true probability of this Target Area being correct is 54.3% better than random.
Extensive Elliott Commentary for Global X SuperIncome Preferred ETF (SPFF) Daily on 12-Feb-2016 with three incomplete patterns:
Wave C of the Minor degree inverted Flat with a rating of 102 is expected to complete in the price range 12.15 to 13, but more probably between 12.34 and 12.76. This wave is due to complete anytime from now until 19-Feb-2016, but is most likely to complete before 12-Feb-2016.
This wave C will complete the Flat pattern.
This is the final wave in the pattern. When complete it will also complete wave (B) of the Intermediate degree Zigzag with a rating of 93.5. These two waves have the same target ranges.
After wave (B) is complete, expect the market to continue down into wave (C), which should be a five wave impulsive pattern. Expect wave (C) to retrace wave (B) by 127% - 277%. Wave (C) can also be expected to be 43% - 277% of the price length of wave (A). The expected time for wave (C) to complete is 19% - 191% of the time taken for wave (B) to complete and 55% - 222% of the time taken for wave (A) to complete.
Wave Y of the Primary degree Double Zigzag with a rating of 85.9 is expected to complete in the price range 11.6 to 12.19, but more probably between 11.98 and 12.17. This wave is due to complete anytime from now until 23-Jun-2016, but is most likely to complete before 28-Mar-2016.
Wave Y will probably complete this Double Sharp pattern, although it could possibly extend into a Triple Sharp pattern.
Current Analysis Settings: Analysis Date Range: 24-Mar-2014 to 12-Feb-2016, Label Range: 15 - 50, Preferred Count Labels: 16, Min Rating: 75, Stocks toggle ON, Bias Towards Beginning of Data: 8, Bias Towards Major High/Low: 8, Largest Degree Wave Filter: Any Pattern
Rating:75.9
Current Trading Positions for Guggenheim BulletShares 2016 High Yield Corp Bond ETF (BSJG) Daily on 12-Feb-2016
* An Intermediate degree trader (hold positions from months to quarters), would currently be shorting this market. The probability of this Target Area being correct is 70.5%. However, the random probability of this Target Area being correct is 45.0%. So the true probability of this Target Area being correct is 56.7% better than random.
* A Primary degree trader (hold positions from months to years), would currently be trading long in this market. The probability of this Target Area being correct is 49.9%. However, the random probability of this Target Area being correct is 45.0%. So the true probability of this Target Area being correct is 10.9% better than random.
* A Cycle degree trader (hold positions from quarters to years), would currently be trading long in this market. The probability of this Target Area being correct is 39.5%. However, the random probability of this Target Area being correct is 34.0%. So the true probability of this Target Area being correct is 16.2% better than random.
Extensive Elliott Commentary for Guggenheim BulletShares 2016 High Yield Corp Bond ETF (BSJG) Daily on 12-Feb-2016 with three incomplete patterns:
Wave (2) of the Intermediate degree Impulse with a rating of 94.9 is expected to complete in the price range 25.33 to 25.67, but more probably between 25.5 and 25.64. This wave was expected to complete before 03-Feb-2016, and must complete by 29-Feb-2016.
After this wave (2) is complete, expect the market to continue up into wave (3). Wave (3) should always be an Impulse and should retrace wave (2) completely. Expect wave (3) to retrace wave (2) by 164% - 383%. Wave (3) can also be expected to be 83% - 383% of the price length of wave (1). The expected time for wave (3) to complete is 87% - 367% of the time taken for wave (2) to complete and 16% - 97% of the time taken for wave (1) to complete. The slope (ie. price range divided by time taken) of wave (3) should be between 70% and 219% of the slope of wave (1).
Once wave (3) is complete, expect wave (4) to be a sideways corrective movement, then wave (5) to continue in the same direction as wave (3). Wave (5) will complete this Impulse.
Wave C of the Primary degree inverted Zigzag with a rating of 79.1 is expected to complete in the price range 26.34 to 30.98, but more probably between 26.4 and 28.31. This wave is most likely to complete sometime between 29-Feb-2016 and 26-Oct-2016 Note that it cannot complete until 18-Feb-2016 but must complete by 08-Jun-2018.
This wave C will complete the ZigZag pattern.
This is the final wave in the pattern. When complete it will also complete wave b of the Cycle degree Flat with a rating of 75.9. These two waves have the same target ranges.
After wave b is complete, expect the market to continue down into wave c, which should be a five wave Impulsive pattern. Expect wave c to retrace wave b by 86% - 162%. Wave c can also be expected to be 90% - 162% of the price length of wave a. The expected time for wave c to complete is 19% - 134% of the time taken for wave b to complete and 24% - 115% of the time taken for wave a to complete.
Current Analysis Settings: Analysis Date Range: 18-Feb-2014 to 12-Feb-2016, Label Range: 15 - 50, Preferred Count Labels: 23, Min Rating: 75, Stocks toggle ON, Bias Towards Beginning of Data: 8, Bias Towards Major High/Low: 8, Largest Degree Wave Filter: Any Pattern
Rating:83.3
Current Trading Positions for Guggenheim BulletShares 2017 High Yield Corp Bond ETF (BSJH) Daily on 12-Feb-2016
* An Intermediate degree trader (hold positions from months to quarters), would currently be shorting this market. The probability of this Target Area being correct is 50.0%. However, the random probability of this Target Area being correct is 34.0%. So the true probability of this Target Area being correct is 47.1% better than random.
* A Primary degree trader (hold positions from months to years), would currently be trading long in this market. The probability of this Target Area being correct is 85.3%. However, the random probability of this Target Area being correct is 64.1%. So the true probability of this Target Area being correct is 33.1% better than random.
Extensive Elliott Commentary for Guggenheim BulletShares 2017 High Yield Corp Bond ETF (BSJH) Daily on 12-Feb-2016 with two incomplete patterns:
Wave (B) of the Intermediate degree inverted Flat with a rating of 100.3 is expected to complete in the price range 22.81 to 24.59, but more probably between 24.31 and 24.58. This wave is due to complete anytime from now until 08-Apr-2016, but is most likely to complete before 15-Feb-2016.
After wave (B) is complete, expect the market to continue up into wave (C), which should be a five wave Impulsive pattern. Expect wave (C) to retrace wave (B) by 80% - 169%. Wave (C) can also be expected to be 99% - 169% of the price length of wave (A). The expected time for wave (C) to complete is 19% - 187% of the time taken for wave (B) to complete and 56% - 268% of the time taken for wave (A) to complete.
Wave Y of the Primary degree inverted Double 3 with a rating of 83.3 is expected to complete in the price range 24.92 to 27.18, but more probably between 25.14 and 26.21. This wave is due to complete anytime from now until 19-Sep-2016, but is most likely to complete before 26-Apr-2016.
Wave Y will probably complete this Double Sideways pattern, although it could possibly extend into a Triple Sideways pattern.
Current Analysis Settings: Analysis Date Range: 18-Feb-2014 to 12-Feb-2016, Label Range: 15 - 50, Preferred Count Labels: 23, Min Rating: 75, Stocks toggle ON, Bias Towards Beginning of Data: 8, Bias Towards Major High/Low: 8, Largest Degree Wave Filter: Any Pattern
Rating:77.4
Current Trading Positions for Guggenheim BulletShares 2018 High Yield Corp Bond ETF (BSJI) Daily on 12-Feb-2016
* A Primary degree trader (hold positions from months to years), would currently be shorting this market. The probability of this Target Area being correct is 62.3%. However, the random probability of this Target Area being correct is 53.0%. So the true probability of this Target Area being correct is 17.5% better than random.
* A Cycle degree trader (hold positions from quarters to years), would currently be trading long in this market. The probability of this Target Area being correct is 40.1%. However, the random probability of this Target Area being correct is 34.0%. So the true probability of this Target Area being correct is 17.9% better than random.
Extensive Elliott Commentary for Guggenheim BulletShares 2018 High Yield Corp Bond ETF (BSJI) Daily on 12-Feb-2016 with two incomplete patterns:
Wave X of the Primary degree inverted Double 3 with a rating of 97.6 is expected to complete in the price range 20.75 to 23.32, but more probably between 22.92 and 23.14. This wave was expected to complete before 10-Feb-2016, and must complete by 18-Mar-2016.
After wave X is complete, expect the market to continue up into wave Y, which will probably be a three wave corrective pattern. Expect wave Y to retrace wave X by 98% - 212%. Wave Y can also be expected to be 73% - 212% of the price length of wave W. The expected time for wave Y to complete is 27% - 214% of the time taken for wave X to complete and 38% - 222% of the time taken for wave W to complete.
Wave b of the Cycle degree Flat with a rating of 77.4 is expected to complete in the price range 25.26 to 31.74, but more probably between 25.33 and 27.04. This wave could complete anytime between now and 19-Feb-2021, but is most likely to complete sometime between 19-Feb-2016 and 05-Oct-2016.
After wave b is complete, expect the market to continue down into wave c, which should be a five wave Impulsive pattern. Expect wave c to retrace wave b by 85% - 162%. Wave c can also be expected to be 90% - 162% of the price length of wave a. The expected time for wave c to complete is 20% - 136% of the time taken for wave b to complete and 20% - 110% of the time taken for wave a to complete.
Current Analysis Settings: Analysis Date Range: 14-May-2014 to 12-Feb-2016, Label Range: 15 - 50, Preferred Count Labels: 20, Min Rating: 75, Stocks toggle ON, Bias Towards Beginning of Data: 8, Bias Towards Major High/Low: 8, Largest Degree Wave Filter: Any Pattern
Rating:81.8
Current Trading Positions for Guggenheim BulletShares 2019 Corp Bond (BSCJ) Daily on 12-Feb-2016
* A Cycle degree trader (hold positions from quarters to years), would currently be shorting this market. The probability of this Target Area being correct is 87.1%. However, the random probability of this Target Area being correct is 64.1%. So the true probability of this Target Area being correct is 35.9% better than random.
* A Supercycle degree trader (buy and hold for years), would currently be shorting this market. The probability of this Target Area being correct is 78.4%. However, the random probability of this Target Area being correct is 65.0%. So the true probability of this Target Area being correct is 20.6% better than random.
Extensive Elliott Commentary for Guggenheim BulletShares 2019 Corp Bond (BSCJ) Daily on 12-Feb-2016 with two incomplete patterns:
Wave y of the Cycle degree Double 3 with a rating of 101.1 is expected to complete in the price range 19.82 to 21.25, but more probably between 20.66 and 21.01. This wave could complete anytime between now and 03-May-2017, but is most likely to complete sometime between 16-Feb-2016 and 08-Sep-2016.
Wave y will probably complete this Double Sideways pattern, although it could possibly extend into a Triple Sideways pattern.
This is the final wave in the pattern. When complete it will also complete wave (x) of the Supercycle degree inverted Double Zigzag with a rating of 81.8. These two waves have the same target ranges.
After wave (x) is complete, expect the market to continue up into wave (y), which should be a three wave Zigzag pattern. Expect wave (y) to retrace wave (x) by 149% - 348%. Wave (y) can also be expected to be 90% - 348% of the price length of wave (w). The expected time for wave (y) to complete is 23% - 188% of the time taken for wave (x) to complete and 28% - 133% of the time taken for wave (w) to complete.
Current Analysis Settings: Analysis Date Range: 06-Dec-2013 to 12-Feb-2016, Label Range: 15 - 50, Preferred Count Labels: 19, Min Rating: 75, Stocks toggle ON, Bias Towards Beginning of Data: 8, Bias Towards Major High/Low: 8, Largest Degree Wave Filter: Any Pattern
Rating:101.2
Current Trading Positions for Guggenheim BulletShares 2019 High Yield Corporate Bond ETF (BSJJ) Daily on 12-Feb-2016
* An Intermediate degree trader (hold positions from months to quarters), would currently be shorting this market. The probability of this Target Area being correct is 50.1%. However, the random probability of this Target Area being correct is 34.0%. So the true probability of this Target Area being correct is 47.4% better than random.
Extensive Elliott Commentary for Guggenheim BulletShares 2019 High Yield Corporate Bond ETF (BSJJ) Daily on 12-Feb-2016 with one incomplete pattern:
Wave (B) of the Intermediate degree inverted Flat with a rating of 101.2 is expected to complete in the price range 18.9 to 22.01, but more probably between 21.52 and 21.99. This wave is due to complete anytime from now until 08-Apr-2016, but is most likely to complete before 15-Feb-2016.
After wave (B) is complete, expect the market to continue up into wave (C), which should be a five wave Impulsive pattern. Expect wave (C) to retrace wave (B) by 80% - 169%. Wave (C) can also be expected to be 99% - 169% of the price length of wave (A). The expected time for wave (C) to complete is 19% - 187% of the time taken for wave (B) to complete and 56% - 268% of the time taken for wave (A) to complete.
Current Analysis Settings: Analysis Date Range: 22-Jan-2014 to 12-Feb-2016, Label Range: 15 - 50, Preferred Count Labels: 49, Min Rating: 75, Stocks toggle ON, Bias Towards Beginning of Data: 8, Bias Towards Major High/Low: 8, Largest Degree Wave Filter: Any Pattern
Rating:88
Current Trading Positions for Guggenheim BulletShares 2020 Corp Bond (BSCK) Daily on 12-Feb-2016
* A Primary degree trader (hold positions from months to years), would currently be shorting this market. The probability of this Target Area being correct is 50.0%. However, the random probability of this Target Area being correct is 34.0%. So the true probability of this Target Area being correct is 47.1% better than random.
* A Cycle degree trader (hold positions from quarters to years), would currently be trading long in this market. The probability of this Target Area being correct is 81.2%. However, the random probability of this Target Area being correct is 65.0%. So the true probability of this Target Area being correct is 24.9% better than random.
Extensive Elliott Commentary for Guggenheim BulletShares 2020 Corp Bond (BSCK) Daily on 12-Feb-2016 with two incomplete patterns:
Wave B of the Primary degree inverted Flat with a rating of 100.6 is expected to complete in the price range 18.71 to 21.03, but more probably between 20.67 and 21.01. This wave was expected to complete before 08-Feb-2016, and must complete by 15-Apr-2016.
After wave B is complete, expect the market to continue up into wave C, which should be a five wave Impulsive pattern. Expect wave C to retrace wave B by 80% - 169%. Wave C can also be expected to be 99% - 169% of the price length of wave A. The expected time for wave C to complete is 19% - 187% of the time taken for wave B to complete and 56% - 268% of the time taken for wave A to complete.
Wave x of the Cycle degree Double Zigzag with a rating of 88 is expected to complete in the price range 21.08 to 22.22, but more probably between 21.39 and 21.99. This wave could complete anytime between now and 21-Sep-2018, but is most likely to complete sometime between 24-Feb-2016 and 10-Oct-2016.
After wave x is complete, expect the market to continue down into wave y, which should be a three wave Zigzag pattern. Expect wave y to retrace wave x by 116% - 261%. Wave y can also be expected to be 90% - 261% of the price length of wave w. The expected time for wave y to complete is 21% - 160% of the time taken for wave x to complete and 25% - 152% of the time taken for wave w to complete.
Current Analysis Settings: Analysis Date Range: 06-Dec-2013 to 12-Feb-2016, Label Range: 15 - 50, Preferred Count Labels: 15, Min Rating: 75, Stocks toggle ON, Bias Towards Beginning of Data: 8, Bias Towards Major High/Low: 8, Largest Degree Wave Filter: Any Pattern
Rating:92.1
Current Trading Positions for Guggenheim CurrencyShares Euro Trust (FXE) Daily on 12-Feb-2016
* A Cycle degree trader (hold positions from quarters to years), would currently be trading long in this market. The probability of this Target Area being correct is 83.2%. However, the random probability of this Target Area being correct is 65.0%. So the true probability of this Target Area being correct is 28.0% better than random.
Extensive Elliott Commentary for Guggenheim CurrencyShares Euro Trust (FXE) Daily on 12-Feb-2016 with two incomplete patterns:
Wave C of the Primary degree inverted Flat with a rating of 106.1 is expected to complete in the price range 106.09 to 134.5, but more probably between 113.34 and 124.55. This wave is due to complete anytime from now until 13-Oct-2017, but is most likely to complete before 25-Apr-2016.
This wave C will complete the Flat pattern.
This is the final wave in the pattern. When complete it will also complete wave x of the Cycle degree Double Zigzag with a rating of 92.1. These two waves have the same target ranges.
After wave x is complete, expect the market to continue down into wave y, which should be a three wave Zigzag pattern. Expect wave y to retrace wave x by 116% - 261%. Wave y can also be expected to be 90% - 261% of the price length of wave w. The expected time for wave y to complete is 21% - 160% of the time taken for wave x to complete and 25% - 152% of the time taken for wave w to complete.
Current Analysis Settings: Analysis Date Range: 30-Jan-2014 to 12-Feb-2016, Label Range: 15 - 50, Preferred Count Labels: 15, Min Rating: 75, Stocks toggle ON, Bias Towards Beginning of Data: 8, Bias Towards Major High/Low: 8, Largest Degree Wave Filter: Any Pattern
Rating:90.4
Current Trading Positions for Guggenheim CurrencyShares Japanese Yen Trust (FXY) Daily on 12-Feb-2016
* An Intermediate degree trader (hold positions from months to quarters), would currently be trading long in this market. The probability of this Target Area being correct is 65.1%. However, the random probability of this Target Area being correct is 45.0%. So the true probability of this Target Area being correct is 44.7% better than random.
* A Primary degree trader (hold positions from months to years), would currently be trading long in this market. The probability of this Target Area being correct is 86.5%. However, the random probability of this Target Area being correct is 64.1%. So the true probability of this Target Area being correct is 34.9% better than random.
* A Cycle degree trader (hold positions from quarters to years), would currently be trading long in this market. The probability of this Target Area being correct is 82.0%. However, the random probability of this Target Area being correct is 65.0%. So the true probability of this Target Area being correct is 26.2% better than random.
Extensive Elliott Commentary for Guggenheim CurrencyShares Japanese Yen Trust (FXY) Daily on 12-Feb-2016 with three incomplete patterns:
Wave (C) of the Intermediate degree inverted Zigzag with a rating of 103.1 is expected to complete in the price range 82.97 to 98.39, but more probably between 83.16 and 88.8. This wave is due to complete anytime from now until 11-Apr-2016, but is most likely to complete before 04-Mar-2016.
This wave (C) will complete the ZigZag pattern.
This is the final wave in the pattern. When complete it will also complete wave Y of the Primary degree inverted Double 3 with a rating of 95.7. These two waves have the same target ranges.
Wave Y will probably complete this Double Sideways pattern, although it could possibly extend into a Triple Sideways pattern.
This is the final wave in the pattern. When complete it will also complete wave x of the Cycle degree Double Zigzag with a rating of 90.4. These two waves have the same target ranges.
After wave x is complete, expect the market to continue down into wave y, which should be a three wave Zigzag pattern. Expect wave y to retrace wave x by 117% - 263%. Wave y can also be expected to be 90% - 263% of the price length of wave w. The expected time for wave y to complete is 21% - 161% of the time taken for wave x to complete and 27% - 154% of the time taken for wave w to complete.
Current Analysis Settings: Analysis Date Range: 19-Dec-2013 to 12-Feb-2016, Label Range: 15 - 50, Preferred Count Labels: 16, Min Rating: 75, Stocks toggle ON, Bias Towards Beginning of Data: 8, Bias Towards Major High/Low: 8, Largest Degree Wave Filter: Any Pattern
Rating:90.8
Current Trading Positions for Guggenheim Enhanced Short Duration ETF (GSY) Daily on 12-Feb-2016
* An Intermediate degree trader (hold positions from months to quarters), would currently be shorting this market. The probability of this Target Area being correct is 41.6%. However, the random probability of this Target Area being correct is 24.3%. So the true probability of this Target Area being correct is 71.2% better than random.
* A Primary degree trader (hold positions from months to years), would currently be shorting this market. The probability of this Target Area being correct is 44.0%. However, the random probability of this Target Area being correct is 34.0%. So the true probability of this Target Area being correct is 29.4% better than random.
Extensive Elliott Commentary for Guggenheim Enhanced Short Duration ETF (GSY) Daily on 12-Feb-2016 with two incomplete patterns:
Wave (Y) of the Intermediate degree Double Zigzag with a rating of 98.5 is expected to complete in the price range 49.48 to 49.81, but more probably between 49.67 and 49.8. This wave was expected to complete before 11-Feb-2016, and must complete by 12-Feb-2016.
Wave (Y) will probably complete this Double Sharp pattern, although it could possibly extend into a Triple Sharp pattern.
This is the final wave in the pattern. When complete it will also complete wave B of the Primary degree inverted Flat with a rating of 90.8. These two waves have the same target ranges.
After wave B is complete, expect the market to continue up into wave C, which should be a five wave Impulsive pattern. Expect wave C to retrace wave B by 80% - 169%. Wave C can also be expected to be 99% - 169% of the price length of wave A. The expected time for wave C to complete is 19% - 187% of the time taken for wave B to complete and 56% - 268% of the time taken for wave A to complete.
Current Analysis Settings: Analysis Date Range: 19-May-2014 to 12-Feb-2016, Label Range: 15 - 50, Preferred Count Labels: 23, Min Rating: 75, Stocks toggle ON, Bias Towards Beginning of Data: 8, Bias Towards Major High/Low: 8, Largest Degree Wave Filter: Any Pattern
Rating:87.9
Current Trading Positions for Guggenheim Multi-Asset Income ETF (CVY) Daily on 12-Feb-2016
* A Primary degree trader (hold positions from months to years), would currently be shorting this market. The probability of this Target Area being correct is 50.2%. However, the random probability of this Target Area being correct is 34.0%. So the true probability of this Target Area being correct is 47.6% better than random.
* A Cycle degree trader (hold positions from quarters to years), would currently be trading long in this market. The probability of this Target Area being correct is 87.4%. However, the random probability of this Target Area being correct is 80.4%. So the true probability of this Target Area being correct is 8.7% better than random.
Extensive Elliott Commentary for Guggenheim Multi-Asset Income ETF (CVY) Daily on 12-Feb-2016 with two incomplete patterns:
Wave B of the Primary degree inverted Flat with a rating of 102.2 is expected to complete in the price range 10.37 to 16.48, but more probably between 15.53 and 16.44. This wave is due to complete anytime from now until 19-Apr-2016, but is most likely to complete before 18-Feb-2016.
After wave B is complete, expect the market to continue up into wave C, which should be a five wave Impulsive pattern. Expect wave C to retrace wave B by 80% - 169%. Wave C can also be expected to be 99% - 169% of the price length of wave A. The expected time for wave C to complete is 19% - 187% of the time taken for wave B to complete and 56% - 268% of the time taken for wave A to complete.
Wave IV of the Cycle degree inverted Ending Diagonal with a rating of 87.9 is expected to complete in the price range 17.5 to 19.73, but more probably between 17.56 and 18.99. This wave is due to complete anytime from now until 03-Aug-2016, but is most likely to complete before 16-Mar-2016.
Expect this wave IV to complete in the price range of wave 2, and then continue down to the end of wave V, which should be a ZigZag family three wave pattern. Expect wave V to have between 52% and 91% of the price range of wave III and complete in 18% to 62% of the time taken by wave
III. Expect also that wave V will have between 31% and 72% of the price range of wave I and complete in 3% to 22% of the time taken by wave I. The slope (ie. price range divided by time taken) of wave V should be between 49% and 173% of the slope of wave III and between 77% to 312% of the slope of wave I. Wave V will complete this Ending Diagonal pattern.
Current Analysis Settings: Analysis Date Range: 12-May-2014 to 12-Feb-2016, Label Range: 15 - 50, Preferred Count Labels: 15, Min Rating: 75, Stocks toggle ON, Bias Towards Beginning of Data: 8, Bias Towards Major High/Low: 8, Largest Degree Wave Filter: Any Pattern
Rating:100.4
Current Trading Positions for Guggenheim S&P 500 Equal Weight ETF (RSP) Daily on 12-Feb-2016
* A Primary degree trader (hold positions from months to years), would currently be trading long in this market. The probability of this Target Area being correct is 50.0%. However, the random probability of this Target Area being correct is 34.0%. So the true probability of this Target Area being correct is 47.1% better than random.
Extensive Elliott Commentary for Guggenheim S&P 500 Equal Weight ETF (RSP) Daily on 12-Feb-2016 with one incomplete pattern:
Wave B of the Primary degree Flat with a rating of 100.4 is expected to complete in the price range 76.06 to 101.06, but more probably between 76.32 and 82.86. This wave is most likely to complete sometime between 22-Feb-2016 and 06-May-2016 Note that it cannot complete until 15-Feb-2016 but must complete by 28-Sep-2017.
After wave B is complete, expect the market to continue down into wave C, which should be a five wave Impulsive pattern. Expect wave C to retrace wave B by 86% - 162%. Wave C can also be expected to be 90% - 162% of the price length of wave A. The expected time for wave C to complete is 19% - 134% of the time taken for wave B to complete and 24% - 115% of the time taken for wave A to complete.
Current Analysis Settings: Analysis Date Range: 09-Apr-2015 to 12-Feb-2016, Label Range: 15 - 50, Preferred Count Labels: 20, Min Rating: 75, Stocks toggle ON, Bias Towards Beginning of Data: 8, Bias Towards Major High/Low: 8, Largest Degree Wave Filter: Any Pattern
Rating:92.1
Current Trading Positions for Guggenheim S&P 500 Equal Wt Tech Etf (RYT) Daily on 12-Feb-2016
* A Primary degree trader (hold positions from months to years), would currently be shorting this market. The probability of this Target Area being correct is 65.3%. However, the random probability of this Target Area being correct is 45.0%. So the true probability of this Target Area being correct is 45.1% better than random.
* A Cycle degree trader (hold positions from quarters to years), would currently be shorting this market. The probability of this Target Area being correct is 45.2%. However, the random probability of this Target Area being correct is 34.0%. So the true probability of this Target Area being correct is 32.9% better than random.
Extensive Elliott Commentary for Guggenheim S&P 500 Equal Wt Tech Etf (RYT) Daily on 12-Feb-2016 with two incomplete patterns:
Wave C of the Primary degree Zigzag with a rating of 104.3 is expected to complete in the price range 55.41 to 81.14, but more probably between 72.18 and 80.7. This wave is due to complete anytime from now until 18-Apr-2016, but is most likely to complete before 29-Feb-2016.
This wave C will complete the ZigZag pattern.
This is the final wave in the pattern. When complete it will also complete wave b of the Cycle degree inverted Flat with a rating of 92.1. These two waves have the same target ranges.
After wave b is complete, expect the market to continue up into wave c, which should be a five wave Impulsive pattern. Expect wave c to retrace wave b by 82% - 179%. Wave c can also be expected to be 67% - 179% of the price length of wave a. The expected time for wave c to complete is 20% - 151% of the time taken for wave b to complete and 11% - 58% of the time taken for wave a to complete.
Current Analysis Settings: Analysis Date Range: 06-Dec-2013 to 12-Feb-2016, Label Range: 15 - 50, Preferred Count Labels: 17, Min Rating: 75, Stocks toggle ON, Bias Towards Beginning of Data: 8, Bias Towards Major High/Low: 8, Largest Degree Wave Filter: Any Pattern
Rating:78.9
Current Trading Positions for Guggenheim S&P 500 Pure Growth ETF (RPG) Daily on 12-Feb-2016
* A Primary degree trader (hold positions from months to years), would currently be trading long in this market. The probability of this Target Area being correct is 40.4%. However, the random probability of this Target Area being correct is 34.0%. So the true probability of this Target Area being correct is 18.8% better than random.
Extensive Elliott Commentary for Guggenheim S&P 500 Pure Growth ETF (RPG) Daily on 12-Feb-2016 with two incomplete patterns:
Wave (C) of the Intermediate degree inverted Flat with a rating of 100.4 is expected to complete in the price range 70.55 to 82.21, but more probably between 73 and 78.9. This wave is due to complete anytime from now until 25-Mar-2016, but is most likely to complete before 23-Feb-2016.
This wave (C) will complete the Flat pattern.
This is the final wave in the pattern. When complete it will also complete wave B of the Primary degree Flat with a rating of 78.9. These two waves have the same target ranges.
After wave B is complete, expect the market to continue down into wave C, which should be a five wave Impulsive pattern. Expect wave C to retrace wave B by 86% - 162%. Wave C can also be expected to be 90% - 162% of the price length of wave A. The expected time for wave C to complete is 19% - 134% of the time taken for wave B to complete and 24% - 115% of the time taken for wave A to complete.
Current Analysis Settings: Analysis Date Range: 06-Feb-2015 to 12-Feb-2016, Label Range: 15 - 50, Preferred Count Labels: 19, Min Rating: 75, Stocks toggle ON, Bias Towards Beginning of Data: 8, Bias Towards Major High/Low: 8, Largest Degree Wave Filter: Any Pattern
Rating:84.2
Current Trading Positions for Guggenheim S&P 500 Pure Value ETF (RPV) Daily on 12-Feb-2016
* An Intermediate degree trader (hold positions from months to quarters), would currently be trading long in this market. The probability of this Target Area being correct is 42.2%. However, the random probability of this Target Area being correct is 24.3%. So the true probability of this Target Area being correct is 73.7% better than random.
* A Primary degree trader (hold positions from months to years), would currently be trading long in this market. The probability of this Target Area being correct is 42.2%. However, the random probability of this Target Area being correct is 34.0%. So the true probability of this Target Area being correct is 24.1% better than random.
Extensive Elliott Commentary for Guggenheim S&P 500 Pure Value ETF (RPV) Daily on 12-Feb-2016 with two incomplete patterns:
Wave (Y) of the Intermediate degree inverted Double Zigzag with a rating of 101.1 is expected to complete in the price range 45.85 to 59.1, but more probably between 46.4 and 51.16. This wave is most likely to complete sometime between 12-Feb-2016 and 25-Feb-2016 Note that it cannot complete until 12-Feb-2016 but must complete by 21-Mar-2016.
Wave (Y) will probably complete this Double Sharp pattern, although it could possibly extend into a Triple Sharp pattern.
This is the final wave in the pattern. When complete it will also complete wave B of the Primary degree Flat with a rating of 84.2. These two waves have the same target ranges.
After wave B is complete, expect the market to continue down into wave C, which should be a five wave Impulsive pattern. Expect wave C to retrace wave B by 86% - 162%. Wave C can also be expected to be 90% - 162% of the price length of wave A. The expected time for wave C to complete is 19% - 134% of the time taken for wave B to complete and 24% - 115% of the time taken for wave A to complete.
Current Analysis Settings: Analysis Date Range: 24-Mar-2015 to 12-Feb-2016, Label Range: 15 - 50, Preferred Count Labels: 25, Min Rating: 75, Stocks toggle ON, Bias Towards Beginning of Data: 8, Bias Towards Major High/Low: 8, Largest Degree Wave Filter: Any Pattern
Rating:77.1
Current Trading Positions for Guggenheim Solar ETF (TAN) Daily on 12-Feb-2016
* An Intermediate degree trader (hold positions from months to quarters), would currently be shorting this market. The probability of this Target Area being correct is 52.0%. However, the random probability of this Target Area being correct is 13.0%. So the true probability of this Target Area being correct is 300.0% better than random.
* A Primary degree trader (hold positions from months to years), would currently be shorting this market. The probability of this Target Area being correct is 14.0%. However, the random probability of this Target Area being correct is 13.0%. So the true probability of this Target Area being correct is 7.7% better than random.
Extensive Elliott Commentary for Guggenheim Solar ETF (TAN) Daily on 12-Feb-2016 with three incomplete patterns:
Wave (3) of the Intermediate degree inverted Impulse with a rating of 98.2 is expected to complete at a price no higher than 20.16, but more probably between 7.6 and 17.4. This wave is due to complete anytime from now until 12-Apr-2016, but is most likely to complete before 24-Feb-2016.
When complete, expect the overall slope (ie. price range divided by time taken) of this wave (3) to be between 47% to 194% of the slope of wave (1). Then expect the market to pull back into wave (4), which will be corrective in nature and has a probability of 0% of being a Flat or other sideways pattern. Wave (4) should not retrace back into the price range of wave (1) or (2). Expect wave (4) to have between 5% - 140% of the price range of wave (2). The expected time for wave (4) to complete is between 16% - 136% of wave (2). After wave (4), expect wave (5) to move beyond the end of wave (3) to complete this Impulse.
Wave 3 of the Primary degree inverted Impulse with a rating of 81.8 is expected to complete at a price no higher than 21.84, but more probably no higher than 16.33. This wave is due to complete anytime from now until 14-Apr-2017, but is most likely to complete before 07-Jun-2016.
When complete, expect the overall slope (ie. price range divided by time taken) of this wave 3 to be between 47% to 194% of the slope of wave 1. Then expect the market to pull back into wave 4, which will be corrective in nature and has a probability of 0% of being a Flat or other sideways pattern. Wave 4 should not retrace back into the price range of wave 1 or 2. Expect wave 4 to have between 5% - 140% of the price range of wave 2. The expected time for wave 4 to complete is between 15% - 136% of wave 2. After wave 4, expect wave 5 to move beyond the end of wave 3 to complete this Impulse.
Wave c of the Cycle degree Flat with a rating of 77.1 is expected to complete in the price range 2.41 to 43.05, but more probably between 17.67 and 33.56. This wave was expected to complete before 15-Dec-2015, and must complete by 16-Jan-2017.
This wave c will complete the Flat pattern.
Current Analysis Settings: Analysis Date Range: 24-Jan-2014 to 12-Feb-2016, Label Range: 15 - 50, Preferred Count Labels: 26, Min Rating: 75, Stocks toggle ON, Bias Towards Beginning of Data: 8, Bias Towards Major High/Low: 8, Largest Degree Wave Filter: Any Pattern
Rating:81.9
Current Trading Positions for Hercules Technology Growth Capital Inc (HTGC) Daily on 12-Feb-2016
* A Primary degree trader (hold positions from months to years), would currently be shorting this market. The probability of this Target Area being correct is 65.7%. However, the random probability of this Target Area being correct is 45.0%. So the true probability of this Target Area being correct is 46.0% better than random.
* A Cycle degree trader (hold positions from quarters to years), would currently be shorting this market. The probability of this Target Area being correct is 35.5%. However, the random probability of this Target Area being correct is 24.3%. So the true probability of this Target Area being correct is 46.1% better than random.
Extensive Elliott Commentary for Hercules Technology Growth Capital Inc (HTGC) Daily on 12-Feb-2016 with two incomplete patterns:
Wave C of the Primary degree Zigzag with a rating of 106.3 is expected to complete in the price range 5.56 to 10.17, but more probably between 8.09 and 9.9. This wave is due to complete anytime from now until 11-Apr-2016, but is most likely to complete before 26-Feb-2016.
This wave C will complete the ZigZag pattern.
This is the final wave in the pattern. When complete it will also complete wave y of the Cycle degree Double Zigzag with a rating of 81.9. These two waves have the same target ranges.
Wave y will probably complete this Double Sharp pattern, although it could possibly extend into a Triple Sharp pattern.
Current Analysis Settings: Analysis Date Range: 17-Jun-2014 to 12-Feb-2016, Label Range: 15 - 50, Preferred Count Labels: 16, Min Rating: 75, Stocks toggle ON, Bias Towards Beginning of Data: 8, Bias Towards Major High/Low: 8, Largest Degree Wave Filter: Any Pattern
Rating:87.2
Current Trading Positions for Highland iBoxx Senior Loan ETF (SNLN) Daily on 12-Feb-2016
* A Primary degree trader (hold positions from months to years), would currently be shorting this market. The probability of this Target Area being correct is 43.1%. However, the random probability of this Target Area being correct is 34.0%. So the true probability of this Target Area being correct is 26.8% better than random.
Extensive Elliott Commentary for Highland iBoxx Senior Loan ETF (SNLN) Daily on 12-Feb-2016 with two incomplete patterns:
Wave (C) of the Intermediate degree Flat with a rating of 99.3 is expected to complete in the price range 17.22 to 17.81, but more probably between 17.36 and 17.63. This wave is due to complete anytime from now until 15-Mar-2016, but is most likely to complete before 19-Feb-2016.
This wave (C) will complete the Flat pattern.
This is the final wave in the pattern. When complete it will also complete wave B of the Primary degree inverted Flat with a rating of 87.2. These two waves have the same target ranges.
After wave B is complete, expect the market to continue up into wave C, which should be a five wave Impulsive pattern. Expect wave C to retrace wave B by 80% - 169%. Wave C can also be expected to be 99% - 169% of the price length of wave A. The expected time for wave C to complete is 19% - 187% of the time taken for wave B to complete and 56% - 268% of the time taken for wave A to complete.
Current Analysis Settings: Analysis Date Range: 06-Dec-2013 to 12-Feb-2016, Label Range: 15 - 50, Preferred Count Labels: 17, Min Rating: 75, Stocks toggle ON, Bias Towards Beginning of Data: 8, Bias Towards Major High/Low: 8, Largest Degree Wave Filter: Any Pattern
Rating:228.5
Current Trading Positions for iPath Dow Jones-UBS Coffee Total Return Sub-Index ETN (JO) Daily on 12-Feb-2016
* A Primary degree trader (hold positions from months to years), would currently be shorting this market. The probability of this Target Area being correct is 78.1%. However, the random probability of this Target Area being correct is 64.0%. So the true probability of this Target Area being correct is 22.0% better than random.
Extensive Elliott Commentary for iPath Dow Jones-UBS Coffee Total Return Sub-Index ETN (JO) Daily on 12-Feb-2016 with one incomplete pattern:
Wave D of the Primary degree inverted Contracting Triangle with a rating of 228.5 is expected to complete in the price range 17.19 to 18.31, but more probably between 17.53 and 18.08. This wave is due to complete anytime from now until 15-Mar-2016, but is most likely to complete before 16-Feb-2016.
Once this wave D is complete, expect the market to continue up to the end of wave E, which will most probably be a ZigZag family pattern or possibly a Contracting Triangle. Expect wave E to have between 39% and 66% of the price range of wave C and complete in 4% to 60% of the time taken by wave C. Expect also that wave E will have between 21% and 47% of the price range of wave A and complete in 2% to 24% of the time taken by wave A. The slope (ie. price range divided by time taken) of wave E should be between 28% and 143% of the slope of wave C and between 19% to 183% of the slope of wave A. Wave E will complete this Contracting Triangle.
Current Analysis Settings: Analysis Date Range: 13-Mar-2014 to 12-Feb-2016, Label Range: 15 - 50, Preferred Count Labels: 46, Min Rating: 75, Stocks toggle ON, Bias Towards Beginning of Data: 8, Bias Towards Major High/Low: 8, Largest Degree Wave Filter: Any Pattern
Rating:102.1
Current Trading Positions for iPath Dow Jones-UBS Commodity Index Total Return ETN (DJP) Daily on 12-Feb-2016
* An Intermediate degree trader (hold positions from months to quarters), would currently be shorting this market. The probability of this Target Area being correct is 50.2%. However, the random probability of this Target Area being correct is 34.0%. So the true probability of this Target Area being correct is 47.6% better than random.
Extensive Elliott Commentary for iPath Dow Jones-UBS Commodity Index Total Return ETN (DJP) Daily on 12-Feb-2016 with one incomplete pattern:
Wave (B) of the Intermediate degree inverted Flat with a rating of 102.1 is expected to complete in the price range 14.27 to 19.99, but more probably between 19.1 and 19.96. This wave is due to complete anytime from now until 20-May-2016, but is most likely to complete before 26-Feb-2016.
After wave (B) is complete, expect the market to continue up into wave (C), which should be a five wave Impulsive pattern. Expect wave (C) to retrace wave (B) by 80% - 169%. Wave (C) can also be expected to be 99% - 169% of the price length of wave (A). The expected time for wave (C) to complete is 19% - 187% of the time taken for wave (B) to complete and 56% - 268% of the time taken for wave (A) to complete.
Current Analysis Settings: Analysis Date Range: 18-Mar-2014 to 12-Feb-2016, Label Range: 15 - 50, Preferred Count Labels: 20, Min Rating: 75, Stocks toggle ON, Bias Towards Beginning of Data: 8, Bias Towards Major High/Low: 8, Largest Degree Wave Filter: Any Pattern
Rating:75.4
Current Trading Positions for iPath S&P 500 VIX Mid-Term Futures (VXZ) Daily on 12-Feb-2016
* A Minor degree trader (hold positions from weeks to quarters), would currently be trading long in this market. The probability of this Target Area being correct is 50.2%. However, the random probability of this Target Area being correct is 34.0%. So the true probability of this Target Area being correct is 47.6% better than random.
* An Intermediate degree trader (hold positions from months to quarters), would currently be shorting this market. The probability of this Target Area being correct is 86.2%. However, the random probability of this Target Area being correct is 64.1%. So the true probability of this Target Area being correct is 34.5% better than random.
* A Primary degree trader (hold positions from months to years), would currently be shorting this market. The probability of this Target Area being correct is 39.8%. However, the random probability of this Target Area being correct is 34.0%. So the true probability of this Target Area being correct is 17.1% better than random.
* A Cycle degree trader (hold positions from quarters to years), would currently be trading long in this market. The probability of this Target Area being correct is 76.0%. However, the random probability of this Target Area being correct is 65.0%. So the true probability of this Target Area being correct is 16.9% better than random.
Extensive Elliott Commentary for iPath S&P 500 VIX Mid-Term Futures (VXZ) Daily on 12-Feb-2016 with four incomplete patterns:
Wave B of the Minor degree Flat with a rating of 102.5 is expected to complete in the price range 13.2 to 19.82, but more probably between 13.23 and 14.49. This wave is due to complete anytime from now until 21-Apr-2016, but is most likely to complete before 24-Feb-2016.
After wave B is complete, expect the market to continue down into wave C, which should be a five wave Impulsive pattern. Expect wave C to retrace wave B by 89% - 167%. Wave C can also be expected to be 104% - 167% of the price length of wave A. The expected time for wave C to complete is 20% - 146% of the time taken for wave B to complete and 53% - 275% of the time taken for wave A to complete.
Wave (Y) of the Intermediate degree Double 3 with a rating of 92.2 is expected to complete in the price range .28 to 13.39, but more probably between 8.16 and 11.26. This wave is due to complete anytime from now until 23-May-2016, but is most likely to complete before 08-Apr-2016.
Wave (Y) will probably complete this Double Sideways pattern, although it could possibly extend into a Triple Sideways pattern.
This is the final wave in the pattern. When complete it will also complete wave B of the Primary degree inverted Flat with a rating of 77. These two waves have the same target ranges.
After wave B is complete, expect the market to continue up into wave C, which should be a five wave Impulsive pattern. Expect wave C to retrace wave B by 82% - 177%. Wave C can also be expected to be 89% - 177% of the price length of wave A. The expected time for wave C to complete is 15% - 160% of the time taken for wave B to complete and 16% - 118% of the time taken for wave A to complete.
Wave x of the Cycle degree Double Zigzag with a rating of 75.4 is expected to complete in the price range 11.39 to 17.36, but more probably between 13.06 and 16.19. This wave is due to complete anytime from now until 06-Nov-2020, but is most likely to complete before 02-Mar-2017.
After wave x is complete, expect the market to continue down into wave y, which should be a three wave Zigzag pattern. Expect wave y to retrace wave x by 116% - 261%. Wave y can also be expected to be 90% - 261% of the price length of wave w. The expected time for wave y to complete is 21% - 160% of the time taken for wave x to complete and 25% - 152% of the time taken for wave w to complete.
Current Analysis Settings: Analysis Date Range: 23-Dec-2013 to 12-Feb-2016, Label Range: 15 - 50, Preferred Count Labels: 35, Min Rating: 75, Stocks toggle ON, Bias Towards Beginning of Data: 8, Bias Towards Major High/Low: 8, Largest Degree Wave Filter: Any Pattern
Rating:88.3
Current Trading Positions for iPath S&P 500 VIX Short-Term Futures (VXX) Daily on 12-Feb-2016
* A Cycle degree trader (hold positions from quarters to years), would currently be trading long in this market. The probability of this Target Area being correct is 81.2%. However, the random probability of this Target Area being correct is 65.0%. So the true probability of this Target Area being correct is 24.9% better than random.
Extensive Elliott Commentary for iPath S&P 500 VIX Short-Term Futures (VXX) Daily on 12-Feb-2016 with two incomplete patterns:
Wave C of the Primary degree inverted Flat with a rating of 98.1 is expected to complete in the price range 21.08 to 55.14, but more probably between 29.87 and 43.5. This wave was expected to complete before 02-Feb-2016, and must complete by 21-Dec-2016.
This wave C will complete the Flat pattern.
This is the final wave in the pattern. When complete it will also complete wave x of the Cycle degree Double Zigzag with a rating of 88.3. These two waves have the same target ranges.
After wave x is complete, expect the market to continue down into wave y, which should be a three wave Zigzag pattern. Expect wave y to retrace wave x by 116% - 261%. Wave y can also be expected to be 90% - 261% of the price length of wave w. The expected time for wave y to complete is 21% - 160% of the time taken for wave x to complete and 25% - 152% of the time taken for wave w to complete.
Current Analysis Settings: Analysis Date Range: 23-Dec-2013 to 12-Feb-2016, Label Range: 15 - 50, Preferred Count Labels: 17, Min Rating: 75, Stocks toggle ON, Bias Towards Beginning of Data: 8, Bias Towards Major High/Low: 8, Largest Degree Wave Filter: Any Pattern
Rating:83.8
Current Trading Positions for iPath S&P Goldman Sachs Crude Oil TR Idx ETN (OIL) Daily on 12-Feb-2016
* A Primary degree trader (hold positions from months to years), would currently be shorting this market. The probability of this Target Area being correct is 50.3%. However, the random probability of this Target Area being correct is 34.0%. So the true probability of this Target Area being correct is 47.9% better than random.
* A Cycle degree trader (hold positions from quarters to years), would currently be trading long in this market. The probability of this Target Area being correct is 79.2%. However, the random probability of this Target Area being correct is 65.0%. So the true probability of this Target Area being correct is 21.8% better than random.
Extensive Elliott Commentary for iPath S&P Goldman Sachs Crude Oil TR Idx ETN (OIL) Daily on 12-Feb-2016 with two incomplete patterns:
Wave B of the Primary degree inverted Flat with a rating of 103.2 is expected to complete in the price range 1.94 to 4.71, but more probably between 4.28 and 4.69. This wave is due to complete anytime from now until 11-May-2016, but is most likely to complete before 25-Feb-2016.
After wave B is complete, expect the market to continue up into wave C, which should be a five wave Impulsive pattern. Expect wave C to retrace wave B by 80% - 169%. Wave C can also be expected to be 99% - 169% of the price length of wave A. The expected time for wave C to complete is 19% - 187% of the time taken for wave B to complete and 56% - 268% of the time taken for wave A to complete.
Wave x of the Cycle degree Double Zigzag with a rating of 83.8 is expected to complete in the price range 6.03 to 13.17, but more probably between 8.03 and 11.69. This wave could complete anytime between now and 20-Jun-2018, but is most likely to complete sometime between 04-Mar-2016 and 23-Sep-2016.
After wave x is complete, expect the market to continue down into wave y, which should be a three wave Zigzag pattern. Expect wave y to retrace wave x by 117% - 263%. Wave y can also be expected to be 90% - 263% of the price length of wave w. The expected time for wave y to complete is 21% - 161% of the time taken for wave x to complete and 27% - 154% of the time taken for wave w to complete.
Current Analysis Settings: Analysis Date Range: 09-May-2014 to 12-Feb-2016, Label Range: 15 - 50, Preferred Count Labels: 21, Min Rating: 75, Stocks toggle ON, Bias Towards Beginning of Data: 8, Bias Towards Major High/Low: 8, Largest Degree Wave Filter: Any Pattern
Rating:91
Current Trading Positions for iPath S&P GSCI Total Return Index ETN (GSP) Daily on 12-Feb-2016
* A Minor degree trader (hold positions from weeks to quarters), would currently be shorting this market. The probability of this Target Area being correct is 87.6%. However, the random probability of this Target Area being correct is 64.1%. So the true probability of this Target Area being correct is 36.7% better than random.
* An Intermediate degree trader (hold positions from months to quarters), would currently be shorting this market. The probability of this Target Area being correct is 82.6%. However, the random probability of this Target Area being correct is 65.0%. So the true probability of this Target Area being correct is 27.1% better than random.
Extensive Elliott Commentary for iPath S&P GSCI Total Return Index ETN (GSP) Daily on 12-Feb-2016 with two incomplete patterns:
Wave Y of the Minor degree Double 3 with a rating of 106.6 is expected to complete in the price range 8.55 to 12.06, but more probably between 10.57 and 11.42. This wave was expected to complete before 10-Feb-2016, and must complete by 15-Feb-2016.
Wave Y will probably complete this Double Sideways pattern, although it could possibly extend into a Triple Sideways pattern.
This is the final wave in the pattern. When complete it will also complete wave (X) of the Intermediate degree inverted Double Zigzag with a rating of 91. These two waves have the same target ranges.
After wave (X) is complete, expect the market to continue up into wave (Y), which should be a three wave Zigzag pattern. Expect wave (Y) to retrace wave (X) by 128% - 319%. Wave (Y) can also be expected to be 90% - 319% of the price length of wave (W). The expected time for wave (Y) to complete is 23% - 167% of the time taken for wave (X) to complete and 47% - 204% of the time taken for wave (W) to complete.
Current Analysis Settings: Analysis Date Range: 24-Feb-2014 to 12-Feb-2016, Label Range: 15 - 50, Preferred Count Labels: 18, Min Rating: 75, Stocks toggle ON, Bias Towards Beginning of Data: 8, Bias Towards Major High/Low: 8, Largest Degree Wave Filter: Any Pattern
Rating:104.6
Current Trading Positions for IQ Hedge Multi-Strategy Tracker ETF (QAI) Daily on 12-Feb-2016
* An Intermediate degree trader (hold positions from months to quarters), would currently be shorting this market. The probability of this Target Area being correct is 68.0%. However, the random probability of this Target Area being correct is 53.0%. So the true probability of this Target Area being correct is 28.3% better than random.
Extensive Elliott Commentary for IQ Hedge Multi-Strategy Tracker ETF (QAI) Daily on 12-Feb-2016 with one incomplete pattern:
Wave (X) of the Intermediate degree inverted Double 3 with a rating of 104.6 is expected to complete in the price range 25.76 to 28.06, but more probably between 27.7 and 27.9. This wave is most likely to complete sometime between 15-Feb-2016 and 03-Mar-2016 Note that it cannot complete until 15-Feb-2016 but must complete by 15-Jun-2016.
After wave (X) is complete, expect the market to continue up into wave (Y), which will probably be a three wave corrective pattern. Expect wave (Y) to retrace wave (X) by 98% - 212%. Wave (Y) can also be expected to be 73% - 212% of the price length of wave (W). The expected time for wave (Y) to complete is 27% - 214% of the time taken for wave (X) to complete and 38% - 222% of the time taken for wave (W) to complete.
Current Analysis Settings: Analysis Date Range: 18-Feb-2015 to 12-Feb-2016, Label Range: 15 - 50, Preferred Count Labels: 39, Min Rating: 75, Stocks toggle ON, Bias Towards Beginning of Data: 8, Bias Towards Major High/Low: 8, Largest Degree Wave Filter: Any Pattern
Rating:101.3
Current Trading Positions for iShares 10+ Year Credit Bond Fund (CLY) Daily on 12-Feb-2016
* A Cycle degree trader (hold positions from quarters to years), would currently be shorting this market. The probability of this Target Area being correct is 42.2%. However, the random probability of this Target Area being correct is 24.3%. So the true probability of this Target Area being correct is 73.7% better than random.
Extensive Elliott Commentary for iShares 10+ Year Credit Bond Fund (CLY) Daily on 12-Feb-2016 with one incomplete pattern:
Wave y of the Cycle degree Double Zigzag with a rating of 101.3 is expected to complete in the price range 48.91 to 50.86, but more probably between 49.89 and 50.73. This wave is due to complete anytime from now until 20-Jan-2017, but is most likely to complete before 25-Apr-2016.
Wave y will probably complete this Double Sharp pattern, although it could possibly extend into a Triple Sharp pattern.
Current Analysis Settings: Analysis Date Range: 06-Dec-2013 to 12-Feb-2016, Label Range: 15 - 50, Preferred Count Labels: 15, Min Rating: 75, Stocks toggle ON, Bias Towards Beginning of Data: 8, Bias Towards Major High/Low: 8, Largest Degree Wave Filter: Any Pattern
Rating:84.4
Current Trading Positions for iShares Barclays 1-3 Year Credit Bond Fund (CSJ) Daily on 12-Feb-2016
* An Intermediate degree trader (hold positions from months to quarters), would currently be trading long in this market. The probability of this Target Area being correct is 70.5%. However, the random probability of this Target Area being correct is 45.0%. So the true probability of this Target Area being correct is 56.7% better than random.
* A Primary degree trader (hold positions from months to years), would currently be shorting this market. The probability of this Target Area being correct is 50.6%. However, the random probability of this Target Area being correct is 45.0%. So the true probability of this Target Area being correct is 12.4% better than random.
* A Cycle degree trader (hold positions from quarters to years), would currently be shorting this market. The probability of this Target Area being correct is 37.0%. However, the random probability of this Target Area being correct is 24.3%. So the true probability of this Target Area being correct is 52.3% better than random.
Extensive Elliott Commentary for iShares Barclays 1-3 Year Credit Bond Fund (CSJ) Daily on 12-Feb-2016 with three incomplete patterns:
Wave (2) of the Intermediate degree inverted Impulse with a rating of 94.4 is expected to complete in the price range 104.58 to 104.91, but more probably between 104.66 and 104.78. This wave was expected to complete before 28-Jan-2016, and must complete by 15-Feb-2016.
After this wave (2) is complete, expect the market to continue down into wave (3). Wave (3) should always be an Impulse and should retrace wave (2) completely. Expect wave (3) to retrace wave (2) by 236% - 406%. Wave (3) can also be expected to be 100% - 406% of the price length of wave (1). The expected time for wave (3) to complete is 43% - 383% of the time taken for wave (2) to complete and 45% - 197% of the time taken for wave (1) to complete. The slope (ie. price range divided by time taken) of wave (3) should be between 39% and 179% of the slope of wave (1). Once wave (3) is complete, expect wave (4) to be a sideways corrective movement, then wave (5) to continue in the same direction as wave (3). Wave (5) will complete this Impulse.
Wave C of the Primary degree Zigzag with a rating of 86.4 is expected to complete in the price range 102.27 to 104.47, but more probably between 103.82 and 104.43. This wave is due to complete anytime from now until 19-Aug-2016, but is most likely to complete before 09-Mar-2016.
This wave C will complete the ZigZag pattern.
This is the final wave in the pattern. When complete it will also complete wave y of the Cycle degree Double Zigzag with a rating of 84.4. These two waves have the same target ranges.
Wave y will probably complete this Double Sharp pattern, although it could possibly extend into a Triple Sharp pattern.
Current Analysis Settings: Analysis Date Range: 04-Sep-2014 to 12-Feb-2016, Label Range: 15 - 50, Preferred Count Labels: 22, Min Rating: 75, Stocks toggle ON, Bias Towards Beginning of Data: 8, Bias Towards Major High/Low: 8, Largest Degree Wave Filter: Any Pattern
Rating:82.7
Current Trading Positions for iShares Barclays 1-3 Year Treasury Bond Fund (SHY) Daily on 12-Feb-2016
* A Primary degree trader (hold positions from months to years), would currently be trading long in this market. The probability of this Target Area being correct is 86.9%. However, the random probability of this Target Area being correct is 64.1%. So the true probability of this Target Area being correct is 35.6% better than random.
* A Cycle degree trader (hold positions from quarters to years), would currently be trading long in this market. The probability of this Target Area being correct is 41.6%. However, the random probability of this Target Area being correct is 34.0%. So the true probability of this Target Area being correct is 22.4% better than random.
Extensive Elliott Commentary for iShares Barclays 1-3 Year Treasury Bond Fund (SHY) Daily on 12-Feb-2016 with two incomplete patterns:
Wave Y of the Primary degree inverted Double 3 with a rating of 99.4 is expected to complete in the price range 84.36 to 87.4, but more probably between 84.86 and 85.73. This wave is due to complete anytime from now until 25-Nov-2016, but is most likely to complete before 01-Aug-2016.
Wave Y will probably complete this Double Sideways pattern, although it could possibly extend into a Triple Sideways pattern.
This is the final wave in the pattern. When complete it will also complete wave b of the Cycle degree Flat with a rating of 82.7. These two waves have the same target ranges.
After wave b is complete, expect the market to continue down into wave c, which should be a five wave Impulsive pattern. Expect wave c to retrace wave b by 86% - 162%. Wave c can also be expected to be 90% - 162% of the price length of wave a. The expected time for wave c to complete is 19% - 134% of the time taken for wave b to complete and 24% - 115% of the time taken for wave a to complete.
Current Analysis Settings: Analysis Date Range: 02-Sep-2014 to 12-Feb-2016, Label Range: 15 - 50, Preferred Count Labels: 15, Min Rating: 75, Stocks toggle ON, Bias Towards Beginning of Data: 8, Bias Towards Major High/Low: 8, Largest Degree Wave Filter: Any Pattern
Rating:81.7
Current Trading Positions for iShares Barclays 20+ Year Treasury Bond Fund (TLT) Daily on 12-Feb-2016
* A Cycle degree trader (hold positions from quarters to years), would currently be trading long in this market. The probability of this Target Area being correct is 85.1%. However, the random probability of this Target Area being correct is 64.1%. So the true probability of this Target Area being correct is 32.8% better than random.
Extensive Elliott Commentary for iShares Barclays 20+ Year Treasury Bond Fund (TLT) Daily on 12-Feb-2016 with two incomplete patterns:
Wave C of the Primary degree inverted Flat with a rating of 103.2 is expected to complete in the price range 120.48 to 147.7, but more probably between 127.27 and 137.69. This wave is due to complete anytime from now until 01-May-2017, but is most likely to complete before 29-Feb-2016.
This wave C will complete the Flat pattern.
This is the final wave in the pattern. When complete it will also complete wave y of the Cycle degree inverted Double 3 with a rating of 81.7. These two waves have the same target ranges.
Wave y will probably complete this Double Sideways pattern, although it could possibly extend into a Triple Sideways pattern.
Current Analysis Settings: Analysis Date Range: 06-Dec-2013 to 12-Feb-2016, Label Range: 15 - 50, Preferred Count Labels: 16, Min Rating: 75, Stocks toggle ON, Bias Towards Beginning of Data: 8, Bias Towards Major High/Low: 8, Largest Degree Wave Filter: Any Pattern
Rating:99.7
Current Trading Positions for iShares Barclays 3-7 Year Treasury Bond Fund (IEI) Daily on 12-Feb-2016
* A Cycle degree trader (hold positions from quarters to years), would currently be trading long in this market. The probability of this Target Area being correct is 41.8%. However, the random probability of this Target Area being correct is 24.3%. So the true probability of this Target Area being correct is 72.0% better than random.
Extensive Elliott Commentary for iShares Barclays 3-7 Year Treasury Bond Fund (IEI) Daily on 12-Feb-2016 with one incomplete pattern:
Wave y of the Cycle degree inverted Double Zigzag with a rating of 99.7 is expected to complete in the price range 126.34 to 134.96, but more probably between 126.41 and 130.08. This wave is most likely to complete sometime between 15-Mar-2016 and 23-Jan-2017 Note that it cannot complete until 08-Mar-2016 but must complete by 27-Oct-2017.
Wave y will probably complete this Double Sharp pattern, although it could possibly extend into a Triple Sharp pattern.
Current Analysis Settings: Analysis Date Range: 06-Dec-2013 to 12-Feb-2016, Label Range: 15 - 50, Preferred Count Labels: 16, Min Rating: 75, Stocks toggle ON, Bias Towards Beginning of Data: 8, Bias Towards Major High/Low: 8, Largest Degree Wave Filter: Any Pattern
Rating:95.6
Current Trading Positions for iShares Barclays 7-10 Year Treasury Bond Fund (IEF) Daily on 12-Feb-2016
* A Primary degree trader (hold positions from months to years), would currently be trading long in this market. The probability of this Target Area being correct is 50.0%. However, the random probability of this Target Area being correct is 34.0%. So the true probability of this Target Area being correct is 47.1% better than random.
* A Cycle degree trader (hold positions from quarters to years), would currently be shorting this market. The probability of this Target Area being correct is 47.0%. However, the random probability of this Target Area being correct is 34.0%. So the true probability of this Target Area being correct is 38.2% better than random.
Extensive Elliott Commentary for iShares Barclays 7-10 Year Treasury Bond Fund (IEF) Daily on 12-Feb-2016 with two incomplete patterns:
Wave B of the Primary degree Flat with a rating of 100.4 is expected to complete in the price range 107.56 to 114.85, but more probably between 107.63 and 109.54. This wave is due to complete anytime from now until 24-Mar-2017, but is most likely to complete before 15-Feb-2016.
After wave B is complete, expect the market to continue down into wave C, which should be a five wave Impulsive pattern. Expect wave C to retrace wave B by 86% - 162%. Wave C can also be expected to be 90% - 162% of the price length of wave A. The expected time for wave C to complete is 19% - 134% of the time taken for wave B to complete and 24% - 115% of the time taken for wave A to complete.
Wave b of the Cycle degree inverted Flat with a rating of 95.6 is expected to complete in the price range 95.7 to 104.36, but more probably between 102.26 and 104.16. This wave is due to complete anytime from now until 18-Sep-2017, but is most likely to complete before 21-Mar-2016.
After wave b is complete, expect the market to continue up into wave c, which should be a five wave Impulsive pattern. Expect wave c to retrace wave b by 82% - 179%. Wave c can also be expected to be 67% - 179% of the price length of wave a. The expected time for wave c to complete is 20% - 151% of the time taken for wave b to complete and 11% - 58% of the time taken for wave a to complete.
Current Analysis Settings: Analysis Date Range: 06-Dec-2013 to 12-Feb-2016, Label Range: 15 - 50, Preferred Count Labels: 16, Min Rating: 75, Stocks toggle ON, Bias Towards Beginning of Data: 8, Bias Towards Major High/Low: 8, Largest Degree Wave Filter: Any Pattern
Rating:95.5
Current Trading Positions for iShares Barclays Aggregate Bond Fund (AGG) Daily on 12-Feb-2016
* A Supercycle degree trader (buy and hold for years), would currently be shorting this market. The probability of this Target Area being correct is 75.5%. However, the random probability of this Target Area being correct is 64.0%. So the true probability of this Target Area being correct is 18.0% better than random.
Extensive Elliott Commentary for iShares Barclays Aggregate Bond Fund (AGG) Daily on 12-Feb-2016 with one incomplete pattern:
Wave (d) of the Supercycle degree inverted Contracting Triangle with a rating of 95.5 is expected to complete in the price range 108.11 to 109.06, but more probably between 108.13 and 108.36. This wave is most likely to complete sometime between 26-Feb-2016 and 24-May-2016 Note that it cannot complete until 19-Feb-2016 but must complete by 18-Nov-2016.
Once this wave (d) is complete, expect the market to continue up to the end of wave (e), which will most probably be a ZigZag family pattern or possibly a Contracting Triangle. Expect wave (e) to have between 39% and 66% of the price range of wave (c) and complete in 4% to 60% of the time taken by wave (c). Expect also that wave (e) will have between 21% and 47% of the price range of wave (a) and complete in 2% to 24% of the time taken by wave (a). The slope (ie. price range divided by time taken) of wave (e) should be between 28% and 143% of the slope of wave (c) and between 19% to 183% of the slope of wave (a). Wave (e) will complete this Contracting Triangle.
Current Analysis Settings: Analysis Date Range: 06-Dec-2013 to 12-Feb-2016, Label Range: 15 - 50, Preferred Count Labels: 49, Min Rating: 75, Stocks toggle ON, Bias Towards Beginning of Data: 8, Bias Towards Major High/Low: 8, Largest Degree Wave Filter: Any Pattern
Rating:77.2
Current Trading Positions for iShares Barclays Intermediate Credit Bond Fund (CIU) Daily on 12-Feb-2016
* A Minor degree trader (hold positions from weeks to quarters), would currently be shorting this market. The probability of this Target Area being correct is 42.4%. However, the random probability of this Target Area being correct is 24.3%. So the true probability of this Target Area being correct is 74.5% better than random.
* An Intermediate degree trader (hold positions from months to quarters), would currently be shorting this market. The probability of this Target Area being correct is 41.3%. However, the random probability of this Target Area being correct is 34.0%. So the true probability of this Target Area being correct is 21.5% better than random.
* A Primary degree trader (hold positions from months to years), would currently be trading long in this market. The probability of this Target Area being correct is 85.2%. However, the random probability of this Target Area being correct is 64.1%. So the true probability of this Target Area being correct is 32.9% better than random.
* A Cycle degree trader (hold positions from quarters to years), would currently be trading long in this market. The probability of this Target Area being correct is 40.1%. However, the random probability of this Target Area being correct is 34.0%. So the true probability of this Target Area being correct is 17.9% better than random.
Extensive Elliott Commentary for iShares Barclays Intermediate Credit Bond Fund (CIU) Daily on 12-Feb-2016 with four incomplete patterns:
Wave Y of the Minor degree Double Zigzag with a rating of 102.7 is expected to complete in the price range 102.24 to 106.88, but more probably between 105.35 and 106.81. This wave is most likely to complete sometime between 19-Feb-2016 and 24-Mar-2016 Note that it cannot complete until 17-Feb-2016 but must complete by 24-May-2016.
Wave Y will probably complete this Double Sharp pattern, although it could possibly extend into a Triple Sharp pattern.
This is the final wave in the pattern. When complete it will also complete wave (B) of the Intermediate degree inverted Flat with a rating of 81.4. These two waves have the same target ranges.
After wave (B) is complete, expect the market to continue up into wave (C), which should be a five wave Impulsive pattern. Expect wave (C) to retrace wave (B) by 80% - 169%. Wave (C) can also be expected to be 99% - 169% of the price length of wave (A). The expected time for wave (C) to complete is 19% - 187% of the time taken for wave (B) to complete and 56% - 268% of the time taken for wave (A) to complete.
Wave Y of the Primary degree inverted Double 3 with a rating of 82.3 is expected to complete in the price range 108.31 to 112.91, but more probably between 108.83 and 110.65. This wave was expected to complete before 12-Feb-2016, and must complete by 07-Mar-2016.
Wave Y will probably complete this Double Sideways pattern, although it could possibly extend into a Triple Sideways pattern.
This is the final wave in the pattern. When complete it will also complete wave b of the Cycle degree Flat with a rating of 77.2. These two waves have the same target ranges.
After wave b is complete, expect the market to continue down into wave c, which should be a five wave Impulsive pattern. Expect wave c to retrace wave b by 86% - 162%. Wave c can also be expected to be 90% - 162% of the price length of wave a. The expected time for wave c to complete is 19% - 134% of the time taken for wave b to complete and 24% - 115% of the time taken for wave a to complete.
Current Analysis Settings: Analysis Date Range: 04-Sep-2014 to 12-Feb-2016, Label Range: 15 - 50, Preferred Count Labels: 42, Min Rating: 75, Stocks toggle ON, Bias Towards Beginning of Data: 8, Bias Towards Major High/Low: 8, Largest Degree Wave Filter: Any Pattern
Rating:101
Current Trading Positions for iShares Barclays MBS Bond Fund (MBB) Daily on 12-Feb-2016
* A Supercycle degree trader (buy and hold for years), would currently be trading long in this market. The probability of this Target Area being correct is 42.2%. However, the random probability of this Target Area being correct is 24.3%. So the true probability of this Target Area being correct is 73.7% better than random.
Extensive Elliott Commentary for iShares Barclays MBS Bond Fund (MBB) Daily on 12-Feb-2016 with one incomplete pattern:
Wave (y) of the Supercycle degree inverted Double Zigzag with a rating of 101 is expected to complete in the price range 112.59 to 122.09, but more probably between 112.67 and 116.85. This wave is most likely to complete sometime between 04-Apr-2016 and 28-Feb-2017 Note that it cannot complete until 11-Mar-2016 but must complete by 02-Apr-2018.
Wave (y) will probably complete this Double Sharp pattern, although it could possibly extend into a Triple Sharp pattern.
Current Analysis Settings: Analysis Date Range: 06-Dec-2013 to 12-Feb-2016, Label Range: 15 - 50, Preferred Count Labels: 16, Min Rating: 75, Stocks toggle ON, Bias Towards Beginning of Data: 8, Bias Towards Major High/Low: 8, Largest Degree Wave Filter: Any Pattern
Rating:83.6
Current Trading Positions for iShares Barclays Short Treasury Bond Fund (SHV) Daily on 12-Feb-2016
* A Minuette degree trader (hold positions from days to months), would currently be shorting this market. The probability of this Target Area being correct is 50.3%. However, the random probability of this Target Area being correct is 34.0%. So the true probability of this Target Area being correct is 47.9% better than random.
* A Minute degree trader (hold positions from weeks to months), would currently be trading long in this market. The probability of this Target Area being correct is 78.8%. However, the random probability of this Target Area being correct is 65.0%. So the true probability of this Target Area being correct is 21.2% better than random.
* A Minor degree trader (hold positions from weeks to quarters), would currently be shorting this market. The probability of this Target Area being correct is 42.2%. However, the random probability of this Target Area being correct is 34.0%. So the true probability of this Target Area being correct is 24.1% better than random.
* An Intermediate degree trader (hold positions from months to quarters), would currently be trading long in this market. The probability of this Target Area being correct is 41.9%. However, the random probability of this Target Area being correct is 34.0%. So the true probability of this Target Area being correct is 23.2% better than random.
Extensive Elliott Commentary for iShares Barclays Short Treasury Bond Fund (SHV) Daily on 12-Feb-2016 with four incomplete patterns:
Wave (b) of the Minuette degree inverted Flat with a rating of 103.1 is expected to complete in the price range 110.08 to 110.3, but more probably between 110.27 and 110.3. This wave is due to complete anytime from now until 19-Feb-2016, but is most likely to complete before 12-Feb-2016.
After wave (b) is complete, expect the market to continue up into wave (c), which should be a five wave Impulsive pattern. Expect wave (c) to retrace wave (b) by 83% - 173%. Wave (c) can also be expected to be 101% - 173% of the price length of wave (a). The expected time for wave (c) to complete is 20% - 190% of the time taken for wave (b) to complete and 57% - 279% of the time taken for wave (a) to complete.
Wave x of the Minute degree Double Zigzag with a rating of 82.9 is expected to complete in the price range 110.29 to 110.32, but more probably between 110.3 and 110.31. This wave was expected to complete before 12-Feb-2016, and must complete by 15-Feb-2016.
After wave x is complete, expect the market to continue down into wave y, which should be a three wave Zigzag pattern. Expect wave y to retrace wave x by 129% - 302%. Wave y can also be expected to be 90% - 302% of the price length of wave w. The expected time for wave y to complete is 26% - 141% of the time taken for wave x to complete and 96% - 271% of the time taken for wave w to complete.
Wave B of the Minor degree inverted Flat with a rating of 84.4 is expected to complete in the price range 110.09 to 110.28, but more probably between 110.25 and 110.28. This wave is due to complete anytime from now until 28-Mar-2016, but is most likely to complete before 19-Feb-2016.
After wave B is complete, expect the market to continue up into wave C, which should be a five wave Impulsive pattern. Expect wave C to retrace wave B by 83% - 173%. Wave C can also be expected to be 101% - 173% of the price length of wave A. The expected time for wave C to complete is 20% - 190% of the time taken for wave B to complete and 57% - 279% of the time taken for wave A to complete.
Wave (B) of the Intermediate degree Flat with a rating of 83.6 is expected to complete in the price range 110.3 to 110.48, but more probably between 110.3 and 110.33. This wave is due to complete anytime from now until 22-Apr-2016, but is most likely to complete before 25-Feb-2016.
After wave (B) is complete, expect the market to continue down into wave (C), which should be a five wave Impulsive pattern. Expect wave (C) to retrace wave (B) by 89% - 167%. Wave (C) can also be expected to be 104% - 167% of the price length of wave (A). The expected time for wave (C) to complete is 20% - 146% of the time taken for wave (B) to complete and 53% - 275% of the time taken for wave (A) to complete.
Current Analysis Settings: Analysis Date Range: 04-Nov-2015 to 12-Feb-2016, Label Range: 15 - 50, Preferred Count Labels: 25, Min Rating: 75, Stocks toggle ON, Bias Towards Beginning of Data: 8, Bias Towards Major High/Low: 8, Largest Degree Wave Filter: Any Pattern
Rating:91.1
Current Trading Positions for iShares Barclays TIPS Bond Fund (TIP) Daily on 12-Feb-2016
* A Minor degree trader (hold positions from weeks to quarters), would currently be shorting this market. The probability of this Target Area being correct is 42.8%. However, the random probability of this Target Area being correct is 24.3%. So the true probability of this Target Area being correct is 76.1% better than random.
* An Intermediate degree trader (hold positions from months to quarters), would currently be shorting this market. The probability of this Target Area being correct is 41.6%. However, the random probability of this Target Area being correct is 34.0%. So the true probability of this Target Area being correct is 22.4% better than random.
* A Primary degree trader (hold positions from months to years), would currently be trading long in this market. The probability of this Target Area being correct is 40.4%. However, the random probability of this Target Area being correct is 34.0%. So the true probability of this Target Area being correct is 18.8% better than random.
* A Cycle degree trader (hold positions from quarters to years), would currently be shorting this market. The probability of this Target Area being correct is 86.1%. However, the random probability of this Target Area being correct is 64.1%. So the true probability of this Target Area being correct is 34.3% better than random.
Extensive Elliott Commentary for iShares Barclays TIPS Bond Fund (TIP) Daily on 12-Feb-2016 with four incomplete patterns:
Wave Y of the Minor degree Double Zigzag with a rating of 104.8 is expected to complete in the price range 99.5 to 108.95, but more probably between 106.15 and 108.89. This wave is most likely to complete sometime between 25-Feb-2016 and 30-May-2016 Note that it cannot complete until 23-Feb-2016 but must complete by 07-Nov-2016.
Wave Y will probably complete this Double Sharp pattern, although it could possibly extend into a Triple Sharp pattern.
This is the final wave in the pattern. When complete it will also complete wave (B) of the Intermediate degree inverted Flat with a rating of 82.4. These two waves have the same target ranges.
After wave (B) is complete, expect the market to continue up into wave (C), which should be a five wave Impulsive pattern. Expect wave (C) to retrace wave (B) by 80% - 169%. Wave (C) can also be expected to be 99% - 169% of the price length of wave (A). The expected time for wave (C) to complete is 19% - 187% of the time taken for wave (B) to complete and 56% - 268% of the time taken for wave (A) to complete.
Wave B of the Primary degree Flat with a rating of 78.3 is expected to complete in the price range 114.04 to 123.47, but more probably between 114.13 and 116.6. This wave was expected to complete before 14-Aug-2015, and must complete by 13-Jul-2016.
After wave B is complete, expect the market to continue down into wave C, which should be a five wave Impulsive pattern. Expect wave C to retrace wave B by 86% - 162%. Wave C can also be expected to be 90% - 162% of the price length of wave A. The expected time for wave C to complete is 19% - 134% of the time taken for wave B to complete and 24% - 115% of the time taken for wave A to complete.
Wave y of the Cycle degree Double 3 with a rating of 91.1 is expected to complete in the price range 95.26 to 115.33, but more probably between 106.16 and 111.47. This wave was expected to complete before 20-Nov-2015, and must complete by 01-Aug-2016.
Wave y will probably complete this Double Sideways pattern, although it could possibly extend into a Triple Sideways pattern.
Current Analysis Settings: Analysis Date Range: 16-Apr-2014 to 12-Feb-2016, Label Range: 15 - 50, Preferred Count Labels: 28, Min Rating: 75, Stocks toggle ON, Bias Towards Beginning of Data: 8, Bias Towards Major High/Low: 8, Largest Degree Wave Filter: Any Pattern
Rating:104.5
Current Trading Positions for iShares Barclays U.S. Treasury Bond Fund (GOVT) Daily on 12-Feb-2016
* A Cycle degree trader (hold positions from quarters to years), would currently be shorting this market. The probability of this Target Area being correct is 68.0%. However, the random probability of this Target Area being correct is 53.0%. So the true probability of this Target Area being correct is 28.3% better than random.
Extensive Elliott Commentary for iShares Barclays U.S. Treasury Bond Fund (GOVT) Daily on 12-Feb-2016 with one incomplete pattern:
Wave x of the Cycle degree inverted Double 3 with a rating of 104.5 is expected to complete in the price range 21.06 to 25.14, but more probably between 24.64 and 25.11. This wave is most likely to complete sometime between 17-Mar-2016 and 22-Aug-2016 Note that it cannot complete until 15-Feb-2016 but must complete by 30-Oct-2018.
After wave x is complete, expect the market to continue up into wave y, which will probably be a three wave corrective pattern. Expect wave y to retrace wave x by 48% - 183%. Wave y can also be expected to be 40% - 183% of the price length of wave w. The expected time for wave y to complete is 30% - 228% of the time taken for wave x to complete and 12% - 72% of the time taken for wave w to complete.
Current Analysis Settings: Analysis Date Range: 06-Dec-2013 to 12-Feb-2016, Label Range: 15 - 50, Preferred Count Labels: 23, Min Rating: 75, Stocks toggle ON, Bias Towards Beginning of Data: 8, Bias Towards Major High/Low: 8, Largest Degree Wave Filter: Any Pattern
Rating:104.3
Current Trading Positions for iShares Cohen & Steers Realty Majors Index Fund ETF (ICF) Daily on 12-Feb-2016
* A Primary degree trader (hold positions from months to years), would currently be shorting this market. The probability of this Target Area being correct is 65.3%. However, the random probability of this Target Area being correct is 45.0%. So the true probability of this Target Area being correct is 45.1% better than random.
Extensive Elliott Commentary for iShares Cohen & Steers Realty Majors Index Fund ETF (ICF) Daily on 12-Feb-2016 with one incomplete pattern:
Wave C of the Primary degree Zigzag with a rating of 104.3 is expected to complete in the price range 68.42 to 91.52, but more probably between 83.01 and 90.44. This wave is due to complete anytime from now until 21-Apr-2016, but is most likely to complete before 25-Feb-2016.
This wave C will complete the ZigZag pattern.
Current Analysis Settings: Analysis Date Range: 15-Dec-2014 to 12-Feb-2016, Label Range: 15 - 50, Preferred Count Labels: 32, Min Rating: 75, Stocks toggle ON, Bias Towards Beginning of Data: 8, Bias Towards Major High/Low: 8, Largest Degree Wave Filter: Any Pattern
Rating:99.9
Current Trading Positions for iShares COMEX Gold Trust ETF (IAU) Daily on 12-Feb-2016
* A Cycle degree trader (hold positions from quarters to years), would currently be trading long in this market. The probability of this Target Area being correct is 49.4%. However, the random probability of this Target Area being correct is 34.0%. So the true probability of this Target Area being correct is 45.3% better than random.
Extensive Elliott Commentary for iShares COMEX Gold Trust ETF (IAU) Daily on 12-Feb-2016 with one incomplete pattern:
Wave b of the Cycle degree Flat with a rating of 99.9 is expected to complete in the price range 12.38 to 18.85, but more probably between 12.45 and 14.16. This wave could complete anytime between now and 24-Aug-2026, but is most likely to complete sometime between 22-Feb-2016 and 16-Jun-2017.
After wave b is complete, expect the market to continue down into wave c, which should be a five wave Impulsive pattern. Expect wave c to retrace wave b by 85% - 162%. Wave c can also be expected to be 90% - 162% of the price length of wave a. The expected time for wave c to complete is 20% - 136% of the time taken for wave b to complete and 20% - 110% of the time taken for wave a to complete.
Current Analysis Settings: Analysis Date Range: 31-Jan-2014 to 12-Feb-2016, Label Range: 15 - 50, Preferred Count Labels: 18, Min Rating: 75, Stocks toggle ON, Bias Towards Beginning of Data: 8, Bias Towards Major High/Low: 8, Largest Degree Wave Filter: Any Pattern
Rating:87.4
Current Trading Positions for iShares Core MSCI EAFE ETF (IEFA) Daily on 12-Feb-2016
* A Primary degree trader (hold positions from months to years), would currently be shorting this market. The probability of this Target Area being correct is 65.1%. However, the random probability of this Target Area being correct is 45.0%. So the true probability of this Target Area being correct is 44.7% better than random.
* A Cycle degree trader (hold positions from quarters to years), would currently be shorting this market. The probability of this Target Area being correct is 38.5%. However, the random probability of this Target Area being correct is 24.3%. So the true probability of this Target Area being correct is 58.4% better than random.
Extensive Elliott Commentary for iShares Core MSCI EAFE ETF (IEFA) Daily on 12-Feb-2016 with two incomplete patterns:
Wave C of the Primary degree Zigzag with a rating of 103.4 is expected to complete in the price range 32.49 to 48.26, but more probably between 42.85 and 48.01. This wave is due to complete anytime from now until 18-Apr-2016, but is most likely to complete before 14-Mar-2016.
This is the final wave in the pattern. When complete it will also complete wave y of the Cycle degree Double Zigzag with a rating of 87.4. These two waves have the same target ranges.
Wave y will probably complete this Double Sharp pattern, although it could possibly extend into a Triple Sharp pattern.
Current Analysis Settings: Analysis Date Range: 08-May-2014 to 12-Feb-2016, Label Range: 15 - 50, Preferred Count Labels: 20, Min Rating: 75, Stocks toggle ON, Bias Towards Beginning of Data: 8, Bias Towards Major High/Low: 8, Largest Degree Wave Filter: Any Pattern
This wave C will complete the ZigZag pattern.
Rating:76.6
Current Trading Positions for iShares Core MSCI Total International Stock ETF (IXUS) Daily on 12-Feb-2016
* An Intermediate degree trader (hold positions from months to quarters), would currently be shorting this market. The probability of this Target Area being correct is 70.5%. However, the random probability of this Target Area being correct is 45.0%. So the true probability of this Target Area being correct is 56.7% better than random.
* A Cycle degree trader (hold positions from quarters to years), would currently be trading long in this market. The probability of this Target Area being correct is 39.8%. However, the random probability of this Target Area being correct is 34.0%. So the true probability of this Target Area being correct is 17.1% better than random.
Extensive Elliott Commentary for iShares Core MSCI Total International Stock ETF (IXUS) Daily on 12-Feb-2016 with three incomplete patterns:
Wave (2) of the Intermediate degree Impulse with a rating of 94.5 is expected to complete in the price range 43.02 to 46.24, but more probably between 44.65 and 45.91. This wave was expected to complete before 03-Feb-2016, and must complete by 29-Feb-2016.
After this wave (2) is complete, expect the market to continue up into wave (3). Wave (3) should always be an Impulse and should retrace wave (2) completely. Expect wave (3) to retrace wave (2) by 164% - 383%. Wave (3) can also be expected to be 83% - 383% of the price length of wave (1). The expected time for wave (3) to complete is 87% - 367% of the time taken for wave (2) to complete and 16% - 97% of the time taken for wave (1) to complete. The slope (ie. price range divided by time taken) of wave (3) should be between 70% and 219% of the slope of wave (1). Once wave (3) is complete, expect wave (4) to be a sideways corrective movement, then wave (5) to continue in the same direction as wave (3). Wave (5) will complete this Impulse.
Wave C of the Primary degree inverted Flat with a rating of 82.1 is expected to complete in the price range 47 to 60.69, but more probably between 49.7 and 57.26. This wave is due to complete anytime from now until 03-Jan-2017, but is most likely to complete before 07-Apr-2016.
This wave C will complete the Flat pattern.
This is the final wave in the pattern. When complete it will also complete wave b of the Cycle degree Flat with a rating of 76.6. These two waves have the same target ranges.
After wave b is complete, expect the market to continue down into wave c, which should be a five wave Impulsive pattern. Expect wave c to retrace wave b by 85% - 162%. Wave c can also be expected to be 90% - 162% of the price length of wave a. The expected time for wave c to complete is 20% - 136% of the time taken for wave b to complete and 20% - 110% of the time taken for wave a to complete.
Current Analysis Settings: Analysis Date Range: 08-May-2014 to 12-Feb-2016, Label Range: 15 - 50, Preferred Count Labels: 20, Min Rating: 75, Stocks toggle ON, Bias Towards Beginning of Data: 8, Bias Towards Major High/Low: 8, Largest Degree Wave Filter: Any Pattern
Rating:77.6
Current Trading Positions for iShares Core S&P Total US Stock Market ETF (ITOT) Daily on 12-Feb-2016
* An Intermediate degree trader (hold positions from months to quarters), would currently be trading long in this market. The probability of this Target Area being correct is 85.8%. However, the random probability of this Target Area being correct is 64.1%. So the true probability of this Target Area being correct is 33.9% better than random.
* A Primary degree trader (hold positions from months to years), would currently be trading long in this market. The probability of this Target Area being correct is 40.1%. However, the random probability of this Target Area being correct is 34.0%. So the true probability of this Target Area being correct is 17.9% better than random.
Extensive Elliott Commentary for iShares Core S&P Total US Stock Market ETF (ITOT) Daily on 12-Feb-2016 with three incomplete patterns:
Wave C of the Minor degree inverted Flat with a rating of 101.2 is expected to complete in the price range 82.29 to 88.72, but more probably between 84.02 and 86.54. This wave is due to complete anytime from now until 19-Feb-2016, but is most likely to complete before 15-Feb-2016.
This wave C will complete the Flat pattern.
This is the final wave in the pattern. When complete it will also complete wave (Y) of the Intermediate degree inverted Double 3 with a rating of 88.1. These two waves have the same target ranges.
Wave (Y) will probably complete this Double Sideways pattern, although it could possibly extend into a Triple Sideways pattern.
This is the final wave in the pattern. When complete it will also complete wave B of the Primary degree Flat with a rating of 77.6. These two waves have the same target ranges.
After wave B is complete, expect the market to continue down into wave C, which should be a five wave Impulsive pattern. Expect wave C to retrace wave B by 86% - 162%. Wave C can also be expected to be 90% - 162% of the price length of wave A. The expected time for wave C to complete is 19% - 134% of the time taken for wave B to complete and 24% - 115% of the time taken for wave A to complete.
Current Analysis Settings: Analysis Date Range: 11-May-2015 to 12-Feb-2016, Label Range: 15 - 50, Preferred Count Labels: 29, Min Rating: 75, Stocks toggle ON, Bias Towards Beginning of Data: 8, Bias Towards Major High/Low: 8, Largest Degree Wave Filter: Any Pattern
Rating:86.5
Current Trading Positions for iShares Dow Jones EPAC Select Dividend Index Fund ETF (IDV) Daily on 12-Feb-2016
* A Primary degree trader (hold positions from months to years), would currently be shorting this market. The probability of this Target Area being correct is 50.2%. However, the random probability of this Target Area being correct is 34.0%. So the true probability of this Target Area being correct is 47.6% better than random.
* A Cycle degree trader (hold positions from quarters to years), would currently be trading long in this market. The probability of this Target Area being correct is 87.2%. However, the random probability of this Target Area being correct is 80.4%. So the true probability of this Target Area being correct is 8.5% better than random.
Extensive Elliott Commentary for iShares Dow Jones EPAC Select Dividend Index Fund ETF (IDV) Daily on 12-Feb-2016 with two incomplete patterns:
Wave B of the Primary degree inverted Flat with a rating of 102 is expected to complete in the price range 16.18 to 25.73, but more probably between 24.24 and 25.68. This wave is due to complete anytime from now until 20-May-2016, but is most likely to complete before 26-Feb-2016.
After wave B is complete, expect the market to continue up into wave C, which should be a five wave Impulsive pattern. Expect wave C to retrace wave B by 80% - 169%. Wave C can also be expected to be 99% - 169% of the price length of wave A. The expected time for wave C to complete is 19% - 187% of the time taken for wave B to complete and 56% - 268% of the time taken for wave A to complete.
Wave IV of the Cycle degree inverted Ending Diagonal with a rating of 86.5 is expected to complete in the price range 27.57 to 30.18, but more probably between 27.57 and 29.07. This wave is due to complete anytime from now until 29-Aug-2016, but is most likely to complete before 16-Mar-2016.
Expect this wave IV to complete in the price range of wave 2, and then continue down to the end of wave V, which should be a ZigZag family three wave pattern. Expect wave V to have between 52% and 91% of the price range of wave III and complete in 18% to 62% of the time taken by wave III. Expect also that wave V will have between 31% and 72% of the price range of wave I and complete in 3% to 22% of the time taken by wave I. The slope (ie. price range divided by time taken) of wave V should be between 49% and 173% of the slope of wave III and between 77% to 312% of the slope of wave I. Wave V will complete this Ending Diagonal pattern.
Current Analysis Settings: Analysis Date Range: 08-May-2014 to 12-Feb-2016, Label Range: 15 - 50, Preferred Count Labels: 28, Min Rating: 75, Stocks toggle ON, Bias Towards Beginning of Data: 8, Bias Towards Major High/Low: 8, Largest Degree Wave Filter: Any Pattern
Rating:102.6
Current Trading Positions for iShares Dow Jones Select Dividend Index Fund ETF (DVY) Daily on 12-Feb-2016
* A Primary degree trader (hold positions from months to years), would currently be trading long in this market. The probability of this Target Area being correct is 50.2%. However, the random probability of this Target Area being correct is 34.0%. So the true probability of this Target Area being correct is 47.6% better than random.
Extensive Elliott Commentary for iShares Dow Jones Select Dividend Index Fund ETF (DVY) Daily on 12-Feb-2016 with one incomplete pattern:
Wave B of the Primary degree Flat with a rating of 102.6 is expected to complete in the price range 75.2 to 92.11, but more probably between 75.37 and 79.8. This wave is due to complete anytime from now until 25-Apr-2017, but is most likely to complete before 31-Mar-2016.
After wave B is complete, expect the market to continue down into wave C, which should be a five wave Impulsive pattern. Expect wave C to retrace wave B by 86% - 162%. Wave C can also be expected to be 90% - 162% of the price length of wave A. The expected time for wave C to complete is 19% - 134% of the time taken for wave B to complete and 24% - 115% of the time taken for wave A to complete.
Current Analysis Settings: Analysis Date Range: 14-Nov-2014 to 12-Feb-2016, Label Range: 15 - 50, Preferred Count Labels: 22, Min Rating: 75, Stocks toggle ON, Bias Towards Beginning of Data: 8, Bias Towards Major High/Low: 8, Largest Degree Wave Filter: Any Pattern
Rating:105.1
Current Trading Positions for iShares Dow Jones Transportation Average Index Fund ETF (IYT) Daily on 12-Feb-2016
* An Intermediate degree trader (hold positions from months to quarters), would currently be trading long in this market. The probability of this Target Area being correct is 43.0%. However, the random probability of this Target Area being correct is 24.3%. So the true probability of this Target Area being correct is 77.0% better than random.
Extensive Elliott Commentary for iShares Dow Jones Transportation Average Index Fund ETF (IYT) Daily on 12-Feb-2016 with one incomplete pattern:
Wave (Y) of the Intermediate degree inverted Double Zigzag with a rating of 105.1 is expected to complete in the price range 130.98 to 140.61, but more probably between 131.14 and 135.63. This wave is most likely to complete sometime between 12-Feb-2016 and 25-Feb-2016 Note that it cannot complete until 12-Feb-2016 but must complete by 21-Mar-2016.
Wave (Y) will probably complete this Double Sharp pattern, although it could possibly extend into a Triple Sharp pattern.
Current Analysis Settings: Analysis Date Range: 17-Oct-2014 to 12-Feb-2016, Label Range: 15 - 50, Preferred Count Labels: 48, Min Rating: 75, Stocks toggle ON, Bias Towards Beginning of Data: 8, Bias Towards Major High/Low: 8, Largest Degree Wave Filter: Any Pattern
Rating:77.1
Current Trading Positions for iShares Dow Jones US Basic Materials Index Fund ETF (IYM) Daily on 12-Feb-2016
* An Intermediate degree trader (hold positions from months to quarters), would currently be shorting this market. The probability of this Target Area being correct is 71.0%. However, the random probability of this Target Area being correct is 45.0%. So the true probability of this Target Area being correct is 57.8% better than random.
* A Cycle degree trader (hold positions from quarters to years), would currently be trading long in this market. The probability of this Target Area being correct is 54.8%. However, the random probability of this Target Area being correct is 53.0%. So the true probability of this Target Area being correct is 3.4% better than random.
Extensive Elliott Commentary for iShares Dow Jones US Basic Materials Index Fund ETF (IYM) Daily on 12-Feb-2016 with three incomplete patterns:
Wave (2) of the Intermediate degree Impulse with a rating of 98.7 is expected to complete in the price range 58.66 to 66.14, but more probably between 62.44 and 65.36. This wave was expected to complete before 09-Feb-2016, and must complete by 14-Mar-2016.
After this wave (2) is complete, expect the market to continue up into wave (3). Wave (3) should always be an Impulse and should retrace wave (2) completely. Expect wave (3) to retrace wave (2) by 164% - 383%. Wave (3) can also be expected to be 83% - 383% of the price length of wave (1). The expected time for wave (3) to complete is 87% - 367% of the time taken for wave (2) to complete and 16% - 97% of the time taken for wave (1) to complete. The slope (ie. price range divided by time taken) of wave (3) should be between 70% and 219% of the slope of wave (1). Once wave (3) is complete, expect wave (4) to be a sideways corrective movement, then wave (5) to continue in the same direction as wave (3). Wave (5) will complete this Impulse.
Wave C of the Primary degree inverted Flat with a rating of 85.2 is expected to complete in the price range 64.66 to 90.14, but more probably between 70.12 and 83.08. This wave is due to complete anytime from now until 28-Feb-2017, but is most likely to complete before 06-Apr-2016.
This wave C will complete the Flat pattern.
This is the final wave in the pattern. When complete it will also complete wave x of the Cycle degree Double 3 with a rating of 77.1. These two waves have the same target ranges.
After wave x is complete, expect the market to continue down into wave y, which will probably be a three wave corrective pattern. Expect wave y to retrace wave x by 98% - 192%. Wave y can also be expected to be 76% - 192% of the price length of wave w. The expected time for wave y to complete is 20% - 179% of the time taken for wave x to complete and 12% - 112% of the time taken for wave w to complete.
Current Analysis Settings: Analysis Date Range: 08-Aug-2014 to 12-Feb-2016, Label Range: 15 - 50, Preferred Count Labels: 15, Min Rating: 75, Stocks toggle ON, Bias Towards Beginning of Data: 8, Bias Towards Major High/Low: 8, Largest Degree Wave Filter: Any Pattern
Rating:105.6
Current Trading Positions for iShares Dow Jones US Energy Sector Index Fund ETF (IYE) Daily on 12-Feb-2016
* An Intermediate degree trader (hold positions from months to quarters), would currently be trading long in this market. The probability of this Target Area being correct is 43.0%. However, the random probability of this Target Area being correct is 24.3%. So the true probability of this Target Area being correct is 77.0% better than random.
Extensive Elliott Commentary for iShares Dow Jones US Energy Sector Index Fund ETF (IYE) Daily on 12-Feb-2016 with one incomplete pattern:
Wave (Y) of the Intermediate degree inverted Double Zigzag with a rating of 105.6 is expected to complete in the price range 33.54 to 44.93, but more probably between 33.61 and 37.86. This wave is most likely to complete sometime between 12-Feb-2016 and 25-Feb-2016 Note that it cannot complete until 12-Feb-2016 but must complete by 16-Mar-2016.
Wave (Y) will probably complete this Double Sharp pattern, although it could possibly extend into a Triple Sharp pattern.
Current Analysis Settings: Analysis Date Range: 12-May-2014 to 12-Feb-2016, Label Range: 15 - 50, Preferred Count Labels: 44, Min Rating: 75, Stocks toggle ON, Bias Towards Beginning of Data: 8, Bias Towards Major High/Low: 8, Largest Degree Wave Filter: Any Pattern
Rating:78.3
Current Trading Positions for iShares Dow Jones US Financial Sector Index Fund ETF (IYF) Daily on 12-Feb-2016
* An Intermediate degree trader (hold positions from months to quarters), would currently be trading long in this market. The probability of this Target Area being correct is 85.6%. However, the random probability of this Target Area being correct is 64.1%. So the true probability of this Target Area being correct is 33.5% better than random.
* A Primary degree trader (hold positions from months to years), would currently be trading long in this market. The probability of this Target Area being correct is 40.4%. However, the random probability of this Target Area being correct is 34.0%. So the true probability of this Target Area being correct is 18.8% better than random.
Extensive Elliott Commentary for iShares Dow Jones US Financial Sector Index Fund ETF (IYF) Daily on 12-Feb-2016 with three incomplete patterns:
Wave C of the Minor degree inverted Flat with a rating of 102.7 is expected to complete in the price range 74.91 to 81.65, but more probably between 76.51 and 79.71. This wave is due to complete anytime from now until 19-Feb-2016, but is most likely to complete before 12-Feb-2016.
This wave C will complete the Flat pattern.
This is the final wave in the pattern. When complete it will also complete wave (Y) of the Intermediate degree inverted Double 3 with a rating of 86. These two waves have the same target ranges.
Wave (Y) will probably complete this Double Sideways pattern, although it could possibly extend into a Triple Sideways pattern.
This is the final wave in the pattern. When complete it will also complete wave B of the Primary degree Flat with a rating of 78.3. These two waves have the same target ranges.
After wave B is complete, expect the market to continue down into wave C, which should be a five wave Impulsive pattern. Expect wave C to retrace wave B by 86% - 162%. Wave C can also be expected to be 90% - 162% of the price length of wave A. The expected time for wave C to complete is 19% - 134% of the time taken for wave B to complete and 24% - 115% of the time taken for wave A to complete.
Current Analysis Settings: Analysis Date Range: 11-Jun-2015 to 12-Feb-2016, Label Range: 15 - 50, Preferred Count Labels: 25, Min Rating: 75, Stocks toggle ON, Bias Towards Beginning of Data: 8, Bias Towards Major High/Low: 8, Largest Degree Wave Filter: Any Pattern
Rating:82.7
Current Trading Positions for iShares Dow Jones US Financial Services Index Fund ETF (IYG) Daily on 12-Feb-2016
* A Minute degree trader (hold positions from weeks to months), would currently be trading long in this market. The probability of this Target Area being correct is 86.8%. However, the random probability of this Target Area being correct is 65.0%. So the true probability of this Target Area being correct is 33.5% better than random.
* A Minor degree trader (hold positions from weeks to quarters), would currently be shorting this market. The probability of this Target Area being correct is 40.7%. However, the random probability of this Target Area being correct is 34.0%. So the true probability of this Target Area being correct is 19.7% better than random.
* An Intermediate degree trader (hold positions from months to quarters), would currently be trading long in this market. The probability of this Target Area being correct is 85.2%. However, the random probability of this Target Area being correct is 64.1%. So the true probability of this Target Area being correct is 32.9% better than random.
Extensive Elliott Commentary for iShares Dow Jones US Financial Services Index Fund ETF (IYG) Daily on 12-Feb-2016 with four incomplete patterns:
Wave (c) of the Minuette degree inverted Flat with a rating of 103.4 is expected to complete in the price range 72.28 to 81.77, but more probably between 74.71 and 78.76. This wave is due to complete anytime from now until 19-Feb-2016, but is most likely to complete before 12-Feb-2016.
This wave (c) will complete the Flat pattern.
This is the final wave in the pattern. When complete it will also complete wave x of the Minute degree Double Zigzag with a rating of 98.5. These two waves have the same target ranges.
After wave x is complete, expect the market to continue down into wave y, which should be a three wave Zigzag pattern. Expect wave y to retrace wave x by 129% - 302%. Wave y can also be expected to be 90% - 302% of the price length of wave w. The expected time for wave y to complete is 26% - 141% of the time taken for wave x to complete and 96% - 271% of the time taken for wave w to complete.
Wave B of the Minor degree inverted Flat with a rating of 79.4 is expected to complete in the price range 60.63 to 75.76, but more probably between 73.33 and 75.64. This wave was expected to complete before 11-Feb-2016, and must complete by 26-Feb-2016.
After wave B is complete, expect the market to continue up into wave C, which should be a five wave Impulsive pattern. Expect wave C to retrace wave B by 83% - 173%. Wave C can also be expected to be 101% - 173% of the price length of wave A. The expected time for wave C to complete is 20% - 190% of the time taken for wave B to complete and 57% - 279% of the time taken for wave A to complete.
Wave (Y) of the Intermediate degree inverted Double 3 with a rating of 82.7 is expected to complete in the price range 75.37 to 96.81, but more probably between 78.75 and 84.94. This wave is due to complete anytime from now until 19-Feb-2016, but is most likely to complete before 15-Feb-2016.
Wave (Y) will probably complete this Double Sideways pattern, although it could possibly extend into a Triple Sideways pattern.
Current Analysis Settings: Analysis Date Range: 11-Jun-2015 to 12-Feb-2016, Label Range: 15 - 50, Preferred Count Labels: 31, Min Rating: 75, Stocks toggle ON, Bias Towards Beginning of Data: 8, Bias Towards Major High/Low: 8, Largest Degree Wave Filter: Any Pattern
Rating:78.6
Current Trading Positions for iShares Dow Jones US Health Care Providers Index Fund ETF (IHF) Daily on 12-Feb-2016
* A Primary degree trader (hold positions from months to years), would currently be trading long in this market. The probability of this Target Area being correct is 40.4%. However, the random probability of this Target Area being correct is 34.0%. So the true probability of this Target Area being correct is 18.8% better than random.
Extensive Elliott Commentary for iShares Dow Jones US Health Care Providers Index Fund ETF (IHF) Daily on 12-Feb-2016 with two incomplete patterns:
Wave (C) of the Intermediate degree inverted Flat with a rating of 99.6 is expected to complete in the price range 116.02 to 137.31, but more probably between 118.92 and 131.31. This wave is most likely to complete sometime between 15-Feb-2016 and 29-Mar-2016 Note that it cannot complete until 12-Feb-2016 but must complete by 20-Oct-2016.
This wave (C) will complete the Flat pattern.
This is the final wave in the pattern. When complete it will also complete wave B of the Primary degree Flat with a rating of 78.6. These two waves have the same target ranges.
After wave B is complete, expect the market to continue down into wave C, which should be a five wave Impulsive pattern. Expect wave C to retrace wave B by 89% - 167%. Wave C can also be expected to be 104% - 167% of the price length of wave A. The expected time for wave C to complete is 20% - 146% of the time taken for wave B to complete and 53% - 275% of the time taken for wave A to complete.
Current Analysis Settings: Analysis Date Range: 06-Dec-2013 to 12-Feb-2016, Label Range: 15 - 50, Preferred Count Labels: 28, Min Rating: 75, Stocks toggle ON, Bias Towards Beginning of Data: 8, Bias Towards Major High/Low: 8, Largest Degree Wave Filter: Any Pattern
Rating:82.5
Current Trading Positions for iShares Dow Jones US Healthcare Sector Index Fund ETF (IYH) Daily on 12-Feb-2016
* An Intermediate degree trader (hold positions from months to quarters), would currently be shorting this market. The probability of this Target Area being correct is 48.8%. However, the random probability of this Target Area being correct is 34.0%. So the true probability of this Target Area being correct is 43.5% better than random.
* A Primary degree trader (hold positions from months to years), would currently be trading long in this market. The probability of this Target Area being correct is 78.8%. However, the random probability of this Target Area being correct is 65.0%. So the true probability of this Target Area being correct is 21.2% better than random.
Extensive Elliott Commentary for iShares Dow Jones US Healthcare Sector Index Fund ETF (IYH) Daily on 12-Feb-2016 with two incomplete patterns:
Wave (B) of the Intermediate degree inverted Flat with a rating of 98.8 is expected to complete in the price range 108.97 to 136.25, but more probably between 131.88 and 136.03. This wave was expected to complete before 10-Feb-2016, and must complete by 18-Mar-2016.
After wave (B) is complete, expect the market to continue up into wave (C), which should be a five wave Impulsive pattern. Expect wave (C) to retrace wave (B) by 83% - 173%. Wave (C) can also be expected to be 101% - 173% of the price length of wave (A). The expected time for wave (C) to complete is 20% - 190% of the time taken for wave (B) to complete and 57% - 279% of the time taken for wave (A) to complete.
Wave X of the Primary degree Double Zigzag with a rating of 82.5 is expected to complete in the price range 137.93 to 156.35, but more probably between 143.09 and 152.53. This wave is due to complete anytime from now until 16-Mar-2017, but is most likely to complete before 19-May-2016.
After wave X is complete, expect the market to continue down into wave Y, which should be a three wave Zigzag pattern. Expect wave Y to retrace wave X by 117% - 263%. Wave Y can also be expected to be 90% - 263% of the price length of wave W. The expected time for wave Y to complete is 21% - 161% of the time taken for wave X to complete and 27% - 154% of the time taken for wave W to complete.
Current Analysis Settings: Analysis Date Range: 09-Jun-2015 to 12-Feb-2016, Label Range: 15 - 50, Preferred Count Labels: 17, Min Rating: 75, Stocks toggle ON, Bias Towards Beginning of Data: 8, Bias Towards Major High/Low: 8, Largest Degree Wave Filter: Any Pattern
Rating:85.1
Current Trading Positions for iShares Dow Jones US Home Construction Index Fund ETF (ITB) Daily on 12-Feb-2016
* An Intermediate degree trader (hold positions from months to quarters), would currently be shorting this market. The probability of this Target Area being correct is 50.1%. However, the random probability of this Target Area being correct is 34.0%. So the true probability of this Target Area being correct is 47.4% better than random.
* A Primary degree trader (hold positions from months to years), would currently be trading long in this market. The probability of this Target Area being correct is 55.6%. However, the random probability of this Target Area being correct is 53.0%. So the true probability of this Target Area being correct is 4.9% better than random.
Extensive Elliott Commentary for iShares Dow Jones US Home Construction Index Fund ETF (ITB) Daily on 12-Feb-2016 with two incomplete patterns:
Wave (B) of the Intermediate degree inverted Flat with a rating of 101.3 is expected to complete in the price range 14.25 to 22.85, but more probably between 21.51 and 22.81. This wave is due to complete anytime from now until 08-Apr-2016, but is most likely to complete before 15-Feb-2016.
After wave (B) is complete, expect the market to continue up into wave (C), which should be a five wave Impulsive pattern. Expect wave (C) to retrace wave (B) by 80% - 169%. Wave (C) can also be expected to be 99% - 169% of the price length of wave (A). The expected time for wave (C) to complete is 19% - 187% of the time taken for wave (B) to complete and 56% - 268% of the time taken for wave (A) to complete.
Wave X of the Primary degree Double 3 with a rating of 85.1 is expected to complete in the price range 27.3 to 64.96, but more probably between 27.53 and 31.17. This wave is due to complete anytime from now until 17-Aug-2017, but is most likely to complete before 29-Apr-2016.
After wave X is complete, expect the market to continue down into wave Y, which will probably be a three wave corrective pattern. Expect wave Y to retrace wave X by 98% - 193%. Wave Y can also be expected to be 76% - 193% of the price length of wave W. The expected time for wave Y to complete is 20% - 178% of the time taken for wave X to complete and 12% - 115% of the time taken for wave W to complete.
Current Analysis Settings: Analysis Date Range: 02-Sep-2014 to 12-Feb-2016, Label Range: 15 - 50, Preferred Count Labels: 16, Min Rating: 75, Stocks toggle ON, Bias Towards Beginning of Data: 8, Bias Towards Major High/Low: 8, Largest Degree Wave Filter: Any Pattern
Rating:82.5
Current Trading Positions for iShares Dow Jones US Oil & Gas Exploration & Production Index Fund ETF (IEO) Daily on 12-Feb-2016
* A Primary degree trader (hold positions from months to years), would currently be shorting this market. The probability of this Target Area being correct is 88.3%. However, the random probability of this Target Area being correct is 65.0%. So the true probability of this Target Area being correct is 35.8% better than random.
* A Cycle degree trader (hold positions from quarters to years), would currently be trading long in this market. The probability of this Target Area being correct is 41.6%. However, the random probability of this Target Area being correct is 34.0%. So the true probability of this Target Area being correct is 22.4% better than random.
Extensive Elliott Commentary for iShares Dow Jones US Oil & Gas Exploration & Production Index Fund ETF (IEO) Daily on 12-Feb-2016 with two incomplete patterns:
Wave X of the Primary degree inverted Double Zigzag with a rating of 101.3 is expected to complete in the price range 40.25 to 47.49, but more probably between 42.63 and 46.17. This wave is due to complete anytime from now until 08-Mar-2016, but is most likely to complete before 12-Feb-2016.
After wave X is complete, expect the market to continue up into wave Y, which should be a three wave Zigzag pattern. Expect wave Y to retrace wave X by 128% - 319%. Wave Y can also be expected to be 90% - 319% of the price length of wave W. The expected time for wave Y to complete is 23% - 167% of the time taken for wave X to complete and 47% - 204% of the time taken for wave W to complete.
Wave b of the Cycle degree Flat with a rating of 82.5 is expected to complete in the price range 80.79 to 195.88, but more probably between 81.99 and 112.4. This wave could complete anytime between now and 14-Jul-2025, but is most likely to complete sometime between 09-Mar-2016 and 11-May-2017.
After wave b is complete, expect the market to continue down into wave c, which should be a five wave Impulsive pattern. Expect wave c to retrace wave b by 85% - 162%. Wave c can also be expected to be 90% - 162% of the price length of wave a. The expected time for wave c to complete is 20% - 136% of the time taken for wave b to complete and 20% - 110% of the time taken for wave a to complete.
Current Analysis Settings: Analysis Date Range: 13-May-2014 to 12-Feb-2016, Label Range: 15 - 50, Preferred Count Labels: 16, Min Rating: 75, Stocks toggle ON, Bias Towards Beginning of Data: 8, Bias Towards Major High/Low: 8, Largest Degree Wave Filter: Any Pattern
Rating:79
Current Trading Positions for iShares Dow Jones US Oil Equipment & Services Index Fund ETF (IEZ) Daily on 12-Feb-2016
* An Intermediate degree trader (hold positions from months to quarters), would currently be shorting this market. The probability of this Target Area being correct is 70.9%. However, the random probability of this Target Area being correct is 45.0%. So the true probability of this Target Area being correct is 57.6% better than random.
* A Cycle degree trader (hold positions from quarters to years), would currently be trading long in this market. The probability of this Target Area being correct is 77.2%. However, the random probability of this Target Area being correct is 65.0%. So the true probability of this Target Area being correct is 18.8% better than random.
Extensive Elliott Commentary for iShares Dow Jones US Oil Equipment & Services Index Fund ETF (IEZ) Daily on 12-Feb-2016 with three incomplete patterns:
Wave (2) of the Intermediate degree Impulse with a rating of 97.4 is expected to complete in the price range 27.5 to 32.48, but more probably between 30.02 and 31.96. This wave was expected to complete before 09-Feb-2016, and must complete by 14-Mar-2016.
After this wave (2) is complete, expect the market to continue up into wave (3). Wave (3) should always be an Impulse and should retrace wave (2) completely. Expect wave (3) to retrace wave (2) by 164% - 383%. Wave (3) can also be expected to be 83% - 383% of the price length of wave (1). The expected time for wave (3) to complete is 87% - 367% of the time taken for wave (2) to complete and 16% - 97% of the time taken for wave (1) to complete. The slope (ie. price range divided by time taken) of wave (3) should be between 70% and 219% of the slope of wave (1). Once wave (3) is complete, expect wave (4) to be a sideways corrective movement, then wave (5) to continue in the same direction as wave (3). Wave (5) will complete this Impulse.
Wave C of the Primary degree inverted Flat with a rating of 83.9 is expected to complete in the price range 35.45 to 51.42, but more probably between 37.59 and 46.9. This wave is due to complete anytime from now until 28-Feb-2017, but is most likely to complete before 06-Apr-2016.
This wave C will complete the Flat pattern.
This is the final wave in the pattern. When complete it will also complete wave x of the Cycle degree Double Zigzag with a rating of 79. These two waves have the same target ranges.
After wave x is complete, expect the market to continue down into wave y, which should be a three wave Zigzag pattern. Expect wave y to retrace wave x by 116% - 261%. Wave y can also be expected to be 90% - 261% of the price length of wave w. The expected time for wave y to complete is 21% - 160% of the time taken for wave x to complete and 25% - 152% of the time taken for wave w to complete.
Current Analysis Settings: Analysis Date Range: 20-May-2014 to 12-Feb-2016, Label Range: 15 - 50, Preferred Count Labels: 15, Min Rating: 75, Stocks toggle ON, Bias Towards Beginning of Data: 8, Bias Towards Major High/Low: 8, Largest Degree Wave Filter: Any Pattern
Rating:91.6
Current Trading Positions for iShares Dow Jones US Real Estate Index Fund ETF (IYR) Daily on 12-Feb-2016
* A Primary degree trader (hold positions from months to years), would currently be shorting this market. The probability of this Target Area being correct is 65.1%. However, the random probability of this Target Area being correct is 45.0%. So the true probability of this Target Area being correct is 44.7% better than random.
* A Cycle degree trader (hold positions from quarters to years), would currently be shorting this market. The probability of this Target Area being correct is 40.2%. However, the random probability of this Target Area being correct is 24.3%. So the true probability of this Target Area being correct is 65.4% better than random.
Extensive Elliott Commentary for iShares Dow Jones US Real Estate Index Fund ETF (IYR) Daily on 12-Feb-2016 with two incomplete patterns:
Wave C of the Primary degree Zigzag with a rating of 103.4 is expected to complete in the price range 46.35 to 68.22, but more probably between 62.76 and 67.88. This wave is due to complete anytime from now until 18-Apr-2016, but is most likely to complete before 29-Feb-2016.
This wave C will complete the ZigZag pattern.
This is the final wave in the pattern. When complete it will also complete wave y of the Cycle degree Double Zigzag with a rating of 91.6. These two waves have the same target ranges.
Wave y will probably complete this Double Sharp pattern, although it could possibly extend into a Triple Sharp pattern.
Current Analysis Settings: Analysis Date Range: 06-Dec-2013 to 12-Feb-2016, Label Range: 15 - 50, Preferred Count Labels: 19, Min Rating: 75, Stocks toggle ON, Bias Towards Beginning of Data: 8, Bias Towards Major High/Low: 8, Largest Degree Wave Filter: Any Pattern
Rating:95.1
Current Trading Positions for iShares Dow Jones US Regional Banks Index Fund ETF (IAT) Daily on 12-Feb-2016
* A Primary degree trader (hold positions from months to years), would currently be trading long in this market. The probability of this Target Area being correct is 89.0%. However, the random probability of this Target Area being correct is 80.4%. So the true probability of this Target Area being correct is 10.7% better than random.
Extensive Elliott Commentary for iShares Dow Jones US Regional Banks Index Fund ETF (IAT) Daily on 12-Feb-2016 with one incomplete pattern:
Wave 4 of the Primary degree inverted Ending Diagonal with a rating of 95.1 is expected to complete in the price range 29.29 to 30.76, but more probably between 29.45 and 30.23. This wave is due to complete anytime from now until 25-Feb-2016, but is most likely to complete before 17-Feb-2016.
Expect this wave 4 to complete in the price range of wave 2, and then continue down to the end of wave 5, which should be a ZigZag family three wave pattern. Expect wave 5 to have between 52% and 91% of the price range of wave 3 and complete in 18% to 62% of the time taken by wave 3. Expect also that wave 5 will have between 31% and 72% of the price range of wave 1 and complete in 3% to 22% of the time taken by wave 1. The slope (ie. price range divided by time taken) of wave 5 should be between 49% and 173% of the slope of wave 3 and between 77% to 312% of the slope of wave 1. Wave 5 will complete this Ending Diagonal pattern.
Current Analysis Settings: Analysis Date Range: 11-Jun-2015 to 12-Feb-2016, Label Range: 15 - 50, Preferred Count Labels: 15, Min Rating: 75, Stocks toggle ON, Bias Towards Beginning of Data: 8, Bias Towards Major High/Low: 8, Largest Degree Wave Filter: Any Pattern
Rating:571.3
Current Trading Positions for iShares Dow Jones US Telecommunications Sector Index Fund ETF (IYZ) Daily on 12-Feb-2016
* A Primary degree trader (hold positions from months to years), would currently be shorting this market. The probability of this Target Area being correct is 78.1%. However, the random probability of this Target Area being correct is 64.0%. So the true probability of this Target Area being correct is 22.0% better than random.
Extensive Elliott Commentary for iShares Dow Jones US Telecommunications Sector Index Fund ETF (IYZ) Daily on 12-Feb-2016 with one incomplete pattern:
Wave D of the Primary degree inverted Contracting Triangle with a rating of 571.3 is expected to complete in the price range 24.65 to 26.42, but more probably between 24.68 and 25.73. This wave is due to complete anytime from now until 15-Mar-2016, but is most likely to complete before 26-Feb-2016.
Once this wave D is complete, expect the market to continue up to the end of wave E, which will most probably be a ZigZag family pattern or possibly a Contracting Triangle. Expect wave E to have between 39% and 66% of the price range of wave C and complete in 4% to 60% of the time taken by wave C. Expect also that wave E will have between 21% and 47% of the price range of wave A and complete in 2% to 24% of the time taken by wave A. The slope (ie. price range divided by time taken) of wave E should be between 28% and 143% of the slope of wave C and between 19% to 183% of the slope of wave A. Wave E will complete this Contracting Triangle.
Current Analysis Settings: Analysis Date Range: 17-Jun-2014 to 12-Feb-2016, Label Range: 15 - 50, Preferred Count Labels: 17, Min Rating: 75, Stocks toggle ON, Bias Towards Beginning of Data: 8, Bias Towards Major High/Low: 8, Largest Degree Wave Filter: Any Pattern
Rating:81.8
Current Trading Positions for iShares Dow Jones US Utilities Sector Index Fund ETF (IDU) Daily on 12-Feb-2016
* A Minor degree trader (hold positions from weeks to quarters), would currently be trading long in this market. The probability of this Target Area being correct is 87.6%. However, the random probability of this Target Area being correct is 64.1%. So the true probability of this Target Area being correct is 36.7% better than random.
* An Intermediate degree trader (hold positions from months to quarters), would currently be trading long in this market. The probability of this Target Area being correct is 43.4%. However, the random probability of this Target Area being correct is 34.0%. So the true probability of this Target Area being correct is 27.6% better than random.
* A Primary degree trader (hold positions from months to years), would currently be shorting this market. The probability of this Target Area being correct is 39.5%. However, the random probability of this Target Area being correct is 34.0%. So the true probability of this Target Area being correct is 16.2% better than random.
* A Cycle degree trader (hold positions from quarters to years), would currently be trading long in this market. The probability of this Target Area being correct is 78.4%. However, the random probability of this Target Area being correct is 65.0%. So the true probability of this Target Area being correct is 20.6% better than random.
Extensive Elliott Commentary for iShares Dow Jones US Utilities Sector Index Fund ETF (IDU) Daily on 12-Feb-2016 with four incomplete patterns:
Wave Y of the Minor degree inverted Double 3 with a rating of 106.1 is expected to complete in the price range 105.92 to 128.92, but more probably between 109.7 and 116.5. This wave is due to complete anytime from now until 19-Apr-2016, but is most likely to complete before 07-Mar-2016.
Wave Y will probably complete this Double Sideways pattern, although it could possibly extend into a Triple Sideways pattern.
This is the final wave in the pattern. When complete it will also complete wave (B) of the Intermediate degree Flat with a rating of 88.9. These two waves have the same target ranges.
After wave (B) is complete, expect the market to continue down into wave (C), which should be a five wave Impulsive pattern. Expect wave (C) to retrace wave (B) by 86% - 162%. Wave (C) can also be expected to be 90% - 162% of the price length of wave (A). The expected time for wave (C) to complete is 19% - 134% of the time taken for wave (B) to complete and 24% - 115% of the time taken for wave (A) to complete.
Wave B of the Primary degree inverted Flat with a rating of 75.5 is expected to complete in the price range 89.62 to 107.06, but more probably between 102.2 and 106.84. This wave was expected to complete before 12-Oct-2015, and must complete by 17-Jun-2016.
After wave B is complete, expect the market to continue up into wave C, which should be a five wave Impulsive pattern. Expect wave C to retrace wave B by 82% - 177%. Wave C can also be expected to be 89% - 177% of the price length of wave A. The expected time for wave C to complete is 15% - 160% of the time taken for wave B to complete and 16% - 118% of the time taken for wave A to complete.
Wave x of the Cycle degree Double Zigzag with a rating of 81.8 is expected to complete in the price range 107.23 to 124.63, but more probably between 112.11 and 121.02. This wave was expected to complete before 25-Jan-2016, and must complete by 07-Feb-2017.
After wave x is complete, expect the market to continue down into wave y, which should be a three wave Zigzag pattern. Expect wave y to retrace wave x by 117% - 263%. Wave y can also be expected to be 90% - 263% of the price length of wave w. The expected time for wave y to complete is 21% - 161% of the time taken for wave x to complete and 27% - 154% of the time taken for wave w to complete.
Current Analysis Settings: Analysis Date Range: 06-Dec-2013 to 12-Feb-2016, Label Range: 15 - 50, Preferred Count Labels: 31, Min Rating: 75, Stocks toggle ON, Bias Towards Beginning of Data: 8, Bias Towards Major High/Low: 8, Largest Degree Wave Filter: Any Pattern
Rating:82.4
Current Trading Positions for iShares Floating Rate Note Fund (FLOT) Daily on 12-Feb-2016
* A Primary degree trader (hold positions from months to years), would currently be trading long in this market. The probability of this Target Area being correct is 88.6%. However, the random probability of this Target Area being correct is 80.4%. So the true probability of this Target Area being correct is 10.2% better than random.
* A Cycle degree trader (hold positions from quarters to years), would currently be shorting this market. The probability of this Target Area being correct is 50.2%. However, the random probability of this Target Area being correct is 45.0%. So the true probability of this Target Area being correct is 11.6% better than random.
Extensive Elliott Commentary for iShares Floating Rate Note Fund (FLOT) Daily on 12-Feb-2016 with two incomplete patterns:
Wave 4 of the Primary degree inverted Ending Diagonal with a rating of 93.5 is expected to complete in the price range 50.36 to 50.39, but more probably between 50.38 and 50.39. This wave is due to complete anytime from now until 22-Mar-2016, but is most likely to complete before 18-Feb-2016.
Expect this wave 4 to complete in the price range of wave 2, and then continue down to the end of wave 5, which should be a ZigZag family three wave pattern. Expect wave 5 to have between 52% and 92% of the price range of wave 3 and complete in 20% to 64% of the time taken by wave 3. Expect also that wave 5 will have between 31% and 73% of the price range of wave 1 and complete in 3% to 22% of the time taken by wave 1. The slope (ie. price range divided by time taken) of wave 5 should be between 49% and 173% of the slope of wave 3 and between 77% to 312% of the slope of wave 1. Wave 5 will complete this Ending Diagonal pattern.
Wave c of the Cycle degree Zigzag with a rating of 82.4 is expected to complete in the price range 49.54 to 50.33, but more probably between 50.08 and 50.31. This wave is due to complete anytime from now until 24-Feb-2017, but is most likely to complete before 04-Apr-2016.
This wave c will complete the ZigZag pattern.
Current Analysis Settings: Analysis Date Range: 18-Aug-2014 to 12-Feb-2016, Label Range: 15 - 50, Preferred Count Labels: 17, Min Rating: 75, Stocks toggle ON, Bias Towards Beginning of Data: 8, Bias Towards Major High/Low: 8, Largest Degree Wave Filter: Any Pattern
Rating:86.9
Current Trading Positions for iShares FTSE EPRA/NAREIT Global Real Estate EX-US Index Fund ETF (IFGL) Daily on 12-Feb-2016
* A Primary degree trader (hold positions from months to years), would currently be shorting this market. The probability of this Target Area being correct is 64.7%. However, the random probability of this Target Area being correct is 45.0%. So the true probability of this Target Area being correct is 43.8% better than random.
* A Cycle degree trader (hold positions from quarters to years), would currently be shorting this market. The probability of this Target Area being correct is 38.0%. However, the random probability of this Target Area being correct is 24.3%. So the true probability of this Target Area being correct is 56.4% better than random.
Extensive Elliott Commentary for iShares FTSE EPRA/NAREIT Global Real Estate EX-US Index Fund ETF (IFGL) Daily on 12-Feb-2016 with two incomplete patterns:
Wave C of the Primary degree Zigzag with a rating of 101.2 is expected to complete in the price range 16.43 to 25.2, but more probably between 22.1 and 24.79. This wave is due to complete anytime from now until 23-May-2016, but is most likely to complete before 03-Mar-2016.
This wave C will complete the ZigZag pattern.
This is the final wave in the pattern. When complete it will also complete wave y of the Cycle degree Double Zigzag with a rating of 86.9. These two waves have the same target ranges.
Wave y will probably complete this Double Sharp pattern, although it could possibly extend into a Triple Sharp pattern.
Current Analysis Settings: Analysis Date Range: 06-Dec-2013 to 12-Feb-2016, Label Range: 15 - 50, Preferred Count Labels: 34, Min Rating: 75, Stocks toggle ON, Bias Towards Beginning of Data: 8, Bias Towards Major High/Low: 8, Largest Degree Wave Filter: Any Pattern
Rating:80.8
Current Trading Positions for iShares FTSE NAREIT Mortgage REITs Index Fund ETF (REM) Daily on 12-Feb-2016
* A Primary degree trader (hold positions from months to years), would currently be shorting this market. The probability of this Target Area being correct is 88.3%. However, the random probability of this Target Area being correct is 65.0%. So the true probability of this Target Area being correct is 35.8% better than random.
* A Cycle degree trader (hold positions from quarters to years), would currently be trading long in this market. The probability of this Target Area being correct is 41.0%. However, the random probability of this Target Area being correct is 34.0%. So the true probability of this Target Area being correct is 20.6% better than random.
Extensive Elliott Commentary for iShares FTSE NAREIT Mortgage REITs Index Fund ETF (REM) Daily on 12-Feb-2016 with two incomplete patterns:
Wave X of the Primary degree inverted Double Zigzag with a rating of 101.9 is expected to complete in the price range 7.99 to 8.94, but more probably between 8.3 and 8.77. This wave is due to complete anytime from now until 01-Apr-2016, but is most likely to complete before 24-Feb-2016.
After wave X is complete, expect the market to continue up into wave Y, which should be a three wave Zigzag pattern. Expect wave Y to retrace wave X by 128% - 319%. Wave Y can also be expected to be 90% - 319% of the price length of wave W. The expected time for wave Y to complete is 23% - 167% of the time taken for wave X to complete and 47% - 204% of the time taken for wave W to complete.
Wave b of the Cycle degree Flat with a rating of 80.8 is expected to complete in the price range 10.81 to 18.82, but more probably between 10.89 and 13.01. This wave could complete anytime between now and 22-Jan-2021, but is most likely to complete sometime between 17-Feb-2016 and 30-Sep-2016.
After wave b is complete, expect the market to continue down into wave c, which should be a five wave Impulsive pattern. Expect wave c to retrace wave b by 85% - 162%. Wave c can also be expected to be 90% - 162% of the price length of wave a. The expected time for wave c to complete is 20% - 136% of the time taken for wave b to complete and 20% - 110% of the time taken for wave a to complete.
Current Analysis Settings: Analysis Date Range: 28-Jul-2014 to 12-Feb-2016, Label Range: 15 - 50, Preferred Count Labels: 16, Min Rating: 75, Stocks toggle ON, Bias Towards Beginning of Data: 8, Bias Towards Major High/Low: 8, Largest Degree Wave Filter: Any Pattern
Rating:85.4
Current Trading Positions for iShares FTSE/Xinhua China 25 Index Fund ETF (FXI) Daily on 12-Feb-2016
* A Cycle degree trader (hold positions from quarters to years), would currently be shorting this market. The probability of this Target Area being correct is 50.5%. However, the random probability of this Target Area being correct is 45.0%. So the true probability of this Target Area being correct is 12.2% better than random.
Extensive Elliott Commentary for iShares FTSE/Xinhua China 25 Index Fund ETF (FXI) Daily on 12-Feb-2016 with two incomplete patterns:
Wave 5 of the Primary degree inverted Impulse with a rating of 91.9 is expected to complete in the price range 11.33 to 29.52, but more probably between 21.78 and 27.79. This wave is due to complete anytime from now until 08-Apr-2016, but is most likely to complete before 19-Feb-2016.
When complete, expect the overall slope (ie. price range divided by time taken) of this wave 5 to be between 48% and 200% of the slope of wave 3 and between 29% to 297% of the slope of wave 1. This wave 5 will complete the Impulse pattern.
This is the final wave in the pattern. When complete it will also complete wave c of the Cycle degree Zigzag with a rating of 85.4. These two waves have the same target ranges.
This wave c will complete the ZigZag pattern.
Current Analysis Settings: Analysis Date Range: 16-Mar-2015 to 12-Feb-2016, Label Range: 15 - 50, Preferred Count Labels: 20, Min Rating: 75, Stocks toggle ON, Bias Towards Beginning of Data: 8, Bias Towards Major High/Low: 8, Largest Degree Wave Filter: Any Pattern
Rating:103.7
Current Trading Positions for iShares Goldman Sachs Natural Resources Index Fund ETF (IGE) Daily on 12-Feb-2016
* An Intermediate degree trader (hold positions from months to quarters), would currently be trading long in this market. The probability of this Target Area being correct is 42.6%. However, the random probability of this Target Area being correct is 24.3%. So the true probability of this Target Area being correct is 75.3% better than random.
Extensive Elliott Commentary for iShares Goldman Sachs Natural Resources Index Fund ETF (IGE) Daily on 12-Feb-2016 with one incomplete pattern:
Wave (Y) of the Intermediate degree inverted Double Zigzag with a rating of 103.7 is expected to complete in the price range 27.97 to 36.56, but more probably between 28.03 and 31.33. This wave is most likely to complete sometime between 12-Feb-2016 and 25-Feb-2016 Note that it cannot complete until 12-Feb-2016 but must complete by 16-Mar-2016.
Wave (Y) will probably complete this Double Sharp pattern, although it could possibly extend into a Triple Sharp pattern.
Current Analysis Settings: Analysis Date Range: 12-May-2014 to 12-Feb-2016, Label Range: 15 - 50, Preferred Count Labels: 36, Min Rating: 75, Stocks toggle ON, Bias Towards Beginning of Data: 8, Bias Towards Major High/Low: 8, Largest Degree Wave Filter: Any Pattern
Rating:79.8
Current Trading Positions for iShares IBoxx $ High Yield Corporate Bond ETF (HYG) Daily on 12-Feb-2016
* A Primary degree trader (hold positions from months to years), would currently be shorting this market. The probability of this Target Area being correct is 65.9%. However, the random probability of this Target Area being correct is 53.0%. So the true probability of this Target Area being correct is 24.3% better than random.
* A Cycle degree trader (hold positions from quarters to years), would currently be trading long in this market. The probability of this Target Area being correct is 40.7%. However, the random probability of this Target Area being correct is 34.0%. So the true probability of this Target Area being correct is 19.7% better than random.
Extensive Elliott Commentary for iShares IBoxx $ High Yield Corporate Bond ETF (HYG) Daily on 12-Feb-2016 with two incomplete patterns:
Wave X of the Primary degree inverted Double 3 with a rating of 101.3 is expected to complete in the price range 61.37 to 78.07, but more probably between 75.49 and 76.9. This wave was expected to complete before 11-Feb-2016, and must complete by 28-Mar-2016.
After wave X is complete, expect the market to continue up into wave Y, which will probably be a three wave corrective pattern. Expect wave Y to retrace wave X by 98% - 212%. Wave Y can also be expected to be 73% - 212% of the price length of wave W. The expected time for wave Y to complete is 27% - 214% of the time taken for wave X to complete and 38% - 222% of the time taken for wave W to complete.
Wave b of the Cycle degree Flat with a rating of 79.8 is expected to complete in the price range 89.15 to 127, but more probably between 89.54 and 99.54. This wave could complete anytime between now and 22-Jul-2025, but is most likely to complete sometime between 09-Mar-2016 and 12-May-2017.
After wave b is complete, expect the market to continue down into wave c, which should be a five wave Impulsive pattern. Expect wave c to retrace wave b by 85% - 162%. Wave c can also be expected to be 90% - 162% of the price length of wave a. The expected time for wave c to complete is 20% - 136% of the time taken for wave b to complete and 20% - 110% of the time taken for wave a to complete.
Current Analysis Settings: Analysis Date Range: 12-May-2014 to 12-Feb-2016, Label Range: 15 - 50, Preferred Count Labels: 19, Min Rating: 75, Stocks toggle ON, Bias Towards Beginning of Data: 8, Bias Towards Major High/Low: 8, Largest Degree Wave Filter: Any Pattern
Rating:75.5
Current Trading Positions for iShares Iboxx $ Investop Corp Bd (LQD) Daily on 12-Feb-2016
* An Intermediate degree trader (hold positions from months to quarters), would currently be shorting this market. The probability of this Target Area being correct is 61.8%. However, the random probability of this Target Area being correct is 45.0%. So the true probability of this Target Area being correct is 37.3% better than random.
* A Primary degree trader (hold positions from months to years), would currently be shorting this market. The probability of this Target Area being correct is 55.4%. However, the random probability of this Target Area being correct is 53.0%. So the true probability of this Target Area being correct is 4.5% better than random.
* A Cycle degree trader (hold positions from quarters to years), would currently be trading long in this market. The probability of this Target Area being correct is 39.5%. However, the random probability of this Target Area being correct is 34.0%. So the true probability of this Target Area being correct is 16.2% better than random.
Extensive Elliott Commentary for iShares Iboxx $ Investop Corp Bd (LQD) Daily on 12-Feb-2016 with three incomplete patterns:
Wave (C) of the Intermediate degree Zigzag with a rating of 98.7 is expected to complete in the price range 106.33 to 114.65, but more probably between 111.68 and 114.26. This wave was expected to complete before 11-Jan-2016, and must complete by 13-Apr-2016.
This wave (C) will complete the ZigZag pattern.
This is the final wave in the pattern. When complete it will also complete wave X of the Primary degree inverted Double 3 with a rating of 83. These two waves have the same target ranges.
After wave X is complete, expect the market to continue up into wave Y, which will probably be a three wave corrective pattern. Expect wave Y to retrace wave X by 98% - 227%. Wave Y can also be expected to be 71% - 227% of the price length of wave W. The expected time for wave Y to complete is 28% - 231% of the time taken for wave X to complete and 16% - 135% of the time taken for wave W to complete.
Wave b of the Cycle degree Flat with a rating of 75.5 is expected to complete in the price range 121.02 to 138.52, but more probably between 121.2 and 125.78. This wave was expected to complete before 18-Nov-2015, and must complete by 20-Oct-2017.
After wave b is complete, expect the market to continue down into wave c, which should be a five wave Impulsive pattern. Expect wave c to retrace wave b by 86% - 162%. Wave c can also be expected to be 90% - 162% of the price length of wave a. The expected time for wave c to complete is 19% - 134% of the time taken for wave b to complete and 24% - 115% of the time taken for wave a to complete.
Current Analysis Settings: Analysis Date Range: 17-Dec-2014 to 12-Feb-2016, Label Range: 15 - 50, Preferred Count Labels: 24, Min Rating: 75, Stocks toggle ON, Bias Towards Beginning of Data: 8, Bias Towards Major High/Low: 8, Largest Degree Wave Filter: Any Pattern
Rating:77.4
Current Trading Positions for iShares JPMorgan USD Emerging Markets Bond Fund ETF (EMB) Daily on 12-Feb-2016
* An Intermediate degree trader (hold positions from months to quarters), would currently be shorting this market. The probability of this Target Area being correct is 64.5%. However, the random probability of this Target Area being correct is 45.0%. So the true probability of this Target Area being correct is 43.3% better than random.
* A Primary degree trader (hold positions from months to years), would currently be shorting this market. The probability of this Target Area being correct is 40.7%. However, the random probability of this Target Area being correct is 34.0%. So the true probability of this Target Area being correct is 19.7% better than random.
* A Cycle degree trader (hold positions from quarters to years), would currently be trading long in this market. The probability of this Target Area being correct is 54.8%. However, the random probability of this Target Area being correct is 53.0%. So the true probability of this Target Area being correct is 3.4% better than random.
Extensive Elliott Commentary for iShares JPMorgan USD Emerging Markets Bond Fund ETF (EMB) Daily on 12-Feb-2016 with three incomplete patterns:
Wave (C) of the Intermediate degree Zigzag with a rating of 100.5 is expected to complete in the price range 90.12 to 103.44, but more probably between 99.47 and 103.23. This wave is due to complete anytime from now until 07-Apr-2016, but is most likely to complete before 11-Mar-2016.
This wave (C) will complete the ZigZag pattern.
This is the final wave in the pattern. When complete it will also complete wave B of the Primary degree inverted Flat with a rating of 79.8. These two waves have the same target ranges.
After wave B is complete, expect the market to continue up into wave C, which should be a five wave Impulsive pattern. Expect wave C to retrace wave B by 82% - 177%. Wave C can also be expected to be 89% - 177% of the price length of wave A. The expected time for wave C to complete is 15% - 160% of the time taken for wave B to complete and 16% - 118% of the time taken for wave A to complete.
Wave x of the Cycle degree Double 3 with a rating of 77.4 is expected to complete in the price range 111.6 to 163.65, but more probably between 111.9 and 116.51. This wave is due to complete anytime from now until 26-Sep-2018, but is most likely to complete before 13-Apr-2016.
After wave x is complete, expect the market to continue down into wave y, which will probably be a three wave corrective pattern. Expect wave y to retrace wave x by 98% - 192%. Wave y can also be expected to be 76% - 192% of the price length of wave w. The expected time for wave y to complete is 20% - 179% of the time taken for wave x to complete and 12% - 112% of the time taken for wave w to complete.
Current Analysis Settings: Analysis Date Range: 11-Jun-2014 to 12-Feb-2016, Label Range: 15 - 50, Preferred Count Labels: 20, Min Rating: 75, Stocks toggle ON, Bias Towards Beginning of Data: 8, Bias Towards Major High/Low: 8, Largest Degree Wave Filter: Any Pattern
Rating:91.2
Current Trading Positions for iShares MSCI ACWI Index Fund ETF (ACWI) Daily on 12-Feb-2016
* A Cycle degree trader (hold positions from quarters to years), would currently be shorting this market. The probability of this Target Area being correct is 40.2%. However, the random probability of this Target Area being correct is 24.3%. So the true probability of this Target Area being correct is 65.4% better than random.
Extensive Elliott Commentary for iShares MSCI ACWI Index Fund ETF (ACWI) Daily on 12-Feb-2016 with one incomplete pattern:
Wave y of the Cycle degree Double Zigzag with a rating of 91.2 is expected to complete in the price range 40.04 to 43.74, but more probably between 41.89 and 43.58. This wave is most likely to complete sometime between 25-Feb-2016 and 29-Apr-2016 Note that it cannot complete until 23-Feb-2016 but must complete by 06-Jun-2016.
Wave y will probably complete this Double Sharp pattern, although it could possibly extend into a Triple Sharp pattern.
Current Analysis Settings: Analysis Date Range: 10-Apr-2015 to 12-Feb-2016, Label Range: 15 - 50, Preferred Count Labels: 24, Min Rating: 75, Stocks toggle ON, Bias Towards Beginning of Data: 8, Bias Towards Major High/Low: 8, Largest Degree Wave Filter: Any Pattern
Rating:81.1
Current Trading Positions for iShares MSCI All Country Asia ex Japan Index (AAXJ) Daily on 12-Feb-2016
* A Primary degree trader (hold positions from months to years), would currently be shorting this market. The probability of this Target Area being correct is 50.2%. However, the random probability of this Target Area being correct is 34.0%. So the true probability of this Target Area being correct is 47.6% better than random.
* A Cycle degree trader (hold positions from quarters to years), would currently be trading long in this market. The probability of this Target Area being correct is 86.2%. However, the random probability of this Target Area being correct is 80.4%. So the true probability of this Target Area being correct is 7.2% better than random.
Extensive Elliott Commentary for iShares MSCI All Country Asia ex Japan Index (AAXJ) Daily on 12-Feb-2016 with two incomplete patterns:
Wave B of the Primary degree inverted Flat with a rating of 102.2 is expected to complete in the price range 33.51 to 47.34, but more probably between 45.19 and 47.27. This wave is due to complete anytime from now until 08-Apr-2016, but is most likely to complete before 15-Feb-2016.
After wave B is complete, expect the market to continue up into wave C, which should be a five wave Impulsive pattern. Expect wave C to retrace wave B by 80% - 169%. Wave C can also be expected to be 99% - 169% of the price length of wave A. The expected time for wave C to complete is 19% - 187% of the time taken for wave B to complete and 56% - 268% of the time taken for wave A to complete.
Wave IV of the Cycle degree inverted Ending Diagonal with a rating of 81.1 is expected to complete in the price range 47.61 to 57.66, but more probably between 49.71 and 53.58. This wave is due to complete anytime from now until 29-Mar-2016, but is most likely to complete before 16-Feb-2016.
Expect this wave IV to complete in the price range of wave 2, and then continue down to the end of wave V, which should be a ZigZag family three wave pattern. Expect wave V to have between 52% and 92% of the price range of wave III and complete in 20% to 64% of the time taken by wave III. Expect also that wave V will have between 31% and 73% of the price range of wave I and complete in 3% to 22% of the time taken by wave I. The slope (ie. price range divided by time taken) of wave V should be between 49% and 173% of the slope of wave III and between 77% to 312% of the slope of wave I. Wave V will complete this Ending Diagonal pattern.
Current Analysis Settings: Analysis Date Range: 16-Mar-2015 to 12-Feb-2016, Label Range: 15 - 50, Preferred Count Labels: 17, Min Rating: 75, Stocks toggle ON, Bias Towards Beginning of Data: 8, Bias Towards Major High/Low: 8, Largest Degree Wave Filter: Any Pattern
Rating:96.8
Current Trading Positions for iShares MSCI All Country World Minimum Volatility Index (ACWV) Daily on 12-Feb-2016
* A Primary degree trader (hold positions from months to years), would currently be shorting this market. The probability of this Target Area being correct is 47.6%. However, the random probability of this Target Area being correct is 34.0%. So the true probability of this Target Area being correct is 40.0% better than random.
Extensive Elliott Commentary for iShares MSCI All Country World Minimum Volatility Index (ACWV) Daily on 12-Feb-2016 with one incomplete pattern:
Wave B of the Primary degree inverted Flat with a rating of 96.8 is expected to complete in the price range 61.44 to 66.54, but more probably between 65.12 and 66.48. This wave could complete anytime between now and 16-Feb-2018, but is most likely to complete sometime between 19-Feb-2016 and 23-May-2016.
After wave B is complete, expect the market to continue up into wave C, which should be a five wave Impulsive pattern. Expect wave C to retrace wave B by 82% - 177%. Wave C can also be expected to be 89% - 177% of the price length of wave A. The expected time for wave C to complete is 15% - 160% of the time taken for wave B to complete and 16% - 118% of the time taken for wave A to complete.
Current Analysis Settings: Analysis Date Range: 16-Mar-2015 to 12-Feb-2016, Label Range: 15 - 50, Preferred Count Labels: 26, Min Rating: 75, Stocks toggle ON, Bias Towards Beginning of Data: 8, Bias Towards Major High/Low: 8, Largest Degree Wave Filter: Any Pattern
Rating:98.9
Current Trading Positions for iShares MSCI All Peru Capped Index Fund (EPU) Daily on 12-Feb-2016
* An Intermediate degree trader (hold positions from months to quarters), would currently be trading long in this market. The probability of this Target Area being correct is 52.0%. However, the random probability of this Target Area being correct is 13.0%. So the true probability of this Target Area being correct is 300.0% better than random.
Extensive Elliott Commentary for iShares MSCI All Peru Capped Index Fund (EPU) Daily on 12-Feb-2016 with one incomplete pattern:
Wave (3) of the Intermediate degree Impulse with a rating of 98.9 is expected to complete in the price range 20.09 to 26.43, but more probably between 20.52 and 22.47. This wave was expected to complete before 09-Feb-2016, and must complete by 15-Feb-2016.
When complete, expect the overall slope (ie. price range divided by time taken) of this wave (3) to be between 70% to 219% of the slope of wave (1). Then expect the market to pull back into wave (4), which will be corrective in nature and has a probability of 83% of being a Flat or other sideways pattern. Wave (4) should not retrace back into the price range of wave (1) or (2). Expect wave (4) to have between 5% - 141% of the price range of wave (2). The expected time for wave (4) to complete is between 15% - 135% of wave (2). After wave (4), expect wave (5) to move beyond the end of wave (3) to complete this Impulse.
Current Analysis Settings: Analysis Date Range: 28-May-2014 to 12-Feb-2016, Label Range: 15 - 50, Preferred Count Labels: 27, Min Rating: 75, Stocks toggle ON, Bias Towards Beginning of Data: 8, Bias Towards Major High/Low: 8, Largest Degree Wave Filter: Any Pattern
Rating:80.6
Current Trading Positions for iShares MSCI Australia Index Fund ETF (EWA) Daily on 12-Feb-2016
* A Primary degree trader (hold positions from months to years), would currently be shorting this market. The probability of this Target Area being correct is 57.0%. However, the random probability of this Target Area being correct is 45.0%. So the true probability of this Target Area being correct is 26.7% better than random.
* A Cycle degree trader (hold positions from quarters to years), would currently be trading long in this market. The probability of this Target Area being correct is 41.0%. However, the random probability of this Target Area being correct is 34.0%. So the true probability of this Target Area being correct is 20.6% better than random.
Extensive Elliott Commentary for iShares MSCI Australia Index Fund ETF (EWA) Daily on 12-Feb-2016 with two incomplete patterns:
Wave B of the Primary degree inverted Zigzag with a rating of 102.2 is expected to complete in the price range 16.08 to 17.69, but more probably between 16.76 and 17.48. This wave is due to complete anytime from now until 22-Apr-2016, but is most likely to complete before 17-Feb-2016.
After wave B is complete, expect the market to continue up into wave C, which should be a five wave impulsive pattern. Expect wave C to retrace wave B by 114% - 331%. Wave C can also be expected to be 53% - 331% of the price length of wave A. The expected time for wave C to complete is 24% - 277% of the time taken for wave B to complete and 31% - 204% of the time taken for wave A to complete.
Wave b of the Cycle degree Flat with a rating of 80.6 is expected to complete in the price range 23.85 to 45.91, but more probably between 24.08 and 29.91. This wave could complete anytime between now and 03-May-2024, but is most likely to complete sometime between 04-Mar-2016 and 13-Mar-2017.
After wave b is complete, expect the market to continue down into wave c, which should be a five wave Impulsive pattern. Expect wave c to retrace wave b by 85% - 162%. Wave c can also be expected to be 90% - 162% of the price length of wave a. The expected time for wave c to complete is 20% - 136% of the time taken for wave b to complete and 20% - 110% of the time taken for wave a to complete.
Current Analysis Settings: Analysis Date Range: 24-Jul-2014 to 12-Feb-2016, Label Range: 15 - 50, Preferred Count Labels: 28, Min Rating: 75, Stocks toggle ON, Bias Towards Beginning of Data: 8, Bias Towards Major High/Low: 8, Largest Degree Wave Filter: Any Pattern
Rating:86.4
Current Trading Positions for iShares MSCI Belgium Index Fund ETF (EWK) Daily on 12-Feb-2016
* A Primary degree trader (hold positions from months to years), would currently be shorting this market. The probability of this Target Area being correct is 65.1%. However, the random probability of this Target Area being correct is 45.0%. So the true probability of this Target Area being correct is 44.7% better than random.
* A Cycle degree trader (hold positions from quarters to years), would currently be shorting this market. The probability of this Target Area being correct is 42.8%. However, the random probability of this Target Area being correct is 34.0%. So the true probability of this Target Area being correct is 25.9% better than random.
Extensive Elliott Commentary for iShares MSCI Belgium Index Fund ETF (EWK) Daily on 12-Feb-2016 with two incomplete patterns:
Wave C of the Primary degree Zigzag with a rating of 103.7 is expected to complete in the price range 10.84 to 16.11, but more probably between 14.01 and 15.86. This wave is due to complete anytime from now until 21-Apr-2016, but is most likely to complete before 26-Feb-2016.
This wave C will complete the ZigZag pattern.
This is the final wave in the pattern. When complete it will also complete wave b of the Cycle degree inverted Flat with a rating of 86.4. These two waves have the same target ranges.
After wave b is complete, expect the market to continue up into wave c, which should be a five wave Impulsive pattern. Expect wave c to retrace wave b by 82% - 179%. Wave c can also be expected to be 67% - 179% of the price length of wave a. The expected time for wave c to complete is 20% - 151% of the time taken for wave b to complete and 11% - 58% of the time taken for wave a to complete.
Current Analysis Settings: Analysis Date Range: 05-Sep-2014 to 12-Feb-2016, Label Range: 15 - 50, Preferred Count Labels: 22, Min Rating: 75, Stocks toggle ON, Bias Towards Beginning of Data: 8, Bias Towards Major High/Low: 8, Largest Degree Wave Filter: Any Pattern
Rating:79.3
Current Trading Positions for iShares MSCI Brazil Index Fund ETF (EWZ) Daily on 12-Feb-2016
* An Intermediate degree trader (hold positions from months to quarters), would currently be shorting this market. The probability of this Target Area being correct is 67.6%. However, the random probability of this Target Area being correct is 45.0%. So the true probability of this Target Area being correct is 50.2% better than random.
Extensive Elliott Commentary for iShares MSCI Brazil Index Fund ETF (EWZ) Daily on 12-Feb-2016 with three incomplete patterns:
Wave C of the Minor degree Flat with a rating of 96.9 is expected to complete in the price range 16.08 to 19.93, but more probably between 17.55 and 19.06. This wave was expected to complete before 08-Feb-2016, and must complete by 15-Feb-2016.
This wave C will complete the Flat pattern.
This is the final wave in the pattern. When complete it will also complete wave (2) of the Intermediate degree Impulse with a rating of 78.3. These two waves have the same target ranges.
After this wave (2) is complete, expect the market to continue up into wave (3). Wave (3) should always be an Impulse and should retrace wave (2) completely. Expect wave (3) to retrace wave (2) by 164% - 383%. Wave (3) can also be expected to be 83% - 383% of the price length of wave (1). The expected time for wave (3) to complete is 87% - 367% of the time taken for wave (2) to complete and 16% - 97% of the time taken for wave (1) to complete. The slope (ie. price range divided by time taken) of wave (3) should be between 70% and 219% of the slope of wave (1). Once wave (3) is complete, expect wave (4) to be a sideways corrective movement, then wave (5) to continue in the same direction as wave (3). Wave (5) will complete this Impulse.
Wave C of the Primary degree inverted Flat with a rating of 79.3 is expected to complete in the price range 20.06 to 33.78, but more probably between 23.27 and 29.42. This wave is due to complete anytime from now until 11-May-2016, but is most likely to complete before 01-Apr-2016.
This wave C will complete the Flat pattern.
Current Analysis Settings: Analysis Date Range: 23-Jul-2014 to 12-Feb-2016, Label Range: 15 - 50, Preferred Count Labels: 49, Min Rating: 75, Stocks toggle ON, Bias Towards Beginning of Data: 8, Bias Towards Major High/Low: 8, Largest Degree Wave Filter: Any Pattern
Rating:87.6
Current Trading Positions for iShares MSCI Canada Index Fund ETF (EWC) Daily on 12-Feb-2016
* A Primary degree trader (hold positions from months to years), would currently be trading long in this market. The probability of this Target Area being correct is 64.9%. However, the random probability of this Target Area being correct is 45.0%. So the true probability of this Target Area being correct is 44.2% better than random.
* A Cycle degree trader (hold positions from quarters to years), would currently be trading long in this market. The probability of this Target Area being correct is 43.1%. However, the random probability of this Target Area being correct is 34.0%. So the true probability of this Target Area being correct is 26.8% better than random.
Extensive Elliott Commentary for iShares MSCI Canada Index Fund ETF (EWC) Daily on 12-Feb-2016 with two incomplete patterns:
Wave C of the Primary degree inverted Zigzag with a rating of 102.3 is expected to complete in the price range 21.24 to 29.38, but more probably between 21.5 and 25.23. This wave is most likely to complete sometime between 12-Feb-2016 and 29-Feb-2016 Note that it cannot complete until 12-Feb-2016 but must complete by 30-Mar-2016.
This wave C will complete the ZigZag pattern.
This is the final wave in the pattern. When complete it will also complete wave b of the Cycle degree Flat with a rating of 87.6. These two waves have the same target ranges.
After wave b is complete, expect the market to continue down into wave c, which should be a five wave Impulsive pattern. Expect wave c to retrace wave b by 85% - 162%. Wave c can also be expected to be 90% - 162% of the price length of wave a. The expected time for wave c to complete is 20% - 136% of the time taken for wave b to complete and 20% - 110% of the time taken for wave a to complete.
Current Analysis Settings: Analysis Date Range: 24-Jul-2014 to 12-Feb-2016, Label Range: 15 - 50, Preferred Count Labels: 25, Min Rating: 75, Stocks toggle ON, Bias Towards Beginning of Data: 8, Bias Towards Major High/Low: 8, Largest Degree Wave Filter: Any Pattern
Rating:97.8
Current Trading Positions for iShares MSCI Chile Index Fund ETF (ECH) Daily on 12-Feb-2016
* A Cycle degree trader (hold positions from quarters to years), would currently be trading long in this market. The probability of this Target Area being correct is 48.2%. However, the random probability of this Target Area being correct is 34.0%. So the true probability of this Target Area being correct is 41.8% better than random.
Extensive Elliott Commentary for iShares MSCI Chile Index Fund ETF (ECH) Daily on 12-Feb-2016 with one incomplete pattern:
Wave b of the Cycle degree Flat with a rating of 97.8 is expected to complete in the price range 39.75 to 70.5, but more probably between 40.06 and 48.11. This wave could complete anytime between now and 21-Feb-2020, but is most likely to complete sometime between 22-Feb-2016 and 26-Aug-2016.
After wave b is complete, expect the market to continue down into wave c, which should be a five wave Impulsive pattern. Expect wave c to retrace wave b by 86% - 162%. Wave c can also be expected to be 90% - 162% of the price length of wave a. The expected time for wave c to complete is 19% - 134% of the time taken for wave b to complete and 24% - 115% of the time taken for wave a to complete.
Current Analysis Settings: Analysis Date Range: 02-Apr-2014 to 12-Feb-2016, Label Range: 15 - 50, Preferred Count Labels: 15, Min Rating: 75, Stocks toggle ON, Bias Towards Beginning of Data: 8, Bias Towards Major High/Low: 8, Largest Degree Wave Filter: Any Pattern
Rating:83.3
Current Trading Positions for iShares MSCI China Index Fund (MCHI) Daily on 12-Feb-2016
* A Primary degree trader (hold positions from months to years), would currently be shorting this market. The probability of this Target Area being correct is 63.2%. However, the random probability of this Target Area being correct is 53.0%. So the true probability of this Target Area being correct is 19.2% better than random.
* A Cycle degree trader (hold positions from quarters to years), would currently be trading long in this market. The probability of this Target Area being correct is 86.6%. However, the random probability of this Target Area being correct is 80.4%. So the true probability of this Target Area being correct is 7.7% better than random.
Extensive Elliott Commentary for iShares MSCI China Index Fund (MCHI) Daily on 12-Feb-2016 with two incomplete patterns:
Wave X of the Primary degree inverted Double 3 with a rating of 98.8 is expected to complete in the price range 25.85 to 38.27, but more probably between 36.35 and 37.41. This wave was expected to complete before 11-Feb-2016, and must complete by 28-Mar-2016.
After wave X is complete, expect the market to continue up into wave Y, which will probably be a three wave corrective pattern. Expect wave Y to retrace wave X by 98% - 212%. Wave Y can also be expected to be 73% - 212% of the price length of wave W. The expected time for wave Y to complete is 27% - 214% of the time taken for wave X to complete and 38% - 222% of the time taken for wave W to complete.
Wave IV of the Cycle degree inverted Ending Diagonal with a rating of 83.3 is expected to complete in the price range 39.77 to 48.72, but more probably between 41.06 and 46.06. This wave is due to complete anytime from now until 07-Jun-2016, but is most likely to complete before 19-Feb-2016.
Expect this wave IV to complete in the price range of wave 2, and then continue down to the end of wave V, which should be a ZigZag family three wave pattern. Expect wave V to have between 52% and 91% of the price range of wave III and complete in 18% to 62% of the time taken by wave
III. Expect also that wave V will have between 31% and 72% of the price range of wave I and complete in 3% to 22% of the time taken by wave I. The slope (ie. price range divided by time taken) of wave V should be between 49% and 173% of the slope of wave III and between 77% to 312% of the slope of wave I. Wave V will complete this Ending Diagonal pattern.
Current Analysis Settings: Analysis Date Range: 16-Mar-2015 to 12-Feb-2016, Label Range: 15 - 50, Preferred Count Labels: 16, Min Rating: 75, Stocks toggle ON, Bias Towards Beginning of Data: 8, Bias Towards Major High/Low: 8, Largest Degree Wave Filter: Any Pattern
Rating:86.9
Current Trading Positions for iShares MSCI EAFE Growth Index Fund ETF (EFG) Daily on 12-Feb-2016
* A Minor degree trader (hold positions from weeks to quarters), would currently be shorting this market. The probability of this Target Area being correct is 50.0%. However, the random probability of this Target Area being correct is 34.0%. So the true probability of this Target Area being correct is 47.1% better than random.
* An Intermediate degree trader (hold positions from months to quarters), would currently be trading long in this market. The probability of this Target Area being correct is 85.6%. However, the random probability of this Target Area being correct is 64.1%. So the true probability of this Target Area being correct is 33.5% better than random.
Extensive Elliott Commentary for iShares MSCI EAFE Growth Index Fund ETF (EFG) Daily on 12-Feb-2016 with two incomplete patterns:
Wave B of the Minor degree inverted Flat with a rating of 100.4 is expected to complete in the price range 54.21 to 59.89, but more probably between 58.98 and 59.84. This wave was expected to complete before 12-Feb-2016, and must complete by 19-Feb-2016.
After wave B is complete, expect the market to continue up into wave C, which should be a five wave Impulsive pattern. Expect wave C to retrace wave B by 83% - 173%. Wave C can also be expected to be 101% - 173% of the price length of wave A. The expected time for wave C to complete is 20% - 190% of the time taken for wave B to complete and 57% - 279% of the time taken for wave A to complete.
Wave (Y) of the Intermediate degree inverted Double 3 with a rating of 86.9 is expected to complete in the price range 59.78 to 83.31, but more probably between 63.55 and 69.66. This wave is due to complete anytime from now until 09-Mar-2016, but is most likely to complete before 24-Feb-2016.
Wave (Y) will probably complete this Double Sideways pattern, although it could possibly extend into a Triple Sideways pattern.
Current Analysis Settings: Analysis Date Range: 10-Apr-2015 to 12-Feb-2016, Label Range: 15 - 50, Preferred Count Labels: 44, Min Rating: 75, Stocks toggle ON, Bias Towards Beginning of Data: 8, Bias Towards Major High/Low: 8, Largest Degree Wave Filter: Any Pattern
Rating:87.3
Current Trading Positions for iShares MSCI EAFE Index Fund ETF (EFA) Daily on 12-Feb-2016
* A Primary degree trader (hold positions from months to years), would currently be shorting this market. The probability of this Target Area being correct is 65.1%. However, the random probability of this Target Area being correct is 45.0%. So the true probability of this Target Area being correct is 44.7% better than random.
* A Cycle degree trader (hold positions from quarters to years), would currently be shorting this market. The probability of this Target Area being correct is 38.5%. However, the random probability of this Target Area being correct is 24.3%. So the true probability of this Target Area being correct is 58.4% better than random.
Extensive Elliott Commentary for iShares MSCI EAFE Index Fund ETF (EFA) Daily on 12-Feb-2016 with two incomplete patterns:
Wave C of the Primary degree Zigzag with a rating of 104 is expected to complete in the price range 35.36 to 52.21, but more probably between 46.2 and 51.87. This wave is due to complete anytime from now until 18-Apr-2016, but is most likely to complete before 14-Mar-2016.
This wave C will complete the ZigZag pattern.
This is the final wave in the pattern. When complete it will also complete wave y of the Cycle degree Double Zigzag with a rating of 87.3. These two waves have the same target ranges.
Wave y will probably complete this Double Sharp pattern, although it could possibly extend into a Triple Sharp pattern.
Current Analysis Settings: Analysis Date Range: 08-May-2014 to 12-Feb-2016, Label Range: 15 - 50, Preferred Count Labels: 20, Min Rating: 75, Stocks toggle ON, Bias Towards Beginning of Data: 8, Bias Towards Major High/Low: 8, Largest Degree Wave Filter: Any Pattern
Rating:86.7
Current Trading Positions for iShares MSCI EAFE Minimum Volatility Index (EFAV) Daily on 12-Feb-2016
* An Intermediate degree trader (hold positions from months to quarters), would currently be shorting this market. The probability of this Target Area being correct is 41.8%. However, the random probability of this Target Area being correct is 24.3%. So the true probability of this Target Area being correct is 72.0% better than random.
* A Primary degree trader (hold positions from months to years), would currently be shorting this market. The probability of this Target Area being correct is 40.4%. However, the random probability of this Target Area being correct is 34.0%. So the true probability of this Target Area being correct is 18.8% better than random.
* A Cycle degree trader (hold positions from quarters to years), would currently be trading long in this market. The probability of this Target Area being correct is 85.6%. However, the random probability of this Target Area being correct is 64.1%. So the true probability of this Target Area being correct is 33.5% better than random.
Extensive Elliott Commentary for iShares MSCI EAFE Minimum Volatility Index (EFAV) Daily on 12-Feb-2016 with three incomplete patterns:
Wave (Y) of the Intermediate degree Double Zigzag with a rating of 99.5 is expected to complete in the price range 40.43 to 57.45, but more probably between 52.81 and 57.34. This wave is most likely to complete sometime between 17-Feb-2016 and 08-Mar-2016 Note that it cannot complete until 16-Feb-2016 but must complete by 25-Mar-2016.
Wave (Y) will probably complete this Double Sharp pattern, although it could possibly extend into a Triple Sharp pattern.
This is the final wave in the pattern. When complete it will also complete wave B of the Primary degree inverted Flat with a rating of 78. These two waves have the same target ranges.
After wave B is complete, expect the market to continue up into wave C, which should be a five wave Impulsive pattern. Expect wave C to retrace wave B by 82% - 177%. Wave C can also be expected to be 89% - 177% of the price length of wave A. The expected time for wave C to complete is 15% - 160% of the time taken for wave B to complete and 16% - 118% of the time taken for wave A to complete.
Wave y of the Cycle degree inverted Double 3 with a rating of 86.7 is expected to complete in the price range 61.09 to 105.64, but more probably between 64.48 and 78.58. This wave is due to complete anytime from now until 23-Sep-2016, but is most likely to complete before 27-Apr-2016.
Wave y will probably complete this Double Sideways pattern, although it could possibly extend into a Triple Sideways pattern.
Current Analysis Settings: Analysis Date Range: 19-Dec-2013 to 12-Feb-2016, Label Range: 15 - 50, Preferred Count Labels: 21, Min Rating: 75, Stocks toggle ON, Bias Towards Beginning of Data: 8, Bias Towards Major High/Low: 8, Largest Degree Wave Filter: Any Pattern
Rating:88.2
Current Trading Positions for iShares MSCI EAFE Small Cap Index Fund ETF (SCZ) Daily on 12-Feb-2016
* An Intermediate degree trader (hold positions from months to quarters), would currently be trading long in this market. The probability of this Target Area being correct is 85.8%. However, the random probability of this Target Area being correct is 64.1%. So the true probability of this Target Area being correct is 33.9% better than random.
Extensive Elliott Commentary for iShares MSCI EAFE Small Cap Index Fund ETF (SCZ) Daily on 12-Feb-2016 with two incomplete patterns:
Wave C of the Minor degree inverted Flat with a rating of 103.7 is expected to complete in the price range 43.65 to 46.2, but more probably between 44.34 and 45.33. This wave is due to complete anytime from now until 19-Feb-2016, but is most likely to complete before 12-Feb-2016.
This wave C will complete the Flat pattern.
This is the final wave in the pattern. When complete it will also complete wave (Y) of the Intermediate degree inverted Double 3 with a rating of 88.2. These two waves have the same target ranges.
Wave (Y) will probably complete this Double Sideways pattern, although it could possibly extend into a Triple Sideways pattern.
Current Analysis Settings: Analysis Date Range: 06-Apr-2015 to 12-Feb-2016, Label Range: 15 - 50, Preferred Count Labels: 45, Min Rating: 75, Stocks toggle ON, Bias Towards Beginning of Data: 8, Bias Towards Major High/Low: 8, Largest Degree Wave Filter: Any Pattern
Rating:92.4
Current Trading Positions for iShares MSCI Emerging Markets Minimum Volatility Index (EEMV) Daily on 12-Feb-2016
* An Intermediate degree trader (hold positions from months to quarters), would currently be shorting this market. The probability of this Target Area being correct is 83.2%. However, the random probability of this Target Area being correct is 65.0%. So the true probability of this Target Area being correct is 28.0% better than random.
Extensive Elliott Commentary for iShares MSCI Emerging Markets Minimum Volatility Index (EEMV) Daily on 12-Feb-2016 with two incomplete patterns:
Wave C of the Minor degree Flat with a rating of 102.6 is expected to complete in the price range 43.61 to 46.05, but more probably between 44.17 and 45.33. This wave is due to complete anytime from now until 09-Mar-2016, but is most likely to complete before 18-Feb-2016.
This wave C will complete the Flat pattern.
This is the final wave in the pattern. When complete it will also complete wave (X) of the Intermediate degree inverted Double Zigzag with a rating of 92.4. These two waves have the same target ranges.
After wave (X) is complete, expect the market to continue up into wave (Y), which should be a three wave Zigzag pattern. Expect wave (Y) to retrace wave (X) by 128% - 319%. Wave (Y) can also be expected to be 90% - 319% of the price length of wave (W). The expected time for wave (Y) to complete is 23% - 167% of the time taken for wave (X) to complete and 47% - 204% of the time taken for wave (W) to complete.
Current Analysis Settings: Analysis Date Range: 17-Mar-2015 to 12-Feb-2016, Label Range: 15 - 50, Preferred Count Labels: 29, Min Rating: 75, Stocks toggle ON, Bias Towards Beginning of Data: 8, Bias Towards Major High/Low: 8, Largest Degree Wave Filter: Any Pattern
Rating:79.5
Current Trading Positions for iShares MSCI EMU Index Fund ETF (EZU) Daily on 12-Feb-2016
* A Primary degree trader (hold positions from months to years), would currently be shorting this market. The probability of this Target Area being correct is 49.7%. However, the random probability of this Target Area being correct is 45.0%. So the true probability of this Target Area being correct is 10.4% better than random.
* A Cycle degree trader (hold positions from quarters to years), would currently be shorting this market. The probability of this Target Area being correct is 34.5%. However, the random probability of this Target Area being correct is 24.3%. So the true probability of this Target Area being correct is 42.0% better than random.
Extensive Elliott Commentary for iShares MSCI EMU Index Fund ETF (EZU) Daily on 12-Feb-2016 with three incomplete patterns:
Wave (5) of the Intermediate degree inverted Impulse with a rating of 93.3 is expected to complete in the price range 18.76 to 32.1, but more probably between 27.62 and 31.18. This wave is due to complete anytime from now until 18-Apr-2016, but is most likely to complete before 19-Feb-2016.
When complete, expect the overall slope (ie. price range divided by time taken) of this wave (5) to be between 48% and 200% of the slope of wave (3) and between 29% to 297% of the slope of wave (1). This wave (5) will complete the Impulse pattern.
This is the final wave in the pattern. When complete it will also complete wave C of the Primary degree Zigzag with a rating of 77.5. These two waves have the same target ranges.
This wave C will complete the ZigZag pattern.
This is the final wave in the pattern. When complete it will also complete wave y of the Cycle degree Double Zigzag with a rating of 79.5. These two waves have the same target ranges.
Wave y will probably complete this Double Sharp pattern, although it could possibly extend into a Triple Sharp pattern.
Current Analysis Settings: Analysis Date Range: 25-Apr-2014 to 12-Feb-2016, Label Range: 15 - 50, Preferred Count Labels: 33, Min Rating: 75, Stocks toggle ON, Bias Towards Beginning of Data: 8, Bias Towards Major High/Low: 8, Largest Degree Wave Filter: Any Pattern
Rating:102.5
Current Trading Positions for iShares MSCI Europe Financials (EUFN) Daily on 12-Feb-2016
* An Intermediate degree trader (hold positions from months to quarters), would currently be shorting this market. The probability of this Target Area being correct is 88.6%. However, the random probability of this Target Area being correct is 65.0%. So the true probability of this Target Area being correct is 36.3% better than random.
Extensive Elliott Commentary for iShares MSCI Europe Financials (EUFN) Daily on 12-Feb-2016 with one incomplete pattern:
Wave (X) of the Intermediate degree inverted Double Zigzag with a rating of 102.5 is expected to complete in the price range 15.93 to 16.65, but more probably between 16.09 and 16.43. This wave was expected to complete before 12-Feb-2016, and must complete by 15-Feb-2016.
After wave (X) is complete, expect the market to continue up into wave (Y), which should be a three wave Zigzag pattern. Expect wave (Y) to retrace wave (X) by 123% - 305%. Wave (Y) can also be expected to be 91% - 305% of the price length of wave (W). The expected time for wave (Y) to complete is 28% - 154% of the time taken for wave (X) to complete and 86% - 284% of the time taken for wave (W) to complete.
Current Analysis Settings: Analysis Date Range: 25-Apr-2014 to 12-Feb-2016, Label Range: 15 - 50, Preferred Count Labels: 24, Min Rating: 75, Stocks toggle ON, Bias Towards Beginning of Data: 8, Bias Towards Major High/Low: 8, Largest Degree Wave Filter: Any Pattern
Rating:96.2
Current Trading Positions for iShares MSCI France Index Fund ETF (EWQ) Daily on 12-Feb-2016
* An Intermediate degree trader (hold positions from months to quarters), would currently be shorting this market. The probability of this Target Area being correct is 50.3%. However, the random probability of this Target Area being correct is 34.0%. So the true probability of this Target Area being correct is 47.9% better than random.
* A Primary degree trader (hold positions from months to years), would currently be trading long in this market. The probability of this Target Area being correct is 53.0%. However, the random probability of this Target Area being correct is 45.0%. So the true probability of this Target Area being correct is 17.8% better than random.
* A Cycle degree trader (hold positions from quarters to years), would currently be shorting this market. The probability of this Target Area being correct is 41.2%. However, the random probability of this Target Area being correct is 24.3%. So the true probability of this Target Area being correct is 69.5% better than random.
Extensive Elliott Commentary for iShares MSCI France Index Fund ETF (EWQ) Daily on 12-Feb-2016 with three incomplete patterns:
Wave (B) of the Intermediate degree inverted Flat with a rating of 103 is expected to complete in the price range 15.08 to 22.1, but more probably between 21 and 22.06. This wave is due to complete anytime from now until 19-Apr-2016, but is most likely to complete before 18-Feb-2016.
After wave (B) is complete, expect the market to continue up into wave (C), which should be a five wave Impulsive pattern. Expect wave (C) to retrace wave (B) by 80% - 169%. Wave (C) can also be expected to be 99% - 169% of the price length of wave (A). The expected time for wave (C) to complete is 19% - 187% of the time taken for wave (B) to complete and 56% - 268% of the time taken for wave (A) to complete.
Wave B of the Primary degree Zigzag with a rating of 90.4 is expected to complete in the price range 21.63 to 26.41, but more probably between 22.1 and 23.9. This wave is due to complete anytime from now until 26-Apr-2017, but is most likely to complete before 14-Mar-2016.
After wave B is complete, expect the market to continue down into wave C, which should be a five wave impulsive pattern. Expect wave C to retrace wave B by 96% - 215%. Wave C can also be expected to be 33% - 215% of the price length of wave A. The expected time for wave C to complete is 22% - 199% of the time taken for wave B to complete and 24% - 111% of the time taken for wave A to complete.
Wave y of the Cycle degree Double Zigzag with a rating of 96.2 is expected to complete in the price range 11.63 to 19.76, but more probably between 17.47 and 19.65. This wave is due to complete anytime from now until 28-Nov-2017, but is most likely to complete before 29-Aug-2016.
Wave y will probably complete this Double Sharp pattern, although it could possibly extend into a Triple Sharp pattern.
Current Analysis Settings: Analysis Date Range: 25-Apr-2014 to 12-Feb-2016, Label Range: 15 - 50, Preferred Count Labels: 17, Min Rating: 75, Stocks toggle ON, Bias Towards Beginning of Data: 8, Bias Towards Major High/Low: 8, Largest Degree Wave Filter: Any Pattern
Rating:80.6
Current Trading Positions for iShares MSCI Frontier 100 Index (FM) Daily on 12-Feb-2016
* A Primary degree trader (hold positions from months to years), would currently be shorting this market. The probability of this Target Area being correct is 65.9%. However, the random probability of this Target Area being correct is 53.0%. So the true probability of this Target Area being correct is 24.3% better than random.
* A Cycle degree trader (hold positions from quarters to years), would currently be trading long in this market. The probability of this Target Area being correct is 78.0%. However, the random probability of this Target Area being correct is 65.0%. So the true probability of this Target Area being correct is 20.0% better than random.
Extensive Elliott Commentary for iShares MSCI Frontier 100 Index (FM) Daily on 12-Feb-2016 with two incomplete patterns:
Wave X of the Primary degree inverted Double 3 with a rating of 101.6 is expected to complete in the price range 12.65 to 23, but more probably between 21.4 and 22.28. This wave is due to complete anytime from now until 10-May-2016, but is most likely to complete before 23-Feb-2016.
After wave X is complete, expect the market to continue up into wave Y, which will probably be a three wave corrective pattern. Expect wave Y to retrace wave X by 98% - 212%. Wave Y can also be expected to be 73% - 212% of the price length of wave W. The expected time for wave Y to complete is 27% - 214% of the time taken for wave X to complete and 38% - 222% of the time taken for wave W to complete.
Wave x of the Cycle degree Double Zigzag with a rating of 80.6 is expected to complete in the price range 23.44 to 31.79, but more probably between 25.78 and 30.16. This wave is most likely to complete sometime between 22-Mar-2016 and 20-Jan-2017 Note that it cannot complete until 17-Feb-2016 but must complete by 28-Aug-2019.
After wave x is complete, expect the market to continue down into wave y, which should be a three wave Zigzag pattern. Expect wave y to retrace wave x by 116% - 261%. Wave y can also be expected to be 90% - 261% of the price length of wave w. The expected time for wave y to complete is 21% - 160% of the time taken for wave x to complete and 25% - 152% of the time taken for wave w to complete.
Current Analysis Settings: Analysis Date Range: 25-Apr-2014 to 12-Feb-2016, Label Range: 15 - 50, Preferred Count Labels: 18, Min Rating: 75, Stocks toggle ON, Bias Towards Beginning of Data: 8, Bias Towards Major High/Low: 8, Largest Degree Wave Filter: Any Pattern
Rating:94.1
Current Trading Positions for iShares MSCI Gbl Sel Metals & Mining Prd (PICK) Daily on 12-Feb-2016
* A Minor degree trader (hold positions from weeks to quarters), would currently be trading long in this market. The probability of this Target Area being correct is 54.8%. However, the random probability of this Target Area being correct is 45.0%. So the true probability of this Target Area being correct is 21.8% better than random.
* An Intermediate degree trader (hold positions from months to quarters), would currently be shorting this market. The probability of this Target Area being correct is 46.4%. However, the random probability of this Target Area being correct is 34.0%. So the true probability of this Target Area being correct is 36.5% better than random.
Extensive Elliott Commentary for iShares MSCI Gbl Sel Metals & Mining Prd (PICK) Daily on 12-Feb-2016 with two incomplete patterns:
Wave B of the Minor degree Zigzag with a rating of 99.7 is expected to complete in the price range 7.06 to 7.87, but more probably between 7.2 and 7.52. This wave is due to complete anytime from now until 21-Mar-2016, but is most likely to complete before 17-Feb-2016.
After wave B is complete, expect the market to continue down into wave C, which should be a five wave impulsive pattern. Expect wave C to retrace wave B by 127% - 277%. Wave C can also be expected to be 43% - 277% of the price length of wave A. The expected time for wave C to complete is 20% - 191% of the time taken for wave B to complete and 55% - 221% of the time taken for wave A to complete.
Wave (B) of the Intermediate degree inverted Flat with a rating of 94.1 is expected to complete in the price range 2.07 to 6.99, but more probably between 6.23 and 6.97. This wave is due to complete anytime from now until 31-May-2016, but is most likely to complete before 01-Mar-2016.
After wave (B) is complete, expect the market to continue up into wave (C), which should be a five wave Impulsive pattern. Expect wave (C) to retrace wave (B) by 80% - 169%. Wave (C) can also be expected to be 99% - 169% of the price length of wave (A). The expected time for wave (C) to complete is 19% - 187% of the time taken for wave (B) to complete and 56% - 268% of the time taken for wave (A) to complete.
Current Analysis Settings: Analysis Date Range: 18-Jun-2014 to 12-Feb-2016, Label Range: 15 - 50, Preferred Count Labels: 32, Min Rating: 75, Stocks toggle ON, Bias Towards Beginning of Data: 8, Bias Towards Major High/Low: 8, Largest Degree Wave Filter: Any Pattern
Rating:78.8
Current Trading Positions for iShares MSCI Germany Index Fund ETF (EWG) Daily on 12-Feb-2016
* A Primary degree trader (hold positions from months to years), would currently be shorting this market. The probability of this Target Area being correct is 49.4%. However, the random probability of this Target Area being correct is 34.0%. So the true probability of this Target Area being correct is 45.3% better than random.
* A Cycle degree trader (hold positions from quarters to years), would currently be trading long in this market. The probability of this Target Area being correct is 84.8%. However, the random probability of this Target Area being correct is 64.1%. So the true probability of this Target Area being correct is 32.3% better than random.
Extensive Elliott Commentary for iShares MSCI Germany Index Fund ETF (EWG) Daily on 12-Feb-2016 with two incomplete patterns:
Wave B of the Primary degree inverted Flat with a rating of 99.5 is expected to complete in the price range 17.66 to 23.57, but more probably between 22.62 and 23.52. This wave was expected to complete before 10-Feb-2016, and must complete by 18-Mar-2016.
After wave B is complete, expect the market to continue up into wave C, which should be a five wave Impulsive pattern. Expect wave C to retrace wave B by 83% - 173%. Wave C can also be expected to be 101% - 173% of the price length of wave A. The expected time for wave C to complete is 20% - 190% of the time taken for wave B to complete and 57% - 279% of the time taken for wave A to complete.
Wave y of the Cycle degree inverted Double 3 with a rating of 78.8 is expected to complete in the price range 25 to 35.69, but more probably between 25 and 29.53. This wave is most likely to complete sometime between 19-Feb-2016 and 29-Jun-2016 Note that it cannot complete until 15-Feb-2016 but must complete by 17-Oct-2016.
Wave y will probably complete this Double Sideways pattern, although it could possibly extend into a Triple Sideways pattern.
Current Analysis Settings: Analysis Date Range: 08-May-2014 to 12-Feb-2016, Label Range: 15 - 50, Preferred Count Labels: 28, Min Rating: 75, Stocks toggle ON, Bias Towards Beginning of Data: 8, Bias Towards Major High/Low: 8, Largest Degree Wave Filter: Any Pattern
Rating:79
Current Trading Positions for iShares MSCI Global Gold Miners (RING) Daily on 12-Feb-2016
* A Primary degree trader (hold positions from months to years), would currently be trading long in this market. The probability of this Target Area being correct is 86.7%. However, the random probability of this Target Area being correct is 64.1%. So the true probability of this Target Area being correct is 35.3% better than random.
* A Cycle degree trader (hold positions from quarters to years), would currently be trading long in this market. The probability of this Target Area being correct is 40.4%. However, the random probability of this Target Area being correct is 34.0%. So the true probability of this Target Area being correct is 18.8% better than random.
Extensive Elliott Commentary for iShares MSCI Global Gold Miners (RING) Daily on 12-Feb-2016 with two incomplete patterns:
Wave Y of the Primary degree inverted Double 3 with a rating of 97.7 is expected to complete in the price range 5.21 to 12.31, but more probably between 6.38 and 8.42. This wave is due to complete anytime from now until 30-Sep-2016, but is most likely to complete before 11-May-2016.
Wave Y will probably complete this Double Sideways pattern, although it could possibly extend into a Triple Sideways pattern.
This is the final wave in the pattern. When complete it will also complete wave b of the Cycle degree Flat with a rating of 79. These two waves have the same target ranges.
After wave b is complete, expect the market to continue down into wave c, which should be a five wave Impulsive pattern. Expect wave c to retrace wave b by 85% - 162%. Wave c can also be expected to be 90% - 162% of the price length of wave a. The expected time for wave c to complete is 20% - 136% of the time taken for wave b to complete and 20% - 110% of the time taken for wave a to complete.
Current Analysis Settings: Analysis Date Range: 31-Jan-2014 to 12-Feb-2016, Label Range: 15 - 50, Preferred Count Labels: 22, Min Rating: 75, Stocks toggle ON, Bias Towards Beginning of Data: 8, Bias Towards Major High/Low: 8, Largest Degree Wave Filter: Any Pattern
Rating:102.1
Current Trading Positions for iShares MSCI Hong Kong Index Fund ETF (EWH) Daily on 12-Feb-2016
* An Intermediate degree trader (hold positions from months to quarters), would currently be shorting this market. The probability of this Target Area being correct is 50.2%. However, the random probability of this Target Area being correct is 34.0%. So the true probability of this Target Area being correct is 47.6% better than random.
Extensive Elliott Commentary for iShares MSCI Hong Kong Index Fund ETF (EWH) Daily on 12-Feb-2016 with one incomplete pattern:
Wave (B) of the Intermediate degree inverted Flat with a rating of 102.1 is expected to complete in the price range 13.27 to 17.28, but more probably between 16.66 and 17.26. This wave is due to complete anytime from now until 08-Apr-2016, but is most likely to complete before 15-Feb-2016.
After wave (B) is complete, expect the market to continue up into wave (C), which should be a five wave Impulsive pattern. Expect wave (C) to retrace wave (B) by 80% - 169%. Wave (C) can also be expected to be 99% - 169% of the price length of wave (A). The expected time for wave (C) to complete is 19% - 187% of the time taken for wave (B) to complete and 56% - 268% of the time taken for wave (A) to complete.
Current Analysis Settings: Analysis Date Range: 14-Apr-2015 to 12-Feb-2016, Label Range: 15 - 50, Preferred Count Labels: 16, Min Rating: 75, Stocks toggle ON, Bias Towards Beginning of Data: 8, Bias Towards Major High/Low: 8, Largest Degree Wave Filter: Any Pattern
Rating:97
Current Trading Positions for iShares MSCI India Index (INDA) Daily on 12-Feb-2016
* A Cycle degree trader (hold positions from quarters to years), would currently be shorting this market. The probability of this Target Area being correct is 48.2%. However, the random probability of this Target Area being correct is 34.0%. So the true probability of this Target Area being correct is 41.8% better than random.
Extensive Elliott Commentary for iShares MSCI India Index (INDA) Daily on 12-Feb-2016 with one incomplete pattern:
Wave b of the Cycle degree inverted Flat with a rating of 97 is expected to complete in the price range 15.71 to 25.14, but more probably between 22.86 and 24.93. This wave is due to complete anytime from now until 29-Oct-2018, but is most likely to complete before 25-Jul-2016.
After wave b is complete, expect the market to continue up into wave c, which should be a five wave Impulsive pattern. Expect wave c to retrace wave b by 82% - 179%. Wave c can also be expected to be 67% - 179% of the price length of wave a. The expected time for wave c to complete is 20% - 151% of the time taken for wave b to complete and 11% - 58% of the time taken for wave a to complete.
Current Analysis Settings: Analysis Date Range: 19-Dec-2013 to 12-Feb-2016, Label Range: 15 - 50, Preferred Count Labels: 15, Min Rating: 75, Stocks toggle ON, Bias Towards Beginning of Data: 8, Bias Towards Major High/Low: 8, Largest Degree Wave Filter: Any Pattern
Rating:84.7
Current Trading Positions for iShares MSCI Indonesia Investable Market Fund (EIDO) Daily on 12-Feb-2016
* A Primary degree trader (hold positions from months to years), would currently be trading long in this market. The probability of this Target Area being correct is 42.0%. However, the random probability of this Target Area being correct is 24.3%. So the true probability of this Target Area being correct is 72.8% better than random.
* A Cycle degree trader (hold positions from quarters to years), would currently be trading long in this market. The probability of this Target Area being correct is 42.2%. However, the random probability of this Target Area being correct is 34.0%. So the true probability of this Target Area being correct is 24.1% better than random.
Extensive Elliott Commentary for iShares MSCI Indonesia Investable Market Fund (EIDO) Daily on 12-Feb-2016 with two incomplete patterns:
Wave Y of the Primary degree inverted Double Zigzag with a rating of 100.7 is expected to complete in the price range 24.55 to 32.17, but more probably between 24.64 and 27.82. This wave is due to complete anytime from now until 03-May-2016, but is most likely to complete before 04-Apr-2016.
Wave Y will probably complete this Double Sharp pattern, although it could possibly extend into a Triple Sharp pattern.
This is the final wave in the pattern. When complete it will also complete wave b of the Cycle degree Flat with a rating of 84.7. These two waves have the same target ranges.
After wave b is complete, expect the market to continue down into wave c, which should be a five wave Impulsive pattern. Expect wave c to retrace wave b by 85% - 162%. Wave c can also be expected to be 90% - 162% of the price length of wave a. The expected time for wave c to complete is 20% - 136% of the time taken for wave b to complete and 20% - 110% of the time taken for wave a to complete.
Current Analysis Settings: Analysis Date Range: 10-Jun-2014 to 12-Feb-2016, Label Range: 15 - 50, Preferred Count Labels: 16, Min Rating: 75, Stocks toggle ON, Bias Towards Beginning of Data: 8, Bias Towards Major High/Low: 8, Largest Degree Wave Filter: Any Pattern
Rating:102.5
Current Trading Positions for iShares MSCI Italy Index Fund ETF (EWI) Daily on 12-Feb-2016
* An Intermediate degree trader (hold positions from months to quarters), would currently be shorting this market. The probability of this Target Area being correct is 88.6%. However, the random probability of this Target Area being correct is 65.0%. So the true probability of this Target Area being correct is 36.3% better than random.
Extensive Elliott Commentary for iShares MSCI Italy Index Fund ETF (EWI) Daily on 12-Feb-2016 with one incomplete pattern:
Wave (X) of the Intermediate degree inverted Double Zigzag with a rating of 102.5 is expected to complete in the price range 10.67 to 11.1, but more probably between 10.76 and 10.97. This wave was expected to complete before 12-Feb-2016, and must complete by 15-Feb-2016.
After wave (X) is complete, expect the market to continue up into wave (Y), which should be a three wave Zigzag pattern. Expect wave (Y) to retrace wave (X) by 123% - 305%. Wave (Y) can also be expected to be 91% - 305% of the price length of wave (W). The expected time for wave (Y) to complete is 28% - 154% of the time taken for wave (X) to complete and 86% - 284% of the time taken for wave (W) to complete.
Current Analysis Settings: Analysis Date Range: 28-Apr-2014 to 12-Feb-2016, Label Range: 15 - 50, Preferred Count Labels: 35, Min Rating: 75, Stocks toggle ON, Bias Towards Beginning of Data: 8, Bias Towards Major High/Low: 8, Largest Degree Wave Filter: Any Pattern
Rating:84.6
Current Trading Positions for iShares MSCI Japan Index Fund ETF (EWJ) Daily on 12-Feb-2016
* A Primary degree trader (hold positions from months to years), would currently be shorting this market. The probability of this Target Area being correct is 50.0%. However, the random probability of this Target Area being correct is 34.0%. So the true probability of this Target Area being correct is 47.1% better than random.
* A Cycle degree trader (hold positions from quarters to years), would currently be trading long in this market. The probability of this Target Area being correct is 55.5%. However, the random probability of this Target Area being correct is 53.0%. So the true probability of this Target Area being correct is 4.7% better than random.
Extensive Elliott Commentary for iShares MSCI Japan Index Fund ETF (EWJ) Daily on 12-Feb-2016 with two incomplete patterns:
Wave B of the Primary degree inverted Flat with a rating of 100 is expected to complete in the price range 7.66 to 10.92, but more probably between 10.41 and 10.9. This wave is due to complete anytime from now until 30-Mar-2016, but is most likely to complete before 12-Feb-2016.
After wave B is complete, expect the market to continue up into wave C, which should be a five wave Impulsive pattern. Expect wave C to retrace wave B by 80% - 169%. Wave C can also be expected to be 99% - 169% of the price length of wave A. The expected time for wave C to complete is 19% - 187% of the time taken for wave B to complete and 56% - 268% of the time taken for wave A to complete.
Wave x of the Cycle degree Double 3 with a rating of 84.6 is expected to complete in the price range 12.45 to 25.62, but more probably between 12.53 and 13.81. This wave could complete anytime between now and 16-Oct-2018, but is most likely to complete sometime between 18-Feb-2016 and 11-Jul-2016.
After wave x is complete, expect the market to continue down into wave y, which will probably be a three wave corrective pattern. Expect wave y to retrace wave x by 98% - 193%. Wave y can also be expected to be 76% - 193% of the price length of wave w. The expected time for wave y to complete is 20% - 178% of the time taken for wave x to complete and 12% - 115% of the time taken for wave w to complete.
Current Analysis Settings: Analysis Date Range: 17-Mar-2015 to 12-Feb-2016, Label Range: 15 - 50, Preferred Count Labels: 19, Min Rating: 75, Stocks toggle ON, Bias Towards Beginning of Data: 8, Bias Towards Major High/Low: 8, Largest Degree Wave Filter: Any Pattern
Rating:82.3
Current Trading Positions for iShares MSCI Malaysia Index Fund ETF (EWM) Daily on 12-Feb-2016
* A Cycle degree trader (hold positions from quarters to years), would currently be trading long in this market. The probability of this Target Area being correct is 78.8%. However, the random probability of this Target Area being correct is 65.0%. So the true probability of this Target Area being correct is 21.2% better than random.
Extensive Elliott Commentary for iShares MSCI Malaysia Index Fund ETF (EWM) Daily on 12-Feb-2016 with two incomplete patterns:
Wave C of the Primary degree inverted Flat with a rating of 95.2 is expected to complete in the price range 9.06 to 13.74, but more probably between 9.8 and 12.49. This wave is due to complete anytime from now until 14-Oct-2016, but is most likely to complete before 08-Apr-2016.
This wave C will complete the Flat pattern.
This is the final wave in the pattern. When complete it will also complete wave x of the Cycle degree Double Zigzag with a rating of 82.3. These two waves have the same target ranges.
After wave x is complete, expect the market to continue down into wave y, which should be a three wave Zigzag pattern. Expect wave y to retrace wave x by 116% - 261%. Wave y can also be expected to be 90% - 261% of the price length of wave w. The expected time for wave y to complete is 21% - 160% of the time taken for wave x to complete and 25% - 152% of the time taken for wave w to complete.
Current Analysis Settings: Analysis Date Range: 17-Jul-2014 to 12-Feb-2016, Label Range: 15 - 50, Preferred Count Labels: 16, Min Rating: 75, Stocks toggle ON, Bias Towards Beginning of Data: 8, Bias Towards Major High/Low: 8, Largest Degree Wave Filter: Any Pattern
Rating:81.9
Current Trading Positions for iShares MSCI Mexico Index Fund ETF (EWW) Daily on 12-Feb-2016
* A Primary degree trader (hold positions from months to years), would currently be shorting this market. The probability of this Target Area being correct is 88.3%. However, the random probability of this Target Area being correct is 65.0%. So the true probability of this Target Area being correct is 35.8% better than random.
* A Cycle degree trader (hold positions from quarters to years), would currently be trading long in this market. The probability of this Target Area being correct is 41.3%. However, the random probability of this Target Area being correct is 34.0%. So the true probability of this Target Area being correct is 21.5% better than random.
Extensive Elliott Commentary for iShares MSCI Mexico Index Fund ETF (EWW) Daily on 12-Feb-2016 with two incomplete patterns:
Wave X of the Primary degree inverted Double Zigzag with a rating of 101.2 is expected to complete in the price range 43.17 to 48.04, but more probably between 44.77 and 47.14. This wave is due to complete anytime from now until 01-Apr-2016, but is most likely to complete before 24-Feb-2016.
After wave X is complete, expect the market to continue up into wave Y, which should be a three wave Zigzag pattern. Expect wave Y to retrace wave X by 128% - 319%. Wave Y can also be expected to be 90% - 319% of the price length of wave W. The expected time for wave Y to complete is 23% - 167% of the time taken for wave X to complete and 47% - 204% of the time taken for wave W to complete.
Wave b of the Cycle degree Flat with a rating of 81.9 is expected to complete in the price range 63.52 to 121.31, but more probably between 64.12 and 79.39. This wave could complete anytime between now and 16-Apr-2024, but is most likely to complete sometime between 03-Mar-2016 and 10-Mar-2017.
After wave b is complete, expect the market to continue down into wave c, which should be a five wave Impulsive pattern. Expect wave c to retrace wave b by 85% - 162%. Wave c can also be expected to be 90% - 162% of the price length of wave a. The expected time for wave c to complete is 20% - 136% of the time taken for wave b to complete and 20% - 110% of the time taken for wave a to complete.
Current Analysis Settings: Analysis Date Range: 28-Jul-2014 to 12-Feb-2016, Label Range: 15 - 50, Preferred Count Labels: 24, Min Rating: 75, Stocks toggle ON, Bias Towards Beginning of Data: 8, Bias Towards Major High/Low: 8, Largest Degree Wave Filter: Any Pattern
Rating:87.5
Current Trading Positions for iShares MSCI Netherlands Index Fund ETF (EWN) Daily on 12-Feb-2016
* A Primary degree trader (hold positions from months to years), would currently be shorting this market. The probability of this Target Area being correct is 64.9%. However, the random probability of this Target Area being correct is 45.0%. So the true probability of this Target Area being correct is 44.2% better than random.
* A Cycle degree trader (hold positions from quarters to years), would currently be shorting this market. The probability of this Target Area being correct is 38.5%. However, the random probability of this Target Area being correct is 24.3%. So the true probability of this Target Area being correct is 58.4% better than random.
Extensive Elliott Commentary for iShares MSCI Netherlands Index Fund ETF (EWN) Daily on 12-Feb-2016 with two incomplete patterns:
Wave C of the Primary degree Zigzag with a rating of 102.5 is expected to complete in the price range 14.05 to 21.76, but more probably between 19.15 and 21.4. This wave is due to complete anytime from now until 21-Apr-2016, but is most likely to complete before 26-Feb-2016.
This wave C will complete the ZigZag pattern.
This is the final wave in the pattern. When complete it will also complete wave y of the Cycle degree Double Zigzag with a rating of 87.5. These two waves have the same target ranges.
Wave y will probably complete this Double Sharp pattern, although it could possibly extend into a Triple Sharp pattern.
Current Analysis Settings: Analysis Date Range: 11-May-2015 to 12-Feb-2016, Label Range: 15 - 50, Preferred Count Labels: 15, Min Rating: 75, Stocks toggle ON, Bias Towards Beginning of Data: 8, Bias Towards Major High/Low: 8, Largest Degree Wave Filter: Any Pattern
Rating:84.7
Current Trading Positions for iShares MSCI Pacific ex-Japan Index Fund ETF (EPP) Daily on 12-Feb-2016
* A Primary degree trader (hold positions from months to years), would currently be shorting this market. The probability of this Target Area being correct is 41.9%. However, the random probability of this Target Area being correct is 34.0%. So the true probability of this Target Area being correct is 23.2% better than random.
* A Cycle degree trader (hold positions from quarters to years), would currently be trading long in this market. The probability of this Target Area being correct is 86.8%. However, the random probability of this Target Area being correct is 80.4%. So the true probability of this Target Area being correct is 8.0% better than random.
Extensive Elliott Commentary for iShares MSCI Pacific ex-Japan Index Fund ETF (EPP) Daily on 12-Feb-2016 with three incomplete patterns:
Wave (C) of the Intermediate degree Flat with a rating of 97 is expected to complete in the price range 30.95 to 34.76, but more probably between 32.31 and 33.77. This wave was expected to complete before 09-Feb-2016, and must complete by 15-Feb-2016.
This wave (C) will complete the Flat pattern.
This is the final wave in the pattern. When complete it will also complete wave B of the Primary degree inverted Flat with a rating of 83.2. These two waves have the same target ranges.
After wave B is complete, expect the market to continue up into wave C, which should be a five wave Impulsive pattern. Expect wave C to retrace wave B by 80% - 169%. Wave C can also be expected to be 99% - 169% of the price length of wave A. The expected time for wave C to complete is 19% - 187% of the time taken for wave B to complete and 56% - 268% of the time taken for wave A to complete.
Wave IV of the Cycle degree inverted Ending Diagonal with a rating of 84.7 is expected to complete in the price range 35.05 to 40.01, but more probably between 36.02 and 38.88. This wave is due to complete anytime from now until 19-Aug-2016, but is most likely to complete before 08-Mar-2016.
Expect this wave IV to complete in the price range of wave 2, and then continue down to the end of wave V, which should be a ZigZag family three wave pattern. Expect wave V to have between 52% and 91% of the price range of wave III and complete in 18% to 62% of the time taken by wave III. Expect also that wave V will have between 31% and 72% of the price range of wave I and complete in 3% to 22% of the time taken by wave I. The slope (ie. price range divided by time taken) of wave V should be between 49% and 173% of the slope of wave III and between 77% to 312% of the slope of wave I. Wave V will complete this Ending Diagonal pattern.
Current Analysis Settings: Analysis Date Range: 24-Jul-2014 to 12-Feb-2016, Label Range: 15 - 50, Preferred Count Labels: 42, Min Rating: 75, Stocks toggle ON, Bias Towards Beginning of Data: 8, Bias Towards Major High/Low: 8, Largest Degree Wave Filter: Any Pattern
Rating:76.1
Current Trading Positions for iShares MSCI Philippines Investable Market Index Fund (EPHE) Daily on 12-Feb-2016
* A Cycle degree trader (hold positions from quarters to years), would currently be trading long in this market. The probability of this Target Area being correct is 39.8%. However, the random probability of this Target Area being correct is 34.0%. So the true probability of this Target Area being correct is 17.1% better than random.
Extensive Elliott Commentary for iShares MSCI Philippines Investable Market Index Fund (EPHE) Daily on 12-Feb-2016 with two incomplete patterns:
Wave C of the Primary degree inverted Flat with a rating of 95.8 is expected to complete in the price range 31 to 39.89, but more probably between 32.92 and 37.39. This wave is due to complete anytime from now until 04-Jul-2016, but is most likely to complete before 31-Mar-2016.
This wave C will complete the Flat pattern.
This is the final wave in the pattern. When complete it will also complete wave b of the Cycle degree Flat with a rating of 76.1. These two waves have the same target ranges.
After wave b is complete, expect the market to continue down into wave c, which should be a five wave Impulsive pattern. Expect wave c to retrace wave b by 86% - 162%. Wave c can also be expected to be 90% - 162% of the price length of wave a. The expected time for wave c to complete is 19% - 134% of the time taken for wave b to complete and 24% - 115% of the time taken for wave a to complete.
Current Analysis Settings: Analysis Date Range: 23-Feb-2015 to 12-Feb-2016, Label Range: 15 - 50, Preferred Count Labels: 22, Min Rating: 75, Stocks toggle ON, Bias Towards Beginning of Data: 8, Bias Towards Major High/Low: 8, Largest Degree Wave Filter: Any Pattern
Rating:97
Current Trading Positions for iShares Msci Poland Investable (EPOL) Daily on 12-Feb-2016
* A Cycle degree trader (hold positions from quarters to years), would currently be trading long in this market. The probability of this Target Area being correct is 86.2%. However, the random probability of this Target Area being correct is 65.0%. So the true probability of this Target Area being correct is 32.6% better than random.
Extensive Elliott Commentary for iShares Msci Poland Investable (EPOL) Daily on 12-Feb-2016 with one incomplete pattern:
Wave x of the Cycle degree Double Zigzag with a rating of 97 is expected to complete in the price range 18.3 to 31.24, but more probably between 21.93 and 28.71. This wave is most likely to complete sometime between 21-Apr-2016 and 01-Aug-2017 Note that it cannot complete until 29-Feb-2016 but must complete by 19-Jul-2021.
After wave x is complete, expect the market to continue down into wave y, which should be a three wave Zigzag pattern. Expect wave y to retrace wave x by 116% - 261%. Wave y can also be expected to be 90% - 261% of the price length of wave w. The expected time for wave y to complete is 21% - 160% of the time taken for wave x to complete and 25% - 152% of the time taken for wave w to complete.
Current Analysis Settings: Analysis Date Range: 25-Apr-2014 to 12-Feb-2016, Label Range: 15 - 50, Preferred Count Labels: 17, Min Rating: 75, Stocks toggle ON, Bias Towards Beginning of Data: 8, Bias Towards Major High/Low: 8, Largest Degree Wave Filter: Any Pattern
Rating:87
Current Trading Positions for iShares MSCI Russia Capped Index Fund (ERUS) Daily on 12-Feb-2016
* A Cycle degree trader (hold positions from quarters to years), would currently be trading long in this market. The probability of this Target Area being correct is 57.0%. However, the random probability of this Target Area being correct is 45.0%. So the true probability of this Target Area being correct is 26.7% better than random.
* A Supercycle degree trader (buy and hold for years), would currently be shorting this market. The probability of this Target Area being correct is 38.0%. However, the random probability of this Target Area being correct is 24.3%. So the true probability of this Target Area being correct is 56.4% better than random.
Extensive Elliott Commentary for iShares MSCI Russia Capped Index Fund (ERUS) Daily on 12-Feb-2016 with two incomplete patterns:
Wave b of the Cycle degree Zigzag with a rating of 102.7 is expected to complete in the price range 9.19 to 13.95, but more probably between 9.66 and 11.45. This wave is due to complete anytime from now until 14-Nov-2016, but is most likely to complete before 25-Feb-2016.
After wave b is complete, expect the market to continue down into wave c, which should be a five wave impulsive pattern. Expect wave c to retrace wave b by 96% - 215%. Wave c can also be expected to be 33% - 215% of the price length of wave a. The expected time for wave c to complete is 22% - 199% of the time taken for wave b to complete and 24% - 111% of the time taken for wave a to complete.
Wave (y) of the Supercycle degree Double Zigzag with a rating of 87 is expected to complete at a price no higher than 3.13, but more probably between .45 and 2.95. This wave is due to complete anytime from now until 22-Feb-2019, but is most likely to complete before 26-Dec-2016.
Wave (y) will probably complete this Double Sharp pattern, although it could possibly extend into a Triple Sharp pattern.
Current Analysis Settings: Analysis Date Range: 06-Dec-2013 to 12-Feb-2016, Label Range: 15 - 50, Preferred Count Labels: 18, Min Rating: 75, Stocks toggle ON, Bias Towards Beginning of Data: 8, Bias Towards Major High/Low: 8, Largest Degree Wave Filter: Any Pattern
Rating:102.1
Current Trading Positions for iShares MSCI Singapore Index Fund ETF (EWS) Daily on 12-Feb-2016
* An Intermediate degree trader (hold positions from months to quarters), would currently be trading long in this market. The probability of this Target Area being correct is 42.4%. However, the random probability of this Target Area being correct is 24.3%. So the true probability of this Target Area being correct is 74.5% better than random.
Extensive Elliott Commentary for iShares MSCI Singapore Index Fund ETF (EWS) Daily on 12-Feb-2016 with one incomplete pattern:
Wave (Y) of the Intermediate degree inverted Double Zigzag with a rating of 102.1 is expected to complete in the price range 9.58 to 10.26, but more probably between 9.59 and 9.87. This wave is due to complete anytime from now until 14-Mar-2016, but is most likely to complete before 22-Feb-2016.
Wave (Y) will probably complete this Double Sharp pattern, although it could possibly extend into a Triple Sharp pattern.
Current Analysis Settings: Analysis Date Range: 12-Jun-2014 to 12-Feb-2016, Label Range: 15 - 50, Preferred Count Labels: 29, Min Rating: 75, Stocks toggle ON, Bias Towards Beginning of Data: 8, Bias Towards Major High/Low: 8, Largest Degree Wave Filter: Any Pattern
Rating:103.2
Current Trading Positions for iShares MSCI South Africa Index Fund ETF (EZA) Daily on 12-Feb-2016
* A Cycle degree trader (hold positions from quarters to years), would currently be trading long in this market. The probability of this Target Area being correct is 50.3%. However, the random probability of this Target Area being correct is 34.0%. So the true probability of this Target Area being correct is 47.9% better than random.
Extensive Elliott Commentary for iShares MSCI South Africa Index Fund ETF (EZA) Daily on 12-Feb-2016 with one incomplete pattern:
Wave b of the Cycle degree Flat with a rating of 103.2 is expected to complete in the price range 61.79 to 130.55, but more probably between 62.5 and 80.48. This wave could complete anytime between now and 23-Jun-2020, but is most likely to complete sometime between 24-Feb-2016 and 13-Sep-2016.
After wave b is complete, expect the market to continue down into wave c, which should be a five wave Impulsive pattern. Expect wave c to retrace wave b by 86% - 162%. Wave c can also be expected to be 90% - 162% of the price length of wave a. The expected time for wave c to complete is 19% - 134% of the time taken for wave b to complete and 24% - 115% of the time taken for wave a to complete.
Current Analysis Settings: Analysis Date Range: 17-Mar-2015 to 12-Feb-2016, Label Range: 15 - 50, Preferred Count Labels: 18, Min Rating: 75, Stocks toggle ON, Bias Towards Beginning of Data: 8, Bias Towards Major High/Low: 8, Largest Degree Wave Filter: Any Pattern
Rating:101.9
Current Trading Positions for iShares MSCI South Korea Index Fund ETF (EWY) Daily on 12-Feb-2016
* An Intermediate degree trader (hold positions from months to quarters), would currently be shorting this market. The probability of this Target Area being correct is 50.1%. However, the random probability of this Target Area being correct is 34.0%. So the true probability of this Target Area being correct is 47.4% better than random.
Extensive Elliott Commentary for iShares MSCI South Korea Index Fund ETF (EWY) Daily on 12-Feb-2016 with one incomplete pattern:
Wave (B) of the Intermediate degree inverted Flat with a rating of 101.9 is expected to complete in the price range 32.41 to 45.56, but more probably between 43.51 and 45.49. This wave is most likely to complete sometime between 15-Feb-2016 and 10-Mar-2016 Note that it cannot complete until 12-Feb-2016 but must complete by 01-Jul-2016.
After wave (B) is complete, expect the market to continue up into wave (C), which should be a five wave Impulsive pattern. Expect wave (C) to retrace wave (B) by 80% - 169%. Wave (C) can also be expected to be 99% - 169% of the price length of wave (A). The expected time for wave (C) to complete is 19% - 187% of the time taken for wave (B) to complete and 56% - 268% of the time taken for wave (A) to complete.
Current Analysis Settings: Analysis Date Range: 18-Jun-2014 to 12-Feb-2016, Label Range: 15 - 50, Preferred Count Labels: 38, Min Rating: 75, Stocks toggle ON, Bias Towards Beginning of Data: 8, Bias Towards Major High/Low: 8, Largest Degree Wave Filter: Any Pattern
Rating:75.2
Current Trading Positions for iShares MSCI Spain Index Fund ETF (EWP) Daily on 12-Feb-2016
* A Primary degree trader (hold positions from months to years), would currently be shorting this market. The probability of this Target Area being correct is 64.7%. However, the random probability of this Target Area being correct is 45.0%. So the true probability of this Target Area being correct is 43.8% better than random.
* A Cycle degree trader (hold positions from quarters to years), would currently be shorting this market. The probability of this Target Area being correct is 32.5%. However, the random probability of this Target Area being correct is 24.3%. So the true probability of this Target Area being correct is 33.7% better than random.
Extensive Elliott Commentary for iShares MSCI Spain Index Fund ETF (EWP) Daily on 12-Feb-2016 with two incomplete patterns:
Wave C of the Primary degree Zigzag with a rating of 101.7 is expected to complete in the price range 17.53 to 24.83, but more probably between 20.53 and 24.09. This wave is most likely to complete sometime between 18-Feb-2016 and 28-Mar-2016 Note that it cannot complete until 15-Feb-2016 but must complete by 30-May-2016.
This wave C will complete the ZigZag pattern.
This is the final wave in the pattern. When complete it will also complete wave y of the Cycle degree Double Zigzag with a rating of 75.2. These two waves have the same target ranges.
Wave y will probably complete this Double Sharp pattern, although it could possibly extend into a Triple Sharp pattern.
Current Analysis Settings: Analysis Date Range: 08-May-2014 to 12-Feb-2016, Label Range: 15 - 50, Preferred Count Labels: 28, Min Rating: 75, Stocks toggle ON, Bias Towards Beginning of Data: 8, Bias Towards Major High/Low: 8, Largest Degree Wave Filter: Any Pattern
Rating:78.9
Current Trading Positions for iShares MSCI Sweden Index Fund ETF (EWD) Daily on 12-Feb-2016
* An Intermediate degree trader (hold positions from months to quarters), would currently be shorting this market. The probability of this Target Area being correct is 88.0%. However, the random probability of this Target Area being correct is 65.0%. So the true probability of this Target Area being correct is 35.4% better than random.
* A Primary degree trader (hold positions from months to years), would currently be trading long in this market. The probability of this Target Area being correct is 42.2%. However, the random probability of this Target Area being correct is 34.0%. So the true probability of this Target Area being correct is 24.1% better than random.
* A Cycle degree trader (hold positions from quarters to years), would currently be shorting this market. The probability of this Target Area being correct is 84.8%. However, the random probability of this Target Area being correct is 64.1%. So the true probability of this Target Area being correct is 32.3% better than random.
Extensive Elliott Commentary for iShares MSCI Sweden Index Fund ETF (EWD) Daily on 12-Feb-2016 with three incomplete patterns:
Wave (X) of the Intermediate degree inverted Double Zigzag with a rating of 100.9 is expected to complete in the price range 25.66 to 27.36, but more probably between 26.03 and 26.86. This wave was expected to complete before 08-Feb-2016, and must complete by 19-Feb-2016.
After wave (X) is complete, expect the market to continue up into wave (Y), which should be a three wave Zigzag pattern. Expect wave (Y) to retrace wave (X) by 122% - 303%. Wave (Y) can also be expected to be 91% - 303% of the price length of wave (W). The expected time for wave (Y) to complete is 29% - 156% of the time taken for wave (X) to complete and 87% - 284% of the time taken for wave (W) to complete.
Wave B of the Primary degree Flat with a rating of 84.5 is expected to complete in the price range 32.13 to 50.69, but more probably between 32.32 and 37.17. This wave could complete anytime between now and 08-Nov-2019, but is most likely to complete sometime between 19-Feb-2016 and 12-Aug-2016.
After wave B is complete, expect the market to continue down into wave C, which should be a five wave Impulsive pattern. Expect wave C to retrace wave B by 86% - 162%. Wave C can also be expected to be 90% - 162% of the price length of wave A. The expected time for wave C to complete is 19% - 134% of the time taken for wave B to complete and 24% - 115% of the time taken for wave A to complete.
Wave y of the Cycle degree Double 3 with a rating of 78.9 is expected to complete in the price range 9.77 to 34.79, but more probably between 22.17 and 29.57. This wave is due to complete anytime from now until 02-Jan-2017, but is most likely to complete before 07-Mar-2016.
Wave y will probably complete this Double Sideways pattern, although it could possibly extend into a Triple Sideways pattern.
Current Analysis Settings: Analysis Date Range: 09-Apr-2014 to 12-Feb-2016, Label Range: 15 - 50, Preferred Count Labels: 16, Min Rating: 75, Stocks toggle ON, Bias Towards Beginning of Data: 8, Bias Towards Major High/Low: 8, Largest Degree Wave Filter: Any Pattern
Rating:93
Current Trading Positions for iShares MSCI Switzerland Index Fund ETF (EWL) Daily on 12-Feb-2016
* A Primary degree trader (hold positions from months to years), would currently be shorting this market. The probability of this Target Area being correct is 65.1%. However, the random probability of this Target Area being correct is 45.0%. So the true probability of this Target Area being correct is 44.7% better than random.
* A Cycle degree trader (hold positions from quarters to years), would currently be shorting this market. The probability of this Target Area being correct is 40.6%. However, the random probability of this Target Area being correct is 24.3%. So the true probability of this Target Area being correct is 67.1% better than random.
Extensive Elliott Commentary for iShares MSCI Switzerland Index Fund ETF (EWL) Daily on 12-Feb-2016 with two incomplete patterns:
Wave C of the Primary degree Zigzag with a rating of 103.4 is expected to complete in the price range 22.83 to 28.1, but more probably between 25.23 and 27.61. This wave is due to complete anytime from now until 18-Mar-2016, but is most likely to complete before 19-Feb-2016.
This wave C will complete the ZigZag pattern.
This is the final wave in the pattern. When complete it will also complete wave y of the Cycle degree Double Zigzag with a rating of 93. These two waves have the same target ranges.
Wave y will probably complete this Double Sharp pattern, although it could possibly extend into a Triple Sharp pattern.
Current Analysis Settings: Analysis Date Range: 02-Apr-2015 to 12-Feb-2016, Label Range: 15 - 50, Preferred Count Labels: 15, Min Rating: 75, Stocks toggle ON, Bias Towards Beginning of Data: 8, Bias Towards Major High/Low: 8, Largest Degree Wave Filter: Any Pattern
Rating:102.5
Current Trading Positions for iShares MSCI Taiwan Index Fund ETF (EWT) Daily on 12-Feb-2016
* An Intermediate degree trader (hold positions from months to quarters), would currently be shorting this market. The probability of this Target Area being correct is 66.8%. However, the random probability of this Target Area being correct is 53.0%. So the true probability of this Target Area being correct is 26.0% better than random.
Extensive Elliott Commentary for iShares MSCI Taiwan Index Fund ETF (EWT) Daily on 12-Feb-2016 with one incomplete pattern:
Wave (X) of the Intermediate degree inverted Double 3 with a rating of 102.5 is expected to complete in the price range 5.24 to 12.14, but more probably between 11.07 and 11.66. This wave is due to complete anytime from now until 02-May-2016, but is most likely to complete before 22-Feb-2016.
After wave (X) is complete, expect the market to continue up into wave (Y), which will probably be a three wave corrective pattern. Expect wave (Y) to retrace wave (X) by 98% - 212%. Wave (Y) can also be expected to be 73% - 212% of the price length of wave (W). The expected time for wave (Y) to complete is 27% - 214% of the time taken for wave (X) to complete and 38% - 222% of the time taken for wave (W) to complete.
Current Analysis Settings: Analysis Date Range: 16-Mar-2015 to 12-Feb-2016, Label Range: 15 - 50, Preferred Count Labels: 15, Min Rating: 75, Stocks toggle ON, Bias Towards Beginning of Data: 8, Bias Towards Major High/Low: 8, Largest Degree Wave Filter: Any Pattern
Rating:102.2
Current Trading Positions for iShares MSCI Thailand Investable Market Index Fund ETF (THD) Daily on 12-Feb-2016
* A Cycle degree trader (hold positions from quarters to years), would currently be trading long in this market. The probability of this Target Area being correct is 50.2%. However, the random probability of this Target Area being correct is 34.0%. So the true probability of this Target Area being correct is 47.6% better than random.
Extensive Elliott Commentary for iShares MSCI Thailand Investable Market Index Fund ETF (THD) Daily on 12-Feb-2016 with one incomplete pattern:
Wave b of the Cycle degree Flat with a rating of 102.2 is expected to complete in the price range 75.97 to 135.69, but more probably between 76.59 and 92.37. This wave could complete anytime between now and 16-Oct-2023, but is most likely to complete sometime between 22-Feb-2016 and 06-Feb-2017.
After wave b is complete, expect the market to continue down into wave c, which should be a five wave Impulsive pattern. Expect wave c to retrace wave b by 85% - 162%. Wave c can also be expected to be 90% - 162% of the price length of wave a. The expected time for wave c to complete is 20% - 136% of the time taken for wave b to complete and 20% - 110% of the time taken for wave a to complete.
Current Analysis Settings: Analysis Date Range: 13-Aug-2014 to 12-Feb-2016, Label Range: 15 - 50, Preferred Count Labels: 16, Min Rating: 75, Stocks toggle ON, Bias Towards Beginning of Data: 8, Bias Towards Major High/Low: 8, Largest Degree Wave Filter: Any Pattern
Rating:77.2
Current Trading Positions for iShares MSCI Turkey Investable Market Index Fund ETF (TUR) Daily on 12-Feb-2016
* A Primary degree trader (hold positions from months to years), would currently be trading long in this market. The probability of this Target Area being correct is 88.0%. However, the random probability of this Target Area being correct is 80.4%. So the true probability of this Target Area being correct is 9.5% better than random.
* A Cycle degree trader (hold positions from quarters to years), would currently be shorting this market. The probability of this Target Area being correct is 49.7%. However, the random probability of this Target Area being correct is 45.0%. So the true probability of this Target Area being correct is 10.4% better than random.
Extensive Elliott Commentary for iShares MSCI Turkey Investable Market Index Fund ETF (TUR) Daily on 12-Feb-2016 with two incomplete patterns:
Wave 4 of the Primary degree inverted Ending Diagonal with a rating of 90.9 is expected to complete in the price range 34.24 to 43.06, but more probably between 36.35 and 39.79. This wave is due to complete anytime from now until 23-May-2016, but is most likely to complete before 16-Feb-2016.
Expect this wave 4 to complete in the price range of wave 2, and then continue down to the end of wave 5, which should be a ZigZag family three wave pattern. Expect wave 5 to have between 52% and 91% of the price range of wave 3 and complete in 18% to 62% of the time taken by wave 3. Expect also that wave 5 will have between 31% and 72% of the price range of wave 1 and complete in 3% to 22% of the time taken by wave 1. The slope (ie. price range divided by time taken) of wave 5 should be between 49% and 173% of the slope of wave 3 and between 77% to 312% of the slope of wave 1. Wave 5 will complete this Ending Diagonal pattern.
Wave c of the Cycle degree Zigzag with a rating of 77.2 is expected to complete in the price range 24.14 to 43.69, but more probably between 34.88 and 42.65. This wave was expected to complete before 30-Oct-2015, and must complete by 29-Apr-2016.
This wave c will complete the ZigZag pattern.
Current Analysis Settings: Analysis Date Range: 16-Jun-2014 to 12-Feb-2016, Label Range: 15 - 50, Preferred Count Labels: 24, Min Rating: 75, Stocks toggle ON, Bias Towards Beginning of Data: 8, Bias Towards Major High/Low: 8, Largest Degree Wave Filter: Any Pattern
Rating:89.2
Current Trading Positions for iShares MSCI United Kingdom Index Fund ETF (EWU) Daily on 12-Feb-2016
* A Primary degree trader (hold positions from months to years), would currently be shorting this market. The probability of this Target Area being correct is 65.1%. However, the random probability of this Target Area being correct is 45.0%. So the true probability of this Target Area being correct is 44.7% better than random.
* A Cycle degree trader (hold positions from quarters to years), would currently be shorting this market. The probability of this Target Area being correct is 39.5%. However, the random probability of this Target Area being correct is 24.3%. So the true probability of this Target Area being correct is 62.6% better than random.
Extensive Elliott Commentary for iShares MSCI United Kingdom Index Fund ETF (EWU) Daily on 12-Feb-2016 with two incomplete patterns:
Wave C of the Primary degree Zigzag with a rating of 103.5 is expected to complete in the price range 7.93 to 14.19, but more probably between 12.01 and 14.08. This wave is due to complete anytime from now until 18-Apr-2016, but is most likely to complete before 10-Mar-2016.
This wave C will complete the ZigZag pattern.
This is the final wave in the pattern. When complete it will also complete wave y of the Cycle degree Double Zigzag with a rating of 89.2. These two waves have the same target ranges.
Wave y will probably complete this Double Sharp pattern, although it could possibly extend into a Triple Sharp pattern.
Current Analysis Settings: Analysis Date Range: 08-May-2014 to 12-Feb-2016, Label Range: 15 - 50, Preferred Count Labels: 20, Min Rating: 75, Stocks toggle ON, Bias Towards Beginning of Data: 8, Bias Towards Major High/Low: 8, Largest Degree Wave Filter: Any Pattern
Rating:97.5
Current Trading Positions for iShares MSCI USA Minimum Volatility Index (USMV) Daily on 12-Feb-2016
* A Primary degree trader (hold positions from months to years), would currently be shorting this market. The probability of this Target Area being correct is 48.2%. However, the random probability of this Target Area being correct is 34.0%. So the true probability of this Target Area being correct is 41.8% better than random.
Extensive Elliott Commentary for iShares MSCI USA Minimum Volatility Index (USMV) Daily on 12-Feb-2016 with one incomplete pattern:
Wave B of the Primary degree inverted Flat with a rating of 97.5 is expected to complete in the price range 35.16 to 39.64, but more probably between 38.39 and 39.59. This wave could complete anytime between now and 16-Feb-2018, but is most likely to complete sometime between 19-Feb-2016 and 23-May-2016.
After wave B is complete, expect the market to continue up into wave C, which should be a five wave Impulsive pattern. Expect wave C to retrace wave B by 82% - 177%. Wave C can also be expected to be 89% - 177% of the price length of wave A. The expected time for wave C to complete is 15% - 160% of the time taken for wave B to complete and 16% - 118% of the time taken for wave A to complete.
Current Analysis Settings: Analysis Date Range: 09-Jul-2015 to 12-Feb-2016, Label Range: 15 - 50, Preferred Count Labels: 19, Min Rating: 75, Stocks toggle ON, Bias Towards Beginning of Data: 8, Bias Towards Major High/Low: 8, Largest Degree Wave Filter: Any Pattern
Rating:102.4
Current Trading Positions for iShares MSCI USA Momentum Factor ETF (MTUM) Daily on 12-Feb-2016
* An Intermediate degree trader (hold positions from months to quarters), would currently be trading long in this market. The probability of this Target Area being correct is 50.2%. However, the random probability of this Target Area being correct is 34.0%. So the true probability of this Target Area being correct is 47.6% better than random.
Extensive Elliott Commentary for iShares MSCI USA Momentum Factor ETF (MTUM) Daily on 12-Feb-2016 with one incomplete pattern:
Wave (B) of the Intermediate degree Flat with a rating of 102.4 is expected to complete in the price range 68.85 to 95.71, but more probably between 69 and 73.93. This wave is due to complete anytime from now until 28-Mar-2016, but is most likely to complete before 22-Feb-2016.
After wave (B) is complete, expect the market to continue down into wave (C), which should be a five wave Impulsive pattern. Expect wave (C) to retrace wave (B) by 89% - 167%. Wave (C) can also be expected to be 105% - 167% of the price length of wave (A). The expected time for wave (C) to complete is 20% - 148% of the time taken for wave (B) to complete and 60% - 290% of the time taken for wave (A) to complete.
Current Analysis Settings: Analysis Date Range: 14-Jul-2015 to 12-Feb-2016, Label Range: 15 - 50, Preferred Count Labels: 15, Min Rating: 75, Stocks toggle ON, Bias Towards Beginning of Data: 8, Bias Towards Major High/Low: 8, Largest Degree Wave Filter: Any Pattern
Rating:84.2
Current Trading Positions for iShares MSCI USA Quality Factor ETF (QUAL) Daily on 12-Feb-2016
* A Minuette degree trader (hold positions from days to months), would currently be trading long in this market. The probability of this Target Area being correct is 54.6%. However, the random probability of this Target Area being correct is 45.0%. So the true probability of this Target Area being correct is 21.3% better than random.
* A Minute degree trader (hold positions from weeks to months), would currently be shorting this market. The probability of this Target Area being correct is 43.4%. However, the random probability of this Target Area being correct is 34.0%. So the true probability of this Target Area being correct is 27.6% better than random.
* A Minor degree trader (hold positions from weeks to quarters), would currently be trading long in this market. The probability of this Target Area being correct is 56.9%. However, the random probability of this Target Area being correct is 53.0%. So the true probability of this Target Area being correct is 7.4% better than random.
* An Intermediate degree trader (hold positions from months to quarters), would currently be shorting this market. The probability of this Target Area being correct is 78.8%. However, the random probability of this Target Area being correct is 65.0%. So the true probability of this Target Area being correct is 21.2% better than random.
* A Primary degree trader (hold positions from months to years), would currently be trading long in this market. The probability of this Target Area being correct is 42.2%. However, the random probability of this Target Area being correct is 34.0%. So the true probability of this Target Area being correct is 24.1% better than random.
Extensive Elliott Commentary for iShares MSCI USA Quality Factor ETF (QUAL) Daily on 12-Feb-2016 with five incomplete patterns:
Wave (b) of the Minuette degree Zigzag with a rating of 98.7 is expected to complete in the price range 58.46 to 60.56, but more probably between 58.84 and 59.66. This wave was expected to complete before 12-Feb-2016, and must complete by 19-Feb-2016.
After wave (b) is complete, expect the market to continue down into wave (c), which should be a five wave impulsive pattern. Expect wave (c) to retrace wave (b) by 127% - 277%. Wave (c) can also be expected to be 43% - 277% of the price length of wave (a). The expected time for wave (c) to complete is 20% - 191% of the time taken for wave (b) to complete and 55% - 221% of the time taken for wave (a) to complete.
Wave b of the Minute degree inverted Flat with a rating of 88.8 is expected to complete in the price range 52.09 to 59.29, but more probably between 58.14 and 59.23. This wave is due to complete anytime from now until 29-Feb-2016, but is most likely to complete before 15-Feb-2016.
After wave b is complete, expect the market to continue up into wave c, which should be a five wave Impulsive pattern. Expect wave c to retrace wave b by 83% - 173%. Wave c can also be expected to be 101% - 173% of the price length of wave a. The expected time for wave c to complete is 20% - 190% of the time taken for wave b to complete and 57% - 279% of the time taken for wave a to complete.
Wave X of the Minor degree Double 3 with a rating of 91.5 is expected to complete in the price range 60.12 to 74.4, but more probably between 60.93 and 62.41. This wave is due to complete anytime from now until 22-Mar-2016, but is most likely to complete before 18-Feb-2016.
After wave X is complete, expect the market to continue down into wave Y, which will probably be a three wave corrective pattern. Expect wave Y to retrace wave X by 98% - 183%. Wave Y can also be expected to be 81% - 183% of the price length of wave W. The expected time for wave Y to complete is 40% - 187% of the time taken for wave X to complete and 100% - 304% of the time taken for wave W to complete.
Wave (X) of the Intermediate degree inverted Double Zigzag with a rating of 82.3 is expected to complete in the price range 57.86 to 61.17, but more probably between 58.95 and 60.56. This wave is due to complete anytime from now until 14-Mar-2016, but is most likely to complete before 16-Feb-2016.
After wave (X) is complete, expect the market to continue up into wave (Y), which should be a three wave Zigzag pattern. Expect wave (Y) to retrace wave (X) by 128% - 319%. Wave (Y) can also be expected to be 90% - 319% of the price length of wave (W). The expected time for wave (Y) to complete is 23% - 167% of the time taken for wave (X) to complete and 47% - 204% of the time taken for wave (W) to complete.
Wave B of the Primary degree Flat with a rating of 84.2 is expected to complete in the price range 63.95 to 81.42, but more probably between 64.13 and 68.7. This wave is due to complete anytime from now until 25-Apr-2017, but is most likely to complete before 31-Mar-2016.
After wave B is complete, expect the market to continue down into wave C, which should be a five wave Impulsive pattern. Expect wave C to retrace wave B by 86% - 162%. Wave C can also be expected to be 90% - 162% of the price length of wave A. The expected time for wave C to complete is 19% - 134% of the time taken for wave B to complete and 24% - 115% of the time taken for wave A to complete.
Current Analysis Settings: Analysis Date Range: 14-Jul-2015 to 12-Feb-2016, Label Range: 15 - 50, Preferred Count Labels: 24, Min Rating: 75, Stocks toggle ON, Bias Towards Beginning of Data: 8, Bias Towards Major High/Low: 8, Largest Degree Wave Filter: Any Pattern
Rating:86.1
Current Trading Positions for iShares Nasdaq Biotechnology Index Fund ETF (IBB) Daily on 12-Feb-2016
* A Primary degree trader (hold positions from months to years), would currently be shorting this market. The probability of this Target Area being correct is 40.1%. However, the random probability of this Target Area being correct is 34.0%. So the true probability of this Target Area being correct is 17.9% better than random.
* A Cycle degree trader (hold positions from quarters to years), would currently be trading long in this market. The probability of this Target Area being correct is 85.6%. However, the random probability of this Target Area being correct is 64.1%. So the true probability of this Target Area being correct is 33.5% better than random.
Extensive Elliott Commentary for iShares Nasdaq Biotechnology Index Fund ETF (IBB) Daily on 12-Feb-2016 with three incomplete patterns:
Wave (C) of the Intermediate degree Flat with a rating of 98.6 is expected to complete in the price range 188.1 to 313.07, but more probably between 217.27 and 275.77. This wave is due to complete anytime from now until 18-Mar-2016, but is most likely to complete before 24-Feb-2016.
This wave (C) will complete the Flat pattern.
This is the final wave in the pattern. When complete it will also complete wave B of the Primary degree inverted Flat with a rating of 77.6. These two waves have the same target ranges.
After wave B is complete, expect the market to continue up into wave C, which should be a five wave Impulsive pattern. Expect wave C to retrace wave B by 80% - 169%. Wave C can also be expected to be 99% - 169% of the price length of wave A. The expected time for wave C to complete is 19% - 187% of the time taken for wave B to complete and 56% - 268% of the time taken for wave A to complete.
Wave y of the Cycle degree inverted Double 3 with a rating of 86.1 is expected to complete in the price range 299.45 to 840.48, but more probably between 342.73 and 528.51. This wave was expected to complete before 31-Dec-2015, and must complete by 17-Feb-2016.
Wave y will probably complete this Double Sideways pattern, although it could possibly extend into a Triple Sideways pattern.
Current Analysis Settings: Analysis Date Range: 05-Mar-2014 to 12-Feb-2016, Label Range: 15 - 50, Preferred Count Labels: 16, Min Rating: 75, Stocks toggle ON, Bias Towards Beginning of Data: 8, Bias Towards Major High/Low: 8, Largest Degree Wave Filter: Any Pattern
Rating:90.2
Current Trading Positions for iShares PHLX SOX Semiconductor Sector Index Fund (SOXX) Daily on 12-Feb-2016
* A Primary degree trader (hold positions from months to years), would currently be shorting this market. The probability of this Target Area being correct is 65.1%. However, the random probability of this Target Area being correct is 45.0%. So the true probability of this Target Area being correct is 44.7% better than random.
* A Cycle degree trader (hold positions from quarters to years), would currently be shorting this market. The probability of this Target Area being correct is 75.0%. However, the random probability of this Target Area being correct is 64.0%. So the true probability of this Target Area being correct is 17.2% better than random.
Extensive Elliott Commentary for iShares PHLX SOX Semiconductor Sector Index Fund (SOXX) Daily on 12-Feb-2016 with two incomplete patterns:
Wave C of the Primary degree Zigzag with a rating of 103.9 is expected to complete in the price range 45.53 to 77.44, but more probably between 67.2 and 76.94. This wave is due to complete anytime from now until 18-Apr-2016, but is most likely to complete before 29-Feb-2016.
This wave C will complete the ZigZag pattern.
This is the final wave in the pattern. When complete it will also complete wave d of the Cycle degree inverted Contracting Triangle with a rating of 90.2. These two waves have the same target ranges.
Once this wave d is complete, expect the market to continue up to the end of wave e, which will most probably be a ZigZag family pattern or possibly a Contracting Triangle. Expect wave e to have between 39% and 66% of the price range of wave c and complete in 4% to 60% of the time taken by wave c. Expect also that wave e will have between 21% and 47% of the price range of wave a and complete in 2% to 24% of the
time taken by wave a. The slope (ie. price range divided by time taken) of wave e should be between 28% and 143% of the slope of wave c and between 19% to 183% of the slope of wave a. Wave e will complete this Contracting Triangle.
Current Analysis Settings: Analysis Date Range: 06-Dec-2013 to 12-Feb-2016, Label Range: 15 - 50, Preferred Count Labels: 25, Min Rating: 75, Stocks toggle ON, Bias Towards Beginning of Data: 8, Bias Towards Major High/Low: 8, Largest Degree Wave Filter: Any Pattern
Rating:94.6
Current Trading Positions for iShares Russell 1000 Growth Index Fund ETF (IWF) Daily on 12-Feb-2016
* A Cycle degree trader (hold positions from quarters to years), would currently be shorting this market. The probability of this Target Area being correct is 40.8%. However, the random probability of this Target Area being correct is 24.3%. So the true probability of this Target Area being correct is 67.9% better than random.
Extensive Elliott Commentary for iShares Russell 1000 Growth Index Fund ETF (IWF) Daily on 12-Feb-2016 with one incomplete pattern:
Wave y of the Cycle degree Double Zigzag with a rating of 94.6 is expected to complete in the price range 46.19 to 78.29, but more probably between 68.85 and 78.01. This wave is most likely to complete sometime between 25-Feb-2016 and 29-Apr-2016 Note that it cannot complete until 23-Feb-2016 but must complete by 06-Jun-2016.
Wave y will probably complete this Double Sharp pattern, although it could possibly extend into a Triple Sharp pattern.
Current Analysis Settings: Analysis Date Range: 23-Dec-2013 to 12-Feb-2016, Label Range: 15 - 50, Preferred Count Labels: 25, Min Rating: 75, Stocks toggle ON, Bias Towards Beginning of Data: 8, Bias Towards Major High/Low: 8, Largest Degree Wave Filter: Any Pattern
Rating:79.3
Current Trading Positions for iShares Russell 1000 Index Fund ETF (IWB) Daily on 12-Feb-2016
* An Intermediate degree trader (hold positions from months to quarters), would currently be trading long in this market. The probability of this Target Area being correct is 85.9%. However, the random probability of this Target Area being correct is 64.1%. So the true probability of this Target Area being correct is 34.0% better than random.
* A Primary degree trader (hold positions from months to years), would currently be trading long in this market. The probability of this Target Area being correct is 40.7%. However, the random probability of this Target Area being correct is 34.0%. So the true probability of this Target Area being correct is 19.7% better than random.
Extensive Elliott Commentary for iShares Russell 1000 Index Fund ETF (IWB) Daily on 12-Feb-2016 with three incomplete patterns:
Wave C of the Minor degree inverted Flat with a rating of 102.3 is expected to complete in the price range 100.91 to 109.07, but more probably between 103.1 and 106.3. This wave is due to complete anytime from now until 19-Feb-2016, but is most likely to complete before 15-Feb-2016.
This wave C will complete the Flat pattern.
This is the final wave in the pattern. When complete it will also complete wave (Y) of the Intermediate degree inverted Double 3 with a rating of 89.7. These two waves have the same target ranges.
Wave (Y) will probably complete this Double Sideways pattern, although it could possibly extend into a Triple Sideways pattern.
This is the final wave in the pattern. When complete it will also complete wave B of the Primary degree Flat with a rating of 79.3. These two waves have the same target ranges.
After wave B is complete, expect the market to continue down into wave C, which should be a five wave Impulsive pattern. Expect wave C to retrace wave B by 86% - 162%. Wave C can also be expected to be 90% - 162% of the price length of wave A. The expected time for wave C to complete is 19% - 134% of the time taken for wave B to complete and 24% - 115% of the time taken for wave A to complete.
Current Analysis Settings: Analysis Date Range: 11-May-2015 to 12-Feb-2016, Label Range: 15 - 50, Preferred Count Labels: 27, Min Rating: 75, Stocks toggle ON, Bias Towards Beginning of Data: 8, Bias Towards Major High/Low: 8, Largest Degree Wave Filter: Any Pattern
Rating:94.5
Current Trading Positions for iShares Russell 1000 Value Index Fund ETF (IWD) Daily on 12-Feb-2016
* A Cycle degree trader (hold positions from quarters to years), would currently be shorting this market. The probability of this Target Area being correct is 40.8%. However, the random probability of this Target Area being correct is 24.3%. So the true probability of this Target Area being correct is 67.9% better than random.
Extensive Elliott Commentary for iShares Russell 1000 Value Index Fund ETF (IWD) Daily on 12-Feb-2016 with one incomplete pattern:
Wave y of the Cycle degree Double Zigzag with a rating of 94.5 is expected to complete in the price range 76.87 to 78.29, but more probably between 77.58 and 78.04. This wave is most likely to complete sometime between 23-Feb-2016 and 21-Jun-2016 Note that it cannot complete until 22-Feb-2016 but must complete by 26-Dec-2016.
Wave y will probably complete this Double Sharp pattern, although it could possibly extend into a Triple Sharp pattern.
Current Analysis Settings: Analysis Date Range: 09-Apr-2015 to 12-Feb-2016, Label Range: 15 - 50, Preferred Count Labels: 19, Min Rating: 75, Stocks toggle ON, Bias Towards Beginning of Data: 8, Bias Towards Major High/Low: 8, Largest Degree Wave Filter: Any Pattern
Rating:85.1
Current Trading Positions for iShares Russell 2000 Index Fund ETF (IWM) Daily on 12-Feb-2016
* A Primary degree trader (hold positions from months to years), would currently be shorting this market. The probability of this Target Area being correct is 65.3%. However, the random probability of this Target Area being correct is 45.0%. So the true probability of this Target Area being correct is 45.1% better than random.
* A Cycle degree trader (hold positions from quarters to years), would currently be shorting this market. The probability of this Target Area being correct is 37.5%. However, the random probability of this Target Area being correct is 24.3%. So the true probability of this Target Area being correct is 54.3% better than random.
Extensive Elliott Commentary for iShares Russell 2000 Index Fund ETF (IWM) Daily on 12-Feb-2016 with two incomplete patterns:
Wave C of the Primary degree Zigzag with a rating of 104.1 is expected to complete in the price range 63.18 to 95.94, but more probably between 80.09 and 93.62. This wave is due to complete anytime from now until 21-Apr-2016, but is most likely to complete before 25-Feb-2016.
This wave C will complete the ZigZag pattern.
This is the final wave in the pattern. When complete it will also complete wave y of the Cycle degree Double Zigzag with a rating of 85.1. These two waves have the same target ranges.
Wave y will probably complete this Double Sharp pattern, although it could possibly extend into a Triple Sharp pattern.
Current Analysis Settings: Analysis Date Range: 13-May-2015 to 12-Feb-2016, Label Range: 15 - 50, Preferred Count Labels: 15, Min Rating: 75, Stocks toggle ON, Bias Towards Beginning of Data: 8, Bias Towards Major High/Low: 8, Largest Degree Wave Filter: Any Pattern
Rating:90.4
Current Trading Positions for iShares Russell 2000 Value Index Fund ETF (IWN) Daily on 12-Feb-2016
* A Minor degree trader (hold positions from weeks to quarters), would currently be trading long in this market. The probability of this Target Area being correct is 65.9%. However, the random probability of this Target Area being correct is 53.0%. So the true probability of this Target Area being correct is 24.3% better than random.
* An Intermediate degree trader (hold positions from months to quarters), would currently be shorting this market. The probability of this Target Area being correct is 41.6%. However, the random probability of this Target Area being correct is 34.0%. So the true probability of this Target Area being correct is 22.4% better than random.
* A Primary degree trader (hold positions from months to years), would currently be trading long in this market. The probability of this Target Area being correct is 82.0%. However, the random probability of this Target Area being correct is 65.0%. So the true probability of this Target Area being correct is 26.2% better than random.
Extensive Elliott Commentary for iShares Russell 2000 Value Index Fund ETF (IWN) Daily on 12-Feb-2016 with three incomplete patterns:
Wave X of the Minor degree Double 3 with a rating of 101 is expected to complete in the price range 80.62 to 115.36, but more probably between 84.02 and 86.95. This wave is most likely to complete sometime between 12-Feb-2016 and 24-Feb-2016 Note that it cannot complete until 12-Feb-2016 but must complete by 04-May-2016.
After wave X is complete, expect the market to continue down into wave Y, which will probably be a three wave corrective pattern. Expect wave Y to retrace wave X by 98% - 190%. Wave Y can also be expected to be 73% - 190% of the price length of wave W. The expected time for wave Y to complete is 25% - 187% of the time taken for wave X to complete and 28% - 204% of the time taken for wave W to complete.
Wave (B) of the Intermediate degree inverted Flat with a rating of 82.1 is expected to complete in the price range 61.94 to 82.36, but more probably between 79.18 and 82.26. This wave is due to complete anytime from now until 27-Apr-2016, but is most likely to complete before 19-Feb-2016.
After wave (B) is complete, expect the market to continue up into wave (C), which should be a five wave Impulsive pattern. Expect wave (C) to retrace wave (B) by 80% - 169%. Wave (C) can also be expected to be 99% - 169% of the price length of wave (A). The expected time for wave (C) to complete is 19% - 187% of the time taken for wave (B) to complete and 56% - 268% of the time taken for wave (A) to complete.
Wave X of the Primary degree Double Zigzag with a rating of 90.4 is expected to complete in the price range 84.02 to 98.66, but more probably between 87.27 and 94.68. This wave is due to complete anytime from now until 27-Jun-2016, but is most likely to complete before 21-Mar-2016.
After wave X is complete, expect the market to continue down into wave Y, which should be a three wave Zigzag pattern. Expect wave Y to retrace wave X by 115% - 269%. Wave Y can also be expected to be 90% - 269% of the price length of wave W. The expected time for wave Y to complete is 22% - 147% of the time taken for wave X to complete and 53% - 204% of the time taken for wave W to complete.
Current Analysis Settings: Analysis Date Range: 13-May-2015 to 12-Feb-2016, Label Range: 15 - 50, Preferred Count Labels: 26, Min Rating: 75, Stocks toggle ON, Bias Towards Beginning of Data: 8, Bias Towards Major High/Low: 8, Largest Degree Wave Filter: Any Pattern
Rating:81.2
Current Trading Positions for iShares Russell 3000 Index Fund ETF (IWV) Daily on 12-Feb-2016
* An Intermediate degree trader (hold positions from months to quarters), would currently be trading long in this market. The probability of this Target Area being correct is 85.8%. However, the random probability of this Target Area being correct is 64.1%. So the true probability of this Target Area being correct is 33.9% better than random.
* A Primary degree trader (hold positions from months to years), would currently be trading long in this market. The probability of this Target Area being correct is 41.3%. However, the random probability of this Target Area being correct is 34.0%. So the true probability of this Target Area being correct is 21.5% better than random.
Extensive Elliott Commentary for iShares Russell 3000 Index Fund ETF (IWV) Daily on 12-Feb-2016 with three incomplete patterns:
Wave C of the Minor degree inverted Flat with a rating of 101.7 is expected to complete in the price range 106.69 to 115.25, but more probably between 108.98 and 112.36. This wave is due to complete anytime from now until 19-Feb-2016, but is most likely to complete before 15-Feb-2016.
This wave C will complete the Flat pattern.
This is the final wave in the pattern. When complete it will also complete wave (Y) of the Intermediate degree inverted Double 3 with a rating of 88.9. These two waves have the same target ranges.
Wave (Y) will probably complete this Double Sideways pattern, although it could possibly extend into a Triple Sideways pattern.
This is the final wave in the pattern. When complete it will also complete wave B of the Primary degree Flat with a rating of 81.2. These two waves have the same target ranges.
After wave B is complete, expect the market to continue down into wave C, which should be a five wave Impulsive pattern. Expect wave C to retrace wave B by 86% - 162%. Wave C can also be expected to be 90% - 162% of the price length of wave A. The expected time for wave C to complete is 19% - 134% of the time taken for wave B to complete and 24% - 115% of the time taken for wave A to complete.
Current Analysis Settings: Analysis Date Range: 11-May-2015 to 12-Feb-2016, Label Range: 15 - 50, Preferred Count Labels: 27, Min Rating: 75, Stocks toggle ON, Bias Towards Beginning of Data: 8, Bias Towards Major High/Low: 8, Largest Degree Wave Filter: Any Pattern
Rating:84.7
Current Trading Positions for iShares Russell MidCap Growth Index Fund ETF (IWP) Daily on 12-Feb-2016
* An Intermediate degree trader (hold positions from months to quarters), would currently be trading long in this market. The probability of this Target Area being correct is 87.2%. However, the random probability of this Target Area being correct is 64.1%. So the true probability of this Target Area being correct is 36.0% better than random.
* A Primary degree trader (hold positions from months to years), would currently be trading long in this market. The probability of this Target Area being correct is 41.0%. However, the random probability of this Target Area being correct is 34.0%. So the true probability of this Target Area being correct is 20.6% better than random.
* A Cycle degree trader (hold positions from quarters to years), would currently be shorting this market. The probability of this Target Area being correct is 85.4%. However, the random probability of this Target Area being correct is 64.1%. So the true probability of this Target Area being correct is 33.2% better than random.
Extensive Elliott Commentary for iShares Russell MidCap Growth Index Fund ETF (IWP) Daily on 12-Feb-2016 with three incomplete patterns:
Wave (Y) of the Intermediate degree inverted Double 3 with a rating of 102.2 is expected to complete in the price range 79.65 to 108.77, but more probably between 84.23 and 92.66. This wave is due to complete anytime from now until 03-Mar-2016, but is most likely to complete before 22-Feb-2016.
Wave (Y) will probably complete this Double Sideways pattern, although it could possibly extend into a Triple Sideways pattern.
This is the final wave in the pattern. When complete it will also complete wave B of the Primary degree Flat with a rating of 80.3. These two waves have the same target ranges.
After wave B is complete, expect the market to continue down into wave C, which should be a five wave Impulsive pattern. Expect wave C to retrace wave B by 86% - 162%. Wave C can also be expected to be 90% - 162% of the price length of wave A. The expected time for wave C to complete is 19% - 134% of the time taken for wave B to complete and 24% - 115% of the time taken for wave A to complete.
Wave y of the Cycle degree Double 3 with a rating of 84.7 is expected to complete in the price range 38.53 to 94.77, but more probably between 66.37 and 83.02. This wave is due to complete anytime from now until 08-Aug-2016, but is most likely to complete before 07-Mar-2016.
Wave y will probably complete this Double Sideways pattern, although it could possibly extend into a Triple Sideways pattern.
Current Analysis Settings: Analysis Date Range: 12-Mar-2015 to 12-Feb-2016, Label Range: 15 - 50, Preferred Count Labels: 19, Min Rating: 75, Stocks toggle ON, Bias Towards Beginning of Data: 8, Bias Towards Major High/Low: 8, Largest Degree Wave Filter: Any Pattern
Rating:102.9
Current Trading Positions for iShares Russell MidCap Index Fund ETF (IWR) Daily on 12-Feb-2016
* An Intermediate degree trader (hold positions from months to quarters), would currently be shorting this market. The probability of this Target Area being correct is 50.2%. However, the random probability of this Target Area being correct is 34.0%. So the true probability of this Target Area being correct is 47.6% better than random.
Extensive Elliott Commentary for iShares Russell MidCap Index Fund ETF (IWR) Daily on 12-Feb-2016 with one incomplete pattern:
Wave (B) of the Intermediate degree inverted Flat with a rating of 102.9 is expected to complete in the price range 98.43 to 142.89, but more probably between 135.97 and 142.65. This wave is due to complete anytime from now until 19-Apr-2016, but is most likely to complete before 18-Feb-2016.
After wave (B) is complete, expect the market to continue up into wave (C), which should be a five wave Impulsive pattern. Expect wave (C) to retrace wave (B) by 80% - 169%. Wave (C) can also be expected to be 99% - 169% of the price length of wave (A). The expected time for wave (C) to complete is 19% - 187% of the time taken for wave (B) to complete and 56% - 268% of the time taken for wave (A) to complete.
Current Analysis Settings: Analysis Date Range: 09-Feb-2015 to 12-Feb-2016, Label Range: 15 - 50, Preferred Count Labels: 17, Min Rating: 75, Stocks toggle ON, Bias Towards Beginning of Data: 8, Bias Towards Major High/Low: 8, Largest Degree Wave Filter: Any Pattern
Rating:90.5
Current Trading Positions for iShares Russell MidCap Value Index Fund ETF (IWS) Daily on 12-Feb-2016
* An Intermediate degree trader (hold positions from months to quarters), would currently be shorting this market. The probability of this Target Area being correct is 88.3%. However, the random probability of this Target Area being correct is 65.0%. So the true probability of this Target Area being correct is 35.8% better than random.
* A Primary degree trader (hold positions from months to years), would currently be trading long in this market. The probability of this Target Area being correct is 44.0%. However, the random probability of this Target Area being correct is 34.0%. So the true probability of this Target Area being correct is 29.4% better than random.
Extensive Elliott Commentary for iShares Russell MidCap Value Index Fund ETF (IWS) Daily on 12-Feb-2016 with two incomplete patterns:
Wave (X) of the Intermediate degree inverted Double Zigzag with a rating of 101.9 is expected to complete in the price range 59.69 to 64.2, but more probably between 61.17 and 63.37. This wave is due to complete anytime from now until 01-Apr-2016, but is most likely to complete before 24-Feb-2016.
After wave (X) is complete, expect the market to continue up into wave (Y), which should be a three wave Zigzag pattern. Expect wave (Y) to retrace wave (X) by 128% - 319%. Wave (Y) can also be expected to be 90% - 319% of the price length of wave (W). The expected time for wave (Y) to complete is 23% - 167% of the time taken for wave (X) to complete and 47% - 204% of the time taken for wave (W) to complete.
Wave B of the Primary degree Flat with a rating of 90.5 is expected to complete in the price range 68.48 to 93.69, but more probably between 68.74 and 75.33. This wave is due to complete anytime from now until 25-Apr-2017, but is most likely to complete before 31-Mar-2016.
After wave B is complete, expect the market to continue down into wave C, which should be a five wave Impulsive pattern. Expect wave C to retrace wave B by 86% - 162%. Wave C can also be expected to be 90% - 162% of the price length of wave A. The expected time for wave C to complete is 19% - 134% of the time taken for wave B to complete and 24% - 115% of the time taken for wave A to complete.
Current Analysis Settings: Analysis Date Range: 09-Feb-2015 to 12-Feb-2016, Label Range: 15 - 50, Preferred Count Labels: 17, Min Rating: 75, Stocks toggle ON, Bias Towards Beginning of Data: 8, Bias Towards Major High/Low: 8, Largest Degree Wave Filter: Any Pattern
Rating:479.2
Current Trading Positions for iShares S&P 100 Index Fund ETF (OEF) Daily on 12-Feb-2016
* A Primary degree trader (hold positions from months to years), would currently be shorting this market. The probability of this Target Area being correct is 78.1%. However, the random probability of this Target Area being correct is 64.0%. So the true probability of this Target Area being correct is 22.0% better than random.
Extensive Elliott Commentary for iShares S&P 100 Index Fund ETF (OEF) Daily on 12-Feb-2016 with one incomplete pattern:
Wave D of the Primary degree inverted Contracting Triangle with a rating of 479.2 is expected to complete in the price range 81.14 to 84.41, but more probably between 81.2 and 83.24. This wave is due to complete anytime from now until 07-Mar-2016, but is most likely to complete before 19-Feb-2016.
Once this wave D is complete, expect the market to continue up to the end of wave E, which will most probably be a ZigZag family pattern or possibly a Contracting Triangle. Expect wave E to have between 39% and 66% of the price range of wave C and complete in 4% to 60% of the time taken by wave C. Expect also that wave E will have between 21% and 47% of the price range of wave A and complete in 2% to 24% of the time taken by wave A. The slope (ie. price range divided by time taken) of wave E should be between 28% and 143% of the slope of wave C and between 19% to 183% of the slope of wave A. Wave E will complete this Contracting Triangle.
Current Analysis Settings: Analysis Date Range: 08-Jun-2015 to 12-Feb-2016, Label Range: 15 - 50, Preferred Count Labels: 20, Min Rating: 75, Stocks toggle ON, Bias Towards Beginning of Data: 8, Bias Towards Major High/Low: 8, Largest Degree Wave Filter: Any Pattern
Rating:82.7
Current Trading Positions for iShares S&P 500 Index Fund ETF (IVV) Daily on 12-Feb-2016
* A Minuette degree trader (hold positions from days to months), would currently be trading long in this market. The probability of this Target Area being correct is 54.8%. However, the random probability of this Target Area being correct is 45.0%. So the true probability of this Target Area being correct is 21.8% better than random.
* A Minute degree trader (hold positions from weeks to months), would currently be shorting this market. The probability of this Target Area being correct is 43.7%. However, the random probability of this Target Area being correct is 34.0%. So the true probability of this Target Area being correct is 28.5% better than random.
* A Minor degree trader (hold positions from weeks to quarters), would currently be trading long in this market. The probability of this Target Area being correct is 55.6%. However, the random probability of this Target Area being correct is 53.0%. So the true probability of this Target Area being correct is 4.9% better than random.
* An Intermediate degree trader (hold positions from months to quarters), would currently be shorting this market. The probability of this Target Area being correct is 77.6%. However, the random probability of this Target Area being correct is 65.0%. So the true probability of this Target Area being correct is 19.4% better than random.
* A Primary degree trader (hold positions from months to years), would currently be trading long in this market. The probability of this Target Area being correct is 41.6%. However, the random probability of this Target Area being correct is 34.0%. So the true probability of this Target Area being correct is 22.4% better than random.
Extensive Elliott Commentary for iShares S&P 500 Index Fund ETF (IVV) Daily on 12-Feb-2016 with five incomplete patterns:
Wave (b) of the Minuette degree Zigzag with a rating of 99.2 is expected to complete in the price range 182.45 to 189.24, but more probably between 183.68 and 186.35. This wave was expected to complete before 12-Feb-2016, and must complete by 19-Feb-2016.
After wave (b) is complete, expect the market to continue down into wave (c), which should be a five wave impulsive pattern. Expect wave (c) to retrace wave (b) by 127% - 277%. Wave (c) can also be expected to be 43% - 277% of the price length of wave (a). The expected time for wave (c) to complete is 20% - 191% of the time taken for wave (b) to complete and 55% - 221% of the time taken for wave (a) to complete.
Wave b of the Minute degree inverted Flat with a rating of 89.2 is expected to complete in the price range 164.51 to 185.54, but more probably between 182.17 and 185.37. This wave is due to complete anytime from now until 29-Feb-2016, but is most likely to complete before 15-Feb-2016.
After wave b is complete, expect the market to continue up into wave c, which should be a five wave Impulsive pattern. Expect wave c to retrace wave b by 83% - 173%. Wave c can also be expected to be 101% - 173% of the price length of wave a. The expected time for wave c to complete is 20% - 190% of the time taken for wave b to complete and 57% - 279% of the time taken for wave a to complete.
Wave X of the Minor degree Double 3 with a rating of 86.9 is expected to complete in the price range 189.03 to 241.23, but more probably between 191.98 and 197.41. This wave is due to complete anytime from now until 22-Mar-2016, but is most likely to complete before 18-Feb-2016.
After wave X is complete, expect the market to continue down into wave Y, which will probably be a three wave corrective pattern. Expect wave Y to retrace wave X by 98% - 183%. Wave Y can also be expected to be 81% - 183% of the price length of wave W. The expected time for wave Y to complete is 40% - 187% of the time taken for wave X to complete and 100% - 304% of the time taken for wave W to complete.
Wave (X) of the Intermediate degree inverted Double Zigzag with a rating of 79.9 is expected to complete in the price range 181.9 to 193.07, but more probably between 185.58 and 191.03. This wave is due to complete anytime from now until 14-Mar-2016, but is most likely to complete before 16-Feb-2016.
After wave (X) is complete, expect the market to continue up into wave (Y), which should be a three wave Zigzag pattern. Expect wave (Y) to retrace wave (X) by 128% - 319%. Wave (Y) can also be expected to be 90% - 319% of the price length of wave (W). The expected time for wave (Y) to complete is 23% - 167% of the time taken for wave (X) to complete and 47% - 204% of the time taken for wave (W) to complete.
Wave B of the Primary degree Flat with a rating of 82.7 is expected to complete in the price range 202.95 to 263.35, but more probably between 203.57 and 219.37. This wave is due to complete anytime from now until 25-Apr-2017, but is most likely to complete before 31-Mar-2016.
After wave B is complete, expect the market to continue down into wave C, which should be a five wave Impulsive pattern. Expect wave C to retrace wave B by 86% - 162%. Wave C can also be expected to be 90% - 162% of the price length of wave A. The expected time for wave C to complete is 19% - 134% of the time taken for wave B to complete and 24% - 115% of the time taken for wave A to complete.
Current Analysis Settings: Analysis Date Range: 09-Apr-2015 to 12-Feb-2016, Label Range: 15 - 50, Preferred Count Labels: 28, Min Rating: 75, Stocks toggle ON, Bias Towards Beginning of Data: 8, Bias Towards Major High/Low: 8, Largest Degree Wave Filter: Any Pattern
Rating:83.9
Current Trading Positions for iShares S&P 500/Barra Growth Index Fund ETF (IVW) Daily on 12-Feb-2016
* An Intermediate degree trader (hold positions from months to quarters), would currently be shorting this market. The probability of this Target Area being correct is 89.2%. However, the random probability of this Target Area being correct is 65.0%. So the true probability of this Target Area being correct is 37.2% better than random.
* A Primary degree trader (hold positions from months to years), would currently be trading long in this market. The probability of this Target Area being correct is 41.9%. However, the random probability of this Target Area being correct is 34.0%. So the true probability of this Target Area being correct is 23.2% better than random.
Extensive Elliott Commentary for iShares S&P 500/Barra Growth Index Fund ETF (IVW) Daily on 12-Feb-2016 with two incomplete patterns:
Wave (X) of the Intermediate degree inverted Double Zigzag with a rating of 104.4 is expected to complete in the price range 101.83 to 105.02, but more probably between 102.53 and 104.07. This wave is due to complete anytime from now until 19-Feb-2016, but is most likely to complete before 15-Feb-2016.
After wave (X) is complete, expect the market to continue up into wave (Y), which should be a three wave Zigzag pattern. Expect wave (Y) to retrace wave (X) by 122% - 303%. Wave (Y) can also be expected to be 91% - 303% of the price length of wave (W). The expected time for wave (Y) to complete is 29% - 156% of the time taken for wave (X) to complete and 87% - 284% of the time taken for wave (W) to complete.
Wave B of the Primary degree Flat with a rating of 83.9 is expected to complete in the price range 114.08 to 149.22, but more probably between 114.44 and 123.63. This wave could complete anytime between now and 29-Aug-2017, but is most likely to complete sometime between 18-Feb-2016 and 29-Apr-2016.
After wave B is complete, expect the market to continue down into wave C, which should be a five wave Impulsive pattern. Expect wave C to retrace wave B by 86% - 162%. Wave C can also be expected to be 90% - 162% of the price length of wave A. The expected time for wave C to complete is 19% - 134% of the time taken for wave B to complete and 24% - 115% of the time taken for wave A to complete.
Current Analysis Settings: Analysis Date Range: 14-Jul-2015 to 12-Feb-2016, Label Range: 15 - 50, Preferred Count Labels: 21, Min Rating: 75, Stocks toggle ON, Bias Towards Beginning of Data: 8, Bias Towards Major High/Low: 8, Largest Degree Wave Filter: Any Pattern
Rating:91.1
Current Trading Positions for iShares S&P 500/Barra Value Index Fund ETF (IVE) Daily on 12-Feb-2016
* An Intermediate degree trader (hold positions from months to quarters), would currently be trading long in this market. The probability of this Target Area being correct is 42.4%. However, the random probability of this Target Area being correct is 24.3%. So the true probability of this Target Area being correct is 74.5% better than random.
* A Primary degree trader (hold positions from months to years), would currently be trading long in this market. The probability of this Target Area being correct is 44.6%. However, the random probability of this Target Area being correct is 34.0%. So the true probability of this Target Area being correct is 31.2% better than random.
Extensive Elliott Commentary for iShares S&P 500/Barra Value Index Fund ETF (IVE) Daily on 12-Feb-2016 with two incomplete patterns:
Wave (Y) of the Intermediate degree inverted Double Zigzag with a rating of 102.5 is expected to complete in the price range 84.44 to 102.98, but more probably between 85.24 and 91.93. This wave is most likely to complete sometime between 12-Feb-2016 and 25-Feb-2016 Note that it cannot complete until 12-Feb-2016 but must complete by 21-Mar-2016.
Wave (Y) will probably complete this Double Sharp pattern, although it could possibly extend into a Triple Sharp pattern.
This is the final wave in the pattern. When complete it will also complete wave B of the Primary degree Flat with a rating of 91.1. These two waves have the same target ranges.
After wave B is complete, expect the market to continue down into wave C, which should be a five wave Impulsive pattern. Expect wave C to retrace wave B by 86% - 162%. Wave C can also be expected to be 90% - 162% of the price length of wave A. The expected time for wave C to complete is 19% - 134% of the time taken for wave B to complete and 24% - 115% of the time taken for wave A to complete.
Current Analysis Settings: Analysis Date Range: 10-Apr-2015 to 12-Feb-2016, Label Range: 15 - 50, Preferred Count Labels: 26, Min Rating: 75, Stocks toggle ON, Bias Towards Beginning of Data: 8, Bias Towards Major High/Low: 8, Largest Degree Wave Filter: Any Pattern
Rating:90.6
Current Trading Positions for iShares S&P Aggressive Allocation Fund (AOA) Daily on 12-Feb-2016
* An Intermediate degree trader (hold positions from months to quarters), would currently be shorting this market. The probability of this Target Area being correct is 88.6%. However, the random probability of this Target Area being correct is 65.0%. So the true probability of this Target Area being correct is 36.3% better than random.
* A Primary degree trader (hold positions from months to years), would currently be trading long in this market. The probability of this Target Area being correct is 44.0%. However, the random probability of this Target Area being correct is 34.0%. So the true probability of this Target Area being correct is 29.4% better than random.
Extensive Elliott Commentary for iShares S&P Aggressive Allocation Fund (AOA) Daily on 12-Feb-2016 with two incomplete patterns:
Wave (X) of the Intermediate degree inverted Double Zigzag with a rating of 102.1 is expected to complete in the price range 40.59 to 42.59, but more probably between 41.25 and 42.23. This wave is due to complete anytime from now until 14-Mar-2016, but is most likely to complete before 16-Feb-2016.
After wave (X) is complete, expect the market to continue up into wave (Y), which should be a three wave Zigzag pattern. Expect wave (Y) to retrace wave (X) by 128% - 319%. Wave (Y) can also be expected to be 90% - 319% of the price length of wave (W). The expected time for wave (Y) to complete is 23% - 167% of the time taken for wave (X) to complete and 47% - 204% of the time taken for wave (W) to complete.
Wave B of the Primary degree Flat with a rating of 90.6 is expected to complete in the price range 44.69 to 56.47, but more probably between 44.81 and 47.89. This wave is due to complete anytime from now until 17-Apr-2017, but is most likely to complete before 30-Mar-2016.
After wave B is complete, expect the market to continue down into wave C, which should be a five wave Impulsive pattern. Expect wave C to retrace wave B by 86% - 162%. Wave C can also be expected to be 90% - 162% of the price length of wave A. The expected time for wave C to complete is 19% - 134% of the time taken for wave B to complete and 24% - 115% of the time taken for wave A to complete.
Current Analysis Settings: Analysis Date Range: 16-Apr-2015 to 12-Feb-2016, Label Range: 15 - 50, Preferred Count Labels: 18, Min Rating: 75, Stocks toggle ON, Bias Towards Beginning of Data: 8, Bias Towards Major High/Low: 8, Largest Degree Wave Filter: Any Pattern
Rating:82.6
Current Trading Positions for iShares S&P Europe 350 Index Fund ETF (IEV) Daily on 12-Feb-2016
* A Cycle degree trader (hold positions from quarters to years), would currently be trading long in this market. The probability of this Target Area being correct is 41.6%. However, the random probability of this Target Area being correct is 34.0%. So the true probability of this Target Area being correct is 22.4% better than random.
Extensive Elliott Commentary for iShares S&P Europe 350 Index Fund ETF (IEV) Daily on 12-Feb-2016 with two incomplete patterns:
Wave C of the Primary degree inverted Flat with a rating of 94.3 is expected to complete in the price range 38.81 to 47.19, but more probably between 40.13 and 44.94. This wave is most likely to complete sometime between 23-Feb-2016 and 16-May-2016 Note that it cannot complete until 19-Feb-2016 but must complete by 02-Aug-2016.
This wave C will complete the Flat pattern.
This is the final wave in the pattern. When complete it will also complete wave b of the Cycle degree Flat with a rating of 82.6. These two waves have the same target ranges.
After wave b is complete, expect the market to continue down into wave c, which should be a five wave Impulsive pattern. Expect wave c to retrace wave b by 86% - 162%. Wave c can also be expected to be 90% - 162% of the price length of wave a. The expected time for wave c to complete is 19% - 134% of the time taken for wave b to complete and 24% - 115% of the time taken for wave a to complete.
Current Analysis Settings: Analysis Date Range: 08-May-2014 to 12-Feb-2016, Label Range: 15 - 50, Preferred Count Labels: 41, Min Rating: 75, Stocks toggle ON, Bias Towards Beginning of Data: 8, Bias Towards Major High/Low: 8, Largest Degree Wave Filter: Any Pattern
Rating:102.3
Current Trading Positions for iShares S&P Global Energy Sector Index Fund ETF (IXC) Daily on 12-Feb-2016
* A Cycle degree trader (hold positions from quarters to years), would currently be trading long in this market. The probability of this Target Area being correct is 50.2%. However, the random probability of this Target Area being correct is 34.0%. So the true probability of this Target Area being correct is 47.6% better than random.
Extensive Elliott Commentary for iShares S&P Global Energy Sector Index Fund ETF (IXC) Daily on 12-Feb-2016 with one incomplete pattern:
Wave b of the Cycle degree Flat with a rating of 102.3 is expected to complete in the price range 41.24 to 92.27, but more probably between 41.77 and 55.26. This wave could complete anytime between now and 22-Jul-2025, but is most likely to complete sometime between 09-Mar-2016 and 12-May-2017.
After wave b is complete, expect the market to continue down into wave c, which should be a five wave Impulsive pattern. Expect wave c to retrace wave b by 85% - 162%. Wave c can also be expected to be 90% - 162% of the price length of wave a. The expected time for wave c to complete is 20% - 136% of the time taken for wave b to complete and 20% - 110% of the time taken for wave a to complete.
Current Analysis Settings: Analysis Date Range: 12-May-2014 to 12-Feb-2016, Label Range: 15 - 50, Preferred Count Labels: 16, Min Rating: 75, Stocks toggle ON, Bias Towards Beginning of Data: 8, Bias Towards Major High/Low: 8, Largest Degree Wave Filter: Any Pattern
Rating:109.8
Current Trading Positions for iShares S&P Global Healthcare Sector Index Fund ETF (IXJ) Daily on 12-Feb-2016
* An Intermediate degree trader (hold positions from months to quarters), would currently be trading long in this market. The probability of this Target Area being correct is 87.9%. However, the random probability of this Target Area being correct is 64.1%. So the true probability of this Target Area being correct is 37.1% better than random.
Extensive Elliott Commentary for iShares S&P Global Healthcare Sector Index Fund ETF (IXJ) Daily on 12-Feb-2016 with one incomplete pattern:
Wave (Y) of the Intermediate degree inverted Double 3 with a rating of 109.8 is expected to complete in the price range 90.33 to 105.59, but more probably between 92.46 and 96.3. This wave is due to complete anytime from now until 15-Feb-2016, but is most likely to complete before 12-Feb-2016.
Wave (Y) will probably complete this Double Sideways pattern, although it could possibly extend into a Triple Sideways pattern.
Current Analysis Settings: Analysis Date Range: 24-Jun-2015 to 12-Feb-2016, Label Range: 15 - 50, Preferred Count Labels: 46, Min Rating: 75, Stocks toggle ON, Bias Towards Beginning of Data: 8, Bias Towards Major High/Low: 8, Largest Degree Wave Filter: Any Pattern
Rating:76.5
Current Trading Positions for iShares S&P Global Infrastructure Index Fund ETF (IGF) Daily on 12-Feb-2016
* An Intermediate degree trader (hold positions from months to quarters), would currently be shorting this market. The probability of this Target Area being correct is 71.0%. However, the random probability of this Target Area being correct is 45.0%. So the true probability of this Target Area being correct is 57.8% better than random.
* A Cycle degree trader (hold positions from quarters to years), would currently be trading long in this market. The probability of this Target Area being correct is 39.8%. However, the random probability of this Target Area being correct is 34.0%. So the true probability of this Target Area being correct is 17.1% better than random.
Extensive Elliott Commentary for iShares S&P Global Infrastructure Index Fund ETF (IGF) Daily on 12-Feb-2016 with three incomplete patterns:
Wave (2) of the Intermediate degree Impulse with a rating of 98.3 is expected to complete in the price range 32.54 to 35.8, but more probably between 34.19 and 35.46. This wave was expected to complete before 09-Feb-2016, and must complete by 14-Mar-2016.
After this wave (2) is complete, expect the market to continue up into wave (3). Wave (3) should always be an Impulse and should retrace wave (2) completely. Expect wave (3) to retrace wave (2) by 164% - 383%. Wave (3) can also be expected to be 83% - 383% of the price length of wave (1). The expected time for wave (3) to complete is 87% - 367% of the time taken for wave (2) to complete and 16% - 97% of the time taken for wave (1) to complete. The slope (ie. price range divided by time taken) of wave (3) should be between 70% and 219% of the slope of wave (1). Once wave (3) is complete, expect wave (4) to be a sideways corrective movement, then wave (5) to continue in the same direction as wave (3). Wave (5) will complete this Impulse.
Wave C of the Primary degree inverted Flat with a rating of 84 is expected to complete in the price range 36.36 to 45.18, but more probably between 37.72 and 42.79. This wave is due to complete anytime from now until 03-Jan-2017, but is most likely to complete before 07-Apr-2016.
This wave C will complete the Flat pattern.
This is the final wave in the pattern. When complete it will also complete wave b of the Cycle degree Flat with a rating of 76.5. These two waves have the same target ranges.
After wave b is complete, expect the market to continue down into wave c, which should be a five wave Impulsive pattern. Expect wave c to retrace wave b by 85% - 162%. Wave c can also be expected to be 90% - 162% of the price length of wave a. The expected time for wave c to complete is 20% - 136% of the time taken for wave b to complete and 20% - 110% of the time taken for wave a to complete.
Current Analysis Settings: Analysis Date Range: 25-Jul-2014 to 12-Feb-2016, Label Range: 15 - 50, Preferred Count Labels: 28, Min Rating: 75, Stocks toggle ON, Bias Towards Beginning of Data: 8, Bias Towards Major High/Low: 8, Largest Degree Wave Filter: Any Pattern
Rating:83.1
Current Trading Positions for iShares S&P Growth Allocation Fund (AOR) Daily on 12-Feb-2016
* An Intermediate degree trader (hold positions from months to quarters), would currently be shorting this market. The probability of this Target Area being correct is 70.7%. However, the random probability of this Target Area being correct is 45.0%. So the true probability of this Target Area being correct is 57.1% better than random.
Extensive Elliott Commentary for iShares S&P Growth Allocation Fund (AOR) Daily on 12-Feb-2016 with two incomplete patterns:
Wave (2) of the Intermediate degree Impulse with a rating of 95.1 is expected to complete in the price range 36.12 to 37.51, but more probably between 36.82 and 37.36. This wave was expected to complete before 03-Feb-2016, and must complete by 29-Feb-2016.
After this wave (2) is complete, expect the market to continue up into wave (3). Wave (3) should always be an Impulse and should retrace wave (2) completely. Expect wave (3) to retrace wave (2) by 164% - 383%. Wave (3) can also be expected to be 83% - 383% of the price length of wave (1). The expected time for wave (3) to complete is 87% - 367% of the time taken for wave (2) to complete and 16% - 97% of the time taken for wave (1) to complete. The slope (ie. price range divided by time taken) of wave (3) should be between 70% and 219% of the slope of wave (1). Once wave (3) is complete, expect wave (4) to be a sideways corrective movement, then wave (5) to continue in the same direction as wave (3). Wave (5) will complete this Impulse.
Wave C of the Primary degree inverted Flat with a rating of 83.1 is expected to complete in the price range 37.6 to 43.14, but more probably between 38.73 and 41.69. This wave is due to complete anytime from now until 22-Nov-2016, but is most likely to complete before 18-Mar-2016.
This wave C will complete the Flat pattern.
Current Analysis Settings: Analysis Date Range: 02-Jun-2015 to 12-Feb-2016, Label Range: 15 - 50, Preferred Count Labels: 19, Min Rating: 75, Stocks toggle ON, Bias Towards Beginning of Data: 8, Bias Towards Major High/Low: 8, Largest Degree Wave Filter: Any Pattern
Rating:83.1
Current Trading Positions for iShares S&P GSCI Commodity Indexed Trust ETF (GSG) Daily on 12-Feb-2016
* A Primary degree trader (hold positions from months to years), would currently be shorting this market. The probability of this Target Area being correct is 65.1%. However, the random probability of this Target Area being correct is 45.0%. So the true probability of this Target Area being correct is 44.7% better than random.
* A Cycle degree trader (hold positions from quarters to years), would currently be shorting this market. The probability of this Target Area being correct is 36.5%. However, the random probability of this Target Area being correct is 24.3%. So the true probability of this Target Area being correct is 50.2% better than random.
Extensive Elliott Commentary for iShares S&P GSCI Commodity Indexed Trust ETF (GSG) Daily on 12-Feb-2016 with two incomplete patterns:
Wave C of the Primary degree Zigzag with a rating of 103.7 is expected to complete in the price range 6.25 to 12.27, but more probably between 9.4 and 11.9. This wave could complete anytime between now and 18-May-2016, but is most likely to complete sometime between 15-Feb-2016 and 16-Mar-2016.
This wave C will complete the ZigZag pattern.
This is the final wave in the pattern. When complete it will also complete wave y of the Cycle degree Double Zigzag with a rating of 83.1. These two waves have the same target ranges.
Wave y will probably complete this Double Sharp pattern, although it could possibly extend into a Triple Sharp pattern.
Current Analysis Settings: Analysis Date Range: 09-May-2014 to 12-Feb-2016, Label Range: 15 - 50, Preferred Count Labels: 19, Min Rating: 75, Stocks toggle ON, Bias Towards Beginning of Data: 8, Bias Towards Major High/Low: 8, Largest Degree Wave Filter: Any Pattern
Rating:81.9
Current Trading Positions for iShares S&P GSTI Networking Index Fund ETF (IGN) Daily on 12-Feb-2016
* An Intermediate degree trader (hold positions from months to quarters), would currently be shorting this market. The probability of this Target Area being correct is 48.8%. However, the random probability of this Target Area being correct is 34.0%. So the true probability of this Target Area being correct is 43.5% better than random.
* A Primary degree trader (hold positions from months to years), would currently be trading long in this market. The probability of this Target Area being correct is 55.5%. However, the random probability of this Target Area being correct is 53.0%. So the true probability of this Target Area being correct is 4.7% better than random.
* A Cycle degree trader (hold positions from quarters to years), would currently be shorting this market. The probability of this Target Area being correct is 41.3%. However, the random probability of this Target Area being correct is 34.0%. So the true probability of this Target Area being correct is 21.5% better than random.
Extensive Elliott Commentary for iShares S&P GSTI Networking Index Fund ETF (IGN) Daily on 12-Feb-2016 with three incomplete patterns:
Wave (B) of the Intermediate degree inverted Flat with a rating of 98 is expected to complete in the price range 22.91 to 31.98, but more probably between 30.53 and 31.91. This wave was expected to complete before 10-Feb-2016, and must complete by 18-Mar-2016.
After wave (B) is complete, expect the market to continue up into wave (C), which should be a five wave Impulsive pattern. Expect wave (C) to retrace wave (B) by 83% - 173%. Wave (C) can also be expected to be 101% - 173% of the price length of wave (A). The expected time for wave (C) to complete is 20% - 190% of the time taken for wave (B) to complete and 57% - 279% of the time taken for wave (A) to complete.
Wave X of the Primary degree Double 3 with a rating of 84 is expected to complete in the price range 36.5 to 74.99, but more probably between 36.74 and 40.46. This wave is due to complete anytime from now until 31-Oct-2016, but is most likely to complete before 11-Mar-2016.
After wave X is complete, expect the market to continue down into wave Y, which will probably be a three wave corrective pattern. Expect wave Y to retrace wave X by 98% - 193%. Wave Y can also be expected to be 76% - 193% of the price length of wave W. The expected time for wave Y to complete is 20% - 178% of the time taken for wave X to complete and 12% - 115% of the time taken for wave W to complete.
Wave b of the Cycle degree inverted Flat with a rating of 81.9 is expected to complete in the price range 22.4 to 33.49, but more probably between 30.8 and 33.24. This wave is due to complete anytime from now until 14-Sep-2017, but is most likely to complete before 28-Apr-2016.
After wave b is complete, expect the market to continue up into wave c, which should be a five wave Impulsive pattern. Expect wave c to retrace wave b by 82% - 179%. Wave c can also be expected to be 67% - 179% of the price length of wave a. The expected time for wave c to complete is 20% - 151% of the time taken for wave b to complete and 11% - 58% of the time taken for wave a to complete.
Current Analysis Settings: Analysis Date Range: 06-Dec-2013 to 12-Feb-2016, Label Range: 15 - 50, Preferred Count Labels: 15, Min Rating: 75, Stocks toggle ON, Bias Towards Beginning of Data: 8, Bias Towards Major High/Low: 8, Largest Degree Wave Filter: Any Pattern
Rating:94.2
Current Trading Positions for iShares S&P GSTI Software Index Fund ETF (IGV) Daily on 12-Feb-2016
* An Intermediate degree trader (hold positions from months to quarters), would currently be shorting this market. The probability of this Target Area being correct is 65.3%. However, the random probability of this Target Area being correct is 45.0%. So the true probability of this Target Area being correct is 45.1% better than random.
* A Primary degree trader (hold positions from months to years), would currently be shorting this market. The probability of this Target Area being correct is 40.8%. However, the random probability of this Target Area being correct is 24.3%. So the true probability of this Target Area being correct is 67.9% better than random.
Extensive Elliott Commentary for iShares S&P GSTI Software Index Fund ETF (IGV) Daily on 12-Feb-2016 with two incomplete patterns:
Wave (C) of the Intermediate degree Zigzag with a rating of 104.5 is expected to complete in the price range 62.51 to 82.63, but more probably between 72.14 and 80.93. This wave is due to complete anytime from now until 29-Feb-2016, but is most likely to complete before 17-Feb-2016.
This wave (C) will complete the ZigZag pattern.
This is the final wave in the pattern. When complete it will also complete wave Y of the Primary degree Double Zigzag with a rating of 94.2. These two waves have the same target ranges.
Wave Y will probably complete this Double Sharp pattern, although it could possibly extend into a Triple Sharp pattern.
Current Analysis Settings: Analysis Date Range: 06-Dec-2013 to 12-Feb-2016, Label Range: 15 - 50, Preferred Count Labels: 47, Min Rating: 75, Stocks toggle ON, Bias Towards Beginning of Data: 8, Bias Towards Major High/Low: 8, Largest Degree Wave Filter: Any Pattern
Rating:81.3
Current Trading Positions for iShares S&P India Nifty 50 Index Fund (INDY) Daily on 12-Feb-2016
* An Intermediate degree trader (hold positions from months to quarters), would currently be shorting this market. The probability of this Target Area being correct is 41.4%. However, the random probability of this Target Area being correct is 24.3%. So the true probability of this Target Area being correct is 70.4% better than random.
* A Primary degree trader (hold positions from months to years), would currently be shorting this market. The probability of this Target Area being correct is 40.1%. However, the random probability of this Target Area being correct is 34.0%. So the true probability of this Target Area being correct is 17.9% better than random.
* A Cycle degree trader (hold positions from quarters to years), would currently be trading long in this market. The probability of this Target Area being correct is 41.3%. However, the random probability of this Target Area being correct is 34.0%. So the true probability of this Target Area being correct is 21.5% better than random.
Extensive Elliott Commentary for iShares S&P India Nifty 50 Index Fund (INDY) Daily on 12-Feb-2016 with three incomplete patterns:
Wave (Y) of the Intermediate degree Double Zigzag with a rating of 97.2 is expected to complete in the price range 18.09 to 21.19, but more probably between 19.99 and 21.11. This wave is most likely to complete sometime between 15-Feb-2016 and 24-Feb-2016 Note that it cannot complete until 15-Feb-2016 but must complete by 07-Mar-2016.
Wave (Y) will probably complete this Double Sharp pattern, although it could possibly extend into a Triple Sharp pattern.
This is the final wave in the pattern. When complete it will also complete wave B of the Primary degree inverted Flat with a rating of 77.7. These two waves have the same target ranges.
After wave B is complete, expect the market to continue up into wave C, which should be a five wave Impulsive pattern. Expect wave C to retrace wave B by 82% - 177%. Wave C can also be expected to be 89% - 177% of the price length of wave A. The expected time for wave C to complete is 15% - 160% of the time taken for wave B to complete and 16% - 118% of the time taken for wave A to complete.
Wave b of the Cycle degree Flat with a rating of 81.3 is expected to complete in the price range 30.8 to 47.46, but more probably between 30.97 and 35.33. This wave is due to complete anytime from now until 31-Aug-2018, but is most likely to complete before 15-Mar-2016.
Current Analysis Settings: Analysis Date Range: 19-Dec-2013 to 12-Feb-2016, Label Range: 15 - 50, Preferred Count Labels: 27, Min Rating: 75, Stocks toggle ON, Bias Towards Beginning of Data: 8, Bias Towards Major High/Low: 8, Largest Degree Wave Filter: Any Pattern
After wave b is complete, expect the market to continue down into wave c, which should be a five wave Impulsive pattern. Expect wave c to retrace wave b by 86% - 162%. Wave c can also be expected to be 90% - 162% of the price length of wave a. The expected time for wave c to complete is 19% - 134% of the time taken for wave b to complete and 24% - 115% of the time taken for wave a to complete.
Rating:100.1
Current Trading Positions for iShares S&P Latin America 40 Index Fund ETF (ILF) Daily on 12-Feb-2016
* A Cycle degree trader (hold positions from quarters to years), would currently be trading long in this market. The probability of this Target Area being correct is 50.0%. However, the random probability of this Target Area being correct is 34.0%. So the true probability of this Target Area being correct is 47.1% better than random.
Extensive Elliott Commentary for iShares S&P Latin America 40 Index Fund ETF (ILF) Daily on 12-Feb-2016 with one incomplete pattern:
Wave b of the Cycle degree Flat with a rating of 100.1 is expected to complete in the price range 35.27 to 84.39, but more probably between 35.78 and 48.76. This wave could complete anytime between now and 13-May-2024, but is most likely to complete sometime between 04-Mar-2016 and 13-Mar-2017.
After wave b is complete, expect the market to continue down into wave c, which should be a five wave Impulsive pattern. Expect wave c to retrace wave b by 85% - 162%. Wave c can also be expected to be 90% - 162% of the price length of wave a. The expected time for wave c to complete is 20% - 136% of the time taken for wave b to complete and 20% - 110% of the time taken for wave a to complete.
Current Analysis Settings: Analysis Date Range: 23-Jul-2014 to 12-Feb-2016, Label Range: 15 - 50, Preferred Count Labels: 16, Min Rating: 75, Stocks toggle ON, Bias Towards Beginning of Data: 8, Bias Towards Major High/Low: 8, Largest Degree Wave Filter: Any Pattern
Rating:75.6
Current Trading Positions for iShares S&P MidCap 400 Index Fund ETF (IJH) Daily on 12-Feb-2016
Extensive Elliott Commentary for iShares S&P MidCap 400 Index Fund ETF (IJH) Daily on 12-Feb-2016 with three incomplete patterns:
* An Intermediate degree trader (hold positions from months to quarters), would currently be shorting this market. The probability of this Target Area being correct is 52.2%. However, the random probability of this Target Area being correct is 45.0%. So the true probability of this Target Area being correct is 16.0% better than random.
* A Primary degree trader (hold positions from months to years), would currently be trading long in this market. The probability of this Target Area being correct is 32.5%. However, the random probability of this Target Area being correct is 24.3%. So the true probability of this Target Area being correct is 33.7% better than random.
Wave C of the Minor degree Flat with a rating of 99.2 is expected to complete in the price range 118.46 to 129.3, but more probably between 121.84 and 126.34. This wave was expected to complete before 09-Feb-2016, and must complete by 15-Feb-2016.
This wave C will complete the Flat pattern.
This is the final wave in the pattern. When complete it will also complete wave (B) of the Intermediate degree inverted Zigzag with a rating of 86.4. These two waves have the same target ranges.
After wave (B) is complete, expect the market to continue up into wave (C), which should be a five wave impulsive pattern. Expect wave (C) to retrace wave (B) by 114% - 331%. Wave (C) can also be expected to be 53% - 331% of the price length of wave (A). The expected time for wave (C) to complete is 24% - 277% of the time taken for wave (B) to complete and 31% - 204% of the time taken for wave (A) to complete.
Wave Y of the Primary degree inverted Double Zigzag with a rating of 75.6 is expected to complete in the price range 153.02 to 243.77, but more probably between 153.57 and 187.46. This wave is due to complete anytime from now until 18-Apr-2016, but is most likely to complete before 25-Mar-2016.
Wave Y will probably complete this Double Sharp pattern, although it could possibly extend into a Triple Sharp pattern.
Current Analysis Settings: Analysis Date Range: 12-May-2015 to 12-Feb-2016, Label Range: 15 - 50, Preferred Count Labels: 17, Min Rating: 75, Stocks toggle ON, Bias Towards Beginning of Data: 8, Bias Towards Major High/Low: 8, Largest Degree Wave Filter: Any Pattern
Rating:98.3
Current Trading Positions for iShares S&P MidCap 400/Barra Growth Index Fund ETF (IJK) Daily on 12-Feb-2016
After wave B is complete, expect the market to continue down into wave C, which should be a five wave Impulsive pattern. Expect wave C to retrace wave B by 86% - 162%. Wave C can also be expected to be 90% - 162% of the price length of wave A. The expected time for wave C to complete is 19% - 134% of the time taken for wave B to complete and 24% - 115% of the time taken for wave A to complete.
* A Primary degree trader (hold positions from months to years), would currently be trading long in this market. The probability of this Target Area being correct is 48.8%. However, the random probability of this Target Area being correct is 34.0%. So the true probability of this Target Area being correct is 43.5% better than random.
Extensive Elliott Commentary for iShares S&P MidCap 400/Barra Growth Index Fund ETF (IJK) Daily on 12-Feb-2016 with one incomplete pattern:
Wave B of the Primary degree Flat with a rating of 98.3 is expected to complete in the price range 159.75 to 215.36, but more probably between 160.32 and 174.86. This wave is most likely to complete sometime between 19-Feb-2016 and 14-Apr-2016 Note that it cannot complete until 15-Feb-2016 but must complete by 24-Apr-2017.
Current Analysis Settings: Analysis Date Range: 12-May-2015 to 12-Feb-2016, Label Range: 15 - 50, Preferred Count Labels: 46, Min Rating: 75, Stocks toggle ON, Bias Towards Beginning of Data: 8, Bias Towards Major High/Low: 8, Largest Degree Wave Filter: Any Pattern
Rating:87.5
Current Trading Positions for iShares S&P MidCap 400/Barra Value Index Fund ETF (IJJ) Daily on 12-Feb-2016
* An Intermediate degree trader (hold positions from months to quarters), would currently be shorting this market. The probability of this Target Area being correct is 88.6%. However, the random probability of this Target Area being correct is 65.0%. So the true probability of this Target Area being correct is 36.3% better than random.
* A Primary degree trader (hold positions from months to years), would currently be trading long in this market. The probability of this Target Area being correct is 43.1%. However, the random probability of this Target Area being correct is 34.0%. So the true probability of this Target Area being correct is 26.8% better than random.
Extensive Elliott Commentary for iShares S&P MidCap 400/Barra Value Index Fund ETF (IJJ) Daily on 12-Feb-2016 with two incomplete patterns:
Wave (X) of the Intermediate degree inverted Double Zigzag with a rating of 102 is expected to complete in the price range 100.71 to 109.44, but more probably between 103.58 and 107.84. This wave is due to complete anytime from now until 01-Apr-2016, but is most likely to complete before 24-Feb-2016.
After wave (X) is complete, expect the market to continue up into wave (Y), which should be a three wave Zigzag pattern. Expect wave (Y) to retrace wave (X) by 128% - 319%. Wave (Y) can also be expected to be 90% - 319% of the price length of wave (W). The expected time for wave (Y) to complete is 23% - 167% of the time taken for wave (X) to complete and 47% - 204% of the time taken for wave (W) to complete.
Wave B of the Primary degree Flat with a rating of 87.5 is expected to complete in the price range 117.62 to 166.14, but more probably between 118.12 and 130.81. This wave is due to complete anytime from now until 25-Apr-2017, but is most likely to complete before 31-Mar-2016.
After wave B is complete, expect the market to continue down into wave C, which should be a five wave Impulsive pattern. Expect wave C to retrace wave B by 86% - 162%. Wave C can also be expected to be 90% - 162% of the price length of wave A. The expected time for wave C to complete is 19% - 134% of the time taken for wave B to complete and 24% - 115% of the time taken for wave A to complete.
Current Analysis Settings: Analysis Date Range: 12-May-2015 to 12-Feb-2016, Label Range: 15 - 50, Preferred Count Labels: 17, Min Rating: 75, Stocks toggle ON, Bias Towards Beginning of Data: 8, Bias Towards Major High/Low: 8, Largest Degree Wave Filter: Any Pattern
Rating:89.8
Current Trading Positions for iShares S&P Moderate Allocation Fund (AOM) Daily on 12-Feb-2016
* An Intermediate degree trader (hold positions from months to quarters), would currently be shorting this market. The probability of this Target Area being correct is 43.7%. However, the random probability of this Target Area being correct is 34.0%. So the true probability of this Target Area being correct is 28.5% better than random.
* A Minute degree trader (hold positions from weeks to months), would currently be shorting this market. The probability of this Target Area being correct is 50.0%. However, the random probability of this Target Area being correct is 34.0%. So the true probability of this Target Area being correct is 47.1% better than random.
* A Minor degree trader (hold positions from weeks to quarters), would currently be trading long in this market. The probability of this Target Area being correct is 56.9%. However, the random probability of this Target Area being correct is 53.0%. So the true probability of this Target Area being correct is 7.4% better than random.
Extensive Elliott Commentary for iShares S&P Moderate Allocation Fund (AOM) Daily on 12-Feb-2016 with three incomplete patterns:
Wave b of the Minute degree inverted Flat with a rating of 100.3 is expected to complete in the price range 31.73 to 32.95, but more probably between 32.76 and 32.94. This wave was expected to complete before 12-Feb-2016, and must complete by 19-Feb-2016.
After wave b is complete, expect the market to continue up into wave c, which should be a five wave Impulsive pattern. Expect wave c to retrace wave b by 83% - 173%. Wave c can also be expected to be 101% - 173% of the price length of wave a. The expected time for wave c to complete is 20% - 190% of the time taken for wave b to complete and 57% - 279% of the time taken for wave a to complete.
Wave X of the Minor degree Double 3 with a rating of 91.2 is expected to complete in the price range 32.96 to 36.48, but more probably between 33.31 and 33.6. This wave is due to complete anytime from now until 04-Apr-2016, but is most likely to complete before 17-Feb-2016.
After wave X is complete, expect the market to continue down into wave Y, which will probably be a three wave corrective pattern. Expect wave Y to retrace wave X by 98% - 190%. Wave Y can also be expected to be 73% - 190% of the price length of wave W. The expected time for wave Y to complete is 25% - 187% of the time taken for wave X to complete and 28% - 204% of the time taken for wave W to complete.
Wave (B) of the Intermediate degree inverted Flat with a rating of 89.8 is expected to complete in the price range 29.05 to 32.84, but more probably between 32.25 and 32.82. This wave is due to complete anytime from now until 19-Apr-2016, but is most likely to complete before 18-Feb-2016.
After wave (B) is complete, expect the market to continue up into wave (C), which should be a five wave Impulsive pattern. Expect wave (C) to retrace wave (B) by 80% - 169%. Wave (C) can also be expected to be 99% - 169% of the price length of wave (A). The expected time for wave (C) to complete is 19% - 187% of the time taken for wave (B) to complete and 56% - 268% of the time taken for wave (A) to complete.
Current Analysis Settings: Analysis Date Range: 17-Feb-2015 to 12-Feb-2016, Label Range: 15 - 50, Preferred Count Labels: 49, Min Rating: 75, Stocks toggle ON, Bias Towards Beginning of Data: 8, Bias Towards Major High/Low: 8, Largest Degree Wave Filter: Any Pattern
Rating:83.5
Current Trading Positions for iShares S&P National Municipal Bond ETF (MUB) Daily on 12-Feb-2016
After wave x is complete, expect the market to continue down into wave y, which should be a three wave Zigzag pattern. Expect wave y to retrace wave x by 117% - 263%. Wave y can also be expected to be 90% - 263% of the price length of wave w. The expected time for wave y to complete is 21% - 161% of the time taken for wave x to complete and 27% - 154% of the time taken for wave w to complete.
* A Primary degree trader (hold positions from months to years), would currently be trading long in this market. The probability of this Target Area being correct is 53.7%. However, the random probability of this Target Area being correct is 45.0%. So the true probability of this Target Area being correct is 19.3% better than random.
* A Cycle degree trader (hold positions from quarters to years), would currently be trading long in this market. The probability of this Target Area being correct is 79.2%. However, the random probability of this Target Area being correct is 65.0%. So the true probability of this Target Area being correct is 21.8% better than random.
Extensive Elliott Commentary for iShares S&P National Municipal Bond ETF (MUB) Daily on 12-Feb-2016 with two incomplete patterns:
Wave C of the Primary degree inverted Zigzag with a rating of 92.7 is expected to complete in the price range 109.36 to 114.82, but more probably between 109.43 and 111.53. This wave was expected to complete before 25-Nov-2015, and must complete by 05-Apr-2016.
This wave C will complete the ZigZag pattern.
This is the final wave in the pattern. When complete it will also complete wave x of the Cycle degree Double Zigzag with a rating of 83.5. These two waves have the same target ranges.
Current Analysis Settings: Analysis Date Range: 06-Dec-2013 to 12-Feb-2016, Label Range: 15 - 50, Preferred Count Labels: 15, Min Rating: 75, Stocks toggle ON, Bias Towards Beginning of Data: 8, Bias Towards Major High/Low: 8, Largest Degree Wave Filter: Any Pattern
Rating:85.6
Current Trading Positions for iShares S&P SmallCap 600 Index Fund ETF (IJR) Daily on 12-Feb-2016
* A Minor degree trader (hold positions from weeks to quarters), would currently be trading long in this market. The probability of this Target Area being correct is 55.5%. However, the random probability of this Target Area being correct is 53.0%. So the true probability of this Target Area being correct is 4.7% better than random.
* An Intermediate degree trader (hold positions from months to quarters), would currently be shorting this market. The probability of this Target Area being correct is 41.3%. However, the random probability of this Target Area being correct is 34.0%. So the true probability of this Target Area being correct is 21.5% better than random.
* A Primary degree trader (hold positions from months to years), would currently be trading long in this market. The probability of this Target Area being correct is 80.0%. However, the random probability of this Target Area being correct is 65.0%. So the true probability of this Target Area being correct is 23.1% better than random.
Extensive Elliott Commentary for iShares S&P SmallCap 600 Index Fund ETF (IJR) Daily on 12-Feb-2016 with four incomplete patterns:
Wave c of the Minute degree inverted Flat with a rating of 99.8 is expected to complete in the price range 97.05 to 103.84, but more probably between 98.65 and 101.91. This wave is due to complete anytime from now until 19-Feb-2016, but is most likely to complete before 15-Feb-2016.
This wave c will complete the Flat pattern.
This is the final wave in the pattern. When complete it will also complete wave X of the Minor degree Double 3 with a rating of 84.4. These two waves have the same target ranges.
After wave X is complete, expect the market to continue down into wave Y, which will probably be a three wave corrective pattern. Expect wave Y to retrace wave X by 98% - 183%. Wave Y can also be expected to be 81% - 183% of the price length of wave W. The expected time for wave Y to complete is 40% - 187% of the time taken for wave X to complete and 100% - 304% of the time taken for wave W to complete.
Wave (B) of the Intermediate degree inverted Flat with a rating of 81.8 is expected to complete in the price range 75.83 to 99.36, but more probably between 95.7 and 99.24. This wave is due to complete anytime from now until 09-May-2016, but is most likely to complete before 22-Feb-2016.
After wave (B) is complete, expect the market to continue up into wave (C), which should be a five wave Impulsive pattern. Expect wave (C) to retrace wave (B) by 80% - 169%. Wave (C) can also be expected to be 99% - 169% of the price length of wave (A). The expected time for wave (C) to complete is 19% - 187% of the time taken for wave (B) to complete and 56% - 268% of the time taken for wave (A) to complete.
Wave X of the Primary degree Double Zigzag with a rating of 85.6 is expected to complete in the price range 100.9 to 117.21, but more probably between 105.47 and 113.82. This wave is due to complete anytime from now until 28-Jun-2016, but is most likely to complete before 07-Mar-2016.
After wave X is complete, expect the market to continue down into wave Y, which should be a three wave Zigzag pattern. Expect wave Y to retrace wave X by 117% - 263%. Wave Y can also be expected to be 90% - 263% of the price length of wave W. The expected time for wave Y to complete is 21% - 161% of the time taken for wave X to complete and 27% - 154% of the time taken for wave W to complete.
Current Analysis Settings: Analysis Date Range: 12-May-2015 to 12-Feb-2016, Label Range: 15 - 50, Preferred Count Labels: 34, Min Rating: 75, Stocks toggle ON, Bias Towards Beginning of Data: 8, Bias Towards Major High/Low: 8, Largest Degree Wave Filter: Any Pattern
Rating:85.8
Current Trading Positions for iShares S&P SmallCap 600/Barra Value Index Fund ETF (IJS) Daily on 12-Feb-2016
* A Minute degree trader (hold positions from weeks to months), would currently be shorting this market. The probability of this Target Area being correct is 48.2%. However, the random probability of this Target Area being correct is 34.0%. So the true probability of this Target Area being correct is 41.8% better than random.
* A Minor degree trader (hold positions from weeks to quarters), would currently be trading long in this market. The probability of this Target Area being correct is 55.6%. However, the random probability of this Target Area being correct is 53.0%. So the true probability of this Target Area being correct is 4.9% better than random.
* An Intermediate degree trader (hold positions from months to quarters), would currently be shorting this market. The probability of this Target Area being correct is 42.2%. However, the random probability of this Target Area being correct is 34.0%. So the true probability of this Target Area being correct is 24.1% better than random.
* A Primary degree trader (hold positions from months to years), would currently be trading long in this market. The probability of this Target Area being correct is 80.0%. However, the random probability of this Target Area being correct is 65.0%. So the true probability of this Target Area being correct is 23.1% better than random.
Extensive Elliott Commentary for iShares S&P SmallCap 600/Barra Value Index Fund ETF (IJS) Daily on 12-Feb-2016 with four incomplete patterns:
Wave b of the Minute degree inverted Flat with a rating of 97.1 is expected to complete in the price range 83.74 to 98.98, but more probably between 96.54 and 98.86. This wave was expected to complete before 08-Feb-2016, and must complete by 15-Feb-2016.
After wave b is complete, expect the market to continue up into wave c, which should be a five wave Impulsive pattern. Expect wave c to retrace wave b by 83% - 173%. Wave c can also be expected to be 101% - 173% of the price length of wave a. The expected time for wave c to complete is 20% - 190% of the time taken for wave b to complete and 57% - 279% of the time taken for wave a to complete.
Wave X of the Minor degree Double 3 with a rating of 86.1 is expected to complete in the price range 99.54 to 118.01, but more probably between 100.58 and 102.5. This wave was expected to complete before 11-Feb-2016, and must complete by 01-Mar-2016.
After wave X is complete, expect the market to continue down into wave Y, which will probably be a three wave corrective pattern. Expect wave Y to retrace wave X by 98% - 183%. Wave Y can also be expected to be 81% - 183% of the price length of wave W. The expected time for wave Y to complete is 40% - 187% of the time taken for wave X to complete and 100% - 304% of the time taken for wave W to complete.
Wave (B) of the Intermediate degree inverted Flat with a rating of 84 is expected to complete in the price range 62.41 to 95.91, but more probably between 90.7 and 95.74. This wave is due to complete anytime from now until 08-Apr-2016, but is most likely to complete before 15-Feb-2016.
After wave (B) is complete, expect the market to continue up into wave (C), which should be a five wave Impulsive pattern. Expect wave (C) to retrace wave (B) by 80% - 169%. Wave (C) can also be expected to be 99% - 169% of the price length of wave (A). The expected time for wave (C) to complete is 19% - 187% of the time taken for wave (B) to complete and 56% - 268% of the time taken for wave (A) to complete.
Wave X of the Primary degree Double Zigzag with a rating of 85.8 is expected to complete in the price range 97.02 to 115.34, but more probably between 102.15 and 111.54. This wave is due to complete anytime from now until 30-Jun-2016, but is most likely to complete before 09-Mar-2016.
After wave X is complete, expect the market to continue down into wave Y, which should be a three wave Zigzag pattern. Expect wave Y to retrace wave X by 117% - 263%. Wave Y can also be expected to be 90% - 263% of the price length of wave W. The expected time for wave Y to complete is 21% - 161% of the time taken for wave X to complete and 27% - 154% of the time taken for wave W to complete.
Current Analysis Settings: Analysis Date Range: 12-May-2015 to 12-Feb-2016, Label Range: 15 - 50, Preferred Count Labels: 17, Min Rating: 75, Stocks toggle ON, Bias Towards Beginning of Data: 8, Bias Towards Major High/Low: 8, Largest Degree Wave Filter: Any Pattern
Rating:87.8
Current Trading Positions for iShares S&P US Preferred Stock Index Fund ETF (PFF) Daily on 12-Feb-2016
* An Intermediate degree trader (hold positions from months to quarters), would currently be trading long in this market. The probability of this Target Area being correct is 87.5%. However, the random probability of this Target Area being correct is 64.1%. So the true probability of this Target Area being correct is 36.5% better than random.
* A Primary degree trader (hold positions from months to years), would currently be trading long in this market. The probability of this Target Area being correct is 43.1%. However, the random probability of this Target Area being correct is 34.0%. So the true probability of this Target Area being correct is 26.8% better than random.
Extensive Elliott Commentary for iShares S&P US Preferred Stock Index Fund ETF (PFF) Daily on 12-Feb-2016 with two incomplete patterns:
Wave (Y) of the Intermediate degree inverted Double 3 with a rating of 105.7 is expected to complete in the price range 36.33 to 40.88, but more probably between 36.96 and 38.38. This wave is due to complete anytime from now until 15-Feb-2016, but is most likely to complete before 12-Feb-2016.
Wave (Y) will probably complete this Double Sideways pattern, although it could possibly extend into a Triple Sideways pattern.
This is the final wave in the pattern. When complete it will also complete wave B of the Primary degree Flat with a rating of 87.8. These two waves have the same target ranges.
After wave B is complete, expect the market to continue down into wave C, which should be a five wave Impulsive pattern. Expect wave C to retrace wave B by 86% - 162%. Wave C can also be expected to be 90% - 162% of the price length of wave A. The expected time for wave C to complete is 19% - 134% of the time taken for wave B to complete and 24% - 115% of the time taken for wave A to complete.
Current Analysis Settings: Analysis Date Range: 18-Feb-2015 to 12-Feb-2016, Label Range: 15 - 50, Preferred Count Labels: 16, Min Rating: 75, Stocks toggle ON, Bias Towards Beginning of Data: 8, Bias Towards Major High/Low: 8, Largest Degree Wave Filter: Any Pattern
Rating:90.6
Current Trading Positions for iShares Silver Trust ETF (SLV) Daily on 12-Feb-2016
* A Primary degree trader (hold positions from months to years), would currently be trading long in this market. The probability of this Target Area being correct is 87.2%. However, the random probability of this Target Area being correct is 64.1%. So the true probability of this Target Area being correct is 36.0% better than random.
* A Cycle degree trader (hold positions from quarters to years), would currently be trading long in this market. The probability of this Target Area being correct is 82.0%. However, the random probability of this Target Area being correct is 65.0%. So the true probability of this Target Area being correct is 26.2% better than random.
Extensive Elliott Commentary for iShares Silver Trust ETF (SLV) Daily on 12-Feb-2016 with two incomplete patterns:
Wave Y of the Primary degree inverted Double 3 with a rating of 102.1 is expected to complete in the price range 13.73 to 22.22, but more probably between 14.95 and 17.92. This wave is due to complete anytime from now until 27-Jun-2016, but is most likely to complete before 30-Mar-2016.
Wave Y will probably complete this Double Sideways pattern, although it could possibly extend into a Triple Sideways pattern.
This is the final wave in the pattern. When complete it will also complete wave x of the Cycle degree Double Zigzag with a rating of 90.6. These two waves have the same target ranges.
After wave x is complete, expect the market to continue down into wave y, which should be a three wave Zigzag pattern. Expect wave y to retrace wave x by 116% - 261%. Wave y can also be expected to be 90% - 261% of the price length of wave w. The expected time for wave y to complete is 21% - 160% of the time taken for wave x to complete and 25% - 152% of the time taken for wave w to complete.
Current Analysis Settings: Analysis Date Range: 10-Jan-2014 to 12-Feb-2016, Label Range: 15 - 50, Preferred Count Labels: 20, Min Rating: 75, Stocks toggle ON, Bias Towards Beginning of Data: 8, Bias Towards Major High/Low: 8, Largest Degree Wave Filter: Any Pattern
Rating:77
Current Trading Positions for JP Morgan Alerian MLP Index ETN (AMJ) Daily on 12-Feb-2016
* A Minor degree trader (hold positions from weeks to quarters), would currently be shorting this market. The probability of this Target Area being correct is 87.3%. However, the random probability of this Target Area being correct is 64.1%. So the true probability of this Target Area being correct is 36.2% better than random.
* An Intermediate degree trader (hold positions from months to quarters), would currently be shorting this market. The probability of this Target Area being correct is 42.5%. However, the random probability of this Target Area being correct is 34.0%. So the true probability of this Target Area being correct is 25.0% better than random.
* A Primary degree trader (hold positions from months to years), would currently be trading long in this market. The probability of this Target Area being correct is 85.6%. However, the random probability of this Target Area being correct is 64.1%. So the true probability of this Target Area being correct is 33.5% better than random.
* A Cycle degree trader (hold positions from quarters to years), would currently be trading long in this market. The probability of this Target Area being correct is 76.8%. However, the random probability of this Target Area being correct is 65.0%. So the true probability of this Target Area being correct is 18.2% better than random.
Extensive Elliott Commentary for JP Morgan Alerian MLP Index ETN (AMJ) Daily on 12-Feb-2016 with four incomplete patterns:
Wave Y of the Minor degree Double 3 with a rating of 103.7 is expected to complete at a price no higher than 25.82, but more probably between 11.76 and 20.07. This wave is due to complete anytime from now until 07-Mar-2016, but is most likely to complete before 18-Feb-2016.
Wave Y will probably complete this Double Sideways pattern, although it could possibly extend into a Triple Sideways pattern.
This is the final wave in the pattern. When complete it will also complete wave (B) of the Intermediate degree inverted Flat with a rating of 85.6. These two waves have the same target ranges.
After wave (B) is complete, expect the market to continue up into wave (C), which should be a five wave Impulsive pattern. Expect wave (C) to retrace wave (B) by 80% - 169%. Wave (C) can also be expected to be 99% - 169% of the price length of wave (A). The expected time for wave (C) to complete is 19% - 187% of the time taken for wave (B) to complete and 56% - 268% of the time taken for wave (A) to complete.
Wave Y of the Primary degree inverted Double 3 with a rating of 86.3 is expected to complete in the price range 31.35 to 42.8, but more probably between 31.35 and 37.47. This wave is due to complete anytime from now until 20-Apr-2016, but is most likely to complete before 26-Feb-2016.
Wave Y will probably complete this Double Sideways pattern, although it could possibly extend into a Triple Sideways pattern.
This is the final wave in the pattern. When complete it will also complete wave x of the Cycle degree Double Zigzag with a rating of 77. These two waves have the same target ranges.
After wave x is complete, expect the market to continue down into wave y, which should be a three wave Zigzag pattern. Expect wave y to retrace wave x by 116% - 261%. Wave y can also be expected to be 90% - 261% of the price length of wave w. The expected time for wave y to complete is 21% - 160% of the time taken for wave x to complete and 25% - 152% of the time taken for wave w to complete.
Current Analysis Settings: Analysis Date Range: 23-Jul-2014 to 12-Feb-2016, Label Range: 15 - 50, Preferred Count Labels: 20, Min Rating: 75, Stocks toggle ON, Bias Towards Beginning of Data: 8, Bias Towards Major High/Low: 8, Largest Degree Wave Filter: Any Pattern
Rating:100.2
Current Trading Positions for KraneShares CSI China Internet ETF (KWEB) Daily on 12-Feb-2016
* A Primary degree trader (hold positions from months to years), would currently be shorting this market. The probability of this Target Area being correct is 64.5%. However, the random probability of this Target Area being correct is 45.0%. So the true probability of this Target Area being correct is 43.3% better than random.
Extensive Elliott Commentary for KraneShares CSI China Internet ETF (KWEB) Daily on 12-Feb-2016 with one incomplete pattern:
Wave C of the Primary degree Zigzag with a rating of 100.2 is expected to complete in the price range 29.12 to 33.56, but more probably between 30.32 and 32.51. This wave is due to complete anytime from now until 25-Mar-2016, but is most likely to complete before 17-Feb-2016.
This wave C will complete the ZigZag pattern.
Current Analysis Settings: Analysis Date Range: 01-May-2015 to 12-Feb-2016, Label Range: 15 - 50, Preferred Count Labels: 33, Min Rating: 75, Stocks toggle ON, Bias Towards Beginning of Data: 8, Bias Towards Major High/Low: 8, Largest Degree Wave Filter: Any Pattern
Rating:102.5
Current Trading Positions for Legg Mason BW Global Income Opportunities (BWG) Daily on 12-Feb-2016
* An Intermediate degree trader (hold positions from months to quarters), would currently be shorting this market. The probability of this Target Area being correct is 57.0%. However, the random probability of this Target Area being correct is 45.0%. So the true probability of this Target Area being correct is 26.7% better than random.
Extensive Elliott Commentary for Legg Mason BW Global Income Opportunities (BWG) Daily on 12-Feb-2016 with one incomplete pattern:
Wave (B) of the Intermediate degree inverted Zigzag with a rating of 102.5 is expected to complete in the price range 10.15 to 11.21, but more probably between 10.6 and 11.07. This wave is due to complete anytime from now until 22-Apr-2016, but is most likely to complete before 17-Feb-2016.
After wave (B) is complete, expect the market to continue up into wave (C), which should be a five wave impulsive pattern. Expect wave (C) to retrace wave (B) by 114% - 331%. Wave (C) can also be expected to be 53% - 331% of the price length of wave (A). The expected time for wave (C) to complete is 24% - 277% of the time taken for wave (B) to complete and 31% - 204% of the time taken for wave (A) to complete.
Current Analysis Settings: Analysis Date Range: 22-Jul-2014 to 12-Feb-2016, Label Range: 15 - 50, Preferred Count Labels: 19, Min Rating: 75, Stocks toggle ON, Bias Towards Beginning of Data: 8, Bias Towards Major High/Low: 8, Largest Degree Wave Filter: Any Pattern
Rating:83.9
Current Trading Positions for Market Vectors Agribusiness ETF (MOO) Daily on 12-Feb-2016
Wave (2) of the Intermediate degree Impulse with a rating of 97.8 is expected to complete in the price range 40.92 to 43.94, but more probably between 42.45 and 43.63. This wave was expected to complete before 11-Feb-2016, and must complete by 17-Mar-2016.
* An Intermediate degree trader (hold positions from months to quarters), would currently be shorting this market. The probability of this Target Area being correct is 70.9%. However, the random probability of this Target Area being correct is 45.0%. So the true probability of this Target Area being correct is 57.6% better than random.
Extensive Elliott Commentary for Market Vectors Agribusiness ETF (MOO) Daily on 12-Feb-2016 with two incomplete patterns:
After this wave (2) is complete, expect the market to continue up into wave (3). Wave (3) should always be an Impulse and should retrace wave (2) completely. Expect wave (3) to retrace wave (2) by 164% - 383%. Wave (3) can also be expected to be 83% - 383% of the price length of wave (1). The expected time for wave (3) to complete is 87% - 367% of the time taken for wave (2) to complete and 16% - 97% of the time taken for wave (1) to complete. The slope (ie. price range divided by time taken) of wave (3) should be between 70% and 219% of the slope of wave (1). Once wave (3) is complete, expect wave (4) to be a sideways corrective movement, then wave (5) to continue in the same direction as wave (3). Wave (5) will complete this Impulse.
Wave C of the Primary degree inverted Flat with a rating of 83.9 is expected to complete in the price range 44.76 to 56.37, but more probably between 47.02 and 53.34. This wave is due to complete anytime from now until 18-Jul-2016, but is most likely to complete before 14-Apr-2016.
This wave C will complete the Flat pattern.
Current Analysis Settings: Analysis Date Range: 06-Apr-2015 to 12-Feb-2016, Label Range: 15 - 50, Preferred Count Labels: 15, Min Rating: 75, Stocks toggle ON, Bias Towards Beginning of Data: 8, Bias Towards Major High/Low: 8, Largest Degree Wave Filter: Any Pattern
Rating:79
Current Trading Positions for Market Vectors Barclays Capital AMT - Free Intermediate Continuous Municipal Index (ITM) Daily on 12-Feb-2016
Extensive Elliott Commentary for Market Vectors Barclays Capital AMT - Free Intermediate Continuous Municipal Index (ITM) Daily on 12-Feb-2016 with three incomplete patterns:
* An Intermediate degree trader (hold positions from months to quarters), would currently be trading long in this market. The probability of this Target Area being correct is 53.7%. However, the random probability of this Target Area being correct is 45.0%. So the true probability of this Target Area being correct is 19.3% better than random.
* A Primary degree trader (hold positions from months to years), would currently be trading long in this market. The probability of this Target Area being correct is 42.8%. However, the random probability of this Target Area being correct is 34.0%. So the true probability of this Target Area being correct is 25.9% better than random.
* A Cycle degree trader (hold positions from quarters to years), would currently be shorting this market. The probability of this Target Area being correct is 40.4%. However, the random probability of this Target Area being correct is 34.0%. So the true probability of this Target Area being correct is 18.8% better than random.
Wave (C) of the Intermediate degree inverted Zigzag with a rating of 92.2 is expected to complete in the price range 23.55 to 25.24, but more probably between 23.57 and 24.24. This wave was expected to complete before 23-Nov-2015, and must complete by 25-Mar-2016.
This wave (C) will complete the ZigZag pattern.
This is the final wave in the pattern. When complete it will also complete wave B of the Primary degree Flat with a rating of 86.7. These two waves have the same target ranges.
After wave B is complete, expect the market to continue down into wave C, which should be a five wave Impulsive pattern. Expect wave C to retrace wave B by 86% - 162%. Wave C can also be expected to be 90% - 162% of the price length of wave A. The expected time for wave C to complete is 19% - 134% of the time taken for wave B to complete and 24% - 115% of the time taken for wave A to complete.
Wave b of the Cycle degree inverted Flat with a rating of 79 is expected to complete in the price range 20.79 to 23.11, but more probably between 22.46 and 23.08. This wave was expected to complete before 18-May-2015, and must complete by 04-Dec-2017.
After wave b is complete, expect the market to continue up into wave c, which should be a five wave Impulsive pattern. Expect wave c to retrace wave b by 82% - 177%. Wave c can also be expected to be 89% - 177% of the price length of wave a. The expected time for wave c to complete is 15% - 160% of the time taken for wave b to complete and 16% - 118% of the time taken for wave a to complete.
Current Analysis Settings: Analysis Date Range: 06-Dec-2013 to 12-Feb-2016, Label Range: 15 - 50, Preferred Count Labels: 27, Min Rating: 75, Stocks toggle ON, Bias Towards Beginning of Data: 8, Bias Towards Major High/Low: 8, Largest Degree Wave Filter: Any Pattern
Rating:82.7
Current Trading Positions for Market Vectors Barclays Capital Municipal Custom High Yield Composite Index (HYD) Daily on 12-Feb-2016
* A Primary degree trader (hold positions from months to years), would currently be trading long in this market. The probability of this Target Area being correct is 42.0%. However, the random probability of this Target Area being correct is 24.3%. So the true probability of this Target Area being correct is 72.8% better than random.
* A Cycle degree trader (hold positions from quarters to years), would currently be trading long in this market. The probability of this Target Area being correct is 41.6%. However, the random probability of this Target Area being correct is 34.0%. So the true probability of this Target Area being correct is 22.4% better than random.
Extensive Elliott Commentary for Market Vectors Barclays Capital Municipal Custom High Yield Composite Index (HYD) Daily on 12-Feb-2016 with two incomplete patterns:
Wave Y of the Primary degree inverted Double Zigzag with a rating of 100.8 is expected to complete in the price range 31.18 to 32.08, but more probably between 31.63 and 31.63. This wave is due to complete anytime from now until 15-Jun-2016, but is most likely to complete before 23-Mar-2016.
Wave Y will probably complete this Double Sharp pattern, although it could possibly extend into a Triple Sharp pattern.
This is the final wave in the pattern. When complete it will also complete wave b of the Cycle degree Flat with a rating of 82.7. These two waves have the same target ranges.
After wave b is complete, expect the market to continue down into wave c, which should be a five wave Impulsive pattern. Expect wave c to retrace wave b by 86% - 162%. Wave c can also be expected to be 90% - 162% of the price length of wave a. The expected time for wave c to complete is 19% - 134% of the time taken for wave b to complete and 24% - 115% of the time taken for wave a to complete.
Current Analysis Settings: Analysis Date Range: 06-Dec-2013 to 12-Feb-2016, Label Range: 15 - 50, Preferred Count Labels: 29, Min Rating: 75, Stocks toggle ON, Bias Towards Beginning of Data: 8, Bias Towards Major High/Low: 8, Largest Degree Wave Filter: Any Pattern
Rating:78.8
Current Trading Positions for Market Vectors Emerging Markets Local Currency Bond ETF (EMLC) Daily on 12-Feb-2016
* A Primary degree trader (hold positions from months to years), would currently be trading long in this market. The probability of this Target Area being correct is 56.0%. However, the random probability of this Target Area being correct is 45.0%. So the true probability of this Target Area being correct is 24.4% better than random.
* A Cycle degree trader (hold positions from quarters to years), would currently be shorting this market. The probability of this Target Area being correct is 34.0%. However, the random probability of this Target Area being correct is 24.3%. So the true probability of this Target Area being correct is 39.9% better than random.
Extensive Elliott Commentary for Market Vectors Emerging Markets Local Currency Bond ETF (EMLC) Daily on 12-Feb-2016 with two incomplete patterns:
Wave B of the Primary degree Zigzag with a rating of 101.6 is expected to complete in the price range 16.35 to 18.46, but more probably between 16.56 and 17.35. This wave is due to complete anytime from now until 04-Jul-2017, but is most likely to complete before 21-Mar-2016.
After wave B is complete, expect the market to continue down into wave C, which should be a five wave impulsive pattern. Expect wave C to retrace wave B by 96% - 215%. Wave C can also be expected to be 33% - 215% of the price length of wave A. The expected time for wave C to complete is 22% - 199% of the time taken for wave B to complete and 24% - 111% of the time taken for wave A to complete.
Wave y of the Cycle degree Double Zigzag with a rating of 78.8 is expected to complete in the price range 13.99 to 15.55, but more probably between 14.82 and 15.5. This wave is due to complete anytime from now until 04-May-2016, but is most likely to complete before 16-Feb-2016.
Wave y will probably complete this Double Sharp pattern, although it could possibly extend into a Triple Sharp pattern.
Current Analysis Settings: Analysis Date Range: 11-Jun-2014 to 12-Feb-2016, Label Range: 15 - 50, Preferred Count Labels: 24, Min Rating: 75, Stocks toggle ON, Bias Towards Beginning of Data: 8, Bias Towards Major High/Low: 8, Largest Degree Wave Filter: Any Pattern
Rating:92.1
Current Trading Positions for Market Vectors Emerging Mkt Hi Yield Bond ETF (HYEM) Daily on 12-Feb-2016
Current Analysis Settings: Analysis Date Range: 28-May-2014 to 12-Feb-2016, Label Range: 15 - 50, Preferred Count Labels: 15, Min Rating: 75, Stocks toggle ON, Bias Towards Beginning of Data: 8, Bias Towards Major High/Low: 8, Largest Degree Wave Filter: Any Pattern
* A Primary degree trader (hold positions from months to years), would currently be shorting this market. The probability of this Target Area being correct is 64.9%. However, the random probability of this Target Area being correct is 45.0%. So the true probability of this Target Area being correct is 44.2% better than random.
* A Cycle degree trader (hold positions from quarters to years), would currently be shorting this market. The probability of this Target Area being correct is 40.4%. However, the random probability of this Target Area being correct is 24.3%. So the true probability of this Target Area being correct is 66.3% better than random.
Extensive Elliott Commentary for Market Vectors Emerging Mkt Hi Yield Bond ETF (HYEM) Daily on 12-Feb-2016 with two incomplete patterns:
Wave C of the Primary degree Zigzag with a rating of 102.3 is expected to complete in the price range 19.13 to 21.49, but more probably between 20.37 and 21.35. This wave is due to complete anytime from now until 15-Apr-2016, but is most likely to complete before 09-Mar-2016.
This wave C will complete the ZigZag pattern.
This is the final wave in the pattern. When complete it will also complete wave y of the Cycle degree Double Zigzag with a rating of 92.1. These two waves have the same target ranges.
Wave y will probably complete this Double Sharp pattern, although it could possibly extend into a Triple Sharp pattern.
Rating:90.8
Current Trading Positions for Market Vectors Gold Miners ETF (GDX) Daily on 12-Feb-2016
This wave (C) will complete the Flat pattern.
* A Primary degree trader (hold positions from months to years), would currently be trading long in this market. The probability of this Target Area being correct is 51.0%. However, the random probability of this Target Area being correct is 45.0%. So the true probability of this Target Area being correct is 13.3% better than random.
* A Cycle degree trader (hold positions from quarters to years), would currently be shorting this market. The probability of this Target Area being correct is 40.0%. However, the random probability of this Target Area being correct is 24.3%. So the true probability of this Target Area being correct is 64.6% better than random.
Extensive Elliott Commentary for Market Vectors Gold Miners ETF (GDX) Daily on 12-Feb-2016 with three incomplete patterns:
Wave (C) of the Intermediate degree inverted Flat with a rating of 102.3 is expected to complete in the price range 13.37 to 24.44, but more probably between 16.09 and 20.25. This wave is due to complete anytime from now until 27-Feb-2017, but is most likely to complete before 14-Apr-2016.
This is the final wave in the pattern. When complete it will also complete wave B of the Primary degree Zigzag with a rating of 80.9. These two waves have the same target ranges.
After wave B is complete, expect the market to continue down into wave C, which should be a five wave impulsive pattern. Expect wave C to retrace wave B by 96% - 215%. Wave C can also be expected to be 33% - 215% of the price length of wave A. The expected time for wave C to complete is 22% - 199% of the time taken for wave B to complete and 24% - 111% of the time taken for wave A to complete.
Wave y of the Cycle degree Double Zigzag with a rating of 90.8 is expected to complete at a price no higher than 11.17, but more probably between 7.29 and 11. This wave is due to complete anytime from now until 08-May-2017, but is most likely to complete before 24-Mar-2016.
Wave y will probably complete this Double Sharp pattern, although it could possibly extend into a Triple Sharp pattern.
Current Analysis Settings: Analysis Date Range: 31-Jan-2014 to 12-Feb-2016, Label Range: 15 - 50, Preferred Count Labels: 28, Min Rating: 75, Stocks toggle ON, Bias Towards Beginning of Data: 8, Bias Towards Major High/Low: 8, Largest Degree Wave Filter: Any Pattern
Rating:87.6
Current Trading Positions for Market Vectors Junior Gold Miners ETF (GDXJ) Daily on 12-Feb-2016
* A Primary degree trader (hold positions from months to years), would currently be trading long in this market. The probability of this Target Area being correct is 87.2%. However, the random probability of this Target Area being correct is 64.1%. So the true probability of this Target Area being correct is 36.0% better than random.
* A Cycle degree trader (hold positions from quarters to years), would currently be trading long in this market. The probability of this Target Area being correct is 80.8%. However, the random probability of this Target Area being correct is 65.0%. So the true probability of this Target Area being correct is 24.3% better than random.
Extensive Elliott Commentary for Market Vectors Junior Gold Miners ETF (GDXJ) Daily on 12-Feb-2016 with two incomplete patterns:
Wave Y of the Primary degree inverted Double 3 with a rating of 102.4 is expected to complete in the price range 17.92 to 44.66, but more probably between 22.16 and 30.48. This wave is due to complete anytime from now until 04-Nov-2016, but is most likely to complete before 19-May-2016.
Wave Y will probably complete this Double Sideways pattern, although it could possibly extend into a Triple Sideways pattern.
This is the final wave in the pattern. When complete it will also complete wave x of the Cycle degree Double Zigzag with a rating of 87.6. These two waves have the same target ranges.
After wave x is complete, expect the market to continue down into wave y, which should be a three wave Zigzag pattern. Expect wave y to retrace wave x by 116% - 261%. Wave y can also be expected to be 90% - 261% of the price length of wave w. The expected time for wave y to complete is 21% - 160% of the time taken for wave x to complete and 25% - 152% of the time taken for wave w to complete.
Current Analysis Settings: Analysis Date Range: 29-May-2014 to 12-Feb-2016, Label Range: 15 - 50, Preferred Count Labels: 20, Min Rating: 75, Stocks toggle ON, Bias Towards Beginning of Data: 8, Bias Towards Major High/Low: 8, Largest Degree Wave Filter: Any Pattern
Rating:79.5
Current Trading Positions for Market Vectors Morningstar Wide Moat ETF (MOAT) Daily on 12-Feb-2016
After wave X is complete, expect the market to continue up into wave Y, which should be a three wave Zigzag pattern. Expect wave Y to retrace wave X by 128% - 319%. Wave Y can also be expected to be 90% - 319% of the price length of wave W. The expected time for wave Y to complete is 23% - 167% of the time taken for wave X to complete and 47% - 204% of the time taken for wave W to complete.
* A Minor degree trader (hold positions from weeks to quarters), would currently be shorting this market. The probability of this Target Area being correct is 88.3%. However, the random probability of this Target Area being correct is 65.0%. So the true probability of this Target Area being correct is 35.8% better than random.
* An Intermediate degree trader (hold positions from months to quarters), would currently be trading long in this market. The probability of this Target Area being correct is 43.7%. However, the random probability of this Target Area being correct is 34.0%. So the true probability of this Target Area being correct is 28.5% better than random.
* A Primary degree trader (hold positions from months to years), would currently be shorting this market. The probability of this Target Area being correct is 40.7%. However, the random probability of this Target Area being correct is 34.0%. So the true probability of this Target Area being correct is 19.7% better than random.
Extensive Elliott Commentary for Market Vectors Morningstar Wide Moat ETF (MOAT) Daily on 12-Feb-2016 with three incomplete patterns:
Wave X of the Minor degree inverted Double Zigzag with a rating of 101.9 is expected to complete in the price range 25.96 to 27.7, but more probably between 26.53 and 27.38. This wave is due to complete anytime from now until 01-Apr-2016, but is most likely to complete before 24-Feb-2016.
Wave (B) of the Intermediate degree Flat with a rating of 89.7 is expected to complete in the price range 29.46 to 39.5, but more probably between 29.56 and 32.19. This wave is due to complete anytime from now until 01-Nov-2016, but is most likely to complete before 07-Mar-2016.
After wave (B) is complete, expect the market to continue down into wave (C), which should be a five wave Impulsive pattern. Expect wave (C) to retrace wave (B) by 86% - 162%. Wave (C) can also be expected to be 90% - 162% of the price length of wave (A). The expected time for wave (C) to complete is 19% - 134% of the time taken for wave (B) to complete and 24% - 115% of the time taken for wave (A) to complete.
Wave B of the Primary degree inverted Flat with a rating of 79.5 is expected to complete in the price range 20.91 to 28.07, but more probably between 26.08 and 27.98. This wave is due to complete anytime from now until 20-Apr-2017, but is most likely to complete before 04-Mar-2016.
After wave B is complete, expect the market to continue up into wave C, which should be a five wave Impulsive pattern. Expect wave C to retrace wave B by 82% - 177%. Wave C can also be expected to be 89% - 177% of the price length of wave A. The expected time for wave C to complete is 15% - 160% of the time taken for wave B to complete and 16% - 118% of the time taken for wave A to complete.
Current Analysis Settings: Analysis Date Range: 13-Oct-2014 to 12-Feb-2016, Label Range: 15 - 50, Preferred Count Labels: 41, Min Rating: 75, Stocks toggle ON, Bias Towards Beginning of Data: 8, Bias Towards Major High/Low: 8, Largest Degree Wave Filter: Any Pattern
Rating:75.8
Current Trading Positions for Market Vectors Oil Service ETF (OIH) Daily on 12-Feb-2016
* A Primary degree trader (hold positions from months to years), would currently be trading long in this market. The probability of this Target Area being correct is 50.4%. However, the random probability of this Target Area being correct is 45.0%. So the true probability of this Target Area being correct is 12.0% better than random.
* A Minor degree trader (hold positions from weeks to quarters), would currently be shorting this market. The probability of this Target Area being correct is 70.7%. However, the random probability of this Target Area being correct is 45.0%. So the true probability of this Target Area being correct is 57.1% better than random.
* A Cycle degree trader (hold positions from quarters to years), would currently be shorting this market. The probability of this Target Area being correct is 32.5%. However, the random probability of this Target Area being correct is 24.3%. So the true probability of this Target Area being correct is 33.7% better than random.
Extensive Elliott Commentary for Market Vectors Oil Service ETF (OIH) Daily on 12-Feb-2016 with four incomplete patterns:
Wave 2 of the Minor degree Impulse with a rating of 95.7 is expected to complete in the price range 20.46 to 24.09, but more probably between 22.29 and 23.72. This wave was expected to complete before 09-Feb-2016, and must complete by 14-Mar-2016.
After this wave 2 is complete, expect the market to continue up into wave 3. Wave 3 should always be an Impulse and should retrace wave 2 completely. Expect wave 3 to retrace wave 2 by 164% - 383%. Wave 3 can also be expected to be 83% - 383% of the price length of wave 1. The expected time for wave 3 to complete is 87% - 367% of the time taken for wave 2 to complete and 16% - 97% of the time taken for wave 1 to complete. The slope (ie. price range divided by time taken) of wave 3 should be between 70% and 219% of the slope of wave 1. Once wave 3 is complete, expect wave 4 to be a sideways corrective movement, then wave 5 to continue in the same direction as wave 3. Wave 5 will complete this Impulse.
Wave (C) of the Intermediate degree inverted Flat with a rating of 84.1 is expected to complete in the price range 26 to 40.73, but more probably between 28.52 and 36.9. This wave is due to complete anytime from now until 28-Feb-2017, but is most likely to complete before 06-Apr-2016.
This wave (C) will complete the Flat pattern.
Wave y will probably complete this Double Sharp pattern, although it could possibly extend into a Triple Sharp pattern.
This is the final wave in the pattern. When complete it will also complete wave B of the Primary degree Zigzag with a rating of 77.9. These two waves have the same target ranges.
After wave B is complete, expect the market to continue down into wave C, which should be a five wave impulsive pattern. Expect wave C to retrace wave B by 96% - 215%. Wave C can also be expected to be 33% - 215% of the price length of wave A. The expected time for wave C to complete is 22% - 199% of the time taken for wave B to complete and 24% - 111% of the time taken for wave A to complete.
Wave y of the Cycle degree Double Zigzag with a rating of 75.8 is expected to complete in the price range 8.62 to 18.51, but more probably between 13.56 and 18.14. This wave was expected to complete before 30-Dec-2015, and must complete by 09-Nov-2016.
Current Analysis Settings: Analysis Date Range: 20-May-2014 to 12-Feb-2016, Label Range: 15 - 50, Preferred Count Labels: 23, Min Rating: 75, Stocks toggle ON, Bias Towards Beginning of Data: 8, Bias Towards Major High/Low: 8, Largest Degree Wave Filter: Any Pattern
Rating:99.8
Current Trading Positions for Market Vectors Russia ETF (RSX) Daily on 12-Feb-2016
Wave y will probably complete this Double Sharp pattern, although it could possibly extend into a Triple Sharp pattern.
* A Primary degree trader (hold positions from months to years), would currently be shorting this market. The probability of this Target Area being correct is 65.1%. However, the random probability of this Target Area being correct is 45.0%. So the true probability of this Target Area being correct is 44.7% better than random.
* A Cycle degree trader (hold positions from quarters to years), would currently be shorting this market. The probability of this Target Area being correct is 41.8%. However, the random probability of this Target Area being correct is 24.3%. So the true probability of this Target Area being correct is 72.0% better than random.
Extensive Elliott Commentary for Market Vectors Russia ETF (RSX) Daily on 12-Feb-2016 with two incomplete patterns:
Wave C of the Primary degree Zigzag with a rating of 103.6 is expected to complete in the price range 1.18 to 12.26, but more probably between 8.76 and 12.09. This wave is due to complete anytime from now until 07-Apr-2016, but is most likely to complete before 01-Mar-2016.
This wave C will complete the ZigZag pattern.
This is the final wave in the pattern. When complete it will also complete wave y of the Cycle degree Double Zigzag with a rating of 99.8. These two waves have the same target ranges.
Current Analysis Settings: Analysis Date Range: 06-Dec-2013 to 12-Feb-2016, Label Range: 15 - 50, Preferred Count Labels: 19, Min Rating: 75, Stocks toggle ON, Bias Towards Beginning of Data: 8, Bias Towards Major High/Low: 8, Largest Degree Wave Filter: Any Pattern
Rating:84.6
Current Trading Positions for Market Vectors Semiconductor ETF (SMH) Daily on 12-Feb-2016
After wave b is complete, expect the market to continue up into wave c, which should be a five wave Impulsive pattern. Expect wave c to retrace wave b by 82% - 179%. Wave c can also be expected to be 67% - 179% of the price length of wave a. The expected time for wave c to complete is 20% - 151% of the time taken for wave b to complete and 11% - 58% of the time taken for wave a to complete.
* A Primary degree trader (hold positions from months to years), would currently be shorting this market. The probability of this Target Area being correct is 56.4%. However, the random probability of this Target Area being correct is 45.0%. So the true probability of this Target Area being correct is 25.3% better than random.
* A Cycle degree trader (hold positions from quarters to years), would currently be shorting this market. The probability of this Target Area being correct is 42.2%. However, the random probability of this Target Area being correct is 34.0%. So the true probability of this Target Area being correct is 24.1% better than random.
Extensive Elliott Commentary for Market Vectors Semiconductor ETF (SMH) Daily on 12-Feb-2016 with two incomplete patterns:
Wave C of the Primary degree Zigzag with a rating of 94.1 is expected to complete in the price range 16.86 to 44.66, but more probably between 35.22 and 44.23. This wave is most likely to complete sometime between 22-Feb-2016 and 24-Jun-2016 Note that it cannot complete until 18-Feb-2016 but must complete by 10-Mar-2017.
This wave C will complete the ZigZag pattern.
This is the final wave in the pattern. When complete it will also complete wave b of the Cycle degree inverted Flat with a rating of 84.6. These two waves have the same target ranges.
Current Analysis Settings: Analysis Date Range: 23-Dec-2013 to 12-Feb-2016, Label Range: 15 - 50, Preferred Count Labels: 27, Min Rating: 75, Stocks toggle ON, Bias Towards Beginning of Data: 8, Bias Towards Major High/Low: 8, Largest Degree Wave Filter: Any Pattern
Rating:102
Current Trading Positions for Market Vectors Vietnam ETF (VNM) Daily on 12-Feb-2016
* A Cycle degree trader (hold positions from quarters to years), would currently be trading long in this market. The probability of this Target Area being correct is 50.1%. However, the random probability of this Target Area being correct is 34.0%. So the true probability of this Target Area being correct is 47.4% better than random.
Extensive Elliott Commentary for Market Vectors Vietnam ETF (VNM) Daily on 12-Feb-2016 with one incomplete pattern:
Wave b of the Cycle degree Flat with a rating of 102 is expected to complete in the price range 20.16 to 42.22, but more probably between 20.39 and 26.22. This wave could complete anytime between now and 13-May-2024, but is most likely to complete sometime between 04-Mar-2016 and 13-Mar-2017.
After wave b is complete, expect the market to continue down into wave c, which should be a five wave Impulsive pattern. Expect wave c to retrace wave b by 85% - 162%. Wave c can also be expected to be 90% - 162% of the price length of wave a. The expected time for wave c to complete is 20% - 136% of the time taken for wave b to complete and 20% - 110% of the time taken for wave a to complete.
Current Analysis Settings: Analysis Date Range: 23-Jul-2014 to 12-Feb-2016, Label Range: 15 - 50, Preferred Count Labels: 15, Min Rating: 75, Stocks toggle ON, Bias Towards Beginning of Data: 8, Bias Towards Major High/Low: 8, Largest Degree Wave Filter: Any Pattern
Rating:95.1
Current Trading Positions for Morgan Stanley China A Share Fund, Inc (CAF) Daily on 12-Feb-2016
* An Intermediate degree trader (hold positions from months to quarters), would currently be shorting this market. The probability of this Target Area being correct is 47.0%. However, the random probability of this Target Area being correct is 34.0%. So the true probability of this Target Area being correct is 38.2% better than random.
Extensive Elliott Commentary for Morgan Stanley China A Share Fund, Inc (CAF) Daily on 12-Feb-2016 with one incomplete pattern:
Wave (B) of the Intermediate degree inverted Flat with a rating of 95.1 is expected to complete in the price range 11.36 to 15.55, but more probably between 14.88 and 15.52. This wave was expected to complete before 28-Jan-2016, and must complete by 16-Feb-2016.
After wave (B) is complete, expect the market to continue up into wave (C), which should be a five wave Impulsive pattern. Expect wave (C) to retrace wave (B) by 83% - 173%. Wave (C) can also be expected to be 101% - 173% of the price length of wave (A). The expected time for wave (C) to complete is 20% - 190% of the time taken for wave (B) to complete and 57% - 279% of the time taken for wave (A) to complete.
Current Analysis Settings: Analysis Date Range: 01-May-2015 to 12-Feb-2016, Label Range: 15 - 50, Preferred Count Labels: 33, Min Rating: 75, Stocks toggle ON, Bias Towards Beginning of Data: 8, Bias Towards Major High/Low: 8, Largest Degree Wave Filter: Any Pattern
Rating:79.8
Current Trading Positions for Nuveen Energy MLP Total Return (JMF) Daily on 12-Feb-2016
Extensive Elliott Commentary for Nuveen Energy MLP Total Return (JMF) Daily on 12-Feb-2016 with two incomplete patterns:
* A Primary degree trader (hold positions from months to years), would currently be shorting this market. The probability of this Target Area being correct is 88.3%. However, the random probability of this Target Area being correct is 65.0%. So the true probability of this Target Area being correct is 35.8% better than random.
* A Cycle degree trader (hold positions from quarters to years), would currently be trading long in this market. The probability of this Target Area being correct is 40.7%. However, the random probability of this Target Area being correct is 34.0%. So the true probability of this Target Area being correct is 19.7% better than random.
Wave X of the Primary degree inverted Double Zigzag with a rating of 101 is expected to complete in the price range 5.88 to 8.56, but more probably between 6.76 and 8.07. This wave is due to complete anytime from now until 08-Mar-2016, but is most likely to complete before 12-Feb-2016.
After wave X is complete, expect the market to continue up into wave Y, which should be a three wave Zigzag pattern. Expect wave Y to retrace wave X by 128% - 319%. Wave Y can also be expected to be 90% - 319% of the price length of wave W. The expected time for wave Y to complete is 23% - 167% of the time taken for wave X to complete and 47% - 204% of the time taken for wave W to complete.
Wave b of the Cycle degree Flat with a rating of 79.8 is expected to complete in the price range 15.86 to 44.19, but more probably between 16.15 and 23.64. This wave could complete anytime between now and 09-May-2022, but is most likely to complete sometime between 23-Feb-2016 and 02-Dec-2016.
After wave b is complete, expect the market to continue down into wave c, which should be a five wave Impulsive pattern. Expect wave c to retrace wave b by 85% - 162%. Wave c can also be expected to be 90% - 162% of the price length of wave a. The expected time for wave c to complete is 20% - 136% of the time taken for wave b to complete and 20% - 110% of the time taken for wave a to complete.
Current Analysis Settings: Analysis Date Range: 18-Jul-2014 to 12-Feb-2016, Label Range: 15 - 50, Preferred Count Labels: 19, Min Rating: 75, Stocks toggle ON, Bias Towards Beginning of Data: 8, Bias Towards Major High/Low: 8, Largest Degree Wave Filter: Any Pattern
Rating:99.4
Current Trading Positions for Nuveen Intermediate Duration Municipal Term Fund (NID) Daily on 12-Feb-2016
Wave Y of the Primary degree inverted Double Zigzag with a rating of 99.4 is expected to complete in the price range 13.56 to 14.44, but more probably between 13.57 and 14.02. This wave is due to complete anytime from now until 04-Mar-2016, but is most likely to complete before 22-Feb-2016.
* A Primary degree trader (hold positions from months to years), would currently be trading long in this market. The probability of this Target Area being correct is 41.8%. However, the random probability of this Target Area being correct is 24.3%. So the true probability of this Target Area being correct is 72.0% better than random.
Extensive Elliott Commentary for Nuveen Intermediate Duration Municipal Term Fund (NID) Daily on 12-Feb-2016 with one incomplete pattern:
Wave Y will probably complete this Double Sharp pattern, although it could possibly extend into a Triple Sharp pattern.
Current Analysis Settings: Analysis Date Range: 06-Dec-2013 to 12-Feb-2016, Label Range: 15 - 50, Preferred Count Labels: 41, Min Rating: 75, Stocks toggle ON, Bias Towards Beginning of Data: 8, Bias Towards Major High/Low: 8, Largest Degree Wave Filter: Any Pattern
Rating:101
Current Trading Positions for Nuveen Preferred Income Opportunities Fund (JPC) Daily on 12-Feb-2016
* A Primary degree trader (hold positions from months to years), would currently be trading long in this market. The probability of this Target Area being correct is 42.2%. However, the random probability of this Target Area being correct is 24.3%. So the true probability of this Target Area being correct is 73.7% better than random.
Extensive Elliott Commentary for Nuveen Preferred Income Opportunities Fund (JPC) Daily on 12-Feb-2016 with one incomplete pattern:
Wave Y of the Primary degree inverted Double Zigzag with a rating of 101 is expected to complete in the price range 10.84 to 13.17, but more probably between 10.88 and 12.06. This wave is most likely to complete sometime between 03-Mar-2016 and 29-Apr-2016 Note that it cannot complete until 29-Feb-2016 but must complete by 03-Jun-2016.
Wave Y will probably complete this Double Sharp pattern, although it could possibly extend into a Triple Sharp pattern.
Current Analysis Settings: Analysis Date Range: 17-Mar-2015 to 12-Feb-2016, Label Range: 15 - 50, Preferred Count Labels: 18, Min Rating: 75, Stocks toggle ON, Bias Towards Beginning of Data: 8, Bias Towards Major High/Low: 8, Largest Degree Wave Filter: Any Pattern
Rating:75.2
Current Trading Positions for Pimco 0-5 Yr High Yld Corp Bond Fd (HYS) Daily on 12-Feb-2016
* An Intermediate degree trader (hold positions from months to quarters), would currently be shorting this market. The probability of this Target Area being correct is 38.0%. However, the random probability of this Target Area being correct is 13.0%. So the true probability of this Target Area being correct is 192.3% better than random.
* A Primary degree trader (hold positions from months to years), would currently be shorting this market. The probability of this Target Area being correct is 14.0%. However, the random probability of this Target Area being correct is 13.0%. So the true probability of this Target Area being correct is 7.7% better than random.
* A Cycle degree trader (hold positions from quarters to years), would currently be shorting this market. The probability of this Target Area being correct is 14.0%. However, the random probability of this Target Area being correct is 13.0%. So the true probability of this Target Area being correct is 7.7% better than random.
Extensive Elliott Commentary for Pimco 0-5 Yr High Yld Corp Bond Fd (HYS) Daily on 12-Feb-2016 with three incomplete patterns:
Wave (3) of the Intermediate degree inverted Impulse with a rating of 95 is expected to complete in the price range 66.11 to 86.86, but more probably between 81.03 and 86.2. This wave is due to complete anytime from now until 08-Apr-2016, but is most likely to complete before 22-Feb-2016.
When complete, expect the overall slope (ie. price range divided by time taken) of this wave (3) to be between 47% to 194% of the slope of wave (1). Then expect the market to pull back into wave (4), which will be corrective in nature and has a probability of 0% of being a Flat or other sideways pattern. Wave (4) should not retrace back into the price range of wave (1) or (2). Expect wave (4) to have between 5% - 140% of the price range of wave (2). The expected time for wave (4) to complete is between 16% - 136% of wave (2). After wave (4), expect wave (5) to move beyond the end of wave (3) to complete this Impulse.
Wave 3 of the Primary degree inverted Impulse with a rating of 75.3 is expected to complete in the price range 73.49 to 88.77, but more probably between 81.4 and 87.3. This wave was expected to complete before 10-Feb-2016, and must complete by 30-Mar-2016.
When complete, expect the overall slope (ie. price range divided by time taken) of this wave 3 to be between 47% to 194% of the slope of wave 1. Then expect the market to pull back into wave 4, which will be corrective in nature and has a probability of 0% of being a Flat or other sideways pattern. Wave 4 should not retrace back into the price range of wave 1 or 2. Expect wave 4 to have between 5% - 140% of the price range of wave 2. The expected time for wave 4 to complete is between 15% - 136% of wave 2. After wave 4, expect wave 5 to move beyond the end of wave 3 to complete this Impulse.
Wave III of the Cycle degree inverted Impulse with a rating of 75.2 is expected to complete in the price range 80.85 to 94.26, but more probably between 87.51 and 92.93. This wave is due to complete anytime from now until 31-Jan-2017, but is most likely to complete before 13-Apr-2016.
When complete, expect the overall slope (ie. price range divided by time taken) of this wave III to be between 47% to 194% of the slope of wave I. Then expect the market to pull back into wave IV, which will be corrective in nature and has a probability of 0% of being a Flat or other sideways pattern. Wave IV should not retrace back into the price range of wave I or II. Expect wave IV to have between 5% - 140% of the price range of wave II. The expected time for wave IV to complete is between 15% - 136% of wave II. After wave IV, expect wave V to move beyond the end of wave III to complete this Impulse.
Current Analysis Settings: Analysis Date Range: 14-May-2014 to 12-Feb-2016, Label Range: 15 - 50, Preferred Count Labels: 16, Min Rating: 75, Stocks toggle ON, Bias Towards Beginning of Data: 8, Bias Towards Major High/Low: 8, Largest Degree Wave Filter: Any Pattern
Rating:102.7
Current Trading Positions for Pimco Dynamic Credit Income Fund (PCI) Daily on 12-Feb-2016
Extensive Elliott Commentary for Pimco Dynamic Credit Income Fund (PCI) Daily on 12-Feb-2016 with one incomplete pattern:
* An Intermediate degree trader (hold positions from months to quarters), would currently be shorting this market. The probability of this Target Area being correct is 50.2%. However, the random probability of this Target Area being correct is 34.0%. So the true probability of this Target Area being correct is 47.6% better than random.
Wave (B) of the Intermediate degree inverted Flat with a rating of 102.7 is expected to complete in the price range 12.89 to 16.95, but more probably between 16.32 and 16.93. This wave is due to complete anytime from now until 19-Apr-2016, but is most likely to complete before 18-Feb-2016.
After wave (B) is complete, expect the market to continue up into wave (C), which should be a five wave Impulsive pattern. Expect wave (C) to retrace wave (B) by 80% - 169%. Wave (C) can also be expected to be 99% - 169% of the price length of wave (A). The expected time for wave (C) to complete is 19% - 187% of the time taken for wave (B) to complete and 56% - 268% of the time taken for wave (A) to complete.
Current Analysis Settings: Analysis Date Range: 19-May-2014 to 12-Feb-2016, Label Range: 15 - 50, Preferred Count Labels: 16, Min Rating: 75, Stocks toggle ON, Bias Towards Beginning of Data: 8, Bias Towards Major High/Low: 8, Largest Degree Wave Filter: Any Pattern
Rating:81.4
Current Trading Positions for PIMCO Enhanced Short Maturity Strategy Fund (MINT) Daily on 12-Feb-2016
This wave (C) will complete the ZigZag pattern.
* An Intermediate degree trader (hold positions from months to quarters), would currently be shorting this market. The probability of this Target Area being correct is 65.1%. However, the random probability of this Target Area being correct is 45.0%. So the true probability of this Target Area being correct is 44.7% better than random.
* A Primary degree trader (hold positions from months to years), would currently be shorting this market. The probability of this Target Area being correct is 41.3%. However, the random probability of this Target Area being correct is 34.0%. So the true probability of this Target Area being correct is 21.5% better than random.
Extensive Elliott Commentary for PIMCO Enhanced Short Maturity Strategy Fund (MINT) Daily on 12-Feb-2016 with two incomplete patterns:
Wave (C) of the Intermediate degree Zigzag with a rating of 103.9 is expected to complete in the price range 99.97 to 100.62, but more probably between 100.36 and 100.59. This wave is due to complete anytime from now until 04-Jul-2016, but is most likely to complete before 09-Mar-2016.
This is the final wave in the pattern. When complete it will also complete wave B of the Primary degree inverted Flat with a rating of 81.4. These two waves have the same target ranges.
After wave B is complete, expect the market to continue up into wave C, which should be a five wave Impulsive pattern. Expect wave C to retrace wave B by 82% - 177%. Wave C can also be expected to be 89% - 177% of the price length of wave A. The expected time for wave C to complete is 15% - 160% of the time taken for wave B to complete and 16% - 118% of the time taken for wave A to complete.
Current Analysis Settings: Analysis Date Range: 06-Dec-2013 to 12-Feb-2016, Label Range: 15 - 50, Preferred Count Labels: 28, Min Rating: 75, Stocks toggle ON, Bias Towards Beginning of Data: 8, Bias Towards Major High/Low: 8, Largest Degree Wave Filter: Any Pattern
Rating:75.2
Current Trading Positions for Pimco Total Return ETF (BOND) Daily on 12-Feb-2016
* An Intermediate degree trader (hold positions from months to quarters), would currently be shorting this market. The probability of this Target Area being correct is 67.7%. However, the random probability of this Target Area being correct is 53.0%. So the true probability of this Target Area being correct is 27.7% better than random.
* A Primary degree trader (hold positions from months to years), would currently be trading long in this market. The probability of this Target Area being correct is 43.7%. However, the random probability of this Target Area being correct is 34.0%. So the true probability of this Target Area being correct is 28.5% better than random.
* A Cycle degree trader (hold positions from quarters to years), would currently be shorting this market. The probability of this Target Area being correct is 84.5%. However, the random probability of this Target Area being correct is 64.1%. So the true probability of this Target Area being correct is 31.8% better than random.
Extensive Elliott Commentary for Pimco Total Return ETF (BOND) Daily on 12-Feb-2016 with three incomplete patterns:
Wave (X) of the Intermediate degree inverted Double 3 with a rating of 103.7 is expected to complete in the price range 98.92 to 104.53, but more probably between 103.67 and 104.14. This wave is due to complete anytime from now until 05-May-2016, but is most likely to complete before 18-Feb-2016.
After wave (X) is complete, expect the market to continue up into wave (Y), which will probably be a three wave corrective pattern. Expect wave (Y) to retrace wave (X) by 98% - 212%. Wave (Y) can also be expected to be 73% - 212% of the price length of wave (W). The expected time for wave (Y) to complete is 27% - 214% of the time taken for wave (X) to complete and 38% - 222% of the time taken for wave (W) to complete.
Wave B of the Primary degree Flat with a rating of 89.7 is expected to complete in the price range 106.12 to 112.85, but more probably between 106.19 and 107.95. This wave is due to complete anytime from now until 20-Apr-2017, but is most likely to complete before 25-Mar-2016.
After wave B is complete, expect the market to continue down into wave C, which should be a five wave Impulsive pattern. Expect wave C to retrace wave B by 86% - 162%. Wave C can also be expected to be 90% - 162% of the price length of wave A. The expected time for wave C to complete is 19% - 134% of the time taken for wave B to complete and 24% - 115% of the time taken for wave A to complete.
Wave y of the Cycle degree Double 3 with a rating of 75.2 is expected to complete in the price range 99.83 to 107.11, but more probably between 103.42 and 105.59. This wave was expected to complete before 04-Jan-2016, and must complete by 15-Apr-2016.
Wave y will probably complete this Double Sideways pattern, although it could possibly extend into a Triple Sideways pattern.
Current Analysis Settings: Analysis Date Range: 06-Feb-2015 to 12-Feb-2016, Label Range: 15 - 50, Preferred Count Labels: 33, Min Rating: 75, Stocks toggle ON, Bias Towards Beginning of Data: 8, Bias Towards Major High/Low: 8, Largest Degree Wave Filter: Any Pattern
Rating:79.8
Current Trading Positions for PowerShares Build America Bond Portfolio (BAB) Daily on 12-Feb-2016
* An Intermediate degree trader (hold positions from months to quarters), would currently be trading long in this market. The probability of this Target Area being correct is 60.5%. However, the random probability of this Target Area being correct is 45.0%. So the true probability of this Target Area being correct is 34.4% better than random.
* A Primary degree trader (hold positions from months to years), would currently be trading long in this market. The probability of this Target Area being correct is 86.2%. However, the random probability of this Target Area being correct is 64.1%. So the true probability of this Target Area being correct is 34.5% better than random.
* A Cycle degree trader (hold positions from quarters to years), would currently be trading long in this market. The probability of this Target Area being correct is 40.7%. However, the random probability of this Target Area being correct is 34.0%. So the true probability of this Target Area being correct is 19.7% better than random.
Extensive Elliott Commentary for PowerShares Build America Bond Portfolio (BAB) Daily on 12-Feb-2016 with three incomplete patterns:
Wave (C) of the Intermediate degree inverted Zigzag with a rating of 97.7 is expected to complete in the price range 29.4 to 32.3, but more probably between 29.5 and 30.59. This wave is due to complete anytime from now until 09-May-2016, but is most likely to complete before 22-Feb-2016.
This wave (C) will complete the ZigZag pattern.
This is the final wave in the pattern. When complete it will also complete wave Y of the Primary degree inverted Double 3 with a rating of 92.8. These two waves have the same target ranges.
Wave Y will probably complete this Double Sideways pattern, although it could possibly extend into a Triple Sideways pattern.
This is the final wave in the pattern. When complete it will also complete wave b of the Cycle degree Flat with a rating of 79.8. These two waves have the same target ranges.
After wave b is complete, expect the market to continue down into wave c, which should be a five wave Impulsive pattern. Expect wave c to retrace wave b by 86% - 162%. Wave c can also be expected to be 90% - 162% of the price length of wave a. The expected time for wave c to complete is 19% - 134% of the time taken for wave b to complete and 24% - 115% of the time taken for wave a to complete.
Current Analysis Settings: Analysis Date Range: 06-Dec-2013 to 12-Feb-2016, Label Range: 15 - 50, Preferred Count Labels: 24, Min Rating: 75, Stocks toggle ON, Bias Towards Beginning of Data: 8, Bias Towards Major High/Low: 8, Largest Degree Wave Filter: Any Pattern
Rating:84.3
Current Trading Positions for PowerShares Buyback Achievers Portfolio (PKW) Daily on 12-Feb-2016
* An Intermediate degree trader (hold positions from months to quarters), would currently be shorting this market. The probability of this Target Area being correct is 88.3%. However, the random probability of this Target Area being correct is 65.0%. So the true probability of this Target Area being correct is 35.8% better than random.
* A Primary degree trader (hold positions from months to years), would currently be trading long in this market. The probability of this Target Area being correct is 42.2%. However, the random probability of this Target Area being correct is 34.0%. So the true probability of this Target Area being correct is 24.1% better than random.
* A Cycle degree trader (hold positions from quarters to years), would currently be shorting this market. The probability of this Target Area being correct is 85.4%. However, the random probability of this Target Area being correct is 64.1%. So the true probability of this Target Area being correct is 33.2% better than random.
Extensive Elliott Commentary for PowerShares Buyback Achievers Portfolio (PKW) Daily on 12-Feb-2016 with three incomplete patterns:
Wave (X) of the Intermediate degree inverted Double Zigzag with a rating of 101.1 is expected to complete in the price range 39.75 to 42.23, but more probably between 40.56 and 41.78. This wave is due to complete anytime from now until 14-Mar-2016, but is most likely to complete before 16-Feb-2016.
After wave (X) is complete, expect the market to continue up into wave (Y), which should be a three wave Zigzag pattern. Expect wave (Y) to retrace wave (X) by 128% - 319%. Wave (Y) can also be expected to be 90% - 319% of the price length of wave (W). The expected time for wave (Y) to complete is 23% - 167% of the time taken for wave (X) to complete and 47% - 204% of the time taken for wave (W) to complete.
Wave B of the Primary degree Flat with a rating of 85 is expected to complete in the price range 45.42 to 61.68, but more probably between 45.58 and 49.84. This wave is due to complete anytime from now until 25-Apr-2017, but is most likely to complete before 31-Mar-2016.
After wave B is complete, expect the market to continue down into wave C, which should be a five wave Impulsive pattern. Expect wave C to retrace wave B by 86% - 162%. Wave C can also be expected to be 90% - 162% of the price length of wave A. The expected time for wave C to complete is 19% - 134% of the time taken for wave B to complete and 24% - 115% of the time taken for wave A to complete.
Wave y of the Cycle degree Double 3 with a rating of 84.3 is expected to complete at a price no higher than 47, but more probably between 7.31 and 30.22. This wave is due to complete anytime from now until 08-Aug-2016, but is most likely to complete before 30-Mar-2016.
Wave y will probably complete this Double Sideways pattern, although it could possibly extend into a Triple Sideways pattern.
Current Analysis Settings: Analysis Date Range: 12-Jan-2015 to 12-Feb-2016, Label Range: 15 - 50, Preferred Count Labels: 15, Min Rating: 75, Stocks toggle ON, Bias Towards Beginning of Data: 8, Bias Towards Major High/Low: 8, Largest Degree Wave Filter: Any Pattern
Rating:80.9
Current Trading Positions for PowerShares CEF Income Composite Portfolio (PCEF) Daily on 12-Feb-2016
Wave Y will probably complete this Double Sharp pattern, although it could possibly extend into a Triple Sharp pattern.
* An Intermediate degree trader (hold positions from months to quarters), would currently be shorting this market. The probability of this Target Area being correct is 54.8%. However, the random probability of this Target Area being correct is 45.0%. So the true probability of this Target Area being correct is 21.8% better than random.
* A Primary degree trader (hold positions from months to years), would currently be trading long in this market. The probability of this Target Area being correct is 35.0%. However, the random probability of this Target Area being correct is 24.3%. So the true probability of this Target Area being correct is 44.0% better than random.
Extensive Elliott Commentary for PowerShares CEF Income Composite Portfolio (PCEF) Daily on 12-Feb-2016 with two incomplete patterns:
Wave (B) of the Intermediate degree inverted Zigzag with a rating of 99.4 is expected to complete in the price range 19.25 to 20.51, but more probably between 19.78 and 20.34. This wave was expected to complete before 11-Feb-2016, and must complete by 30-Mar-2016.
After wave (B) is complete, expect the market to continue up into wave (C), which should be a five wave impulsive pattern. Expect wave (C) to retrace wave (B) by 114% - 331%. Wave (C) can also be expected to be 53% - 331% of the price length of wave (A). The expected time for wave (C) to complete is 24% - 277% of the time taken for wave (B) to complete and 31% - 204% of the time taken for wave (A) to complete.
Wave Y of the Primary degree inverted Double Zigzag with a rating of 80.9 is expected to complete in the price range 24.47 to 33.72, but more probably between 24.56 and 28.64. This wave is due to complete anytime from now until 22-Sep-2016, but is most likely to complete before 18-Apr-2016.
Current Analysis Settings: Analysis Date Range: 20-May-2014 to 12-Feb-2016, Label Range: 15 - 50, Preferred Count Labels: 17, Min Rating: 75, Stocks toggle ON, Bias Towards Beginning of Data: 8, Bias Towards Major High/Low: 8, Largest Degree Wave Filter: Any Pattern
Rating:96.4
Current Trading Positions for PowerShares DB Agriculture Fund ETF (DBA) Daily on 12-Feb-2016
* A Cycle degree trader (hold positions from quarters to years), would currently be shorting this market. The probability of this Target Area being correct is 59.1%. However, the random probability of this Target Area being correct is 45.0%. So the true probability of this Target Area being correct is 31.3% better than random.
Extensive Elliott Commentary for PowerShares DB Agriculture Fund ETF (DBA) Daily on 12-Feb-2016 with one incomplete pattern:
Wave c of the Cycle degree Zigzag with a rating of 96.4 is expected to complete in the price range 18.94 to 19.68, but more probably between 19.31 and 19.31. This wave could complete anytime between now and 04-May-2018, but is most likely to complete sometime between 26-Feb-2016 and 07-Oct-2016.
This wave c will complete the ZigZag pattern.
Current Analysis Settings: Analysis Date Range: 18-Mar-2014 to 12-Feb-2016, Label Range: 15 - 50, Preferred Count Labels: 18, Min Rating: 75, Stocks toggle ON, Bias Towards Beginning of Data: 8, Bias Towards Major High/Low: 8, Largest Degree Wave Filter: Any Pattern
Rating:101.2
Current Trading Positions for PowerShares DB Base Metals Fund (DBB) Daily on 12-Feb-2016
* A Primary degree trader (hold positions from months to years), would currently be shorting this market. The probability of this Target Area being correct is 50.1%. However, the random probability of this Target Area being correct is 34.0%. So the true probability of this Target Area being correct is 47.4% better than random.
Extensive Elliott Commentary for PowerShares DB Base Metals Fund (DBB) Daily on 12-Feb-2016 with one incomplete pattern:
Wave B of the Primary degree inverted Flat with a rating of 101.2 is expected to complete in the price range 10.22 to 11.57, but more probably between 11.19 and 11.55. This wave could complete anytime between now and 09-Jan-2017, but is most likely to complete sometime between 12-Feb-2016 and 25-Mar-2016.
After wave B is complete, expect the market to continue up into wave C, which should be a five wave Impulsive pattern. Expect wave C to retrace wave B by 82% - 177%. Wave C can also be expected to be 89% - 177% of the price length of wave A. The expected time for wave C to complete is 15% - 160% of the time taken for wave B to complete and 16% - 118% of the time taken for wave A to complete.
Current Analysis Settings: Analysis Date Range: 28-Jul-2014 to 12-Feb-2016, Label Range: 15 - 50, Preferred Count Labels: 42, Min Rating: 75, Stocks toggle ON, Bias Towards Beginning of Data: 8, Bias Towards Major High/Low: 8, Largest Degree Wave Filter: Any Pattern
Rating:101.4
Current Trading Positions for PowerShares DB Commodity Index Tracking ETF (DBC) Daily on 12-Feb-2016
* An Intermediate degree trader (hold positions from months to quarters), would currently be shorting this market. The probability of this Target Area being correct is 50.1%. However, the random probability of this Target Area being correct is 34.0%. So the true probability of this Target Area being correct is 47.4% better than random.
Extensive Elliott Commentary for PowerShares DB Commodity Index Tracking ETF (DBC) Daily on 12-Feb-2016 with one incomplete pattern:
Wave (B) of the Intermediate degree inverted Flat with a rating of 101.4 is expected to complete in the price range 7.92 to 12.05, but more probably between 11.41 and 12.03. This wave is due to complete anytime from now until 20-May-2016, but is most likely to complete before 26-Feb-2016.
After wave (B) is complete, expect the market to continue up into wave (C), which should be a five wave Impulsive pattern. Expect wave (C) to retrace wave (B) by 80% - 169%. Wave (C) can also be expected to be 99% - 169% of the price length of wave (A). The expected time for wave (C) to complete is 19% - 187% of the time taken for wave (B) to complete and 56% - 268% of the time taken for wave (A) to complete.
Current Analysis Settings: Analysis Date Range: 12-May-2014 to 12-Feb-2016, Label Range: 15 - 50, Preferred Count Labels: 17, Min Rating: 75, Stocks toggle ON, Bias Towards Beginning of Data: 8, Bias Towards Major High/Low: 8, Largest Degree Wave Filter: Any Pattern
Rating:80.7
Current Trading Positions for Powershares Db Energy Fund (DBE) Daily on 12-Feb-2016
* A Primary degree trader (hold positions from months to years), would currently be trading long in this market. The probability of this Target Area being correct is 53.0%. However, the random probability of this Target Area being correct is 45.0%. So the true probability of this Target Area being correct is 17.8% better than random.
* An Intermediate degree trader (hold positions from months to quarters), would currently be shorting this market. The probability of this Target Area being correct is 50.0%. However, the random probability of this Target Area being correct is 34.0%. So the true probability of this Target Area being correct is 47.1% better than random.
* A Cycle degree trader (hold positions from quarters to years), would currently be shorting this market. The probability of this Target Area being correct is 35.0%. However, the random probability of this Target Area being correct is 24.3%. So the true probability of this Target Area being correct is 44.0% better than random.
Extensive Elliott Commentary for Powershares Db Energy Fund (DBE) Daily on 12-Feb-2016 with three incomplete patterns:
Wave (B) of the Intermediate degree inverted Flat with a rating of 100.3 is expected to complete in the price range 3.09 to 9.2, but more probably between 8.25 and 9.16. This wave is due to complete anytime from now until 08-Apr-2016, but is most likely to complete before 15-Feb-2016.
After wave (B) is complete, expect the market to continue up into wave (C), which should be a five wave Impulsive pattern. Expect wave (C) to retrace wave (B) by 80% - 169%. Wave (C) can also be expected to be 99% - 169% of the price length of wave (A). The expected time for wave (C) to complete is 19% - 187% of the time taken for wave (B) to complete and 56% - 268% of the time taken for wave (A) to complete.
Wave B of the Primary degree Zigzag with a rating of 90.6 is expected to complete in the price range 8.83 to 14.32, but more probably between 9.37 and 11.44. This wave is due to complete anytime from now until 02-Mar-2017, but is most likely to complete before 07-Mar-2016.
After wave B is complete, expect the market to continue down into wave C, which should be a five wave impulsive pattern. Expect wave C to retrace wave B by 96% - 215%. Wave C can also be expected to be 33% - 215% of the price length of wave A. The expected time for wave C to complete is 22% - 199% of the time taken for wave B to complete and 24% - 111% of the time taken for wave A to complete.
Wave y of the Cycle degree Double Zigzag with a rating of 80.7 is expected to complete in the price range 5.54 to 6.57, but more probably between 6.06 and 6.44. This wave is due to complete anytime from now until 08-Aug-2016, but is most likely to complete before 16-May-2016.
Wave y will probably complete this Double Sharp pattern, although it could possibly extend into a Triple Sharp pattern.
Current Analysis Settings: Analysis Date Range: 08-May-2014 to 12-Feb-2016, Label Range: 15 - 50, Preferred Count Labels: 18, Min Rating: 75, Stocks toggle ON, Bias Towards Beginning of Data: 8, Bias Towards Major High/Low: 8, Largest Degree Wave Filter: Any Pattern
Rating:99.8
Current Trading Positions for PowerShares DB US Dollar Index Bullish Fund (UUP) Daily on 12-Feb-2016
* A Cycle degree trader (hold positions from quarters to years), would currently be shorting this market. The probability of this Target Area being correct is 41.8%. However, the random probability of this Target Area being correct is 24.3%. So the true probability of this Target Area being correct is 72.0% better than random.
Extensive Elliott Commentary for PowerShares DB US Dollar Index Bullish Fund (UUP) Daily on 12-Feb-2016 with one incomplete pattern:
Wave y of the Cycle degree Double Zigzag with a rating of 99.8 is expected to complete in the price range 19.29 to 24.37, but more probably between 22.6 and 24.24. This wave is due to complete anytime from now until 29-Jul-2016, but is most likely to complete before 16-May-2016.
Wave y will probably complete this Double Sharp pattern, although it could possibly extend into a Triple Sharp pattern.
Current Analysis Settings: Analysis Date Range: 25-Mar-2014 to 12-Feb-2016, Label Range: 15 - 50, Preferred Count Labels: 15, Min Rating: 75, Stocks toggle ON, Bias Towards Beginning of Data: 8, Bias Towards Major High/Low: 8, Largest Degree Wave Filter: Any Pattern
Rating:83.7
Current Trading Positions for PowerShares DWA Emerging Markets Technical Leaders Portfolio ETF (PIE) Daily on 12-Feb-2016
Extensive Elliott Commentary for PowerShares DWA Emerging Markets Technical Leaders Portfolio ETF (PIE) Daily on 12-Feb-2016 with two incomplete patterns:
* A Cycle degree trader (hold positions from quarters to years), would currently be trading long in this market. The probability of this Target Area being correct is 41.9%. However, the random probability of this Target Area being correct is 34.0%. So the true probability of this Target Area being correct is 23.2% better than random.
Wave C of the Primary degree inverted Flat with a rating of 99 is expected to complete in the price range 14.1 to 19.97, but more probably between 15.5 and 18.11. This wave is due to complete anytime from now until 28-Feb-2017, but is most likely to complete before 06-Apr-2016.
This wave C will complete the Flat pattern.
This is the final wave in the pattern. When complete it will also complete wave b of the Cycle degree Flat with a rating of 83.7. These two waves have the same target ranges.
After wave b is complete, expect the market to continue down into wave c, which should be a five wave Impulsive pattern. Expect wave c to retrace wave b by 85% - 162%. Wave c can also be expected to be 90% - 162% of the price length of wave a. The expected time for wave c to complete is 20% - 136% of the time taken for wave b to complete and 20% - 110% of the time taken for wave a to complete.
Current Analysis Settings: Analysis Date Range: 23-Jul-2014 to 12-Feb-2016, Label Range: 15 - 50, Preferred Count Labels: 15, Min Rating: 75, Stocks toggle ON, Bias Towards Beginning of Data: 8, Bias Towards Major High/Low: 8, Largest Degree Wave Filter: Any Pattern
Rating:78.5
Current Trading Positions for PowerShares DWA SmCap Technical Ldrs (DWAS) Daily on 12-Feb-2016
* A Primary degree trader (hold positions from months to years), would currently be trading long in this market. The probability of this Target Area being correct is 77.2%. However, the random probability of this Target Area being correct is 65.0%. So the true probability of this Target Area being correct is 18.8% better than random.
* An Intermediate degree trader (hold positions from months to quarters), would currently be trading long in this market. The probability of this Target Area being correct is 85.3%. However, the random probability of this Target Area being correct is 64.1%. So the true probability of this Target Area being correct is 33.1% better than random.
Extensive Elliott Commentary for PowerShares DWA SmCap Technical Ldrs (DWAS) Daily on 12-Feb-2016 with three incomplete patterns:
Wave C of the Minor degree inverted Flat with a rating of 103.1 is expected to complete in the price range 30.06 to 33.1, but more probably between 30.89 and 32.04. This wave is due to complete anytime from now until 19-Feb-2016, but is most likely to complete before 12-Feb-2016.
This wave C will complete the Flat pattern.
This is the final wave in the pattern. When complete it will also complete wave (Y) of the Intermediate degree inverted Double 3 with a rating of 83.7. These two waves have the same target ranges.
Wave (Y) will probably complete this Double Sideways pattern, although it could possibly extend into a Triple Sideways pattern.
This is the final wave in the pattern. When complete it will also complete wave X of the Primary degree Double Zigzag with a rating of 78.5. These two waves have the same target ranges.
After wave X is complete, expect the market to continue down into wave Y, which should be a three wave Zigzag pattern. Expect wave Y to retrace wave X by 117% - 263%. Wave Y can also be expected to be 90% - 263% of the price length of wave W. The expected time for wave Y to complete is 21% - 161% of the time taken for wave X to complete and 27% - 154% of the time taken for wave W to complete.
Current Analysis Settings: Analysis Date Range: 13-Mar-2015 to 12-Feb-2016, Label Range: 15 - 50, Preferred Count Labels: 46, Min Rating: 75, Stocks toggle ON, Bias Towards Beginning of Data: 8, Bias Towards Major High/Low: 8, Largest Degree Wave Filter: Any Pattern
Rating:109.3
Current Trading Positions for PowerShares DWA Technical Leaders Portfolio ETF (PDP) Daily on 12-Feb-2016
* An Intermediate degree trader (hold positions from months to quarters), would currently be trading long in this market. The probability of this Target Area being correct is 87.9%. However, the random probability of this Target Area being correct is 64.1%. So the true probability of this Target Area being correct is 37.1% better than random.
Extensive Elliott Commentary for PowerShares DWA Technical Leaders Portfolio ETF (PDP) Daily on 12-Feb-2016 with one incomplete pattern:
Wave (Y) of the Intermediate degree inverted Double 3 with a rating of 109.3 is expected to complete in the price range 36.03 to 41.94, but more probably between 36.92 and 38.63. This wave is due to complete anytime from now until 15-Feb-2016, but is most likely to complete before 12-Feb-2016.
Wave (Y) will probably complete this Double Sideways pattern, although it could possibly extend into a Triple Sideways pattern.
Current Analysis Settings: Analysis Date Range: 06-Feb-2015 to 12-Feb-2016, Label Range: 15 - 50, Preferred Count Labels: 47, Min Rating: 75, Stocks toggle ON, Bias Towards Beginning of Data: 8, Bias Towards Major High/Low: 8, Largest Degree Wave Filter: Any Pattern
Rating:85.1
Current Trading Positions for PowerShares Dynamic Food & Beverage Portfolio ETF (PBJ) Daily on 12-Feb-2016
* A Minor degree trader (hold positions from weeks to quarters), would currently be shorting this market. The probability of this Target Area being correct is 55.0%. However, the random probability of this Target Area being correct is 45.0%. So the true probability of this Target Area being correct is 22.2% better than random.
* An Intermediate degree trader (hold positions from months to quarters), would currently be trading long in this market. The probability of this Target Area being correct is 40.2%. However, the random probability of this Target Area being correct is 24.3%. So the true probability of this Target Area being correct is 65.4% better than random.
* A Primary degree trader (hold positions from months to years), would currently be trading long in this market. The probability of this Target Area being correct is 42.5%. However, the random probability of this Target Area being correct is 34.0%. So the true probability of this Target Area being correct is 25.0% better than random.
Extensive Elliott Commentary for PowerShares Dynamic Food & Beverage Portfolio ETF (PBJ) Daily on 12-Feb-2016 with three incomplete patterns:
Wave B of the Minor degree inverted Zigzag with a rating of 100.5 is expected to complete in the price range 29.62 to 30.87, but more probably between 30.15 and 30.7. This wave was expected to complete before 12-Feb-2016, and must complete by 23-Feb-2016.
After wave B is complete, expect the market to continue up into wave C, which should be a five wave impulsive pattern. Expect wave C to retrace wave B by 112% - 330%. Wave C can also be expected to be 52% - 330% of the price length of wave A. The expected time for wave C to complete is 24% - 275% of the time taken for wave B to complete and 31% - 204% of the time taken for wave A to complete.
Wave (Y) of the Intermediate degree inverted Double Zigzag with a rating of 91.8 is expected to complete in the price range 31.84 to 38.76, but more probably between 32.15 and 34.87. This wave is due to complete anytime from now until 03-Mar-2016, but is most likely to complete before 19-Feb-2016.
Wave (Y) will probably complete this Double Sharp pattern, although it could possibly extend into a Triple Sharp pattern.
This is the final wave in the pattern. When complete it will also complete wave B of the Primary degree Flat with a rating of 85.1. These two waves have the same target ranges.
After wave B is complete, expect the market to continue down into wave C, which should be a five wave Impulsive pattern. Expect wave C to retrace wave B by 86% - 162%. Wave C can also be expected to be 90% - 162% of the price length of wave A. The expected time for wave C to complete is 19% - 134% of the time taken for wave B to complete and 24% - 115% of the time taken for wave A to complete.
Current Analysis Settings: Analysis Date Range: 14-Jul-2015 to 12-Feb-2016, Label Range: 15 - 50, Preferred Count Labels: 22, Min Rating: 75, Stocks toggle ON, Bias Towards Beginning of Data: 8, Bias Towards Major High/Low: 8, Largest Degree Wave Filter: Any Pattern
Rating:91.1
Current Trading Positions for PowerShares Dynamic Large Cap Value Portfolio ETF (PWV) Daily on 12-Feb-2016
* An Intermediate degree trader (hold positions from months to quarters), would currently be shorting this market. The probability of this Target Area being correct is 88.6%. However, the random probability of this Target Area being correct is 65.0%. So the true probability of this Target Area being correct is 36.3% better than random.
* A Primary degree trader (hold positions from months to years), would currently be trading long in this market. The probability of this Target Area being correct is 44.6%. However, the random probability of this Target Area being correct is 34.0%. So the true probability of this Target Area being correct is 31.2% better than random.
Extensive Elliott Commentary for PowerShares Dynamic Large Cap Value Portfolio ETF (PWV) Daily on 12-Feb-2016 with two incomplete patterns:
Wave (X) of the Intermediate degree inverted Double Zigzag with a rating of 102.5 is expected to complete in the price range 26.07 to 27.75, but more probably between 26.62 and 27.45. This wave is due to complete anytime from now until 14-Mar-2016, but is most likely to complete before 16-Feb-2016.
After wave (X) is complete, expect the market to continue up into wave (Y), which should be a three wave Zigzag pattern. Expect wave (Y) to retrace wave (X) by 128% - 319%. Wave (Y) can also be expected to be 90% - 319% of the price length of wave (W). The expected time for wave (Y) to complete is 23% - 167% of the time taken for wave (X) to complete and 47% - 204% of the time taken for wave (W) to complete.
Wave B of the Primary degree Flat with a rating of 91.1 is expected to complete in the price range 29.02 to 37.51, but more probably between 29.11 and 31.33. This wave is due to complete anytime from now until 25-Apr-2017, but is most likely to complete before 31-Mar-2016.
After wave B is complete, expect the market to continue down into wave C, which should be a five wave Impulsive pattern. Expect wave C to retrace wave B by 86% - 162%. Wave C can also be expected to be 90% - 162% of the price length of wave A. The expected time for wave C to complete is 19% - 134% of the time taken for wave B to complete and 24% - 115% of the time taken for wave A to complete.
Current Analysis Settings: Analysis Date Range: 10-Apr-2015 to 12-Feb-2016, Label Range: 15 - 50, Preferred Count Labels: 19, Min Rating: 75, Stocks toggle ON, Bias Towards Beginning of Data: 8, Bias Towards Major High/Low: 8, Largest Degree Wave Filter: Any Pattern
Rating:80.7
Current Trading Positions for PowerShares Dynamic Pharmaceuticals Portfolio ETF (PJP) Daily on 12-Feb-2016
* A Primary degree trader (hold positions from months to years), would currently be trading long in this market. The probability of this Target Area being correct is 78.0%. However, the random probability of this Target Area being correct is 65.0%. So the true probability of this Target Area being correct is 20.0% better than random.
* An Intermediate degree trader (hold positions from months to quarters), would currently be shorting this market. The probability of this Target Area being correct is 46.4%. However, the random probability of this Target Area being correct is 34.0%. So the true probability of this Target Area being correct is 36.5% better than random.
Extensive Elliott Commentary for PowerShares Dynamic Pharmaceuticals Portfolio ETF (PJP) Daily on 12-Feb-2016 with two incomplete patterns:
Wave (B) of the Intermediate degree inverted Flat with a rating of 94.7 is expected to complete in the price range 44.78 to 61.96, but more probably between 59.21 and 61.83. This wave was expected to complete before 02-Feb-2016, and must complete by 26-Feb-2016.
After wave (B) is complete, expect the market to continue up into wave (C), which should be a five wave Impulsive pattern. Expect wave (C) to retrace wave (B) by 83% - 173%. Wave (C) can also be expected to be 101% - 173% of the price length of wave (A). The expected time for wave (C) to complete is 20% - 190% of the time taken for wave (B) to complete and 57% - 279% of the time taken for wave (A) to complete.
Wave X of the Primary degree Double Zigzag with a rating of 80.7 is expected to complete in the price range 63.75 to 78.69, but more probably between 67.94 and 75.59. This wave is due to complete anytime from now until 16-Mar-2017, but is most likely to complete before 19-May-2016.
After wave X is complete, expect the market to continue down into wave Y, which should be a three wave Zigzag pattern. Expect wave Y to retrace wave X by 117% - 263%. Wave Y can also be expected to be 90% - 263% of the price length of wave W. The expected time for wave Y to complete is 21% - 161% of the time taken for wave X to complete and 27% - 154% of the time taken for wave W to complete.
Current Analysis Settings: Analysis Date Range: 09-Jun-2015 to 12-Feb-2016, Label Range: 15 - 50, Preferred Count Labels: 15, Min Rating: 75, Stocks toggle ON, Bias Towards Beginning of Data: 8, Bias Towards Major High/Low: 8, Largest Degree Wave Filter: Any Pattern
Rating:81.9
Current Trading Positions for PowerShares Emerg Mkts Svrgn Debt Port (PCY) Daily on 12-Feb-2016
This wave C will complete the Flat pattern.
* A Cycle degree trader (hold positions from quarters to years), would currently be trading long in this market. The probability of this Target Area being correct is 78.4%. However, the random probability of this Target Area being correct is 65.0%. So the true probability of this Target Area being correct is 20.6% better than random.
Extensive Elliott Commentary for PowerShares Emerg Mkts Svrgn Debt Port (PCY) Daily on 12-Feb-2016 with two incomplete patterns:
Wave C of the Primary degree inverted Flat with a rating of 100 is expected to complete in the price range 26.81 to 30.23, but more probably between 27.66 and 28.98. This wave could complete anytime between now and 25-Feb-2019, but is most likely to complete sometime between 16-Feb-2016 and 02-Aug-2016.
This is the final wave in the pattern. When complete it will also complete wave x of the Cycle degree Double Zigzag with a rating of 81.9. These two waves have the same target ranges.
After wave x is complete, expect the market to continue down into wave y, which should be a three wave Zigzag pattern. Expect wave y to retrace wave x by 117% - 263%. Wave y can also be expected to be 90% - 263% of the price length of wave w. The expected time for wave y to complete is 21% - 161% of the time taken for wave x to complete and 27% - 154% of the time taken for wave w to complete.
Current Analysis Settings: Analysis Date Range: 17-Jul-2014 to 12-Feb-2016, Label Range: 15 - 50, Preferred Count Labels: 22, Min Rating: 75, Stocks toggle ON, Bias Towards Beginning of Data: 8, Bias Towards Major High/Low: 8, Largest Degree Wave Filter: Any Pattern
Rating:103.8
Current Trading Positions for PowerShares Financial Preferred Portfolio (PGF) Daily on 12-Feb-2016
After wave X is complete, expect the market to continue down into wave Y, which will probably be a three wave corrective pattern. Expect wave Y to retrace wave X by 98% - 184%. Wave Y can also be expected to be 81% - 184% of the price length of wave W. The expected time for wave Y to complete is 40% - 187% of the time taken for wave X to complete and 100% - 304% of the time taken for wave W to complete.
* A Minor degree trader (hold positions from weeks to quarters), would currently be trading long in this market. The probability of this Target Area being correct is 67.7%. However, the random probability of this Target Area being correct is 53.0%. So the true probability of this Target Area being correct is 27.7% better than random.
Extensive Elliott Commentary for PowerShares Financial Preferred Portfolio (PGF) Daily on 12-Feb-2016 with one incomplete pattern:
Wave X of the Minor degree Double 3 with a rating of 103.8 is expected to complete in the price range 17.78 to 21.01, but more probably between 17.97 and 18.3. This wave is due to complete anytime from now until 19-Feb-2016, but is most likely to complete before 12-Feb-2016.
Current Analysis Settings: Analysis Date Range: 14-Jul-2015 to 12-Feb-2016, Label Range: 15 - 50, Preferred Count Labels: 15, Min Rating: 75, Stocks toggle ON, Bias Towards Beginning of Data: 8, Bias Towards Major High/Low: 8, Largest Degree Wave Filter: Any Pattern
Rating:81.8
Current Trading Positions for PowerShares FTSE RAFI Emerging Markets Portfolio ETF (PXH) Daily on 12-Feb-2016
Wave X of the Primary degree inverted Double 3 with a rating of 102.3 is expected to complete in the price range 5.26 to 12.76, but more probably between 11.6 and 12.23. This wave is due to complete anytime from now until 02-May-2016, but is most likely to complete before 22-Feb-2016.
* A Primary degree trader (hold positions from months to years), would currently be shorting this market. The probability of this Target Area being correct is 66.8%. However, the random probability of this Target Area being correct is 53.0%. So the true probability of this Target Area being correct is 26.0% better than random.
* A Cycle degree trader (hold positions from quarters to years), would currently be trading long in this market. The probability of this Target Area being correct is 41.3%. However, the random probability of this Target Area being correct is 34.0%. So the true probability of this Target Area being correct is 21.5% better than random.
Extensive Elliott Commentary for PowerShares FTSE RAFI Emerging Markets Portfolio ETF (PXH) Daily on 12-Feb-2016 with two incomplete patterns:
After wave X is complete, expect the market to continue up into wave Y, which will probably be a three wave corrective pattern. Expect wave Y to retrace wave X by 98% - 212%. Wave Y can also be expected to be 73% - 212% of the price length of wave W. The expected time for wave Y to complete is 27% - 214% of the time taken for wave X to complete and 38% - 222% of the time taken for wave W to complete.
Wave b of the Cycle degree Flat with a rating of 81.8 is expected to complete in the price range 19.63 to 42.02, but more probably between 19.87 and 25.78. This wave could complete anytime between now and 13-May-2024, but is most likely to complete sometime between 04-Mar-2016 and 13-Mar-2017.
After wave b is complete, expect the market to continue down into wave c, which should be a five wave Impulsive pattern. Expect wave c to retrace wave b by 85% - 162%. Wave c can also be expected to be 90% - 162% of the price length of wave a. The expected time for wave c to complete is 20% - 136% of the time taken for wave b to complete and 20% - 110% of the time taken for wave a to complete.
Current Analysis Settings: Analysis Date Range: 23-Jul-2014 to 12-Feb-2016, Label Range: 15 - 50, Preferred Count Labels: 17, Min Rating: 75, Stocks toggle ON, Bias Towards Beginning of Data: 8, Bias Towards Major High/Low: 8, Largest Degree Wave Filter: Any Pattern
Rating:80.3
Current Trading Positions for PowerShares FTSE RAFI US1000 ETF (PRF) Daily on 12-Feb-2016
Wave B of the Primary degree Zigzag with a rating of 101.3 is expected to complete in the price range 77.55 to 82.76, but more probably between 78.49 and 80.54. This wave is due to complete anytime from now until 27-Apr-2016, but is most likely to complete before 23-Feb-2016.
* A Primary degree trader (hold positions from months to years), would currently be trading long in this market. The probability of this Target Area being correct is 56.0%. However, the random probability of this Target Area being correct is 45.0%. So the true probability of this Target Area being correct is 24.4% better than random.
* A Cycle degree trader (hold positions from quarters to years), would currently be shorting this market. The probability of this Target Area being correct is 35.0%. However, the random probability of this Target Area being correct is 24.3%. So the true probability of this Target Area being correct is 44.0% better than random.
Extensive Elliott Commentary for PowerShares FTSE RAFI US1000 ETF (PRF) Daily on 12-Feb-2016 with two incomplete patterns:
After wave B is complete, expect the market to continue down into wave C, which should be a five wave impulsive pattern. Expect wave C to retrace wave B by 127% - 277%. Wave C can also be expected to be 43% - 277% of the price length of wave A. The expected time for wave C to complete is 19% - 191% of the time taken for wave B to complete and 55% - 222% of the time taken for wave A to complete.
Wave y of the Cycle degree Double Zigzag with a rating of 80.3 is expected to complete in the price range 52.94 to 68.92, but more probably between 63.95 and 68.68. This wave is most likely to complete sometime between 25-Feb-2016 and 06-May-2016 Note that it cannot complete until 23-Feb-2016 but must complete by 14-Jun-2016.
Wave y will probably complete this Double Sharp pattern, although it could possibly extend into a Triple Sharp pattern.
Current Analysis Settings: Analysis Date Range: 10-Apr-2015 to 12-Feb-2016, Label Range: 15 - 50, Preferred Count Labels: 23, Min Rating: 75, Stocks toggle ON, Bias Towards Beginning of Data: 8, Bias Towards Major High/Low: 8, Largest Degree Wave Filter: Any Pattern
Rating:81.2
Current Trading Positions for PowerShares High Yield Corporate Bond Portfolio ETF (PHB) Daily on 12-Feb-2016
Wave X of the Primary degree inverted Double Zigzag with a rating of 99.2 is expected to complete in the price range 16.61 to 17.08, but more probably between 16.76 and 16.99. This wave is due to complete anytime from now until 08-Mar-2016, but is most likely to complete before 12-Feb-2016.
* A Primary degree trader (hold positions from months to years), would currently be shorting this market. The probability of this Target Area being correct is 87.4%. However, the random probability of this Target Area being correct is 65.0%. So the true probability of this Target Area being correct is 34.5% better than random.
* A Cycle degree trader (hold positions from quarters to years), would currently be trading long in this market. The probability of this Target Area being correct is 41.3%. However, the random probability of this Target Area being correct is 34.0%. So the true probability of this Target Area being correct is 21.5% better than random.
Extensive Elliott Commentary for PowerShares High Yield Corporate Bond Portfolio ETF (PHB) Daily on 12-Feb-2016 with two incomplete patterns:
After wave X is complete, expect the market to continue up into wave Y, which should be a three wave Zigzag pattern. Expect wave Y to retrace wave X by 128% - 319%. Wave Y can also be expected to be 90% - 319% of the price length of wave W. The expected time for wave Y to complete is 23% - 167% of the time taken for wave X to complete and 47% - 204% of the time taken for wave W to complete.
Wave b of the Cycle degree Flat with a rating of 81.2 is expected to complete in the price range 18.66 to 24.49, but more probably between 18.72 and 20.26. This wave could complete anytime between now and 09-Jun-2025, but is most likely to complete sometime between 09-Mar-2016 and 05-May-2017.
After wave b is complete, expect the market to continue down into wave c, which should be a five wave Impulsive pattern. Expect wave c to retrace wave b by 85% - 162%. Wave c can also be expected to be 90% - 162% of the price length of wave a. The expected time for wave c to complete is 20% - 136% of the time taken for wave b to complete and 20% - 110% of the time taken for wave a to complete.
Current Analysis Settings: Analysis Date Range: 19-May-2014 to 12-Feb-2016, Label Range: 15 - 50, Preferred Count Labels: 15, Min Rating: 75, Stocks toggle ON, Bias Towards Beginning of Data: 8, Bias Towards Major High/Low: 8, Largest Degree Wave Filter: Any Pattern
Rating:447.8
Current Trading Positions for PowerShares High Yield Equity Dividend Achievers Portfolio ETF (PEY) Daily on 12-Feb-2016
* A Primary degree trader (hold positions from months to years), would currently be shorting this market. The probability of this Target Area being correct is 78.1%. However, the random probability of this Target Area being correct is 64.0%. So the true probability of this Target Area being correct is 22.0% better than random.
Extensive Elliott Commentary for PowerShares High Yield Equity Dividend Achievers Portfolio ETF (PEY) Daily on 12-Feb-2016 with one incomplete pattern:
Wave D of the Primary degree inverted Contracting Triangle with a rating of 447.8 is expected to complete in the price range 11.89 to 12.58, but more probably between 12.06 and 12.44. This wave is due to complete anytime from now until 15-Mar-2016, but is most likely to complete before 26-Feb-2016.
Once this wave D is complete, expect the market to continue up to the end of wave E, which will most probably be a ZigZag family pattern or possibly a Contracting Triangle. Expect wave E to have between 39% and 66% of the price range of wave C and complete in 4% to 60% of the time taken by wave C. Expect also that wave E will have between 21% and 47% of the price range of wave A and complete in 2% to 24% of the time taken by wave A. The slope (ie. price range divided by time taken) of wave E should be between 28% and 143% of the slope of wave C and between 19% to 183% of the slope of wave A. Wave E will complete this Contracting Triangle.
Current Analysis Settings: Analysis Date Range: 14-Jul-2015 to 12-Feb-2016, Label Range: 15 - 50, Preferred Count Labels: 18, Min Rating: 75, Stocks toggle ON, Bias Towards Beginning of Data: 8, Bias Towards Major High/Low: 8, Largest Degree Wave Filter: Any Pattern
Rating:108.8
Current Trading Positions for PowerShares India Portfolio ETF (PIN) Daily on 12-Feb-2016
* A Cycle degree trader (hold positions from quarters to years), would currently be shorting this market. The probability of this Target Area being correct is 50.8%. However, the random probability of this Target Area being correct is 34.0%. So the true probability of this Target Area being correct is 49.4% better than random.
Extensive Elliott Commentary for PowerShares India Portfolio ETF (PIN) Daily on 12-Feb-2016 with one incomplete pattern:
Wave b of the Cycle degree inverted Flat with a rating of 108.8 is expected to complete in the price range 12.83 to 17.36, but more probably between 16.26 and 17.25. This wave could complete anytime between now and 02-Apr-2019, but is most likely to complete sometime between 24-Feb-2016 and 03-Oct-2016.
After wave b is complete, expect the market to continue up into wave c, which should be a five wave Impulsive pattern. Expect wave c to retrace wave b by 82% - 179%. Wave c can also be expected to be 67% - 179% of the price length of wave a. The expected time for wave c to complete is 20% - 151% of the time taken for wave b to complete and 11% - 58% of the time taken for wave a to complete.
Current Analysis Settings: Analysis Date Range: 19-Dec-2013 to 12-Feb-2016, Label Range: 15 - 50, Preferred Count Labels: 19, Min Rating: 75, Stocks toggle ON, Bias Towards Beginning of Data: 8, Bias Towards Major High/Low: 8, Largest Degree Wave Filter: Any Pattern
Rating:101.6
Current Trading Positions for PowerShares Insured National Municipal Bond Portfolio ETF (PZA) Daily on 12-Feb-2016
Wave X of the Primary degree inverted Double 3 with a rating of 101.6 is expected to complete in the price range 23.03 to 25.45, but more probably between 25.22 and 25.43. This wave is most likely to complete sometime between 17-Feb-2016 and 14-Mar-2016 Note that it cannot complete until 12-Feb-2016 but must complete by 02-Sep-2016.
* A Primary degree trader (hold positions from months to years), would currently be shorting this market. The probability of this Target Area being correct is 65.9%. However, the random probability of this Target Area being correct is 53.0%. So the true probability of this Target Area being correct is 24.3% better than random.
Extensive Elliott Commentary for PowerShares Insured National Municipal Bond Portfolio ETF (PZA) Daily on 12-Feb-2016 with one incomplete pattern:
After wave X is complete, expect the market to continue up into wave Y, which will probably be a three wave corrective pattern. Expect wave Y to retrace wave X by 98% - 227%. Wave Y can also be expected to be 71% - 227% of the price length of wave W. The expected time for wave Y to complete is 28% - 231% of the time taken for wave X to complete and 16% - 135% of the time taken for wave W to complete.
Current Analysis Settings: Analysis Date Range: 06-Dec-2013 to 12-Feb-2016, Label Range: 15 - 50, Preferred Count Labels: 33, Min Rating: 75, Stocks toggle ON, Bias Towards Beginning of Data: 8, Bias Towards Major High/Low: 8, Largest Degree Wave Filter: Any Pattern
Rating:84.5
Current Trading Positions for PowerShares International Dividend Achievers Portfolio ETF (PID) Daily on 12-Feb-2016
After wave B is complete, expect the market to continue up into wave C, which should be a five wave impulsive pattern. Expect wave C to retrace wave B by 114% - 331%. Wave C can also be expected to be 53% - 331% of the price length of wave A. The expected time for wave C to complete is 24% - 277% of the time taken for wave B to complete and 31% - 204% of the time taken for wave A to complete.
* A Primary degree trader (hold positions from months to years), would currently be shorting this market. The probability of this Target Area being correct is 57.0%. However, the random probability of this Target Area being correct is 45.0%. So the true probability of this Target Area being correct is 26.7% better than random.
* A Cycle degree trader (hold positions from quarters to years), would currently be trading long in this market. The probability of this Target Area being correct is 42.2%. However, the random probability of this Target Area being correct is 34.0%. So the true probability of this Target Area being correct is 24.1% better than random.
Extensive Elliott Commentary for PowerShares International Dividend Achievers Portfolio ETF (PID) Daily on 12-Feb-2016 with two incomplete patterns:
Wave B of the Primary degree inverted Zigzag with a rating of 102.5 is expected to complete in the price range 11.08 to 12.69, but more probably between 11.76 and 12.48. This wave is due to complete anytime from now until 22-Apr-2016, but is most likely to complete before 17-Feb-2016.
Wave b of the Cycle degree Flat with a rating of 84.5 is expected to complete in the price range 17 to 33.83, but more probably between 17.18 and 21.63. This wave could complete anytime between now and 03-May-2024, but is most likely to complete sometime between 04-Mar-2016 and 13-Mar-2017.
After wave b is complete, expect the market to continue down into wave c, which should be a five wave Impulsive pattern. Expect wave c to retrace wave b by 85% - 162%. Wave c can also be expected to be 90% - 162% of the price length of wave a. The expected time for wave c to complete is 20% - 136% of the time taken for wave b to complete and 20% - 110% of the time taken for wave a to complete.
Current Analysis Settings: Analysis Date Range: 24-Jul-2014 to 12-Feb-2016, Label Range: 15 - 50, Preferred Count Labels: 22, Min Rating: 75, Stocks toggle ON, Bias Towards Beginning of Data: 8, Bias Towards Major High/Low: 8, Largest Degree Wave Filter: Any Pattern
Rating:86.1
Current Trading Positions for PowerShares Preferred Portfolio ETF (PGX) Daily on 12-Feb-2016
This wave C will complete the Flat pattern.
* An Intermediate degree trader (hold positions from months to quarters), would currently be trading long in this market. The probability of this Target Area being correct is 53.6%. However, the random probability of this Target Area being correct is 45.0%. So the true probability of this Target Area being correct is 19.1% better than random.
* A Primary degree trader (hold positions from months to years), would currently be shorting this market. The probability of this Target Area being correct is 38.0%. However, the random probability of this Target Area being correct is 24.3%. So the true probability of this Target Area being correct is 56.4% better than random.
Extensive Elliott Commentary for PowerShares Preferred Portfolio ETF (PGX) Daily on 12-Feb-2016 with three incomplete patterns:
Wave C of the Minor degree inverted Flat with a rating of 101.5 is expected to complete in the price range 14.21 to 14.79, but more probably between 14.31 and 14.64. This wave is due to complete anytime from now until 19-Feb-2016, but is most likely to complete before 12-Feb-2016.
This is the final wave in the pattern. When complete it will also complete wave (B) of the Intermediate degree Zigzag with a rating of 93.3. These two waves have the same target ranges.
After wave (B) is complete, expect the market to continue down into wave (C), which should be a five wave impulsive pattern. Expect wave (C) to retrace wave (B) by 127% - 277%. Wave (C) can also be expected to be 43% - 277% of the price length of wave (A). The expected time for wave (C) to complete is 20% - 191% of the time taken for wave (B) to complete and 55% - 221% of the time taken for wave (A) to complete.
Wave Y of the Primary degree Double Zigzag with a rating of 86.1 is expected to complete in the price range 13.41 to 14.4, but more probably between 14.11 and 14.39. This wave is due to complete anytime from now until 24-Mar-2016, but is most likely to complete before 22-Feb-2016.
Wave Y will probably complete this Double Sharp pattern, although it could possibly extend into a Triple Sharp pattern.
Current Analysis Settings: Analysis Date Range: 14-Jul-2015 to 12-Feb-2016, Label Range: 15 - 50, Preferred Count Labels: 17, Min Rating: 75, Stocks toggle ON, Bias Towards Beginning of Data: 8, Bias Towards Major High/Low: 8, Largest Degree Wave Filter: Any Pattern
Rating:77.5
Current Trading Positions for PowerShares Private Equity Portfolio ETF (PSP) Daily on 12-Feb-2016
Wave (Y) of the Intermediate degree Double Zigzag with a rating of 95.3 is expected to complete in the price range 5.8 to 7.69, but more probably between 7.15 and 7.66. This wave is most likely to complete sometime between 18-Feb-2016 and 29-Feb-2016 Note that it cannot complete until 17-Feb-2016 but must complete by 14-Mar-2016.
* An Intermediate degree trader (hold positions from months to quarters), would currently be shorting this market. The probability of this Target Area being correct is 41.0%. However, the random probability of this Target Area being correct is 24.3%. So the true probability of this Target Area being correct is 68.7% better than random.
* A Primary degree trader (hold positions from months to years), would currently be shorting this market. The probability of this Target Area being correct is 40.1%. However, the random probability of this Target Area being correct is 34.0%. So the true probability of this Target Area being correct is 17.9% better than random.
* A Cycle degree trader (hold positions from quarters to years), would currently be trading long in this market. The probability of this Target Area being correct is 40.1%. However, the random probability of this Target Area being correct is 34.0%. So the true probability of this Target Area being correct is 17.9% better than random.
Extensive Elliott Commentary for PowerShares Private Equity Portfolio ETF (PSP) Daily on 12-Feb-2016 with three incomplete patterns:
Wave (Y) will probably complete this Double Sharp pattern, although it could possibly extend into a Triple Sharp pattern.
This is the final wave in the pattern. When complete it will also complete wave B of the Primary degree inverted Flat with a rating of 77.8. These two waves have the same target ranges.
After wave B is complete, expect the market to continue up into wave C, which should be a five wave Impulsive pattern. Expect wave C to retrace wave B by 82% - 177%. Wave C can also be expected to be 89% - 177% of the price length of wave A. The expected time for wave C to complete is 15% - 160% of the time taken for wave B to complete and 16% - 118% of the time taken for wave A to complete.
Wave b of the Cycle degree Flat with a rating of 77.5 is expected to complete in the price range 11.42 to 18.27, but more probably between 11.49 and 13.3. This wave is due to complete anytime from now until 12-Jul-2022, but is most likely to complete before 15-Sep-2016.
After wave b is complete, expect the market to continue down into wave c, which should be a five wave Impulsive pattern. Expect wave c to retrace wave b by 85% - 162%. Wave c can also be expected to be 90% - 162% of the price length of wave a. The expected time for wave c to complete is 20% - 136% of the time taken for wave b to complete and 20% - 110% of the time taken for wave a to complete.
Current Analysis Settings: Analysis Date Range: 18-Mar-2014 to 12-Feb-2016, Label Range: 15 - 50, Preferred Count Labels: 17, Min Rating: 75, Stocks toggle ON, Bias Towards Beginning of Data: 8, Bias Towards Major High/Low: 8, Largest Degree Wave Filter: Any Pattern
Rating:100.5
Current Trading Positions for PowerShares QQQTrust Ser 1 (QQQ) Daily on 12-Feb-2016
Current Analysis Settings: Analysis Date Range: 05-Mar-2014 to 12-Feb-2016, Label Range: 15 - 50, Preferred Count Labels: 35, Min Rating: 75, Stocks toggle ON, Bias Towards Beginning of Data: 8, Bias Towards Major High/Low: 8, Largest Degree Wave Filter: Any Pattern
* A Primary degree trader (hold positions from months to years), would currently be trading long in this market. The probability of this Target Area being correct is 42.0%. However, the random probability of this Target Area being correct is 24.3%. So the true probability of this Target Area being correct is 72.8% better than random.
Extensive Elliott Commentary for PowerShares QQQTrust Ser 1 (QQQ) Daily on 12-Feb-2016 with one incomplete pattern:
Wave Y of the Primary degree inverted Double Zigzag with a rating of 100.5 is expected to complete in the price range 121.57 to 197.78, but more probably between 124.03 and 153.01. This wave is most likely to complete sometime between 22-Feb-2016 and 12-May-2016 Note that it cannot complete until 19-Feb-2016 but must complete by 10-Oct-2016.
Wave Y will probably complete this Double Sharp pattern, although it could possibly extend into a Triple Sharp pattern.
Rating:100.3
Current Trading Positions for PowerShares S&P Emerging Markets ETF (EELV) Daily on 12-Feb-2016
* A Cycle degree trader (hold positions from quarters to years), would currently be trading long in this market. The probability of this Target Area being correct is 50.0%. However, the random probability of this Target Area being correct is 34.0%. So the true probability of this Target Area being correct is 47.1% better than random.
Extensive Elliott Commentary for PowerShares S&P Emerging Markets ETF (EELV) Daily on 12-Feb-2016 with one incomplete pattern:
Wave b of the Cycle degree Flat with a rating of 100.3 is expected to complete in the price range 26.08 to 48.6, but more probably between 26.31 and 32.27. This wave could complete anytime between now and 03-May-2024, but is most likely to complete sometime between 04-Mar-2016 and 13-Mar-2017.
After wave b is complete, expect the market to continue down into wave c, which should be a five wave Impulsive pattern. Expect wave c to retrace wave b by 85% - 162%. Wave c can also be expected to be 90% - 162% of the price length of wave a. The expected time for wave c to complete is 20% - 136% of the time taken for wave b to complete and 20% - 110% of the time taken for wave a to complete.
Current Analysis Settings: Analysis Date Range: 24-Jul-2014 to 12-Feb-2016, Label Range: 15 - 50, Preferred Count Labels: 15, Min Rating: 75, Stocks toggle ON, Bias Towards Beginning of Data: 8, Bias Towards Major High/Low: 8, Largest Degree Wave Filter: Any Pattern
Rating:93.6
Current Trading Positions for PowerShares S&P Intl Dev Low Vol Port (IDLV) Daily on 12-Feb-2016
* An Intermediate degree trader (hold positions from months to quarters), would currently be shorting this market. The probability of this Target Area being correct is 88.6%. However, the random probability of this Target Area being correct is 65.0%. So the true probability of this Target Area being correct is 36.3% better than random.
* A Primary degree trader (hold positions from months to years), would currently be trading long in this market. The probability of this Target Area being correct is 45.8%. However, the random probability of this Target Area being correct is 34.0%. So the true probability of this Target Area being correct is 34.7% better than random.
Extensive Elliott Commentary for PowerShares S&P Intl Dev Low Vol Port (IDLV) Daily on 12-Feb-2016 with two incomplete patterns:
Wave (X) of the Intermediate degree inverted Double Zigzag with a rating of 102.1 is expected to complete in the price range 25.63 to 27.35, but more probably between 26.19 and 27.03. This wave is due to complete anytime from now until 01-Apr-2016, but is most likely to complete before 24-Feb-2016.
After wave (X) is complete, expect the market to continue up into wave (Y), which should be a three wave Zigzag pattern. Expect wave (Y) to retrace wave (X) by 128% - 319%. Wave (Y) can also be expected to be 90% - 319% of the price length of wave (W). The expected time for wave (Y) to complete is 23% - 167% of the time taken for wave (X) to complete and 47% - 204% of the time taken for wave (W) to complete.
Wave B of the Primary degree Flat with a rating of 93.6 is expected to complete in the price range 28.81 to 37.93, but more probably between 28.9 and 31.29. This wave is due to complete anytime from now until 16-Jun-2017, but is most likely to complete before 08-Apr-2016.
After wave B is complete, expect the market to continue down into wave C, which should be a five wave Impulsive pattern. Expect wave C to retrace wave B by 86% - 162%. Wave C can also be expected to be 90% - 162% of the price length of wave A. The expected time for wave C to complete is 19% - 134% of the time taken for wave B to complete and 24% - 115% of the time taken for wave A to complete.
Current Analysis Settings: Analysis Date Range: 07-May-2014 to 12-Feb-2016, Label Range: 15 - 50, Preferred Count Labels: 27, Min Rating: 75, Stocks toggle ON, Bias Towards Beginning of Data: 8, Bias Towards Major High/Low: 8, Largest Degree Wave Filter: Any Pattern
Rating:101.6
Current Trading Positions for PowerShares S&P500 High Quality Portfolio (SPHQ) Daily on 12-Feb-2016
* A Primary degree trader (hold positions from months to years), would currently be shorting this market. The probability of this Target Area being correct is 64.7%. However, the random probability of this Target Area being correct is 45.0%. So the true probability of this Target Area being correct is 43.8% better than random.
Extensive Elliott Commentary for PowerShares S&P500 High Quality Portfolio (SPHQ) Daily on 12-Feb-2016 with one incomplete pattern:
Wave C of the Primary degree Zigzag with a rating of 101.6 is expected to complete in the price range 14.46 to 21.34, but more probably between 19.6 and 21.23. This wave is due to complete anytime from now until 18-Apr-2016, but is most likely to complete before 29-Feb-2016.
This wave C will complete the ZigZag pattern.
Current Analysis Settings: Analysis Date Range: 16-Jan-2015 to 12-Feb-2016, Label Range: 15 - 50, Preferred Count Labels: 15, Min Rating: 75, Stocks toggle ON, Bias Towards Beginning of Data: 8, Bias Towards Major High/Low: 8, Largest Degree Wave Filter: Any Pattern
Rating:81.4
Current Trading Positions for PowerShares S&P500 Low Volatility Portfolio (SPLV) Daily on 12-Feb-2016
* An Intermediate degree trader (hold positions from months to quarters), would currently be shorting this market. The probability of this Target Area being correct is 65.3%. However, the random probability of this Target Area being correct is 45.0%. So the true probability of this Target Area being correct is 45.1% better than random.
* A Primary degree trader (hold positions from months to years), would currently be shorting this market. The probability of this Target Area being correct is 41.3%. However, the random probability of this Target Area being correct is 34.0%. So the true probability of this Target Area being correct is 21.5% better than random.
Extensive Elliott Commentary for PowerShares S&P500 Low Volatility Portfolio (SPLV) Daily on 12-Feb-2016 with two incomplete patterns:
Wave (C) of the Intermediate degree Zigzag with a rating of 104.5 is expected to complete in the price range 32.91 to 36.63, but more probably between 35.28 and 36.45. This wave is due to complete anytime from now until 29-Feb-2016, but is most likely to complete before 17-Feb-2016.
This wave (C) will complete the ZigZag pattern.
This is the final wave in the pattern. When complete it will also complete wave B of the Primary degree inverted Flat with a rating of 81.4. These two waves have the same target ranges.
After wave B is complete, expect the market to continue up into wave C, which should be a five wave Impulsive pattern. Expect wave C to retrace wave B by 82% - 177%. Wave C can also be expected to be 89% - 177% of the price length of wave A. The expected time for wave C to complete is 15% - 160% of the time taken for wave B to complete and 16% - 118% of the time taken for wave A to complete.
Current Analysis Settings: Analysis Date Range: 14-Jul-2015 to 12-Feb-2016, Label Range: 15 - 50, Preferred Count Labels: 28, Min Rating: 75, Stocks toggle ON, Bias Towards Beginning of Data: 8, Bias Towards Major High/Low: 8, Largest Degree Wave Filter: Any Pattern
Rating:85
Current Trading Positions for Powershares SP 500 Downside Hdg (PHDG) Daily on 12-Feb-2016
* An Intermediate degree trader (hold positions from months to quarters), would currently be shorting this market. The probability of this Target Area being correct is 47.6%. However, the random probability of this Target Area being correct is 34.0%. So the true probability of this Target Area being correct is 40.0% better than random.
* A Primary degree trader (hold positions from months to years), would currently be trading long in this market. The probability of this Target Area being correct is 85.4%. However, the random probability of this Target Area being correct is 64.1%. So the true probability of this Target Area being correct is 33.2% better than random.
Extensive Elliott Commentary for Powershares SP 500 Downside Hdg (PHDG) Daily on 12-Feb-2016 with two incomplete patterns:
Wave (B) of the Intermediate degree inverted Flat with a rating of 96.9 is expected to complete in the price range 21.77 to 23.9, but more probably between 23.56 and 23.88.
After wave (B) is complete, expect the market to continue up into wave (C), which should be a five wave Impulsive pattern. Expect wave (C) to retrace wave (B) by 83% - 173%. Wave (C) can also be expected to be 101% - 173% of the price length of wave (A). The expected time for wave (C) to complete is 20% - 190% of the time taken for wave (B) to complete and 57% - 279% of the time taken for wave (A) to complete.
Wave Y of the Primary degree inverted Double 3 with a rating of 85 is expected to complete in the price range 23.86 to 32.55, but more probably between 25.26 and 27.73. This wave is due to complete anytime from now until 24-May-2016, but is most likely to complete before 23-Mar-2016.
Wave Y will probably complete this Double Sideways pattern, although it could possibly extend into a Triple Sideways pattern.
Current Analysis Settings: Analysis Date Range: 24-Oct-2014 to 12-Feb-2016, Label Range: 15 - 50, Preferred Count Labels: 20, Min Rating: 75, Stocks toggle ON, Bias Towards Beginning of Data: 8, Bias Towards Major High/Low: 8, Largest Degree Wave Filter: Any Pattern
Rating:106.2
Current Trading Positions for PowerShares SP 500 High Div Portfolio ETF (SPHD) Daily on 12-Feb-2016
* A Primary degree trader (hold positions from months to years), would currently be shorting this market. The probability of this Target Area being correct is 87.6%. However, the random probability of this Target Area being correct is 64.1%. So the true probability of this Target Area being correct is 36.7% better than random.
Extensive Elliott Commentary for PowerShares SP 500 High Div Portfolio ETF (SPHD) Daily on 12-Feb-2016 with one incomplete pattern:
Wave Y of the Primary degree Double 3 with a rating of 106.2 is expected to complete in the price range 20.6 to 33.53, but more probably between 28 and 31.17. This wave is due to complete anytime from now until 31-Mar-2016, but is most likely to complete before 14-Mar-2016.
Wave Y will probably complete this Double Sideways pattern, although it could possibly extend into a Triple Sideways pattern.
Current Analysis Settings: Analysis Date Range: 18-Nov-2014 to 12-Feb-2016, Label Range: 15 - 50, Preferred Count Labels: 34, Min Rating: 75, Stocks toggle ON, Bias Towards Beginning of Data: 8, Bias Towards Major High/Low: 8, Largest Degree Wave Filter: Any Pattern
Rating:75.2
Current Trading Positions for PowerShares Wilderhill Clean Energy Porfolio ETF (PBW) Daily on 12-Feb-2016
* An Intermediate degree trader (hold positions from months to quarters), would currently be shorting this market. The probability of this Target Area being correct is 64.7%. However, the random probability of this Target Area being correct is 45.0%. So the true probability of this Target Area being correct is 43.8% better than random.
* A Primary degree trader (hold positions from months to years), would currently be shorting this market. The probability of this Target Area being correct is 43.4%. However, the random probability of this Target Area being correct is 34.0%. So the true probability of this Target Area being correct is 27.6% better than random.
* A Cycle degree trader (hold positions from quarters to years), would currently be trading long in this market. The probability of this Target Area being correct is 39.5%. However, the random probability of this Target Area being correct is 34.0%. So the true probability of this Target Area being correct is 16.2% better than random.
Extensive Elliott Commentary for PowerShares Wilderhill Clean Energy Porfolio ETF (PBW) Daily on 12-Feb-2016 with three incomplete patterns:
Wave (C) of the Intermediate degree Zigzag with a rating of 101.3 is expected to complete in the price range 1.52 to 3.6, but more probably between 2.55 and 3.44. This wave is due to complete anytime from now until 23-May-2016, but is most likely to complete before 04-Mar-2016.
This wave (C) will complete the ZigZag pattern.
This is the final wave in the pattern. When complete it will also complete wave B of the Primary degree inverted Flat with a rating of 88.5. These two waves have the same target ranges.
After wave B is complete, expect the market to continue up into wave C, which should be a five wave Impulsive pattern. Expect wave C to retrace wave B by 82% - 177%. Wave C can also be expected to be 89% - 177% of the price length of wave A. The expected time for wave C to complete is 15% - 160% of the time taken for wave B to complete and 16% - 118% of the time taken for wave A to complete.
Wave b of the Cycle degree Flat with a rating of 75.2 is expected to complete in the price range 6.62 to 15.05, but more probably between 6.7 and 8.93. This wave is due to complete anytime from now until 23-Jul-2024, but is most likely to complete before 26-Dec-2016.
After wave b is complete, expect the market to continue down into wave c, which should be a five wave Impulsive pattern. Expect wave c to retrace wave b by 85% - 162%. Wave c can also be expected to be 90% - 162% of the price length of wave a. The expected time for wave c to complete is 20% - 136% of the time taken for wave b to complete and 20% - 110% of the time taken for wave a to complete.
Current Analysis Settings: Analysis Date Range: 28-Jan-2014 to 12-Feb-2016, Label Range: 15 - 50, Preferred Count Labels: 26, Min Rating: 75, Stocks toggle ON, Bias Towards Beginning of Data: 8, Bias Towards Major High/Low: 8, Largest Degree Wave Filter: Any Pattern
Rating:99.9
Current Trading Positions for ProShares S&P 500 Aristocrats ETF (NOBL) Daily on 12-Feb-2016
* A Primary degree trader (hold positions from months to years), would currently be shorting this market. The probability of this Target Area being correct is 41.8%. However, the random probability of this Target Area being correct is 24.3%. So the true probability of this Target Area being correct is 72.0% better than random.
Extensive Elliott Commentary for ProShares S&P 500 Aristocrats ETF (NOBL) Daily on 12-Feb-2016 with one incomplete pattern:
Wave Y of the Primary degree Double Zigzag with a rating of 99.9 is expected to complete in the price range 29.12 to 43.24, but more probably between 39.39 and 43.15. This wave is most likely to complete sometime between 17-Feb-2016 and 11-Mar-2016 Note that it cannot complete until 16-Feb-2016 but must complete by 31-Mar-2016.
Wave Y will probably complete this Double Sharp pattern, although it could possibly extend into a Triple Sharp pattern.
Current Analysis Settings: Analysis Date Range: 13-Jan-2015 to 12-Feb-2016, Label Range: 15 - 50, Preferred Count Labels: 16, Min Rating: 75, Stocks toggle ON, Bias Towards Beginning of Data: 8, Bias Towards Major High/Low: 8, Largest Degree Wave Filter: Any Pattern
Rating:99.8
Current Trading Positions for ProShares Short 20+ Year Treasury ETF (TBF) Daily on 12-Feb-2016
* A Cycle degree trader (hold positions from quarters to years), would currently be shorting this market. The probability of this Target Area being correct is 41.8%. However, the random probability of this Target Area being correct is 24.3%. So the true probability of this Target Area being correct is 72.0% better than random.
Extensive Elliott Commentary for ProShares Short 20+ Year Treasury ETF (TBF) Daily on 12-Feb-2016 with one incomplete pattern:
Wave y of the Cycle degree Double Zigzag with a rating of 99.8 is expected to complete in the price range 12.36 to 20.49, but more probably between 18.23 and 20.4. This wave is due to complete anytime from now until 13-Mar-2017, but is most likely to complete before 25-Jul-2016.
Wave y will probably complete this Double Sharp pattern, although it could possibly extend into a Triple Sharp pattern.
Current Analysis Settings: Analysis Date Range: 06-Dec-2013 to 12-Feb-2016, Label Range: 15 - 50, Preferred Count Labels: 16, Min Rating: 75, Stocks toggle ON, Bias Towards Beginning of Data: 8, Bias Towards Major High/Low: 8, Largest Degree Wave Filter: Any Pattern
Rating:103.9
Current Trading Positions for ProShares Short High Yield (SJB) Daily on 12-Feb-2016
* A Cycle degree trader (hold positions from quarters to years), would currently be shorting this market. The probability of this Target Area being correct is 50.3%. However, the random probability of this Target Area being correct is 34.0%. So the true probability of this Target Area being correct is 47.9% better than random.
Extensive Elliott Commentary for ProShares Short High Yield (SJB) Daily on 12-Feb-2016 with one incomplete pattern:
Wave b of the Cycle degree inverted Flat with a rating of 103.9 is expected to complete in the price range 20.86 to 27.6, but more probably between 25.73 and 27.52. This wave is most likely to complete sometime between 10-Mar-2016 and 05-Aug-2016 Note that it cannot complete until 17-Feb-2016 but must complete by 31-May-2019.
After wave b is complete, expect the market to continue up into wave c, which should be a five wave Impulsive pattern. Expect wave c to retrace wave b by 82% - 177%. Wave c can also be expected to be 89% - 177% of the price length of wave a. The expected time for wave c to complete is 15% - 160% of the time taken for wave b to complete and 16% - 118% of the time taken for wave a to complete.
Current Analysis Settings: Analysis Date Range: 22-Apr-2015 to 12-Feb-2016, Label Range: 15 - 50, Preferred Count Labels: 18, Min Rating: 75, Stocks toggle ON, Bias Towards Beginning of Data: 8, Bias Towards Major High/Low: 8, Largest Degree Wave Filter: Any Pattern
Rating:327.5
Current Trading Positions for ProShares Short MSCI Emerging Markets (EUM) Daily on 12-Feb-2016
* A Primary degree trader (hold positions from months to years), would currently be trading long in this market. The probability of this Target Area being correct is 78.1%. However, the random probability of this Target Area being correct is 64.0%. So the true probability of this Target Area being correct is 22.0% better than random.
Extensive Elliott Commentary for ProShares Short MSCI Emerging Markets (EUM) Daily on 12-Feb-2016 with one incomplete pattern:
Wave D of the Primary degree Contracting Triangle with a rating of 327.5 is expected to complete in the price range 32.58 to 34.07, but more probably between 32.98 and 33.68. This wave is due to complete anytime from now until 15-Mar-2016, but is most likely to complete before 26-Feb-2016.
Once this wave D is complete, expect the market to continue down to the end of wave E, which will most probably be a ZigZag family pattern or possibly a Contracting Triangle. Expect wave E to have between 39% and 67% of the price range of wave C and complete in 6% to 60% of the time taken by wave C. Expect also that wave E will have between 22% and 49% of the price range of wave A and complete in 3% to 29% of the time taken by wave A. The slope (ie. price range divided by time taken) of wave E should be between 28% and 143% of the slope of wave C and between 19% to 183% of the slope of wave A. Wave E will complete this Contracting Triangle.
Current Analysis Settings: Analysis Date Range: 17-Mar-2015 to 12-Feb-2016, Label Range: 15 - 50, Preferred Count Labels: 19, Min Rating: 75, Stocks toggle ON, Bias Towards Beginning of Data: 8, Bias Towards Major High/Low: 8, Largest Degree Wave Filter: Any Pattern
Rating:84.3
Current Trading Positions for ProShares Short QQQ ETF (PSQ) Daily on 12-Feb-2016
* An Intermediate degree trader (hold positions from months to quarters), would currently be trading long in this market. The probability of this Target Area being correct is 52.0%. However, the random probability of this Target Area being correct is 13.0%. So the true probability of this Target Area being correct is 300.0% better than random.
* A Cycle degree trader (hold positions from quarters to years), would currently be trading long in this market. The probability of this Target Area being correct is 79.6%. However, the random probability of this Target Area being correct is 65.0%. So the true probability of this Target Area being correct is 22.5% better than random.
Extensive Elliott Commentary for ProShares Short QQQ ETF (PSQ) Daily on 12-Feb-2016 with three incomplete patterns:
Wave (3) of the Intermediate degree Impulse with a rating of 98.5 is expected to complete in the price range 60.83 to 94.22, but more probably between 62.51 and 71.56. This wave is due to complete anytime from now until 01-Apr-2016, but is most likely to complete before 24-Feb-2016.
When complete, expect the overall slope (ie. price range divided by time taken) of this wave (3) to be between 70% to 219% of the slope of wave (1). Then expect the market to pull back into wave (4), which will be corrective in nature and has a probability of 83% of being a Flat or other sideways pattern. Wave (4) should not retrace back into the price range of wave (1) or (2). Expect wave (4) to have between 5% - 141% of the price range of wave (2). The expected time for wave (4) to complete is between 15% - 135% of wave (2). After wave (4), expect wave (5) to move beyond the end of wave (3) to complete this Impulse.
Wave C of the Primary degree inverted Flat with a rating of 81.7 is expected to complete in the price range 52.87 to 72.77, but more probably between 57.89 and 65.63. This wave is due to complete anytime from now until 14-Feb-2017, but is most likely to complete before 31-Mar-2016.
This wave C will complete the Flat pattern.
This is the final wave in the pattern. When complete it will also complete wave x of the Cycle degree Double Zigzag with a rating of 84.3. These two waves have the same target ranges.
After wave x is complete, expect the market to continue down into wave y, which should be a three wave Zigzag pattern. Expect wave y to retrace wave x by 116% - 261%. Wave y can also be expected to be 90% - 261% of the price length of wave w. The expected time for wave y to complete is 21% - 160% of the time taken for wave x to complete and 25% - 152% of the time taken for wave w to complete.
Current Analysis Settings: Analysis Date Range: 06-Dec-2013 to 12-Feb-2016, Label Range: 15 - 50, Preferred Count Labels: 25, Min Rating: 75, Stocks toggle ON, Bias Towards Beginning of Data: 8, Bias Towards Major High/Low: 8, Largest Degree Wave Filter: Any Pattern
Rating:84.1
Current Trading Positions for ProShares Short Russell2000 (RWM) Daily on 12-Feb-2016
* A Primary degree trader (hold positions from months to years), would currently be trading long in this market. The probability of this Target Area being correct is 65.5%. However, the random probability of this Target Area being correct is 45.0%. So the true probability of this Target Area being correct is 45.6% better than random.
* A Cycle degree trader (hold positions from quarters to years), would currently be trading long in this market. The probability of this Target Area being correct is 37.0%. However, the random probability of this Target Area being correct is 24.3%. So the true probability of this Target Area being correct is 52.3% better than random.
Extensive Elliott Commentary for ProShares Short Russell2000 (RWM) Daily on 12-Feb-2016 with two incomplete patterns:
Wave C of the Primary degree inverted Zigzag with a rating of 105.8 is expected to complete in the price range 72.53 to 96.33, but more probably between 73.99 and 86.08. This wave is due to complete anytime from now until 21-Apr-2016, but is most likely to complete before 26-Feb-2016.
This wave C will complete the ZigZag pattern.
This is the final wave in the pattern. When complete it will also complete wave y of the Cycle degree inverted Double Zigzag with a rating of 84.1. These two waves have the same target ranges.
Wave y will probably complete this Double Sharp pattern, although it could possibly extend into a Triple Sharp pattern.
Current Analysis Settings: Analysis Date Range: 13-May-2015 to 12-Feb-2016, Label Range: 15 - 50, Preferred Count Labels: 15, Min Rating: 75, Stocks toggle ON, Bias Towards Beginning of Data: 8, Bias Towards Major High/Low: 8, Largest Degree Wave Filter: Any Pattern
Rating:87.6
Current Trading Positions for ProShares Short S&P500 ETF (SH) Daily on 12-Feb-2016
* A Primary degree trader (hold positions from months to years), would currently be trading long in this market. The probability of this Target Area being correct is 86.8%. However, the random probability of this Target Area being correct is 64.1%. So the true probability of this Target Area being correct is 35.4% better than random.
* A Cycle degree trader (hold positions from quarters to years), would currently be trading long in this market. The probability of this Target Area being correct is 43.1%. However, the random probability of this Target Area being correct is 34.0%. So the true probability of this Target Area being correct is 26.8% better than random.
Extensive Elliott Commentary for ProShares Short S&P500 ETF (SH) Daily on 12-Feb-2016 with two incomplete patterns:
Wave Y of the Primary degree inverted Double 3 with a rating of 98.6 is expected to complete in the price range 21.97 to 32.18, but more probably between 23.69 and 26.8. This wave is most likely to complete sometime between 02-Mar-2016 and 27-Sep-2016 Note that it cannot complete until 18-Feb-2016 but must complete by 31-Jul-2017.
Wave Y will probably complete this Double Sideways pattern, although it could possibly extend into a Triple Sideways pattern.
This is the final wave in the pattern. When complete it will also complete wave b of the Cycle degree Flat with a rating of 87.6. These two waves have the same target ranges.
After wave b is complete, expect the market to continue down into wave c, which should be a five wave Impulsive pattern. Expect wave c to retrace wave b by 86% - 162%. Wave c can also be expected to be 90% - 162% of the price length of wave a. The expected time for wave c to complete is 19% - 134% of the time taken for wave b to complete and 24% - 115% of the time taken for wave a to complete.
Current Analysis Settings: Analysis Date Range: 23-Dec-2013 to 12-Feb-2016, Label Range: 15 - 50, Preferred Count Labels: 27, Min Rating: 75, Stocks toggle ON, Bias Towards Beginning of Data: 8, Bias Towards Major High/Low: 8, Largest Degree Wave Filter: Any Pattern
Rating:87
Current Trading Positions for ProShares Short Trust Dow30 (DOG) Daily on 12-Feb-2016
* A Primary degree trader (hold positions from months to years), would currently be trading long in this market. The probability of this Target Area being correct is 42.6%. However, the random probability of this Target Area being correct is 24.3%. So the true probability of this Target Area being correct is 75.3% better than random.
* A Cycle degree trader (hold positions from quarters to years), would currently be trading long in this market. The probability of this Target Area being correct is 42.8%. However, the random probability of this Target Area being correct is 34.0%. So the true probability of this Target Area being correct is 25.9% better than random.
Extensive Elliott Commentary for ProShares Short Trust Dow30 (DOG) Daily on 12-Feb-2016 with two incomplete patterns:
Wave Y of the Primary degree inverted Double Zigzag with a rating of 103.5 is expected to complete in the price range 26.55 to 31.84, but more probably between 26.6 and 28.91. This wave is due to complete anytime from now until 14-Mar-2016, but is most likely to complete before 01-Mar-2016.
Wave Y will probably complete this Double Sharp pattern, although it could possibly extend into a Triple Sharp pattern.
This is the final wave in the pattern. When complete it will also complete wave b of the Cycle degree Flat with a rating of 87. These two waves have the same target ranges.
After wave b is complete, expect the market to continue down into wave c, which should be a five wave Impulsive pattern. Expect wave c to retrace wave b by 85% - 162%. Wave c can also be expected to be 90% - 162% of the price length of wave a. The expected time for wave c to complete is 20% - 136% of the time taken for wave b to complete and 20% - 110% of the time taken for wave a to complete.
Current Analysis Settings: Analysis Date Range: 23-Dec-2013 to 12-Feb-2016, Label Range: 15 - 50, Preferred Count Labels: 19, Min Rating: 75, Stocks toggle ON, Bias Towards Beginning of Data: 8, Bias Towards Major High/Low: 8, Largest Degree Wave Filter: Any Pattern
Rating:85.2
Current Trading Positions for ProShares Short VIX Short-Term Futures ETF (SVXY) Daily on 12-Feb-2016
* An Intermediate degree trader (hold positions from months to quarters), would currently be shorting this market. The probability of this Target Area being correct is 66.8%. However, the random probability of this Target Area being correct is 53.0%. So the true probability of this Target Area being correct is 26.0% better than random.
* A Primary degree trader (hold positions from months to years), would currently be trading long in this market. The probability of this Target Area being correct is 42.5%. However, the random probability of this Target Area being correct is 34.0%. So the true probability of this Target Area being correct is 25.0% better than random.
Extensive Elliott Commentary for ProShares Short VIX Short-Term Futures ETF (SVXY) Daily on 12-Feb-2016 with two incomplete patterns:
Wave (X) of the Intermediate degree inverted Double 3 with a rating of 102.3 is expected to complete at a price no higher than 36.93, but more probably between 31.16 and 34.33. This wave is due to complete anytime from now until 05-Apr-2016, but is most likely to complete before 12-Feb-2016.
After wave (X) is complete, expect the market to continue up into wave (Y), which will probably be a three wave corrective pattern. Expect wave (Y) to retrace wave (X) by 98% - 212%. Wave (Y) can also be expected to be 73% - 212% of the price length of wave (W). The expected time for wave (Y) to complete is 27% - 214% of the time taken for wave (X) to complete and 38% - 222% of the time taken for wave (W) to complete.
Wave B of the Primary degree Flat with a rating of 85.2 is expected to complete in the price range 54.23 to 118.26, but more probably between 54.88 and 71.63. This wave is due to complete anytime from now until 21-Jul-2017, but is most likely to complete before 13-Apr-2016.
After wave B is complete, expect the market to continue down into wave C, which should be a five wave Impulsive pattern. Expect wave C to retrace wave B by 86% - 162%. Wave C can also be expected to be 90% - 162% of the price length of wave A. The expected time for wave C to complete is 19% - 134% of the time taken for wave B to complete and 24% - 115% of the time taken for wave A to complete.
Current Analysis Settings: Analysis Date Range: 13-May-2015 to 12-Feb-2016, Label Range: 15 - 50, Preferred Count Labels: 25, Min Rating: 75, Stocks toggle ON, Bias Towards Beginning of Data: 8, Bias Towards Major High/Low: 8, Largest Degree Wave Filter: Any Pattern
Rating:77.9
Current Trading Positions for ProShares Ultra Bloomberg Natural Gas (BOIL) Daily on 12-Feb-2016
* A Primary degree trader (hold positions from months to years), would currently be shorting this market. The probability of this Target Area being correct is 64.5%. However, the random probability of this Target Area being correct is 45.0%. So the true probability of this Target Area being correct is 43.3% better than random.
* A Cycle degree trader (hold positions from quarters to years), would currently be shorting this market. The probability of this Target Area being correct is 33.5%. However, the random probability of this Target Area being correct is 24.3%. So the true probability of this Target Area being correct is 37.9% better than random.
Extensive Elliott Commentary for ProShares Ultra Bloomberg Natural Gas (BOIL) Daily on 12-Feb-2016 with two incomplete patterns:
Wave C of the Primary degree Zigzag with a rating of 100.4 is expected to complete at a price no higher than 13.79, but more probably no higher than 10.39. This wave is due to complete anytime from now until 07-Jun-2016, but is most likely to complete before 13-Apr-2016.
This wave C will complete the ZigZag pattern.
This is the final wave in the pattern. When complete it will also complete wave y of the Cycle degree Double Zigzag with a rating of 77.9. These two waves have the same target ranges.
Wave y will probably complete this Double Sharp pattern, although it could possibly extend into a Triple Sharp pattern.
Current Analysis Settings: Analysis Date Range: 23-Dec-2013 to 12-Feb-2016, Label Range: 15 - 50, Preferred Count Labels: 16, Min Rating: 75, Stocks toggle ON, Bias Towards Beginning of Data: 8, Bias Towards Major High/Low: 8, Largest Degree Wave Filter: Any Pattern
Rating:81.2
Current Trading Positions for ProShares Ultra DJ Crude (UCO) Daily on 12-Feb-2016
* An Intermediate degree trader (hold positions from months to quarters), would currently be shorting this market. The probability of this Target Area being correct is 47.6%. However, the random probability of this Target Area being correct is 34.0%. So the true probability of this Target Area being correct is 40.0% better than random.
* A Primary degree trader (hold positions from months to years), would currently be trading long in this market. The probability of this Target Area being correct is 86.7%. However, the random probability of this Target Area being correct is 64.1%. So the true probability of this Target Area being correct is 35.3% better than random.
* A Cycle degree trader (hold positions from quarters to years), would currently be trading long in this market. The probability of this Target Area being correct is 78.4%. However, the random probability of this Target Area being correct is 65.0%. So the true probability of this Target Area being correct is 20.6% better than random.
Extensive Elliott Commentary for ProShares Ultra DJ Crude (UCO) Daily on 12-Feb-2016 with three incomplete patterns:
Wave (B) of the Intermediate degree inverted Flat with a rating of 96.9 is expected to complete in the price range .57 to 8, but more probably between 6.81 and 7.94. This wave was expected to complete before 08-Feb-2016, and must complete by 15-Feb-2016.
After wave (B) is complete, expect the market to continue up into wave (C), which should be a five wave Impulsive pattern. Expect wave (C) to retrace wave (B) by 83% - 173%. Wave (C) can also be expected to be 101% - 173% of the price length of wave (A). The expected time for wave (C) to complete is 20% - 190% of the time taken for wave (B) to complete and 57% - 279% of the time taken for wave (A) to complete.
Wave Y of the Primary degree inverted Double 3 with a rating of 97.3 is expected to complete in the price range 7.63 to 19.75, but more probably between 9.85 and 13.64. This wave is due to complete anytime from now until 19-Feb-2016, but is most likely to complete before 15-Feb-2016.
Wave Y will probably complete this Double Sideways pattern, although it could possibly extend into a Triple Sideways pattern.
This is the final wave in the pattern. When complete it will also complete wave x of the Cycle degree Double Zigzag with a rating of 81.2. These two waves have the same target ranges.
After wave x is complete, expect the market to continue down into wave y, which should be a three wave Zigzag pattern. Expect wave y to retrace wave x by 117% - 263%. Wave y can also be expected to be 90% - 263% of the price length of wave w. The expected time for wave y to complete is 21% - 161% of the time taken for wave x to complete and 27% - 154% of the time taken for wave w to complete.
Current Analysis Settings: Analysis Date Range: 09-May-2014 to 12-Feb-2016, Label Range: 15 - 50, Preferred Count Labels: 15, Min Rating: 75, Stocks toggle ON, Bias Towards Beginning of Data: 8, Bias Towards Major High/Low: 8, Largest Degree Wave Filter: Any Pattern
Rating:96.9
Current Trading Positions for ProShares Ultra Dow30 ETF (DDM) Daily on 12-Feb-2016
* A Primary degree trader (hold positions from months to years), would currently be shorting this market. The probability of this Target Area being correct is 47.6%. However, the random probability of this Target Area being correct is 34.0%. So the true probability of this Target Area being correct is 40.0% better than random.
Extensive Elliott Commentary for ProShares Ultra Dow30 ETF (DDM) Daily on 12-Feb-2016 with one incomplete pattern:
Wave B of the Primary degree inverted Flat with a rating of 96.9 is expected to complete in the price range 37.18 to 51.48, but more probably between 47.5 and 51.3. This wave could complete anytime between now and 01-Mar-2018, but is most likely to complete sometime between 19-Feb-2016 and 24-May-2016.
After wave B is complete, expect the market to continue up into wave C, which should be a five wave Impulsive pattern. Expect wave C to retrace wave B by 82% - 177%. Wave C can also be expected to be 89% - 177% of the price length of wave A. The expected time for wave C to complete is 15% - 160% of the time taken for wave B to complete and 16% - 118% of the time taken for wave A to complete.
Current Analysis Settings: Analysis Date Range: 09-Apr-2015 to 12-Feb-2016, Label Range: 15 - 50, Preferred Count Labels: 23, Min Rating: 75, Stocks toggle ON, Bias Towards Beginning of Data: 8, Bias Towards Major High/Low: 8, Largest Degree Wave Filter: Any Pattern
Rating:96.8
Current Trading Positions for ProShares Ultra Nasdaq Biotechnology (BIB) Daily on 12-Feb-2016
* An Intermediate degree trader (hold positions from months to quarters), would currently be shorting this market. The probability of this Target Area being correct is 47.6%. However, the random probability of this Target Area being correct is 34.0%. So the true probability of this Target Area being correct is 40.0% better than random.
Extensive Elliott Commentary for ProShares Ultra Nasdaq Biotechnology (BIB) Daily on 12-Feb-2016 with one incomplete pattern:
Wave (B) of the Intermediate degree inverted Flat with a rating of 96.8 is expected to complete in the price range 16.37 to 40.87, but more probably between 36.94 and 40.67. This wave was expected to complete before 08-Feb-2016, and must complete by 15-Feb-2016.
After wave (B) is complete, expect the market to continue up into wave (C), which should be a five wave Impulsive pattern. Expect wave (C) to retrace wave (B) by 83% - 173%. Wave (C) can also be expected to be 101% - 173% of the price length of wave (A). The expected time for wave (C) to complete is 20% - 190% of the time taken for wave (B) to complete and 57% - 279% of the time taken for wave (A) to complete.
Current Analysis Settings: Analysis Date Range: 05-Mar-2014 to 12-Feb-2016, Label Range: 15 - 50, Preferred Count Labels: 28, Min Rating: 75, Stocks toggle ON, Bias Towards Beginning of Data: 8, Bias Towards Major High/Low: 8, Largest Degree Wave Filter: Any Pattern
Rating:82.4
Current Trading Positions for ProShares Ultra Oil & Gas ETF (DIG) Daily on 12-Feb-2016
* A Minor degree trader (hold positions from weeks to quarters), would currently be shorting this market. The probability of this Target Area being correct is 71.0%. However, the random probability of this Target Area being correct is 45.0%. So the true probability of this Target Area being correct is 57.8% better than random.
* A Primary degree trader (hold positions from months to years), would currently be trading long in this market. The probability of this Target Area being correct is 50.4%. However, the random probability of this Target Area being correct is 45.0%. So the true probability of this Target Area being correct is 12.0% better than random.
* A Cycle degree trader (hold positions from quarters to years), would currently be shorting this market. The probability of this Target Area being correct is 36.0%. However, the random probability of this Target Area being correct is 24.3%. So the true probability of this Target Area being correct is 48.1% better than random.
Extensive Elliott Commentary for ProShares Ultra Oil & Gas ETF (DIG) Daily on 12-Feb-2016 with four incomplete patterns:
Wave 2 of the Minor degree Impulse with a rating of 98.3 is expected to complete in the price range 20.4 to 26.54, but more probably between 23.5 and 25.9. This wave was expected to complete before 09-Feb-2016, and must complete by 14-Mar-2016.
After this wave 2 is complete, expect the market to continue up into wave 3. Wave 3 should always be an Impulse and should retrace wave 2 completely. Expect wave 3 to retrace wave 2 by 164% - 383%. Wave 3 can also be expected to be 83% - 383% of the price length of wave 1. The expected time for wave 3 to complete is 87% - 367% of the time taken for wave 2 to complete and 16% - 97% of the time taken for wave 1 to complete. The slope (ie. price range divided by time taken) of wave 3 should be between 70% and 219% of the slope of wave 1. Once wave 3 is complete, expect wave 4 to be a sideways corrective movement, then wave 5 to continue in the same direction as wave 3. Wave 5 will complete this Impulse.
Wave (C) of the Intermediate degree inverted Flat with a rating of 84.4 is expected to complete in the price range 28.99 to 61.84, but more probably between 35.77 and 53.15. This wave is due to complete anytime from now until 28-Feb-2017, but is most likely to complete before 06-Apr-2016.
This wave (C) will complete the Flat pattern.
This is the final wave in the pattern. When complete it will also complete wave B of the Primary degree Zigzag with a rating of 77.9. These two waves have the same target ranges.
After wave B is complete, expect the market to continue down into wave C, which should be a five wave impulsive pattern. Expect wave C to retrace wave B by 96% - 215%. Wave C can also be expected to be 33% - 215% of the price length of wave A. The expected time for wave C to complete is 22% - 199% of the time taken for wave B to complete and 24% - 111% of the time taken for wave A to complete.
Wave y of the Cycle degree Double Zigzag with a rating of 82.4 is expected to complete at a price no higher than 19, but more probably between 8.59 and 18.31. This wave was expected to complete before 07-Jan-2016, and must complete by 09-Nov-2016.
Wave y will probably complete this Double Sharp pattern, although it could possibly extend into a Triple Sharp pattern.
Current Analysis Settings: Analysis Date Range: 12-May-2014 to 12-Feb-2016, Label Range: 15 - 50, Preferred Count Labels: 21, Min Rating: 75, Stocks toggle ON, Bias Towards Beginning of Data: 8, Bias Towards Major High/Low: 8, Largest Degree Wave Filter: Any Pattern
Rating:81.1
Current Trading Positions for ProShares Ultra QQQ (QLD) Daily on 12-Feb-2016
* A Primary degree trader (hold positions from months to years), would currently be shorting this market. The probability of this Target Area being correct is 41.2%. However, the random probability of this Target Area being correct is 24.3%. So the true probability of this Target Area being correct is 69.5% better than random.
* A Cycle degree trader (hold positions from quarters to years), would currently be shorting this market. The probability of this Target Area being correct is 41.3%. However, the random probability of this Target Area being correct is 34.0%. So the true probability of this Target Area being correct is 21.5% better than random.
Extensive Elliott Commentary for ProShares Ultra QQQ (QLD) Daily on 12-Feb-2016 with two incomplete patterns:
Wave Y of the Primary degree Double Zigzag with a rating of 96.3 is expected to complete in the price range 2.67 to 43.59, but more probably between 31.37 and 43.16. This wave is most likely to complete sometime between 25-Feb-2016 and 29-Apr-2016 Note that it cannot complete until 23-Feb-2016 but must complete by 06-Jun-2016.
Wave Y will probably complete this Double Sharp pattern, although it could possibly extend into a Triple Sharp pattern.
This is the final wave in the pattern. When complete it will also complete wave b of the Cycle degree inverted Flat with a rating of 81.1. These two waves have the same target ranges.
After wave b is complete, expect the market to continue up into wave c, which should be a five wave Impulsive pattern. Expect wave c to retrace wave b by 82% - 179%. Wave c can also be expected to be 67% - 179% of the price length of wave a. The expected time for wave c to complete is 20% - 151% of the time taken for wave b to complete and 11% - 58% of the time taken for wave a to complete.
Current Analysis Settings: Analysis Date Range: 05-Mar-2014 to 12-Feb-2016, Label Range: 15 - 50, Preferred Count Labels: 28, Min Rating: 75, Stocks toggle ON, Bias Towards Beginning of Data: 8, Bias Towards Major High/Low: 8, Largest Degree Wave Filter: Any Pattern
Rating:75.5
Current Trading Positions for ProShares Ultra Real Estate ETF (URE) Daily on 12-Feb-2016
* An Intermediate degree trader (hold positions from months to quarters), would currently be shorting this market. The probability of this Target Area being correct is 50.1%. However, the random probability of this Target Area being correct is 34.0%. So the true probability of this Target Area being correct is 47.4% better than random.
* A Primary degree trader (hold positions from months to years), would currently be trading long in this market. The probability of this Target Area being correct is 85.4%. However, the random probability of this Target Area being correct is 64.1%. So the true probability of this Target Area being correct is 33.2% better than random.
* A Cycle degree trader (hold positions from quarters to years), would currently be trading long in this market. The probability of this Target Area being correct is 39.5%. However, the random probability of this Target Area being correct is 34.0%. So the true probability of this Target Area being correct is 16.2% better than random.
Extensive Elliott Commentary for ProShares Ultra Real Estate ETF (URE) Daily on 12-Feb-2016 with three incomplete patterns:
Wave (B) of the Intermediate degree inverted Flat with a rating of 101.1 is expected to complete in the price range 37.07 to 88.12, but more probably between 80.17 and 87.85. This wave is due to complete anytime from now until 19-Apr-2016, but is most likely to complete before 18-Feb-2016.
After wave (B) is complete, expect the market to continue up into wave (C), which should be a five wave Impulsive pattern. Expect wave (C) to retrace wave (B) by 80% - 169%. Wave (C) can also be expected to be 99% - 169% of the price length of wave (A). The expected time for wave (C) to complete is 19% - 187% of the time taken for wave (B) to complete and 56% - 268% of the time taken for wave (A) to complete.
Wave Y of the Primary degree inverted Double 3 with a rating of 85 is expected to complete in the price range 92.05 to 164.35, but more probably between 101.66 and 129.24. This wave is due to complete anytime from now until 14-Oct-2016, but is most likely to complete before 24-May-2016.
Wave Y will probably complete this Double Sideways pattern, although it could possibly extend into a Triple Sideways pattern.
This is the final wave in the pattern. When complete it will also complete wave b of the Cycle degree Flat with a rating of 75.5. These two waves have the same target ranges.
After wave b is complete, expect the market to continue down into wave c, which should be a five wave Impulsive pattern. Expect wave c to retrace wave b by 86% - 162%. Wave c can also be expected to be 90% - 162% of the price length of wave a. The expected time for wave c to complete is 19% - 134% of the time taken for wave b to complete and 24% - 115% of the time taken for wave a to complete.
Current Analysis Settings: Analysis Date Range: 06-Dec-2013 to 12-Feb-2016, Label Range: 15 - 50, Preferred Count Labels: 17, Min Rating: 75, Stocks toggle ON, Bias Towards Beginning of Data: 8, Bias Towards Major High/Low: 8, Largest Degree Wave Filter: Any Pattern
Rating:88.9
Current Trading Positions for ProShares Ultra Russell 2000 ETF (UWM) Daily on 12-Feb-2016
* A Primary degree trader (hold positions from months to years), would currently be shorting this market. The probability of this Target Area being correct is 64.9%. However, the random probability of this Target Area being correct is 45.0%. So the true probability of this Target Area being correct is 44.2% better than random.
* A Cycle degree trader (hold positions from quarters to years), would currently be shorting this market. The probability of this Target Area being correct is 39.0%. However, the random probability of this Target Area being correct is 24.3%. So the true probability of this Target Area being correct is 60.5% better than random.
Extensive Elliott Commentary for ProShares Ultra Russell 2000 ETF (UWM) Daily on 12-Feb-2016 with two incomplete patterns:
Wave C of the Primary degree Zigzag with a rating of 103 is expected to complete in the price range 32.01 to 59.75, but more probably between 42.35 and 56.33. This wave is due to complete anytime from now until 10-May-2016, but is most likely to complete before 24-Feb-2016.
This wave C will complete the ZigZag pattern.
This is the final wave in the pattern. When complete it will also complete wave y of the Cycle degree Double Zigzag with a rating of 88.9. These two waves have the same target ranges.
Wave y will probably complete this Double Sharp pattern, although it could possibly extend into a Triple Sharp pattern.
Current Analysis Settings: Analysis Date Range: 12-May-2015 to 12-Feb-2016, Label Range: 15 - 50, Preferred Count Labels: 17, Min Rating: 75, Stocks toggle ON, Bias Towards Beginning of Data: 8, Bias Towards Major High/Low: 8, Largest Degree Wave Filter: Any Pattern
Rating:91
Current Trading Positions for ProShares Ultra S&P 500 (SSO) Daily on 12-Feb-2016
* A Primary degree trader (hold positions from months to years), would currently be shorting this market. The probability of this Target Area being correct is 64.9%. However, the random probability of this Target Area being correct is 45.0%. So the true probability of this Target Area being correct is 44.2% better than random.
* A Cycle degree trader (hold positions from quarters to years), would currently be shorting this market. The probability of this Target Area being correct is 44.0%. However, the random probability of this Target Area being correct is 34.0%. So the true probability of this Target Area being correct is 29.4% better than random.
Extensive Elliott Commentary for ProShares Ultra S&P 500 (SSO) Daily on 12-Feb-2016 with two incomplete patterns:
Wave C of the Primary degree Zigzag with a rating of 102.9 is expected to complete in the price range 18.98 to 50.68, but more probably between 40.22 and 50.19. This wave is due to complete anytime from now until 18-Apr-2016, but is most likely to complete before 10-Mar-2016.
This wave C will complete the ZigZag pattern.
This is the final wave in the pattern. When complete it will also complete wave b of the Cycle degree inverted Flat with a rating of 91. These two waves have the same target ranges.
After wave b is complete, expect the market to continue up into wave c, which should be a five wave Impulsive pattern. Expect wave c to retrace wave b by 82% - 179%. Wave c can also be expected to be 67% - 179% of the price length of wave a. The expected time for wave c to complete is 20% - 151% of the time taken for wave b to complete and 11% - 58% of the time taken for wave a to complete.
Current Analysis Settings: Analysis Date Range: 23-Dec-2013 to 12-Feb-2016, Label Range: 15 - 50, Preferred Count Labels: 19, Min Rating: 75, Stocks toggle ON, Bias Towards Beginning of Data: 8, Bias Towards Major High/Low: 8, Largest Degree Wave Filter: Any Pattern
Rating:96.6
Current Trading Positions for ProShares Ultra Short Nasdaq Biotechnology (BIS) Daily on 12-Feb-2016
* An Intermediate degree trader (hold positions from months to quarters), would currently be trading long in this market. The probability of this Target Area being correct is 47.6%. However, the random probability of this Target Area being correct is 34.0%. So the true probability of this Target Area being correct is 40.0% better than random.
Extensive Elliott Commentary for ProShares Ultra Short Nasdaq Biotechnology (BIS) Daily on 12-Feb-2016 with one incomplete pattern:
Wave (B) of the Intermediate degree Flat with a rating of 96.6 is expected to complete in the price range 47.07 to 73.01, but more probably between 47.21 and 51.98. This wave was expected to complete before 08-Feb-2016, and must complete by 15-Feb-2016.
After wave (B) is complete, expect the market to continue down into wave (C), which should be a five wave Impulsive pattern. Expect wave (C) to retrace wave (B) by 89% - 167%. Wave (C) can also be expected to be 105% - 167% of the price length of wave (A). The expected time for wave (C) to complete is 20% - 148% of the time taken for wave (B) to complete and 60% - 290% of the time taken for wave (A) to complete.
Current Analysis Settings: Analysis Date Range: 06-Dec-2013 to 12-Feb-2016, Label Range: 15 - 50, Preferred Count Labels: 39, Min Rating: 75, Stocks toggle ON, Bias Towards Beginning of Data: 8, Bias Towards Major High/Low: 8, Largest Degree Wave Filter: Any Pattern
Rating:88.2
Current Trading Positions for Proshares Ultra Silver (AGQ) Daily on 12-Feb-2016
* A Primary degree trader (hold positions from months to years), would currently be trading long in this market. The probability of this Target Area being correct is 87.2%. However, the random probability of this Target Area being correct is 64.1%. So the true probability of this Target Area being correct is 36.0% better than random.
* A Cycle degree trader (hold positions from quarters to years), would currently be trading long in this market. The probability of this Target Area being correct is 81.2%. However, the random probability of this Target Area being correct is 65.0%. So the true probability of this Target Area being correct is 24.9% better than random.
Extensive Elliott Commentary for Proshares Ultra Silver (AGQ) Daily on 12-Feb-2016 with two incomplete patterns:
Wave Y of the Primary degree inverted Double 3 with a rating of 102.4 is expected to complete in the price range 30.37 to 65.58, but more probably between 35.13 and 48.33. This wave is due to complete anytime from now until 27-Jun-2016, but is most likely to complete before 30-Mar-2016.
Wave Y will probably complete this Double Sideways pattern, although it could possibly extend into a Triple Sideways pattern.
This is the final wave in the pattern. When complete it will also complete wave x of the Cycle degree Double Zigzag with a rating of 88.2. These two waves have the same target ranges.
After wave x is complete, expect the market to continue down into wave y, which should be a three wave Zigzag pattern. Expect wave y to retrace wave x by 116% - 261%. Wave y can also be expected to be 90% - 261% of the price length of wave w. The expected time for wave y to complete is 21% - 160% of the time taken for wave x to complete and 25% - 152% of the time taken for wave w to complete.
Current Analysis Settings: Analysis Date Range: 10-Jan-2014 to 12-Feb-2016, Label Range: 15 - 50, Preferred Count Labels: 20, Min Rating: 75, Stocks toggle ON, Bias Towards Beginning of Data: 8, Bias Towards Major High/Low: 8, Largest Degree Wave Filter: Any Pattern
Rating:79.2
Current Trading Positions for ProShares Ultra VIX Short-Term Futures ETF (UVXY) Daily on 12-Feb-2016
* An Intermediate degree trader (hold positions from months to quarters), would currently be trading long in this market. The probability of this Target Area being correct is 88.0%. However, the random probability of this Target Area being correct is 65.0%. So the true probability of this Target Area being correct is 35.4% better than random.
* A Primary degree trader (hold positions from months to years), would currently be shorting this market. The probability of this Target Area being correct is 39.8%. However, the random probability of this Target Area being correct is 34.0%. So the true probability of this Target Area being correct is 17.1% better than random.
* A Cycle degree trader (hold positions from quarters to years), would currently be trading long in this market. The probability of this Target Area being correct is 77.6%. However, the random probability of this Target Area being correct is 65.0%. So the true probability of this Target Area being correct is 19.4% better than random.
Extensive Elliott Commentary for ProShares Ultra VIX Short-Term Futures ETF (UVXY) Daily on 12-Feb-2016 with three incomplete patterns:
Wave (X) of the Intermediate degree Double Zigzag with a rating of 100.2 is expected to complete in the price range 36.84 to 91.25, but more probably between 52.1 and 79.97. This wave was expected to complete before 27-Jan-2016, and must complete by 01-Jul-2016.
After wave (X) is complete, expect the market to continue down into wave (Y), which should be a three wave Zigzag pattern. Expect wave (Y) to retrace wave (X) by 117% - 263%. Wave (Y) can also be expected to be 90% - 263% of the price length of wave (W). The expected time for wave (Y) to complete is 21% - 161% of the time taken for wave (X) to complete and 27% - 154% of the time taken for wave (W) to complete.
Wave B of the Primary degree inverted Flat with a rating of 76.9 is expected to complete at a price no higher than 51.1, but more probably between 24.73 and 49.9. This wave was expected to complete before 09-Nov-2015, and must complete by 16-Sep-2016.
After wave B is complete, expect the market to continue up into wave C, which should be a five wave Impulsive pattern. Expect wave C to retrace wave B by 82% - 177%. Wave C can also be expected to be 89% - 177% of the price length of wave A. The expected time for wave C to complete is 15% - 160% of the time taken for wave B to complete and 16% - 118% of the time taken for wave A to complete.
Wave x of the Cycle degree Double Zigzag with a rating of 79.2 is expected to complete in the price range 76.34 to 281.4, but more probably between 133.85 and 238.88. This wave is due to complete anytime from now until 22-Dec-2017, but is most likely to complete before 22-Apr-2016.
After wave x is complete, expect the market to continue down into wave y, which should be a three wave Zigzag pattern. Expect wave y to retrace wave x by 117% - 263%. Wave y can also be expected to be 90% - 263% of the price length of wave w. The expected time for wave y to complete is 21% - 161% of the time taken for wave x to complete and 27% - 154% of the time taken for wave w to complete.
Current Analysis Settings: Analysis Date Range: 23-Dec-2013 to 12-Feb-2016, Label Range: 15 - 50, Preferred Count Labels: 15, Min Rating: 75, Stocks toggle ON, Bias Towards Beginning of Data: 8, Bias Towards Major High/Low: 8, Largest Degree Wave Filter: Any Pattern
Rating:76
Current Trading Positions for ProShares UltraPro Dow 30 (UDOW) Daily on 12-Feb-2016
* An Intermediate degree trader (hold positions from months to quarters), would currently be trading long in this market. The probability of this Target Area being correct is 23.0%. However, the random probability of this Target Area being correct is 13.0%. So the true probability of this Target Area being correct is 76.9% better than random.
* A Cycle degree trader (hold positions from quarters to years), would currently be trading long in this market. The probability of this Target Area being correct is 39.5%. However, the random probability of this Target Area being correct is 34.0%. So the true probability of this Target Area being correct is 16.2% better than random.
Extensive Elliott Commentary for ProShares UltraPro Dow 30 (UDOW) Daily on 12-Feb-2016 with three incomplete patterns:
Wave (3) of the Intermediate degree Impulse with a rating of 93 is expected to complete in the price range 56.71 to 106.91, but more probably between 58.47 and 71.56. This wave is most likely to complete sometime between 15-Feb-2016 and 29-Feb-2016 Note that it cannot complete until 15-Feb-2016 but must complete by 15-Mar-2016.
When complete, expect the overall slope (ie. price range divided by time taken) of this wave (3) to be between 70% to 219% of the slope of wave (1). Then expect the market to pull back into wave (4), which will be corrective in nature and has a probability of 83% of being a Flat or other sideways pattern. Wave (4) should not retrace back into the price range of wave (1) or (2). Expect wave (4) to have between 5% - 141% of the price range of wave (2). The expected time for wave (4) to complete is between 15% - 135% of wave (2). After wave (4), expect wave (5) to move beyond the end of wave (3) to complete this Impulse.
Wave C of the Primary degree inverted Flat with a rating of 83.9 is expected to complete in the price range 50.79 to 116.27, but more probably between 67.39 and 92.97. This wave is due to complete anytime from now until 08-Mar-2017, but is most likely to complete before 05-Apr-2016.
This wave C will complete the Flat pattern.
This is the final wave in the pattern. When complete it will also complete wave b of the Cycle degree Flat with a rating of 76. These two waves have the same target ranges.
After wave b is complete, expect the market to continue down into wave c, which should be a five wave Impulsive pattern. Expect wave c to retrace wave b by 86% - 162%. Wave c can also be expected to be 90% - 162% of the price length of wave a. The expected time for wave c to complete is 19% - 134% of the time taken for wave b to complete and 24% - 115% of the time taken for wave a to complete.
Current Analysis Settings: Analysis Date Range: 09-Apr-2015 to 12-Feb-2016, Label Range: 15 - 50, Preferred Count Labels: 24, Min Rating: 75, Stocks toggle ON, Bias Towards Beginning of Data: 8, Bias Towards Major High/Low: 8, Largest Degree Wave Filter: Any Pattern
Rating:80.4
Current Trading Positions for ProShares UltraPro QQQ (TQQQ) Daily on 12-Feb-2016
* A Primary degree trader (hold positions from months to years), would currently be shorting this market. The probability of this Target Area being correct is 56.4%. However, the random probability of this Target Area being correct is 45.0%. So the true probability of this Target Area being correct is 25.3% better than random.
* A Cycle degree trader (hold positions from quarters to years), would currently be shorting this market. The probability of this Target Area being correct is 41.0%. However, the random probability of this Target Area being correct is 34.0%. So the true probability of this Target Area being correct is 20.6% better than random.
Extensive Elliott Commentary for ProShares UltraPro QQQ (TQQQ) Daily on 12-Feb-2016 with two incomplete patterns:
Wave C of the Primary degree Zigzag with a rating of 94.8 is expected to complete at a price no higher than 68.2, but more probably between 17.98 and 61.3. This wave is most likely to complete sometime between 22-Feb-2016 and 14-Jun-2016 Note that it cannot complete until 19-Feb-2016 but must complete by 22-Sep-2016.
This wave C will complete the ZigZag pattern.
This is the final wave in the pattern. When complete it will also complete wave b of the Cycle degree inverted Flat with a rating of 80.4. These two waves have the same target ranges.
After wave b is complete, expect the market to continue up into wave c, which should be a five wave Impulsive pattern. Expect wave c to retrace wave b by 82% - 179%. Wave c can also be expected to be 67% - 179% of the price length of wave a. The expected time for wave c to complete is 20% - 151% of the time taken for wave b to complete and 11% - 58% of the time taken for wave a to complete.
Current Analysis Settings: Analysis Date Range: 05-Mar-2014 to 12-Feb-2016, Label Range: 15 - 50, Preferred Count Labels: 22, Min Rating: 75, Stocks toggle ON, Bias Towards Beginning of Data: 8, Bias Towards Major High/Low: 8, Largest Degree Wave Filter: Any Pattern
Rating:86.4
Current Trading Positions for ProShares UltraPro Russell 2000 (URTY) Daily on 12-Feb-2016
* A Primary degree trader (hold positions from months to years), would currently be shorting this market. The probability of this Target Area being correct is 64.9%. However, the random probability of this Target Area being correct is 45.0%. So the true probability of this Target Area being correct is 44.2% better than random.
* A Cycle degree trader (hold positions from quarters to years), would currently be shorting this market. The probability of this Target Area being correct is 38.0%. However, the random probability of this Target Area being correct is 24.3%. So the true probability of this Target Area being correct is 56.4% better than random.
Extensive Elliott Commentary for ProShares UltraPro Russell 2000 (URTY) Daily on 12-Feb-2016 with two incomplete patterns:
Wave C of the Primary degree Zigzag with a rating of 102.5 is expected to complete in the price range 14.43 to 48.26, but more probably between 25.26 and 43.43. This wave is due to complete anytime from now until 10-May-2016, but is most likely to complete before 24-Feb-2016.
This wave C will complete the ZigZag pattern.
This is the final wave in the pattern. When complete it will also complete wave y of the Cycle degree Double Zigzag with a rating of 86.4. These two waves have the same target ranges.
Wave y will probably complete this Double Sharp pattern, although it could possibly extend into a Triple Sharp pattern.
Current Analysis Settings: Analysis Date Range: 13-May-2015 to 12-Feb-2016, Label Range: 15 - 50, Preferred Count Labels: 17, Min Rating: 75, Stocks toggle ON, Bias Towards Beginning of Data: 8, Bias Towards Major High/Low: 8, Largest Degree Wave Filter: Any Pattern
Rating:86.5
Current Trading Positions for ProShares UltraPro S&P500 (UPRO) Daily on 12-Feb-2016
* A Minor degree trader (hold positions from weeks to quarters), would currently be shorting this market. The probability of this Target Area being correct is 88.3%. However, the random probability of this Target Area being correct is 65.0%. So the true probability of this Target Area being correct is 35.8% better than random.
* An Intermediate degree trader (hold positions from months to quarters), would currently be trading long in this market. The probability of this Target Area being correct is 43.4%. However, the random probability of this Target Area being correct is 34.0%. So the true probability of this Target Area being correct is 27.6% better than random.
* A Primary degree trader (hold positions from months to years), would currently be shorting this market. The probability of this Target Area being correct is 40.1%. However, the random probability of this Target Area being correct is 34.0%. So the true probability of this Target Area being correct is 17.9% better than random.
* A Cycle degree trader (hold positions from quarters to years), would currently be trading long in this market. The probability of this Target Area being correct is 85.6%. However, the random probability of this Target Area being correct is 64.1%. So the true probability of this Target Area being correct is 33.5% better than random.
Extensive Elliott Commentary for ProShares UltraPro S&P500 (UPRO) Daily on 12-Feb-2016 with four incomplete patterns:
Wave X of the Minor degree inverted Double Zigzag with a rating of 102 is expected to complete in the price range 43.22 to 51.72, but more probably between 46.01 and 50.16. This wave is due to complete anytime from now until 14-Mar-2016, but is most likely to complete before 16-Feb-2016.
After wave X is complete, expect the market to continue up into wave Y, which should be a three wave Zigzag pattern. Expect wave Y to retrace wave X by 128% - 319%. Wave Y can also be expected to be 90% - 319% of the price length of wave W. The expected time for wave Y to complete is 23% - 167% of the time taken for wave X to complete and 47% - 204% of the time taken for wave W to complete.
Wave (B) of the Intermediate degree Flat with a rating of 88.2 is expected to complete in the price range 61.39 to 113.51, but more probably between 61.93 and 75.56. This wave is due to complete anytime from now until 25-Apr-2017, but is most likely to complete before 31-Mar-2016.
After wave (B) is complete, expect the market to continue down into wave (C), which should be a five wave Impulsive pattern. Expect wave (C) to retrace wave (B) by 86% - 162%. Wave (C) can also be expected to be 90% - 162% of the price length of wave (A). The expected time for wave (C) to complete is 19% - 134% of the time taken for wave (B) to complete and 24% - 115% of the time taken for wave (A) to complete.
Wave B of the Primary degree inverted Flat with a rating of 77.8 is expected to complete in the price range 9.31 to 51.89, but more probably between 40.03 and 51.35. This wave was expected to complete before 15-Jan-2016, and must complete by 14-Nov-2016.
After wave B is complete, expect the market to continue up into wave C, which should be a five wave Impulsive pattern. Expect wave C to retrace wave B by 82% - 177%. Wave C can also be expected to be 89% - 177% of the price length of wave A. The expected time for wave C to complete is 15% - 160% of the time taken for wave B to complete and 16% - 118% of the time taken for wave A to complete.
Wave y of the Cycle degree inverted Double 3 with a rating of 86.5 is expected to complete in the price range 44.87 to 141.83, but more probably between 61.16 and 90.64. This wave is due to complete anytime from now until 21-Nov-2017, but is most likely to complete before 25-Oct-2016.
Wave y will probably complete this Double Sideways pattern, although it could possibly extend into a Triple Sideways pattern.
Current Analysis Settings: Analysis Date Range: 23-Dec-2013 to 12-Feb-2016, Label Range: 15 - 50, Preferred Count Labels: 21, Min Rating: 75, Stocks toggle ON, Bias Towards Beginning of Data: 8, Bias Towards Major High/Low: 8, Largest Degree Wave Filter: Any Pattern
Rating:88.4
Current Trading Positions for ProShares UltraPro Short Dow 30 (SDOW) Daily on 12-Feb-2016
* A Primary degree trader (hold positions from months to years), would currently be trading long in this market. The probability of this Target Area being correct is 42.8%. However, the random probability of this Target Area being correct is 24.3%. So the true probability of this Target Area being correct is 76.1% better than random.
* A Cycle degree trader (hold positions from quarters to years), would currently be trading long in this market. The probability of this Target Area being correct is 43.4%. However, the random probability of this Target Area being correct is 34.0%. So the true probability of this Target Area being correct is 27.6% better than random.
Extensive Elliott Commentary for ProShares UltraPro Short Dow 30 (SDOW) Daily on 12-Feb-2016 with two incomplete patterns:
Wave Y of the Primary degree inverted Double Zigzag with a rating of 104.5 is expected to complete in the price range 27.34 to 43, but more probably between 27.46 and 34.09. This wave could complete anytime between now and 31-Mar-2016, but is most likely to complete sometime between 12-Feb-2016 and 08-Mar-2016.
Wave Y will probably complete this Double Sharp pattern, although it could possibly extend into a Triple Sharp pattern.
This is the final wave in the pattern. When complete it will also complete wave b of the Cycle degree Flat with a rating of 88.4. These two waves have the same target ranges.
After wave b is complete, expect the market to continue down into wave c, which should be a five wave Impulsive pattern. Expect wave c to retrace wave b by 85% - 162%. Wave c can also be expected to be 90% - 162% of the price length of wave a. The expected time for wave c to complete is 20% - 136% of the time taken for wave b to complete and 20% - 110% of the time taken for wave a to complete.
Current Analysis Settings: Analysis Date Range: 23-Dec-2013 to 12-Feb-2016, Label Range: 15 - 50, Preferred Count Labels: 19, Min Rating: 75, Stocks toggle ON, Bias Towards Beginning of Data: 8, Bias Towards Major High/Low: 8, Largest Degree Wave Filter: Any Pattern
Rating:76.2
Current Trading Positions for ProShares UltraPro Short QQQ (SQQQ) Daily on 12-Feb-2016
* A Minor degree trader (hold positions from weeks to quarters), would currently be trading long in this market. The probability of this Target Area being correct is 50.2%. However, the random probability of this Target Area being correct is 34.0%. So the true probability of this Target Area being correct is 47.6% better than random.
* An Intermediate degree trader (hold positions from months to quarters), would currently be shorting this market. The probability of this Target Area being correct is 43.7%. However, the random probability of this Target Area being correct is 34.0%. So the true probability of this Target Area being correct is 28.5% better than random.
* A Primary degree trader (hold positions from months to years), would currently be trading long in this market. The probability of this Target Area being correct is 84.6%. However, the random probability of this Target Area being correct is 64.1%. So the true probability of this Target Area being correct is 32.0% better than random.
* A Cycle degree trader (hold positions from quarters to years), would currently be trading long in this market. The probability of this Target Area being correct is 39.8%. However, the random probability of this Target Area being correct is 34.0%. So the true probability of this Target Area being correct is 17.1% better than random.
Extensive Elliott Commentary for ProShares UltraPro Short QQQ (SQQQ) Daily on 12-Feb-2016 with four incomplete patterns:
Wave B of the Minor degree Flat with a rating of 102.4 is expected to complete in the price range 25.7 to 45.85, but more probably between 25.82 and 29.63. This wave is due to complete anytime from now until 21-Apr-2016, but is most likely to complete before 24-Feb-2016.
After wave B is complete, expect the market to continue down into wave C, which should be a five wave Impulsive pattern. Expect wave C to retrace wave B by 89% - 167%. Wave C can also be expected to be 104% - 167% of the price length of wave A. The expected time for wave C to complete is 20% - 146% of the time taken for wave B to complete and 53% - 275% of the time taken for wave A to complete.
Wave (B) of the Intermediate degree inverted Flat with a rating of 89.2 is expected to complete in the price range 5.25 to 20.89, but more probably between 16.54 and 20.69. This wave is due to complete anytime from now until 11-Jan-2017, but is most likely to complete before 17-Mar-2016.
After wave (B) is complete, expect the market to continue up into wave (C), which should be a five wave Impulsive pattern. Expect wave (C) to retrace wave (B) by 82% - 177%. Wave (C) can also be expected to be 89% - 177% of the price length of wave (A). The expected time for wave (C) to complete is 15% - 160% of the time taken for wave (B) to complete and 16% - 118% of the time taken for wave (A) to complete.
Wave Y of the Primary degree inverted Double 3 with a rating of 76.3 is expected to complete in the price range 20.19 to 140.68, but more probably between 40.09 and 72.69. This wave is due to complete anytime from now until 07-Apr-2016, but is most likely to complete before 26-Feb-2016.
Wave Y will probably complete this Double Sideways pattern, although it could possibly extend into a Triple Sideways pattern.
This is the final wave in the pattern. When complete it will also complete wave b of the Cycle degree Flat with a rating of 76.2. These two waves have the same target ranges.
After wave b is complete, expect the market to continue down into wave c, which should be a five wave Impulsive pattern. Expect wave c to retrace wave b by 85% - 162%. Wave c can also be expected to be 90% - 162% of the price length of wave a. The expected time for wave c to complete is 20% - 136% of the time taken for wave b to complete and 20% - 110% of the time taken for wave a to complete.
Current Analysis Settings: Analysis Date Range: 06-Dec-2013 to 12-Feb-2016, Label Range: 15 - 50, Preferred Count Labels: 23, Min Rating: 75, Stocks toggle ON, Bias Towards Beginning of Data: 8, Bias Towards Major High/Low: 8, Largest Degree Wave Filter: Any Pattern
Rating:92.1
Current Trading Positions for ProShares UltraPro Short Russell 2000 (SRTY) Daily on 12-Feb-2016
* A Primary degree trader (hold positions from months to years), would currently be trading long in this market. The probability of this Target Area being correct is 65.3%. However, the random probability of this Target Area being correct is 45.0%. So the true probability of this Target Area being correct is 45.1% better than random.
* A Cycle degree trader (hold positions from quarters to years), would currently be trading long in this market. The probability of this Target Area being correct is 45.2%. However, the random probability of this Target Area being correct is 34.0%. So the true probability of this Target Area being correct is 32.9% better than random.
Extensive Elliott Commentary for ProShares UltraPro Short Russell 2000 (SRTY) Daily on 12-Feb-2016 with two incomplete patterns:
Wave C of the Primary degree inverted Zigzag with a rating of 104.5 is expected to complete in the price range 46.21 to 89.26, but more probably between 47.46 and 68.05. This wave is due to complete anytime from now until 21-Apr-2016, but is most likely to complete before 03-Mar-2016.
This wave C will complete the ZigZag pattern.
This is the final wave in the pattern. When complete it will also complete wave b of the Cycle degree Flat with a rating of 92.1. These two waves have the same target ranges.
After wave b is complete, expect the market to continue down into wave c, which should be a five wave Impulsive pattern. Expect wave c to retrace wave b by 85% - 162%. Wave c can also be expected to be 90% - 162% of the price length of wave a. The expected time for wave c to complete is 20% - 136% of the time taken for wave b to complete and 20% - 110% of the time taken for wave a to complete.
Current Analysis Settings: Analysis Date Range: 23-Dec-2013 to 12-Feb-2016, Label Range: 15 - 50, Preferred Count Labels: 15, Min Rating: 75, Stocks toggle ON, Bias Towards Beginning of Data: 8, Bias Towards Major High/Low: 8, Largest Degree Wave Filter: Any Pattern
Rating:89.3
Current Trading Positions for ProShares UltraPro Short S&P500 (SPXU) Daily on 12-Feb-2016
* A Primary degree trader (hold positions from months to years), would currently be trading long in this market. The probability of this Target Area being correct is 41.0%. However, the random probability of this Target Area being correct is 24.3%. So the true probability of this Target Area being correct is 68.7% better than random.
* A Cycle degree trader (hold positions from quarters to years), would currently be trading long in this market. The probability of this Target Area being correct is 43.7%. However, the random probability of this Target Area being correct is 34.0%. So the true probability of this Target Area being correct is 28.5% better than random.
Extensive Elliott Commentary for ProShares UltraPro Short S&P500 (SPXU) Daily on 12-Feb-2016 with two incomplete patterns:
Wave Y of the Primary degree inverted Double Zigzag with a rating of 95.3 is expected to complete in the price range 49.92 to 98.09, but more probably between 51.01 and 67.76. This wave is most likely to complete sometime between 25-Feb-2016 and 29-Apr-2016 Note that it cannot complete until 23-Feb-2016 but must complete by 06-Jun-2016.
Wave Y will probably complete this Double Sharp pattern, although it could possibly extend into a Triple Sharp pattern.
This is the final wave in the pattern. When complete it will also complete wave b of the Cycle degree Flat with a rating of 89.3. These two waves have the same target ranges.
After wave b is complete, expect the market to continue down into wave c, which should be a five wave Impulsive pattern. Expect wave c to retrace wave b by 85% - 162%. Wave c can also be expected to be 90% - 162% of the price length of wave a. The expected time for wave c to complete is 20% - 136% of the time taken for wave b to complete and 20% - 110% of the time taken for wave a to complete.
Current Analysis Settings: Analysis Date Range: 23-Dec-2013 to 12-Feb-2016, Label Range: 15 - 50, Preferred Count Labels: 25, Min Rating: 75, Stocks toggle ON, Bias Towards Beginning of Data: 8, Bias Towards Major High/Low: 8, Largest Degree Wave Filter: Any Pattern
Rating:99.4
Current Trading Positions for ProShares UltraShort 20+ Year Treasury (TBT) Daily on 12-Feb-2016
* A Cycle degree trader (hold positions from quarters to years), would currently be shorting this market. The probability of this Target Area being correct is 49.4%. However, the random probability of this Target Area being correct is 34.0%. So the true probability of this Target Area being correct is 45.3% better than random.
Extensive Elliott Commentary for ProShares UltraShort 20+ Year Treasury (TBT) Daily on 12-Feb-2016 with one incomplete pattern:
Wave b of the Cycle degree inverted Flat with a rating of 99.4 is expected to complete in the price range 31.6 to 40.33, but more probably between 38.21 and 40.13. This wave is due to complete anytime from now until 31-Jul-2017, but is most likely to complete before 19-May-2016.
After wave b is complete, expect the market to continue up into wave c, which should be a five wave Impulsive pattern. Expect wave c to retrace wave b by 82% - 179%. Wave c can also be expected to be 67% - 179% of the price length of wave a. The expected time for wave c to complete is 20% - 151% of the time taken for wave b to complete and 11% - 58% of the time taken for wave a to complete.
Current Analysis Settings: Analysis Date Range: 06-Dec-2013 to 12-Feb-2016, Label Range: 15 - 50, Preferred Count Labels: 30, Min Rating: 75, Stocks toggle ON, Bias Towards Beginning of Data: 8, Bias Towards Major High/Low: 8, Largest Degree Wave Filter: Any Pattern
Rating:88.4
Current Trading Positions for ProShares UltraShort Dow 30 (DXD) Daily on 12-Feb-2016
* A Primary degree trader (hold positions from months to years), would currently be trading long in this market. The probability of this Target Area being correct is 86.5%. However, the random probability of this Target Area being correct is 64.1%. So the true probability of this Target Area being correct is 34.9% better than random.
* A Cycle degree trader (hold positions from quarters to years), would currently be trading long in this market. The probability of this Target Area being correct is 43.4%. However, the random probability of this Target Area being correct is 34.0%. So the true probability of this Target Area being correct is 27.6% better than random.
Extensive Elliott Commentary for ProShares UltraShort Dow 30 (DXD) Daily on 12-Feb-2016 with two incomplete patterns:
Wave Y of the Primary degree inverted Double 3 with a rating of 95.4 is expected to complete in the price range 22.77 to 50.79, but more probably between 27.89 and 37.46. This wave is most likely to complete sometime between 24-Feb-2016 and 22-Jul-2016 Note that it cannot complete until 16-Feb-2016 but must complete by 21-Dec-2016.
Wave Y will probably complete this Double Sideways pattern, although it could possibly extend into a Triple Sideways pattern.
This is the final wave in the pattern. When complete it will also complete wave b of the Cycle degree Flat with a rating of 88.4. These two waves have the same target ranges.
After wave b is complete, expect the market to continue down into wave c, which should be a five wave Impulsive pattern. Expect wave c to retrace wave b by 85% - 162%. Wave c can also be expected to be 90% - 162% of the price length of wave a. The expected time for wave c to complete is 20% - 136% of the time taken for wave b to complete and 20% - 110% of the time taken for wave a to complete.
Current Analysis Settings: Analysis Date Range: 23-Dec-2013 to 12-Feb-2016, Label Range: 15 - 50, Preferred Count Labels: 23, Min Rating: 75, Stocks toggle ON, Bias Towards Beginning of Data: 8, Bias Towards Major High/Low: 8, Largest Degree Wave Filter: Any Pattern
Rating:86.4
Current Trading Positions for ProShares UltraShort Euro (EUO) Daily on 12-Feb-2016
* An Intermediate degree trader (hold positions from months to quarters), would currently be shorting this market. The probability of this Target Area being correct is 41.8%. However, the random probability of this Target Area being correct is 24.3%. So the true probability of this Target Area being correct is 72.0% better than random.
* A Primary degree trader (hold positions from months to years), would currently be shorting this market. The probability of this Target Area being correct is 43.4%. However, the random probability of this Target Area being correct is 34.0%. So the true probability of this Target Area being correct is 27.6% better than random.
* A Cycle degree trader (hold positions from quarters to years), would currently be trading long in this market. The probability of this Target Area being correct is 42.8%. However, the random probability of this Target Area being correct is 34.0%. So the true probability of this Target Area being correct is 25.9% better than random.
Extensive Elliott Commentary for ProShares UltraShort Euro (EUO) Daily on 12-Feb-2016 with three incomplete patterns:
Wave (Y) of the Intermediate degree Double Zigzag with a rating of 99.1 is expected to complete in the price range 18.46 to 24.11, but more probably between 22.48 and 24.07. This wave was expected to complete before 01-Feb-2016, and must complete by 24-Feb-2016.
Wave (Y) will probably complete this Double Sharp pattern, although it could possibly extend into a Triple Sharp pattern.
This is the final wave in the pattern. When complete it will also complete wave B of the Primary degree inverted Flat with a rating of 88.5. These two waves have the same target ranges.
After wave B is complete, expect the market to continue up into wave C, which should be a five wave Impulsive pattern. Expect wave C to retrace wave B by 82% - 177%. Wave C can also be expected to be 89% - 177% of the price length of wave A. The expected time for wave C to complete is 15% - 160% of the time taken for wave B to complete and 16% - 118% of the time taken for wave A to complete.
Wave b of the Cycle degree Flat with a rating of 86.4 is expected to complete in the price range 26.08 to 37.04, but more probably between 26.19 and 29.06. This wave was expected to complete before 10-Feb-2016, and must complete by 05-Jan-2018.
After wave b is complete, expect the market to continue down into wave c, which should be a five wave Impulsive pattern. Expect wave c to retrace wave b by 86% - 162%. Wave c can also be expected to be 90% - 162% of the price length of wave a. The expected time for wave c to complete is 19% - 134% of the time taken for wave b to complete and 24% - 115% of the time taken for wave a to complete.
Current Analysis Settings: Analysis Date Range: 26-Mar-2014 to 12-Feb-2016, Label Range: 15 - 50, Preferred Count Labels: 15, Min Rating: 75, Stocks toggle ON, Bias Towards Beginning of Data: 8, Bias Towards Major High/Low: 8, Largest Degree Wave Filter: Any Pattern
Rating:95.2
Current Trading Positions for ProShares UltraShort MSCI Emerging Mkts (EEV) Daily on 12-Feb-2016
* A Cycle degree trader (hold positions from quarters to years), would currently be trading long in this market. The probability of this Target Area being correct is 41.0%. However, the random probability of this Target Area being correct is 24.3%. So the true probability of this Target Area being correct is 68.7% better than random.
Extensive Elliott Commentary for ProShares UltraShort MSCI Emerging Mkts (EEV) Daily on 12-Feb-2016 with one incomplete pattern:
Wave y of the Cycle degree inverted Double Zigzag with a rating of 95.2 is expected to complete in the price range 35.32 to 49.59, but more probably between 35.49 and 41.58. This wave is most likely to complete sometime between 29-Feb-2016 and 06-May-2016 Note that it cannot complete until 26-Feb-2016 but must complete by 13-Jun-2016.
Wave y will probably complete this Double Sharp pattern, although it could possibly extend into a Triple Sharp pattern.
Current Analysis Settings: Analysis Date Range: 17-Mar-2015 to 12-Feb-2016, Label Range: 15 - 50, Preferred Count Labels: 17, Min Rating: 75, Stocks toggle ON, Bias Towards Beginning of Data: 8, Bias Towards Major High/Low: 8, Largest Degree Wave Filter: Any Pattern
Rating:97.2
Current Trading Positions for ProShares UltraShort Oil & Gas (DUG) Daily on 12-Feb-2016
* A Primary degree trader (hold positions from months to years), would currently be trading long in this market. The probability of this Target Area being correct is 65.1%. However, the random probability of this Target Area being correct is 45.0%. So the true probability of this Target Area being correct is 44.7% better than random.
* A Cycle degree trader (hold positions from quarters to years), would currently be trading long in this market. The probability of this Target Area being correct is 86.7%. However, the random probability of this Target Area being correct is 64.1%. So the true probability of this Target Area being correct is 35.3% better than random.
Extensive Elliott Commentary for ProShares UltraShort Oil & Gas (DUG) Daily on 12-Feb-2016 with two incomplete patterns:
Wave C of the Primary degree inverted Zigzag with a rating of 103.3 is expected to complete in the price range 98.25 to 215.6, but more probably between 99.68 and 149.2. This wave is due to complete anytime from now until 23-May-2016, but is most likely to complete before 21-Mar-2016.
This wave C will complete the ZigZag pattern.
This is the final wave in the pattern. When complete it will also complete wave y of the Cycle degree inverted Double 3 with a rating of 97.2. These two waves have the same target ranges.
Wave y will probably complete this Double Sideways pattern, although it could possibly extend into a Triple Sideways pattern.
Current Analysis Settings: Analysis Date Range: 12-Jun-2014 to 12-Feb-2016, Label Range: 15 - 50, Preferred Count Labels: 19, Min Rating: 75, Stocks toggle ON, Bias Towards Beginning of Data: 8, Bias Towards Major High/Low: 8, Largest Degree Wave Filter: Any Pattern
Rating:81.4
Current Trading Positions for ProShares UltraShort QQQ (QID) Daily on 12-Feb-2016
* An Intermediate degree trader (hold positions from months to quarters), would currently be trading long in this market. The probability of this Target Area being correct is 52.0%. However, the random probability of this Target Area being correct is 13.0%. So the true probability of this Target Area being correct is 300.0% better than random.
* A Cycle degree trader (hold positions from quarters to years), would currently be trading long in this market. The probability of this Target Area being correct is 78.4%. However, the random probability of this Target Area being correct is 65.0%. So the true probability of this Target Area being correct is 20.6% better than random.
Extensive Elliott Commentary for ProShares UltraShort QQQ (QID) Daily on 12-Feb-2016 with three incomplete patterns:
Wave (3) of the Intermediate degree Impulse with a rating of 98.8 is expected to complete in the price range 40.09 to 81.96, but more probably between 41.97 and 53.04. This wave is due to complete anytime from now until 22-Apr-2016, but is most likely to complete before 03-Mar-2016.
When complete, expect the overall slope (ie. price range divided by time taken) of this wave (3) to be between 70% to 219% of the slope of wave (1). Then expect the market to pull back into wave (4), which will be corrective in nature and has a probability of 84% of being a Flat or other sideways pattern. Wave (4) should not retrace back into the price range of wave (1) or (2). Expect wave (4) to have between 5% - 141% of the price range of wave (2). The expected time for wave (4) to complete is between 14% - 136% of wave (2). After wave (4), expect wave (5) to move beyond the end of wave (3) to complete this Impulse.
Wave C of the Primary degree inverted Flat with a rating of 82.3 is expected to complete in the price range 30.69 to 54.16, but more probably between 36.68 and 46.1. This wave is due to complete anytime from now until 30-Jan-2017, but is most likely to complete before 03-Mar-2016.
This wave C will complete the Flat pattern.
This is the final wave in the pattern. When complete it will also complete wave x of the Cycle degree Double Zigzag with a rating of 81.4. These two waves have the same target ranges.
After wave x is complete, expect the market to continue down into wave y, which should be a three wave Zigzag pattern. Expect wave y to retrace wave x by 116% - 261%. Wave y can also be expected to be 90% - 261% of the price length of wave w. The expected time for wave y to complete is 21% - 160% of the time taken for wave x to complete and 25% - 152% of the time taken for wave w to complete.
Current Analysis Settings: Analysis Date Range: 06-Dec-2013 to 12-Feb-2016, Label Range: 15 - 50, Preferred Count Labels: 23, Min Rating: 75, Stocks toggle ON, Bias Towards Beginning of Data: 8, Bias Towards Major High/Low: 8, Largest Degree Wave Filter: Any Pattern
Rating:80.3
Current Trading Positions for ProShares UltraShort Russell2000 (TWM) Daily on 12-Feb-2016
* A Primary degree trader (hold positions from months to years), would currently be shorting this market. The probability of this Target Area being correct is 50.1%. However, the random probability of this Target Area being correct is 34.0%. So the true probability of this Target Area being correct is 47.4% better than random.
* A Cycle degree trader (hold positions from quarters to years), would currently be trading long in this market. The probability of this Target Area being correct is 85.0%. However, the random probability of this Target Area being correct is 64.1%. So the true probability of this Target Area being correct is 32.6% better than random.
Extensive Elliott Commentary for ProShares UltraShort Russell2000 (TWM) Daily on 12-Feb-2016 with two incomplete patterns:
Wave B of the Primary degree inverted Flat with a rating of 101.6 is expected to complete in the price range 11.44 to 42.26, but more probably between 33.68 and 41.87. This wave is most likely to complete sometime between 22-Feb-2016 and 15-Apr-2016 Note that it cannot complete until 12-Feb-2016 but must complete by 03-May-2017.
After wave B is complete, expect the market to continue up into wave C, which should be a five wave Impulsive pattern. Expect wave C to retrace wave B by 82% - 177%. Wave C can also be expected to be 89% - 177% of the price length of wave A. The expected time for wave C to complete is 15% - 160% of the time taken for wave B to complete and 16% - 118% of the time taken for wave A to complete.
Wave y of the Cycle degree inverted Double 3 with a rating of 80.3 is expected to complete in the price range 36.65 to 82.03, but more probably between 44.08 and 57.39. This wave was expected to complete before 04-Feb-2016, and must complete by 25-Apr-2016.
Wave y will probably complete this Double Sideways pattern, although it could possibly extend into a Triple Sideways pattern.
Current Analysis Settings: Analysis Date Range: 13-May-2015 to 12-Feb-2016, Label Range: 15 - 50, Preferred Count Labels: 46, Min Rating: 75, Stocks toggle ON, Bias Towards Beginning of Data: 8, Bias Towards Major High/Low: 8, Largest Degree Wave Filter: Any Pattern
Rating:81
Current Trading Positions for ProShares UltraShort S&P500 (SDS) Daily on 12-Feb-2016
* A Cycle degree trader (hold positions from quarters to years), would currently be trading long in this market. The probability of this Target Area being correct is 41.3%. However, the random probability of this Target Area being correct is 34.0%. So the true probability of this Target Area being correct is 21.5% better than random.
Extensive Elliott Commentary for ProShares UltraShort S&P500 (SDS) Daily on 12-Feb-2016 with two incomplete patterns:
Wave C of the Primary degree inverted Flat with a rating of 90.9 is expected to complete in the price range 22.95 to 32.44, but more probably between 25.83 and 30.54. This wave could complete anytime between now and 19-Jan-2017, but is most likely to complete sometime between 15-Feb-2016 and 26-May-2016.
This wave C will complete the Flat pattern.
This is the final wave in the pattern. When complete it will also complete wave b of the Cycle degree Flat with a rating of 81. These two waves have the same target ranges.
After wave b is complete, expect the market to continue down into wave c, which should be a five wave Impulsive pattern. Expect wave c to retrace wave b by 85% - 162%. Wave c can also be expected to be 90% - 162% of the price length of wave a. The expected time for wave c to complete is 20% - 136% of the time taken for wave b to complete and 20% - 110% of the time taken for wave a to complete.
Current Analysis Settings: Analysis Date Range: 23-Dec-2013 to 12-Feb-2016, Label Range: 15 - 50, Preferred Count Labels: 31, Min Rating: 75, Stocks toggle ON, Bias Towards Beginning of Data: 8, Bias Towards Major High/Low: 8, Largest Degree Wave Filter: Any Pattern
Rating:87.5
Current Trading Positions for ProShares VIX Short-Term Futures ETF (VIXY) Daily on 12-Feb-2016
* A Cycle degree trader (hold positions from quarters to years), would currently be trading long in this market. The probability of this Target Area being correct is 80.8%. However, the random probability of this Target Area being correct is 65.0%. So the true probability of this Target Area being correct is 24.3% better than random.
Extensive Elliott Commentary for ProShares VIX Short-Term Futures ETF (VIXY) Daily on 12-Feb-2016 with two incomplete patterns:
Wave C of the Primary degree inverted Flat with a rating of 97.3 is expected to complete in the price range 14.03 to 36.75, but more probably between 19.89 and 28.98. This wave was expected to complete before 02-Feb-2016, and must complete by 21-Dec-2016.
This wave C will complete the Flat pattern.
This is the final wave in the pattern. When complete it will also complete wave x of the Cycle degree Double Zigzag with a rating of 87.5. These two waves have the same target ranges.
After wave x is complete, expect the market to continue down into wave y, which should be a three wave Zigzag pattern. Expect wave y to retrace wave x by 116% - 261%. Wave y can also be expected to be 90% - 261% of the price length of wave w. The expected time for wave y to complete is 21% - 160% of the time taken for wave x to complete and 25% - 152% of the time taken for wave w to complete.
Current Analysis Settings: Analysis Date Range: 23-Dec-2013 to 12-Feb-2016, Label Range: 15 - 50, Preferred Count Labels: 17, Min Rating: 75, Stocks toggle ON, Bias Towards Beginning of Data: 8, Bias Towards Major High/Low: 8, Largest Degree Wave Filter: Any Pattern
Rating:80.7
Current Trading Positions for Prudential Glabal Short Duration High Yield Fund, Inc (GHY) Daily on 12-Feb-2016
* A Primary degree trader (hold positions from months to years), would currently be trading long in this market. The probability of this Target Area being correct is 86.8%. However, the random probability of this Target Area being correct is 64.1%. So the true probability of this Target Area being correct is 35.4% better than random.
* A Cycle degree trader (hold positions from quarters to years), would currently be trading long in this market. The probability of this Target Area being correct is 41.0%. However, the random probability of this Target Area being correct is 34.0%. So the true probability of this Target Area being correct is 20.6% better than random.
Extensive Elliott Commentary for Prudential Glabal Short Duration High Yield Fund, Inc (GHY) Daily on 12-Feb-2016 with two incomplete patterns:
Wave Y of the Primary degree inverted Double 3 with a rating of 99 is expected to complete in the price range 13.37 to 20.52, but more probably between 14.51 and 16.51. This wave is due to complete anytime from now until 11-Jul-2016, but is most likely to complete before 06-May-2016.
Wave Y will probably complete this Double Sideways pattern, although it could possibly extend into a Triple Sideways pattern.
This is the final wave in the pattern. When complete it will also complete wave b of the Cycle degree Flat with a rating of 80.7. These two waves have the same target ranges.
After wave b is complete, expect the market to continue down into wave c, which should be a five wave Impulsive pattern. Expect wave c to retrace wave b by 85% - 162%. Wave c can also be expected to be 90% - 162% of the price length of wave a. The expected time for wave c to complete is 20% - 136% of the time taken for wave b to complete and 20% - 110% of the time taken for wave a to complete.
Current Analysis Settings: Analysis Date Range: 06-May-2014 to 12-Feb-2016, Label Range: 15 - 50, Preferred Count Labels: 16, Min Rating: 75, Stocks toggle ON, Bias Towards Beginning of Data: 8, Bias Towards Major High/Low: 8, Largest Degree Wave Filter: Any Pattern
Rating:99
Current Trading Positions for Prudential Short Duration High Yield Fund (ISD) Daily on 12-Feb-2016
* A Primary degree trader (hold positions from months to years), would currently be shorting this market. The probability of this Target Area being correct is 49.4%. However, the random probability of this Target Area being correct is 34.0%. So the true probability of this Target Area being correct is 45.3% better than random.
Extensive Elliott Commentary for Prudential Short Duration High Yield Fund (ISD) Daily on 12-Feb-2016 with one incomplete pattern:
Wave B of the Primary degree inverted Flat with a rating of 99 is expected to complete in the price range 11.94 to 13.94, but more probably between 13.39 and 13.92. This wave could complete anytime between now and 22-Feb-2018, but is most likely to complete sometime between 19-Feb-2016 and 23-May-2016.
After wave B is complete, expect the market to continue up into wave C, which should be a five wave Impulsive pattern. Expect wave C to retrace wave B by 82% - 177%. Wave C can also be expected to be 89% - 177% of the price length of wave A. The expected time for wave C to complete is 15% - 160% of the time taken for wave B to complete and 16% - 118% of the time taken for wave A to complete.
Current Analysis Settings: Analysis Date Range: 07-Feb-2014 to 12-Feb-2016, Label Range: 15 - 50, Preferred Count Labels: 25, Min Rating: 75, Stocks toggle ON, Bias Towards Beginning of Data: 8, Bias Towards Major High/Low: 8, Largest Degree Wave Filter: Any Pattern
Rating:77.4
Current Trading Positions for Putnam Master Intermediate Income Trust (PIM) Daily on 12-Feb-2016
* A Minor degree trader (hold positions from weeks to quarters), would currently be shorting this market. The probability of this Target Area being correct is 61.8%. However, the random probability of this Target Area being correct is 45.0%. So the true probability of this Target Area being correct is 37.3% better than random.
* An Intermediate degree trader (hold positions from months to quarters), would currently be shorting this market. The probability of this Target Area being correct is 40.7%. However, the random probability of this Target Area being correct is 34.0%. So the true probability of this Target Area being correct is 19.7% better than random.
* A Primary degree trader (hold positions from months to years), would currently be trading long in this market. The probability of this Target Area being correct is 85.9%. However, the random probability of this Target Area being correct is 64.1%. So the true probability of this Target Area being correct is 34.0% better than random.
* A Cycle degree trader (hold positions from quarters to years), would currently be trading long in this market. The probability of this Target Area being correct is 40.1%. However, the random probability of this Target Area being correct is 34.0%. So the true probability of this Target Area being correct is 17.9% better than random.
Extensive Elliott Commentary for Putnam Master Intermediate Income Trust (PIM) Daily on 12-Feb-2016 with four incomplete patterns:
Wave C of the Minor degree Zigzag with a rating of 98.8 is expected to complete in the price range 3.17 to 4.15, but more probably between 3.76 and 4.11. This wave is due to complete anytime from now until 26-Feb-2016, but is most likely to complete before 15-Feb-2016.
This wave C will complete the ZigZag pattern.
This is the final wave in the pattern. When complete it will also complete wave (B) of the Intermediate degree inverted Flat with a rating of 79.5. These two waves have the same target ranges.
After wave (B) is complete, expect the market to continue up into wave (C), which should be a five wave Impulsive pattern. Expect wave (C) to retrace wave (B) by 80% - 169%. Wave (C) can also be expected to be 99% - 169% of the price length of wave (A). The expected time for wave (C) to complete is 19% - 187% of the time taken for wave (B) to complete and 56% - 268% of the time taken for wave (A) to complete.
Wave Y of the Primary degree inverted Double 3 with a rating of 89 is expected to complete in the price range 4.38 to 5.72, but more probably between 4.58 and 5.02. This wave is due to complete anytime from now until 21-Mar-2016, but is most likely to complete before 29-Feb-2016.
Wave Y will probably complete this Double Sideways pattern, although it could possibly extend into a Triple Sideways pattern.
This is the final wave in the pattern. When complete it will also complete wave b of the Cycle degree Flat with a rating of 77.4. These two waves have the same target ranges.
After wave b is complete, expect the market to continue down into wave c, which should be a five wave Impulsive pattern. Expect wave c to retrace wave b by 85% - 162%. Wave c can also be expected to be 90% - 162% of the price length of wave a. The expected time for wave c to complete is 20% - 136% of the time taken for wave b to complete and 20% - 110% of the time taken for wave a to complete.
Current Analysis Settings: Analysis Date Range: 12-May-2014 to 12-Feb-2016, Label Range: 15 - 50, Preferred Count Labels: 19, Min Rating: 75, Stocks toggle ON, Bias Towards Beginning of Data: 8, Bias Towards Major High/Low: 8, Largest Degree Wave Filter: Any Pattern
Rating:101.3
Current Trading Positions for Putnam Premier Income Trust (PPT) Daily on 12-Feb-2016
* An Intermediate degree trader (hold positions from months to quarters), would currently be shorting this market. The probability of this Target Area being correct is 50.1%. However, the random probability of this Target Area being correct is 34.0%. So the true probability of this Target Area being correct is 47.4% better than random.
Extensive Elliott Commentary for Putnam Premier Income Trust (PPT) Daily on 12-Feb-2016 with one incomplete pattern:
Wave (B) of the Intermediate degree inverted Flat with a rating of 101.3 is expected to complete in the price range 3.4 to 4.58, but more probably between 4.39 and 4.57. This wave is due to complete anytime from now until 08-Apr-2016, but is most likely to complete before 15-Feb-2016.
After wave (B) is complete, expect the market to continue up into wave (C), which should be a five wave Impulsive pattern. Expect wave (C) to retrace wave (B) by 80% - 169%. Wave (C) can also be expected to be 99% - 169% of the price length of wave (A). The expected time for wave (C) to complete is 19% - 187% of the time taken for wave (B) to complete and 56% - 268% of the time taken for wave (A) to complete.
Current Analysis Settings: Analysis Date Range: 14-May-2014 to 12-Feb-2016, Label Range: 15 - 50, Preferred Count Labels: 50, Min Rating: 75, Stocks toggle ON, Bias Towards Beginning of Data: 8, Bias Towards Major High/Low: 8, Largest Degree Wave Filter: Any Pattern
Rating:83
Current Trading Positions for QuantShares U.S. Market Neutral Anti-Beta Fund (BTAL) Daily on 12-Feb-2016
* A Minor degree trader (hold positions from weeks to quarters), would currently be shorting this market. The probability of this Target Area being correct is 67.7%. However, the random probability of this Target Area being correct is 53.0%. So the true probability of this Target Area being correct is 27.7% better than random.
* An Intermediate degree trader (hold positions from months to quarters), would currently be trading long in this market. The probability of this Target Area being correct is 41.6%. However, the random probability of this Target Area being correct is 34.0%. So the true probability of this Target Area being correct is 22.4% better than random.
Extensive Elliott Commentary for QuantShares U.S. Market Neutral Anti-Beta Fund (BTAL) Daily on 12-Feb-2016 with two incomplete patterns:
Wave X of the Minor degree inverted Double 3 with a rating of 103.2 is expected to complete in the price range 19.85 to 24.61, but more probably between 23.15 and 23.74. This wave was expected to complete before 12-Feb-2016, and must complete by 19-Feb-2016.
After wave X is complete, expect the market to continue up into wave Y, which will probably be a three wave corrective pattern. Expect wave Y to retrace wave X by 98% - 204%. Wave Y can also be expected to be 73% - 204% of the price length of wave W. The expected time for wave Y to complete is 27% - 204% of the time taken for wave X to complete and 97% - 304% of the time taken for wave W to complete.
Wave (B) of the Intermediate degree Flat with a rating of 83 is expected to complete in the price range 24.01 to 28.08, but more probably between 24.04 and 24.78. This wave is due to complete anytime from now until 29-Mar-2016, but is most likely to complete before 23-Feb-2016.
After wave (B) is complete, expect the market to continue down into wave (C), which should be a five wave Impulsive pattern. Expect wave (C) to retrace wave (B) by 89% - 167%. Wave (C) can also be expected to be 105% - 167% of the price length of wave (A). The expected time for wave (C) to complete is 20% - 148% of the time taken for wave (B) to complete and 60% - 290% of the time taken for wave (A) to complete.
Current Analysis Settings: Analysis Date Range: 14-Jul-2015 to 12-Feb-2016, Label Range: 15 - 50, Preferred Count Labels: 26, Min Rating: 75, Stocks toggle ON, Bias Towards Beginning of Data: 8, Bias Towards Major High/Low: 8, Largest Degree Wave Filter: Any Pattern
Rating:100.2
Current Trading Positions for Schwab Emerging Markets Equity ETF (SCHE) Daily on 12-Feb-2016
* A Cycle degree trader (hold positions from quarters to years), would currently be trading long in this market. The probability of this Target Area being correct is 50.0%. However, the random probability of this Target Area being correct is 34.0%. So the true probability of this Target Area being correct is 47.1% better than random.
Extensive Elliott Commentary for Schwab Emerging Markets Equity ETF (SCHE) Daily on 12-Feb-2016 with one incomplete pattern:
Wave b of the Cycle degree Flat with a rating of 100.2 is expected to complete in the price range 24.47 to 46.34, but more probably between 24.7 and 30.47. This wave could complete anytime between now and 13-May-2024, but is most likely to complete sometime between 04-Mar-2016 and 13-Mar-2017.
After wave b is complete, expect the market to continue down into wave c, which should be a five wave Impulsive pattern. Expect wave c to retrace wave b by 85% - 162%. Wave c can also be expected to be 90% - 162% of the price length of wave a. The expected time for wave c to complete is 20% - 136% of the time taken for wave b to complete and 20% - 110% of the time taken for wave a to complete.
Current Analysis Settings: Analysis Date Range: 23-Jul-2014 to 12-Feb-2016, Label Range: 15 - 50, Preferred Count Labels: 16, Min Rating: 75, Stocks toggle ON, Bias Towards Beginning of Data: 8, Bias Towards Major High/Low: 8, Largest Degree Wave Filter: Any Pattern
Rating:76.4
Current Trading Positions for Schwab Fundamental Emerg Mkts Lg Co ETF (FNDE) Daily on 12-Feb-2016
* An Intermediate degree trader (hold positions from months to quarters), would currently be shorting this market. The probability of this Target Area being correct is 67.4%. However, the random probability of this Target Area being correct is 45.0%. So the true probability of this Target Area being correct is 49.8% better than random.
Extensive Elliott Commentary for Schwab Fundamental Emerg Mkts Lg Co ETF (FNDE) Daily on 12-Feb-2016 with three incomplete patterns:
Wave C of the Minor degree Flat with a rating of 96.3 is expected to complete in the price range 14.82 to 17.39, but more probably between 15.9 and 16.77. This wave was expected to complete before 11-Feb-2016, and must complete by 15-Feb-2016.
This wave C will complete the Flat pattern.
This is the final wave in the pattern. When complete it will also complete wave (2) of the Intermediate degree Impulse with a rating of 77.5. These two waves have the same target ranges.
After this wave (2) is complete, expect the market to continue up into wave (3). Wave (3) should always be an Impulse and should retrace wave (2) completely. Expect wave (3) to retrace wave (2) by 164% - 383%. Wave (3) can also be expected to be 83% - 383% of the price length of wave (1). The expected time for wave (3) to complete is 87% - 367% of the time taken for wave (2) to complete and 16% - 97% of the time taken for wave (1) to complete. The slope (ie. price range divided by time taken) of wave (3) should be between 70% and 219% of the slope of wave (1). Once wave (3) is complete, expect wave (4) to be a sideways corrective movement, then wave (5) to continue in the same direction as wave (3). Wave (5) will complete this Impulse.
Wave C of the Primary degree inverted Flat with a rating of 76.4 is expected to complete in the price range 17.92 to 26.08, but more probably between 19.56 and 23.99. This wave is due to complete anytime from now until 08-Mar-2017, but is most likely to complete before 05-Apr-2016.
This wave C will complete the Flat pattern.
Current Analysis Settings: Analysis Date Range: 25-Jul-2014 to 12-Feb-2016, Label Range: 15 - 50, Preferred Count Labels: 37, Min Rating: 75, Stocks toggle ON, Bias Towards Beginning of Data: 8, Bias Towards Major High/Low: 8, Largest Degree Wave Filter: Any Pattern
Rating:81.5
Current Trading Positions for Schwab Fundamental Intl Lg Co ETF (FNDF) Daily on 12-Feb-2016
* An Intermediate degree trader (hold positions from months to quarters), would currently be shorting this market. The probability of this Target Area being correct is 50.1%. However, the random probability of this Target Area being correct is 34.0%. So the true probability of this Target Area being correct is 47.4% better than random.
* A Primary degree trader (hold positions from months to years), would currently be trading long in this market. The probability of this Target Area being correct is 53.0%. However, the random probability of this Target Area being correct is 45.0%. So the true probability of this Target Area being correct is 17.8% better than random.
* A Cycle degree trader (hold positions from quarters to years), would currently be shorting this market. The probability of this Target Area being correct is 35.5%. However, the random probability of this Target Area being correct is 24.3%. So the true probability of this Target Area being correct is 46.1% better than random.
Extensive Elliott Commentary for Schwab Fundamental Intl Lg Co ETF (FNDF) Daily on 12-Feb-2016 with three incomplete patterns:
Wave (B) of the Intermediate degree inverted Flat with a rating of 101.8 is expected to complete in the price range 14.21 to 21.34, but more probably between 20.23 and 21.3. This wave is due to complete anytime from now until 19-Apr-2016, but is most likely to complete before 18-Feb-2016.
After wave (B) is complete, expect the market to continue up into wave (C), which should be a five wave Impulsive pattern. Expect wave (C) to retrace wave (B) by 80% - 169%. Wave (C) can also be expected to be 99% - 169% of the price length of wave (A). The expected time for wave (C) to complete is 19% - 187% of the time taken for wave (B) to complete and 56% - 268% of the time taken for wave (A) to complete.
Wave B of the Primary degree Zigzag with a rating of 90.8 is expected to complete in the price range 20.88 to 26.27, but more probably between 21.41 and 23.44. This wave is due to complete anytime from now until 26-Apr-2017, but is most likely to complete before 14-Mar-2016.
After wave B is complete, expect the market to continue down into wave C, which should be a five wave impulsive pattern. Expect wave C to retrace wave B by 96% - 215%. Wave C can also be expected to be 33% - 215% of the price length of wave A. The expected time for wave C to complete is 22% - 199% of the time taken for wave B to complete and 24% - 111% of the time taken for wave A to complete.
Wave y of the Cycle degree Double Zigzag with a rating of 81.5 is expected to complete in the price range 18.59 to 21.25, but more probably between 20.01 and 21.17. This wave is due to complete anytime from now until 21-Aug-2017, but is most likely to complete before 15-Aug-2016.
Wave y will probably complete this Double Sharp pattern, although it could possibly extend into a Triple Sharp pattern.
Current Analysis Settings: Analysis Date Range: 22-May-2014 to 12-Feb-2016, Label Range: 15 - 50, Preferred Count Labels: 19, Min Rating: 75, Stocks toggle ON, Bias Towards Beginning of Data: 8, Bias Towards Major High/Low: 8, Largest Degree Wave Filter: Any Pattern
Rating:89.4
Current Trading Positions for Schwab Fundamental US Large Company ETF (FNDX) Daily on 12-Feb-2016
* An Intermediate degree trader (hold positions from months to quarters), would currently be shorting this market. The probability of this Target Area being correct is 88.3%. However, the random probability of this Target Area being correct is 65.0%. So the true probability of this Target Area being correct is 35.8% better than random.
* A Primary degree trader (hold positions from months to years), would currently be trading long in this market. The probability of this Target Area being correct is 43.7%. However, the random probability of this Target Area being correct is 34.0%. So the true probability of this Target Area being correct is 28.5% better than random.
Extensive Elliott Commentary for Schwab Fundamental US Large Company ETF (FNDX) Daily on 12-Feb-2016 with two incomplete patterns:
Wave (X) of the Intermediate degree inverted Double Zigzag with a rating of 101.8 is expected to complete in the price range 25.44 to 27.11, but more probably between 25.99 and 26.8. This wave is due to complete anytime from now until 14-Mar-2016, but is most likely to complete before 16-Feb-2016.
After wave (X) is complete, expect the market to continue up into wave (Y), which should be a three wave Zigzag pattern. Expect wave (Y) to retrace wave (X) by 128% - 319%. Wave (Y) can also be expected to be 90% - 319% of the price length of wave (W). The expected time for wave (Y) to complete is 23% - 167% of the time taken for wave (X) to complete and 47% - 204% of the time taken for wave (W) to complete.
Wave B of the Primary degree Flat with a rating of 89.4 is expected to complete in the price range 28.54 to 37.43, but more probably between 28.63 and 30.95. This wave is due to complete anytime from now until 25-Apr-2017, but is most likely to complete before 31-Mar-2016.
After wave B is complete, expect the market to continue down into wave C, which should be a five wave Impulsive pattern. Expect wave C to retrace wave B by 86% - 162%. Wave C can also be expected to be 90% - 162% of the price length of wave A. The expected time for wave C to complete is 19% - 134% of the time taken for wave B to complete and 24% - 115% of the time taken for wave A to complete.
Current Analysis Settings: Analysis Date Range: 10-Apr-2015 to 12-Feb-2016, Label Range: 15 - 50, Preferred Count Labels: 15, Min Rating: 75, Stocks toggle ON, Bias Towards Beginning of Data: 8, Bias Towards Major High/Low: 8, Largest Degree Wave Filter: Any Pattern
Rating:81.4
Current Trading Positions for Schwab Fundamental US Small Company ETF (FNDA) Daily on 12-Feb-2016
* An Intermediate degree trader (hold positions from months to quarters), would currently be shorting this market. The probability of this Target Area being correct is 80.8%. However, the random probability of this Target Area being correct is 65.0%. So the true probability of this Target Area being correct is 24.3% better than random.
* A Primary degree trader (hold positions from months to years), would currently be trading long in this market. The probability of this Target Area being correct is 41.3%. However, the random probability of this Target Area being correct is 34.0%. So the true probability of this Target Area being correct is 21.5% better than random.
Extensive Elliott Commentary for Schwab Fundamental US Small Company ETF (FNDA) Daily on 12-Feb-2016 with three incomplete patterns:
Wave C of the Minor degree Flat with a rating of 98 is expected to complete in the price range 23.32 to 25.52, but more probably between 23.98 and 24.92. This wave was expected to complete before 09-Feb-2016, and must complete by 15-Feb-2016.
This wave C will complete the Flat pattern.
This is the final wave in the pattern. When complete it will also complete wave (X) of the Intermediate degree inverted Double Zigzag with a rating of 87.2. These two waves have the same target ranges.
After wave (X) is complete, expect the market to continue up into wave (Y), which should be a three wave Zigzag pattern. Expect wave (Y) to retrace wave (X) by 128% - 319%. Wave (Y) can also be expected to be 90% - 319% of the price length of wave (W). The expected time for wave (Y) to complete is 23% - 167% of the time taken for wave (X) to complete and 47% - 204% of the time taken for wave (W) to complete.
Wave B of the Primary degree Flat with a rating of 81.4 is expected to complete in the price range 27.86 to 39.24, but more probably between 27.97 and 30.95. This wave is due to complete anytime from now until 09-Nov-2016, but is most likely to complete before 07-Mar-2016.
After wave B is complete, expect the market to continue down into wave C, which should be a five wave Impulsive pattern. Expect wave C to retrace wave B by 86% - 162%. Wave C can also be expected to be 90% - 162% of the price length of wave A. The expected time for wave C to complete is 19% - 134% of the time taken for wave B to complete and 24% - 115% of the time taken for wave A to complete.
Current Analysis Settings: Analysis Date Range: 12-May-2015 to 12-Feb-2016, Label Range: 15 - 50, Preferred Count Labels: 15, Min Rating: 75, Stocks toggle ON, Bias Towards Beginning of Data: 8, Bias Towards Major High/Low: 8, Largest Degree Wave Filter: Any Pattern
Rating:99.7
Current Trading Positions for Schwab Intermediate-Term U.S. Treasury ETF (SCHR) Daily on 12-Feb-2016
* A Primary degree trader (hold positions from months to years), would currently be trading long in this market. The probability of this Target Area being correct is 49.4%. However, the random probability of this Target Area being correct is 34.0%. So the true probability of this Target Area being correct is 45.3% better than random.
* A Cycle degree trader (hold positions from quarters to years), would currently be shorting this market. The probability of this Target Area being correct is 49.4%. However, the random probability of this Target Area being correct is 34.0%. So the true probability of this Target Area being correct is 45.3% better than random.
Extensive Elliott Commentary for Schwab Intermediate-Term U.S. Treasury ETF (SCHR) Daily on 12-Feb-2016 with two incomplete patterns:
Wave B of the Primary degree Flat with a rating of 99.7 is expected to complete in the price range 54.34 to 59.86, but more probably between 54.37 and 55.41. This wave is due to complete anytime from now until 09-Sep-2016, but is most likely to complete before 24-Feb-2016.
After wave B is complete, expect the market to continue down into wave C, which should be a five wave Impulsive pattern. Expect wave C to retrace wave B by 89% - 167%. Wave C can also be expected to be 104% - 167% of the price length of wave A. The expected time for wave C to complete is 20% - 146% of the time taken for wave B to complete and 53% - 275% of the time taken for wave A to complete.
Wave b of the Cycle degree inverted Flat with a rating of 99.7 is expected to complete in the price range 49.7 to 53.11, but more probably between 52.28 and 53.03. This wave is due to complete anytime from now until 29-May-2018, but is most likely to complete before 08-Jun-2016.
After wave b is complete, expect the market to continue up into wave c, which should be a five wave Impulsive pattern. Expect wave c to retrace wave b by 82% - 179%. Wave c can also be expected to be 67% - 179% of the price length of wave a. The expected time for wave c to complete is 20% - 151% of the time taken for wave b to complete and 11% - 58% of the time taken for wave a to complete.
Current Analysis Settings: Analysis Date Range: 06-Dec-2013 to 12-Feb-2016, Label Range: 15 - 50, Preferred Count Labels: 20, Min Rating: 75, Stocks toggle ON, Bias Towards Beginning of Data: 8, Bias Towards Major High/Low: 8, Largest Degree Wave Filter: Any Pattern
Rating:102.5
Current Trading Positions for Schwab International Small-Cap Equity ETF (SCHC) Daily on 12-Feb-2016
* An Intermediate degree trader (hold positions from months to quarters), would currently be shorting this market. The probability of this Target Area being correct is 50.2%. However, the random probability of this Target Area being correct is 34.0%. So the true probability of this Target Area being correct is 47.6% better than random.
Extensive Elliott Commentary for Schwab International Small-Cap Equity ETF (SCHC) Daily on 12-Feb-2016 with one incomplete pattern:
Wave (B) of the Intermediate degree inverted Flat with a rating of 102.5 is expected to complete in the price range 17.66 to 25.58, but more probably between 24.35 and 25.54. This wave is due to complete anytime from now until 19-Apr-2016, but is most likely to complete before 18-Feb-2016.
After wave (B) is complete, expect the market to continue up into wave (C), which should be a five wave Impulsive pattern. Expect wave (C) to retrace wave (B) by 80% - 169%. Wave (C) can also be expected to be 99% - 169% of the price length of wave (A). The expected time for wave (C) to complete is 19% - 187% of the time taken for wave (B) to complete and 56% - 268% of the time taken for wave (A) to complete.
Current Analysis Settings: Analysis Date Range: 22-May-2014 to 12-Feb-2016, Label Range: 15 - 50, Preferred Count Labels: 15, Min Rating: 75, Stocks toggle ON, Bias Towards Beginning of Data: 8, Bias Towards Major High/Low: 8, Largest Degree Wave Filter: Any Pattern
Rating:88.5
Current Trading Positions for Schwab Short-Term U.S. Treasury ETF (SCHO) Daily on 12-Feb-2016
* An Intermediate degree trader (hold positions from months to quarters), would currently be shorting this market. The probability of this Target Area being correct is 87.6%. However, the random probability of this Target Area being correct is 64.1%. So the true probability of this Target Area being correct is 36.7% better than random.
* A Primary degree trader (hold positions from months to years), would currently be shorting this market. The probability of this Target Area being correct is 81.2%. However, the random probability of this Target Area being correct is 65.0%. So the true probability of this Target Area being correct is 24.9% better than random.
Extensive Elliott Commentary for Schwab Short-Term U.S. Treasury ETF (SCHO) Daily on 12-Feb-2016 with two incomplete patterns:
Wave (Y) of the Intermediate degree Double 3 with a rating of 106.2 is expected to complete in the price range 50.37 to 50.84, but more probably between 50.63 and 50.76. This wave is due to complete anytime from now until 15-Feb-2016, but is most likely to complete before 12-Feb-2016.
Wave (Y) will probably complete this Double Sideways pattern, although it could possibly extend into a Triple Sideways pattern.
This is the final wave in the pattern. When complete it will also complete wave X of the Primary degree inverted Double Zigzag with a rating of 88.5. These two waves have the same target ranges.
After wave X is complete, expect the market to continue up into wave Y, which should be a three wave Zigzag pattern. Expect wave Y to retrace wave X by 128% - 319%. Wave Y can also be expected to be 90% - 319% of the price length of wave W. The expected time for wave Y to complete is 23% - 167% of the time taken for wave X to complete and 47% - 204% of the time taken for wave W to complete.
Current Analysis Settings: Analysis Date Range: 14-Jul-2015 to 12-Feb-2016, Label Range: 15 - 50, Preferred Count Labels: 38, Min Rating: 75, Stocks toggle ON, Bias Towards Beginning of Data: 8, Bias Towards Major High/Low: 8, Largest Degree Wave Filter: Any Pattern
Rating:86.4
Current Trading Positions for Schwab U.S. Mid Cap ETF (SCHM) Daily on 12-Feb-2016
* An Intermediate degree trader (hold positions from months to quarters), would currently be shorting this market. The probability of this Target Area being correct is 88.6%. However, the random probability of this Target Area being correct is 65.0%. So the true probability of this Target Area being correct is 36.3% better than random.
* A Primary degree trader (hold positions from months to years), would currently be trading long in this market. The probability of this Target Area being correct is 42.8%. However, the random probability of this Target Area being correct is 34.0%. So the true probability of this Target Area being correct is 25.9% better than random.
Extensive Elliott Commentary for Schwab U.S. Mid Cap ETF (SCHM) Daily on 12-Feb-2016 with two incomplete patterns:
Wave (X) of the Intermediate degree inverted Double Zigzag with a rating of 102.3 is expected to complete in the price range 34.6 to 36.94, but more probably between 35.37 and 36.51. This wave is due to complete anytime from now until 14-Mar-2016, but is most likely to complete before 16-Feb-2016.
After wave (X) is complete, expect the market to continue up into wave (Y), which should be a three wave Zigzag pattern. Expect wave (Y) to retrace wave (X) by 128% - 319%. Wave (Y) can also be expected to be 90% - 319% of the price length of wave (W). The expected time for wave (Y) to complete is 23% - 167% of the time taken for wave (X) to complete and 47% - 204% of the time taken for wave (W) to complete.
Wave B of the Primary degree Flat with a rating of 86.4 is expected to complete in the price range 39.65 to 54.16, but more probably between 39.8 and 43.6. This wave is due to complete anytime from now until 25-Apr-2017, but is most likely to complete before 31-Mar-2016.
After wave B is complete, expect the market to continue down into wave C, which should be a five wave Impulsive pattern. Expect wave C to retrace wave B by 86% - 162%. Wave C can also be expected to be 90% - 162% of the price length of wave A. The expected time for wave C to complete is 19% - 134% of the time taken for wave B to complete and 24% - 115% of the time taken for wave A to complete.
Current Analysis Settings: Analysis Date Range: 07-May-2015 to 12-Feb-2016, Label Range: 15 - 50, Preferred Count Labels: 15, Min Rating: 75, Stocks toggle ON, Bias Towards Beginning of Data: 8, Bias Towards Major High/Low: 8, Largest Degree Wave Filter: Any Pattern
Rating:85.8
Current Trading Positions for Schwab U.S. REIT ETF (SCHH) Daily on 12-Feb-2016
* A Minor degree trader (hold positions from weeks to quarters), would currently be shorting this market. The probability of this Target Area being correct is 48.2%. However, the random probability of this Target Area being correct is 34.0%. So the true probability of this Target Area being correct is 41.8% better than random.
* An Intermediate degree trader (hold positions from months to quarters), would currently be trading long in this market. The probability of this Target Area being correct is 59.6%. However, the random probability of this Target Area being correct is 53.0%. So the true probability of this Target Area being correct is 12.5% better than random.
* A Primary degree trader (hold positions from months to years), would currently be shorting this market. The probability of this Target Area being correct is 42.5%. However, the random probability of this Target Area being correct is 34.0%. So the true probability of this Target Area being correct is 25.0% better than random.
Extensive Elliott Commentary for Schwab U.S. REIT ETF (SCHH) Daily on 12-Feb-2016 with three incomplete patterns:
Wave B of the Minor degree inverted Flat with a rating of 97.5 is expected to complete in the price range 27.41 to 36.82, but more probably between 35.31 and 36.75. This wave was expected to complete before 05-Feb-2016, and must complete by 08-Mar-2016.
After wave B is complete, expect the market to continue up into wave C, which should be a five wave Impulsive pattern. Expect wave C to retrace wave B by 83% - 173%. Wave C can also be expected to be 101% - 173% of the price length of wave A. The expected time for wave C to complete is 20% - 190% of the time taken for wave B to complete and 57% - 279% of the time taken for wave A to complete.
Wave (X) of the Intermediate degree Double 3 with a rating of 94.3 is expected to complete in the price range 36.76 to 59.22, but more probably between 38.96 and 40.86. This wave is due to complete anytime from now until 25-May-2016, but is most likely to complete before 12-Feb-2016.
After wave (X) is complete, expect the market to continue down into wave (Y), which will probably be a three wave corrective pattern. Expect wave (Y) to retrace wave (X) by 98% - 190%. Wave (Y) can also be expected to be 73% - 190% of the price length of wave (W). The expected time for wave (Y) to complete is 25% - 187% of the time taken for wave (X) to complete and 28% - 204% of the time taken for wave (W) to complete.
Wave B of the Primary degree inverted Flat with a rating of 85.8 is expected to complete in the price range 17.21 to 33.37, but more probably between 28.87 and 33.17. This wave is due to complete anytime from now until 18-Sep-2017, but is most likely to complete before 11-Apr-2016.
After wave B is complete, expect the market to continue up into wave C, which should be a five wave Impulsive pattern. Expect wave C to retrace wave B by 82% - 177%. Wave C can also be expected to be 89% - 177% of the price length of wave A. The expected time for wave C to complete is 15% - 160% of the time taken for wave B to complete and 16% - 118% of the time taken for wave A to complete.
Current Analysis Settings: Analysis Date Range: 06-Dec-2013 to 12-Feb-2016, Label Range: 15 - 50, Preferred Count Labels: 17, Min Rating: 75, Stocks toggle ON, Bias Towards Beginning of Data: 8, Bias Towards Major High/Low: 8, Largest Degree Wave Filter: Any Pattern
Rating:77.2
Current Trading Positions for Schwab U.S. TIPs ETF (SCHP) Daily on 12-Feb-2016
* An Intermediate degree trader (hold positions from months to quarters), would currently be shorting this market. The probability of this Target Area being correct is 41.3%. However, the random probability of this Target Area being correct is 34.0%. So the true probability of this Target Area being correct is 21.5% better than random.
* A Primary degree trader (hold positions from months to years), would currently be trading long in this market. The probability of this Target Area being correct is 40.1%. However, the random probability of this Target Area being correct is 34.0%. So the true probability of this Target Area being correct is 17.9% better than random.
* A Cycle degree trader (hold positions from quarters to years), would currently be shorting this market. The probability of this Target Area being correct is 40.1%. However, the random probability of this Target Area being correct is 34.0%. So the true probability of this Target Area being correct is 17.9% better than random.
Extensive Elliott Commentary for Schwab U.S. TIPs ETF (SCHP) Daily on 12-Feb-2016 with four incomplete patterns:
Wave C of the Minor degree Flat with a rating of 102.7 is expected to complete in the price range 50.39 to 53.86, but more probably between 51.93 and 53.06. This wave could complete anytime between now and 15-Aug-2016, but is most likely to complete sometime between 12-Feb-2016 and 21-Mar-2016.
This wave C will complete the Flat pattern.
This is the final wave in the pattern. When complete it will also complete wave (B) of the Intermediate degree inverted Flat with a rating of 81.9. These two waves have the same target ranges.
After wave (B) is complete, expect the market to continue up into wave (C), which should be a five wave Impulsive pattern. Expect wave (C) to retrace wave (B) by 82% - 177%. Wave (C) can also be expected to be 89% - 177% of the price length of wave (A). The expected time for wave (C) to complete is 15% - 160% of the time taken for wave (B) to complete and 16% - 118% of the time taken for wave (A) to complete.
Wave B of the Primary degree Flat with a rating of 77.6 is expected to complete in the price range 54.32 to 57.46, but more probably between 54.35 and 55.17. This wave was expected to complete before 05-Feb-2016, and must complete by 05-Sep-2017.
After wave B is complete, expect the market to continue down into wave C, which should be a five wave Impulsive pattern. Expect wave C to retrace wave B by 86% - 162%. Wave C can also be expected to be 90% - 162% of the price length of wave A. The expected time for wave C to complete is 19% - 134% of the time taken for wave B to complete and 24% - 115% of the time taken for wave A to complete.
Wave b of the Cycle degree inverted Flat with a rating of 77.2 is expected to complete in the price range 50.64 to 53.42, but more probably between 52.75 and 53.36. This wave is due to complete anytime from now until 28-Dec-2017, but is most likely to complete before 26-Feb-2016.
After wave b is complete, expect the market to continue up into wave c, which should be a five wave Impulsive pattern. Expect wave c to retrace wave b by 82% - 179%. Wave c can also be expected to be 67% - 179% of the price length of wave a. The expected time for wave c to complete is 20% - 151% of the time taken for wave b to complete and 11% - 58% of the time taken for wave a to complete.
Current Analysis Settings: Analysis Date Range: 06-Dec-2013 to 12-Feb-2016, Label Range: 15 - 50, Preferred Count Labels: 43, Min Rating: 75, Stocks toggle ON, Bias Towards Beginning of Data: 8, Bias Towards Major High/Low: 8, Largest Degree Wave Filter: Any Pattern
Rating:99
Current Trading Positions for Schwab US Aggregate Bond ETF (SCHZ) Daily on 12-Feb-2016
* A Supercycle degree trader (buy and hold for years), would currently be trading long in this market. The probability of this Target Area being correct is 41.8%. However, the random probability of this Target Area being correct is 24.3%. So the true probability of this Target Area being correct is 72.0% better than random.
Extensive Elliott Commentary for Schwab US Aggregate Bond ETF (SCHZ) Daily on 12-Feb-2016 with one incomplete pattern:
Wave (y) of the Supercycle degree inverted Double Zigzag with a rating of 99 is expected to complete in the price range 53.61 to 59.52, but more probably between 53.85 and 56.13. This wave is most likely to complete sometime between 04-Apr-2016 and 28-Feb-2017 Note that it cannot complete until 11-Mar-2016 but must complete by 02-Apr-2018.
Wave (y) will probably complete this Double Sharp pattern, although it could possibly extend into a Triple Sharp pattern.
Current Analysis Settings: Analysis Date Range: 06-Dec-2013 to 12-Feb-2016, Label Range: 15 - 50, Preferred Count Labels: 18, Min Rating: 75, Stocks toggle ON, Bias Towards Beginning of Data: 8, Bias Towards Major High/Low: 8, Largest Degree Wave Filter: Any Pattern
Rating:79.3
Current Trading Positions for Schwab US Broad Market ETF (SCHB) Daily on 12-Feb-2016
* An Intermediate degree trader (hold positions from months to quarters), would currently be trading long in this market. The probability of this Target Area being correct is 85.8%. However, the random probability of this Target Area being correct is 64.1%. So the true probability of this Target Area being correct is 33.9% better than random.
* A Primary degree trader (hold positions from months to years), would currently be trading long in this market. The probability of this Target Area being correct is 40.7%. However, the random probability of this Target Area being correct is 34.0%. So the true probability of this Target Area being correct is 19.7% better than random.
Extensive Elliott Commentary for Schwab US Broad Market ETF (SCHB) Daily on 12-Feb-2016 with three incomplete patterns:
Wave C of the Minor degree inverted Flat with a rating of 101.7 is expected to complete in the price range 43.48 to 46.96, but more probably between 44.42 and 45.78. This wave is due to complete anytime from now until 19-Feb-2016, but is most likely to complete before 15-Feb-2016.
This wave C will complete the Flat pattern.
This is the final wave in the pattern. When complete it will also complete wave (Y) of the Intermediate degree inverted Double 3 with a rating of 88.7. These two waves have the same target ranges.
Wave (Y) will probably complete this Double Sideways pattern, although it could possibly extend into a Triple Sideways pattern.
This is the final wave in the pattern. When complete it will also complete wave B of the Primary degree Flat with a rating of 79.3. These two waves have the same target ranges.
After wave B is complete, expect the market to continue down into wave C, which should be a five wave Impulsive pattern. Expect wave C to retrace wave B by 86% - 162%. Wave C can also be expected to be 90% - 162% of the price length of wave A. The expected time for wave C to complete is 19% - 134% of the time taken for wave B to complete and 24% - 115% of the time taken for wave A to complete.
Current Analysis Settings: Analysis Date Range: 07-May-2015 to 12-Feb-2016, Label Range: 15 - 50, Preferred Count Labels: 28, Min Rating: 75, Stocks toggle ON, Bias Towards Beginning of Data: 8, Bias Towards Major High/Low: 8, Largest Degree Wave Filter: Any Pattern
Rating:76.1
Current Trading Positions for Schwab US Dividend Equity ETF (SCHD) Daily on 12-Feb-2016
* A Minor degree trader (hold positions from weeks to quarters), would currently be shorting this market. The probability of this Target Area being correct is 54.8%. However, the random probability of this Target Area being correct is 45.0%. So the true probability of this Target Area being correct is 21.8% better than random.
* An Intermediate degree trader (hold positions from months to quarters), would currently be trading long in this market. The probability of this Target Area being correct is 43.4%. However, the random probability of this Target Area being correct is 34.0%. So the true probability of this Target Area being correct is 27.6% better than random.
* A Primary degree trader (hold positions from months to years), would currently be shorting this market. The probability of this Target Area being correct is 39.8%. However, the random probability of this Target Area being correct is 34.0%. So the true probability of this Target Area being correct is 17.1% better than random.
Extensive Elliott Commentary for Schwab US Dividend Equity ETF (SCHD) Daily on 12-Feb-2016 with three incomplete patterns:
Wave B of the Minor degree inverted Zigzag with a rating of 99.2 is expected to complete in the price range 34.88 to 37.57, but more probably between 36.02 and 37.22. This wave was expected to complete before 11-Feb-2016, and must complete by 30-Mar-2016.
After wave B is complete, expect the market to continue up into wave C, which should be a five wave impulsive pattern. Expect wave C to retrace wave B by 114% - 331%. Wave C can also be expected to be 53% - 331% of the price length of wave A. The expected time for wave C to complete is 24% - 277% of the time taken for wave B to complete and 31% - 204% of the time taken for wave A to complete.
Wave (B) of the Intermediate degree Flat with a rating of 88.7 is expected to complete in the price range 38.2 to 47.74, but more probably between 38.3 and 40.79. This wave is due to complete anytime from now until 25-Apr-2017, but is most likely to complete before 31-Mar-2016.
After wave (B) is complete, expect the market to continue down into wave (C), which should be a five wave Impulsive pattern. Expect wave (C) to retrace wave (B) by 86% - 162%. Wave (C) can also be expected to be 90% - 162% of the price length of wave (A). The expected time for wave (C) to complete is 19% - 134% of the time taken for wave (B) to complete and 24% - 115% of the time taken for wave (A) to complete.
Wave B of the Primary degree inverted Flat with a rating of 76.1 is expected to complete in the price range 21.72 to 34.39, but more probably between 30.86 and 34.23. This wave was expected to complete before 15-Jan-2016, and must complete by 14-Nov-2016.
After wave B is complete, expect the market to continue up into wave C, which should be a five wave Impulsive pattern. Expect wave C to retrace wave B by 82% - 177%. Wave C can also be expected to be 89% - 177% of the price length of wave A. The expected time for wave C to complete is 15% - 160% of the time taken for wave B to complete and 16% - 118% of the time taken for wave A to complete.
Current Analysis Settings: Analysis Date Range: 16-Jan-2015 to 12-Feb-2016, Label Range: 15 - 50, Preferred Count Labels: 31, Min Rating: 75, Stocks toggle ON, Bias Towards Beginning of Data: 8, Bias Towards Major High/Low: 8, Largest Degree Wave Filter: Any Pattern
Rating:90.3
Current Trading Positions for Schwab US Large Cap Growth ETF (SCHG) Daily on 12-Feb-2016
* An Intermediate degree trader (hold positions from months to quarters), would currently be trading long in this market. The probability of this Target Area being correct is 88.9%. However, the random probability of this Target Area being correct is 65.0%. So the true probability of this Target Area being correct is 36.8% better than random.
Extensive Elliott Commentary for Schwab US Large Cap Growth ETF (SCHG) Daily on 12-Feb-2016 with two incomplete patterns:
Wave (X) of the Intermediate degree Double Zigzag with a rating of 103.5 is expected to complete in the price range 45.81 to 47.29, but more probably between 46.38 and 47.1. This wave is due to complete anytime from now until 16-Feb-2016, but is most likely to complete before 12-Feb-2016.
After wave (X) is complete, expect the market to continue down into wave (Y), which should be a three wave Zigzag pattern. Expect wave (Y) to retrace wave (X) by 129% - 302%. Wave (Y) can also be expected to be 90% - 302% of the price length of wave (W). The expected time for wave (Y) to complete is 26% - 141% of the time taken for wave (X) to complete and 96% - 271% of the time taken for wave (W) to complete.
Wave 5 of the Primary degree inverted Ending Diagonal with a rating of 90.3 is expected to complete in the price range 31.81 to 45.76, but more probably between 42.02 and 44.9. This wave is due to complete anytime from now until 19-Feb-2016, but is most likely to complete before 17-Feb-2016.
When complete, expect the overall slope (ie. price range divided by time taken) of this wave 5 to be between 49% and 173% of the slope of wave 3 and between 77% to 312% of the slope of wave 1. Wave 5 will complete this Ending Diagonal pattern.
Current Analysis Settings: Analysis Date Range: 08-Jun-2015 to 12-Feb-2016, Label Range: 15 - 50, Preferred Count Labels: 25, Min Rating: 75, Stocks toggle ON, Bias Towards Beginning of Data: 8, Bias Towards Major High/Low: 8, Largest Degree Wave Filter: Any Pattern
Rating:88.9
Current Trading Positions for Schwab US Large Cap Value ETF (SCHV) Daily on 12-Feb-2016
* An Intermediate degree trader (hold positions from months to quarters), would currently be shorting this market. The probability of this Target Area being correct is 88.3%. However, the random probability of this Target Area being correct is 65.0%. So the true probability of this Target Area being correct is 35.8% better than random.
* A Primary degree trader (hold positions from months to years), would currently be trading long in this market. The probability of this Target Area being correct is 43.4%. However, the random probability of this Target Area being correct is 34.0%. So the true probability of this Target Area being correct is 27.6% better than random.
Extensive Elliott Commentary for Schwab US Large Cap Value ETF (SCHV) Daily on 12-Feb-2016 with two incomplete patterns:
Wave (X) of the Intermediate degree inverted Double Zigzag with a rating of 101.7 is expected to complete in the price range 37.92 to 40.32, but more probably between 38.71 and 39.88. This wave is due to complete anytime from now until 14-Mar-2016, but is most likely to complete before 16-Feb-2016.
After wave (X) is complete, expect the market to continue up into wave (Y), which should be a three wave Zigzag pattern. Expect wave (Y) to retrace wave (X) by 128% - 319%. Wave (Y) can also be expected to be 90% - 319% of the price length of wave (W). The expected time for wave (Y) to complete is 23% - 167% of the time taken for wave (X) to complete and 47% - 204% of the time taken for wave (W) to complete.
Wave B of the Primary degree Flat with a rating of 88.9 is expected to complete in the price range 41.91 to 53.35, but more probably between 42.02 and 45.02. This wave is due to complete anytime from now until 25-Apr-2017, but is most likely to complete before 31-Mar-2016.
After wave B is complete, expect the market to continue down into wave C, which should be a five wave Impulsive pattern. Expect wave C to retrace wave B by 86% - 162%. Wave C can also be expected to be 90% - 162% of the price length of wave A. The expected time for wave C to complete is 19% - 134% of the time taken for wave B to complete and 24% - 115% of the time taken for wave A to complete.
Current Analysis Settings: Analysis Date Range: 09-Apr-2015 to 12-Feb-2016, Label Range: 15 - 50, Preferred Count Labels: 17, Min Rating: 75, Stocks toggle ON, Bias Towards Beginning of Data: 8, Bias Towards Major High/Low: 8, Largest Degree Wave Filter: Any Pattern
Rating:97
Current Trading Positions for Schwab US Large-Cap ETF (SCHX) Daily on 12-Feb-2016
* A Primary degree trader (hold positions from months to years), would currently be shorting this market. The probability of this Target Area being correct is 48.2%. However, the random probability of this Target Area being correct is 34.0%. So the true probability of this Target Area being correct is 41.8% better than random.
Extensive Elliott Commentary for Schwab US Large-Cap ETF (SCHX) Daily on 12-Feb-2016 with one incomplete pattern:
Wave B of the Primary degree inverted Flat with a rating of 97 is expected to complete in the price range 35.67 to 43.03, but more probably between 40.98 and 42.94. This wave could complete anytime between now and 01-Mar-2018, but is most likely to complete sometime between 19-Feb-2016 and 24-May-2016.
After wave B is complete, expect the market to continue up into wave C, which should be a five wave Impulsive pattern. Expect wave C to retrace wave B by 82% - 177%. Wave C can also be expected to be 89% - 177% of the price length of wave A. The expected time for wave C to complete is 15% - 160% of the time taken for wave B to complete and 16% - 118% of the time taken for wave A to complete.
Current Analysis Settings: Analysis Date Range: 10-Apr-2015 to 12-Feb-2016, Label Range: 15 - 50, Preferred Count Labels: 24, Min Rating: 75, Stocks toggle ON, Bias Towards Beginning of Data: 8, Bias Towards Major High/Low: 8, Largest Degree Wave Filter: Any Pattern
Rating:79.9
Current Trading Positions for Schwab US Small-Cap ETF (SCHA) Daily on 12-Feb-2016
* An Intermediate degree trader (hold positions from months to quarters), would currently be shorting this market. The probability of this Target Area being correct is 55.8%. However, the random probability of this Target Area being correct is 53.0%. So the true probability of this Target Area being correct is 5.3% better than random.
* A Primary degree trader (hold positions from months to years), would currently be trading long in this market. The probability of this Target Area being correct is 40.7%. However, the random probability of this Target Area being correct is 34.0%. So the true probability of this Target Area being correct is 19.7% better than random.
Extensive Elliott Commentary for Schwab US Small-Cap ETF (SCHA) Daily on 12-Feb-2016 with three incomplete patterns:
Wave C of the Minor degree Flat with a rating of 97.2 is expected to complete in the price range 42.67 to 46.82, but more probably between 43.88 and 45.67. This wave was expected to complete before 09-Feb-2016, and must complete by 15-Feb-2016.
This wave C will complete the Flat pattern.
This is the final wave in the pattern. When complete it will also complete wave (X) of the Intermediate degree inverted Double 3 with a rating of 88.8. These two waves have the same target ranges.
After wave (X) is complete, expect the market to continue up into wave (Y), which will probably be a three wave corrective pattern. Expect wave (Y) to retrace wave (X) by 98% - 212%. Wave (Y) can also be expected to be 73% - 212% of the price length of wave (W). The expected time for wave (Y) to complete is 27% - 214% of the time taken for wave (X) to complete and 38% - 222% of the time taken for wave (W) to complete.
Wave B of the Primary degree Flat with a rating of 79.9 is expected to complete in the price range 51.74 to 73.7, but more probably between 51.97 and 57.71. This wave is due to complete anytime from now until 18-Nov-2016, but is most likely to complete before 08-Mar-2016.
After wave B is complete, expect the market to continue down into wave C, which should be a five wave Impulsive pattern. Expect wave C to retrace wave B by 86% - 162%. Wave C can also be expected to be 90% - 162% of the price length of wave A. The expected time for wave C to complete is 19% - 134% of the time taken for wave B to complete and 24% - 115% of the time taken for wave A to complete.
Current Analysis Settings: Analysis Date Range: 12-May-2015 to 12-Feb-2016, Label Range: 15 - 50, Preferred Count Labels: 17, Min Rating: 75, Stocks toggle ON, Bias Towards Beginning of Data: 8, Bias Towards Major High/Low: 8, Largest Degree Wave Filter: Any Pattern
Rating:101.4
Current Trading Positions for SPDR Barclays Capital Convertible Bond ETF (CWB) Daily on 12-Feb-2016
* A Primary degree trader (hold positions from months to years), would currently be shorting this market. The probability of this Target Area being correct is 64.7%. However, the random probability of this Target Area being correct is 45.0%. So the true probability of this Target Area being correct is 43.8% better than random.
Extensive Elliott Commentary for SPDR Barclays Capital Convertible Bond ETF (CWB) Daily on 12-Feb-2016 with one incomplete pattern:
Wave C of the Primary degree Zigzag with a rating of 101.4 is expected to complete in the price range 33.18 to 39.82, but more probably between 35.95 and 39.16. This wave is due to complete anytime from now until 18-Apr-2016, but is most likely to complete before 10-Mar-2016.
This wave C will complete the ZigZag pattern.
Current Analysis Settings: Analysis Date Range: 24-Jul-2014 to 12-Feb-2016, Label Range: 15 - 50, Preferred Count Labels: 22, Min Rating: 75, Stocks toggle ON, Bias Towards Beginning of Data: 8, Bias Towards Major High/Low: 8, Largest Degree Wave Filter: Any Pattern
Rating:78.9
Current Trading Positions for SPDR Barclays Capital Intermediate Term Credit Bond (ITR) Daily on 12-Feb-2016
* A Minor degree trader (hold positions from weeks to quarters), would currently be shorting this market. The probability of this Target Area being correct is 88.9%. However, the random probability of this Target Area being correct is 65.0%. So the true probability of this Target Area being correct is 36.8% better than random.
* An Intermediate degree trader (hold positions from months to quarters), would currently be trading long in this market. The probability of this Target Area being correct is 44.0%. However, the random probability of this Target Area being correct is 34.0%. So the true probability of this Target Area being correct is 29.4% better than random.
* A Primary degree trader (hold positions from months to years), would currently be shorting this market. The probability of this Target Area being correct is 39.5%. However, the random probability of this Target Area being correct is 34.0%. So the true probability of this Target Area being correct is 16.2% better than random.
* A Cycle degree trader (hold positions from quarters to years), would currently be trading long in this market. The probability of this Target Area being correct is 40.4%. However, the random probability of this Target Area being correct is 34.0%. So the true probability of this Target Area being correct is 18.8% better than random.
Extensive Elliott Commentary for SPDR Barclays Capital Intermediate Term Credit Bond (ITR) Daily on 12-Feb-2016 with four incomplete patterns:
Wave X of the Minor degree inverted Double Zigzag with a rating of 103.1 is expected to complete in the price range 33.34 to 33.66, but more probably between 33.44 and 33.6. This wave is most likely to complete sometime between 22-Feb-2016 and 30-Mar-2016 Note that it cannot complete until 16-Feb-2016 but must complete by 05-Jul-2016.
After wave X is complete, expect the market to continue up into wave Y, which should be a three wave Zigzag pattern. Expect wave Y to retrace wave X by 128% - 319%. Wave Y can also be expected to be 90% - 319% of the price length of wave W. The expected time for wave Y to complete is 23% - 167% of the time taken for wave X to complete and 47% - 204% of the time taken for wave W to complete.
Wave (B) of the Intermediate degree Flat with a rating of 90.5 is expected to complete in the price range 33.92 to 35.6, but more probably between 33.94 and 34.38. This wave is due to complete anytime from now until 01-Feb-2017, but is most likely to complete before 08-Mar-2016.
After wave (B) is complete, expect the market to continue down into wave (C), which should be a five wave Impulsive pattern. Expect wave (C) to retrace wave (B) by 86% - 162%. Wave (C) can also be expected to be 90% - 162% of the price length of wave (A). The expected time for wave (C) to complete is 19% - 134% of the time taken for wave (B) to complete and 24% - 115% of the time taken for wave (A) to complete.
Wave B of the Primary degree inverted Flat with a rating of 75.7 is expected to complete in the price range 31.88 to 33.85, but more probably between 33.54 and 33.84. This wave was expected to complete before 15-Jan-2016, and must complete by 23-Aug-2016.
After wave B is complete, expect the market to continue up into wave C, which should be a five wave Impulsive pattern. Expect wave C to retrace wave B by 80% - 169%. Wave C can also be expected to be 99% - 169% of the price length of wave A. The expected time for wave C to complete is 19% - 187% of the time taken for wave B to complete and 56% - 268% of the time taken for wave A to complete.
Wave b of the Cycle degree Flat with a rating of 78.9 is expected to complete in the price range 34.19 to 35.67, but more probably between 34.21 and 34.59. This wave is due to complete anytime from now until 23-Nov-2017, but is most likely to complete before 18-Feb-2016.
After wave b is complete, expect the market to continue down into wave c, which should be a five wave Impulsive pattern. Expect wave c to retrace wave b by 86% - 162%. Wave c can also be expected to be 90% - 162% of the price length of wave a. The expected time for wave c to complete is 19% - 134% of the time taken for wave b to complete and 24% - 115% of the time taken for wave a to complete.
Current Analysis Settings: Analysis Date Range: 17-Dec-2014 to 12-Feb-2016, Label Range: 15 - 50, Preferred Count Labels: 26, Min Rating: 75, Stocks toggle ON, Bias Towards Beginning of Data: 8, Bias Towards Major High/Low: 8, Largest Degree Wave Filter: Any Pattern
Rating:89.3
Current Trading Positions for SPDR Barclays Capital Short Term Corp Bond (SCPB) Daily on 12-Feb-2016
* A Cycle degree trader (hold positions from quarters to years), would currently be trading long in this market. The probability of this Target Area being correct is 55.9%. However, the random probability of this Target Area being correct is 53.0%. So the true probability of this Target Area being correct is 5.5% better than random.
Extensive Elliott Commentary for SPDR Barclays Capital Short Term Corp Bond (SCPB) Daily on 12-Feb-2016 with two incomplete patterns:
Wave C of the Primary degree inverted Flat with a rating of 100.9 is expected to complete in the price range 30.42 to 30.79, but more probably between 30.49 and 30.69. This wave is due to complete anytime from now until 03-Mar-2017, but is most likely to complete before 13-Apr-2016.
This wave C will complete the Flat pattern.
This is the final wave in the pattern. When complete it will also complete wave x of the Cycle degree Double 3 with a rating of 89.3. These two waves have the same target ranges.
After wave x is complete, expect the market to continue down into wave y, which will probably be a three wave corrective pattern. Expect wave y to retrace wave x by 98% - 192%. Wave y can also be expected to be 76% - 192% of the price length of wave w. The expected time for wave y to complete is 20% - 179% of the time taken for wave x to complete and 12% - 112% of the time taken for wave w to complete.
Current Analysis Settings: Analysis Date Range: 17-Apr-2014 to 12-Feb-2016, Label Range: 15 - 50, Preferred Count Labels: 16, Min Rating: 75, Stocks toggle ON, Bias Towards Beginning of Data: 8, Bias Towards Major High/Low: 8, Largest Degree Wave Filter: Any Pattern
Rating:77.9
Current Trading Positions for SPDR Barclays High Yield Bond ETF (JNK) Daily on 12-Feb-2016
* A Cycle degree trader (hold positions from quarters to years), would currently be trading long in this market. The probability of this Target Area being correct is 76.8%. However, the random probability of this Target Area being correct is 65.0%. So the true probability of this Target Area being correct is 18.2% better than random.
Extensive Elliott Commentary for SPDR Barclays High Yield Bond ETF (JNK) Daily on 12-Feb-2016 with two incomplete patterns:
Wave C of the Primary degree inverted Flat with a rating of 101.9 is expected to complete in the price range 31.88 to 35.39, but more probably between 32.73 and 34.23. This wave is most likely to complete sometime between 12-Feb-2016 and 29-Feb-2016 Note that it cannot complete until 12-Feb-2016 but must complete by 18-Apr-2016.
This wave C will complete the Flat pattern.
This is the final wave in the pattern. When complete it will also complete wave x of the Cycle degree Double Zigzag with a rating of 77.9. These two waves have the same target ranges.
After wave x is complete, expect the market to continue down into wave y, which should be a three wave Zigzag pattern. Expect wave y to retrace wave x by 116% - 261%. Wave y can also be expected to be 90% - 261% of the price length of wave w. The expected time for wave y to complete is 21% - 160% of the time taken for wave x to complete and 25% - 152% of the time taken for wave w to complete.
Current Analysis Settings: Analysis Date Range: 14-May-2014 to 12-Feb-2016, Label Range: 15 - 50, Preferred Count Labels: 19, Min Rating: 75, Stocks toggle ON, Bias Towards Beginning of Data: 8, Bias Towards Major High/Low: 8, Largest Degree Wave Filter: Any Pattern
Rating:80.4
Current Trading Positions for SPDR Blackstone GSO Senior Loan ETF (SRLN) Daily on 12-Feb-2016
* An Intermediate degree trader (hold positions from months to quarters), would currently be shorting this market. The probability of this Target Area being correct is 63.2%. However, the random probability of this Target Area being correct is 45.0%. So the true probability of this Target Area being correct is 40.4% better than random.
* A Primary degree trader (hold positions from months to years), would currently be shorting this market. The probability of this Target Area being correct is 41.0%. However, the random probability of this Target Area being correct is 34.0%. So the true probability of this Target Area being correct is 20.6% better than random.
Extensive Elliott Commentary for SPDR Blackstone GSO Senior Loan ETF (SRLN) Daily on 12-Feb-2016 with two incomplete patterns:
Wave (C) of the Intermediate degree Zigzag with a rating of 99.7 is expected to complete in the price range 44.5 to 46, but more probably between 45.01 and 45.71. This wave is due to complete anytime from now until 20-Jun-2016, but is most likely to complete before 15-Mar-2016.
This wave (C) will complete the ZigZag pattern.
This is the final wave in the pattern. When complete it will also complete wave B of the Primary degree inverted Flat with a rating of 80.4. These two waves have the same target ranges.
After wave B is complete, expect the market to continue up into wave C, which should be a five wave Impulsive pattern. Expect wave C to retrace wave B by 80% - 169%. Wave C can also be expected to be 99% - 169% of the price length of wave A. The expected time for wave C to complete is 19% - 187% of the time taken for wave B to complete and 56% - 268% of the time taken for wave A to complete.
Current Analysis Settings: Analysis Date Range: 11-Dec-2013 to 12-Feb-2016, Label Range: 15 - 50, Preferred Count Labels: 21, Min Rating: 75, Stocks toggle ON, Bias Towards Beginning of Data: 8, Bias Towards Major High/Low: 8, Largest Degree Wave Filter: Any Pattern
Rating:127.4
Current Trading Positions for SPDR DJ Wilshire International Real Estate Fund (RWX) Daily on 12-Feb-2016
* A Primary degree trader (hold positions from months to years), would currently be shorting this market. The probability of this Target Area being correct is 78.1%. However, the random probability of this Target Area being correct is 64.0%. So the true probability of this Target Area being correct is 22.0% better than random.
* A Cycle degree trader (hold positions from quarters to years), would currently be trading long in this market. The probability of this Target Area being correct is 94.3%. However, the random probability of this Target Area being correct is 65.0%. So the true probability of this Target Area being correct is 45.1% better than random.
Extensive Elliott Commentary for SPDR DJ Wilshire International Real Estate Fund (RWX) Daily on 12-Feb-2016 with two incomplete patterns:
Wave D of the Primary degree inverted Contracting Triangle with a rating of 219.8 is expected to complete in the price range 34.55 to 36.25, but more probably between 34.91 and 35.72. This wave is due to complete anytime from now until 15-Mar-2016, but is most likely to complete before 25-Feb-2016.
Once this wave D is complete, expect the market to continue up to the end of wave E, which will most probably be a ZigZag family pattern or possibly a Contracting Triangle. Expect wave E to have between 39% and 66% of the price range of wave C and complete in 4% to 60% of the time taken by wave C. Expect also that wave E will have between 21% and 47% of the price range of wave A and complete in 2% to 24% of the time taken by wave A. The slope (ie. price range divided by time taken) of wave E should be between 28% and 143% of the slope of wave C and between 19% to 183% of the slope of wave A. Wave E will complete this Contracting Triangle.
Wave x of the Cycle degree Double Zigzag with a rating of 127.4 is expected to complete in the price range 38.9 to 45.4, but more probably between 40.72 and 44.05. This wave was expected to complete before 06-Jan-2016, and must complete by 16-Sep-2016.
After wave x is complete, expect the market to continue down into wave y, which should be a three wave Zigzag pattern. Expect wave y to retrace wave x by 117% - 263%. Wave y can also be expected to be 90% - 263% of the price length of wave w. The expected time for wave y to complete is 21% - 161% of the time taken for wave x to complete and 27% - 154% of the time taken for wave w to complete.
Current Analysis Settings: Analysis Date Range: 06-Apr-2015 to 12-Feb-2016, Label Range: 15 - 50, Preferred Count Labels: 21, Min Rating: 75, Stocks toggle ON, Bias Towards Beginning of Data: 8, Bias Towards Major High/Low: 8, Largest Degree Wave Filter: Any Pattern
Rating:97.1
Current Trading Positions for SPDR Dow Jones Global Real Estate ETF (RWO) Daily on 12-Feb-2016
* A Primary degree trader (hold positions from months to years), would currently be shorting this market. The probability of this Target Area being correct is 41.4%. However, the random probability of this Target Area being correct is 24.3%. So the true probability of this Target Area being correct is 70.4% better than random.
Extensive Elliott Commentary for SPDR Dow Jones Global Real Estate ETF (RWO) Daily on 12-Feb-2016 with one incomplete pattern:
Wave Y of the Primary degree Double Zigzag with a rating of 97.1 is expected to complete in the price range 28.78 to 39.8, but more probably between 36.76 and 39.7. This wave is most likely to complete sometime between 16-Feb-2016 and 29-Feb-2016 Note that it cannot complete until 15-Feb-2016 but must complete by 14-Mar-2016.
Wave Y will probably complete this Double Sharp pattern, although it could possibly extend into a Triple Sharp pattern.
Current Analysis Settings: Analysis Date Range: 15-Dec-2014 to 12-Feb-2016, Label Range: 15 - 50, Preferred Count Labels: 20, Min Rating: 75, Stocks toggle ON, Bias Towards Beginning of Data: 8, Bias Towards Major High/Low: 8, Largest Degree Wave Filter: Any Pattern
Rating:97.2
Current Trading Positions for SPDR Dow Jones Industrial Average ETF (DIA) Daily on 12-Feb-2016
* A Primary degree trader (hold positions from months to years), would currently be shorting this market. The probability of this Target Area being correct is 48.2%. However, the random probability of this Target Area being correct is 34.0%. So the true probability of this Target Area being correct is 41.8% better than random.
Extensive Elliott Commentary for SPDR Dow Jones Industrial Average ETF (DIA) Daily on 12-Feb-2016 with one incomplete pattern:
Wave B of the Primary degree inverted Flat with a rating of 97.2 is expected to complete in the price range 132.57 to 155.32, but more probably between 148.98 and 155.03. This wave could complete anytime between now and 01-Mar-2018, but is most likely to complete sometime between 19-Feb-2016 and 24-May-2016.
After wave B is complete, expect the market to continue up into wave C, which should be a five wave Impulsive pattern. Expect wave C to retrace wave B by 82% - 177%. Wave C can also be expected to be 89% - 177% of the price length of wave A. The expected time for wave C to complete is 15% - 160% of the time taken for wave B to complete and 16% - 118% of the time taken for wave A to complete.
Current Analysis Settings: Analysis Date Range: 09-Apr-2015 to 12-Feb-2016, Label Range: 15 - 50, Preferred Count Labels: 23, Min Rating: 75, Stocks toggle ON, Bias Towards Beginning of Data: 8, Bias Towards Major High/Low: 8, Largest Degree Wave Filter: Any Pattern
Rating:83.5
Current Trading Positions for SPDR Dow Jones REIT ETF (RWR) Daily on 12-Feb-2016
* A Primary degree trader (hold positions from months to years), would currently be shorting this market. The probability of this Target Area being correct is 48.2%. However, the random probability of this Target Area being correct is 34.0%. So the true probability of this Target Area being correct is 41.8% better than random.
* A Cycle degree trader (hold positions from quarters to years), would currently be trading long in this market. The probability of this Target Area being correct is 85.3%. However, the random probability of this Target Area being correct is 64.1%. So the true probability of this Target Area being correct is 33.1% better than random.
Extensive Elliott Commentary for SPDR Dow Jones REIT ETF (RWR) Daily on 12-Feb-2016 with two incomplete patterns:
Wave B of the Primary degree inverted Flat with a rating of 97.1 is expected to complete in the price range 63.39 to 85.15, but more probably between 81.67 and 84.98. This wave was expected to complete before 05-Feb-2016, and must complete by 08-Mar-2016.
After wave B is complete, expect the market to continue up into wave C, which should be a five wave Impulsive pattern. Expect wave C to retrace wave B by 83% - 173%. Wave C can also be expected to be 101% - 173% of the price length of wave A. The expected time for wave C to complete is 20% - 190% of the time taken for wave B to complete and 57% - 279% of the time taken for wave A to complete.
Wave y of the Cycle degree inverted Double 3 with a rating of 83.5 is expected to complete in the price range 84.71 to 131.2, but more probably between 88.57 and 105.46. This wave is most likely to complete sometime between 19-Feb-2016 and 08-Jul-2016 Note that it cannot complete until 15-Feb-2016 but must complete by 21-Nov-2016.
Wave y will probably complete this Double Sideways pattern, although it could possibly extend into a Triple Sideways pattern.
Current Analysis Settings: Analysis Date Range: 06-Dec-2013 to 12-Feb-2016, Label Range: 15 - 50, Preferred Count Labels: 17, Min Rating: 75, Stocks toggle ON, Bias Towards Beginning of Data: 8, Bias Towards Major High/Low: 8, Largest Degree Wave Filter: Any Pattern
Rating:81.8
Current Trading Positions for SPDR EURO STOXX 50 ETF (FEZ) Daily on 12-Feb-2016
* A Primary degree trader (hold positions from months to years), would currently be shorting this market. The probability of this Target Area being correct is 63.2%. However, the random probability of this Target Area being correct is 45.0%. So the true probability of this Target Area being correct is 40.4% better than random.
* A Cycle degree trader (hold positions from quarters to years), would currently be shorting this market. The probability of this Target Area being correct is 35.5%. However, the random probability of this Target Area being correct is 24.3%. So the true probability of this Target Area being correct is 46.1% better than random.
Extensive Elliott Commentary for SPDR EURO STOXX 50 ETF (FEZ) Daily on 12-Feb-2016 with two incomplete patterns:
Wave C of the Primary degree Zigzag with a rating of 99.6 is expected to complete in the price range 21.48 to 30.61, but more probably between 26.81 and 30.24. This wave is due to complete anytime from now until 17-Mar-2016, but is most likely to complete before 29-Feb-2016.
This wave C will complete the ZigZag pattern.
This is the final wave in the pattern. When complete it will also complete wave y of the Cycle degree Double Zigzag with a rating of 81.8. These two waves have the same target ranges.
Wave y will probably complete this Double Sharp pattern, although it could possibly extend into a Triple Sharp pattern.
Current Analysis Settings: Analysis Date Range: 08-May-2014 to 12-Feb-2016, Label Range: 15 - 50, Preferred Count Labels: 28, Min Rating: 75, Stocks toggle ON, Bias Towards Beginning of Data: 8, Bias Towards Major High/Low: 8, Largest Degree Wave Filter: Any Pattern
Rating:85.2
Current Trading Positions for SPDR Gold Trust (GLD) Daily on 12-Feb-2016
* A Cycle degree trader (hold positions from quarters to years), would currently be trading long in this market. The probability of this Target Area being correct is 42.5%. However, the random probability of this Target Area being correct is 34.0%. So the true probability of this Target Area being correct is 25.0% better than random.
Extensive Elliott Commentary for SPDR Gold Trust (GLD) Daily on 12-Feb-2016 with two incomplete patterns:
Wave C of the Primary degree inverted Flat with a rating of 103.5 is expected to complete in the price range 103.43 to 131.8, but more probably between 110.57 and 122.22. This wave is due to complete anytime from now until 22-Feb-2017, but is most likely to complete before 14-Mar-2016.
This wave C will complete the Flat pattern.
This is the final wave in the pattern. When complete it will also complete wave b of the Cycle degree Flat with a rating of 85.2. These two waves have the same target ranges.
After wave b is complete, expect the market to continue down into wave c, which should be a five wave Impulsive pattern. Expect wave c to retrace wave b by 85% - 162%. Wave c can also be expected to be 90% - 162% of the price length of wave a. The expected time for wave c to complete is 20% - 136% of the time taken for wave b to complete and 20% - 110% of the time taken for wave a to complete.
Current Analysis Settings: Analysis Date Range: 31-Jan-2014 to 12-Feb-2016, Label Range: 15 - 50, Preferred Count Labels: 28, Min Rating: 75, Stocks toggle ON, Bias Towards Beginning of Data: 8, Bias Towards Major High/Low: 8, Largest Degree Wave Filter: Any Pattern
Rating:100.4
Current Trading Positions for SPDR KBW Bank ETF (KBE) Daily on 12-Feb-2016
* A Cycle degree trader (hold positions from quarters to years), would currently be trading long in this market. The probability of this Target Area being correct is 50.0%. However, the random probability of this Target Area being correct is 34.0%. So the true probability of this Target Area being correct is 47.1% better than random.
Extensive Elliott Commentary for SPDR KBW Bank ETF (KBE) Daily on 12-Feb-2016 with one incomplete pattern:
Wave b of the Cycle degree Flat with a rating of 100.4 is expected to complete in the price range 33.76 to 55.21, but more probably between 33.98 and 39.59. This wave is most likely to complete sometime between 04-Mar-2016 and 05-Aug-2016 Note that it cannot complete until 19-Feb-2016 but must complete by 20-Jun-2019.
After wave b is complete, expect the market to continue down into wave c, which should be a five wave Impulsive pattern. Expect wave c to retrace wave b by 86% - 162%. Wave c can also be expected to be 90% - 162% of the price length of wave a. The expected time for wave c to complete is 19% - 134% of the time taken for wave b to complete and 24% - 115% of the time taken for wave a to complete.
Current Analysis Settings: Analysis Date Range: 11-Jun-2015 to 12-Feb-2016, Label Range: 15 - 50, Preferred Count Labels: 15, Min Rating: 75, Stocks toggle ON, Bias Towards Beginning of Data: 8, Bias Towards Major High/Low: 8, Largest Degree Wave Filter: Any Pattern
Rating:94
Current Trading Positions for SPDR KBW Insurance ETF (KIE) Daily on 12-Feb-2016
* A Primary degree trader (hold positions from months to years), would currently be trading long in this market. The probability of this Target Area being correct is 88.8%. However, the random probability of this Target Area being correct is 80.4%. So the true probability of this Target Area being correct is 10.4% better than random.
Extensive Elliott Commentary for SPDR KBW Insurance ETF (KIE) Daily on 12-Feb-2016 with one incomplete pattern:
Wave 4 of the Primary degree inverted Ending Diagonal with a rating of 94 is expected to complete in the price range 61.91 to 65.29, but more probably between 63.22 and 64.79. This wave is due to complete anytime from now until 11-Mar-2016, but is most likely to complete before 17-Feb-2016.
Expect this wave 4 to complete in the price range of wave 2, and then continue down to the end of wave 5, which should be a ZigZag family three wave pattern. Expect wave 5 to have between 52% and 91% of the price range of wave 3 and complete in 18% to 62% of the time taken by wave 3. Expect also that wave 5 will have between 31% and 72% of the price range of wave 1 and complete in 3% to 22% of the time taken by wave 1. The slope (ie. price range divided by time taken) of wave 5 should be between 49% and 173% of the slope of wave 3 and between 77% to 312% of the slope of wave 1. Wave 5 will complete this Ending Diagonal pattern.
Current Analysis Settings: Analysis Date Range: 23-Dec-2013 to 12-Feb-2016, Label Range: 15 - 50, Preferred Count Labels: 30, Min Rating: 75, Stocks toggle ON, Bias Towards Beginning of Data: 8, Bias Towards Major High/Low: 8, Largest Degree Wave Filter: Any Pattern
Rating:75.8
Current Trading Positions for SPDR KBW Regional Banking ETF (KRE) Daily on 12-Feb-2016
* A Minute degree trader (hold positions from weeks to months), would currently be trading long in this market. The probability of this Target Area being correct is 50.1%. However, the random probability of this Target Area being correct is 34.0%. So the true probability of this Target Area being correct is 47.4% better than random.
* A Minor degree trader (hold positions from weeks to quarters), would currently be shorting this market. The probability of this Target Area being correct is 40.4%. However, the random probability of this Target Area being correct is 34.0%. So the true probability of this Target Area being correct is 18.8% better than random.
* An Intermediate degree trader (hold positions from months to quarters), would currently be trading long in this market. The probability of this Target Area being correct is 85.9%. However, the random probability of this Target Area being correct is 64.1%. So the true probability of this Target Area being correct is 34.0% better than random.
* A Primary degree trader (hold positions from months to years), would currently be trading long in this market. The probability of this Target Area being correct is 39.5%. However, the random probability of this Target Area being correct is 34.0%. So the true probability of this Target Area being correct is 16.2% better than random.
Extensive Elliott Commentary for SPDR KBW Regional Banking ETF (KRE) Daily on 12-Feb-2016 with four incomplete patterns:
Wave b of the Minute degree Flat with a rating of 101.9 is expected to complete in the price range 35.13 to 48.82, but more probably between 35.21 and 37.72. This wave is due to complete anytime from now until 30-Mar-2016, but is most likely to complete before 24-Feb-2016.
After wave b is complete, expect the market to continue down into wave c, which should be a five wave Impulsive pattern. Expect wave c to retrace wave b by 89% - 167%. Wave c can also be expected to be 105% - 167% of the price length of wave a. The expected time for wave c to complete is 20% - 148% of the time taken for wave b to complete and 60% - 290% of the time taken for wave a to complete.
Wave B of the Minor degree inverted Flat with a rating of 78 is expected to complete in the price range 27.04 to 34.93, but more probably between 33.67 and 34.87. This wave was expected to complete before 08-Feb-2016, and must complete by 15-Feb-2016.
After wave B is complete, expect the market to continue up into wave C, which should be a five wave Impulsive pattern. Expect wave C to retrace wave B by 83% - 173%. Wave C can also be expected to be 101% - 173% of the price length of wave A. The expected time for wave C to complete is 20% - 190% of the time taken for wave B to complete and 57% - 279% of the time taken for wave A to complete.
Wave (Y) of the Intermediate degree inverted Double 3 with a rating of 89.8 is expected to complete in the price range 34.78 to 43.57, but more probably between 36.11 and 38.77. This wave is due to complete anytime from now until 19-Feb-2016, but is most likely to complete before 15-Feb-2016.
Wave (Y) will probably complete this Double Sideways pattern, although it could possibly extend into a Triple Sideways pattern.
This is the final wave in the pattern. When complete it will also complete wave B of the Primary degree Flat with a rating of 75.8. These two waves have the same target ranges.
After wave B is complete, expect the market to continue down into wave C, which should be a five wave Impulsive pattern. Expect wave C to retrace wave B by 86% - 162%. Wave C can also be expected to be 90% - 162% of the price length of wave A. The expected time for wave C to complete is 19% - 134% of the time taken for wave B to complete and 24% - 115% of the time taken for wave A to complete.
Current Analysis Settings: Analysis Date Range: 28-Sep-2015 to 12-Feb-2016, Label Range: 15 - 50, Preferred Count Labels: 23, Min Rating: 75, Stocks toggle ON, Bias Towards Beginning of Data: 8, Bias Towards Major High/Low: 8, Largest Degree Wave Filter: Any Pattern
Rating:81.4
Current Trading Positions for SPDR Lehm Muni ETF (TFI) Daily on 12-Feb-2016
* A Primary degree trader (hold positions from months to years), would currently be trading long in this market. The probability of this Target Area being correct is 41.4%. However, the random probability of this Target Area being correct is 24.3%. So the true probability of this Target Area being correct is 70.4% better than random.
* A Cycle degree trader (hold positions from quarters to years), would currently be trading long in this market. The probability of this Target Area being correct is 41.3%. However, the random probability of this Target Area being correct is 34.0%. So the true probability of this Target Area being correct is 21.5% better than random.
Extensive Elliott Commentary for SPDR Lehm Muni ETF (TFI) Daily on 12-Feb-2016 with two incomplete patterns:
Wave Y of the Primary degree inverted Double Zigzag with a rating of 97.8 is expected to complete in the price range 24.4 to 24.94, but more probably between 24.41 and 24.68. This wave is due to complete anytime from now until 19-Aug-2016, but is most likely to complete before 04-Mar-2016.
Wave Y will probably complete this Double Sharp pattern, although it could possibly extend into a Triple Sharp pattern.
This is the final wave in the pattern. When complete it will also complete wave b of the Cycle degree Flat with a rating of 81.4. These two waves have the same target ranges.
After wave b is complete, expect the market to continue down into wave c, which should be a five wave Impulsive pattern. Expect wave c to retrace wave b by 86% - 162%. Wave c can also be expected to be 90% - 162% of the price length of wave a. The expected time for wave c to complete is 19% - 134% of the time taken for wave b to complete and 24% - 115% of the time taken for wave a to complete.
Current Analysis Settings: Analysis Date Range: 06-Dec-2013 to 12-Feb-2016, Label Range: 15 - 50, Preferred Count Labels: 18, Min Rating: 75, Stocks toggle ON, Bias Towards Beginning of Data: 8, Bias Towards Major High/Low: 8, Largest Degree Wave Filter: Any Pattern
Rating:87.1
Current Trading Positions for SPDR Lehman Intermediate Term Treasury ETF (ITE) Daily on 12-Feb-2016
* A Primary degree trader (hold positions from months to years), would currently be trading long in this market. The probability of this Target Area being correct is 41.9%. However, the random probability of this Target Area being correct is 34.0%. So the true probability of this Target Area being correct is 23.2% better than random.
* A Cycle degree trader (hold positions from quarters to years), would currently be shorting this market. The probability of this Target Area being correct is 43.1%. However, the random probability of this Target Area being correct is 34.0%. So the true probability of this Target Area being correct is 26.8% better than random.
Extensive Elliott Commentary for SPDR Lehman Intermediate Term Treasury ETF (ITE) Daily on 12-Feb-2016 with three incomplete patterns:
Wave (C) of the Intermediate degree inverted Flat with a rating of 96.8 is expected to complete in the price range 60.2 to 63.16, but more probably between 60.97 and 62.18. This wave was expected to complete before 05-Feb-2016, and must complete by 03-Mar-2016.
This wave (C) will complete the Flat pattern.
This is the final wave in the pattern. When complete it will also complete wave B of the Primary degree Flat with a rating of 83.4. These two waves have the same target ranges.
After wave B is complete, expect the market to continue down into wave C, which should be a five wave Impulsive pattern. Expect wave C to retrace wave B by 86% - 162%. Wave C can also be expected to be 90% - 162% of the price length of wave A. The expected time for wave C to complete is 19% - 134% of the time taken for wave B to complete and 24% - 115% of the time taken for wave A to complete.
Wave b of the Cycle degree inverted Flat with a rating of 87.1 is expected to complete in the price range 56.53 to 58.84, but more probably between 58.19 and 58.81. This wave is due to complete anytime from now until 26-Mar-2018, but is most likely to complete before 09-Mar-2016.
After wave b is complete, expect the market to continue up into wave c, which should be a five wave Impulsive pattern. Expect wave c to retrace wave b by 82% - 177%. Wave c can also be expected to be 89% - 177% of the price length of wave a. The expected time for wave c to complete is 15% - 160% of the time taken for wave b to complete and 16% - 118% of the time taken for wave a to complete.
Current Analysis Settings: Analysis Date Range: 04-Feb-2015 to 12-Feb-2016, Label Range: 15 - 50, Preferred Count Labels: 19, Min Rating: 75, Stocks toggle ON, Bias Towards Beginning of Data: 8, Bias Towards Major High/Low: 8, Largest Degree Wave Filter: Any Pattern
Rating:93
Current Trading Positions for SPDR Lehman International Treasury Bond Fund ETF (BWX) Daily on 12-Feb-2016
* A Primary degree trader (hold positions from months to years), would currently be trading long in this market. The probability of this Target Area being correct is 87.2%. However, the random probability of this Target Area being correct is 64.1%. So the true probability of this Target Area being correct is 36.0% better than random.
* A Cycle degree trader (hold positions from quarters to years), would currently be trading long in this market. The probability of this Target Area being correct is 83.8%. However, the random probability of this Target Area being correct is 65.0%. So the true probability of this Target Area being correct is 28.9% better than random.
Extensive Elliott Commentary for SPDR Lehman International Treasury Bond Fund ETF (BWX) Daily on 12-Feb-2016 with two incomplete patterns:
Wave Y of the Primary degree inverted Double 3 with a rating of 102.6 is expected to complete in the price range 51.25 to 62.67, but more probably between 53.01 and 56.7. This wave is due to complete anytime from now until 01-Sep-2016, but is most likely to complete before 17-Mar-2016.
Wave Y will probably complete this Double Sideways pattern, although it could possibly extend into a Triple Sideways pattern.
This is the final wave in the pattern. When complete it will also complete wave x of the Cycle degree Double Zigzag with a rating of 93. These two waves have the same target ranges.
After wave x is complete, expect the market to continue down into wave y, which should be a three wave Zigzag pattern. Expect wave y to retrace wave x by 117% - 263%. Wave y can also be expected to be 90% - 263% of the price length of wave w. The expected time for wave y to complete is 21% - 161% of the time taken for wave x to complete and 27% - 154% of the time taken for wave w to complete.
Current Analysis Settings: Analysis Date Range: 07-Jul-2014 to 12-Feb-2016, Label Range: 15 - 50, Preferred Count Labels: 16, Min Rating: 75, Stocks toggle ON, Bias Towards Beginning of Data: 8, Bias Towards Major High/Low: 8, Largest Degree Wave Filter: Any Pattern
Rating:102.2
Current Trading Positions for SPDR Lehman Short Term Municipal Bond ETF (SHM) Daily on 12-Feb-2016
* A Cycle degree trader (hold positions from quarters to years), would currently be trading long in this market. The probability of this Target Area being correct is 42.4%. However, the random probability of this Target Area being correct is 24.3%. So the true probability of this Target Area being correct is 74.5% better than random.
Extensive Elliott Commentary for SPDR Lehman Short Term Municipal Bond ETF (SHM) Daily on 12-Feb-2016 with one incomplete pattern:
Wave y of the Cycle degree inverted Double Zigzag with a rating of 102.2 is expected to complete in the price range 24.68 to 24.73, but more probably between 24.69 and 24.71. This wave is most likely to complete sometime between 24-Feb-2016 and 01-Jun-2016 Note that it cannot complete until 19-Feb-2016 but must complete by 14-Nov-2016.
Wave y will probably complete this Double Sharp pattern, although it could possibly extend into a Triple Sharp pattern.
Current Analysis Settings: Analysis Date Range: 01-May-2015 to 12-Feb-2016, Label Range: 15 - 50, Preferred Count Labels: 19, Min Rating: 75, Stocks toggle ON, Bias Towards Beginning of Data: 8, Bias Towards Major High/Low: 8, Largest Degree Wave Filter: Any Pattern
Rating:83.6
Current Trading Positions for SPDR MSCI ACWI Ex-US ETF (CWI) Daily on 12-Feb-2016
* An Intermediate degree trader (hold positions from months to quarters), would currently be shorting this market. The probability of this Target Area being correct is 70.5%. However, the random probability of this Target Area being correct is 45.0%. So the true probability of this Target Area being correct is 56.7% better than random.
Extensive Elliott Commentary for SPDR MSCI ACWI Ex-US ETF (CWI) Daily on 12-Feb-2016 with two incomplete patterns:
Wave (2) of the Intermediate degree Impulse with a rating of 94.2 is expected to complete in the price range 26.91 to 28.84, but more probably between 27.88 and 28.64. This wave was expected to complete before 02-Feb-2016, and must complete by 25-Feb-2016.
After this wave (2) is complete, expect the market to continue up into wave (3). Wave (3) should always be an Impulse and should retrace wave (2) completely. Expect wave (3) to retrace wave (2) by 164% - 383%. Wave (3) can also be expected to be 83% - 383% of the price length of wave (1). The expected time for wave (3) to complete is 87% - 367% of the time taken for wave (2) to complete and 16% - 97% of the time taken for wave (1) to complete. The slope (ie. price range divided by time taken) of wave (3) should be between 70% and 219% of the slope of wave (1). Once wave (3) is complete, expect wave (4) to be a sideways corrective movement, then wave (5) to continue in the same direction as wave (3). Wave (5) will complete this Impulse.
Wave C of the Primary degree inverted Flat with a rating of 83.6 is expected to complete in the price range 29.54 to 38.03, but more probably between 31.24 and 35.73. This wave is due to complete anytime from now until 18-Jul-2016, but is most likely to complete before 14-Apr-2016.
This wave C will complete the Flat pattern.
Current Analysis Settings: Analysis Date Range: 08-May-2014 to 12-Feb-2016, Label Range: 15 - 50, Preferred Count Labels: 32, Min Rating: 75, Stocks toggle ON, Bias Towards Beginning of Data: 8, Bias Towards Major High/Low: 8, Largest Degree Wave Filter: Any Pattern
Rating:77.3
Current Trading Positions for SPDR Nuveen S&P High Yield Municipal Bond ETF (HYMB) Daily on 12-Feb-2016
* An Intermediate degree trader (hold positions from months to quarters), would currently be shorting this market. The probability of this Target Area being correct is 87.4%. However, the random probability of this Target Area being correct is 64.1%. So the true probability of this Target Area being correct is 36.3% better than random.
* A Primary degree trader (hold positions from months to years), would currently be shorting this market. The probability of this Target Area being correct is 44.6%. However, the random probability of this Target Area being correct is 34.0%. So the true probability of this Target Area being correct is 31.2% better than random.
* A Cycle degree trader (hold positions from quarters to years), would currently be trading long in this market. The probability of this Target Area being correct is 40.1%. However, the random probability of this Target Area being correct is 34.0%. So the true probability of this Target Area being correct is 17.9% better than random.
Extensive Elliott Commentary for SPDR Nuveen S&P High Yield Municipal Bond ETF (HYMB) Daily on 12-Feb-2016 with three incomplete patterns:
Wave (Y) of the Intermediate degree Double 3 with a rating of 104.7 is expected to complete in the price range 50.42 to 57.21, but more probably between 54.4 and 56.1. This wave is due to complete anytime from now until 29-Apr-2016, but is most likely to complete before 26-Feb-2016.
Wave (Y) will probably complete this Double Sideways pattern, although it could possibly extend into a Triple Sideways pattern.
This is the final wave in the pattern. When complete it will also complete wave B of the Primary degree inverted Flat with a rating of 91.1. These two waves have the same target ranges.
After wave B is complete, expect the market to continue up into wave C, which should be a five wave Impulsive pattern. Expect wave C to retrace wave B by 82% - 177%. Wave C can also be expected to be 89% - 177% of the price length of wave A. The expected time for wave C to complete is 15% - 160% of the time taken for wave B to complete and 16% - 118% of the time taken for wave A to complete.
Wave b of the Cycle degree Flat with a rating of 77.3 is expected to complete in the price range 57.65 to 66.27, but more probably between 57.74 and 59.99. This wave was expected to complete before 06-Jan-2016, and must complete by 06-Mar-2018.
After wave b is complete, expect the market to continue down into wave c, which should be a five wave Impulsive pattern. Expect wave c to retrace wave b by 86% - 162%. Wave c can also be expected to be 90% - 162% of the price length of wave a. The expected time for wave c to complete is 19% - 134% of the time taken for wave b to complete and 24% - 115% of the time taken for wave a to complete.
Current Analysis Settings: Analysis Date Range: 06-Dec-2013 to 12-Feb-2016, Label Range: 15 - 50, Preferred Count Labels: 20, Min Rating: 75, Stocks toggle ON, Bias Towards Beginning of Data: 8, Bias Towards Major High/Low: 8, Largest Degree Wave Filter: Any Pattern
Rating:83.6
Current Trading Positions for SPDR S&P Biotech ETF (XBI) Daily on 12-Feb-2016
* A Primary degree trader (hold positions from months to years), would currently be shorting this market. The probability of this Target Area being correct is 40.8%. However, the random probability of this Target Area being correct is 24.3%. So the true probability of this Target Area being correct is 67.9% better than random.
* A Cycle degree trader (hold positions from quarters to years), would currently be shorting this market. The probability of this Target Area being correct is 41.9%. However, the random probability of this Target Area being correct is 34.0%. So the true probability of this Target Area being correct is 23.2% better than random.
Extensive Elliott Commentary for SPDR S&P Biotech ETF (XBI) Daily on 12-Feb-2016 with two incomplete patterns:
Wave Y of the Primary degree Double Zigzag with a rating of 94.1 is expected to complete in the price range 25.52 to 36.29, but more probably between 31.02 and 35.94.
Wave Y will probably complete this Double Sharp pattern, although it could possibly extend into a Triple Sharp pattern.
This is the final wave in the pattern. When complete it will also complete wave b of the Cycle degree inverted Flat with a rating of 83.6. These two waves have the same target ranges.
After wave b is complete, expect the market to continue up into wave c, which should be a five wave Impulsive pattern. Expect wave c to retrace wave b by 82% - 179%. Wave c can also be expected to be 67% - 179% of the price length of wave a. The expected time for wave c to complete is 20% - 151% of the time taken for wave b to complete and 11% - 58% of the time taken for wave a to complete.
Current Analysis Settings: Analysis Date Range: 05-Mar-2014 to 12-Feb-2016, Label Range: 15 - 50, Preferred Count Labels: 20, Min Rating: 75, Stocks toggle ON, Bias Towards Beginning of Data: 8, Bias Towards Major High/Low: 8, Largest Degree Wave Filter: Any Pattern
Rating:81.2
Current Trading Positions for SPDR S&P Dividends ETF (SDY) Daily on 12-Feb-2016
* An Intermediate degree trader (hold positions from months to quarters), would currently be shorting this market. The probability of this Target Area being correct is 57.0%. However, the random probability of this Target Area being correct is 45.0%. So the true probability of this Target Area being correct is 26.7% better than random.
* A Primary degree trader (hold positions from months to years), would currently be trading long in this market. The probability of this Target Area being correct is 35.5%. However, the random probability of this Target Area being correct is 24.3%. So the true probability of this Target Area being correct is 46.1% better than random.
Extensive Elliott Commentary for SPDR S&P Dividends ETF (SDY) Daily on 12-Feb-2016 with two incomplete patterns:
Wave (B) of the Intermediate degree inverted Zigzag with a rating of 102.5 is expected to complete in the price range 66.86 to 72.9, but more probably between 69.42 and 72.11. This wave is due to complete anytime from now until 22-Apr-2016, but is most likely to complete before 17-Feb-2016.
After wave (B) is complete, expect the market to continue up into wave (C), which should be a five wave impulsive pattern. Expect wave (C) to retrace wave (B) by 114% - 331%. Wave (C) can also be expected to be 53% - 331% of the price length of wave (A). The expected time for wave (C) to complete is 24% - 277% of the time taken for wave (B) to complete and 31% - 204% of the time taken for wave (A) to complete.
Wave Y of the Primary degree inverted Double Zigzag with a rating of 81.2 is expected to complete in the price range 95.39 to 127.53, but more probably between 95.88 and 111.79. This wave is due to complete anytime from now until 22-Sep-2016, but is most likely to complete before 18-Apr-2016.
Wave Y will probably complete this Double Sharp pattern, although it could possibly extend into a Triple Sharp pattern.
Current Analysis Settings: Analysis Date Range: 27-Oct-2014 to 12-Feb-2016, Label Range: 15 - 50, Preferred Count Labels: 15, Min Rating: 75, Stocks toggle ON, Bias Towards Beginning of Data: 8, Bias Towards Major High/Low: 8, Largest Degree Wave Filter: Any Pattern
Rating:102
Current Trading Positions for SPDR S&P Emerging Markets Dividend ETF (EDIV) Daily on 12-Feb-2016
* An Intermediate degree trader (hold positions from months to quarters), would currently be shorting this market. The probability of this Target Area being correct is 50.2%. However, the random probability of this Target Area being correct is 34.0%. So the true probability of this Target Area being correct is 47.6% better than random.
Extensive Elliott Commentary for SPDR S&P Emerging Markets Dividend ETF (EDIV) Daily on 12-Feb-2016 with one incomplete pattern:
Wave (B) of the Intermediate degree inverted Flat with a rating of 102 is expected to complete in the price range 10.94 to 21.55, but more probably between 19.9 and 21.49. This wave is due to complete anytime from now until 20-May-2016, but is most likely to complete before 26-Feb-2016.
After wave (B) is complete, expect the market to continue up into wave (C), which should be a five wave Impulsive pattern. Expect wave (C) to retrace wave (B) by 80% - 169%. Wave (C) can also be expected to be 99% - 169% of the price length of wave (A). The expected time for wave (C) to complete is 19% - 187% of the time taken for wave (B) to complete and 56% - 268% of the time taken for wave (A) to complete.
Current Analysis Settings: Analysis Date Range: 08-May-2014 to 12-Feb-2016, Label Range: 15 - 50, Preferred Count Labels: 38, Min Rating: 75, Stocks toggle ON, Bias Towards Beginning of Data: 8, Bias Towards Major High/Low: 8, Largest Degree Wave Filter: Any Pattern
Rating:102.1
Current Trading Positions for SPDR S&P Global Natural Resources ETF (GNR) Daily on 12-Feb-2016
* An Intermediate degree trader (hold positions from months to quarters), would currently be trading long in this market. The probability of this Target Area being correct is 42.4%. However, the random probability of this Target Area being correct is 24.3%. So the true probability of this Target Area being correct is 74.5% better than random.
Extensive Elliott Commentary for SPDR S&P Global Natural Resources ETF (GNR) Daily on 12-Feb-2016 with one incomplete pattern:
Wave (Y) of the Intermediate degree inverted Double Zigzag with a rating of 102.1 is expected to complete in the price range 32.68 to 39.04, but more probably between 32.74 and 35.34. This wave is most likely to complete sometime between 15-Feb-2016 and 26-Feb-2016 Note that it cannot complete until 15-Feb-2016 but must complete by 07-Mar-2016.
Wave (Y) will probably complete this Double Sharp pattern, although it could possibly extend into a Triple Sharp pattern.
Current Analysis Settings: Analysis Date Range: 12-Jun-2014 to 12-Feb-2016, Label Range: 15 - 50, Preferred Count Labels: 26, Min Rating: 75, Stocks toggle ON, Bias Towards Beginning of Data: 8, Bias Towards Major High/Low: 8, Largest Degree Wave Filter: Any Pattern
Rating:102.7
Current Trading Positions for SPDR S&P Homebuilders ETF (XHB) Daily on 12-Feb-2016
* An Intermediate degree trader (hold positions from months to quarters), would currently be shorting this market. The probability of this Target Area being correct is 88.6%. However, the random probability of this Target Area being correct is 65.0%. So the true probability of this Target Area being correct is 36.3% better than random.
Extensive Elliott Commentary for SPDR S&P Homebuilders ETF (XHB) Daily on 12-Feb-2016 with one incomplete pattern:
Wave (X) of the Intermediate degree inverted Double Zigzag with a rating of 102.7 is expected to complete in the price range 27.84 to 28.89, but more probably between 28.07 and 28.58. This wave was expected to complete before 12-Feb-2016, and must complete by 15-Feb-2016.
After wave (X) is complete, expect the market to continue up into wave (Y), which should be a three wave Zigzag pattern. Expect wave (Y) to retrace wave (X) by 123% - 305%. Wave (Y) can also be expected to be 91% - 305% of the price length of wave (W). The expected time for wave (Y) to complete is 28% - 154% of the time taken for wave (X) to complete and 86% - 284% of the time taken for wave (W) to complete.
Current Analysis Settings: Analysis Date Range: 04-Sep-2014 to 12-Feb-2016, Label Range: 15 - 50, Preferred Count Labels: 45, Min Rating: 75, Stocks toggle ON, Bias Towards Beginning of Data: 8, Bias Towards Major High/Low: 8, Largest Degree Wave Filter: Any Pattern
Rating:83.8
Current Trading Positions for SPDR S&P International Dividend ETF (DWX) Daily on 12-Feb-2016
* An Intermediate degree trader (hold positions from months to quarters), would currently be shorting this market. The probability of this Target Area being correct is 70.8%. However, the random probability of this Target Area being correct is 45.0%. So the true probability of this Target Area being correct is 57.3% better than random.
Extensive Elliott Commentary for SPDR S&P International Dividend ETF (DWX) Daily on 12-Feb-2016 with two incomplete patterns:
Wave (2) of the Intermediate degree Impulse with a rating of 96.3 is expected to complete in the price range 28.93 to 31.77, but more probably between 30.36 and 31.48. This wave was expected to complete before 09-Feb-2016, and must complete by 14-Mar-2016.
After this wave (2) is complete, expect the market to continue up into wave (3). Wave (3) should always be an Impulse and should retrace wave (2) completely. Expect wave (3) to retrace wave (2) by 164% - 383%. Wave (3) can also be expected to be 83% - 383% of the price length of wave (1). The expected time for wave (3) to complete is 87% - 367% of the time taken for wave (2) to complete and 16% - 97% of the time taken for wave (1) to complete. The slope (ie. price range divided by time taken) of wave (3) should be between 70% and 219% of the slope of wave (1). Once wave (3) is complete, expect wave (4) to be a sideways corrective movement, then wave (5) to continue in the same direction as wave (3). Wave (5) will complete this Impulse.
Wave C of the Primary degree inverted Flat with a rating of 83.8 is expected to complete in the price range 33.04 to 41.96, but more probably between 34.34 and 39.5. This wave is due to complete anytime from now until 03-Jan-2017, but is most likely to complete before 07-Apr-2016.
This wave C will complete the Flat pattern.
Current Analysis Settings: Analysis Date Range: 08-May-2014 to 12-Feb-2016, Label Range: 15 - 50, Preferred Count Labels: 18, Min Rating: 75, Stocks toggle ON, Bias Towards Beginning of Data: 8, Bias Towards Major High/Low: 8, Largest Degree Wave Filter: Any Pattern
Rating:102.7
Current Trading Positions for SPDR S&P International Small Cap ETF (GWX) Daily on 12-Feb-2016
* An Intermediate degree trader (hold positions from months to quarters), would currently be shorting this market. The probability of this Target Area being correct is 50.2%. However, the random probability of this Target Area being correct is 34.0%. So the true probability of this Target Area being correct is 47.6% better than random.
Extensive Elliott Commentary for SPDR S&P International Small Cap ETF (GWX) Daily on 12-Feb-2016 with one incomplete pattern:
Wave (B) of the Intermediate degree inverted Flat with a rating of 102.7 is expected to complete in the price range 18.13 to 25.22, but more probably between 24.12 and 25.18. This wave is due to complete anytime from now until 19-Apr-2016, but is most likely to complete before 18-Feb-2016.
After wave (B) is complete, expect the market to continue up into wave (C), which should be a five wave Impulsive pattern. Expect wave (C) to retrace wave (B) by 80% - 169%. Wave (C) can also be expected to be 99% - 169% of the price length of wave (A). The expected time for wave (C) to complete is 19% - 187% of the time taken for wave (B) to complete and 56% - 268% of the time taken for wave (A) to complete.
Current Analysis Settings: Analysis Date Range: 22-May-2014 to 12-Feb-2016, Label Range: 15 - 50, Preferred Count Labels: 15, Min Rating: 75, Stocks toggle ON, Bias Towards Beginning of Data: 8, Bias Towards Major High/Low: 8, Largest Degree Wave Filter: Any Pattern
Rating:104.3
Current Trading Positions for SPDR S&P Metals & Mining ETF (XME) Daily on 12-Feb-2016
* An Intermediate degree trader (hold positions from months to quarters), would currently be trading long in this market. The probability of this Target Area being correct is 65.3%. However, the random probability of this Target Area being correct is 45.0%. So the true probability of this Target Area being correct is 45.1% better than random.
Extensive Elliott Commentary for SPDR S&P Metals & Mining ETF (XME) Daily on 12-Feb-2016 with one incomplete pattern:
Wave (C) of the Intermediate degree inverted Zigzag with a rating of 104.3 is expected to complete in the price range 15.35 to 21.77, but more probably between 15.95 and 19.58. This wave is most likely to complete sometime between 12-Feb-2016 and 29-Feb-2016 Note that it cannot complete until 12-Feb-2016 but must complete by 30-Mar-2016.
This wave (C) will complete the ZigZag pattern.
Current Analysis Settings: Analysis Date Range: 09-Jul-2014 to 12-Feb-2016, Label Range: 15 - 50, Preferred Count Labels: 17, Min Rating: 75, Stocks toggle ON, Bias Towards Beginning of Data: 8, Bias Towards Major High/Low: 8, Largest Degree Wave Filter: Any Pattern
Rating:75.8
Current Trading Positions for SPDR S&P Oil & Gas Equipment & Services ETF (XES) Daily on 12-Feb-2016
* A Cycle degree trader (hold positions from quarters to years), would currently be shorting this market. The probability of this Target Area being correct is 49.5%. However, the random probability of this Target Area being correct is 45.0%. So the true probability of this Target Area being correct is 10.0% better than random.
Extensive Elliott Commentary for SPDR S&P Oil & Gas Equipment & Services ETF (XES) Daily on 12-Feb-2016 with two incomplete patterns:
Wave 5 of the Primary degree inverted Impulse with a rating of 96.4 is expected to complete at a price no higher than 13.54, but more probably no higher than 9.06. This wave could complete anytime between now and 20-May-2016, but is most likely to complete sometime between 15-Feb-2016 and 30-Mar-2016.
When complete, expect the overall slope (ie. price range divided by time taken) of this wave 5 to be between 48% and 200% of the slope of wave 3 and between 29% to 297% of the slope of wave 1. This wave 5 will complete the Impulse pattern.
This is the final wave in the pattern. When complete it will also complete wave c of the Cycle degree Zigzag with a rating of 75.8. These two waves have the same target ranges.
This wave c will complete the ZigZag pattern.
Current Analysis Settings: Analysis Date Range: 20-May-2014 to 12-Feb-2016, Label Range: 15 - 50, Preferred Count Labels: 17, Min Rating: 75, Stocks toggle ON, Bias Towards Beginning of Data: 8, Bias Towards Major High/Low: 8, Largest Degree Wave Filter: Any Pattern
Rating:78.2
Current Trading Positions for SPDR S&P Oil &Gas Exploration & Production ETF (XOP) Daily on 12-Feb-2016
* An Intermediate degree trader (hold positions from months to quarters), would currently be shorting this market. The probability of this Target Area being correct is 70.0%. However, the random probability of this Target Area being correct is 13.0%. So the true probability of this Target Area being correct is 438.5% better than random.
* A Primary degree trader (hold positions from months to years), would currently be shorting this market. The probability of this Target Area being correct is 50.2%. However, the random probability of this Target Area being correct is 45.0%. So the true probability of this Target Area being correct is 11.6% better than random.
* A Cycle degree trader (hold positions from quarters to years), would currently be shorting this market. The probability of this Target Area being correct is 34.0%. However, the random probability of this Target Area being correct is 24.3%. So the true probability of this Target Area being correct is 39.9% better than random.
Extensive Elliott Commentary for SPDR S&P Oil &Gas Exploration & Production ETF (XOP) Daily on 12-Feb-2016 with three incomplete patterns:
Wave (3) of the Intermediate degree inverted Impulse with a rating of 104.4 is expected to complete at a price no higher than 20.08, but more probably no higher than 15.4. This wave is due to complete anytime from now until 12-Apr-2016, but is most likely to complete before 18-Mar-2016.
When complete, expect the overall slope (ie. price range divided by time taken) of this wave (3) to be between 47% to 194% of the slope of wave (1). Then expect the market to pull back into wave (4), which will be corrective in nature and has a probability of 0% of being a Flat or other sideways pattern. Wave (4) should not retrace back into the price range of wave (1) or (2). Expect wave (4) to have between 5% - 140% of the
price range of wave (2). The expected time for wave (4) to complete is between 15% - 136% of wave (2). After wave (4), expect wave (5) to move beyond the end of wave (3) to complete this Impulse.
Wave C of the Primary degree Zigzag with a rating of 82.3 is expected to complete in the price range .78 to 34.14, but more probably between 21.17 and 33.09. This wave was expected to complete before 03-Feb-2016, and must complete by 23-Aug-2016.
This wave C will complete the ZigZag pattern.
This is the final wave in the pattern. When complete it will also complete wave y of the Cycle degree Double Zigzag with a rating of 78.2. These two waves have the same target ranges.
Wave y will probably complete this Double Sharp pattern, although it could possibly extend into a Triple Sharp pattern.
Current Analysis Settings: Analysis Date Range: 12-May-2014 to 12-Feb-2016, Label Range: 15 - 50, Preferred Count Labels: 17, Min Rating: 75, Stocks toggle ON, Bias Towards Beginning of Data: 8, Bias Towards Major High/Low: 8, Largest Degree Wave Filter: Any Pattern
Rating:75.1
Current Trading Positions for SPDR S&P Pharmaceuticals ETF (XPH) Daily on 12-Feb-2016
* An Intermediate degree trader (hold positions from months to quarters), would currently be shorting this market. The probability of this Target Area being correct is 47.6%. However, the random probability of this Target Area being correct is 34.0%. So the true probability of this Target Area being correct is 40.0% better than random.
* A Primary degree trader (hold positions from months to years), would currently be trading long in this market. The probability of this Target Area being correct is 40.4%. However, the random probability of this Target Area being correct is 34.0%. So the true probability of this Target Area being correct is 18.8% better than random.
* A Cycle degree trader (hold positions from quarters to years), would currently be shorting this market. The probability of this Target Area being correct is 84.5%. However, the random probability of this Target Area being correct is 64.1%. So the true probability of this Target Area being correct is 31.8% better than random.
Extensive Elliott Commentary for SPDR S&P Pharmaceuticals ETF (XPH) Daily on 12-Feb-2016 with three incomplete patterns:
Wave (B) of the Intermediate degree inverted Flat with a rating of 96.9 is expected to complete in the price range 29.3 to 43.4, but more probably between 41.21 and 43.33. This wave was expected to complete before 04-Feb-2016, and must complete by 15-Mar-2016.
After wave (B) is complete, expect the market to continue up into wave (C), which should be a five wave Impulsive pattern. Expect wave (C) to retrace wave (B) by 80% - 169%. Wave (C) can also be expected to be 99% - 169% of the price length of wave (A). The expected time for wave (C) to complete is 19% - 187% of the time taken for wave (B) to complete and 56% - 268% of the time taken for wave (A) to complete.
Wave B of the Primary degree Flat with a rating of 78.8 is expected to complete in the price range 51.36 to 99.19, but more probably between 51.63 and 60.68. This wave is due to complete anytime from now until 01-Nov-2016, but is most likely to complete before 08-Apr-2016.
After wave B is complete, expect the market to continue down into wave C, which should be a five wave Impulsive pattern. Expect wave C to retrace wave B by 89% - 167%. Wave C can also be expected to be 104% - 167% of the price length of wave A. The expected time for wave C to complete is 20% - 146% of the time taken for wave B to complete and 53% - 275% of the time taken for wave A to complete.
Wave y of the Cycle degree Double 3 with a rating of 75.1 is expected to complete at a price no higher than 53.95, but more probably between 11.04 and 36.58. This wave is due to complete anytime from now until 11-Apr-2016, but is most likely to complete before 10-Mar-2016.
Wave y will probably complete this Double Sideways pattern, although it could possibly extend into a Triple Sideways pattern.
Current Analysis Settings: Analysis Date Range: 11-Jun-2015 to 12-Feb-2016, Label Range: 15 - 50, Preferred Count Labels: 16, Min Rating: 75, Stocks toggle ON, Bias Towards Beginning of Data: 8, Bias Towards Major High/Low: 8, Largest Degree Wave Filter: Any Pattern
Rating:83.6
Current Trading Positions for SPDR S&P Retail ETF (XRT) Daily on 12-Feb-2016
* A Primary degree trader (hold positions from months to years), would currently be shorting this market. The probability of this Target Area being correct is 50.2%. However, the random probability of this Target Area being correct is 34.0%. So the true probability of this Target Area being correct is 47.6% better than random.
* A Cycle degree trader (hold positions from quarters to years), would currently be trading long in this market. The probability of this Target Area being correct is 86.6%. However, the random probability of this Target Area being correct is 80.4%. So the true probability of this Target Area being correct is 7.7% better than random.
Extensive Elliott Commentary for SPDR S&P Retail ETF (XRT) Daily on 12-Feb-2016 with two incomplete patterns:
Wave B of the Primary degree inverted Flat with a rating of 102.9 is expected to complete in the price range 25.24 to 38.99, but more probably between 36.85 and 38.92. This wave is due to complete anytime from now until 19-Apr-2016, but is most likely to complete before 18-Feb-2016.
After wave B is complete, expect the market to continue up into wave C, which should be a five wave Impulsive pattern. Expect wave C to retrace wave B by 80% - 169%. Wave C can also be expected to be 99% - 169% of the price length of wave A. The expected time for wave C to complete is 19% - 187% of the time taken for wave B to complete and 56% - 268% of the time taken for wave A to complete.
Wave IV of the Cycle degree inverted Ending Diagonal with a rating of 83.6 is expected to complete in the price range 41.63 to 45.11, but more probably between 41.63 and 42.12. This wave is due to complete anytime from now until 02-Jun-2016, but is most likely to complete before 24-Feb-2016.
Expect this wave IV to complete in the price range of wave 2, and then continue down to the end of wave V, which should be a ZigZag family three wave pattern. Expect wave V to have between 52% and 91% of the price range of wave III and complete in 18% to 62% of the time taken by wave
III. Expect also that wave V will have between 31% and 72% of the price range of wave I and complete in 3% to 22% of the time taken by wave I. The slope (ie. price range divided by time taken) of wave V should be between 49% and 173% of the slope of wave III and between 77% to 312% of the slope of wave I. Wave V will complete this Ending Diagonal pattern.
Current Analysis Settings: Analysis Date Range: 18-Feb-2015 to 12-Feb-2016, Label Range: 15 - 50, Preferred Count Labels: 17, Min Rating: 75, Stocks toggle ON, Bias Towards Beginning of Data: 8, Bias Towards Major High/Low: 8, Largest Degree Wave Filter: Any Pattern
Rating:103
Current Trading Positions for SPDR S&P Semiconductor ETF (XSD) Daily on 12-Feb-2016
* A Supercycle degree trader (buy and hold for years), would currently be shorting this market. The probability of this Target Area being correct is 50.2%. However, the random probability of this Target Area being correct is 34.0%. So the true probability of this Target Area being correct is 47.6% better than random.
Extensive Elliott Commentary for SPDR S&P Semiconductor ETF (XSD) Daily on 12-Feb-2016 with one incomplete pattern:
Wave (b) of the Supercycle degree inverted Flat with a rating of 103 is expected to complete in the price range 15.66 to 32.89, but more probably between 28.72 and 32.5. This wave is most likely to complete sometime between 22-Mar-2016 and 23-Nov-2016 Note that it cannot complete until 15-Feb-2016 but must complete by 05-Sep-2019.
After wave (b) is complete, expect the market to continue up into wave (c), which should be a five wave Impulsive pattern. Expect wave (c) to retrace wave (b) by 82% - 179%. Wave (c) can also be expected to be 67% - 179% of the price length of wave (a). The expected time for wave (c) to complete is 20% - 151% of the time taken for wave (b) to complete and 11% - 58% of the time taken for wave (a) to complete.
Current Analysis Settings: Analysis Date Range: 06-Dec-2013 to 12-Feb-2016, Label Range: 15 - 50, Preferred Count Labels: 16, Min Rating: 75, Stocks toggle ON, Bias Towards Beginning of Data: 8, Bias Towards Major High/Low: 8, Largest Degree Wave Filter: Any Pattern
Rating:102.2
Current Trading Positions for SPDR S&P World ex-US ETF (GWL) Daily on 12-Feb-2016
* An Intermediate degree trader (hold positions from months to quarters), would currently be shorting this market. The probability of this Target Area being correct is 50.2%. However, the random probability of this Target Area being correct is 34.0%. So the true probability of this Target Area being correct is 47.6% better than random.
Extensive Elliott Commentary for SPDR S&P World ex-US ETF (GWL) Daily on 12-Feb-2016 with one incomplete pattern:
Wave (B) of the Intermediate degree inverted Flat with a rating of 102.2 is expected to complete in the price range 16.32 to 23.06, but more probably between 22.01 and 23.03. This wave is due to complete anytime from now until 19-Apr-2016, but is most likely to complete before 18-Feb-2016.
After wave (B) is complete, expect the market to continue up into wave (C), which should be a five wave Impulsive pattern. Expect wave (C) to retrace wave (B) by 80% - 169%. Wave (C) can also be expected to be 99% - 169% of the price length of wave (A). The expected time for wave (C) to complete is 19% - 187% of the time taken for wave (B) to complete and 56% - 268% of the time taken for wave (A) to complete.
Current Analysis Settings: Analysis Date Range: 08-May-2014 to 12-Feb-2016, Label Range: 15 - 50, Preferred Count Labels: 16, Min Rating: 75, Stocks toggle ON, Bias Towards Beginning of Data: 8, Bias Towards Major High/Low: 8, Largest Degree Wave Filter: Any Pattern
Rating:79.1
Current Trading Positions for SPDR Series Trust (BNDS) Daily on 12-Feb-2016
* A Primary degree trader (hold positions from months to years), would currently be trading long in this market. The probability of this Target Area being correct is 43.4%. However, the random probability of this Target Area being correct is 34.0%. So the true probability of this Target Area being correct is 27.6% better than random.
* A Cycle degree trader (hold positions from quarters to years), would currently be shorting this market. The probability of this Target Area being correct is 40.7%. However, the random probability of this Target Area being correct is 34.0%. So the true probability of this Target Area being correct is 19.7% better than random.
Extensive Elliott Commentary for SPDR Series Trust (BNDS) Daily on 12-Feb-2016 with three incomplete patterns:
Wave (C) of the Intermediate degree inverted Flat with a rating of 108.9 is expected to complete in the price range 57.11 to 60.32, but more probably between 57.9 and 59.11. This wave is due to complete anytime from now until 25-May-2017, but is most likely to complete before 15-Apr-2016.
This wave (C) will complete the Flat pattern.
This is the final wave in the pattern. When complete it will also complete wave B of the Primary degree Flat with a rating of 88.2. These two waves have the same target ranges.
After wave B is complete, expect the market to continue down into wave C, which should be a five wave Impulsive pattern. Expect wave C to retrace wave B by 86% - 162%. Wave C can also be expected to be 90% - 162% of the price length of wave A. The expected time for wave C to complete is 19% - 134% of the time taken for wave B to complete and 24% - 115% of the time taken for wave A to complete.
Wave b of the Cycle degree inverted Flat with a rating of 79.1 is expected to complete in the price range 50.79 to 56.66, but more probably between 55.03 and 56.59. This wave was expected to complete before 19-May-2015, and must complete by 21-Dec-2017.
After wave b is complete, expect the market to continue up into wave c, which should be a five wave Impulsive pattern. Expect wave c to retrace wave b by 82% - 177%. Wave c can also be expected to be 89% - 177% of the price length of wave a. The expected time for wave c to complete is 15% - 160% of the time taken for wave b to complete and 16% - 118% of the time taken for wave a to complete.
Current Analysis Settings: Analysis Date Range: 04-Feb-2014 to 12-Feb-2016, Label Range: 15 - 50, Preferred Count Labels: 21, Min Rating: 75, Stocks toggle ON, Bias Towards Beginning of Data: 8, Bias Towards Major High/Low: 8, Largest Degree Wave Filter: Any Pattern
Rating:82.4
Current Trading Positions for SPDR Wells Fargo Preferred Stock ETF (PSK) Daily on 12-Feb-2016
* A Minor degree trader (hold positions from weeks to quarters), would currently be trading long in this market. The probability of this Target Area being correct is 70.9%. However, the random probability of this Target Area being correct is 45.0%. So the true probability of this Target Area being correct is 57.6% better than random.
* An Intermediate degree trader (hold positions from months to quarters), would currently be shorting this market. The probability of this Target Area being correct is 49.7%. However, the random probability of this Target Area being correct is 45.0%. So the true probability of this Target Area being correct is 10.4% better than random.
* A Primary degree trader (hold positions from months to years), would currently be shorting this market. The probability of this Target Area being correct is 85.2%. However, the random probability of this Target Area being correct is 64.1%. So the true probability of this Target Area being correct is 32.9% better than random.
Extensive Elliott Commentary for SPDR Wells Fargo Preferred Stock ETF (PSK) Daily on 12-Feb-2016 with three incomplete patterns:
Wave 2 of the Minor degree inverted Impulse with a rating of 97 is expected to complete in the price range 42.2 to 43.98, but more probably between 42.6 and 43.32. This wave was expected to complete before 12-Feb-2016, and must complete by 18-Feb-2016.
After this wave 2 is complete, expect the market to continue down into wave 3. Wave 3 should always be an Impulse and should retrace wave 2 completely. Expect wave 3 to retrace wave 2 by 222% - 403%. Wave 3 can also be expected to be 106% - 403% of the price length of wave 1. The expected time for wave 3 to complete is 35% - 364% of the time taken for wave 2 to complete and 41% - 204% of the time taken for wave 1 to complete. The slope (ie. price range divided by time taken) of wave 3 should be between 39% and 177% of the slope of wave 1. Once wave 3 is complete, expect wave 4 to be a sideways corrective movement, then wave 5 to continue in the same direction as wave 3. Wave 5 will complete this Impulse.
Wave (C) of the Intermediate degree Zigzag with a rating of 77.9 is expected to complete in the price range 40.1 to 43.28, but more probably between 41.92 and 43.12. This wave is due to complete anytime from now until 19-Feb-2016, but is most likely to complete before 15-Feb-2016.
This wave (C) will complete the ZigZag pattern.
This is the final wave in the pattern. When complete it will also complete wave Y of the Primary degree Double 3 with a rating of 82.4. These two waves have the same target ranges.
Wave Y will probably complete this Double Sideways pattern, although it could possibly extend into a Triple Sideways pattern.
Current Analysis Settings: Analysis Date Range: 14-Jul-2015 to 12-Feb-2016, Label Range: 15 - 50, Preferred Count Labels: 20, Min Rating: 75, Stocks toggle ON, Bias Towards Beginning of Data: 8, Bias Towards Major High/Low: 8, Largest Degree Wave Filter: Any Pattern
Rating:91.2
Current Trading Positions for SPDRs S&P 500 Trust Series ETF (SPY) Daily on 12-Feb-2016
* A Primary degree trader (hold positions from months to years), would currently be shorting this market. The probability of this Target Area being correct is 65.1%. However, the random probability of this Target Area being correct is 45.0%. So the true probability of this Target Area being correct is 44.7% better than random.
* A Cycle degree trader (hold positions from quarters to years), would currently be shorting this market. The probability of this Target Area being correct is 44.6%. However, the random probability of this Target Area being correct is 34.0%. So the true probability of this Target Area being correct is 31.2% better than random.
Extensive Elliott Commentary for SPDRs S&P 500 Trust Series ETF (SPY) Daily on 12-Feb-2016 with two incomplete patterns:
Wave C of the Primary degree Zigzag with a rating of 103.2 is expected to complete in the price range 127.05 to 183.32, but more probably between 165.6 and 182.44. This wave is due to complete anytime from now until 18-Apr-2016, but is most likely to complete before 10-Mar-2016.
This wave C will complete the ZigZag pattern.
This is the final wave in the pattern. When complete it will also complete wave b of the Cycle degree inverted Flat with a rating of 91.2. These two waves have the same target ranges.
After wave b is complete, expect the market to continue up into wave c, which should be a five wave Impulsive pattern. Expect wave c to retrace wave b by 82% - 179%. Wave c can also be expected to be 67% - 179% of the price length of wave a. The expected time for wave c to complete is 20% - 151% of the time taken for wave b to complete and 11% - 58% of the time taken for wave a to complete.
Current Analysis Settings: Analysis Date Range: 23-Dec-2013 to 12-Feb-2016, Label Range: 15 - 50, Preferred Count Labels: 15, Min Rating: 75, Stocks toggle ON, Bias Towards Beginning of Data: 8, Bias Towards Major High/Low: 8, Largest Degree Wave Filter: Any Pattern
Rating:95.6
Current Trading Positions for SPDRs S&P Midcap Trust Series ETF (MDY) Daily on 12-Feb-2016
* A Cycle degree trader (hold positions from quarters to years), would currently be shorting this market. The probability of this Target Area being correct is 41.0%. However, the random probability of this Target Area being correct is 24.3%. So the true probability of this Target Area being correct is 68.7% better than random.
Extensive Elliott Commentary for SPDRs S&P Midcap Trust Series ETF (MDY) Daily on 12-Feb-2016 with one incomplete pattern:
Wave y of the Cycle degree Double Zigzag with a rating of 95.6 is expected to complete in the price range 121.94 to 183.78, but more probably between 166.16 and 182.8. This wave is most likely to complete sometime between 23-Feb-2016 and 06-Jun-2016 Note that it cannot complete until 22-Feb-2016 but must complete by 16-Sep-2016.
Wave y will probably complete this Double Sharp pattern, although it could possibly extend into a Triple Sharp pattern.
Current Analysis Settings: Analysis Date Range: 07-May-2015 to 12-Feb-2016, Label Range: 15 - 50, Preferred Count Labels: 15, Min Rating: 75, Stocks toggle ON, Bias Towards Beginning of Data: 8, Bias Towards Major High/Low: 8, Largest Degree Wave Filter: Any Pattern
Rating:78.8
Current Trading Positions for SPDRs Select Sector Consumer Discretionary ETF (XLY) Daily on 12-Feb-2016
* An Intermediate degree trader (hold positions from months to quarters), would currently be shorting this market. The probability of this Target Area being correct is 50.1%. However, the random probability of this Target Area being correct is 34.0%. So the true probability of this Target Area being correct is 47.4% better than random.
* A Primary degree trader (hold positions from months to years), would currently be trading long in this market. The probability of this Target Area being correct is 55.9%. However, the random probability of this Target Area being correct is 53.0%. So the true probability of this Target Area being correct is 5.5% better than random.
* A Cycle degree trader (hold positions from quarters to years), would currently be shorting this market. The probability of this Target Area being correct is 40.4%. However, the random probability of this Target Area being correct is 34.0%. So the true probability of this Target Area being correct is 18.8% better than random.
Extensive Elliott Commentary for SPDRs Select Sector Consumer Discretionary ETF (XLY) Daily on 12-Feb-2016 with three incomplete patterns:
Wave (B) of the Intermediate degree inverted Flat with a rating of 102 is expected to complete in the price range 48.45 to 70.89, but more probably between 67.4 and 70.77. This wave is due to complete anytime from now until 19-Apr-2016, but is most likely to complete before 18-Feb-2016.
After wave (B) is complete, expect the market to continue up into wave (C), which should be a five wave Impulsive pattern. Expect wave (C) to retrace wave (B) by 80% - 169%. Wave (C) can also be expected to be 99% - 169% of the price length of wave (A). The expected time for wave (C) to complete is 19% - 187% of the time taken for wave (B) to complete and 56% - 268% of the time taken for wave (A) to complete.
Wave X of the Primary degree Double 3 with a rating of 89.3 is expected to complete in the price range 76.75 to 133.47, but more probably between 77.1 and 82.59. This wave is due to complete anytime from now until 04-Oct-2017, but is most likely to complete before 09-May-2016.
After wave X is complete, expect the market to continue down into wave Y, which will probably be a three wave corrective pattern. Expect wave Y to retrace wave X by 98% - 193%. Wave Y can also be expected to be 76% - 193% of the price length of wave W. The expected time for wave Y to complete is 20% - 178% of the time taken for wave X to complete and 12% - 115% of the time taken for wave W to complete.
Wave b of the Cycle degree inverted Flat with a rating of 78.8 is expected to complete in the price range 42.93 to 67.92, but more probably between 61.86 and 67.35. This wave was expected to complete before 13-Jan-2016, and must complete by 08-Feb-2017.
After wave b is complete, expect the market to continue up into wave c, which should be a five wave Impulsive pattern. Expect wave c to retrace wave b by 82% - 179%. Wave c can also be expected to be 67% - 179% of the price length of wave a. The expected time for wave c to complete is 20% - 151% of the time taken for wave b to complete and 11% - 58% of the time taken for wave a to complete.
Current Analysis Settings: Analysis Date Range: 19-Dec-2013 to 12-Feb-2016, Label Range: 15 - 50, Preferred Count Labels: 23, Min Rating: 75, Stocks toggle ON, Bias Towards Beginning of Data: 8, Bias Towards Major High/Low: 8, Largest Degree Wave Filter: Any Pattern
Rating:96.6
Current Trading Positions for SPDRs Select Sector Consumer Staples ETF (XLP) Daily on 12-Feb-2016
* A Cycle degree trader (hold positions from quarters to years), would currently be trading long in this market. The probability of this Target Area being correct is 41.2%. However, the random probability of this Target Area being correct is 24.3%. So the true probability of this Target Area being correct is 69.5% better than random.
Extensive Elliott Commentary for SPDRs Select Sector Consumer Staples ETF (XLP) Daily on 12-Feb-2016 with one incomplete pattern:
Wave y of the Cycle degree inverted Double Zigzag with a rating of 96.6 is expected to complete in the price range 56.41 to 61.58, but more probably between 56.57 and 59.64. This wave is most likely to complete sometime between 05-Apr-2016 and 27-Jan-2017 Note that it cannot complete until 14-Mar-2016 but must complete by 15-Oct-2018.
Wave y will probably complete this Double Sharp pattern, although it could possibly extend into a Triple Sharp pattern.
Current Analysis Settings: Analysis Date Range: 19-Dec-2013 to 12-Feb-2016, Label Range: 15 - 50, Preferred Count Labels: 15, Min Rating: 75, Stocks toggle ON, Bias Towards Beginning of Data: 8, Bias Towards Major High/Low: 8, Largest Degree Wave Filter: Any Pattern
Rating:85.5
Current Trading Positions for SPDRs Select Sector Energy ETF (XLE) Daily on 12-Feb-2016
* A Primary degree trader (hold positions from months to years), would currently be shorting this market. The probability of this Target Area being correct is 57.0%. However, the random probability of this Target Area being correct is 45.0%. So the true probability of this Target Area being correct is 26.7% better than random.
* A Cycle degree trader (hold positions from quarters to years), would currently be trading long in this market. The probability of this Target Area being correct is 42.5%. However, the random probability of this Target Area being correct is 34.0%. So the true probability of this Target Area being correct is 25.0% better than random.
Extensive Elliott Commentary for SPDRs Select Sector Energy ETF (XLE) Daily on 12-Feb-2016 with two incomplete patterns:
Wave B of the Primary degree inverted Zigzag with a rating of 102.3 is expected to complete in the price range 49.93 to 57.81, but more probably between 53.27 and 56.78. This wave is due to complete anytime from now until 22-Apr-2016, but is most likely to complete before 17-Feb-2016.
After wave B is complete, expect the market to continue up into wave C, which should be a five wave impulsive pattern. Expect wave C to retrace wave B by 114% - 331%. Wave C can also be expected to be 53% - 331% of the price length of wave A. The expected time for wave C to complete is 24% - 277% of the time taken for wave B to complete and 31% - 204% of the time taken for wave A to complete.
Wave b of the Cycle degree Flat with a rating of 85.5 is expected to complete in the price range 85.01 to 184.57, but more probably between 86.04 and 112.35. This wave could complete anytime between now and 22-Jul-2025, but is most likely to complete sometime between 09-Mar-2016 and 12-May-2017.
After wave b is complete, expect the market to continue down into wave c, which should be a five wave Impulsive pattern. Expect wave c to retrace wave b by 85% - 162%. Wave c can also be expected to be 90% - 162% of the price length of wave a. The expected time for wave c to complete is 20% - 136% of the time taken for wave b to complete and 20% - 110% of the time taken for wave a to complete.
Current Analysis Settings: Analysis Date Range: 12-May-2014 to 12-Feb-2016, Label Range: 15 - 50, Preferred Count Labels: 17, Min Rating: 75, Stocks toggle ON, Bias Towards Beginning of Data: 8, Bias Towards Major High/Low: 8, Largest Degree Wave Filter: Any Pattern
Rating:99.5
Current Trading Positions for SPDRs Select Sector Financial ETF (XLF) Daily on 12-Feb-2016
* A Primary degree trader (hold positions from months to years), would currently be trading long in this market. The probability of this Target Area being correct is 49.4%. However, the random probability of this Target Area being correct is 34.0%. So the true probability of this Target Area being correct is 45.3% better than random.
Extensive Elliott Commentary for SPDRs Select Sector Financial ETF (XLF) Daily on 12-Feb-2016 with one incomplete pattern:
Wave B of the Primary degree Flat with a rating of 99.5 is expected to complete in the price range 23.22 to 33.83, but more probably between 23.33 and 26.11. This wave is most likely to complete sometime between 22-Feb-2016 and 02-May-2016 Note that it cannot complete until 15-Feb-2016 but must complete by 01-Sep-2017.
After wave B is complete, expect the market to continue down into wave C, which should be a five wave Impulsive pattern. Expect wave C to retrace wave B by 86% - 162%. Wave C can also be expected to be 90% - 162% of the price length of wave A. The expected time for wave C to complete is 19% - 134% of the time taken for wave B to complete and 24% - 115% of the time taken for wave A to complete.
Current Analysis Settings: Analysis Date Range: 11-Jun-2015 to 12-Feb-2016, Label Range: 15 - 50, Preferred Count Labels: 25, Min Rating: 75, Stocks toggle ON, Bias Towards Beginning of Data: 8, Bias Towards Major High/Low: 8, Largest Degree Wave Filter: Any Pattern
Rating:83.9
Current Trading Positions for SPDRs Select Sector Health Care ETF (XLV) Daily on 12-Feb-2016
* A Cycle degree trader (hold positions from quarters to years), would currently be trading long in this market. The probability of this Target Area being correct is 41.9%. However, the random probability of this Target Area being correct is 34.0%. So the true probability of this Target Area being correct is 23.2% better than random.
Extensive Elliott Commentary for SPDRs Select Sector Health Care ETF (XLV) Daily on 12-Feb-2016 with two incomplete patterns:
Wave C of the Primary degree inverted Flat with a rating of 103.6 is expected to complete in the price range 65.91 to 84.35, but more probably between 70.2 and 78.69. This wave is most likely to complete sometime between 15-Feb-2016 and 05-Apr-2016 Note that it cannot complete until 15-Feb-2016 but must complete by 28-Oct-2016.
This wave C will complete the Flat pattern.
This is the final wave in the pattern. When complete it will also complete wave b of the Cycle degree Flat with a rating of 83.9. These two waves have the same target ranges.
After wave b is complete, expect the market to continue down into wave c, which should be a five wave Impulsive pattern. Expect wave c to retrace wave b by 86% - 162%. Wave c can also be expected to be 90% - 162% of the price length of wave a. The expected time for wave c to complete is 19% - 134% of the time taken for wave b to complete and 24% - 115% of the time taken for wave a to complete.
Current Analysis Settings: Analysis Date Range: 06-Dec-2013 to 12-Feb-2016, Label Range: 15 - 50, Preferred Count Labels: 30, Min Rating: 75, Stocks toggle ON, Bias Towards Beginning of Data: 8, Bias Towards Major High/Low: 8, Largest Degree Wave Filter: Any Pattern
Rating:93.7
Current Trading Positions for SPDRs Select Sector Industrial ETF (XLI) Daily on 12-Feb-2016
* An Intermediate degree trader (hold positions from months to quarters), would currently be shorting this market. The probability of this Target Area being correct is 71.0%. However, the random probability of this Target Area being correct is 45.0%. So the true probability of this Target Area being correct is 57.8% better than random.
Extensive Elliott Commentary for SPDRs Select Sector Industrial ETF (XLI) Daily on 12-Feb-2016 with two incomplete patterns:
Wave (2) of the Intermediate degree Impulse with a rating of 98 is expected to complete in the price range 46.82 to 50.37, but more probably between 48.61 and 50.01. This wave was expected to complete before 09-Feb-2016, and must complete by 14-Mar-2016.
After this wave (2) is complete, expect the market to continue up into wave (3). Wave (3) should always be an Impulse and should retrace wave (2) completely. Expect wave (3) to retrace wave (2) by 164% - 383%. Wave (3) can also be expected to be 83% - 383% of the price length of wave (1). The expected time for wave (3) to complete is 87% - 367% of the time taken for wave (2) to complete and 16% - 97% of the time taken for wave (1) to complete. The slope (ie. price range divided by time taken) of wave (3) should be between 70% and 219% of the slope of wave (1). Once wave (3) is complete, expect wave (4) to be a sideways corrective movement, then wave (5) to continue in the same direction as wave (3). Wave (5) will complete this Impulse.
Wave C of the Primary degree inverted Flat with a rating of 93.7 is expected to complete in the price range 48.65 to 70.59, but more probably between 53.94 and 61.95. This wave is due to complete anytime from now until 26-Jan-2017, but is most likely to complete before 04-Apr-2016.
This wave C will complete the Flat pattern.
Current Analysis Settings: Analysis Date Range: 13-Jan-2015 to 12-Feb-2016, Label Range: 15 - 50, Preferred Count Labels: 26, Min Rating: 75, Stocks toggle ON, Bias Towards Beginning of Data: 8, Bias Towards Major High/Low: 8, Largest Degree Wave Filter: Any Pattern
Rating:378.1
Current Trading Positions for SPDRs Select Sector Materials ETF (XLB) Daily on 12-Feb-2016
* A Primary degree trader (hold positions from months to years), would currently be shorting this market. The probability of this Target Area being correct is 78.1%. However, the random probability of this Target Area being correct is 64.0%. So the true probability of this Target Area being correct is 22.0% better than random.
Extensive Elliott Commentary for SPDRs Select Sector Materials ETF (XLB) Daily on 12-Feb-2016 with one incomplete pattern:
Wave D of the Primary degree inverted Contracting Triangle with a rating of 378.1 is expected to complete in the price range 36.29 to 38.7, but more probably between 36.43 and 37.97. This wave is due to complete anytime from now until 15-Mar-2016, but is most likely to complete before 22-Feb-2016.
Once this wave D is complete, expect the market to continue up to the end of wave E, which will most probably be a ZigZag family pattern or possibly a Contracting Triangle. Expect wave E to have between 39% and 66% of the price range of wave C and complete in 4% to 60% of the time taken by wave C. Expect also that wave E will have between 21% and 47% of the price range of wave A and complete in 2% to 24% of the time taken by wave A. The slope (ie. price range divided by time taken) of wave E should be between 28% and 143% of the slope of wave C and between 19% to 183% of the slope of wave A. Wave E will complete this Contracting Triangle.
Current Analysis Settings: Analysis Date Range: 13-Jan-2015 to 12-Feb-2016, Label Range: 15 - 50, Preferred Count Labels: 16, Min Rating: 75, Stocks toggle ON, Bias Towards Beginning of Data: 8, Bias Towards Major High/Low: 8, Largest Degree Wave Filter: Any Pattern
Rating:76.3
Current Trading Positions for SPDRs Select Sector Technology ETF (XLK) Daily on 12-Feb-2016
* A Minute degree trader (hold positions from weeks to months), would currently be shorting this market. The probability of this Target Area being correct is 56.0%. However, the random probability of this Target Area being correct is 45.0%. So the true probability of this Target Area being correct is 24.4% better than random.
* A Minor degree trader (hold positions from weeks to quarters), would currently be trading long in this market. The probability of this Target Area being correct is 39.5%. However, the random probability of this Target Area being correct is 24.3%. So the true probability of this Target Area being correct is 62.6% better than random.
* An Intermediate degree trader (hold positions from months to quarters), would currently be trading long in this market. The probability of this Target Area being correct is 42.2%. However, the random probability of this Target Area being correct is 34.0%. So the true probability of this Target Area being correct is 24.1% better than random.
* A Primary degree trader (hold positions from months to years), would currently be shorting this market. The probability of this Target Area being correct is 76.4%. However, the random probability of this Target Area being correct is 65.0%. So the true probability of this Target Area being correct is 17.5% better than random.
Extensive Elliott Commentary for SPDRs Select Sector Technology ETF (XLK) Daily on 12-Feb-2016 with four incomplete patterns:
Wave b of the Minute degree inverted Zigzag with a rating of 101.4 is expected to complete in the price range 38.26 to 39.42, but more probably between 38.75 and 39.27. This wave was expected to complete before 12-Feb-2016, and must complete by 23-Feb-2016.
After wave b is complete, expect the market to continue up into wave c, which should be a five wave impulsive pattern. Expect wave c to retrace wave b by 112% - 330%. Wave c can also be expected to be 52% - 330% of the price length of wave a. The expected time for wave c to complete is 24% - 275% of the time taken for wave b to complete and 31% - 204% of the time taken for wave a to complete.
Wave Y of the Minor degree inverted Double Zigzag with a rating of 89.5 is expected to complete in the price range 41.58 to 52.31, but more probably between 42.04 and 46.18. This wave is due to complete anytime from now until 03-Mar-2016, but is most likely to complete before 19-Feb-2016.
Wave Y will probably complete this Double Sharp pattern, although it could possibly extend into a Triple Sharp pattern.
This is the final wave in the pattern. When complete it will also complete wave (B) of the Intermediate degree Flat with a rating of 84.8. These two waves have the same target ranges.
After wave (B) is complete, expect the market to continue down into wave (C), which should be a five wave Impulsive pattern. Expect wave (C) to retrace wave (B) by 86% - 162%. Wave (C) can also be expected to be 90% - 162% of the price length of wave (A). The expected time for wave (C) to complete is 19% - 134% of the time taken for wave (B) to complete and 24% - 115% of the time taken for wave (A) to complete.
Wave X of the Primary degree inverted Double Zigzag with a rating of 76.3 is expected to complete in the price range 31.32 to 42.19, but more probably between 35.82 and 40.73. This wave was expected to complete before 25-Jan-2016, and must complete by 08-Aug-2016.
After wave X is complete, expect the market to continue up into wave Y, which should be a three wave Zigzag pattern. Expect wave Y to retrace wave X by 149% - 348%. Wave Y can also be expected to be 90% - 348% of the price length of wave W. The expected time for wave Y to complete is 23% - 188% of the time taken for wave X to complete and 28% - 133% of the time taken for wave W to complete.
Current Analysis Settings: Analysis Date Range: 14-Jul-2015 to 12-Feb-2016, Label Range: 15 - 50, Preferred Count Labels: 23, Min Rating: 75, Stocks toggle ON, Bias Towards Beginning of Data: 8, Bias Towards Major High/Low: 8, Largest Degree Wave Filter: Any Pattern
Rating:85
Current Trading Positions for SPDRs Select Sector Utilities ETF (XLU) Daily on 12-Feb-2016
* A Primary degree trader (hold positions from months to years), would currently be trading long in this market. The probability of this Target Area being correct is 40.4%. However, the random probability of this Target Area being correct is 34.0%. So the true probability of this Target Area being correct is 18.8% better than random.
* A Cycle degree trader (hold positions from quarters to years), would currently be shorting this market. The probability of this Target Area being correct is 42.5%. However, the random probability of this Target Area being correct is 34.0%. So the true probability of this Target Area being correct is 25.0% better than random.
Extensive Elliott Commentary for SPDRs Select Sector Utilities ETF (XLU) Daily on 12-Feb-2016 with three incomplete patterns:
Wave (C) of the Intermediate degree inverted Flat with a rating of 101.6 is expected to complete in the price range 43.01 to 49, but more probably between 44.26 and 47.39. This wave is due to complete anytime from now until 25-Nov-2016, but is most likely to complete before 29-Apr-2016.
This wave (C) will complete the Flat pattern.
This is the final wave in the pattern. When complete it will also complete wave B of the Primary degree Flat with a rating of 78.4. These two waves have the same target ranges.
After wave B is complete, expect the market to continue down into wave C, which should be a five wave Impulsive pattern. Expect wave C to retrace wave B by 89% - 167%. Wave C can also be expected to be 104% - 167% of the price length of wave A. The expected time for wave C to complete is 20% - 146% of the time taken for wave B to complete and 53% - 275% of the time taken for wave A to complete.
Wave b of the Cycle degree inverted Flat with a rating of 85 is expected to complete in the price range 24.56 to 41.29, but more probably between 37.23 and 40.91. This wave was expected to complete before 27-Aug-2015, and must complete by 10-Mar-2017.
After wave b is complete, expect the market to continue up into wave c, which should be a five wave Impulsive pattern. Expect wave c to retrace wave b by 82% - 179%. Wave c can also be expected to be 67% - 179% of the price length of wave a. The expected time for wave c to complete is 20% - 151% of the time taken for wave b to complete and 11% - 58% of the time taken for wave a to complete.
Current Analysis Settings: Analysis Date Range: 06-Dec-2013 to 12-Feb-2016, Label Range: 15 - 50, Preferred Count Labels: 25, Min Rating: 75, Stocks toggle ON, Bias Towards Beginning of Data: 8, Bias Towards Major High/Low: 8, Largest Degree Wave Filter: Any Pattern
Rating:88.2
Current Trading Positions for Sprott Physical Silver Trust (PSLV) Daily on 12-Feb-2016
* A Primary degree trader (hold positions from months to years), would currently be trading long in this market. The probability of this Target Area being correct is 87.3%. However, the random probability of this Target Area being correct is 64.1%. So the true probability of this Target Area being correct is 36.2% better than random.
* A Cycle degree trader (hold positions from quarters to years), would currently be trading long in this market. The probability of this Target Area being correct is 43.4%. However, the random probability of this Target Area being correct is 34.0%. So the true probability of this Target Area being correct is 27.6% better than random.
Extensive Elliott Commentary for Sprott Physical Silver Trust (PSLV) Daily on 12-Feb-2016 with two incomplete patterns:
Wave Y of the Primary degree inverted Double 3 with a rating of 103.4 is expected to complete in the price range 5.54 to 8.91, but more probably between 6.01 and 7.22. This wave is due to complete anytime from now until 08-Jun-2016, but is most likely to complete before 21-Mar-2016.
Wave Y will probably complete this Double Sideways pattern, although it could possibly extend into a Triple Sideways pattern.
This is the final wave in the pattern. When complete it will also complete wave b of the Cycle degree Flat with a rating of 88.2. These two waves have the same target ranges.
After wave b is complete, expect the market to continue down into wave c, which should be a five wave Impulsive pattern. Expect wave c to retrace wave b by 86% - 162%. Wave c can also be expected to be 90% - 162% of the price length of wave a. The expected time for wave c to complete is 19% - 134% of the time taken for wave b to complete and 24% - 115% of the time taken for wave a to complete.
Current Analysis Settings: Analysis Date Range: 10-Jan-2014 to 12-Feb-2016, Label Range: 15 - 50, Preferred Count Labels: 22, Min Rating: 75, Stocks toggle ON, Bias Towards Beginning of Data: 8, Bias Towards Major High/Low: 8, Largest Degree Wave Filter: Any Pattern
Rating:105.5
Current Trading Positions for Tekla World Healthcare Fund (THW) Daily on 12-Feb-2016
* An Intermediate degree trader (hold positions from months to quarters), would currently be shorting this market. The probability of this Target Area being correct is 50.5%. However, the random probability of this Target Area being correct is 34.0%. So the true probability of this Target Area being correct is 48.5% better than random.
Extensive Elliott Commentary for Tekla World Healthcare Fund (THW) Daily on 12-Feb-2016 with one incomplete pattern:
Wave (B) of the Intermediate degree inverted Flat with a rating of 105.5 is expected to complete in the price range 8.42 to 13, but more probably between 12.29 and 12.98. This wave is due to complete anytime from now until 19-Apr-2016, but is most likely to complete before 18-Feb-2016.
After wave (B) is complete, expect the market to continue up into wave (C), which should be a five wave Impulsive pattern. Expect wave (C) to retrace wave (B) by 80% - 169%. Wave (C) can also be expected to be 99% - 169% of the price length of wave (A). The expected time for wave (C) to complete is 19% - 187% of the time taken for wave (B) to complete and 56% - 268% of the time taken for wave (A) to complete.
Current Analysis Settings: Analysis Date Range: 16-Jul-2015 to 12-Feb-2016, Label Range: 15 - 50, Preferred Count Labels: 37, Min Rating: 75, Stocks toggle ON, Bias Towards Beginning of Data: 8, Bias Towards Major High/Low: 8, Largest Degree Wave Filter: Any Pattern
Rating:81.2
Current Trading Positions for Ubs Ag 2Xleveraged Lg Exch (MLPL) Daily on 12-Feb-2016
* A Primary degree trader (hold positions from months to years), would currently be trading long in this market. The probability of this Target Area being correct is 51.4%. However, the random probability of this Target Area being correct is 45.0%. So the true probability of this Target Area being correct is 14.2% better than random.
* A Cycle degree trader (hold positions from quarters to years), would currently be shorting this market. The probability of this Target Area being correct is 35.5%. However, the random probability of this Target Area being correct is 24.3%. So the true probability of this Target Area being correct is 46.1% better than random.
Extensive Elliott Commentary for Ubs Ag 2Xleveraged Lg Exch (MLPL) Daily on 12-Feb-2016 with three incomplete patterns:
Wave (C) of the Intermediate degree inverted Flat with a rating of 94.9 is expected to complete in the price range 14.69 to 32.59, but more probably between 17.84 and 27.99. This wave is due to complete anytime from now until 27-Apr-2016, but is most likely to complete before 29-Feb-2016.
This wave (C) will complete the Flat pattern.
This is the final wave in the pattern. When complete it will also complete wave B of the Primary degree Zigzag with a rating of 82.9. These two waves have the same target ranges.
After wave B is complete, expect the market to continue down into wave C, which should be a five wave impulsive pattern. Expect wave C to retrace wave B by 127% - 277%. Wave C can also be expected to be 43% - 277% of the price length of wave A. The expected time for wave C to complete is 19% - 191% of the time taken for wave B to complete and 55% - 222% of the time taken for wave A to complete.
Wave y of the Cycle degree Double Zigzag with a rating of 81.2 is expected to complete at a price no higher than 11.46, but more probably between 2.33 and 11.14. This wave was expected to complete before 22-Jan-2016, and must complete by 11-Apr-2016.
Wave y will probably complete this Double Sharp pattern, although it could possibly extend into a Triple Sharp pattern.
Current Analysis Settings: Analysis Date Range: 22-Jul-2014 to 12-Feb-2016, Label Range: 15 - 50, Preferred Count Labels: 28, Min Rating: 75, Stocks toggle ON, Bias Towards Beginning of Data: 8, Bias Towards Major High/Low: 8, Largest Degree Wave Filter: Any Pattern
Rating:88
Current Trading Positions for United States Oil Fund LP (USO) Daily on 12-Feb-2016
* A Minor degree trader (hold positions from weeks to quarters), would currently be shorting this market. The probability of this Target Area being correct is 47.6%. However, the random probability of this Target Area being correct is 34.0%. So the true probability of this Target Area being correct is 40.0% better than random.
* An Intermediate degree trader (hold positions from months to quarters), would currently be trading long in this market. The probability of this Target Area being correct is 55.7%. However, the random probability of this Target Area being correct is 53.0%. So the true probability of this Target Area being correct is 5.1% better than random.
* A Primary degree trader (hold positions from months to years), would currently be shorting this market. The probability of this Target Area being correct is 43.7%. However, the random probability of this Target Area being correct is 34.0%. So the true probability of this Target Area being correct is 28.5% better than random.
Extensive Elliott Commentary for United States Oil Fund LP (USO) Daily on 12-Feb-2016 with four incomplete patterns:
Wave B of the Minor degree inverted Flat with a rating of 96.3 is expected to complete in the price range 4.67 to 8.9, but more probably between 8.22 and 8.87. This wave was expected to complete before 08-Feb-2016, and must complete by 15-Feb-2016.
After wave B is complete, expect the market to continue up into wave C, which should be a five wave Impulsive pattern. Expect wave C to retrace wave B by 83% - 173%. Wave C can also be expected to be 101% - 173% of the price length of wave A. The expected time for wave C to complete is 20% - 190% of the time taken for wave B to complete and 57% - 279% of the time taken for wave A to complete.
Wave (X) of the Intermediate degree Double 3 with a rating of 87.6 is expected to complete in the price range 9.14 to 15.06, but more probably between 9.47 and 10.09. This wave was expected to complete before 11-Feb-2016, and must complete by 01-Mar-2016.
After wave (X) is complete, expect the market to continue down into wave (Y), which will probably be a three wave corrective pattern. Expect wave (Y) to retrace wave (X) by 98% - 183%. Wave (Y) can also be expected to be 81% - 183% of the price length of wave (W). The expected time for wave (Y) to complete is 40% - 187% of the time taken for wave (X) to complete and 100% - 304% of the time taken for wave (W) to complete.
Wave B of the Primary degree inverted Flat with a rating of 89.9 is expected to complete in the price range 1.13 to 8.56, but more probably between 7.41 and 8.52. This wave is due to complete anytime from now until 08-Apr-2016, but is most likely to complete before 15-Feb-2016.
After wave B is complete, expect the market to continue up into wave C, which should be a five wave Impulsive pattern. Expect wave C to retrace wave B by 80% - 169%. Wave C can also be expected to be 99% - 169% of the price length of wave A. The expected time for wave C to complete is 19% - 187% of the time taken for wave B to complete and 56% - 268% of the time taken for wave A to complete.
Wave IV of the Cycle degree inverted Impulse with a rating of 88 is expected to complete in the price range 7.98 to 12.37, but more probably between 8.39 and 12.07. This wave is due to complete anytime from now until 21-Apr-2016, but is most likely to complete before 29-Feb-2016.
Once this wave IV is complete, expect the market to continue down to the end of wave V, which will most probably be an Impulse but could be an Ending Diagonal. Wave V will usually move beyond the end of wave III. Expect wave V to have between 48% and 103% of the price range of wave III and complete in 15% to 75% of the time taken by wave III. Expect also that wave V will have between 62% and 180% of the price range of wave I and complete in 8% to 49% of the time taken by wave I. The slope (ie. price range divided by time taken) of wave V should be between 48% and 200% of the slope of wave III and between 29% to 297% of the slope of wave I. Wave V will complete the Impulse.
Current Analysis Settings: Analysis Date Range: 09-May-2014 to 12-Feb-2016, Label Range: 15 - 50, Preferred Count Labels: 15, Min Rating: 75, Stocks toggle ON, Bias Towards Beginning of Data: 8, Bias Towards Major High/Low: 8, Largest Degree Wave Filter: Any Pattern
Rating:80.9
Current Trading Positions for US Nat Gas FD ETF (UNG) Daily on 12-Feb-2016
* A Primary degree trader (hold positions from months to years), would currently be trading long in this market. The probability of this Target Area being correct is 87.4%. However, the random probability of this Target Area being correct is 64.1%. So the true probability of this Target Area being correct is 36.3% better than random.
* A Cycle degree trader (hold positions from quarters to years), would currently be trading long in this market. The probability of this Target Area being correct is 78.0%. However, the random probability of this Target Area being correct is 65.0%. So the true probability of this Target Area being correct is 20.0% better than random.
Extensive Elliott Commentary for US Nat Gas FD ETF (UNG) Daily on 12-Feb-2016 with two incomplete patterns:
Wave Y of the Primary degree inverted Double 3 with a rating of 104 is expected to complete in the price range 7.35 to 17.5, but more probably between 9.06 and 11.87. This wave is due to complete anytime from now until 11-Apr-2016, but is most likely to complete before 10-Mar-2016.
Wave Y will probably complete this Double Sideways pattern, although it could possibly extend into a Triple Sideways pattern.
This is the final wave in the pattern. When complete it will also complete wave x of the Cycle degree Double Zigzag with a rating of 80.9. These two waves have the same target ranges.
After wave x is complete, expect the market to continue down into wave y, which should be a three wave Zigzag pattern. Expect wave y to retrace wave x by 116% - 261%. Wave y can also be expected to be 90% - 261% of the price length of wave w. The expected time for wave y to complete is 21% - 160% of the time taken for wave x to complete and 25% - 152% of the time taken for wave w to complete.
Current Analysis Settings: Analysis Date Range: 10-Jan-2014 to 12-Feb-2016, Label Range: 15 - 50, Preferred Count Labels: 26, Min Rating: 75, Stocks toggle ON, Bias Towards Beginning of Data: 8, Bias Towards Major High/Low: 8, Largest Degree Wave Filter: Any Pattern
Rating:92.3
Current Trading Positions for Vanguard Consumer Disc Etf (VCR) Daily on 12-Feb-2016
* A Cycle degree trader (hold positions from quarters to years), would currently be shorting this market. The probability of this Target Area being correct is 53.7%. However, the random probability of this Target Area being correct is 45.0%. So the true probability of this Target Area being correct is 19.3% better than random.
Extensive Elliott Commentary for Vanguard Consumer Disc Etf (VCR) Daily on 12-Feb-2016 with one incomplete pattern:
Wave c of the Cycle degree Zigzag with a rating of 92.3 is expected to complete in the price range 34.69 to 101.8, but more probably between 76.32 and 98.68. This wave is most likely to complete sometime between 22-Feb-2016 and 18-Apr-2016 Note that it cannot complete until 19-Feb-2016 but must complete by 02-Jun-2016.
This wave c will complete the ZigZag pattern.
Current Analysis Settings: Analysis Date Range: 23-Dec-2013 to 12-Feb-2016, Label Range: 15 - 50, Preferred Count Labels: 31, Min Rating: 75, Stocks toggle ON, Bias Towards Beginning of Data: 8, Bias Towards Major High/Low: 8, Largest Degree Wave Filter: Any Pattern
Rating:276
Current Trading Positions for Vanguard Consumer Staples Etf (VDC) Daily on 12-Feb-2016
* A Primary degree trader (hold positions from months to years), would currently be shorting this market. The probability of this Target Area being correct is 78.1%. However, the random probability of this Target Area being correct is 64.0%. So the true probability of this Target Area being correct is 22.0% better than random.
Extensive Elliott Commentary for Vanguard Consumer Staples Etf (VDC) Daily on 12-Feb-2016 with one incomplete pattern:
Wave D of the Primary degree inverted Contracting Triangle with a rating of 276 is expected to complete in the price range 120.33 to 125.29, but more probably between 121.7 and 124.61. This wave is due to complete anytime from now until 02-Mar-2016, but is most likely to complete before 18-Feb-2016.
Once this wave D is complete, expect the market to continue up to the end of wave E, which will most probably be a ZigZag family pattern or possibly a Contracting Triangle. Expect wave E to have between 39% and 66% of the price range of wave C and complete in 4% to 60% of the time taken by wave C. Expect also that wave E will have between 21% and 47% of the price range of wave A and complete in 2% to 24% of the time taken by wave A. The slope (ie. price range divided by time taken) of wave E should be between 28% and 143% of the slope of wave C and between 19% to 183% of the slope of wave A. Wave E will complete this Contracting Triangle.
Current Analysis Settings: Analysis Date Range: 25-Jun-2015 to 12-Feb-2016, Label Range: 15 - 50, Preferred Count Labels: 18, Min Rating: 75, Stocks toggle ON, Bias Towards Beginning of Data: 8, Bias Towards Major High/Low: 8, Largest Degree Wave Filter: Any Pattern
Rating:90.6
Current Trading Positions for Vanguard Dividend Appreciation ETF (VIG) Daily on 12-Feb-2016
* An Intermediate degree trader (hold positions from months to quarters), would currently be shorting this market. The probability of this Target Area being correct is 55.0%. However, the random probability of this Target Area being correct is 45.0%. So the true probability of this Target Area being correct is 22.2% better than random.
* A Primary degree trader (hold positions from months to years), would currently be trading long in this market. The probability of this Target Area being correct is 44.0%. However, the random probability of this Target Area being correct is 34.0%. So the true probability of this Target Area being correct is 29.4% better than random.
Extensive Elliott Commentary for Vanguard Dividend Appreciation ETF (VIG) Daily on 12-Feb-2016 with two incomplete patterns:
Wave (B) of the Intermediate degree inverted Zigzag with a rating of 100.3 is expected to complete in the price range 70.54 to 75.83, but more probably between 72.78 and 75.14. This wave was expected to complete before 11-Feb-2016, and must complete by 30-Mar-2016.
After wave (B) is complete, expect the market to continue up into wave (C), which should be a five wave impulsive pattern. Expect wave (C) to retrace wave (B) by 114% - 331%. Wave (C) can also be expected to be 53% - 331% of the price length of wave (A). The expected time for wave (C) to complete is 24% - 277% of the time taken for wave (B) to complete and 31% - 204% of the time taken for wave (A) to complete.
Wave B of the Primary degree Flat with a rating of 90.6 is expected to complete in the price range 76.89 to 95.13, but more probably between 77.08 and 81.85. This wave is due to complete anytime from now until 17-Apr-2017, but is most likely to complete before 30-Mar-2016.
After wave B is complete, expect the market to continue down into wave C, which should be a five wave Impulsive pattern. Expect wave C to retrace wave B by 86% - 162%. Wave C can also be expected to be 90% - 162% of the price length of wave A. The expected time for wave C to complete is 19% - 134% of the time taken for wave B to complete and 24% - 115% of the time taken for wave A to complete.
Current Analysis Settings: Analysis Date Range: 16-Jan-2015 to 12-Feb-2016, Label Range: 15 - 50, Preferred Count Labels: 21, Min Rating: 75, Stocks toggle ON, Bias Towards Beginning of Data: 8, Bias Towards Major High/Low: 8, Largest Degree Wave Filter: Any Pattern
Rating:82.7
Current Trading Positions for Vanguard Europe Pacific Etf (VEA) Daily on 12-Feb-2016
* A Primary degree trader (hold positions from months to years), would currently be shorting this market. The probability of this Target Area being correct is 65.1%. However, the random probability of this Target Area being correct is 45.0%. So the true probability of this Target Area being correct is 44.7% better than random.
* A Cycle degree trader (hold positions from quarters to years), would currently be shorting this market. The probability of this Target Area being correct is 36.0%. However, the random probability of this Target Area being correct is 24.3%. So the true probability of this Target Area being correct is 48.1% better than random.
Extensive Elliott Commentary for Vanguard Europe Pacific Etf (VEA) Daily on 12-Feb-2016 with two incomplete patterns:
Wave C of the Primary degree Zigzag with a rating of 103.1 is expected to complete in the price range 22.15 to 32.65, but more probably between 28.98 and 32.46. This wave is due to complete anytime from now until 18-Apr-2016, but is most likely to complete before 14-Mar-2016.
This wave C will complete the ZigZag pattern.
This is the final wave in the pattern. When complete it will also complete wave y of the Cycle degree Double Zigzag with a rating of 82.7. These two waves have the same target ranges.
Wave y will probably complete this Double Sharp pattern, although it could possibly extend into a Triple Sharp pattern.
Current Analysis Settings: Analysis Date Range: 08-May-2014 to 12-Feb-2016, Label Range: 15 - 50, Preferred Count Labels: 20, Min Rating: 75, Stocks toggle ON, Bias Towards Beginning of Data: 8, Bias Towards Major High/Low: 8, Largest Degree Wave Filter: Any Pattern
Rating:87.4
Current Trading Positions for Vanguard European Etf (VGK) Daily on 12-Feb-2016
* A Primary degree trader (hold positions from months to years), would currently be shorting this market. The probability of this Target Area being correct is 64.9%. However, the random probability of this Target Area being correct is 45.0%. So the true probability of this Target Area being correct is 44.2% better than random.
* A Cycle degree trader (hold positions from quarters to years), would currently be shorting this market. The probability of this Target Area being correct is 38.5%. However, the random probability of this Target Area being correct is 24.3%. So the true probability of this Target Area being correct is 58.4% better than random.
Extensive Elliott Commentary for Vanguard European Etf (VGK) Daily on 12-Feb-2016 with two incomplete patterns:
Wave C of the Primary degree Zigzag with a rating of 102.9 is expected to complete in the price range 30.13 to 44.37, but more probably between 39.31 and 44.09. This wave is due to complete anytime from now until 18-Apr-2016, but is most likely to complete before 14-Mar-2016.
This wave C will complete the ZigZag pattern.
This is the final wave in the pattern. When complete it will also complete wave y of the Cycle degree Double Zigzag with a rating of 87.4. These two waves have the same target ranges.
Wave y will probably complete this Double Sharp pattern, although it could possibly extend into a Triple Sharp pattern.
Current Analysis Settings: Analysis Date Range: 08-May-2014 to 12-Feb-2016, Label Range: 15 - 50, Preferred Count Labels: 18, Min Rating: 75, Stocks toggle ON, Bias Towards Beginning of Data: 8, Bias Towards Major High/Low: 8, Largest Degree Wave Filter: Any Pattern
Rating:75
Current Trading Positions for Vanguard FTSE All World EX-US ETF (VEU) Daily on 12-Feb-2016
* An Intermediate degree trader (hold positions from months to quarters), would currently be shorting this market. The probability of this Target Area being correct is 70.5%. However, the random probability of this Target Area being correct is 45.0%. So the true probability of this Target Area being correct is 56.7% better than random.
* A Cycle degree trader (hold positions from quarters to years), would currently be trading long in this market. The probability of this Target Area being correct is 39.5%. However, the random probability of this Target Area being correct is 34.0%. So the true probability of this Target Area being correct is 16.2% better than random.
Extensive Elliott Commentary for Vanguard FTSE All World EX-US ETF (VEU) Daily on 12-Feb-2016 with three incomplete patterns:
Wave (2) of the Intermediate degree Impulse with a rating of 94.6 is expected to complete in the price range 37.8 to 40.58, but more probably between 39.2 and 40.29. This wave was expected to complete before 02-Feb-2016, and must complete by 25-Feb-2016.
After this wave (2) is complete, expect the market to continue up into wave (3). Wave (3) should always be an Impulse and should retrace wave (2) completely. Expect wave (3) to retrace wave (2) by 164% - 383%. Wave (3) can also be expected to be 83% - 383% of the price length of wave (1). The expected time for wave (3) to complete is 87% - 367% of the time taken for wave (2) to complete and 16% - 97% of the time taken for wave (1) to complete. The slope (ie. price range divided by time taken) of wave (3) should be between 70% and 219% of the slope of wave (1). Once wave (3) is complete, expect wave (4) to be a sideways corrective movement, then wave (5) to continue in the same direction as wave (3). Wave (5) will complete this Impulse.
Wave C of the Primary degree inverted Flat with a rating of 83.1 is expected to complete in the price range 41.61 to 52.3, but more probably between 43.5 and 49.56. This wave is due to complete anytime from now until 03-Jan-2017, but is most likely to complete before 07-Apr-2016.
This wave C will complete the Flat pattern.
This is the final wave in the pattern. When complete it will also complete wave b of the Cycle degree Flat with a rating of 75. These two waves have the same target ranges.
After wave b is complete, expect the market to continue down into wave c, which should be a five wave Impulsive pattern. Expect wave c to retrace wave b by 85% - 162%. Wave c can also be expected to be 90% - 162% of the price length of wave a. The expected time for wave c to complete is 20% - 136% of the time taken for wave b to complete and 20% - 110% of the time taken for wave a to complete.
Current Analysis Settings: Analysis Date Range: 08-May-2014 to 12-Feb-2016, Label Range: 15 - 50, Preferred Count Labels: 22, Min Rating: 75, Stocks toggle ON, Bias Towards Beginning of Data: 8, Bias Towards Major High/Low: 8, Largest Degree Wave Filter: Any Pattern
Rating:88.4
Current Trading Positions for Vanguard Growth Etf (VUG) Daily on 12-Feb-2016
* A Primary degree trader (hold positions from months to years), would currently be shorting this market. The probability of this Target Area being correct is 50.2%. However, the random probability of this Target Area being correct is 34.0%. So the true probability of this Target Area being correct is 47.6% better than random.
* A Cycle degree trader (hold positions from quarters to years), would currently be trading long in this market. The probability of this Target Area being correct is 85.8%. However, the random probability of this Target Area being correct is 64.1%. So the true probability of this Target Area being correct is 33.9% better than random.
Extensive Elliott Commentary for Vanguard Growth Etf (VUG) Daily on 12-Feb-2016 with two incomplete patterns:
Wave B of the Primary degree inverted Flat with a rating of 102.7 is expected to complete in the price range 69.08 to 95.95, but more probably between 91.77 and 95.81. This wave is due to complete anytime from now until 19-Apr-2016, but is most likely to complete before 18-Feb-2016.
After wave B is complete, expect the market to continue up into wave C, which should be a five wave Impulsive pattern. Expect wave C to retrace wave B by 80% - 169%. Wave C can also be expected to be 99% - 169% of the price length of wave A. The expected time for wave C to complete is 19% - 187% of the time taken for wave B to complete and 56% - 268% of the time taken for wave A to complete.
Wave y of the Cycle degree inverted Double 3 with a rating of 88.4 is expected to complete in the price range 96.01 to 180.91, but more probably between 102.79 and 131.87. This wave is most likely to complete sometime between 07-Mar-2016 and 28-Oct-2016 Note that it cannot complete until 22-Feb-2016 but must complete by 20-Oct-2017.
Wave y will probably complete this Double Sideways pattern, although it could possibly extend into a Triple Sideways pattern.
Current Analysis Settings: Analysis Date Range: 19-Dec-2013 to 12-Feb-2016, Label Range: 15 - 50, Preferred Count Labels: 15, Min Rating: 75, Stocks toggle ON, Bias Towards Beginning of Data: 8, Bias Towards Major High/Low: 8, Largest Degree Wave Filter: Any Pattern
Rating:83.7
Current Trading Positions for Vanguard Health Care Etf (VHT) Daily on 12-Feb-2016
* A Minor degree trader (hold positions from weeks to quarters), would currently be shorting this market. The probability of this Target Area being correct is 48.8%. However, the random probability of this Target Area being correct is 34.0%. So the true probability of this Target Area being correct is 43.5% better than random.
* An Intermediate degree trader (hold positions from months to quarters), would currently be trading long in this market. The probability of this Target Area being correct is 86.2%. However, the random probability of this Target Area being correct is 65.0%. So the true probability of this Target Area being correct is 32.6% better than random.
* A Primary degree trader (hold positions from months to years), would currently be shorting this market. The probability of this Target Area being correct is 41.9%. However, the random probability of this Target Area being correct is 34.0%. So the true probability of this Target Area being correct is 23.2% better than random.
Extensive Elliott Commentary for Vanguard Health Care Etf (VHT) Daily on 12-Feb-2016 with three incomplete patterns:
Wave B of the Minor degree inverted Flat with a rating of 98.2 is expected to complete in the price range 95.58 to 119.81, but more probably between 115.93 and 119.62. This wave was expected to complete before 10-Feb-2016, and must complete by 18-Mar-2016.
After wave B is complete, expect the market to continue up into wave C, which should be a five wave Impulsive pattern. Expect wave C to retrace wave B by 83% - 173%. Wave C can also be expected to be 101% - 173% of the price length of wave A. The expected time for wave C to complete is 20% - 190% of the time taken for wave B to complete and 57% - 279% of the time taken for wave A to complete.
Wave (X) of the Intermediate degree Double Zigzag with a rating of 97.8 is expected to complete in the price range 121 to 135, but more probably between 124.11 and 131.19. This wave is due to complete anytime from now until 05-Apr-2016, but is most likely to complete before 19-Feb-2016.
After wave (X) is complete, expect the market to continue down into wave (Y), which should be a three wave Zigzag pattern. Expect wave (Y) to retrace wave (X) by 115% - 269%. Wave (Y) can also be expected to be 90% - 269% of the price length of wave (W). The expected time for wave (Y) to complete is 22% - 147% of the time taken for wave (X) to complete and 53% - 204% of the time taken for wave (W) to complete.
Wave B of the Primary degree inverted Flat with a rating of 83.7 is expected to complete in the price range 96.52 to 123.54, but more probably between 116.01 and 123.2. This wave is due to complete anytime from now until 27-Mar-2017, but is most likely to complete before 16-Mar-2016.
After wave B is complete, expect the market to continue up into wave C, which should be a five wave Impulsive pattern. Expect wave C to retrace wave B by 82% - 177%. Wave C can also be expected to be 89% - 177% of the price length of wave A. The expected time for wave C to complete is 15% - 160% of the time taken for wave B to complete and 16% - 118% of the time taken for wave A to complete.
Current Analysis Settings: Analysis Date Range: 09-Jun-2015 to 12-Feb-2016, Label Range: 15 - 50, Preferred Count Labels: 17, Min Rating: 75, Stocks toggle ON, Bias Towards Beginning of Data: 8, Bias Towards Major High/Low: 8, Largest Degree Wave Filter: Any Pattern
Rating:98
Current Trading Positions for Vanguard High Div Yld Etf (VYM) Daily on 12-Feb-2016
* A Primary degree trader (hold positions from months to years), would currently be shorting this market. The probability of this Target Area being correct is 48.2%. However, the random probability of this Target Area being correct is 34.0%. So the true probability of this Target Area being correct is 41.8% better than random.
Extensive Elliott Commentary for Vanguard High Div Yld Etf (VYM) Daily on 12-Feb-2016 with one incomplete pattern:
Wave B of the Primary degree inverted Flat with a rating of 98 is expected to complete in the price range 56.5 to 62.46, but more probably between 60.8 and 62.38. This wave could complete anytime between now and 16-Feb-2018, but is most likely to complete sometime between 19-Feb-2016 and 23-May-2016.
After wave B is complete, expect the market to continue up into wave C, which should be a five wave Impulsive pattern. Expect wave C to retrace wave B by 82% - 177%. Wave C can also be expected to be 89% - 177% of the price length of wave A. The expected time for wave C to complete is 15% - 160% of the time taken for wave B to complete and 16% - 118% of the time taken for wave A to complete.
Current Analysis Settings: Analysis Date Range: 09-Apr-2015 to 12-Feb-2016, Label Range: 15 - 50, Preferred Count Labels: 19, Min Rating: 75, Stocks toggle ON, Bias Towards Beginning of Data: 8, Bias Towards Major High/Low: 8, Largest Degree Wave Filter: Any Pattern
Rating:97.3
Current Trading Positions for Vanguard Industrials Etf (VIS) Daily on 12-Feb-2016
* A Primary degree trader (hold positions from months to years), would currently be shorting this market. The probability of this Target Area being correct is 48.2%. However, the random probability of this Target Area being correct is 34.0%. So the true probability of this Target Area being correct is 41.8% better than random.
Extensive Elliott Commentary for Vanguard Industrials Etf (VIS) Daily on 12-Feb-2016 with one incomplete pattern:
Wave B of the Primary degree inverted Flat with a rating of 97.3 is expected to complete in the price range 68.98 to 87.86, but more probably between 82.6 and 87.62. This wave could complete anytime between now and 26-Mar-2018, but is most likely to complete sometime between 24-Feb-2016 and 30-May-2016.
After wave B is complete, expect the market to continue up into wave C, which should be a five wave Impulsive pattern. Expect wave C to retrace wave B by 82% - 177%. Wave C can also be expected to be 89% - 177% of the price length of wave A. The expected time for wave C to complete is 15% - 160% of the time taken for wave B to complete and 16% - 118% of the time taken for wave A to complete.
Current Analysis Settings: Analysis Date Range: 13-Jan-2015 to 12-Feb-2016, Label Range: 15 - 50, Preferred Count Labels: 16, Min Rating: 75, Stocks toggle ON, Bias Towards Beginning of Data: 8, Bias Towards Major High/Low: 8, Largest Degree Wave Filter: Any Pattern
Rating:78.2
Current Trading Positions for Vanguard Information Tech Etf (VGT) Daily on 12-Feb-2016
* A Minute degree trader (hold positions from weeks to months), would currently be trading long in this market. The probability of this Target Area being correct is 63.2%. However, the random probability of this Target Area being correct is 45.0%. So the true probability of this Target Area being correct is 40.4% better than random.
* A Minor degree trader (hold positions from weeks to quarters), would currently be trading long in this market. The probability of this Target Area being correct is 55.6%. However, the random probability of this Target Area being correct is 53.0%. So the true probability of this Target Area being correct is 4.9% better than random.
* An Intermediate degree trader (hold positions from months to quarters), would currently be shorting this market. The probability of this Target Area being correct is 77.6%. However, the random probability of this Target Area being correct is 65.0%. So the true probability of this Target Area being correct is 19.4% better than random.
* A Primary degree trader (hold positions from months to years), would currently be trading long in this market. The probability of this Target Area being correct is 40.4%. However, the random probability of this Target Area being correct is 34.0%. So the true probability of this Target Area being correct is 18.8% better than random.
Extensive Elliott Commentary for Vanguard Information Tech Etf (VGT) Daily on 12-Feb-2016 with four incomplete patterns:
Wave c of the Minute degree inverted Zigzag with a rating of 100 is expected to complete in the price range 96.13 to 107.94, but more probably between 96.53 and 101.37. This wave is due to complete anytime from now until 19-Feb-2016, but is most likely to complete before 15-Feb-2016.
This wave c will complete the ZigZag pattern.
This is the final wave in the pattern. When complete it will also complete wave X of the Minor degree Double 3 with a rating of 85.8. These two waves have the same target ranges.
After wave X is complete, expect the market to continue down into wave Y, which will probably be a three wave corrective pattern. Expect wave Y to retrace wave X by 98% - 183%. Wave Y can also be expected to be 81% - 183% of the price length of wave W. The expected time for wave Y to complete is 40% - 187% of the time taken for wave X to complete and 100% - 304% of the time taken for wave W to complete.
Wave (X) of the Intermediate degree inverted Double Zigzag with a rating of 79.5 is expected to complete in the price range 94.31 to 101.12, but more probably between 96.55 and 99.87. This wave is due to complete anytime from now until 14-Mar-2016, but is most likely to complete before 16-Feb-2016.
After wave (X) is complete, expect the market to continue up into wave (Y), which should be a three wave Zigzag pattern. Expect wave (Y) to retrace wave (X) by 128% - 319%. Wave (Y) can also be expected to be 90% - 319% of the price length of wave (W). The expected time for wave (Y) to complete is 23% - 167% of the time taken for wave (X) to complete and 47% - 204% of the time taken for wave (W) to complete.
Wave B of the Primary degree Flat with a rating of 78.2 is expected to complete in the price range 107.23 to 144.3, but more probably between 107.61 and 117.31. This wave is due to complete anytime from now until 01-Nov-2016, but is most likely to complete before 07-Mar-2016.
After wave B is complete, expect the market to continue down into wave C, which should be a five wave Impulsive pattern. Expect wave C to retrace wave B by 86% - 162%. Wave C can also be expected to be 90% - 162% of the price length of wave A. The expected time for wave C to complete is 19% - 134% of the time taken for wave B to complete and 24% - 115% of the time taken for wave A to complete.
Current Analysis Settings: Analysis Date Range: 14-Jul-2015 to 12-Feb-2016, Label Range: 15 - 50, Preferred Count Labels: 34, Min Rating: 75, Stocks toggle ON, Bias Towards Beginning of Data: 8, Bias Towards Major High/Low: 8, Largest Degree Wave Filter: Any Pattern
Rating:84.2
Current Trading Positions for Vanguard Intermediate Term Bond ETF (BIV) Daily on 12-Feb-2016
* A Primary degree trader (hold positions from months to years), would currently be shorting this market. The probability of this Target Area being correct is 68.2%. However, the random probability of this Target Area being correct is 53.0%. So the true probability of this Target Area being correct is 28.7% better than random.
* A Cycle degree trader (hold positions from quarters to years), would currently be trading long in this market. The probability of this Target Area being correct is 43.7%. However, the random probability of this Target Area being correct is 34.0%. So the true probability of this Target Area being correct is 28.5% better than random.
* A Supercycle degree trader (buy and hold for years), would currently be shorting this market. The probability of this Target Area being correct is 42.2%. However, the random probability of this Target Area being correct is 34.0%. So the true probability of this Target Area being correct is 24.1% better than random.
Extensive Elliott Commentary for Vanguard Intermediate Term Bond ETF (BIV) Daily on 12-Feb-2016 with three incomplete patterns:
Wave X of the Primary degree inverted Double 3 with a rating of 105.9 is expected to complete in the price range 73.89 to 84.07, but more probably between 83.09 and 83.99. This wave is most likely to complete sometime between 10-Mar-2016 and 06-Jul-2016 Note that it cannot complete until 19-Feb-2016 but must complete by 13-Aug-2018.
After wave X is complete, expect the market to continue up into wave Y, which will probably be a three wave corrective pattern. Expect wave Y to retrace wave X by 98% - 227%. Wave Y can also be expected to be 71% - 227% of the price length of wave W. The expected time for wave Y to complete is 28% - 231% of the time taken for wave X to complete and 16% - 135% of the time taken for wave W to complete.
Wave b of the Cycle degree Flat with a rating of 89.2 is expected to complete in the price range 86 to 94.06, but more probably between 86.09 and 88.19. This wave was expected to complete before 18-Nov-2015, and must complete by 20-Oct-2017.
After wave b is complete, expect the market to continue down into wave c, which should be a five wave Impulsive pattern. Expect wave c to retrace wave b by 86% - 162%. Wave c can also be expected to be 90% - 162% of the price length of wave a. The expected time for wave c to complete is 19% - 134% of the time taken for wave b to complete and 24% - 115% of the time taken for wave a to complete.
Wave (b) of the Supercycle degree inverted Flat with a rating of 84.2 is expected to complete in the price range 75.98 to 83.51, but more probably between 81.68 and 83.34. This wave was expected to complete before 02-Sep-2015, and must complete by 23-Mar-2017.
After wave (b) is complete, expect the market to continue up into wave (c), which should be a five wave Impulsive pattern. Expect wave (c) to retrace wave (b) by 82% - 179%. Wave (c) can also be expected to be 67% - 179% of the price length of wave (a). The expected time for wave (c) to complete is 20% - 151% of the time taken for wave (b) to complete and 11% - 58% of the time taken for wave (a) to complete.
Current Analysis Settings: Analysis Date Range: 06-Dec-2013 to 12-Feb-2016, Label Range: 15 - 50, Preferred Count Labels: 45, Min Rating: 75, Stocks toggle ON, Bias Towards Beginning of Data: 8, Bias Towards Major High/Low: 8, Largest Degree Wave Filter: Any Pattern
Rating:81.3
Current Trading Positions for Vanguard Lge Cap Etf (VV) Daily on 12-Feb-2016
* An Intermediate degree trader (hold positions from months to quarters), would currently be trading long in this market. The probability of this Target Area being correct is 85.8%. However, the random probability of this Target Area being correct is 64.1%. So the true probability of this Target Area being correct is 33.9% better than random.
* A Primary degree trader (hold positions from months to years), would currently be trading long in this market. The probability of this Target Area being correct is 41.3%. However, the random probability of this Target Area being correct is 34.0%. So the true probability of this Target Area being correct is 21.5% better than random.
Extensive Elliott Commentary for Vanguard Lge Cap Etf (VV) Daily on 12-Feb-2016 with three incomplete patterns:
Wave C of the Minor degree inverted Flat with a rating of 102.8 is expected to complete in the price range 83.38 to 90.13, but more probably between 85.2 and 87.83. This wave is due to complete anytime from now until 19-Feb-2016, but is most likely to complete before 15-Feb-2016.
This wave C will complete the Flat pattern.
This is the final wave in the pattern. When complete it will also complete wave (Y) of the Intermediate degree inverted Double 3 with a rating of 88.8. These two waves have the same target ranges.
Wave (Y) will probably complete this Double Sideways pattern, although it could possibly extend into a Triple Sideways pattern.
This is the final wave in the pattern. When complete it will also complete wave B of the Primary degree Flat with a rating of 81.3. These two waves have the same target ranges.
After wave B is complete, expect the market to continue down into wave C, which should be a five wave Impulsive pattern. Expect wave C to retrace wave B by 86% - 162%. Wave C can also be expected to be 90% - 162% of the price length of wave A. The expected time for wave C to complete is 19% - 134% of the time taken for wave B to complete and 24% - 115% of the time taken for wave A to complete.
Current Analysis Settings: Analysis Date Range: 11-May-2015 to 12-Feb-2016, Label Range: 15 - 50, Preferred Count Labels: 27, Min Rating: 75, Stocks toggle ON, Bias Towards Beginning of Data: 8, Bias Towards Major High/Low: 8, Largest Degree Wave Filter: Any Pattern
Rating:78.1
Current Trading Positions for Vanguard Long Term Bond ETF (BLV) Daily on 12-Feb-2016
* A Primary degree trader (hold positions from months to years), would currently be trading long in this market. The probability of this Target Area being correct is 83.8%. However, the random probability of this Target Area being correct is 65.0%. So the true probability of this Target Area being correct is 28.9% better than random.
* A Cycle degree trader (hold positions from quarters to years), would currently be shorting this market. The probability of this Target Area being correct is 40.4%. However, the random probability of this Target Area being correct is 34.0%. So the true probability of this Target Area being correct is 18.8% better than random.
Extensive Elliott Commentary for Vanguard Long Term Bond ETF (BLV) Daily on 12-Feb-2016 with three incomplete patterns:
Wave (C) of the Intermediate degree inverted Flat with a rating of 102.8 is expected to complete in the price range 86.97 to 93.9, but more probably between 88.75 and 91.26. This wave is due to complete anytime from now until 15-Jun-2016, but is most likely to complete before 22-Feb-2016.
This wave (C) will complete the Flat pattern.
This is the final wave in the pattern. When complete it will also complete wave X of the Primary degree Double Zigzag with a rating of 93.2. These two waves have the same target ranges.
After wave X is complete, expect the market to continue down into wave Y, which should be a three wave Zigzag pattern. Expect wave Y to retrace wave X by 117% - 263%. Wave Y can also be expected to be 90% - 263% of the price length of wave W. The expected time for wave Y to complete is 21% - 161% of the time taken for wave X to complete and 27% - 154% of the time taken for wave W to complete.
Wave b of the Cycle degree inverted Flat with a rating of 78.1 is expected to complete in the price range 67.52 to 88.17, but more probably between 84.96 and 88.06. This wave was expected to complete before 16-Nov-2015, and must complete by 28-Jul-2016.
After wave b is complete, expect the market to continue up into wave c, which should be a five wave Impulsive pattern. Expect wave c to retrace wave b by 80% - 169%. Wave c can also be expected to be 99% - 169% of the price length of wave a. The expected time for wave c to complete is 19% - 187% of the time taken for wave b to complete and 56% - 268% of the time taken for wave a to complete.
Current Analysis Settings: Analysis Date Range: 06-Dec-2013 to 12-Feb-2016, Label Range: 15 - 50, Preferred Count Labels: 22, Min Rating: 75, Stocks toggle ON, Bias Towards Beginning of Data: 8, Bias Towards Major High/Low: 8, Largest Degree Wave Filter: Any Pattern
Rating:102.3
Current Trading Positions for Vanguard Long-Term Corporate Bond ETF (VCLT) Daily on 12-Feb-2016
* A Cycle degree trader (hold positions from quarters to years), would currently be shorting this market. The probability of this Target Area being correct is 42.4%. However, the random probability of this Target Area being correct is 24.3%. So the true probability of this Target Area being correct is 74.5% better than random.
Extensive Elliott Commentary for Vanguard Long-Term Corporate Bond ETF (VCLT) Daily on 12-Feb-2016 with one incomplete pattern:
Wave y of the Cycle degree Double Zigzag with a rating of 102.3 is expected to complete in the price range 70.57 to 76.46, but more probably between 73.52 and 76.26. This wave is due to complete anytime from now until 06-Jan-2017, but is most likely to complete before 25-Apr-2016.
Wave y will probably complete this Double Sharp pattern, although it could possibly extend into a Triple Sharp pattern.
Current Analysis Settings: Analysis Date Range: 06-Dec-2013 to 12-Feb-2016, Label Range: 15 - 50, Preferred Count Labels: 17, Min Rating: 75, Stocks toggle ON, Bias Towards Beginning of Data: 8, Bias Towards Major High/Low: 8, Largest Degree Wave Filter: Any Pattern
Rating:456.8
Current Trading Positions for Vanguard Malvern Funds Vanguard Short-Term Inflation-Protected Fund (VTIP) Daily on 12-Feb-2016
* A Cycle degree trader (hold positions from quarters to years), would currently be shorting this market. The probability of this Target Area being correct is 78.1%. However, the random probability of this Target Area being correct is 64.0%. So the true probability of this Target Area being correct is 22.0% better than random.
Extensive Elliott Commentary for Vanguard Malvern Funds Vanguard Short-Term Inflation-Protected Fund (VTIP) Daily on 12-Feb-2016 with one incomplete pattern:
Wave d of the Cycle degree inverted Contracting Triangle with a rating of 456.8 is expected to complete in the price range 48.05 to 48.29, but more probably between 48.1 and 48.25. This wave is due to complete anytime from now until 23-May-2016, but is most likely to complete before 17-Mar-2016.
Once this wave d is complete, expect the market to continue up to the end of wave e, which will most probably be a ZigZag family pattern or possibly a Contracting Triangle. Expect wave e to have between 39% and 66% of the price range of wave c and complete in 4% to 60% of the time taken by wave c. Expect also that wave e will have between 21% and 47% of the price range of wave a and complete in 2% to 24% of the time taken by wave a. The slope (ie. price range divided by time taken) of wave e should be between 28% and 143% of the slope of wave c and between 19% to 183% of the slope of wave a. Wave e will complete this Contracting Triangle.
Current Analysis Settings: Analysis Date Range: 13-May-2014 to 12-Feb-2016, Label Range: 15 - 50, Preferred Count Labels: 17, Min Rating: 75, Stocks toggle ON, Bias Towards Beginning of Data: 8, Bias Towards Major High/Low: 8, Largest Degree Wave Filter: Any Pattern
Rating:77.4
Current Trading Positions for Vanguard Mega Cap 300 Growth Index ETF (MGK) Daily on 12-Feb-2016
* A Minuette degree trader (hold positions from days to months), would currently be trading long in this market. The probability of this Target Area being correct is 68.0%. However, the random probability of this Target Area being correct is 53.0%. So the true probability of this Target Area being correct is 28.3% better than random.
* A Minute degree trader (hold positions from weeks to months), would currently be shorting this market. The probability of this Target Area being correct is 44.6%. However, the random probability of this Target Area being correct is 34.0%. So the true probability of this Target Area being correct is 31.2% better than random.
* A Minor degree trader (hold positions from weeks to quarters), would currently be trading long in this market. The probability of this Target Area being correct is 55.6%. However, the random probability of this Target Area being correct is 53.0%. So the true probability of this Target Area being correct is 4.9% better than random.
* An Intermediate degree trader (hold positions from months to quarters), would currently be shorting this market. The probability of this Target Area being correct is 77.2%. However, the random probability of this Target Area being correct is 65.0%. So the true probability of this Target Area being correct is 18.8% better than random.
* A Primary degree trader (hold positions from months to years), would currently be trading long in this market. The probability of this Target Area being correct is 40.1%. However, the random probability of this Target Area being correct is 34.0%. So the true probability of this Target Area being correct is 17.9% better than random.
Extensive Elliott Commentary for Vanguard Mega Cap 300 Growth Index ETF (MGK) Daily on 12-Feb-2016 with five incomplete patterns:
Wave (x) of the Minuette degree Double 3 with a rating of 104.4 is expected to complete in the price range 73.9 to 86.18, but more probably between 74.59 and 75.87. This wave is due to complete anytime from now until 19-Feb-2016, but is most likely to complete before 12-Feb-2016.
After wave (x) is complete, expect the market to continue down into wave (y), which will probably be a three wave corrective pattern. Expect wave (y) to retrace wave (x) by 98% - 184%. Wave (y) can also be expected to be 81% - 184% of the price length of wave (w). The expected time for wave (y) to complete is 40% - 187% of the time taken for wave (x) to complete and 100% - 304% of the time taken for wave (w) to complete.
Wave b of the Minute degree inverted Flat with a rating of 91 is expected to complete in the price range 63.46 to 73.64, but more probably between 72.01 and 73.56. This wave is due to complete anytime from now until 29-Feb-2016, but is most likely to complete before 15-Feb-2016.
After wave b is complete, expect the market to continue up into wave c, which should be a five wave Impulsive pattern. Expect wave c to retrace wave b by 83% - 173%. Wave c can also be expected to be 101% - 173% of the price length of wave a. The expected time for wave c to complete is 20% - 190% of the time taken for wave b to complete and 57% - 279% of the time taken for wave a to complete.
Wave X of the Minor degree Double 3 with a rating of 85.8 is expected to complete in the price range 75.55 to 103, but more probably between 77.1 and 79.96. This wave is due to complete anytime from now until 22-Mar-2016, but is most likely to complete before 18-Feb-2016.
After wave X is complete, expect the market to continue down into wave Y, which will probably be a three wave corrective pattern. Expect wave Y to retrace wave X by 98% - 183%. Wave Y can also be expected to be 81% - 183% of the price length of wave W. The expected time for wave Y to complete is 40% - 187% of the time taken for wave X to complete and 100% - 304% of the time taken for wave W to complete.
Wave (X) of the Intermediate degree inverted Double Zigzag with a rating of 78.6 is expected to complete in the price range 73.5 to 77.98, but more probably between 74.97 and 77.16. This wave is due to complete anytime from now until 14-Mar-2016, but is most likely to complete before 16-Feb-2016.
After wave (X) is complete, expect the market to continue up into wave (Y), which should be a three wave Zigzag pattern. Expect wave (Y) to retrace wave (X) by 128% - 319%. Wave (Y) can also be expected to be 90% - 319% of the price length of wave (W). The expected time for wave (Y) to complete is 23% - 167% of the time taken for wave (X) to complete and 47% - 204% of the time taken for wave (W) to complete.
Wave B of the Primary degree Flat with a rating of 77.4 is expected to complete in the price range 82.68 to 109, but more probably between 82.95 and 89.83. This wave is due to complete anytime from now until 17-Apr-2017, but is most likely to complete before 30-Mar-2016.
After wave B is complete, expect the market to continue down into wave C, which should be a five wave Impulsive pattern. Expect wave C to retrace wave B by 86% - 162%. Wave C can also be expected to be 90% - 162% of the price length of wave A. The expected time for wave C to complete is 19% - 134% of the time taken for wave B to complete and 24% - 115% of the time taken for wave A to complete.
Current Analysis Settings: Analysis Date Range: 08-Jun-2015 to 12-Feb-2016, Label Range: 15 - 50, Preferred Count Labels: 27, Min Rating: 75, Stocks toggle ON, Bias Towards Beginning of Data: 8, Bias Towards Major High/Low: 8, Largest Degree Wave Filter: Any Pattern
Rating:92
Current Trading Positions for Vanguard Mid Cap Etf (VO) Daily on 12-Feb-2016
* A Primary degree trader (hold positions from months to years), would currently be shorting this market. The probability of this Target Area being correct is 40.2%. However, the random probability of this Target Area being correct is 24.3%. So the true probability of this Target Area being correct is 65.4% better than random.
Extensive Elliott Commentary for Vanguard Mid Cap Etf (VO) Daily on 12-Feb-2016 with one incomplete pattern:
Wave Y of the Primary degree Double Zigzag with a rating of 92 is expected to complete in the price range 69.81 to 92.44, but more probably between 86.03 and 92.11. This wave is most likely to complete sometime between 22-Feb-2016 and 01-Mar-2016 Note that it cannot complete until 19-Feb-2016 but must complete by 14-Mar-2016.
Wave Y will probably complete this Double Sharp pattern, although it could possibly extend into a Triple Sharp pattern.
Current Analysis Settings: Analysis Date Range: 18-Feb-2015 to 12-Feb-2016, Label Range: 15 - 50, Preferred Count Labels: 15, Min Rating: 75, Stocks toggle ON, Bias Towards Beginning of Data: 8, Bias Towards Major High/Low: 8, Largest Degree Wave Filter: Any Pattern
Rating:93
Current Trading Positions for Vanguard Mid-Cap Growth ETF (VOT) Daily on 12-Feb-2016
* A Primary degree trader (hold positions from months to years), would currently be shorting this market. The probability of this Target Area being correct is 40.6%. However, the random probability of this Target Area being correct is 24.3%. So the true probability of this Target Area being correct is 67.1% better than random.
Extensive Elliott Commentary for Vanguard Mid-Cap Growth ETF (VOT) Daily on 12-Feb-2016 with one incomplete pattern:
Wave Y of the Primary degree Double Zigzag with a rating of 93 is expected to complete in the price range 59.53 to 75.6, but more probably between 70.98 and 75.31. This wave is most likely to complete sometime between 22-Feb-2016 and 01-Mar-2016 Note that it cannot complete until 19-Feb-2016 but must complete by 14-Mar-2016.
Wave Y will probably complete this Double Sharp pattern, although it could possibly extend into a Triple Sharp pattern.
Current Analysis Settings: Analysis Date Range: 12-Mar-2015 to 12-Feb-2016, Label Range: 15 - 50, Preferred Count Labels: 16, Min Rating: 75, Stocks toggle ON, Bias Towards Beginning of Data: 8, Bias Towards Major High/Low: 8, Largest Degree Wave Filter: Any Pattern
Rating:88.6
Current Trading Positions for Vanguard Mid-Cap Value ETF (VOE) Daily on 12-Feb-2016
* An Intermediate degree trader (hold positions from months to quarters), would currently be trading long in this market. The probability of this Target Area being correct is 42.0%. However, the random probability of this Target Area being correct is 24.3%. So the true probability of this Target Area being correct is 72.8% better than random.
* A Primary degree trader (hold positions from months to years), would currently be trading long in this market. The probability of this Target Area being correct is 43.4%. However, the random probability of this Target Area being correct is 34.0%. So the true probability of this Target Area being correct is 27.6% better than random.
Extensive Elliott Commentary for Vanguard Mid-Cap Value ETF (VOE) Daily on 12-Feb-2016 with two incomplete patterns:
Wave (Y) of the Intermediate degree inverted Double Zigzag with a rating of 100.2 is expected to complete in the price range 80.47 to 99.65, but more probably between 81.28 and 88.59. This wave is most likely to complete sometime between 12-Feb-2016 and 25-Feb-2016 Note that it cannot complete until 12-Feb-2016 but must complete by 21-Mar-2016.
Wave (Y) will probably complete this Double Sharp pattern, although it could possibly extend into a Triple Sharp pattern.
This is the final wave in the pattern. When complete it will also complete wave B of the Primary degree Flat with a rating of 88.6. These two waves have the same target ranges.
After wave B is complete, expect the market to continue down into wave C, which should be a five wave Impulsive pattern. Expect wave C to retrace wave B by 86% - 162%. Wave C can also be expected to be 90% - 162% of the price length of wave A. The expected time for wave C to complete is 19% - 134% of the time taken for wave B to complete and 24% - 115% of the time taken for wave A to complete.
Current Analysis Settings: Analysis Date Range: 09-Apr-2015 to 12-Feb-2016, Label Range: 15 - 50, Preferred Count Labels: 24, Min Rating: 75, Stocks toggle ON, Bias Towards Beginning of Data: 8, Bias Towards Major High/Low: 8, Largest Degree Wave Filter: Any Pattern
Rating:102.9
Current Trading Positions for Vanguard Mortgage-Backed Securities ETF (VMBS) Daily on 12-Feb-2016
* A Cycle degree trader (hold positions from quarters to years), would currently be trading long in this market. The probability of this Target Area being correct is 50.2%. However, the random probability of this Target Area being correct is 34.0%. So the true probability of this Target Area being correct is 47.6% better than random.
Extensive Elliott Commentary for Vanguard Mortgage-Backed Securities ETF (VMBS) Daily on 12-Feb-2016 with one incomplete pattern:
Wave b of the Cycle degree Flat with a rating of 102.9 is expected to complete in the price range 53.25 to 55.34, but more probably between 53.27 and 53.82. This wave is due to complete anytime from now until 14-May-2020, but is most likely to complete before 29-Aug-2016.
After wave b is complete, expect the market to continue down into wave c, which should be a five wave Impulsive pattern. Expect wave c to retrace wave b by 86% - 162%. Wave c can also be expected to be 90% - 162% of the price length of wave a. The expected time for wave c to complete is 19% - 134% of the time taken for wave b to complete and 24% - 115% of the time taken for wave a to complete.
Current Analysis Settings: Analysis Date Range: 06-Dec-2013 to 12-Feb-2016, Label Range: 15 - 50, Preferred Count Labels: 28, Min Rating: 75, Stocks toggle ON, Bias Towards Beginning of Data: 8, Bias Towards Major High/Low: 8, Largest Degree Wave Filter: Any Pattern
Rating:96.1
Current Trading Positions for Vanguard Reit Etf (VNQ) Daily on 12-Feb-2016
* A Cycle degree trader (hold positions from quarters to years), would currently be shorting this market. The probability of this Target Area being correct is 41.2%. However, the random probability of this Target Area being correct is 24.3%. So the true probability of this Target Area being correct is 69.5% better than random.
Extensive Elliott Commentary for Vanguard Reit Etf (VNQ) Daily on 12-Feb-2016 with one incomplete pattern:
Wave y of the Cycle degree Double Zigzag with a rating of 96.1 is expected to complete in the price range 60.78 to 64.79, but more probably between 62.79 and 64.57. This wave is most likely to complete sometime between 03-Mar-2016 and 22-Aug-2016 Note that it cannot complete until 29-Feb-2016 but must complete by 14-Jul-2017.
Wave y will probably complete this Double Sharp pattern, although it could possibly extend into a Triple Sharp pattern.
Current Analysis Settings: Analysis Date Range: 06-Dec-2013 to 12-Feb-2016, Label Range: 15 - 50, Preferred Count Labels: 19, Min Rating: 75, Stocks toggle ON, Bias Towards Beginning of Data: 8, Bias Towards Major High/Low: 8, Largest Degree Wave Filter: Any Pattern
Rating:89.3
Current Trading Positions for Vanguard S&P 500 (VOO) Daily on 12-Feb-2016
* A Primary degree trader (hold positions from months to years), would currently be shorting this market. The probability of this Target Area being correct is 64.9%. However, the random probability of this Target Area being correct is 45.0%. So the true probability of this Target Area being correct is 44.2% better than random.
* A Cycle degree trader (hold positions from quarters to years), would currently be shorting this market. The probability of this Target Area being correct is 43.7%. However, the random probability of this Target Area being correct is 34.0%. So the true probability of this Target Area being correct is 28.5% better than random.
Extensive Elliott Commentary for Vanguard S&P 500 (VOO) Daily on 12-Feb-2016 with two incomplete patterns:
Wave C of the Primary degree Zigzag with a rating of 102.4 is expected to complete in the price range 116.48 to 168.07, but more probably between 151.82 and 167.26. This wave is due to complete anytime from now until 18-Apr-2016, but is most likely to complete before 10-Mar-2016.
This wave C will complete the ZigZag pattern.
This is the final wave in the pattern. When complete it will also complete wave b of the Cycle degree inverted Flat with a rating of 89.3. These two waves have the same target ranges.
After wave b is complete, expect the market to continue up into wave c, which should be a five wave Impulsive pattern. Expect wave c to retrace wave b by 82% - 179%. Wave c can also be expected to be 67% - 179% of the price length of wave a. The expected time for wave c to complete is 20% - 151% of the time taken for wave b to complete and 11% - 58% of the time taken for wave a to complete.
Current Analysis Settings: Analysis Date Range: 23-Dec-2013 to 12-Feb-2016, Label Range: 15 - 50, Preferred Count Labels: 18, Min Rating: 75, Stocks toggle ON, Bias Towards Beginning of Data: 8, Bias Towards Major High/Low: 8, Largest Degree Wave Filter: Any Pattern
Rating:91.9
Current Trading Positions for Vanguard Short Term Bond ETF (BSV) Daily on 12-Feb-2016
* A Primary degree trader (hold positions from months to years), would currently be shorting this market. The probability of this Target Area being correct is 66.8%. However, the random probability of this Target Area being correct is 53.0%. So the true probability of this Target Area being correct is 26.0% better than random.
* A Cycle degree trader (hold positions from quarters to years), would currently be trading long in this market. The probability of this Target Area being correct is 44.6%. However, the random probability of this Target Area being correct is 34.0%. So the true probability of this Target Area being correct is 31.2% better than random.
Extensive Elliott Commentary for Vanguard Short Term Bond ETF (BSV) Daily on 12-Feb-2016 with two incomplete patterns:
Wave X of the Primary degree inverted Double 3 with a rating of 102.5 is expected to complete in the price range 77.52 to 80.13, but more probably between 79.88 and 80.11. This wave is most likely to complete sometime between 04-Mar-2016 and 02-Jun-2016 Note that it cannot complete until 18-Feb-2016 but must complete by 15-Jan-2018.
After wave X is complete, expect the market to continue up into wave Y, which will probably be a three wave corrective pattern. Expect wave Y to retrace wave X by 98% - 227%. Wave Y can also be expected to be 71% - 227% of the price length of wave W. The expected time for wave Y to complete is 28% - 231% of the time taken for wave X to complete and 16% - 135% of the time taken for wave W to complete.
Wave b of the Cycle degree Flat with a rating of 91.9 is expected to complete in the price range 80.62 to 82.65, but more probably between 80.64 and 81.18. This wave is due to complete anytime from now until 31-Jul-2020, but is most likely to complete before 30-May-2016.
After wave b is complete, expect the market to continue down into wave c, which should be a five wave Impulsive pattern. Expect wave c to retrace wave b by 85% - 162%. Wave c can also be expected to be 90% - 162% of the price length of wave a. The expected time for wave c to complete is 20% - 136% of the time taken for wave b to complete and 20% - 110% of the time taken for wave a to complete.
Current Analysis Settings: Analysis Date Range: 04-Sep-2014 to 12-Feb-2016, Label Range: 15 - 50, Preferred Count Labels: 41, Min Rating: 75, Stocks toggle ON, Bias Towards Beginning of Data: 8, Bias Towards Major High/Low: 8, Largest Degree Wave Filter: Any Pattern
Rating:86.2
Current Trading Positions for Vanguard Short-Term Corporate Bond ETF (VCSH) Daily on 12-Feb-2016
* A Cycle degree trader (hold positions from quarters to years), would currently be trading long in this market. The probability of this Target Area being correct is 42.8%. However, the random probability of this Target Area being correct is 34.0%. So the true probability of this Target Area being correct is 25.9% better than random.
Extensive Elliott Commentary for Vanguard Short-Term Corporate Bond ETF (VCSH) Daily on 12-Feb-2016 with two incomplete patterns:
Wave C of the Primary degree inverted Flat with a rating of 102.2 is expected to complete in the price range 79.33 to 80.82, but more probably between 79.58 and 80.43. This wave is due to complete anytime from now until 16-Feb-2017, but is most likely to complete before 04-Apr-2016.
This wave C will complete the Flat pattern.
This is the final wave in the pattern. When complete it will also complete wave b of the Cycle degree Flat with a rating of 86.2. These two waves have the same target ranges.
After wave b is complete, expect the market to continue down into wave c, which should be a five wave Impulsive pattern. Expect wave c to retrace wave b by 86% - 162%. Wave c can also be expected to be 90% - 162% of the price length of wave a. The expected time for wave c to complete is 19% - 134% of the time taken for wave b to complete and 24% - 115% of the time taken for wave a to complete.
Current Analysis Settings: Analysis Date Range: 04-Sep-2014 to 12-Feb-2016, Label Range: 15 - 50, Preferred Count Labels: 22, Min Rating: 75, Stocks toggle ON, Bias Towards Beginning of Data: 8, Bias Towards Major High/Low: 8, Largest Degree Wave Filter: Any Pattern
Rating:75.1
Current Trading Positions for Vanguard Short-Term Government (VGSH) Daily on 12-Feb-2016
* An Intermediate degree trader (hold positions from months to quarters), would currently be trading long in this market. The probability of this Target Area being correct is 70.5%. However, the random probability of this Target Area being correct is 45.0%. So the true probability of this Target Area being correct is 56.7% better than random.
* A Primary degree trader (hold positions from months to years), would currently be shorting this market. The probability of this Target Area being correct is 49.5%. However, the random probability of this Target Area being correct is 45.0%. So the true probability of this Target Area being correct is 10.0% better than random.
Extensive Elliott Commentary for Vanguard Short-Term Government (VGSH) Daily on 12-Feb-2016 with two incomplete patterns:
Wave (2) of the Intermediate degree inverted Impulse with a rating of 95 is expected to complete in the price range 60.75 to 61.29, but more probably between 60.81 and 61.02. This wave was expected to complete before 29-Jan-2016, and must complete by 03-Aug-2016.
After this wave (2) is complete, expect the market to continue down into wave (3). Wave (3) should always be an Impulse and should retrace wave (2) completely. Expect wave (3) to retrace wave (2) by 165% - 383%. Wave (3) can also be expected to be 83% - 383% of the price length of wave (1). The expected time for wave (3) to complete is 84% - 367% of the time taken for wave (2) to complete and 14% - 94% of the time taken for wave (1) to complete. The slope (ie. price range divided by time taken) of wave (3) should be between 47% and 194% of the slope of wave (1). Once wave (3) is complete, expect wave (4) to be a sideways corrective movement, then wave (5) to continue in the same direction as wave (3). Wave (5) will complete this Impulse.
Wave C of the Primary degree Zigzag with a rating of 75.1 is expected to complete in the price range 59.64 to 60.78, but more probably between 60.01 and 60.32. This wave was expected to complete before 12-Nov-2015, and must complete by 29-Feb-2016.
This wave C will complete the ZigZag pattern.
Current Analysis Settings: Analysis Date Range: 10-Nov-2014 to 12-Feb-2016, Label Range: 15 - 50, Preferred Count Labels: 16, Min Rating: 75, Stocks toggle ON, Bias Towards Beginning of Data: 8, Bias Towards Major High/Low: 8, Largest Degree Wave Filter: Any Pattern
Rating:95.9
Current Trading Positions for Vanguard Small Cap Etf (VB) Daily on 12-Feb-2016
* A Primary degree trader (hold positions from months to years), would currently be trading long in this market. The probability of this Target Area being correct is 47.0%. However, the random probability of this Target Area being correct is 34.0%. So the true probability of this Target Area being correct is 38.2% better than random.
Extensive Elliott Commentary for Vanguard Small Cap Etf (VB) Daily on 12-Feb-2016 with one incomplete pattern:
Wave B of the Primary degree Flat with a rating of 95.9 is expected to complete in the price range 109.89 to 155.71, but more probably between 110.36 and 122.34. This wave is most likely to complete sometime between 26-Feb-2016 and 17-Jun-2016 Note that it cannot complete until 17-Feb-2016 but must complete by 13-Jul-2018.
After wave B is complete, expect the market to continue down into wave C, which should be a five wave Impulsive pattern. Expect wave C to retrace wave B by 86% - 162%. Wave C can also be expected to be 90% - 162% of the price length of wave A. The expected time for wave C to complete is 19% - 134% of the time taken for wave B to complete and 24% - 115% of the time taken for wave A to complete.
Current Analysis Settings: Analysis Date Range: 13-May-2015 to 12-Feb-2016, Label Range: 15 - 50, Preferred Count Labels: 34, Min Rating: 75, Stocks toggle ON, Bias Towards Beginning of Data: 8, Bias Towards Major High/Low: 8, Largest Degree Wave Filter: Any Pattern
Rating:98.8
Current Trading Positions for Vanguard Small Cap Gr Etf (VBK) Daily on 12-Feb-2016
* A Primary degree trader (hold positions from months to years), would currently be trading long in this market. The probability of this Target Area being correct is 48.8%. However, the random probability of this Target Area being correct is 34.0%. So the true probability of this Target Area being correct is 43.5% better than random.
Extensive Elliott Commentary for Vanguard Small Cap Gr Etf (VBK) Daily on 12-Feb-2016 with one incomplete pattern:
Wave B of the Primary degree Flat with a rating of 98.8 is expected to complete in the price range 118.47 to 172.75, but more probably between 119.02 and 133.22. This wave is most likely to complete sometime between 19-Feb-2016 and 14-Apr-2016 Note that it cannot complete until 15-Feb-2016 but must complete by 24-Apr-2017.
After wave B is complete, expect the market to continue down into wave C, which should be a five wave Impulsive pattern. Expect wave C to retrace wave B by 86% - 162%. Wave C can also be expected to be 90% - 162% of the price length of wave A. The expected time for wave C to complete is 19% - 134% of the time taken for wave B to complete and 24% - 115% of the time taken for wave A to complete.
Current Analysis Settings: Analysis Date Range: 11-May-2015 to 12-Feb-2016, Label Range: 15 - 50, Preferred Count Labels: 37, Min Rating: 75, Stocks toggle ON, Bias Towards Beginning of Data: 8, Bias Towards Major High/Low: 8, Largest Degree Wave Filter: Any Pattern
Rating:89.2
Current Trading Positions for Vanguard Small Cap Value ETF (VBR) Daily on 12-Feb-2016
* A Minuette degree trader (hold positions from days to months), would currently be trading long in this market. The probability of this Target Area being correct is 50.2%. However, the random probability of this Target Area being correct is 34.0%. So the true probability of this Target Area being correct is 47.6% better than random.
* A Minute degree trader (hold positions from weeks to months), would currently be shorting this market. The probability of this Target Area being correct is 42.8%. However, the random probability of this Target Area being correct is 34.0%. So the true probability of this Target Area being correct is 25.9% better than random.
* A Minor degree trader (hold positions from weeks to quarters), would currently be trading long in this market. The probability of this Target Area being correct is 55.6%. However, the random probability of this Target Area being correct is 53.0%. So the true probability of this Target Area being correct is 4.9% better than random.
* An Intermediate degree trader (hold positions from months to quarters), would currently be shorting this market. The probability of this Target Area being correct is 43.7%. However, the random probability of this Target Area being correct is 34.0%. So the true probability of this Target Area being correct is 28.5% better than random.
Extensive Elliott Commentary for Vanguard Small Cap Value ETF (VBR) Daily on 12-Feb-2016 with four incomplete patterns:
Wave (b) of the Minuette degree Flat with a rating of 102.5 is expected to complete in the price range 88.73 to 102.23, but more probably between 88.8 and 91.28. This wave is due to complete anytime from now until 19-Feb-2016, but is most likely to complete before 12-Feb-2016.
After wave (b) is complete, expect the market to continue down into wave (c), which should be a five wave Impulsive pattern. Expect wave (c) to retrace wave (b) by 89% - 167%. Wave (c) can also be expected to be 105% - 167% of the price length of wave (a). The expected time for wave (c) to complete is 20% - 148% of the time taken for wave (b) to complete and 60% - 290% of the time taken for wave (a) to complete.
Wave b of the Minute degree inverted Flat with a rating of 86.8 is expected to complete in the price range 79.28 to 88.31, but more probably between 86.86 and 88.24. This wave is due to complete anytime from now until 29-Feb-2016, but is most likely to complete before 15-Feb-2016.
After wave b is complete, expect the market to continue up into wave c, which should be a five wave Impulsive pattern. Expect wave c to retrace wave b by 83% - 173%. Wave c can also be expected to be 101% - 173% of the price length of wave a. The expected time for wave c to complete is 20% - 190% of the time taken for wave b to complete and 57% - 279% of the time taken for wave a to complete.
Wave X of the Minor degree Double 3 with a rating of 85.6 is expected to complete in the price range 89.9 to 113.19, but more probably between 91.21 and 93.64. This wave is due to complete anytime from now until 22-Mar-2016, but is most likely to complete before 18-Feb-2016.
After wave X is complete, expect the market to continue down into wave Y, which will probably be a three wave corrective pattern. Expect wave Y to retrace wave X by 98% - 183%. Wave Y can also be expected to be 81% - 183% of the price length of wave W. The expected time for wave Y to complete is 40% - 187% of the time taken for wave X to complete and 100% - 304% of the time taken for wave W to complete.
Wave (B) of the Intermediate degree inverted Flat with a rating of 89.2 is expected to complete in the price range 57.29 to 87.46, but more probably between 82.77 and 87.3. This wave is due to complete anytime from now until 19-Apr-2016, but is most likely to complete before 18-Feb-2016.
After wave (B) is complete, expect the market to continue up into wave (C), which should be a five wave Impulsive pattern. Expect wave (C) to retrace wave (B) by 80% - 169%. Wave (C) can also be expected to be 99% - 169% of the price length of wave (A). The expected time for wave (C) to complete is 19% - 187% of the time taken for wave (B) to complete and 56% - 268% of the time taken for wave (A) to complete.
Current Analysis Settings: Analysis Date Range: 12-May-2015 to 12-Feb-2016, Label Range: 15 - 50, Preferred Count Labels: 34, Min Rating: 75, Stocks toggle ON, Bias Towards Beginning of Data: 8, Bias Towards Major High/Low: 8, Largest Degree Wave Filter: Any Pattern
Rating:81.2
Current Trading Positions for Vanguard Total International Bond ETF (BNDX) Daily on 12-Feb-2016
* An Intermediate degree trader (hold positions from months to quarters), would currently be trading long in this market. The probability of this Target Area being correct is 42.6%. However, the random probability of this Target Area being correct is 24.3%. So the true probability of this Target Area being correct is 75.3% better than random.
* A Primary degree trader (hold positions from months to years), would currently be trading long in this market. The probability of this Target Area being correct is 43.1%. However, the random probability of this Target Area being correct is 34.0%. So the true probability of this Target Area being correct is 26.8% better than random.
* A Cycle degree trader (hold positions from quarters to years), would currently be shorting this market. The probability of this Target Area being correct is 55.2%. However, the random probability of this Target Area being correct is 53.0%. So the true probability of this Target Area being correct is 4.2% better than random.
Extensive Elliott Commentary for Vanguard Total International Bond ETF (BNDX) Daily on 12-Feb-2016 with three incomplete patterns:
Wave (Y) of the Intermediate degree inverted Double Zigzag with a rating of 103.9 is expected to complete in the price range 53.9 to 56.35, but more probably between 53.92 and 54.98. This wave is due to complete anytime from now until 03-May-2016, but is most likely to complete before 24-Mar-2016.
Wave (Y) will probably complete this Double Sharp pattern, although it could possibly extend into a Triple Sharp pattern.
This is the final wave in the pattern. When complete it will also complete wave B of the Primary degree Flat with a rating of 87.6. These two waves have the same target ranges.
After wave B is complete, expect the market to continue down into wave C, which should be a five wave Impulsive pattern. Expect wave C to retrace wave B by 86% - 162%. Wave C can also be expected to be 90% - 162% of the price length of wave A. The expected time for wave C to complete is 19% - 134% of the time taken for wave B to complete and 24% - 115% of the time taken for wave A to complete.
Wave x of the Cycle degree inverted Double 3 with a rating of 81.2 is expected to complete in the price range 42.92 to 52.56, but more probably between 51.63 and 52.49. This wave was expected to complete before 13-Oct-2015, and must complete by 14-Sep-2017.
After wave x is complete, expect the market to continue up into wave y, which will probably be a three wave corrective pattern. Expect wave y to retrace wave x by 98% - 227%. Wave y can also be expected to be 71% - 227% of the price length of wave w. The expected time for wave y to complete is 28% - 231% of the time taken for wave x to complete and 16% - 135% of the time taken for wave w to complete.
Current Analysis Settings: Analysis Date Range: 06-Dec-2013 to 12-Feb-2016, Label Range: 15 - 50, Preferred Count Labels: 16, Min Rating: 75, Stocks toggle ON, Bias Towards Beginning of Data: 8, Bias Towards Major High/Low: 8, Largest Degree Wave Filter: Any Pattern
Rating:89.7
Current Trading Positions for Vanguard Total International Stock ETF (VXUS) Daily on 12-Feb-2016
* A Primary degree trader (hold positions from months to years), would currently be shorting this market. The probability of this Target Area being correct is 64.5%. However, the random probability of this Target Area being correct is 45.0%. So the true probability of this Target Area being correct is 43.3% better than random.
* A Cycle degree trader (hold positions from quarters to years), would currently be shorting this market. The probability of this Target Area being correct is 39.5%. However, the random probability of this Target Area being correct is 24.3%. So the true probability of this Target Area being correct is 62.6% better than random.
Extensive Elliott Commentary for Vanguard Total International Stock ETF (VXUS) Daily on 12-Feb-2016 with two incomplete patterns:
Wave C of the Primary degree Zigzag with a rating of 100.8 is expected to complete in the price range 26.06 to 39.88, but more probably between 34.93 and 39.59. This wave is due to complete anytime from now until 07-Apr-2016, but is most likely to complete before 11-Mar-2016.
This wave C will complete the ZigZag pattern.
This is the final wave in the pattern. When complete it will also complete wave y of the Cycle degree Double Zigzag with a rating of 89.7. These two waves have the same target ranges.
Wave y will probably complete this Double Sharp pattern, although it could possibly extend into a Triple Sharp pattern.
Current Analysis Settings: Analysis Date Range: 08-May-2014 to 12-Feb-2016, Label Range: 15 - 50, Preferred Count Labels: 16, Min Rating: 75, Stocks toggle ON, Bias Towards Beginning of Data: 8, Bias Towards Major High/Low: 8, Largest Degree Wave Filter: Any Pattern
Rating:87.8
Current Trading Positions for Vanguard Total Stock Mkt Etf (VTI) Daily on 12-Feb-2016
* A Primary degree trader (hold positions from months to years), would currently be shorting this market. The probability of this Target Area being correct is 64.9%. However, the random probability of this Target Area being correct is 45.0%. So the true probability of this Target Area being correct is 44.2% better than random.
* A Cycle degree trader (hold positions from quarters to years), would currently be shorting this market. The probability of this Target Area being correct is 43.1%. However, the random probability of this Target Area being correct is 34.0%. So the true probability of this Target Area being correct is 26.8% better than random.
Extensive Elliott Commentary for Vanguard Total Stock Mkt Etf (VTI) Daily on 12-Feb-2016 with two incomplete patterns:
Wave C of the Primary degree Zigzag with a rating of 102.5 is expected to complete in the price range 63.85 to 92.98, but more probably between 83.37 and 92.52. This wave is due to complete anytime from now until 18-Apr-2016, but is most likely to complete before 10-Mar-2016.
This wave C will complete the ZigZag pattern.
This is the final wave in the pattern. When complete it will also complete wave b of the Cycle degree inverted Flat with a rating of 87.8. These two waves have the same target ranges.
After wave b is complete, expect the market to continue up into wave c, which should be a five wave Impulsive pattern. Expect wave c to retrace wave b by 82% - 179%. Wave c can also be expected to be 67% - 179% of the price length of wave a. The expected time for wave c to complete is 20% - 151% of the time taken for wave b to complete and 11% - 58% of the time taken for wave a to complete.
Current Analysis Settings: Analysis Date Range: 23-Dec-2013 to 12-Feb-2016, Label Range: 15 - 50, Preferred Count Labels: 17, Min Rating: 75, Stocks toggle ON, Bias Towards Beginning of Data: 8, Bias Towards Major High/Low: 8, Largest Degree Wave Filter: Any Pattern
Rating:80.1
Current Trading Positions for Vanguard Total World Stock ETF (VT) Daily on 12-Feb-2016
* An Intermediate degree trader (hold positions from months to quarters), would currently be shorting this market. The probability of this Target Area being correct is 88.3%. However, the random probability of this Target Area being correct is 65.0%. So the true probability of this Target Area being correct is 35.8% better than random.
* A Primary degree trader (hold positions from months to years), would currently be trading long in this market. The probability of this Target Area being correct is 43.1%. However, the random probability of this Target Area being correct is 34.0%. So the true probability of this Target Area being correct is 26.8% better than random.
* A Cycle degree trader (hold positions from quarters to years), would currently be shorting this market. The probability of this Target Area being correct is 85.0%. However, the random probability of this Target Area being correct is 64.1%. So the true probability of this Target Area being correct is 32.6% better than random.
Extensive Elliott Commentary for Vanguard Total World Stock ETF (VT) Daily on 12-Feb-2016 with three incomplete patterns:
Wave (X) of the Intermediate degree inverted Double Zigzag with a rating of 101.4 is expected to complete in the price range 50.42 to 53.75, but more probably between 51.51 and 53.14. This wave is due to complete anytime from now until 14-Mar-2016, but is most likely to complete before 16-Feb-2016.
After wave (X) is complete, expect the market to continue up into wave (Y), which should be a three wave Zigzag pattern. Expect wave (Y) to retrace wave (X) by 128% - 319%. Wave (Y) can also be expected to be 90% - 319% of the price length of wave (W). The expected time for wave (Y) to complete is 23% - 167% of the time taken for wave (X) to complete and 47% - 204% of the time taken for wave (W) to complete.
Wave B of the Primary degree Flat with a rating of 87.5 is expected to complete in the price range 57.24 to 76.82, but more probably between 57.44 and 62.56. This wave is due to complete anytime from now until 25-Apr-2017, but is most likely to complete before 31-Mar-2016.
After wave B is complete, expect the market to continue down into wave C, which should be a five wave Impulsive pattern. Expect wave C to retrace wave B by 86% - 162%. Wave C can also be expected to be 90% - 162% of the price length of wave A. The expected time for wave C to complete is 19% - 134% of the time taken for wave B to complete and 24% - 115% of the time taken for wave A to complete.
Wave y of the Cycle degree Double 3 with a rating of 80.1 is expected to complete in the price range 25.2 to 59.87, but more probably between 44.04 and 53.3. This wave is due to complete anytime from now until 06-Apr-2016, but is most likely to complete before 15-Feb-2016.
Wave y will probably complete this Double Sideways pattern, although it could possibly extend into a Triple Sideways pattern.
Current Analysis Settings: Analysis Date Range: 10-Apr-2015 to 12-Feb-2016, Label Range: 15 - 50, Preferred Count Labels: 18, Min Rating: 75, Stocks toggle ON, Bias Towards Beginning of Data: 8, Bias Towards Major High/Low: 8, Largest Degree Wave Filter: Any Pattern
Rating:93.6
Current Trading Positions for Vanguard Utilities Etf (VPU) Daily on 12-Feb-2016
* A Cycle degree trader (hold positions from quarters to years), would currently be trading long in this market. The probability of this Target Area being correct is 83.8%. However, the random probability of this Target Area being correct is 65.0%. So the true probability of this Target Area being correct is 28.9% better than random.
Extensive Elliott Commentary for Vanguard Utilities Etf (VPU) Daily on 12-Feb-2016 with two incomplete patterns:
Wave C of the Primary degree inverted Flat with a rating of 103 is expected to complete in the price range 91.56 to 112.36, but more probably between 96.78 and 104.79. This wave is due to complete anytime from now until 05-Dec-2016, but is most likely to complete before 18-Mar-2016.
This wave C will complete the Flat pattern.
This is the final wave in the pattern. When complete it will also complete wave x of the Cycle degree Double Zigzag with a rating of 93.6. These two waves have the same target ranges.
After wave x is complete, expect the market to continue down into wave y, which should be a three wave Zigzag pattern. Expect wave y to retrace wave x by 117% - 263%. Wave y can also be expected to be 90% - 263% of the price length of wave w. The expected time for wave y to complete is 21% - 161% of the time taken for wave x to complete and 27% - 154% of the time taken for wave w to complete.
Current Analysis Settings: Analysis Date Range: 06-Dec-2013 to 12-Feb-2016, Label Range: 15 - 50, Preferred Count Labels: 21, Min Rating: 75, Stocks toggle ON, Bias Towards Beginning of Data: 8, Bias Towards Major High/Low: 8, Largest Degree Wave Filter: Any Pattern
Rating:86.7
Current Trading Positions for Vanguard Value Etf (VTV) Daily on 12-Feb-2016
* An Intermediate degree trader (hold positions from months to quarters), would currently be shorting this market. The probability of this Target Area being correct is 70.7%. However, the random probability of this Target Area being correct is 45.0%. So the true probability of this Target Area being correct is 57.1% better than random.
* A Cycle degree trader (hold positions from quarters to years), would currently be trading long in this market. The probability of this Target Area being correct is 85.6%. However, the random probability of this Target Area being correct is 64.1%. So the true probability of this Target Area being correct is 33.5% better than random.
Extensive Elliott Commentary for Vanguard Value Etf (VTV) Daily on 12-Feb-2016 with three incomplete patterns:
Wave (2) of the Intermediate degree Impulse with a rating of 95.6 is expected to complete in the price range 72.48 to 77.14, but more probably between 74.83 and 76.66. This wave was expected to complete before 03-Feb-2016, and must complete by 29-Feb-2016.
After this wave (2) is complete, expect the market to continue up into wave (3). Wave (3) should always be an Impulse and should retrace wave (2) completely. Expect wave (3) to retrace wave (2) by 164% - 383%. Wave (3) can also be expected to be 83% - 383% of the price length of wave (1). The expected time for wave (3) to complete is 87% - 367% of the time taken for wave (2) to complete and 16% - 97% of the time taken for wave (1) to complete. The slope (ie. price range divided by time taken) of wave (3) should be between 70% and 219% of the slope of wave (1). Once wave (3) is complete, expect wave (4) to be a sideways corrective movement, then wave (5) to continue in the same direction as wave (3). Wave (5) will complete this Impulse.
Wave C of the Primary degree inverted Flat with a rating of 92.8 is expected to complete in the price range 75.21 to 104.22, but more probably between 82.56 and 93.87. This wave is due to complete anytime from now until 28-Feb-2017, but is most likely to complete before 06-Apr-2016.
This wave C will complete the Flat pattern.
This is the final wave in the pattern. When complete it will also complete wave y of the Cycle degree inverted Double 3 with a rating of 86.7. These two waves have the same target ranges.
Wave y will probably complete this Double Sideways pattern, although it could possibly extend into a Triple Sideways pattern.
Current Analysis Settings: Analysis Date Range: 23-Dec-2013 to 12-Feb-2016, Label Range: 15 - 50, Preferred Count Labels: 16, Min Rating: 75, Stocks toggle ON, Bias Towards Beginning of Data: 8, Bias Towards Major High/Low: 8, Largest Degree Wave Filter: Any Pattern
Rating:90.3
Current Trading Positions for VelocityShares 3x Inverse Natural Gas ETN (DGAZ) Daily on 12-Feb-2016
* An Intermediate degree trader (hold positions from months to quarters), would currently be trading long in this market. The probability of this Target Area being correct is 86.7%. However, the random probability of this Target Area being correct is 64.1%. So the true probability of this Target Area being correct is 35.3% better than random.
* A Primary degree trader (hold positions from months to years), would currently be trading long in this market. The probability of this Target Area being correct is 82.0%. However, the random probability of this Target Area being correct is 65.0%. So the true probability of this Target Area being correct is 26.2% better than random.
Extensive Elliott Commentary for VelocityShares 3x Inverse Natural Gas ETN (DGAZ) Daily on 12-Feb-2016 with three incomplete patterns:
Wave C of the Minor degree inverted Flat with a rating of 103.6 is expected to complete in the price range 15.18 to 27.84, but more probably between 18.96 and 24.45. This wave is due to complete anytime from now until 26-Feb-2016, but is most likely to complete before 15-Feb-2016.
This wave C will complete the Flat pattern.
This is the final wave in the pattern. When complete it will also complete wave (Y) of the Intermediate degree inverted Double 3 with a rating of 97. These two waves have the same target ranges.
Wave (Y) will probably complete this Double Sideways pattern, although it could possibly extend into a Triple Sideways pattern.
This is the final wave in the pattern. When complete it will also complete wave X of the Primary degree Double Zigzag with a rating of 90.3. These two waves have the same target ranges.
After wave X is complete, expect the market to continue down into wave Y, which should be a three wave Zigzag pattern. Expect wave Y to retrace wave X by 115% - 269%. Wave Y can also be expected to be 90% - 269% of the price length of wave W. The expected time for wave Y to complete is 22% - 147% of the time taken for wave X to complete and 53% - 204% of the time taken for wave W to complete.
Current Analysis Settings: Analysis Date Range: 10-Oct-2014 to 12-Feb-2016, Label Range: 15 - 50, Preferred Count Labels: 27, Min Rating: 75, Stocks toggle ON, Bias Towards Beginning of Data: 8, Bias Towards Major High/Low: 8, Largest Degree Wave Filter: Any Pattern
Rating:105.4
Current Trading Positions for VelocityShares 3x Long Natural Gas ETN (UGAZ) Daily on 12-Feb-2016
* A Primary degree trader (hold positions from months to years), would currently be trading long in this market. The probability of this Target Area being correct is 87.5%. However, the random probability of this Target Area being correct is 64.1%. So the true probability of this Target Area being correct is 36.5% better than random.
Extensive Elliott Commentary for VelocityShares 3x Long Natural Gas ETN (UGAZ) Daily on 12-Feb-2016 with one incomplete pattern:
Wave Y of the Primary degree inverted Double 3 with a rating of 105.4 is expected to complete in the price range 1.44 to 9.42, but more probably between 2.72 and 4.81. This wave is due to complete anytime from now until 20-Apr-2016, but is most likely to complete before 11-Mar-2016.
Wave Y will probably complete this Double Sideways pattern, although it could possibly extend into a Triple Sideways pattern.
Current Analysis Settings: Analysis Date Range: 16-Dec-2013 to 12-Feb-2016, Label Range: 15 - 50, Preferred Count Labels: 24, Min Rating: 75, Stocks toggle ON, Bias Towards Beginning of Data: 8, Bias Towards Major High/Low: 8, Largest Degree Wave Filter: Any Pattern
Rating:79.5
Current Trading Positions for VelocityShares Daily 2x VIX Short Term ETN (TVIX) Daily on 12-Feb-2016
* A Primary degree trader (hold positions from months to years), would currently be trading long in this market. The probability of this Target Area being correct is 49.4%. However, the random probability of this Target Area being correct is 34.0%. So the true probability of this Target Area being correct is 45.3% better than random.
* A Cycle degree trader (hold positions from quarters to years), would currently be shorting this market. The probability of this Target Area being correct is 40.7%. However, the random probability of this Target Area being correct is 34.0%. So the true probability of this Target Area being correct is 19.7% better than random.
Extensive Elliott Commentary for VelocityShares Daily 2x VIX Short Term ETN (TVIX) Daily on 12-Feb-2016 with two incomplete patterns:
Wave B of the Primary degree Flat with a rating of 99.5 is expected to complete in the price range 12.16 to 23.97, but more probably between 12.28 and 15.37. This wave could complete anytime between now and 15-Feb-2018, but is most likely to complete sometime between 16-Feb-2016 and 20-May-2016.
After wave B is complete, expect the market to continue down into wave C, which should be a five wave Impulsive pattern. Expect wave C to retrace wave B by 86% - 162%. Wave C can also be expected to be 90% - 162% of the price length of wave A. The expected time for wave C to complete is 19% - 134% of the time taken for wave B to complete and 24% - 115% of the time taken for wave A to complete.
Wave b of the Cycle degree inverted Flat with a rating of 79.5 is expected to complete at a price no higher than 8.21, but more probably between 4.34 and 8.03. This wave was expected to complete before 17-Nov-2015, and must complete by 08-Jul-2016.
After wave b is complete, expect the market to continue up into wave c, which should be a five wave Impulsive pattern. Expect wave c to retrace wave b by 82% - 177%. Wave c can also be expected to be 89% - 177% of the price length of wave a. The expected time for wave c to complete is 15% - 160% of the time taken for wave b to complete and 16% - 118% of the time taken for wave a to complete.
Current Analysis Settings: Analysis Date Range: 23-Dec-2013 to 12-Feb-2016, Label Range: 15 - 50, Preferred Count Labels: 43, Min Rating: 75, Stocks toggle ON, Bias Towards Beginning of Data: 8, Bias Towards Major High/Low: 8, Largest Degree Wave Filter: Any Pattern
Rating:85.6
Current Trading Positions for VelocityShares Daily Inverse VIX Short Term ETN (XIV) Daily on 12-Feb-2016
* An Intermediate degree trader (hold positions from months to quarters), would currently be shorting this market. The probability of this Target Area being correct is 65.9%. However, the random probability of this Target Area being correct is 53.0%. So the true probability of this Target Area being correct is 24.3% better than random.
* A Primary degree trader (hold positions from months to years), would currently be trading long in this market. The probability of this Target Area being correct is 42.5%. However, the random probability of this Target Area being correct is 34.0%. So the true probability of this Target Area being correct is 25.0% better than random.
Extensive Elliott Commentary for VelocityShares Daily Inverse VIX Short Term ETN (XIV) Daily on 12-Feb-2016 with two incomplete patterns:
Wave (X) of the Intermediate degree inverted Double 3 with a rating of 102 is expected to complete at a price no higher than 18.89, but more probably between 15.93 and 17.56. This wave is due to complete anytime from now until 05-Apr-2016, but is most likely to complete before 12-Feb-2016.
After wave (X) is complete, expect the market to continue up into wave (Y), which will probably be a three wave corrective pattern. Expect wave (Y) to retrace wave (X) by 98% - 212%. Wave (Y) can also be expected to be 73% - 212% of the price length of wave (W). The expected time for wave (Y) to complete is 27% - 214% of the time taken for wave (X) to complete and 38% - 222% of the time taken for wave (W) to complete.
Wave B of the Primary degree Flat with a rating of 85.6 is expected to complete in the price range 27.7 to 60.38, but more probably between 28.04 and 36.58. This wave is due to complete anytime from now until 21-Jul-2017, but is most likely to complete before 13-Apr-2016.
After wave B is complete, expect the market to continue down into wave C, which should be a five wave Impulsive pattern. Expect wave C to retrace wave B by 86% - 162%. Wave C can also be expected to be 90% - 162% of the price length of wave A. The expected time for wave C to complete is 19% - 134% of the time taken for wave B to complete and 24% - 115% of the time taken for wave A to complete.
Current Analysis Settings: Analysis Date Range: 13-May-2015 to 12-Feb-2016, Label Range: 15 - 50, Preferred Count Labels: 25, Min Rating: 75, Stocks toggle ON, Bias Towards Beginning of Data: 8, Bias Towards Major High/Low: 8, Largest Degree Wave Filter: Any Pattern
Rating:87.4
Current Trading Positions for VelocityShares VIX Short Term ETN (VIIX) Daily on 12-Feb-2016
* A Cycle degree trader (hold positions from quarters to years), would currently be trading long in this market. The probability of this Target Area being correct is 80.8%. However, the random probability of this Target Area being correct is 65.0%. So the true probability of this Target Area being correct is 24.3% better than random.
Extensive Elliott Commentary for VelocityShares VIX Short Term ETN (VIIX) Daily on 12-Feb-2016 with two incomplete patterns:
Wave C of the Primary degree inverted Flat with a rating of 96.7 is expected to complete in the price range 28.48 to 74.4, but more probably between 40.33 and 58.7. This wave was expected to complete before 02-Feb-2016, and must complete by 21-Dec-2016.
This wave C will complete the Flat pattern.
This is the final wave in the pattern. When complete it will also complete wave x of the Cycle degree Double Zigzag with a rating of 87.4. These two waves have the same target ranges.
After wave x is complete, expect the market to continue down into wave y, which should be a three wave Zigzag pattern. Expect wave y to retrace wave x by 116% - 261%. Wave y can also be expected to be 90% - 261% of the price length of wave w. The expected time for wave y to complete is 21% - 160% of the time taken for wave x to complete and 25% - 152% of the time taken for wave w to complete.
Current Analysis Settings: Analysis Date Range: 23-Dec-2013 to 12-Feb-2016, Label Range: 15 - 50, Preferred Count Labels: 17, Min Rating: 75, Stocks toggle ON, Bias Towards Beginning of Data: 8, Bias Towards Major High/Low: 8, Largest Degree Wave Filter: Any Pattern
Rating:85.7
Current Trading Positions for VelocitySharesTM 3x Long Gold ETN (UGLD) Daily on 12-Feb-2016
* A Primary degree trader (hold positions from months to years), would currently be trading long in this market. The probability of this Target Area being correct is 87.2%. However, the random probability of this Target Area being correct is 64.1%. So the true probability of this Target Area being correct is 36.0% better than random.
* A Cycle degree trader (hold positions from quarters to years), would currently be trading long in this market. The probability of this Target Area being correct is 42.5%. However, the random probability of this Target Area being correct is 34.0%. So the true probability of this Target Area being correct is 25.0% better than random.
Extensive Elliott Commentary for VelocitySharesTM 3x Long Gold ETN (UGLD) Daily on 12-Feb-2016 with two incomplete patterns:
Wave Y of the Primary degree inverted Double 3 with a rating of 102.6 is expected to complete in the price range 8.05 to 19.71, but more probably between 9.73 and 13.81. This wave is due to complete anytime from now until 09-Aug-2016, but is most likely to complete before 04-Apr-2016.
Wave Y will probably complete this Double Sideways pattern, although it could possibly extend into a Triple Sideways pattern.
This is the final wave in the pattern. When complete it will also complete wave b of the Cycle degree Flat with a rating of 85.7. These two waves have the same target ranges.
After wave b is complete, expect the market to continue down into wave c, which should be a five wave Impulsive pattern. Expect wave c to retrace wave b by 85% - 162%. Wave c can also be expected to be 90% - 162% of the price length of wave a. The expected time for wave c to complete is 20% - 136% of the time taken for wave b to complete and 20% - 110% of the time taken for wave a to complete.
Current Analysis Settings: Analysis Date Range: 31-Jan-2014 to 12-Feb-2016, Label Range: 15 - 50, Preferred Count Labels: 20, Min Rating: 75, Stocks toggle ON, Bias Towards Beginning of Data: 8, Bias Towards Major High/Low: 8, Largest Degree Wave Filter: Any Pattern
Rating:76.8
Current Trading Positions for VelocitySharesTM 3x Long Silver ETN (USLV) Daily on 12-Feb-2016
* An Intermediate degree trader (hold positions from months to quarters), would currently be trading long in this market. The probability of this Target Area being correct is 50.2%. However, the random probability of this Target Area being correct is 34.0%. So the true probability of this Target Area being correct is 47.6% better than random.
* A Primary degree trader (hold positions from months to years), would currently be shorting this market. The probability of this Target Area being correct is 39.5%. However, the random probability of this Target Area being correct is 34.0%. So the true probability of this Target Area being correct is 16.2% better than random.
* A Cycle degree trader (hold positions from quarters to years), would currently be trading long in this market. The probability of this Target Area being correct is 76.4%. However, the random probability of this Target Area being correct is 65.0%. So the true probability of this Target Area being correct is 17.5% better than random.
Extensive Elliott Commentary for VelocitySharesTM 3x Long Silver ETN (USLV) Daily on 12-Feb-2016 with three incomplete patterns:
Wave (B) of the Intermediate degree Flat with a rating of 102.2 is expected to complete in the price range 23.81 to 64.3, but more probably between 24.23 and 34.93. This wave could complete anytime between now and 27-Dec-2021, but is most likely to complete sometime between 19-Feb-2016 and 14-Nov-2016.
After wave (B) is complete, expect the market to continue down into wave (C), which should be a five wave Impulsive pattern. Expect wave (C) to retrace wave (B) by 85% - 162%. Wave (C) can also be expected to be 90% - 162% of the price length of wave (A). The expected time for wave (C) to complete is 20% - 136% of the time taken for wave (B) to complete and 20% - 110% of the time taken for wave (A) to complete.
Wave B of the Primary degree inverted Flat with a rating of 75.6 is expected to complete in the price range 4.38 to 22.74, but more probably between 17.63 and 22.51. This wave was expected to complete before 06-Apr-2015, and must complete by 05-May-2016.
After wave B is complete, expect the market to continue up into wave C, which should be a five wave Impulsive pattern. Expect wave C to retrace wave B by 82% - 177%. Wave C can also be expected to be 89% - 177% of the price length of wave A. The expected time for wave C to complete is 15% - 160% of the time taken for wave B to complete and 16% - 118% of the time taken for wave A to complete.
Wave x of the Cycle degree Double Zigzag with a rating of 76.8 is expected to complete in the price range 27.24 to 65.19, but more probably between 37.88 and 57.32. This wave was expected to complete before 20-Oct-2015, and must complete by 16-Aug-2017.
After wave x is complete, expect the market to continue down into wave y, which should be a three wave Zigzag pattern. Expect wave y to retrace wave x by 117% - 263%. Wave y can also be expected to be 90% - 263% of the price length of wave w. The expected time for wave y to complete is 21% - 161% of the time taken for wave x to complete and 27% - 154% of the time taken for wave w to complete.
Current Analysis Settings: Analysis Date Range: 10-Jan-2014 to 12-Feb-2016, Label Range: 15 - 50, Preferred Count Labels: 22, Min Rating: 75, Stocks toggle ON, Bias Towards Beginning of Data: 8, Bias Towards Major High/Low: 8, Largest Degree Wave Filter: Any Pattern
Rating:83.2
Current Trading Positions for Virtus Total Return (DCA) Daily on 12-Feb-2016
* A Primary degree trader (hold positions from months to years), would currently be shorting this market. The probability of this Target Area being correct is 56.0%. However, the random probability of this Target Area being correct is 45.0%. So the true probability of this Target Area being correct is 24.4% better than random.
* A Cycle degree trader (hold positions from quarters to years), would currently be trading long in this market. The probability of this Target Area being correct is 41.9%. However, the random probability of this Target Area being correct is 34.0%. So the true probability of this Target Area being correct is 23.2% better than random.
Extensive Elliott Commentary for Virtus Total Return (DCA) Daily on 12-Feb-2016 with two incomplete patterns:
Wave B of the Primary degree inverted Zigzag with a rating of 101.9 is expected to complete in the price range 3.02 to 3.53, but more probably between 3.23 and 3.46. This wave is due to complete anytime from now until 22-Apr-2016, but is most likely to complete before 17-Feb-2016.
After wave B is complete, expect the market to continue up into wave C, which should be a five wave impulsive pattern. Expect wave C to retrace wave B by 114% - 331%. Wave C can also be expected to be 53% - 331% of the price length of wave A. The expected time for wave C to complete is 24% - 277% of the time taken for wave B to complete and 31% - 204% of the time taken for wave A to complete.
Wave b of the Cycle degree Flat with a rating of 83.2 is expected to complete in the price range 4.34 to 8.1, but more probably between 4.38 and 5.37. This wave could complete anytime between now and 13-May-2024, but is most likely to complete sometime between 04-Mar-2016 and 13-Mar-2017.
After wave b is complete, expect the market to continue down into wave c, which should be a five wave Impulsive pattern. Expect wave c to retrace wave b by 85% - 162%. Wave c can also be expected to be 90% - 162% of the price length of wave a. The expected time for wave c to complete is 20% - 136% of the time taken for wave b to complete and 20% - 110% of the time taken for wave a to complete.
Current Analysis Settings: Analysis Date Range: 23-Jul-2014 to 12-Feb-2016, Label Range: 15 - 50, Preferred Count Labels: 19, Min Rating: 75, Stocks toggle ON, Bias Towards Beginning of Data: 8, Bias Towards Major High/Low: 8, Largest Degree Wave Filter: Any Pattern
Rating:77.3
Current Trading Positions for Wells Fargo Adv Global Div Opp Fund (EOD) Daily on 12-Feb-2016
* An Intermediate degree trader (hold positions from months to quarters), would currently be shorting this market. The probability of this Target Area being correct is 38.0%. However, the random probability of this Target Area being correct is 13.0%. So the true probability of this Target Area being correct is 192.3% better than random.
* A Primary degree trader (hold positions from months to years), would currently be shorting this market. The probability of this Target Area being correct is 49.9%. However, the random probability of this Target Area being correct is 45.0%. So the true probability of this Target Area being correct is 10.9% better than random.
* A Cycle degree trader (hold positions from quarters to years), would currently be shorting this market. The probability of this Target Area being correct is 33.5%. However, the random probability of this Target Area being correct is 24.3%. So the true probability of this Target Area being correct is 37.9% better than random.
Extensive Elliott Commentary for Wells Fargo Adv Global Div Opp Fund (EOD) Daily on 12-Feb-2016 with three incomplete patterns:
Wave (3) of the Intermediate degree inverted Impulse with a rating of 94.3 is expected to complete at a price no higher than 4.8, but more probably between 3.48 and 4.66. This wave is due to complete anytime from now until 28-Mar-2016, but is most likely to complete before 23-Feb-2016.
When complete, expect the overall slope (ie. price range divided by time taken) of this wave (3) to be between 47% to 194% of the slope of wave (1). Then expect the market to pull back into wave (4), which will be corrective in nature and has a probability of 0% of being a Flat or other sideways pattern. Wave (4) should not retrace back into the price range of wave (1) or (2). Expect wave (4) to have between 5% - 140% of the price range of wave (2). The expected time for wave (4) to complete is between 16% - 136% of wave (2). After wave (4), expect wave (5) to move beyond the end of wave (3) to complete this Impulse.
Wave C of the Primary degree Zigzag with a rating of 79.4 is expected to complete in the price range 3.83 to 5.58, but more probably between 5 and 5.55. This wave was expected to complete before 12-Feb-2016, and must complete by 25-Apr-2016.
This wave C will complete the ZigZag pattern.
This is the final wave in the pattern. When complete it will also complete wave y of the Cycle degree Double Zigzag with a rating of 77.3. These two waves have the same target ranges.
Wave y will probably complete this Double Sharp pattern, although it could possibly extend into a Triple Sharp pattern.
Current Analysis Settings: Analysis Date Range: 13-Jun-2014 to 12-Feb-2016, Label Range: 15 - 50, Preferred Count Labels: 16, Min Rating: 75, Stocks toggle ON, Bias Towards Beginning of Data: 8, Bias Towards Major High/Low: 8, Largest Degree Wave Filter: Any Pattern
Rating:77.6
Current Trading Positions for Western Asset Emrg Mkt Incm Fd (EMD) Daily on 12-Feb-2016
* A Primary degree trader (hold positions from months to years), would currently be shorting this market. The probability of this Target Area being correct is 83.2%. However, the random probability of this Target Area being correct is 65.0%. So the true probability of this Target Area being correct is 28.0% better than random.
* A Cycle degree trader (hold positions from quarters to years), would currently be trading long in this market. The probability of this Target Area being correct is 40.1%. However, the random probability of this Target Area being correct is 34.0%. So the true probability of this Target Area being correct is 17.9% better than random.
Extensive Elliott Commentary for Western Asset Emrg Mkt Incm Fd (EMD) Daily on 12-Feb-2016 with three incomplete patterns:
Wave (C) of the Intermediate degree Flat with a rating of 99.9 is expected to complete in the price range 8.77 to 9.39, but more probably between 8.92 and 9.2. This wave was expected to complete before 10-Feb-2016, and must complete by 16-Feb-2016.
This wave (C) will complete the Flat pattern.
This is the final wave in the pattern. When complete it will also complete wave X of the Primary degree inverted Double Zigzag with a rating of 92.4. These two waves have the same target ranges.
After wave X is complete, expect the market to continue up into wave Y, which should be a three wave Zigzag pattern. Expect wave Y to retrace wave X by 128% - 319%. Wave Y can also be expected to be 90% - 319% of the price length of wave W. The expected time for wave Y to complete is 23% - 167% of the time taken for wave X to complete and 47% - 204% of the time taken for wave W to complete.
Wave b of the Cycle degree Flat with a rating of 77.6 is expected to complete in the price range 11.68 to 20.08, but more probably between 11.77 and 13.99. This wave could complete anytime between now and 13-Mar-2025, but is most likely to complete sometime between 08-Mar-2016 and 24-Apr-2017.
After wave b is complete, expect the market to continue down into wave c, which should be a five wave Impulsive pattern. Expect wave c to retrace wave b by 85% - 162%. Wave c can also be expected to be 90% - 162% of the price length of wave a. The expected time for wave c to complete is 20% - 136% of the time taken for wave b to complete and 20% - 110% of the time taken for wave a to complete.
Current Analysis Settings: Analysis Date Range: 17-Apr-2014 to 12-Feb-2016, Label Range: 15 - 50, Preferred Count Labels: 21, Min Rating: 75, Stocks toggle ON, Bias Towards Beginning of Data: 8, Bias Towards Major High/Low: 8, Largest Degree Wave Filter: Any Pattern
Rating:75.4
Current Trading Positions for Western Asset Glbl High Inc Fd (EHI) Daily on 12-Feb-2016
* An Intermediate degree trader (hold positions from months to quarters), would currently be shorting this market. The probability of this Target Area being correct is 38.0%. However, the random probability of this Target Area being correct is 13.0%. So the true probability of this Target Area being correct is 192.3% better than random.
* A Primary degree trader (hold positions from months to years), would currently be shorting this market. The probability of this Target Area being correct is 50.2%. However, the random probability of this Target Area being correct is 45.0%. So the true probability of this Target Area being correct is 11.6% better than random.
* A Cycle degree trader (hold positions from quarters to years), would currently be shorting this market. The probability of this Target Area being correct is 32.5%. However, the random probability of this Target Area being correct is 24.3%. So the true probability of this Target Area being correct is 33.7% better than random.
Extensive Elliott Commentary for Western Asset Glbl High Inc Fd (EHI) Daily on 12-Feb-2016 with three incomplete patterns:
Wave (3) of the Intermediate degree inverted Impulse with a rating of 94.2 is expected to complete in the price range 2.16 to 7.43, but more probably between 5.9 and 7.24. This wave is due to complete anytime from now until 11-Mar-2016, but is most likely to complete before 22-Feb-2016.
When complete, expect the overall slope (ie. price range divided by time taken) of this wave (3) to be between 47% to 194% of the slope of wave (1). Then expect the market to pull back into wave (4), which will be corrective in nature and has a probability of 0% of being a Flat or other sideways pattern. Wave (4) should not retrace back into the price range of wave (1) or (2). Expect wave (4) to have between 5% - 140% of the price range of wave (2). The expected time for wave (4) to complete is between 16% - 136% of wave (2). After wave (4), expect wave (5) to move beyond the end of wave (3) to complete this Impulse.
Wave C of the Primary degree Zigzag with a rating of 82.7 is expected to complete in the price range 6.43 to 8.39, but more probably between 7.41 and 8.24. This wave is due to complete anytime from now until 10-Jun-2016, but is most likely to complete before 29-Feb-2016.
This wave C will complete the ZigZag pattern.
This is the final wave in the pattern. When complete it will also complete wave y of the Cycle degree Double Zigzag with a rating of 75.4. These two waves have the same target ranges.
Wave y will probably complete this Double Sharp pattern, although it could possibly extend into a Triple Sharp pattern.
Current Analysis Settings: Analysis Date Range: 06-May-2014 to 12-Feb-2016, Label Range: 15 - 50, Preferred Count Labels: 17, Min Rating: 75, Stocks toggle ON, Bias Towards Beginning of Data: 8, Bias Towards Major High/Low: 8, Largest Degree Wave Filter: Any Pattern
Rating:88.5
Current Trading Positions for Western Asset Hi Inc Opp Fd (HIO) Daily on 12-Feb-2016
* A Primary degree trader (hold positions from months to years), would currently be shorting this market. The probability of this Target Area being correct is 50.1%. However, the random probability of this Target Area being correct is 34.0%. So the true probability of this Target Area being correct is 47.4% better than random.
* A Cycle degree trader (hold positions from quarters to years), would currently be trading long in this market. The probability of this Target Area being correct is 87.6%. However, the random probability of this Target Area being correct is 80.4%. So the true probability of this Target Area being correct is 9.0% better than random.
Extensive Elliott Commentary for Western Asset Hi Inc Opp Fd (HIO) Daily on 12-Feb-2016 with two incomplete patterns:
Wave B of the Primary degree inverted Flat with a rating of 101.4 is expected to complete in the price range 2.79 to 4.26, but more probably between 4.03 and 4.26. This wave is due to complete anytime from now until 08-Apr-2016, but is most likely to complete before 15-Feb-2016.
After wave B is complete, expect the market to continue up into wave C, which should be a five wave Impulsive pattern. Expect wave C to retrace wave B by 80% - 169%. Wave C can also be expected to be 99% - 169% of the price length of wave A. The expected time for wave C to complete is 19% - 187% of the time taken for wave B to complete and 56% - 268% of the time taken for wave A to complete.
Wave IV of the Cycle degree inverted Ending Diagonal with a rating of 88.5 is expected to complete in the price range 4.47 to 4.84, but more probably between 4.47 and 4.69. This wave is due to complete anytime from now until 27-Jul-2016, but is most likely to complete before 11-Mar-2016.
Expect this wave IV to complete in the price range of wave 2, and then continue down to the end of wave V, which should be a ZigZag family three wave pattern. Expect wave V to have between 52% and 91% of the price range of wave III and complete in 18% to 62% of the time taken by wave
III. Expect also that wave V will have between 31% and 72% of the price range of wave I and complete in 3% to 22% of the time taken by wave I. The slope (ie. price range divided by time taken) of wave V should be between 49% and 173% of the slope of wave III and between 77% to 312% of the slope of wave I. Wave V will complete this Ending Diagonal pattern.
Current Analysis Settings: Analysis Date Range: 28-Mar-2014 to 12-Feb-2016, Label Range: 15 - 50, Preferred Count Labels: 17, Min Rating: 75, Stocks toggle ON, Bias Towards Beginning of Data: 8, Bias Towards Major High/Low: 8, Largest Degree Wave Filter: Any Pattern
Rating:76.5
Current Trading Positions for Western Asset High Yield Defined Opportunity Fund (HYI) Daily on 12-Feb-2016
* An Intermediate degree trader (hold positions from months to quarters), would currently be shorting this market. The probability of this Target Area being correct is 70.5%. However, the random probability of this Target Area being correct is 45.0%. So the true probability of this Target Area being correct is 56.7% better than random.
* A Cycle degree trader (hold positions from quarters to years), would currently be trading long in this market. The probability of this Target Area being correct is 54.7%. However, the random probability of this Target Area being correct is 53.0%. So the true probability of this Target Area being correct is 3.2% better than random.
Extensive Elliott Commentary for Western Asset High Yield Defined Opportunity Fund (HYI) Daily on 12-Feb-2016 with three incomplete patterns:
Wave (2) of the Intermediate degree Impulse with a rating of 94.1 is expected to complete in the price range 12.54 to 13.4, but more probably between 12.97 and 13.31. This wave was expected to complete before 01-Feb-2016, and must complete by 19-Feb-2016.
After this wave (2) is complete, expect the market to continue up into wave (3). Wave (3) should always be an Impulse and should retrace wave (2) completely. Expect wave (3) to retrace wave (2) by 164% - 383%. Wave (3) can also be expected to be 83% - 383% of the price length of wave (1). The expected time for wave (3) to complete is 87% - 367% of the time taken for wave (2) to complete and 16% - 97% of the time taken for wave (1) to complete. The slope (ie. price range divided by time taken) of wave (3) should be between 70% and 219% of the slope of wave (1). Once wave (3) is complete, expect wave (4) to be a sideways corrective movement, then wave (5) to continue in the same direction as wave (3). Wave (5) will complete this Impulse.
Wave C of the Primary degree inverted Flat with a rating of 83.5 is expected to complete in the price range 13.55 to 16.48, but more probably between 14.08 and 15.74. This wave is due to complete anytime from now until 20-Feb-2017, but is most likely to complete before 06-Apr-2016.
This wave C will complete the Flat pattern.
This is the final wave in the pattern. When complete it will also complete wave x of the Cycle degree Double 3 with a rating of 76.5. These two waves have the same target ranges.
After wave x is complete, expect the market to continue down into wave y, which will probably be a three wave corrective pattern. Expect wave y to retrace wave x by 98% - 192%. Wave y can also be expected to be 76% - 192% of the price length of wave w. The expected time for wave y to complete is 20% - 179% of the time taken for wave x to complete and 12% - 112% of the time taken for wave w to complete.
Current Analysis Settings: Analysis Date Range: 21-Jan-2014 to 12-Feb-2016, Label Range: 15 - 50, Preferred Count Labels: 18, Min Rating: 75, Stocks toggle ON, Bias Towards Beginning of Data: 8, Bias Towards Major High/Low: 8, Largest Degree Wave Filter: Any Pattern
Rating:86.7
Current Trading Positions for Wisdom Tree U.S. Dividend Growth Fund (DGRW) Daily on 12-Feb-2016
* An Intermediate degree trader (hold positions from months to quarters), would currently be shorting this market. The probability of this Target Area being correct is 70.8%. However, the random probability of this Target Area being correct is 45.0%. So the true probability of this Target Area being correct is 57.3% better than random.
Extensive Elliott Commentary for Wisdom Tree U.S. Dividend Growth Fund (DGRW) Daily on 12-Feb-2016 with two incomplete patterns:
Wave (2) of the Intermediate degree Impulse with a rating of 96.3 is expected to complete in the price range 27.24 to 28.83, but more probably between 28.04 and 28.66. This wave was expected to complete before 03-Feb-2016, and must complete by 29-Feb-2016.
After this wave (2) is complete, expect the market to continue up into wave (3). Wave (3) should always be an Impulse and should retrace wave (2) completely. Expect wave (3) to retrace wave (2) by 164% - 383%. Wave (3) can also be expected to be 83% - 383% of the price length of wave (1). The expected time for wave (3) to complete is 87% - 367% of the time taken for wave (2) to complete and 16% - 97% of the time taken for wave (1) to complete. The slope (ie. price range divided by time taken) of wave (3) should be between 70% and 219% of the slope of wave (1). Once wave (3) is complete, expect wave (4) to be a sideways corrective movement, then wave (5) to continue in the same direction as wave (3). Wave (5) will complete this Impulse.
Wave C of the Primary degree inverted Flat with a rating of 86.7 is expected to complete in the price range 28.17 to 38.57, but more probably between 30.75 and 34.71. This wave is due to complete anytime from now until 20-Feb-2017, but is most likely to complete before 04-Apr-2016.
This wave C will complete the Flat pattern.
Current Analysis Settings: Analysis Date Range: 08-Apr-2015 to 12-Feb-2016, Label Range: 15 - 50, Preferred Count Labels: 15, Min Rating: 75, Stocks toggle ON, Bias Towards Beginning of Data: 8, Bias Towards Major High/Low: 8, Largest Degree Wave Filter: Any Pattern
Rating:101.4
Current Trading Positions for Wisdomtree Emerging Markets (ELD) Daily on 12-Feb-2016
* A Cycle degree trader (hold positions from quarters to years), would currently be trading long in this market. The probability of this Target Area being correct is 50.1%. However, the random probability of this Target Area being correct is 34.0%. So the true probability of this Target Area being correct is 47.4% better than random.
Extensive Elliott Commentary for Wisdomtree Emerging Markets (ELD) Daily on 12-Feb-2016 with one incomplete pattern:
Wave b of the Cycle degree Flat with a rating of 101.4 is expected to complete in the price range 37.07 to 49.46, but more probably between 37.2 and 40.44. This wave could complete anytime between now and 03-Apr-2019, but is most likely to complete sometime between 16-Feb-2016 and 11-Jul-2016.
After wave b is complete, expect the market to continue down into wave c, which should be a five wave Impulsive pattern. Expect wave c to retrace wave b by 86% - 162%. Wave c can also be expected to be 90% - 162% of the price length of wave a. The expected time for wave c to complete is 19% - 134% of the time taken for wave b to complete and 24% - 115% of the time taken for wave a to complete.
Current Analysis Settings: Analysis Date Range: 28-May-2014 to 12-Feb-2016, Label Range: 15 - 50, Preferred Count Labels: 20, Min Rating: 75, Stocks toggle ON, Bias Towards Beginning of Data: 8, Bias Towards Major High/Low: 8, Largest Degree Wave Filter: Any Pattern
Rating:103.1
Current Trading Positions for WisdomTree Emerging Markets High-Yielding Equity ETF (DEM) Daily on 12-Feb-2016
* A Cycle degree trader (hold positions from quarters to years), would currently be trading long in this market. The probability of this Target Area being correct is 50.3%. However, the random probability of this Target Area being correct is 34.0%. So the true probability of this Target Area being correct is 47.9% better than random.
Extensive Elliott Commentary for WisdomTree Emerging Markets High-Yielding Equity ETF (DEM) Daily on 12-Feb-2016 with one incomplete pattern:
Wave b of the Cycle degree Flat with a rating of 103.1 is expected to complete in the price range 45.44 to 97.38, but more probably between 45.98 and 59.71. This wave could complete anytime between now and 24-Apr-2024, but is most likely to complete sometime between 03-Mar-2016 and 10-Mar-2017.
After wave b is complete, expect the market to continue down into wave c, which should be a five wave Impulsive pattern. Expect wave c to retrace wave b by 85% - 162%. Wave c can also be expected to be 90% - 162% of the price length of wave a. The expected time for wave c to complete is 20% - 136% of the time taken for wave b to complete and 20% - 110% of the time taken for wave a to complete.
Current Analysis Settings: Analysis Date Range: 25-Jul-2014 to 12-Feb-2016, Label Range: 15 - 50, Preferred Count Labels: 16, Min Rating: 75, Stocks toggle ON, Bias Towards Beginning of Data: 8, Bias Towards Major High/Low: 8, Largest Degree Wave Filter: Any Pattern
Rating:88.9
Current Trading Positions for WisdomTree Emerging Markets Small Cap Dividend Fund ETF (DGS) Daily on 12-Feb-2016
* An Intermediate degree trader (hold positions from months to quarters), would currently be shorting this market. The probability of this Target Area being correct is 70.9%. However, the random probability of this Target Area being correct is 45.0%. So the true probability of this Target Area being correct is 57.6% better than random.
Extensive Elliott Commentary for WisdomTree Emerging Markets Small Cap Dividend Fund ETF (DGS) Daily on 12-Feb-2016 with two incomplete patterns:
Wave (2) of the Intermediate degree Impulse with a rating of 97.6 is expected to complete in the price range 30.63 to 33.33, but more probably between 31.99 and 33.05. This wave was expected to complete before 09-Feb-2016, and must complete by 14-Mar-2016.
After this wave (2) is complete, expect the market to continue up into wave (3). Wave (3) should always be an Impulse and should retrace wave (2) completely. Expect wave (3) to retrace wave (2) by 164% - 383%. Wave (3) can also be expected to be 83% - 383% of the price length of wave (1). The expected time for wave (3) to complete is 87% - 367% of the time taken for wave (2) to complete and 16% - 97% of the time taken for wave (1) to complete. The slope (ie. price range divided by time taken) of wave (3) should be between 70% and 219% of the slope of wave (1). Once wave (3) is complete, expect wave (4) to be a sideways corrective movement, then wave (5) to continue in the same direction as wave (3). Wave (5) will complete this Impulse.
Wave C of the Primary degree inverted Flat with a rating of 88.9 is expected to complete in the price range 32.41 to 49.5, but more probably between 36.91 and 43.34. This wave is due to complete anytime from now until 08-Jul-2016, but is most likely to complete before 06-May-2016.
This wave C will complete the Flat pattern.
Current Analysis Settings: Analysis Date Range: 25-Jul-2014 to 12-Feb-2016, Label Range: 15 - 50, Preferred Count Labels: 25, Min Rating: 75, Stocks toggle ON, Bias Towards Beginning of Data: 8, Bias Towards Major High/Low: 8, Largest Degree Wave Filter: Any Pattern
Rating:104.6
Current Trading Positions for WisdomTree Europe SmallCap Dividend Fund (DFE) Daily on 12-Feb-2016
* An Intermediate degree trader (hold positions from months to quarters), would currently be trading long in this market. The probability of this Target Area being correct is 87.4%. However, the random probability of this Target Area being correct is 64.1%. So the true probability of this Target Area being correct is 36.3% better than random.
Extensive Elliott Commentary for WisdomTree Europe SmallCap Dividend Fund (DFE) Daily on 12-Feb-2016 with one incomplete pattern:
Wave (Y) of the Intermediate degree inverted Double 3 with a rating of 104.6 is expected to complete in the price range 49.57 to 69.18, but more probably between 52.84 and 58.24. This wave is due to complete anytime from now until 09-Mar-2016, but is most likely to complete before 24-Feb-2016.
Wave (Y) will probably complete this Double Sideways pattern, although it could possibly extend into a Triple Sideways pattern.
Current Analysis Settings: Analysis Date Range: 25-Apr-2014 to 12-Feb-2016, Label Range: 15 - 50, Preferred Count Labels: 39, Min Rating: 75, Stocks toggle ON, Bias Towards Beginning of Data: 8, Bias Towards Major High/Low: 8, Largest Degree Wave Filter: Any Pattern
Rating:107.8
Current Trading Positions for WisdomTree India Earnings Fund ETF (EPI) Daily on 12-Feb-2016
* A Cycle degree trader (hold positions from quarters to years), would currently be shorting this market. The probability of this Target Area being correct is 50.7%. However, the random probability of this Target Area being correct is 34.0%. So the true probability of this Target Area being correct is 49.1% better than random.
Extensive Elliott Commentary for WisdomTree India Earnings Fund ETF (EPI) Daily on 12-Feb-2016 with one incomplete pattern:
Wave b of the Cycle degree inverted Flat with a rating of 107.8 is expected to complete in the price range 11.5 to 17.11, but more probably between 15.75 and 16.98. This wave could complete anytime between now and 02-Apr-2019, but is most likely to complete sometime between 24-Feb-2016 and 03-Oct-2016.
After wave b is complete, expect the market to continue up into wave c, which should be a five wave Impulsive pattern. Expect wave c to retrace wave b by 82% - 179%. Wave c can also be expected to be 67% - 179% of the price length of wave a. The expected time for wave c to complete is 20% - 151% of the time taken for wave b to complete and 11% - 58% of the time taken for wave a to complete.
Current Analysis Settings: Analysis Date Range: 19-Dec-2013 to 12-Feb-2016, Label Range: 15 - 50, Preferred Count Labels: 25, Min Rating: 75, Stocks toggle ON, Bias Towards Beginning of Data: 8, Bias Towards Major High/Low: 8, Largest Degree Wave Filter: Any Pattern
Rating:94.5
Current Trading Positions for Yorkville High Income MLP Exchange ETF (YMLP) Daily on 12-Feb-2016
* A Cycle degree trader (hold positions from quarters to years), would currently be shorting this market. The probability of this Target Area being correct is 56.4%. However, the random probability of this Target Area being correct is 45.0%. So the true probability of this Target Area being correct is 25.3% better than random.
Extensive Elliott Commentary for Yorkville High Income MLP Exchange ETF (YMLP) Daily on 12-Feb-2016 with one incomplete pattern:
Wave c of the Cycle degree Zigzag with a rating of 94.5 is expected to complete at a price no higher than 3.29, but more probably no higher than 2.14. This wave is most likely to complete sometime between 01-Mar-2016 and 08-Mar-2016 Note that it cannot complete until 18-Feb-2016 but must complete by 28-Mar-2016.
This wave c will complete the ZigZag pattern.
Current Analysis Settings: Analysis Date Range: 12-Jun-2014 to 12-Feb-2016, Label Range: 15 - 50, Preferred Count Labels: 16, Min Rating: 75, Stocks toggle ON, Bias Towards Beginning of Data: 8, Bias Towards Major High/Low: 8, Largest Degree Wave Filter: Any Pattern