Elliott Wave Scan Results * Major World Indexes * 160319 To search for a ticker, use Ctrl F and search for (TIKR .. that is, use a ( before the ticker symbol. For summary sorted by Ticker, go to page 3. For summary sorted by Patterns, go to page 4. For summary sorted by Trade Type and Rating, go to page 5. For summary sorted by Better Than Random, go to page 6. Use Ctrl N to jump to page number. Note: Any ticker for which there is no chart indicates that the Elliott Wave analyzer found "no incomplete wave patterns" and therefore recommends you "stay out of the market" with that ticker. A word of CAUTION about these Elliott Wave forecast charts -- keep in mind that these chart sets are produced by a "scanner" feature that does not optimize the wave pattern selection beyond a very basic level. The scanner picks what it considers the "best fit" from the various possible pattern sequences. When you do a manual analysis, you would normally evaluate long term wave patterns, then shorter and shorter patterns and - most importantly - you would then match the short term pattern choices so they fit properly with the longer term patterns. Using the scanner feature to create "short term" predictions (from days to a few weeks), we are using only a small sample of the most recent data. Otherwise, the chart and patterns become congested and difficult to read. So, IF the scanner starts the short term wave count at an appropriate point and with the appropriate starting pattern, then the resulting prediction will be quite accurate. Otherwise, it is just one of many possibilities. Remember, also, that we provide a sorted list at the front of the chart sets where the Longs and Shorts are sorted based on the Rating. Ratings under 80 are not considered valid. The higher the rating, over 80, the more likely it is to be valid and important. Refer also to the BTR (Better Than Random) rating, which gives another measure of how relevant the forecast may be. Pattern sort is first by pattern (ascending), then by degree (ascending) and then by wave (descending, that is - latest waves first). Rating sort is by rating (descending) with Longs grouped first, then Shorts grouped; high numbers better, below 80 is "suspect." BTR sort is "Better Than Random" and shows the statistical probability that the prediction is better than random. WAVE DEGREES (from longer to shorter times): Grand, Supercycle, Cycle, Primary, Intermediate, Minor, Minute, Minuette, SubMinuette, Micro For some guidance on interpreting the EW charts provided here, download this file: http://jimcooper.biz/stockcharts/Interpreting_ewa_charts_02.pdf See next page for hyperlinked Table of Contents listed by Security name.
Transcript
Elliott Wave Scan Results * Major World Indexes * 160319
To search for a ticker, use Ctrl F and search for (TIKR .. that is, use a ( before the ticker symbol. For summary sorted by Ticker, go to page 3.
For summary sorted by Patterns, go to page 4.
For summary sorted by Trade Type and Rating, go to page 5.
For summary sorted by Better Than Random, go to page 6.
Use Ctrl N to jump to page number.
Note: Any ticker for which there is no chart indicates that the Elliott Wave analyzer found "no incomplete wave patterns" and therefore recommends you "stay out of the market" with that ticker.
A word of CAUTION about these Elliott Wave forecast charts -- keep in mind that these chart sets are produced by a "scanner" feature that does not optimize the wave pattern selection beyond a very basic level. The scanner picks what it considers the "best fit" from the various possible pattern sequences. When you do a manual analysis, you would normally evaluate long term wave patterns, then shorter and shorter patterns and - most importantly - you would then match the short term pattern choices so they fit properly with the longer term patterns. Using the scanner feature to create "short term" predictions (from days to a few weeks), we are using only a small sample of the most recent data. Otherwise, the chart and patterns become congested and difficult to read. So, IF the scanner starts the short term wave count at an appropriate point and with the appropriate starting pattern, then the resulting prediction will be quite accurate. Otherwise, it is just one of many possibilities. Remember, also, that we provide a sorted list at the front of the chart sets where the Longs and Shorts are sorted based on the Rating. Ratings under 80 are not considered valid. The higher the rating, over 80, the more likely it is to be valid and important. Refer also to the BTR (Better Than Random) rating, which gives another measure of how relevant the forecast may be.
Pattern sort is first by pattern (ascending), then by degree (ascending) and then by wave (descending, that is - latest waves first).
Rating sort is by rating (descending) with Longs grouped first, then Shorts grouped; high numbers better, below 80 is "suspect."
BTR sort is "Better Than Random" and shows the statistical probability that the prediction is better than random.
Elliott Wave Scan Results * Major World Indexes * 160319 .................................................................................................................... 1
Current Trading Positions for Amex International Market Index (ADR--X) Daily on 18-Mar-2016.....................................7
Current Trading Positions for CBOE China ETF Volatility Index (VXFXI) Daily on 18-Mar-2016.....................................8
Current Trading Positions for DJ Shanghai Index (DJSH-X) Daily on 18-Mar-2016 ..........................................................10
Current Trading Positions for Dow Jones Industrials (DJ-30) Daily on 18-Mar-2016 .........................................................12
Current Trading Positions for Dow Jones Transport Avg (DJ-20) Daily on 18-Mar-2016...................................................14
Current Trading Positions for Dow Jones Utility Average (DJ-15) Daily on 18-Mar-2016 .................................................15
Current Trading Positions for Hong Kong Hang Seng Index (HKHS-X) Daily on 18-Mar-2016........................................17
Current Trading Positions for Japan Index (JPN--X) Daily on 18-Mar-2016 .......................................................................19
Current Trading Positions for Korea Se KOSPI (KS11-X) Daily on 18-Mar-2016..............................................................21
Current Trading Positions for London Ftse-100 Index (FTSE-X) Daily on 18-Mar-2016 ...................................................22
Current Trading Positions for Mexican Ipc Index (MEXI-X) Daily on 18-Mar-2016..........................................................23
Current Trading Positions for Mexico Index (MXY--X) Daily on 18-Mar-2016 .................................................................24
Current Trading Positions for Nasdaq 100 Index (NDX--X) Daily on 18-Mar-2016 ...........................................................26
Current Trading Positions for Nasdaq Composite Index (COMPQX) Daily on 18-Mar-2016.............................................28
Current Trading Positions for OMX Stockholm 30 Index (OMX--X) Daily on 18-Mar-2016.............................................30
Current Trading Positions for Paris CAC-40 Index (PCAC-X) Daily on 18-Mar-2016 .......................................................32
Current Trading Positions for Sao Paulo Se BOVESPA Index (BVSP-X) Daily on 18-Mar-2016......................................33
Current Trading Positions for Shanghai Se Composite Index (SSEC-X) Daily on 18-Mar-2016 ........................................35
Current Trading Positions for Sydney All Ordinaries Index (AORD-X) Daily on 18-Mar-2016.........................................37
Current Trading Positions for Taiwan Weighted Index (TWII-X) Daily on 18-Mar-2016...................................................38
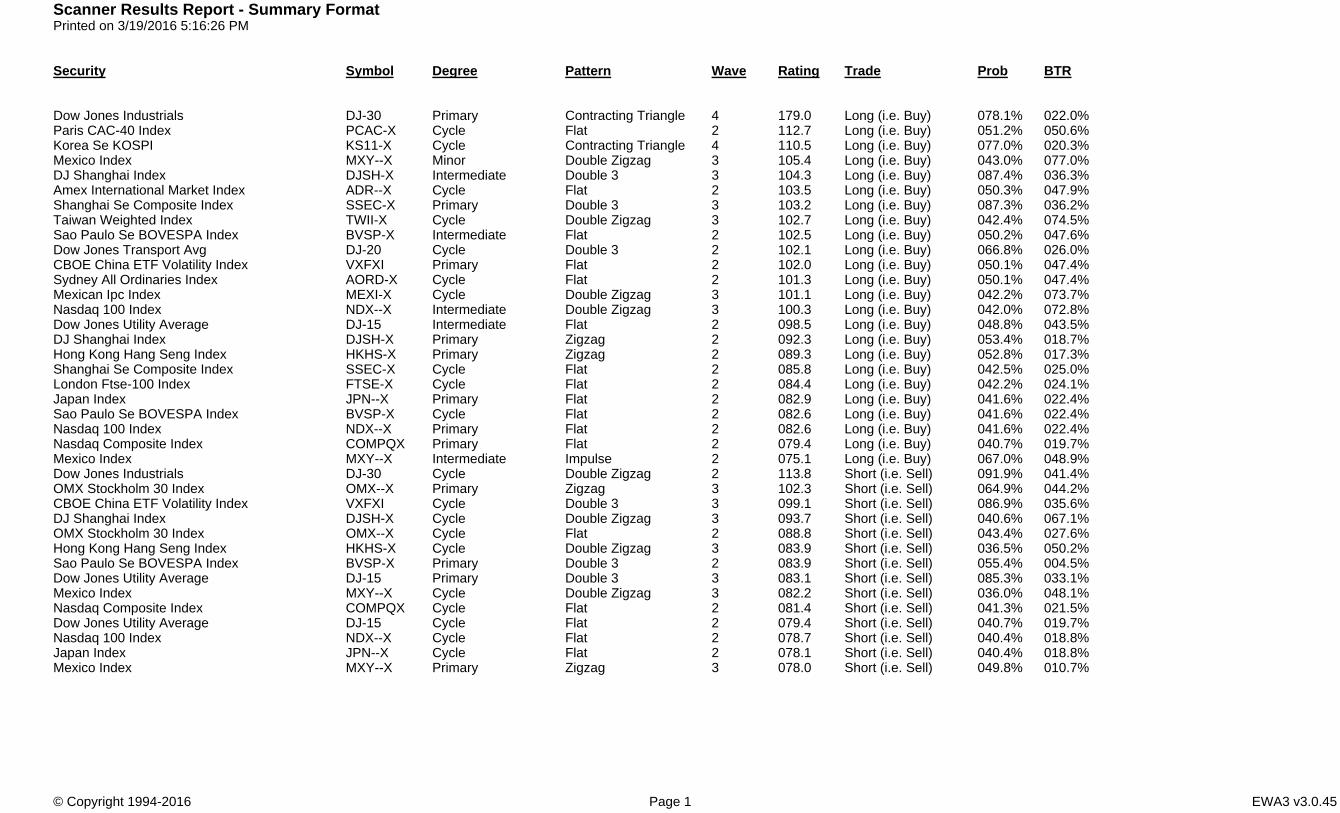
Scanner Results Report - Summary FormatPrinted on 3/19/2016 5:12:14 PM
Security Symbol Degree Pattern Wave Rating Trade Prob BTR
Amex International Market Index ADR--X Cycle Flat 2 103.5 Long (i.e. Buy) 050.3% 047.9%Sydney All Ordinaries Index AORD-X Cycle Flat 2 101.3 Long (i.e. Buy) 050.1% 047.4%Sao Paulo Se BOVESPA Index BVSP-X Intermediate Flat 2 102.5 Long (i.e. Buy) 050.2% 047.6%Sao Paulo Se BOVESPA Index BVSP-X Primary Double 3 2 083.9 Short (i.e. Sell) 055.4% 004.5%Sao Paulo Se BOVESPA Index BVSP-X Cycle Flat 2 082.6 Long (i.e. Buy) 041.6% 022.4%Nasdaq Composite Index COMPQX Primary Flat 2 079.4 Long (i.e. Buy) 040.7% 019.7%Nasdaq Composite Index COMPQX Cycle Flat 2 081.4 Short (i.e. Sell) 041.3% 021.5%Dow Jones Utility Average DJ-15 Intermediate Flat 2 098.5 Long (i.e. Buy) 048.8% 043.5%Dow Jones Utility Average DJ-15 Primary Double 3 3 083.1 Short (i.e. Sell) 085.3% 033.1%Dow Jones Utility Average DJ-15 Cycle Flat 2 079.4 Short (i.e. Sell) 040.7% 019.7%Dow Jones Transport Avg DJ-20 Cycle Double 3 2 102.1 Long (i.e. Buy) 066.8% 026.0%Dow Jones Industrials DJ-30 Primary Contracting Triangle 4 179.0 Long (i.e. Buy) 078.1% 022.0%Dow Jones Industrials DJ-30 Cycle Double Zigzag 2 113.8 Short (i.e. Sell) 091.9% 041.4%DJ Shanghai Index DJSH-X Intermediate Double 3 3 104.3 Long (i.e. Buy) 087.4% 036.3%DJ Shanghai Index DJSH-X Primary Zigzag 2 092.3 Long (i.e. Buy) 053.4% 018.7%DJ Shanghai Index DJSH-X Cycle Double Zigzag 3 093.7 Short (i.e. Sell) 040.6% 067.1%London Ftse-100 Index FTSE-X Cycle Flat 2 084.4 Long (i.e. Buy) 042.2% 024.1%Hong Kong Hang Seng Index HKHS-X Primary Zigzag 2 089.3 Long (i.e. Buy) 052.8% 017.3%Hong Kong Hang Seng Index HKHS-X Cycle Double Zigzag 3 083.9 Short (i.e. Sell) 036.5% 050.2%Japan Index JPN--X Primary Flat 2 082.9 Long (i.e. Buy) 041.6% 022.4%Japan Index JPN--X Cycle Flat 2 078.1 Short (i.e. Sell) 040.4% 018.8%Korea Se KOSPI KS11-X Cycle Contracting Triangle 4 110.5 Long (i.e. Buy) 077.0% 020.3%Mexican Ipc Index MEXI-X Cycle Double Zigzag 3 101.1 Long (i.e. Buy) 042.2% 073.7%Mexico Index MXY--X Minor Double Zigzag 3 105.4 Long (i.e. Buy) 043.0% 077.0%Mexico Index MXY--X Intermediate Impulse 2 075.1 Long (i.e. Buy) 067.0% 048.9%Mexico Index MXY--X Primary Zigzag 3 078.0 Short (i.e. Sell) 049.8% 010.7%Mexico Index MXY--X Cycle Double Zigzag 3 082.2 Short (i.e. Sell) 036.0% 048.1%Nasdaq 100 Index NDX--X Intermediate Double Zigzag 3 100.3 Long (i.e. Buy) 042.0% 072.8%Nasdaq 100 Index NDX--X Primary Flat 2 082.6 Long (i.e. Buy) 041.6% 022.4%Nasdaq 100 Index NDX--X Cycle Flat 2 078.7 Short (i.e. Sell) 040.4% 018.8%OMX Stockholm 30 Index OMX--X Primary Zigzag 3 102.3 Short (i.e. Sell) 064.9% 044.2%OMX Stockholm 30 Index OMX--X Cycle Flat 2 088.8 Short (i.e. Sell) 043.4% 027.6%Paris CAC-40 Index PCAC-X Cycle Flat 2 112.7 Long (i.e. Buy) 051.2% 050.6%Shanghai Se Composite Index SSEC-X Primary Double 3 3 103.2 Long (i.e. Buy) 087.3% 036.2%Shanghai Se Composite Index SSEC-X Cycle Flat 2 085.8 Long (i.e. Buy) 042.5% 025.0%Taiwan Weighted Index TWII-X Cycle Double Zigzag 3 102.7 Long (i.e. Buy) 042.4% 074.5%CBOE China ETF Volatility Index VXFXI Primary Flat 2 102.0 Long (i.e. Buy) 050.1% 047.4%CBOE China ETF Volatility Index VXFXI Cycle Double 3 3 099.1 Short (i.e. Sell) 086.9% 035.6%
Scanner Results Report - Summary FormatPrinted on 3/19/2016 5:15:20 PM
Security Symbol Degree Pattern Wave Rating Trade Prob BTR
Korea Se KOSPI KS11-X Cycle Contracting Triangle 4 110.5 Long (i.e. Buy) 077.0% 020.3%Dow Jones Industrials DJ-30 Primary Contracting Triangle 4 179.0 Long (i.e. Buy) 078.1% 022.0%CBOE China ETF Volatility Index VXFXI Cycle Double 3 3 099.1 Short (i.e. Sell) 086.9% 035.6%DJ Shanghai Index DJSH-X Intermediate Double 3 3 104.3 Long (i.e. Buy) 087.4% 036.3%Dow Jones Utility Average DJ-15 Primary Double 3 3 083.1 Short (i.e. Sell) 085.3% 033.1%Shanghai Se Composite Index SSEC-X Primary Double 3 3 103.2 Long (i.e. Buy) 087.3% 036.2%DJ Shanghai Index DJSH-X Cycle Double Zigzag 3 093.7 Short (i.e. Sell) 040.6% 067.1%Hong Kong Hang Seng Index HKHS-X Cycle Double Zigzag 3 083.9 Short (i.e. Sell) 036.5% 050.2%Mexican Ipc Index MEXI-X Cycle Double Zigzag 3 101.1 Long (i.e. Buy) 042.2% 073.7%Mexico Index MXY--X Cycle Double Zigzag 3 082.2 Short (i.e. Sell) 036.0% 048.1%Taiwan Weighted Index TWII-X Cycle Double Zigzag 3 102.7 Long (i.e. Buy) 042.4% 074.5%Nasdaq 100 Index NDX--X Intermediate Double Zigzag 3 100.3 Long (i.e. Buy) 042.0% 072.8%Mexico Index MXY--X Minor Double Zigzag 3 105.4 Long (i.e. Buy) 043.0% 077.0%Mexico Index MXY--X Primary Zigzag 3 078.0 Short (i.e. Sell) 049.8% 010.7%OMX Stockholm 30 Index OMX--X Primary Zigzag 3 102.3 Short (i.e. Sell) 064.9% 044.2%Dow Jones Transport Avg DJ-20 Cycle Double 3 2 102.1 Long (i.e. Buy) 066.8% 026.0%Sao Paulo Se BOVESPA Index BVSP-X Primary Double 3 2 083.9 Short (i.e. Sell) 055.4% 004.5%Dow Jones Industrials DJ-30 Cycle Double Zigzag 2 113.8 Short (i.e. Sell) 091.9% 041.4%Amex International Market Index ADR--X Cycle Flat 2 103.5 Long (i.e. Buy) 050.3% 047.9%Sydney All Ordinaries Index AORD-X Cycle Flat 2 101.3 Long (i.e. Buy) 050.1% 047.4%Sao Paulo Se BOVESPA Index BVSP-X Cycle Flat 2 082.6 Long (i.e. Buy) 041.6% 022.4%Nasdaq Composite Index COMPQX Cycle Flat 2 081.4 Short (i.e. Sell) 041.3% 021.5%Dow Jones Utility Average DJ-15 Cycle Flat 2 079.4 Short (i.e. Sell) 040.7% 019.7%London Ftse-100 Index FTSE-X Cycle Flat 2 084.4 Long (i.e. Buy) 042.2% 024.1%Japan Index JPN--X Cycle Flat 2 078.1 Short (i.e. Sell) 040.4% 018.8%Nasdaq 100 Index NDX--X Cycle Flat 2 078.7 Short (i.e. Sell) 040.4% 018.8%OMX Stockholm 30 Index OMX--X Cycle Flat 2 088.8 Short (i.e. Sell) 043.4% 027.6%Paris CAC-40 Index PCAC-X Cycle Flat 2 112.7 Long (i.e. Buy) 051.2% 050.6%Shanghai Se Composite Index SSEC-X Cycle Flat 2 085.8 Long (i.e. Buy) 042.5% 025.0%Sao Paulo Se BOVESPA Index BVSP-X Intermediate Flat 2 102.5 Long (i.e. Buy) 050.2% 047.6%Dow Jones Utility Average DJ-15 Intermediate Flat 2 098.5 Long (i.e. Buy) 048.8% 043.5%Nasdaq Composite Index COMPQX Primary Flat 2 079.4 Long (i.e. Buy) 040.7% 019.7%Japan Index JPN--X Primary Flat 2 082.9 Long (i.e. Buy) 041.6% 022.4%Nasdaq 100 Index NDX--X Primary Flat 2 082.6 Long (i.e. Buy) 041.6% 022.4%CBOE China ETF Volatility Index VXFXI Primary Flat 2 102.0 Long (i.e. Buy) 050.1% 047.4%Mexico Index MXY--X Intermediate Impulse 2 075.1 Long (i.e. Buy) 067.0% 048.9%DJ Shanghai Index DJSH-X Primary Zigzag 2 092.3 Long (i.e. Buy) 053.4% 018.7%Hong Kong Hang Seng Index HKHS-X Primary Zigzag 2 089.3 Long (i.e. Buy) 052.8% 017.3%
Scanner Results Report - Summary FormatPrinted on 3/19/2016 5:16:26 PM
Security Symbol Degree Pattern Wave Rating Trade Prob BTR
Dow Jones Industrials DJ-30 Primary Contracting Triangle 4 179.0 Long (i.e. Buy) 078.1% 022.0%Paris CAC-40 Index PCAC-X Cycle Flat 2 112.7 Long (i.e. Buy) 051.2% 050.6%Korea Se KOSPI KS11-X Cycle Contracting Triangle 4 110.5 Long (i.e. Buy) 077.0% 020.3%Mexico Index MXY--X Minor Double Zigzag 3 105.4 Long (i.e. Buy) 043.0% 077.0%DJ Shanghai Index DJSH-X Intermediate Double 3 3 104.3 Long (i.e. Buy) 087.4% 036.3%Amex International Market Index ADR--X Cycle Flat 2 103.5 Long (i.e. Buy) 050.3% 047.9%Shanghai Se Composite Index SSEC-X Primary Double 3 3 103.2 Long (i.e. Buy) 087.3% 036.2%Taiwan Weighted Index TWII-X Cycle Double Zigzag 3 102.7 Long (i.e. Buy) 042.4% 074.5%Sao Paulo Se BOVESPA Index BVSP-X Intermediate Flat 2 102.5 Long (i.e. Buy) 050.2% 047.6%Dow Jones Transport Avg DJ-20 Cycle Double 3 2 102.1 Long (i.e. Buy) 066.8% 026.0%CBOE China ETF Volatility Index VXFXI Primary Flat 2 102.0 Long (i.e. Buy) 050.1% 047.4%Sydney All Ordinaries Index AORD-X Cycle Flat 2 101.3 Long (i.e. Buy) 050.1% 047.4%Mexican Ipc Index MEXI-X Cycle Double Zigzag 3 101.1 Long (i.e. Buy) 042.2% 073.7%Nasdaq 100 Index NDX--X Intermediate Double Zigzag 3 100.3 Long (i.e. Buy) 042.0% 072.8%Dow Jones Utility Average DJ-15 Intermediate Flat 2 098.5 Long (i.e. Buy) 048.8% 043.5%DJ Shanghai Index DJSH-X Primary Zigzag 2 092.3 Long (i.e. Buy) 053.4% 018.7%Hong Kong Hang Seng Index HKHS-X Primary Zigzag 2 089.3 Long (i.e. Buy) 052.8% 017.3%Shanghai Se Composite Index SSEC-X Cycle Flat 2 085.8 Long (i.e. Buy) 042.5% 025.0%London Ftse-100 Index FTSE-X Cycle Flat 2 084.4 Long (i.e. Buy) 042.2% 024.1%Japan Index JPN--X Primary Flat 2 082.9 Long (i.e. Buy) 041.6% 022.4%Sao Paulo Se BOVESPA Index BVSP-X Cycle Flat 2 082.6 Long (i.e. Buy) 041.6% 022.4%Nasdaq 100 Index NDX--X Primary Flat 2 082.6 Long (i.e. Buy) 041.6% 022.4%Nasdaq Composite Index COMPQX Primary Flat 2 079.4 Long (i.e. Buy) 040.7% 019.7%Mexico Index MXY--X Intermediate Impulse 2 075.1 Long (i.e. Buy) 067.0% 048.9%Dow Jones Industrials DJ-30 Cycle Double Zigzag 2 113.8 Short (i.e. Sell) 091.9% 041.4%OMX Stockholm 30 Index OMX--X Primary Zigzag 3 102.3 Short (i.e. Sell) 064.9% 044.2%CBOE China ETF Volatility Index VXFXI Cycle Double 3 3 099.1 Short (i.e. Sell) 086.9% 035.6%DJ Shanghai Index DJSH-X Cycle Double Zigzag 3 093.7 Short (i.e. Sell) 040.6% 067.1%OMX Stockholm 30 Index OMX--X Cycle Flat 2 088.8 Short (i.e. Sell) 043.4% 027.6%Hong Kong Hang Seng Index HKHS-X Cycle Double Zigzag 3 083.9 Short (i.e. Sell) 036.5% 050.2%Sao Paulo Se BOVESPA Index BVSP-X Primary Double 3 2 083.9 Short (i.e. Sell) 055.4% 004.5%Dow Jones Utility Average DJ-15 Primary Double 3 3 083.1 Short (i.e. Sell) 085.3% 033.1%Mexico Index MXY--X Cycle Double Zigzag 3 082.2 Short (i.e. Sell) 036.0% 048.1%Nasdaq Composite Index COMPQX Cycle Flat 2 081.4 Short (i.e. Sell) 041.3% 021.5%Dow Jones Utility Average DJ-15 Cycle Flat 2 079.4 Short (i.e. Sell) 040.7% 019.7%Nasdaq 100 Index NDX--X Cycle Flat 2 078.7 Short (i.e. Sell) 040.4% 018.8%Japan Index JPN--X Cycle Flat 2 078.1 Short (i.e. Sell) 040.4% 018.8%Mexico Index MXY--X Primary Zigzag 3 078.0 Short (i.e. Sell) 049.8% 010.7%
Scanner Results Report - Summary FormatPrinted on 3/19/2016 5:17:23 PM
Security Symbol Degree Pattern Wave Rating Trade Prob BTR
Mexico Index MXY--X Minor Double Zigzag 3 105.4 Long (i.e. Buy) 043.0% 077.0%Taiwan Weighted Index TWII-X Cycle Double Zigzag 3 102.7 Long (i.e. Buy) 042.4% 074.5%Mexican Ipc Index MEXI-X Cycle Double Zigzag 3 101.1 Long (i.e. Buy) 042.2% 073.7%Nasdaq 100 Index NDX--X Intermediate Double Zigzag 3 100.3 Long (i.e. Buy) 042.0% 072.8%DJ Shanghai Index DJSH-X Cycle Double Zigzag 3 093.7 Short (i.e. Sell) 040.6% 067.1%Paris CAC-40 Index PCAC-X Cycle Flat 2 112.7 Long (i.e. Buy) 051.2% 050.6%Hong Kong Hang Seng Index HKHS-X Cycle Double Zigzag 3 083.9 Short (i.e. Sell) 036.5% 050.2%Mexico Index MXY--X Intermediate Impulse 2 075.1 Long (i.e. Buy) 067.0% 048.9%Mexico Index MXY--X Cycle Double Zigzag 3 082.2 Short (i.e. Sell) 036.0% 048.1%Amex International Market Index ADR--X Cycle Flat 2 103.5 Long (i.e. Buy) 050.3% 047.9%Sao Paulo Se BOVESPA Index BVSP-X Intermediate Flat 2 102.5 Long (i.e. Buy) 050.2% 047.6%CBOE China ETF Volatility Index VXFXI Primary Flat 2 102.0 Long (i.e. Buy) 050.1% 047.4%Sydney All Ordinaries Index AORD-X Cycle Flat 2 101.3 Long (i.e. Buy) 050.1% 047.4%OMX Stockholm 30 Index OMX--X Primary Zigzag 3 102.3 Short (i.e. Sell) 064.9% 044.2%Dow Jones Utility Average DJ-15 Intermediate Flat 2 098.5 Long (i.e. Buy) 048.8% 043.5%Dow Jones Industrials DJ-30 Cycle Double Zigzag 2 113.8 Short (i.e. Sell) 091.9% 041.4%DJ Shanghai Index DJSH-X Intermediate Double 3 3 104.3 Long (i.e. Buy) 087.4% 036.3%Shanghai Se Composite Index SSEC-X Primary Double 3 3 103.2 Long (i.e. Buy) 087.3% 036.2%CBOE China ETF Volatility Index VXFXI Cycle Double 3 3 099.1 Short (i.e. Sell) 086.9% 035.6%Dow Jones Utility Average DJ-15 Primary Double 3 3 083.1 Short (i.e. Sell) 085.3% 033.1%OMX Stockholm 30 Index OMX--X Cycle Flat 2 088.8 Short (i.e. Sell) 043.4% 027.6%Dow Jones Transport Avg DJ-20 Cycle Double 3 2 102.1 Long (i.e. Buy) 066.8% 026.0%Shanghai Se Composite Index SSEC-X Cycle Flat 2 085.8 Long (i.e. Buy) 042.5% 025.0%London Ftse-100 Index FTSE-X Cycle Flat 2 084.4 Long (i.e. Buy) 042.2% 024.1%Japan Index JPN--X Primary Flat 2 082.9 Long (i.e. Buy) 041.6% 022.4%Sao Paulo Se BOVESPA Index BVSP-X Cycle Flat 2 082.6 Long (i.e. Buy) 041.6% 022.4%Nasdaq 100 Index NDX--X Primary Flat 2 082.6 Long (i.e. Buy) 041.6% 022.4%Dow Jones Industrials DJ-30 Primary Contracting Triangle 4 179.0 Long (i.e. Buy) 078.1% 022.0%Nasdaq Composite Index COMPQX Cycle Flat 2 081.4 Short (i.e. Sell) 041.3% 021.5%Korea Se KOSPI KS11-X Cycle Contracting Triangle 4 110.5 Long (i.e. Buy) 077.0% 020.3%Nasdaq Composite Index COMPQX Primary Flat 2 079.4 Long (i.e. Buy) 040.7% 019.7%Dow Jones Utility Average DJ-15 Cycle Flat 2 079.4 Short (i.e. Sell) 040.7% 019.7%Nasdaq 100 Index NDX--X Cycle Flat 2 078.7 Short (i.e. Sell) 040.4% 018.8%Japan Index JPN--X Cycle Flat 2 078.1 Short (i.e. Sell) 040.4% 018.8%DJ Shanghai Index DJSH-X Primary Zigzag 2 092.3 Long (i.e. Buy) 053.4% 018.7%Hong Kong Hang Seng Index HKHS-X Primary Zigzag 2 089.3 Long (i.e. Buy) 052.8% 017.3%Mexico Index MXY--X Primary Zigzag 3 078.0 Short (i.e. Sell) 049.8% 010.7%Sao Paulo Se BOVESPA Index BVSP-X Primary Double 3 2 083.9 Short (i.e. Sell) 055.4% 004.5%
Current Trading Positions for Amex International Market Index (ADR--X) Daily on 18-Mar-2016
* A Cycle degree trader (hold positions from quarters to years), would currently be trading long in this market. The probability of this Target Area being correct is 50.3%. However, the random probability of this Target Area being correct is 34.0%. So the true probability of this Target Area being correct is 47.9% better than random.
Extensive Elliott Commentary for Amex International Market Index (ADR--X) Daily on 18-Mar-2016 with one incomplete pattern:
Wave b of the Cycle degree Flat with a rating of 103.5 is expected to complete in the price range 842.1 to 1286.96, but more probably between 846.71 and 964.26. This wave could complete anytime between now and 27-Oct-2025, but is most likely to complete sometime between 06-Apr-2016 and 16-Jun-2017.
After wave b is complete, expect the market to continue down into wave c, which should be a five wave Impulsive pattern. Expect wave c to retrace wave b by 85% - 162%. Wave c can also be expected to be 90% - 162% of the price length of wave a. The expected time for wave c to complete is 20% - 136% of the time taken for wave b to complete and 20% - 110% of the time taken for wave a to complete.
Current Analysis Settings: Analysis Date Range: 22-May-2014 to 18-Mar-2016, Label Range: 15 - 50, Preferred Count Labels: 18, Min Rating: 75, Stocks toggle ON, Bias Towards Beginning of Data: 8, Bias Towards Major High/Low: 8, Largest Degree Wave Filter: Any Pattern
Rating:99.1
Current Trading Positions for CBOE China ETF Volatility Index (VXFXI) Daily on 18-Mar-2016
* A Primary degree trader (hold positions from months to years), would currently be trading long in this market. The probability of this Target Area being correct is 50.1%. However, the random probability of this Target Area being correct is 34.0%. So the true probability of this Target Area being correct is 47.4% better than random.
* A Cycle degree trader (hold positions from quarters to years), would currently be shorting this market. The probability of this Target Area being correct is 86.9%. However, the random probability of this Target Area being correct is 64.1%. So the true probability of this Target Area being correct is 35.6% better than random.
Extensive Elliott Commentary for CBOE China ETF Volatility Index (VXFXI) Daily on 18-Mar-2016 with two incomplete patterns:
Wave B of the Primary degree Flat with a rating of 102 is expected to complete in the price range 40.85 to 118.31, but more probably between 41.29 and 55.95. This wave is most likely to complete sometime between 23-Mar-2016 and 16-May-2016 Note that it cannot complete until 21-Mar-2016 but must complete by 26-Oct-2016.
After wave B is complete, expect the market to continue down into wave C, which should be a five wave Impulsive pattern. Expect wave C to retrace wave B by 89% - 167%. Wave C can also be expected to be 104% - 167% of the price length of wave A. The expected time for wave C to complete is 20% - 146% of the time taken for wave B to complete and 53% - 275% of the time taken for wave A to complete.
Wave y of the Cycle degree Double 3 with a rating of 99.1 is expected to complete at a price no higher than 46.25, but more probably no higher than 24.73. This wave is due to complete anytime from now until 28-Jul-2016, but is most likely to complete before 04-May-2016.
Wave y will probably complete this Double Sideways pattern, although it could possibly extend into a Triple Sideways pattern.
Current Analysis Settings: Analysis Date Range: 20-May-2014 to 18-Mar-2016, Label Range: 15 - 50, Preferred Count Labels: 49, Min Rating: 75, Stocks toggle ON, Bias Towards Beginning of Data: 8, Bias Towards Major High/Low: 8, Largest Degree Wave Filter: Any Pattern
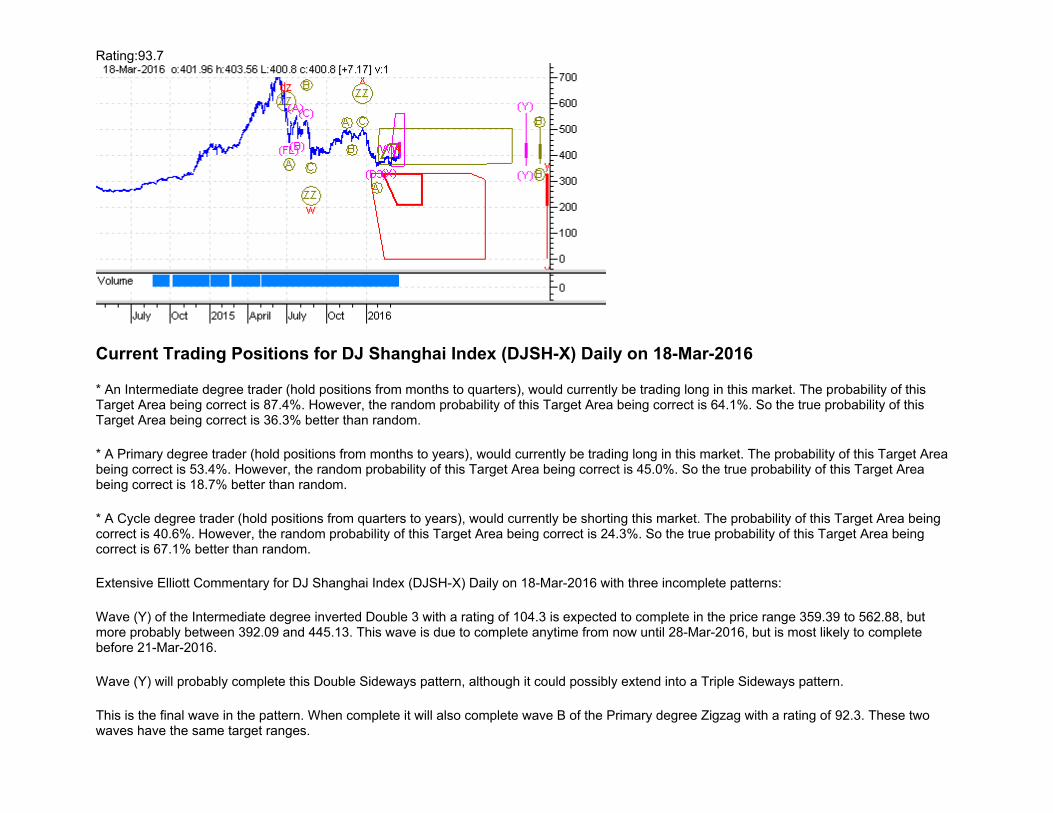
Rating:93.7
Current Trading Positions for DJ Shanghai Index (DJSH-X) Daily on 18-Mar-2016
* An Intermediate degree trader (hold positions from months to quarters), would currently be trading long in this market. The probability of this Target Area being correct is 87.4%. However, the random probability of this Target Area being correct is 64.1%. So the true probability of this Target Area being correct is 36.3% better than random.
* A Primary degree trader (hold positions from months to years), would currently be trading long in this market. The probability of this Target Area being correct is 53.4%. However, the random probability of this Target Area being correct is 45.0%. So the true probability of this Target Area being correct is 18.7% better than random.
* A Cycle degree trader (hold positions from quarters to years), would currently be shorting this market. The probability of this Target Area being correct is 40.6%. However, the random probability of this Target Area being correct is 24.3%. So the true probability of this Target Area being correct is 67.1% better than random.
Extensive Elliott Commentary for DJ Shanghai Index (DJSH-X) Daily on 18-Mar-2016 with three incomplete patterns:
Wave (Y) of the Intermediate degree inverted Double 3 with a rating of 104.3 is expected to complete in the price range 359.39 to 562.88, but more probably between 392.09 and 445.13. This wave is due to complete anytime from now until 28-Mar-2016, but is most likely to complete before 21-Mar-2016.
Wave (Y) will probably complete this Double Sideways pattern, although it could possibly extend into a Triple Sideways pattern.
This is the final wave in the pattern. When complete it will also complete wave B of the Primary degree Zigzag with a rating of 92.3. These two waves have the same target ranges.
After wave B is complete, expect the market to continue down into wave C, which should be a five wave impulsive pattern. Expect wave C to retrace wave B by 127% - 277%. Wave C can also be expected to be 43% - 277% of the price length of wave A. The expected time for wave C to complete is 19% - 191% of the time taken for wave B to complete and 55% - 222% of the time taken for wave A to complete.
Wave y of the Cycle degree Double Zigzag with a rating of 93.7 is expected to complete at a price no higher than 329.06, but more probably between 207.73 and 326.05. This wave is due to complete anytime from now until 04-Aug-2016, but is most likely to complete before 26-Apr-2016.
Wave y will probably complete this Double Sharp pattern, although it could possibly extend into a Triple Sharp pattern.
Current Analysis Settings: Analysis Date Range: 09-Apr-2014 to 18-Mar-2016, Label Range: 15 - 50, Preferred Count Labels: 18, Min Rating: 75, Stocks toggle ON, Bias Towards Beginning of Data: 8, Bias Towards Major High/Low: 8, Largest Degree Wave Filter: Any Pattern
Rating:113.8
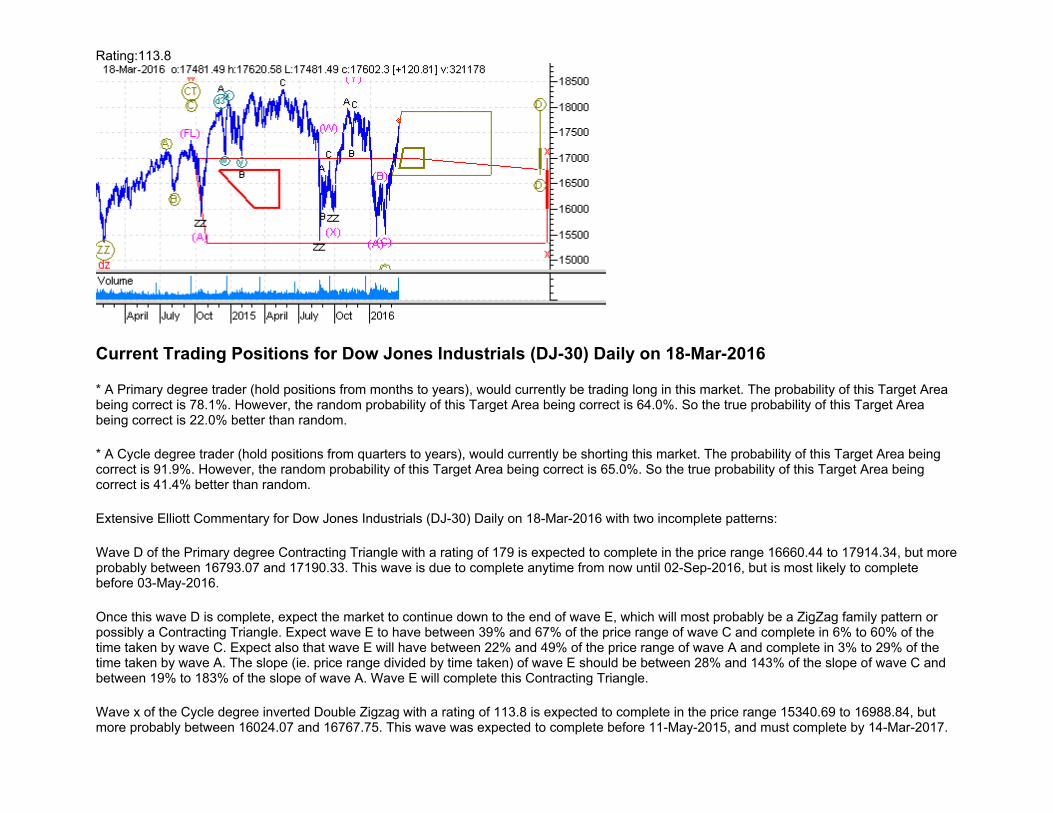
Current Trading Positions for Dow Jones Industrials (DJ-30) Daily on 18-Mar-2016
* A Primary degree trader (hold positions from months to years), would currently be trading long in this market. The probability of this Target Area being correct is 78.1%. However, the random probability of this Target Area being correct is 64.0%. So the true probability of this Target Area being correct is 22.0% better than random.
* A Cycle degree trader (hold positions from quarters to years), would currently be shorting this market. The probability of this Target Area being correct is 91.9%. However, the random probability of this Target Area being correct is 65.0%. So the true probability of this Target Area being correct is 41.4% better than random.
Extensive Elliott Commentary for Dow Jones Industrials (DJ-30) Daily on 18-Mar-2016 with two incomplete patterns:
Wave D of the Primary degree Contracting Triangle with a rating of 179 is expected to complete in the price range 16660.44 to 17914.34, but more probably between 16793.07 and 17190.33. This wave is due to complete anytime from now until 02-Sep-2016, but is most likely to complete before 03-May-2016.
Once this wave D is complete, expect the market to continue down to the end of wave E, which will most probably be a ZigZag family pattern or possibly a Contracting Triangle. Expect wave E to have between 39% and 67% of the price range of wave C and complete in 6% to 60% of the time taken by wave C. Expect also that wave E will have between 22% and 49% of the price range of wave A and complete in 3% to 29% of the time taken by wave A. The slope (ie. price range divided by time taken) of wave E should be between 28% and 143% of the slope of wave C and between 19% to 183% of the slope of wave A. Wave E will complete this Contracting Triangle.
Wave x of the Cycle degree inverted Double Zigzag with a rating of 113.8 is expected to complete in the price range 15340.69 to 16988.84, but more probably between 16024.07 and 16767.75. This wave was expected to complete before 11-May-2015, and must complete by 14-Mar-2017.
After wave x is complete, expect the market to continue up into wave y, which should be a three wave Zigzag pattern. Expect wave y to retrace wave x by 149% - 348%. Wave y can also be expected to be 90% - 348% of the price length of wave w. The expected time for wave y to complete is 23% - 188% of the time taken for wave x to complete and 28% - 133% of the time taken for wave w to complete.
Current Analysis Settings: Analysis Date Range: 13-Jan-2014 to 18-Mar-2016, Label Range: 15 - 50, Preferred Count Labels: 24, Min Rating: 75, Stocks toggle ON, Bias Towards Beginning of Data: 8, Bias Towards Major High/Low: 8, Largest Degree Wave Filter: Any Pattern
Rating:102.1
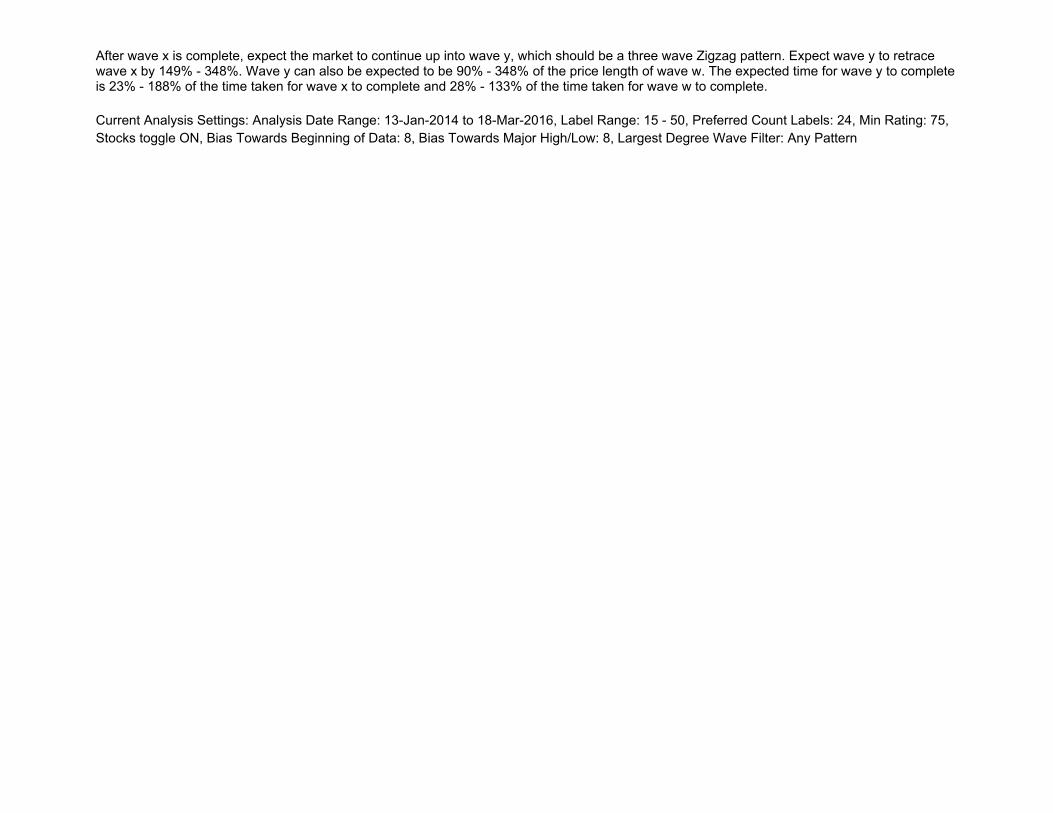
Current Trading Positions for Dow Jones Transport Avg (DJ-20) Daily on 18-Mar-2016
* A Cycle degree trader (hold positions from quarters to years), would currently be trading long in this market. The probability of this Target Area being correct is 66.8%. However, the random probability of this Target Area being correct is 53.0%. So the true probability of this Target Area being correct is 26.0% better than random.
Extensive Elliott Commentary for Dow Jones Transport Avg (DJ-20) Daily on 18-Mar-2016 with one incomplete pattern:
Wave x of the Cycle degree Double 3 with a rating of 102.1 is expected to complete in the price range 7828.741 to 18168.44, but more probably between 7892.567 and 8892.496. This wave is due to complete anytime from now until 16-Oct-2017, but is most likely to complete before 19-May-2016.
After wave x is complete, expect the market to continue down into wave y, which will probably be a three wave corrective pattern. Expect wave y to retrace wave x by 98% - 193%. Wave y can also be expected to be 76% - 193% of the price length of wave w. The expected time for wave y to complete is 20% - 178% of the time taken for wave x to complete and 12% - 115% of the time taken for wave w to complete.
Current Analysis Settings: Analysis Date Range: 17-Oct-2014 to 18-Mar-2016, Label Range: 15 - 50, Preferred Count Labels: 16, Min Rating: 75, Stocks toggle ON, Bias Towards Beginning of Data: 8, Bias Towards Major High/Low: 8, Largest Degree Wave Filter: Any Pattern
Rating:79.4
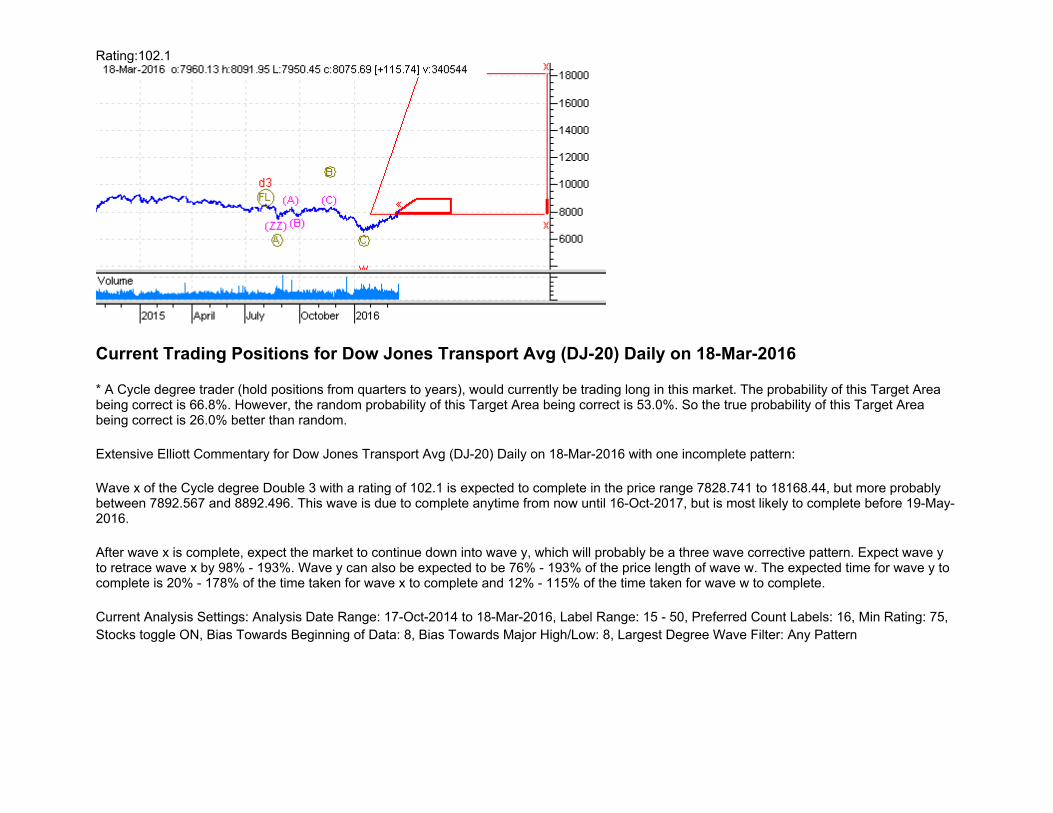
Current Trading Positions for Dow Jones Utility Average (DJ-15) Daily on 18-Mar-2016
* An Intermediate degree trader (hold positions from months to quarters), would currently be trading long in this market. The probability of this Target Area being correct is 48.8%. However, the random probability of this Target Area being correct is 34.0%. So the true probability of this Target Area being correct is 43.5% better than random.
* A Primary degree trader (hold positions from months to years), would currently be shorting this market. The probability of this Target Area being correct is 85.3%. However, the random probability of this Target Area being correct is 64.1%. So the true probability of this Target Area being correct is 33.1% better than random.
* A Cycle degree trader (hold positions from quarters to years), would currently be shorting this market. The probability of this Target Area being correct is 40.7%. However, the random probability of this Target Area being correct is 34.0%. So the true probability of this Target Area being correct is 19.7% better than random.
Extensive Elliott Commentary for Dow Jones Utility Average (DJ-15) Daily on 18-Mar-2016 with three incomplete patterns:
Wave (B) of the Intermediate degree Flat with a rating of 98.5 is expected to complete in the price range 628.21 to 740.51, but more probably between 628.82 and 649.46. This wave was expected to complete before 16-Mar-2016, and must complete by 14-Apr-2016.
After wave (B) is complete, expect the market to continue down into wave (C), which should be a five wave Impulsive pattern. Expect wave (C) to retrace wave (B) by 89% - 167%. Wave (C) can also be expected to be 105% - 167% of the price length of wave (A). The expected time for wave (C) to complete is 20% - 148% of the time taken for wave (B) to complete and 60% - 290% of the time taken for wave (A) to complete.
Wave Y of the Primary degree Double 3 with a rating of 83.1 is expected to complete in the price range 226.65 to 632.51, but more probably between 443.22 and 553.17. This wave is most likely to complete sometime between 25-Mar-2016 and 26-Sep-2016 Note that it cannot complete until 18-Mar-2016 but must complete by 28-Jul-2017.
Wave Y will probably complete this Double Sideways pattern, although it could possibly extend into a Triple Sideways pattern.
This is the final wave in the pattern. When complete it will also complete wave b of the Cycle degree inverted Flat with a rating of 79.4. These two waves have the same target ranges.
After wave b is complete, expect the market to continue up into wave c, which should be a five wave Impulsive pattern. Expect wave c to retrace wave b by 82% - 179%. Wave c can also be expected to be 67% - 179% of the price length of wave a. The expected time for wave c to complete is 20% - 151% of the time taken for wave b to complete and 11% - 58% of the time taken for wave a to complete.
Current Analysis Settings: Analysis Date Range: 13-Jan-2014 to 18-Mar-2016, Label Range: 15 - 50, Preferred Count Labels: 21, Min Rating: 75, Stocks toggle ON, Bias Towards Beginning of Data: 8, Bias Towards Major High/Low: 8, Largest Degree Wave Filter: Any Pattern
Rating:83.9
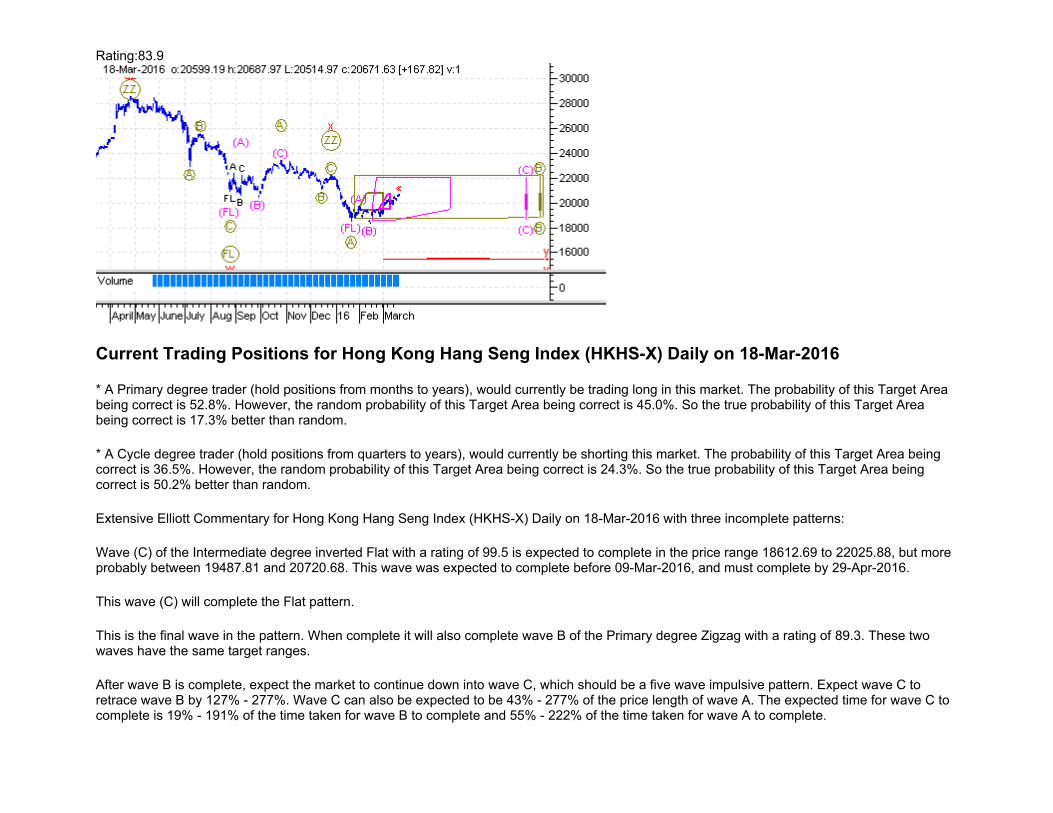
Current Trading Positions for Hong Kong Hang Seng Index (HKHS-X) Daily on 18-Mar-2016
* A Primary degree trader (hold positions from months to years), would currently be trading long in this market. The probability of this Target Area being correct is 52.8%. However, the random probability of this Target Area being correct is 45.0%. So the true probability of this Target Area being correct is 17.3% better than random.
* A Cycle degree trader (hold positions from quarters to years), would currently be shorting this market. The probability of this Target Area being correct is 36.5%. However, the random probability of this Target Area being correct is 24.3%. So the true probability of this Target Area being correct is 50.2% better than random.
Extensive Elliott Commentary for Hong Kong Hang Seng Index (HKHS-X) Daily on 18-Mar-2016 with three incomplete patterns:
Wave (C) of the Intermediate degree inverted Flat with a rating of 99.5 is expected to complete in the price range 18612.69 to 22025.88, but more probably between 19487.81 and 20720.68. This wave was expected to complete before 09-Mar-2016, and must complete by 29-Apr-2016.
This wave (C) will complete the Flat pattern.
This is the final wave in the pattern. When complete it will also complete wave B of the Primary degree Zigzag with a rating of 89.3. These two waves have the same target ranges.
After wave B is complete, expect the market to continue down into wave C, which should be a five wave impulsive pattern. Expect wave C to retrace wave B by 127% - 277%. Wave C can also be expected to be 43% - 277% of the price length of wave A. The expected time for wave C to complete is 19% - 191% of the time taken for wave B to complete and 55% - 222% of the time taken for wave A to complete.
Wave y of the Cycle degree Double Zigzag with a rating of 83.9 is expected to complete in the price range 15483.54 to 15498.21, but more probably between 15490.87 and 15490.87. This wave is due to complete anytime from now until 10-Mar-2017, but is most likely to complete before 02-Jun-2016.
Wave y will probably complete this Double Sharp pattern, although it could possibly extend into a Triple Sharp pattern.
Current Analysis Settings: Analysis Date Range: 16-Mar-2015 to 18-Mar-2016, Label Range: 15 - 50, Preferred Count Labels: 16, Min Rating: 75, Stocks toggle ON, Bias Towards Beginning of Data: 8, Bias Towards Major High/Low: 8, Largest Degree Wave Filter: Any Pattern
Rating:78.1
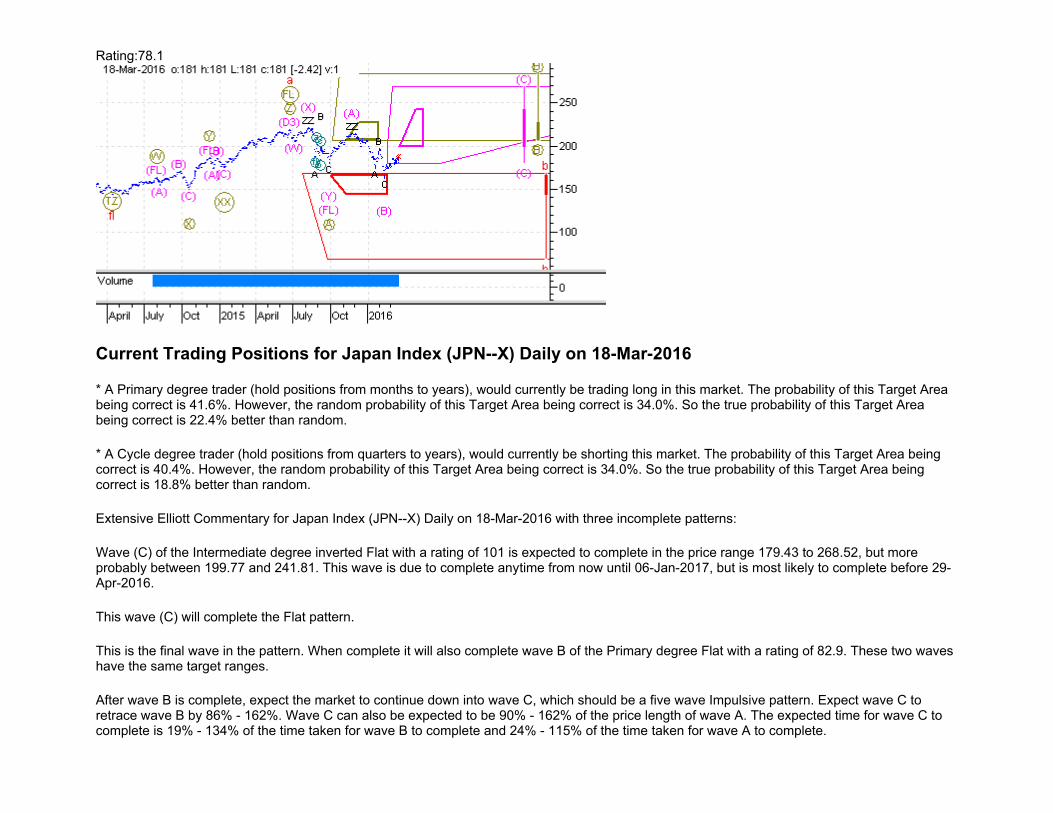
Current Trading Positions for Japan Index (JPN--X) Daily on 18-Mar-2016
* A Primary degree trader (hold positions from months to years), would currently be trading long in this market. The probability of this Target Area being correct is 41.6%. However, the random probability of this Target Area being correct is 34.0%. So the true probability of this Target Area being correct is 22.4% better than random.
* A Cycle degree trader (hold positions from quarters to years), would currently be shorting this market. The probability of this Target Area being correct is 40.4%. However, the random probability of this Target Area being correct is 34.0%. So the true probability of this Target Area being correct is 18.8% better than random.
Extensive Elliott Commentary for Japan Index (JPN--X) Daily on 18-Mar-2016 with three incomplete patterns:
Wave (C) of the Intermediate degree inverted Flat with a rating of 101 is expected to complete in the price range 179.43 to 268.52, but more probably between 199.77 and 241.81. This wave is due to complete anytime from now until 06-Jan-2017, but is most likely to complete before 29-Apr-2016.
This wave (C) will complete the Flat pattern.
This is the final wave in the pattern. When complete it will also complete wave B of the Primary degree Flat with a rating of 82.9. These two waves have the same target ranges.
After wave B is complete, expect the market to continue down into wave C, which should be a five wave Impulsive pattern. Expect wave C to retrace wave B by 86% - 162%. Wave C can also be expected to be 90% - 162% of the price length of wave A. The expected time for wave C to complete is 19% - 134% of the time taken for wave B to complete and 24% - 115% of the time taken for wave A to complete.
Wave b of the Cycle degree inverted Flat with a rating of 78.1 is expected to complete in the price range 68.76 to 168.49, but more probably between 144.31 and 166.22. This wave was expected to complete before 19-Feb-2016, and must complete by 21-Sep-2017.
After wave b is complete, expect the market to continue up into wave c, which should be a five wave Impulsive pattern. Expect wave c to retrace wave b by 82% - 179%. Wave c can also be expected to be 67% - 179% of the price length of wave a. The expected time for wave c to complete is 20% - 151% of the time taken for wave b to complete and 11% - 58% of the time taken for wave a to complete.
Current Analysis Settings: Analysis Date Range: 04-Mar-2014 to 18-Mar-2016, Label Range: 15 - 50, Preferred Count Labels: 26, Min Rating: 75, Stocks toggle ON, Bias Towards Beginning of Data: 8, Bias Towards Major High/Low: 8, Largest Degree Wave Filter: Any Pattern
Rating:110.5
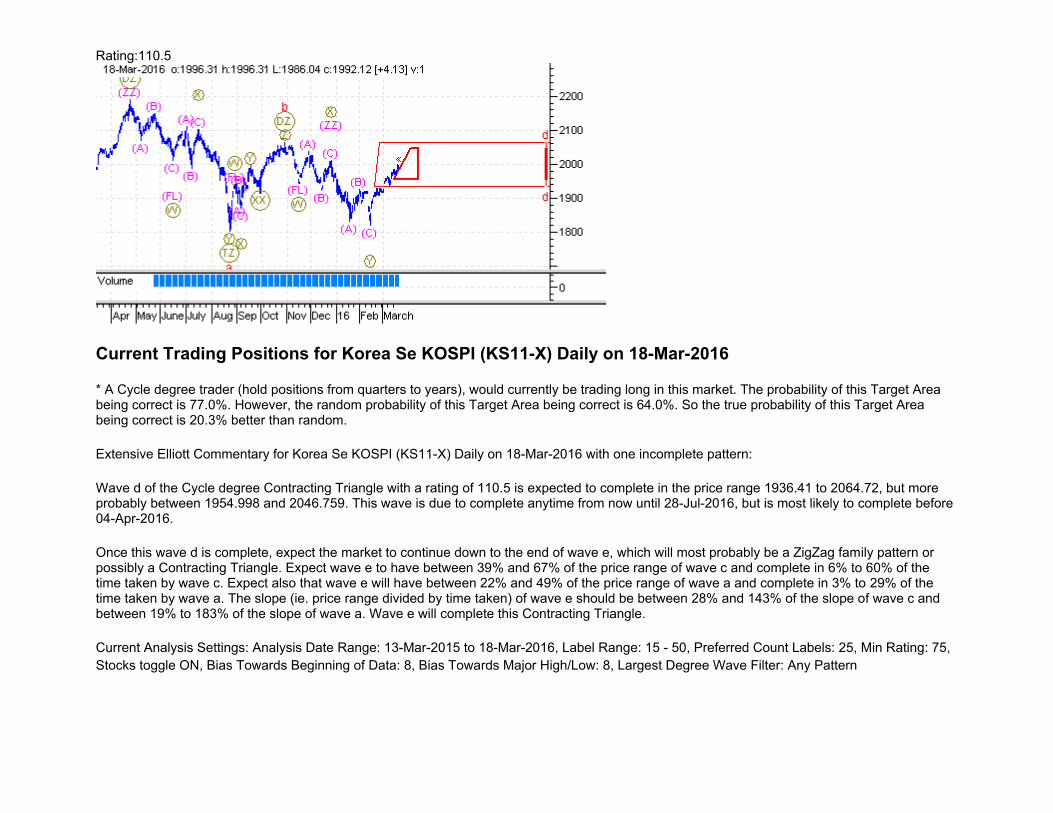
Current Trading Positions for Korea Se KOSPI (KS11-X) Daily on 18-Mar-2016
* A Cycle degree trader (hold positions from quarters to years), would currently be trading long in this market. The probability of this Target Area being correct is 77.0%. However, the random probability of this Target Area being correct is 64.0%. So the true probability of this Target Area being correct is 20.3% better than random.
Extensive Elliott Commentary for Korea Se KOSPI (KS11-X) Daily on 18-Mar-2016 with one incomplete pattern:
Wave d of the Cycle degree Contracting Triangle with a rating of 110.5 is expected to complete in the price range 1936.41 to 2064.72, but more probably between 1954.998 and 2046.759. This wave is due to complete anytime from now until 28-Jul-2016, but is most likely to complete before 04-Apr-2016.
Once this wave d is complete, expect the market to continue down to the end of wave e, which will most probably be a ZigZag family pattern or possibly a Contracting Triangle. Expect wave e to have between 39% and 67% of the price range of wave c and complete in 6% to 60% of the time taken by wave c. Expect also that wave e will have between 22% and 49% of the price range of wave a and complete in 3% to 29% of the time taken by wave a. The slope (ie. price range divided by time taken) of wave e should be between 28% and 143% of the slope of wave c and between 19% to 183% of the slope of wave a. Wave e will complete this Contracting Triangle.
Current Analysis Settings: Analysis Date Range: 13-Mar-2015 to 18-Mar-2016, Label Range: 15 - 50, Preferred Count Labels: 25, Min Rating: 75, Stocks toggle ON, Bias Towards Beginning of Data: 8, Bias Towards Major High/Low: 8, Largest Degree Wave Filter: Any Pattern
Rating:84.4
Current Trading Positions for London Ftse-100 Index (FTSE-X) Daily on 18-Mar-2016
* A Cycle degree trader (hold positions from quarters to years), would currently be trading long in this market. The probability of this Target Area being correct is 42.2%. However, the random probability of this Target Area being correct is 34.0%. So the true probability of this Target Area being correct is 24.1% better than random.
Extensive Elliott Commentary for London Ftse-100 Index (FTSE-X) Daily on 18-Mar-2016 with two incomplete patterns:
Wave C of the Primary degree inverted Flat with a rating of 110.6 is expected to complete in the price range 5768.22 to 7530.079, but more probably between 6190.329 and 6969.921. This wave is due to complete anytime from now until 18-May-2017, but is most likely to complete before 11-May-2016.
This wave C will complete the Flat pattern.
This is the final wave in the pattern. When complete it will also complete wave b of the Cycle degree Flat with a rating of 84.4. These two waves have the same target ranges.
After wave b is complete, expect the market to continue down into wave c, which should be a five wave Impulsive pattern. Expect wave c to retrace wave b by 86% - 162%. Wave c can also be expected to be 90% - 162% of the price length of wave a. The expected time for wave c to complete is 19% - 134% of the time taken for wave b to complete and 24% - 115% of the time taken for wave a to complete.
Current Analysis Settings: Analysis Date Range: 16-Mar-2015 to 18-Mar-2016, Label Range: 15 - 50, Preferred Count Labels: 16, Min Rating: 75, Stocks toggle ON, Bias Towards Beginning of Data: 8, Bias Towards Major High/Low: 8, Largest Degree Wave Filter: Any Pattern
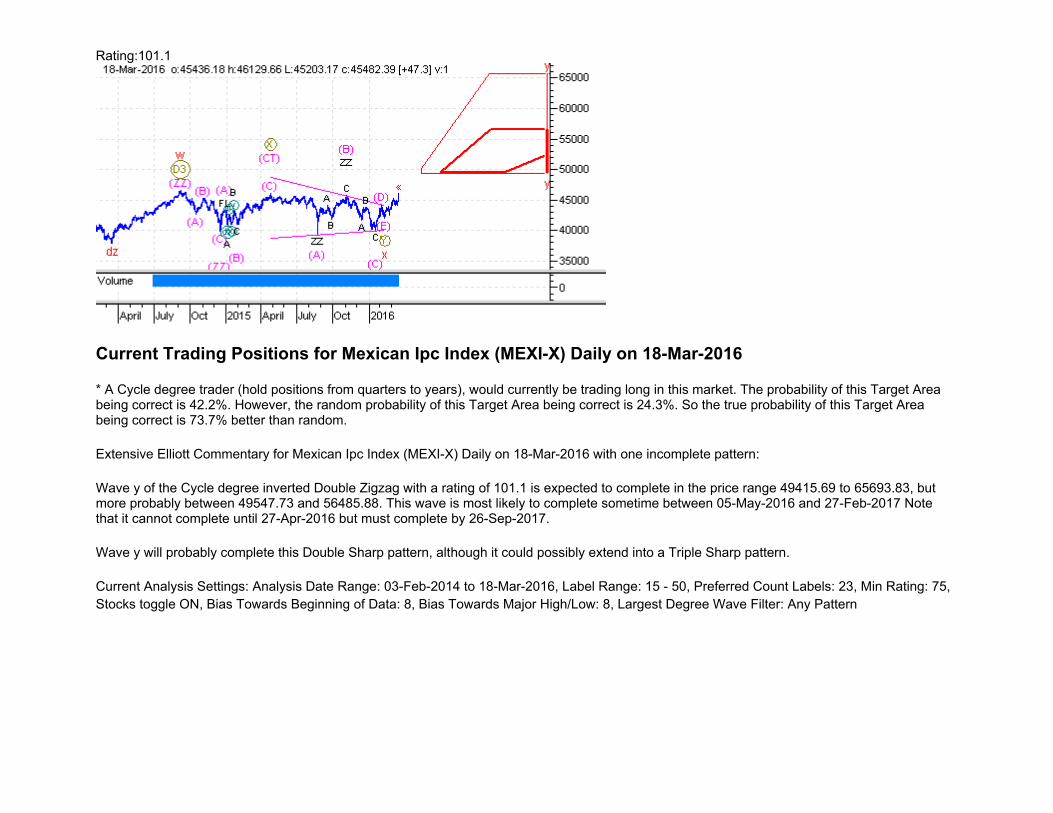
Rating:101.1
Current Trading Positions for Mexican Ipc Index (MEXI-X) Daily on 18-Mar-2016
* A Cycle degree trader (hold positions from quarters to years), would currently be trading long in this market. The probability of this Target Area being correct is 42.2%. However, the random probability of this Target Area being correct is 24.3%. So the true probability of this Target Area being correct is 73.7% better than random.
Extensive Elliott Commentary for Mexican Ipc Index (MEXI-X) Daily on 18-Mar-2016 with one incomplete pattern:
Wave y of the Cycle degree inverted Double Zigzag with a rating of 101.1 is expected to complete in the price range 49415.69 to 65693.83, but more probably between 49547.73 and 56485.88. This wave is most likely to complete sometime between 05-May-2016 and 27-Feb-2017 Note that it cannot complete until 27-Apr-2016 but must complete by 26-Sep-2017.
Wave y will probably complete this Double Sharp pattern, although it could possibly extend into a Triple Sharp pattern.
Current Analysis Settings: Analysis Date Range: 03-Feb-2014 to 18-Mar-2016, Label Range: 15 - 50, Preferred Count Labels: 23, Min Rating: 75, Stocks toggle ON, Bias Towards Beginning of Data: 8, Bias Towards Major High/Low: 8, Largest Degree Wave Filter: Any Pattern
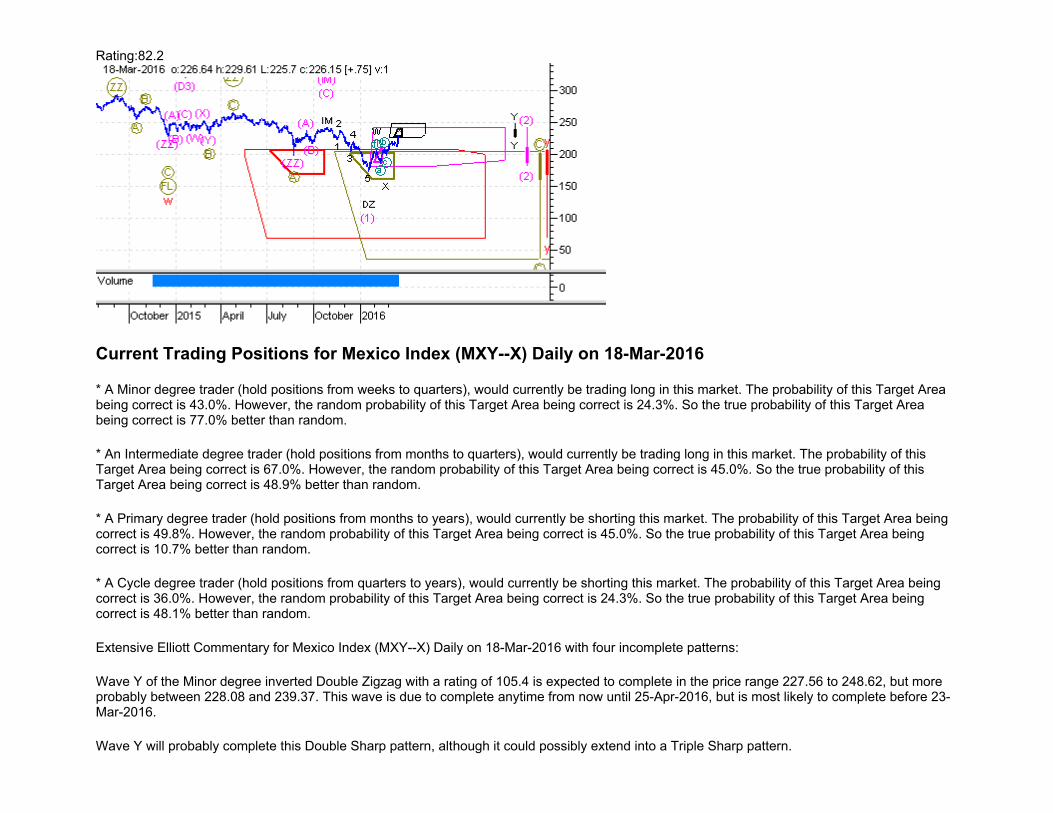
Rating:82.2
Current Trading Positions for Mexico Index (MXY--X) Daily on 18-Mar-2016
* A Minor degree trader (hold positions from weeks to quarters), would currently be trading long in this market. The probability of this Target Area being correct is 43.0%. However, the random probability of this Target Area being correct is 24.3%. So the true probability of this Target Area being correct is 77.0% better than random.
* An Intermediate degree trader (hold positions from months to quarters), would currently be trading long in this market. The probability of this Target Area being correct is 67.0%. However, the random probability of this Target Area being correct is 45.0%. So the true probability of this Target Area being correct is 48.9% better than random.
* A Primary degree trader (hold positions from months to years), would currently be shorting this market. The probability of this Target Area being correct is 49.8%. However, the random probability of this Target Area being correct is 45.0%. So the true probability of this Target Area being correct is 10.7% better than random.
* A Cycle degree trader (hold positions from quarters to years), would currently be shorting this market. The probability of this Target Area being correct is 36.0%. However, the random probability of this Target Area being correct is 24.3%. So the true probability of this Target Area being correct is 48.1% better than random.
Extensive Elliott Commentary for Mexico Index (MXY--X) Daily on 18-Mar-2016 with four incomplete patterns:
Wave Y of the Minor degree inverted Double Zigzag with a rating of 105.4 is expected to complete in the price range 227.56 to 248.62, but more probably between 228.08 and 239.37. This wave is due to complete anytime from now until 25-Apr-2016, but is most likely to complete before 23-Mar-2016.
Wave Y will probably complete this Double Sharp pattern, although it could possibly extend into a Triple Sharp pattern.
This is the final wave in the pattern. When complete it will also complete wave (2) of the Intermediate degree inverted Impulse with a rating of 75.1. These two waves have the same target ranges.
After this wave (2) is complete, expect the market to continue down into wave (3). Wave (3) should always be an Impulse and should retrace wave (2) completely. Expect wave (3) to retrace wave (2) by 165% - 383%. Wave (3) can also be expected to be 83% - 383% of the price length of wave (1). The expected time for wave (3) to complete is 84% - 367% of the time taken for wave (2) to complete and 14% - 94% of the time taken for wave (1) to complete. The slope (ie. price range divided by time taken) of wave (3) should be between 47% and 194% of the slope of wave (1). Once wave (3) is complete, expect wave (4) to be a sideways corrective movement, then wave (5) to continue in the same direction as wave (3). Wave (5) will complete this Impulse.
Wave C of the Primary degree Zigzag with a rating of 78 is expected to complete in the price range 36.66 to 205.48, but more probably between 161.92 and 202.56. This wave was expected to complete before 10-Mar-2016, and must complete by 14-Feb-2017.
This wave C will complete the ZigZag pattern.
This is the final wave in the pattern. When complete it will also complete wave y of the Cycle degree Double Zigzag with a rating of 82.2. These two waves have the same target ranges.
Wave y will probably complete this Double Sharp pattern, although it could possibly extend into a Triple Sharp pattern.
Current Analysis Settings: Analysis Date Range: 28-Jul-2014 to 18-Mar-2016, Label Range: 15 - 50, Preferred Count Labels: 27, Min Rating: 75, Stocks toggle ON, Bias Towards Beginning of Data: 8, Bias Towards Major High/Low: 8, Largest Degree Wave Filter: Any Pattern
Rating:78.7
Current Trading Positions for Nasdaq 100 Index (NDX--X) Daily on 18-Mar-2016
* An Intermediate degree trader (hold positions from months to quarters), would currently be trading long in this market. The probability of this Target Area being correct is 42.0%. However, the random probability of this Target Area being correct is 24.3%. So the true probability of this Target Area being correct is 72.8% better than random.
* A Primary degree trader (hold positions from months to years), would currently be trading long in this market. The probability of this Target Area being correct is 41.6%. However, the random probability of this Target Area being correct is 34.0%. So the true probability of this Target Area being correct is 22.4% better than random.
* A Cycle degree trader (hold positions from quarters to years), would currently be shorting this market. The probability of this Target Area being correct is 40.4%. However, the random probability of this Target Area being correct is 34.0%. So the true probability of this Target Area being correct is 18.8% better than random.
Extensive Elliott Commentary for Nasdaq 100 Index (NDX--X) Daily on 18-Mar-2016 with three incomplete patterns:
Wave (Y) of the Intermediate degree inverted Double Zigzag with a rating of 100.3 is expected to complete in the price range 4745.593 to 7773.789, but more probably between 4949.193 and 6053.537. This wave is due to complete anytime from now until 21-Oct-2016, but is most likely to complete before 23-May-2016.
Wave (Y) will probably complete this Double Sharp pattern, although it could possibly extend into a Triple Sharp pattern.
This is the final wave in the pattern. When complete it will also complete wave B of the Primary degree Flat with a rating of 82.6. These two waves have the same target ranges.
After wave B is complete, expect the market to continue down into wave C, which should be a five wave Impulsive pattern. Expect wave C to retrace wave B by 89% - 167%. Wave C can also be expected to be 104% - 167% of the price length of wave A. The expected time for wave C to complete is 20% - 146% of the time taken for wave B to complete and 53% - 275% of the time taken for wave A to complete.
Wave b of the Cycle degree inverted Flat with a rating of 78.7 is expected to complete in the price range 2716.249 to 4028.21, but more probably between 3710.159 and 3998.393. This wave was expected to complete before 15-Dec-2015, and must complete by 09-Jan-2017.
After wave b is complete, expect the market to continue up into wave c, which should be a five wave Impulsive pattern. Expect wave c to retrace wave b by 82% - 179%. Wave c can also be expected to be 67% - 179% of the price length of wave a. The expected time for wave c to complete is 20% - 151% of the time taken for wave b to complete and 11% - 58% of the time taken for wave a to complete.
Current Analysis Settings: Analysis Date Range: 05-Mar-2014 to 18-Mar-2016, Label Range: 15 - 50, Preferred Count Labels: 29, Min Rating: 75, Stocks toggle ON, Bias Towards Beginning of Data: 8, Bias Towards Major High/Low: 8, Largest Degree Wave Filter: Any Pattern
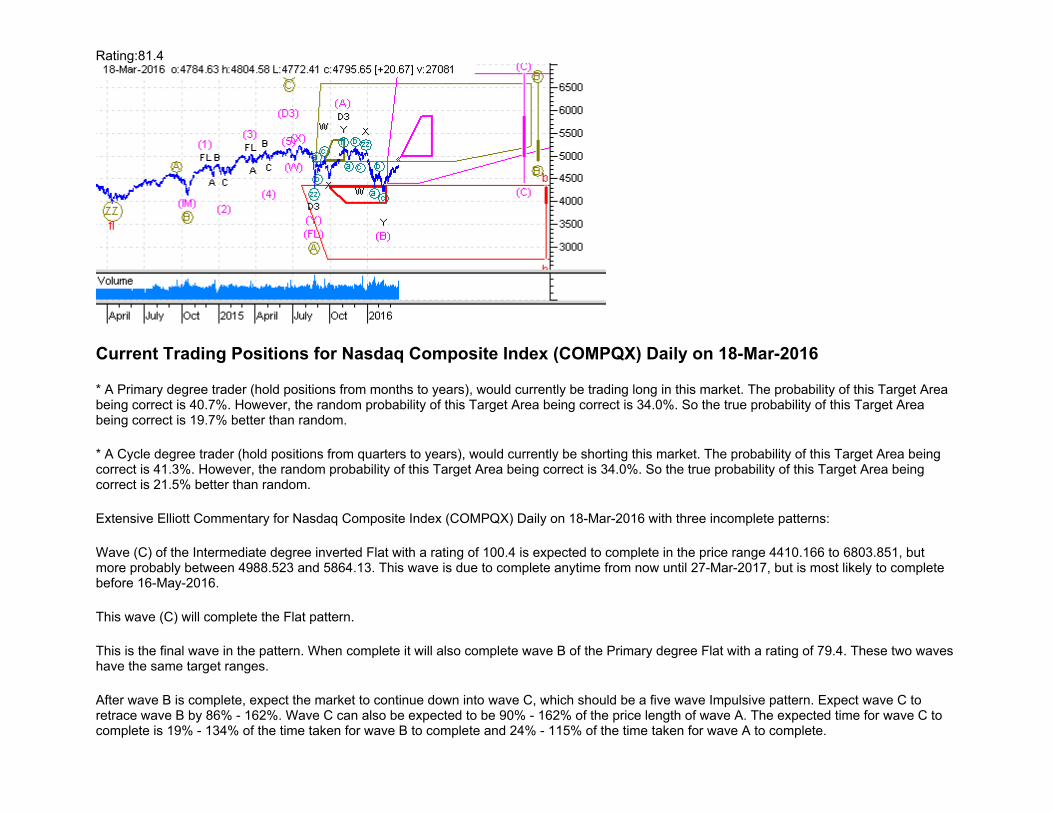
Rating:81.4
Current Trading Positions for Nasdaq Composite Index (COMPQX) Daily on 18-Mar-2016
* A Primary degree trader (hold positions from months to years), would currently be trading long in this market. The probability of this Target Area being correct is 40.7%. However, the random probability of this Target Area being correct is 34.0%. So the true probability of this Target Area being correct is 19.7% better than random.
* A Cycle degree trader (hold positions from quarters to years), would currently be shorting this market. The probability of this Target Area being correct is 41.3%. However, the random probability of this Target Area being correct is 34.0%. So the true probability of this Target Area being correct is 21.5% better than random.
Extensive Elliott Commentary for Nasdaq Composite Index (COMPQX) Daily on 18-Mar-2016 with three incomplete patterns:
Wave (C) of the Intermediate degree inverted Flat with a rating of 100.4 is expected to complete in the price range 4410.166 to 6803.851, but more probably between 4988.523 and 5864.13. This wave is due to complete anytime from now until 27-Mar-2017, but is most likely to complete before 16-May-2016.
This wave (C) will complete the Flat pattern.
This is the final wave in the pattern. When complete it will also complete wave B of the Primary degree Flat with a rating of 79.4. These two waves have the same target ranges.
After wave B is complete, expect the market to continue down into wave C, which should be a five wave Impulsive pattern. Expect wave C to retrace wave B by 86% - 162%. Wave C can also be expected to be 90% - 162% of the price length of wave A. The expected time for wave C to complete is 19% - 134% of the time taken for wave B to complete and 24% - 115% of the time taken for wave A to complete.
Wave b of the Cycle degree inverted Flat with a rating of 81.4 is expected to complete in the price range 2739.883 to 4348.079, but more probably between 3958.213 and 4311.529. This wave was expected to complete before 19-Feb-2016, and must complete by 19-Sep-2017.
After wave b is complete, expect the market to continue up into wave c, which should be a five wave Impulsive pattern. Expect wave c to retrace wave b by 82% - 179%. Wave c can also be expected to be 67% - 179% of the price length of wave a. The expected time for wave c to complete is 20% - 151% of the time taken for wave b to complete and 11% - 58% of the time taken for wave a to complete.
Current Analysis Settings: Analysis Date Range: 05-Mar-2014 to 18-Mar-2016, Label Range: 15 - 50, Preferred Count Labels: 29, Min Rating: 75, Stocks toggle ON, Bias Towards Beginning of Data: 8, Bias Towards Major High/Low: 8, Largest Degree Wave Filter: Any Pattern
Rating:88.8
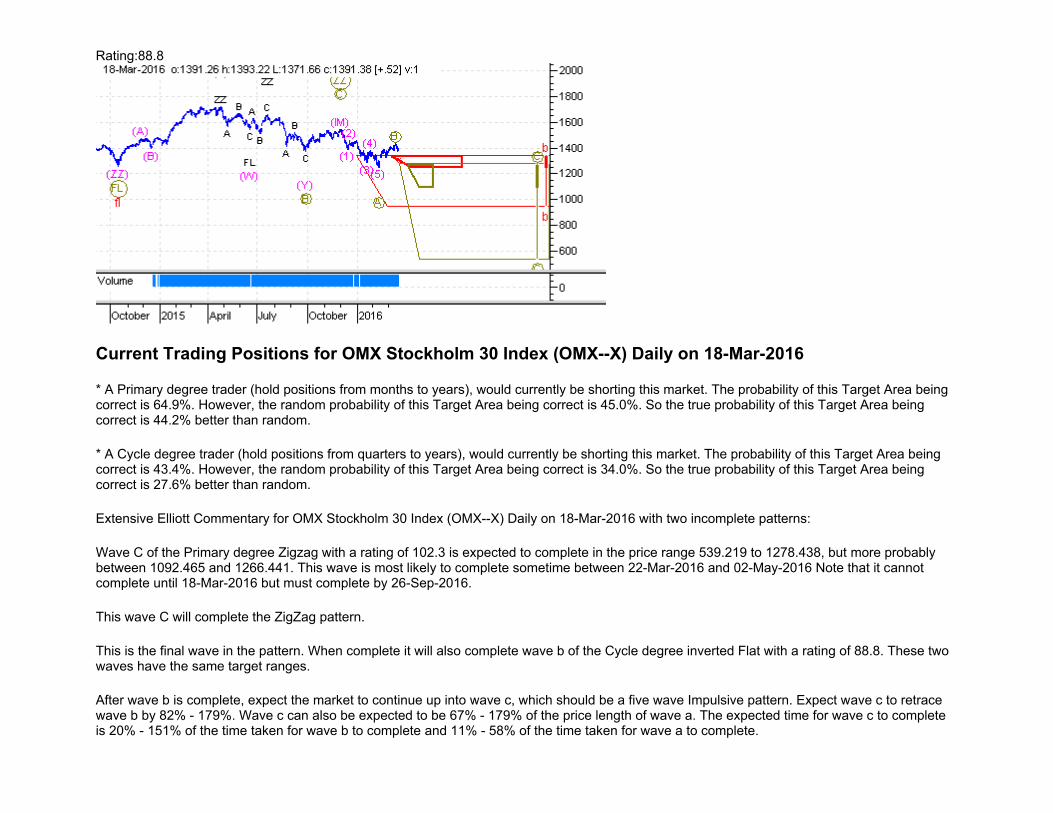
Current Trading Positions for OMX Stockholm 30 Index (OMX--X) Daily on 18-Mar-2016
* A Primary degree trader (hold positions from months to years), would currently be shorting this market. The probability of this Target Area being correct is 64.9%. However, the random probability of this Target Area being correct is 45.0%. So the true probability of this Target Area being correct is 44.2% better than random.
* A Cycle degree trader (hold positions from quarters to years), would currently be shorting this market. The probability of this Target Area being correct is 43.4%. However, the random probability of this Target Area being correct is 34.0%. So the true probability of this Target Area being correct is 27.6% better than random.
Extensive Elliott Commentary for OMX Stockholm 30 Index (OMX--X) Daily on 18-Mar-2016 with two incomplete patterns:
Wave C of the Primary degree Zigzag with a rating of 102.3 is expected to complete in the price range 539.219 to 1278.438, but more probably between 1092.465 and 1266.441. This wave is most likely to complete sometime between 22-Mar-2016 and 02-May-2016 Note that it cannot complete until 18-Mar-2016 but must complete by 26-Sep-2016.
This wave C will complete the ZigZag pattern.
This is the final wave in the pattern. When complete it will also complete wave b of the Cycle degree inverted Flat with a rating of 88.8. These two waves have the same target ranges.
After wave b is complete, expect the market to continue up into wave c, which should be a five wave Impulsive pattern. Expect wave c to retrace wave b by 82% - 179%. Wave c can also be expected to be 67% - 179% of the price length of wave a. The expected time for wave c to complete is 20% - 151% of the time taken for wave b to complete and 11% - 58% of the time taken for wave a to complete.
Current Analysis Settings: Analysis Date Range: 05-Sep-2014 to 18-Mar-2016, Label Range: 15 - 50, Preferred Count Labels: 22, Min Rating: 75, Stocks toggle ON, Bias Towards Beginning of Data: 8, Bias Towards Major High/Low: 8, Largest Degree Wave Filter: Any Pattern
Rating:112.7
Current Trading Positions for Paris CAC-40 Index (PCAC-X) Daily on 18-Mar-2016
* A Cycle degree trader (hold positions from quarters to years), would currently be trading long in this market. The probability of this Target Area being correct is 51.2%. However, the random probability of this Target Area being correct is 34.0%. So the true probability of this Target Area being correct is 50.6% better than random.
Extensive Elliott Commentary for Paris CAC-40 Index (PCAC-X) Daily on 18-Mar-2016 with one incomplete pattern:
Wave b of the Cycle degree Flat with a rating of 112.7 is expected to complete in the price range 4838.51 to 7523.622, but more probably between 4866.335 and 5575.872. This wave is due to complete anytime from now until 11-Dec-2020, but is most likely to complete before 18-Oct-2016.
After wave b is complete, expect the market to continue down into wave c, which should be a five wave Impulsive pattern. Expect wave c to retrace wave b by 85% - 162%. Wave c can also be expected to be 90% - 162% of the price length of wave a. The expected time for wave c to complete is 20% - 136% of the time taken for wave b to complete and 20% - 110% of the time taken for wave a to complete.
Current Analysis Settings: Analysis Date Range: 05-Sep-2014 to 18-Mar-2016, Label Range: 15 - 50, Preferred Count Labels: 19, Min Rating: 75, Stocks toggle ON, Bias Towards Beginning of Data: 8, Bias Towards Major High/Low: 8, Largest Degree Wave Filter: Any Pattern
Rating:82.6
Current Trading Positions for Sao Paulo Se BOVESPA Index (BVSP-X) Daily on 18-Mar-2016
* An Intermediate degree trader (hold positions from months to quarters), would currently be trading long in this market. The probability of this Target Area being correct is 50.2%. However, the random probability of this Target Area being correct is 34.0%. So the true probability of this Target Area being correct is 47.6% better than random.
* A Primary degree trader (hold positions from months to years), would currently be shorting this market. The probability of this Target Area being correct is 55.4%. However, the random probability of this Target Area being correct is 53.0%. So the true probability of this Target Area being correct is 4.5% better than random.
* A Cycle degree trader (hold positions from quarters to years), would currently be trading long in this market. The probability of this Target Area being correct is 41.6%. However, the random probability of this Target Area being correct is 34.0%. So the true probability of this Target Area being correct is 22.4% better than random.
Extensive Elliott Commentary for Sao Paulo Se BOVESPA Index (BVSP-X) Daily on 18-Mar-2016 with three incomplete patterns:
Wave (B) of the Intermediate degree Flat with a rating of 102.5 is expected to complete in the price range 48999.43 to 62486.08, but more probably between 49072.34 and 51550.96. This wave is due to complete anytime from now until 04-Apr-2016, but is most likely to complete before 21-Mar-2016.
After wave (B) is complete, expect the market to continue down into wave (C), which should be a five wave Impulsive pattern. Expect wave (C) to retrace wave (B) by 89% - 167%. Wave (C) can also be expected to be 105% - 167% of the price length of wave (A). The expected time for wave (C) to complete is 20% - 148% of the time taken for wave (B) to complete and 60% - 290% of the time taken for wave (A) to complete.
Wave X of the Primary degree inverted Double 3 with a rating of 83.9 is expected to complete in the price range 16716.89 to 45196.71, but more probably between 42452.56 and 44974.21. This wave is most likely to complete sometime between 06-Apr-2016 and 11-Jul-2016 Note that it cannot complete until 21-Mar-2016 but must complete by 30-Mar-2018.
After wave X is complete, expect the market to continue up into wave Y, which will probably be a three wave corrective pattern. Expect wave Y to retrace wave X by 98% - 227%. Wave Y can also be expected to be 71% - 227% of the price length of wave W. The expected time for wave Y to complete is 28% - 231% of the time taken for wave X to complete and 16% - 135% of the time taken for wave W to complete.
Wave b of the Cycle degree Flat with a rating of 82.6 is expected to complete in the price range 56047.15 to 93789.79, but more probably between 56438.27 and 66411.71. This wave is due to complete anytime from now until 13-Sep-2021, but is most likely to complete before 15-Aug-2016.
After wave b is complete, expect the market to continue down into wave c, which should be a five wave Impulsive pattern. Expect wave c to retrace wave b by 85% - 162%. Wave c can also be expected to be 90% - 162% of the price length of wave a. The expected time for wave c to complete is 20% - 136% of the time taken for wave b to complete and 20% - 110% of the time taken for wave a to complete.
Current Analysis Settings: Analysis Date Range: 24-Jul-2014 to 18-Mar-2016, Label Range: 15 - 50, Preferred Count Labels: 33, Min Rating: 75, Stocks toggle ON, Bias Towards Beginning of Data: 8, Bias Towards Major High/Low: 8, Largest Degree Wave Filter: Any Pattern
Rating:85.8
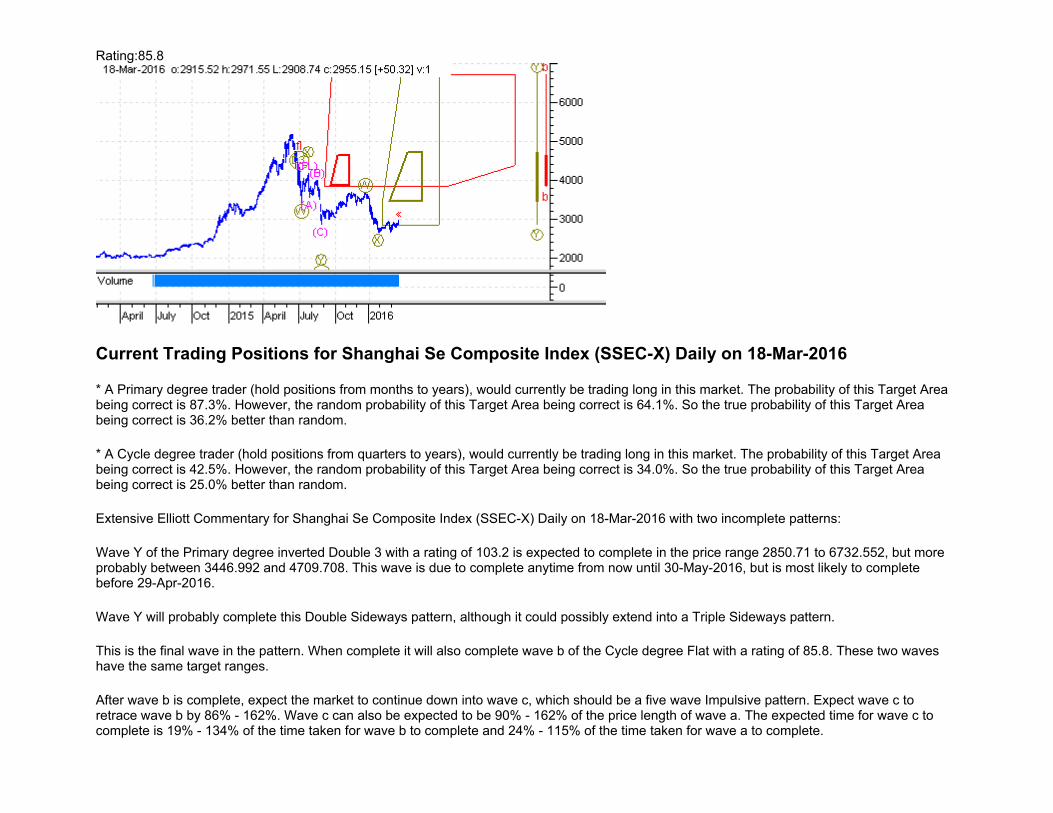
Current Trading Positions for Shanghai Se Composite Index (SSEC-X) Daily on 18-Mar-2016
* A Primary degree trader (hold positions from months to years), would currently be trading long in this market. The probability of this Target Area being correct is 87.3%. However, the random probability of this Target Area being correct is 64.1%. So the true probability of this Target Area being correct is 36.2% better than random.
* A Cycle degree trader (hold positions from quarters to years), would currently be trading long in this market. The probability of this Target Area being correct is 42.5%. However, the random probability of this Target Area being correct is 34.0%. So the true probability of this Target Area being correct is 25.0% better than random.
Extensive Elliott Commentary for Shanghai Se Composite Index (SSEC-X) Daily on 18-Mar-2016 with two incomplete patterns:
Wave Y of the Primary degree inverted Double 3 with a rating of 103.2 is expected to complete in the price range 2850.71 to 6732.552, but more probably between 3446.992 and 4709.708. This wave is due to complete anytime from now until 30-May-2016, but is most likely to complete before 29-Apr-2016.
Wave Y will probably complete this Double Sideways pattern, although it could possibly extend into a Triple Sideways pattern.
This is the final wave in the pattern. When complete it will also complete wave b of the Cycle degree Flat with a rating of 85.8. These two waves have the same target ranges.
After wave b is complete, expect the market to continue down into wave c, which should be a five wave Impulsive pattern. Expect wave c to retrace wave b by 86% - 162%. Wave c can also be expected to be 90% - 162% of the price length of wave a. The expected time for wave c to complete is 19% - 134% of the time taken for wave b to complete and 24% - 115% of the time taken for wave a to complete.
Current Analysis Settings: Analysis Date Range: 29-Jan-2014 to 18-Mar-2016, Label Range: 15 - 50, Preferred Count Labels: 15, Min Rating: 75, Stocks toggle ON, Bias Towards Beginning of Data: 8, Bias Towards Major High/Low: 8, Largest Degree Wave Filter: Any Pattern
Rating:101.3
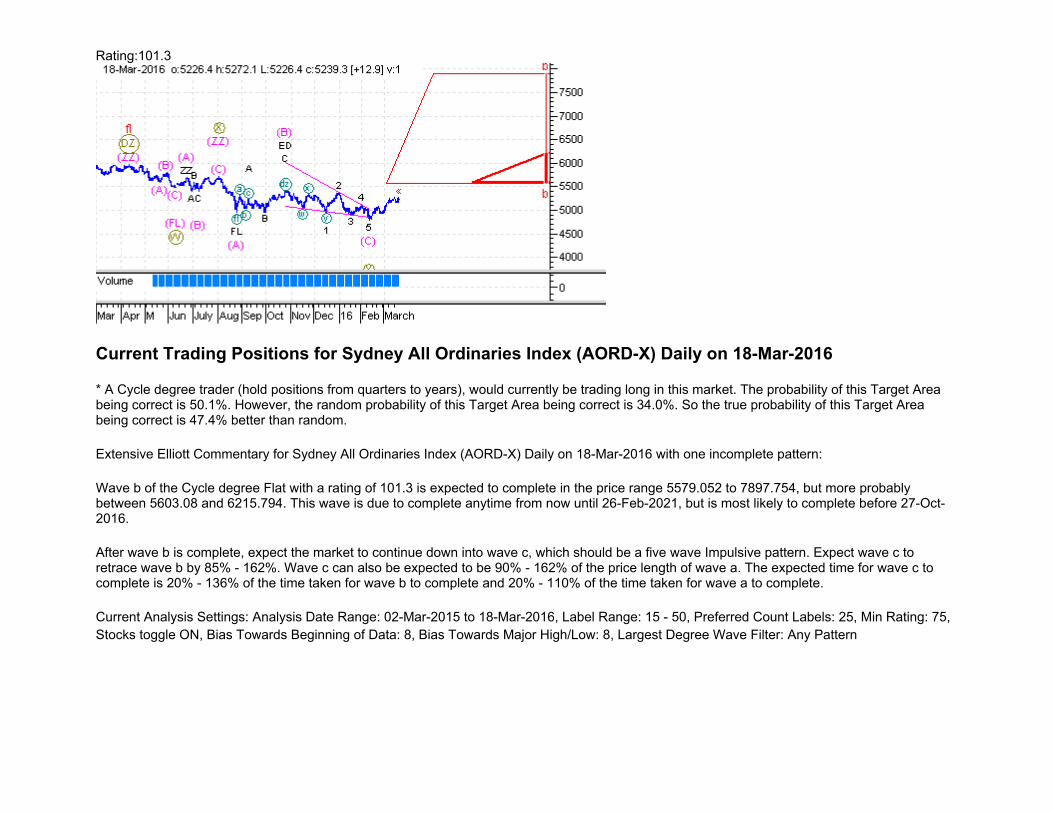
Current Trading Positions for Sydney All Ordinaries Index (AORD-X) Daily on 18-Mar-2016
* A Cycle degree trader (hold positions from quarters to years), would currently be trading long in this market. The probability of this Target Area being correct is 50.1%. However, the random probability of this Target Area being correct is 34.0%. So the true probability of this Target Area being correct is 47.4% better than random.
Extensive Elliott Commentary for Sydney All Ordinaries Index (AORD-X) Daily on 18-Mar-2016 with one incomplete pattern:
Wave b of the Cycle degree Flat with a rating of 101.3 is expected to complete in the price range 5579.052 to 7897.754, but more probably between 5603.08 and 6215.794. This wave is due to complete anytime from now until 26-Feb-2021, but is most likely to complete before 27-Oct-2016.
After wave b is complete, expect the market to continue down into wave c, which should be a five wave Impulsive pattern. Expect wave c to retrace wave b by 85% - 162%. Wave c can also be expected to be 90% - 162% of the price length of wave a. The expected time for wave c to complete is 20% - 136% of the time taken for wave b to complete and 20% - 110% of the time taken for wave a to complete.
Current Analysis Settings: Analysis Date Range: 02-Mar-2015 to 18-Mar-2016, Label Range: 15 - 50, Preferred Count Labels: 25, Min Rating: 75, Stocks toggle ON, Bias Towards Beginning of Data: 8, Bias Towards Major High/Low: 8, Largest Degree Wave Filter: Any Pattern
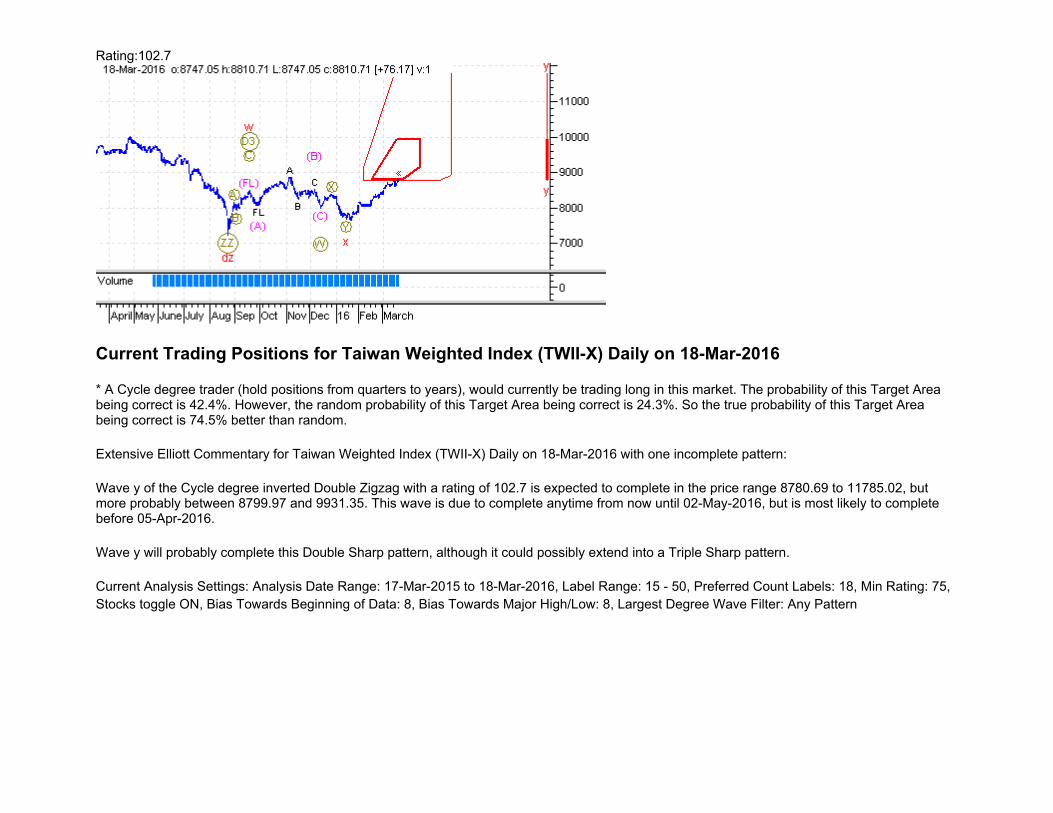
Current Analysis Settings: Analysis Date Range: 17-Mar-2015 to 18-Mar-2016, Label Range: 15 - 50, Preferred Count Labels: 18, Min Rating: 75, Stocks toggle ON, Bias Towards Beginning of Data: 8, Bias Towards Major High/Low: 8, Largest Degree Wave Filter: Any Pattern
* A Cycle degree trader (hold positions from quarters to years), would currently be trading long in this market. The probability of this Target Area being correct is 42.4%. However, the random probability of this Target Area being correct is 24.3%. So the true probability of this Target Area being correct is 74.5% better than random.
Wave y of the Cycle degree inverted Double Zigzag with a rating of 102.7 is expected to complete in the price range 8780.69 to 11785.02, but more probably between 8799.97 and 9931.35. This wave is due to complete anytime from now until 02-May-2016, but is most likely to complete before 05-Apr-2016.
Wave y will probably complete this Double Sharp pattern, although it could possibly extend into a Triple Sharp pattern.
Extensive Elliott Commentary for Taiwan Weighted Index (TWII-X) Daily on 18-Mar-2016 with one incomplete pattern:
Current Trading Positions for Taiwan Weighted Index (TWII-X) Daily on 18-Mar-2016