15
Elliott Wave Technical Analysis Course - Part 2 Surfing the Waves with Richard Tataru www.orbex.com
Elliott Wave Technical Analysis Course - Part 2Surfing the Waves with Richard Tataru
www.orbex.com

Who is Orbex?Orbex is a global award-winning online forex broker, fully licensed and regulated by CySEC, specializing in the provision of access to the world’s biggest and most liquid financial mar-kets. Orbex has a rich experience of ensuring superior customer service. Traders enjoy 24/5 multilingual support, exceptional trading conditions, and a wealth of educational material.
Since its founding in 2010, Orbex has focused on the quality of its services and technologi-cal advancement. As a part of our customer support program, we provide enhanced securi-ty of clients’ funds and high professionalism in confidential finance matters. Orbex under-stands the value of rapid decisions on fast-paced financial markets; therefore, we ensure sharp execution, sound market analysis, and extensive trading education. For our business partners, we have developed an outstanding Forex Affiliate Program, including personal business consultant, custom marketing campaigns, innovative affiliate dashboard, competitive commissions and leading reporting technology that provides full control over your business. Join Orbex and enjoy the new trading experience!
About the Author
Richard is passionate about technical analysis with years of charting experience under his belt. When it comes to his insights and how he analyses the markets, he uses leading analysis tools. In particular, Elliott Wave Analysis is his forte, and he dedicates the majority of his time to using and perfecting this analytical method. Richard uses Elliott Waves in combination with Struc-tures, Patterns, Divergences, and then spices things up with Vibration Levels, Fibonacci measurements, Chan-neling, Break-outs or Flag formations.
1www.orbex.com
CONTENT & COURSE STRUCTURE
4
10
WAVES CHARACTERISTICS
FRACTAL PATTERS
WAVES DEGREES & LABELING
FIBONACCI RELATIONSHIP
FIBONACCI SEQUENCE VS WAVE NUMBERS
Sit back and surf the waves, it’ll be worth your while!
2www.orbex.com
11
12
13
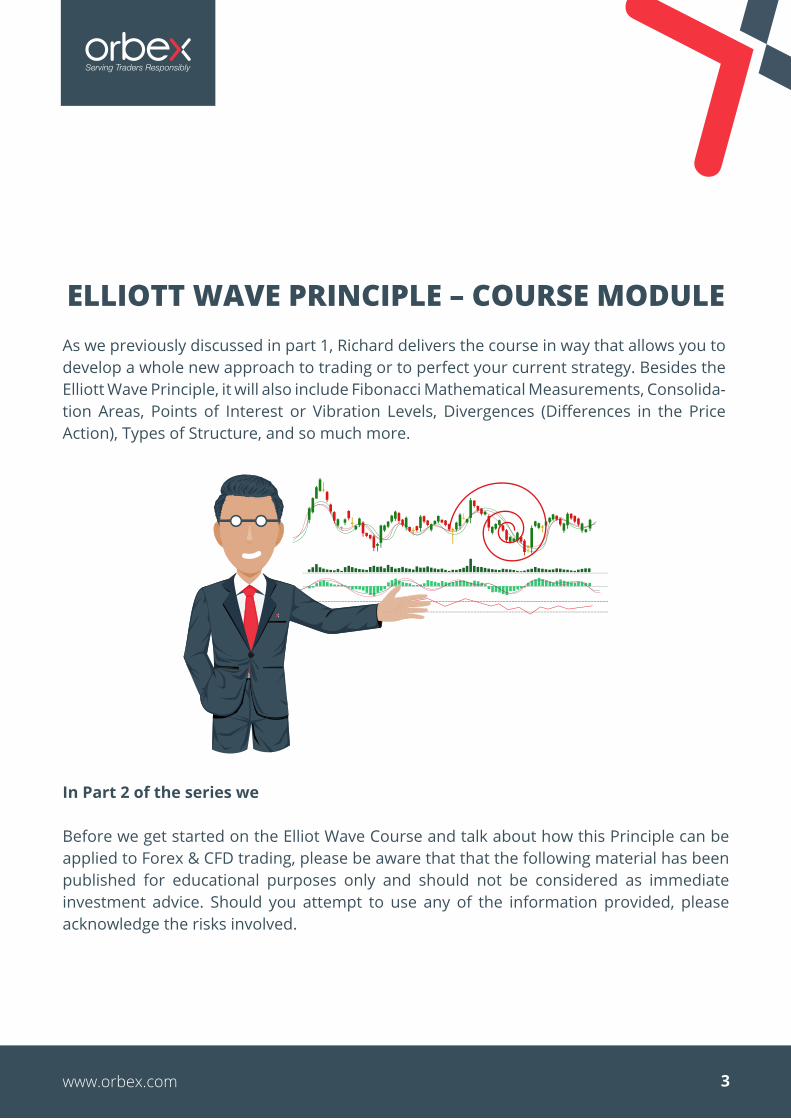
ELLIOTT WAVE PRINCIPLE – COURSE MODULE
In Part 2 of the series we
Before we get started on the Elliot Wave Course and talk about how this Principle can be applied to Forex & CFD trading, please be aware that that the following material has been published for educational purposes only and should not be considered as immediate investment advice. Should you attempt to use any of the information provided, please acknowledge the risks involved.
As we previously discussed in part 1, Richard delivers the course in way that allows you to develop a whole new approach to trading or to perfect your current strategy. Besides the Elliott Wave Principle, it will also include Fibonacci Mathematical Measurements, Consolida-tion Areas, Points of Interest or Vibration Levels, Divergences (Differences in the Price Action), Types of Structure, and so much more.
3www.orbex.com
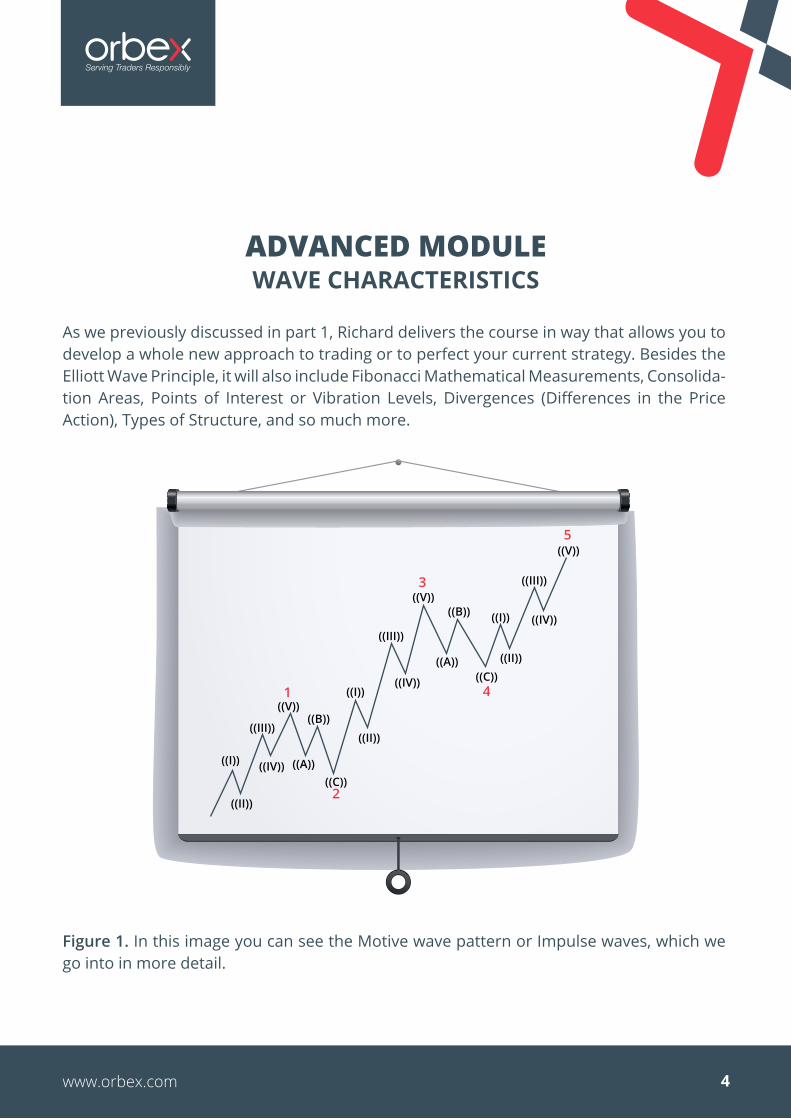
ADVANCED MODULEWAVE CHARACTERISTICS
As we previously discussed in part 1, Richard delivers the course in way that allows you to develop a whole new approach to trading or to perfect your current strategy. Besides the Elliott Wave Principle, it will also include Fibonacci Mathematical Measurements, Consolida-tion Areas, Points of Interest or Vibration Levels, Divergences (Differences in the Price Action), Types of Structure, and so much more.
Figure 1. In this image you can see the Motive wave pattern or Impulse waves, which we go into in more detail.
4www.orbex.com
((I))
((I))
((I))
((II))
((II))
((II))
((III))
((III))
((III))
((IV))
((IV))
((IV))
((V))((B))
((B))
((A))
((A))
((C))
((C))1
((V))5
((V))3
4
2
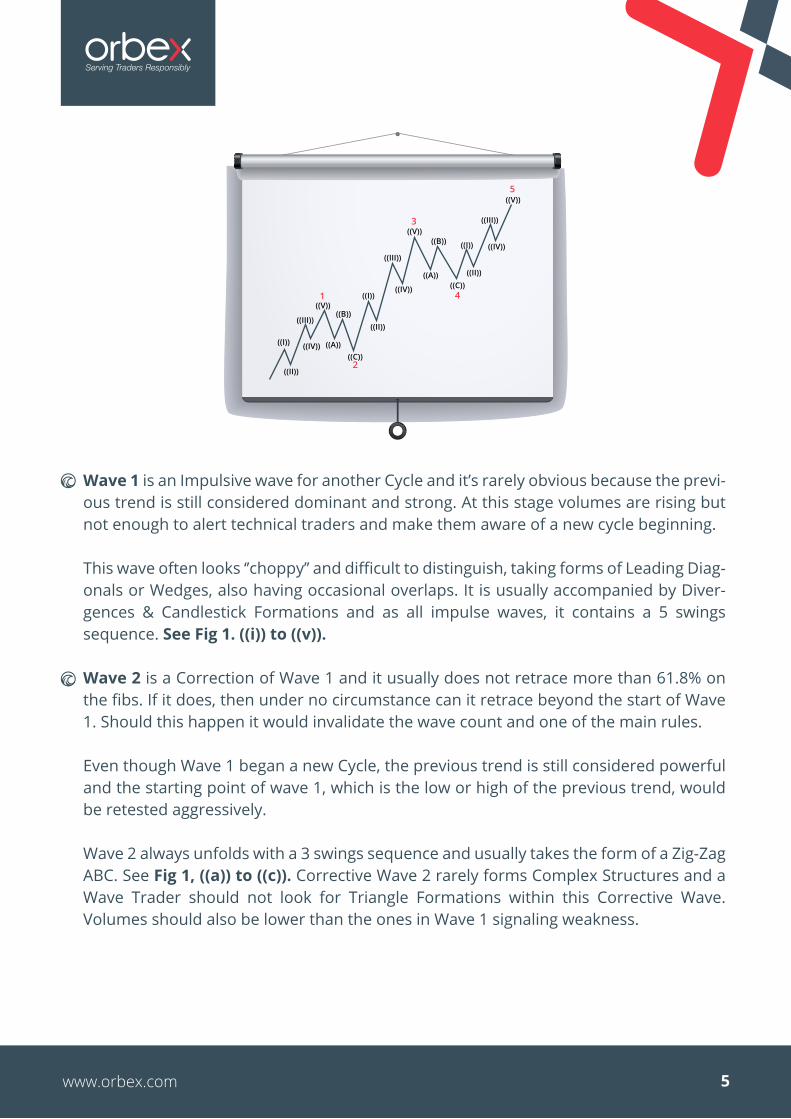
Wave 1 is an Impulsive wave for another Cycle and it’s rarely obvious because the previ-ous trend is still considered dominant and strong. At this stage volumes are rising but not enough to alert technical traders and make them aware of a new cycle beginning.
This wave often looks ‘’choppy’’ and difficult to distinguish, taking forms of Leading Diag-onals or Wedges, also having occasional overlaps. It is usually accompanied by Diver-gences & Candlestick Formations and as all impulse waves, it contains a 5 swings sequence. See Fig 1. ((i)) to ((v)).
Wave 2 is a Correction of Wave 1 and it usually does not retrace more than 61.8% on the fibs. If it does, then under no circumstance can it retrace beyond the start of Wave 1. Should this happen it would invalidate the wave count and one of the main rules.
Even though Wave 1 began a new Cycle, the previous trend is still considered powerful and the starting point of wave 1, which is the low or high of the previous trend, would be retested aggressively.
Wave 2 always unfolds with a 3 swings sequence and usually takes the form of a Zig-Zag ABC. See Fig 1, ((a)) to ((c)). Corrective Wave 2 rarely forms Complex Structures and a Wave Trader should not look for Triangle Formations within this Corrective Wave. Volumes should also be lower than the ones in Wave 1 signaling weakness.
5www.orbex.com
((I))
((I))
((I))
((II))
((II))
((II))
((III))
((III))
((III))
((IV))
((IV))
((IV))
((V))((B))
((B))
((A))
((A))
((C))
((C))1
((V))5
((V))3
4
2
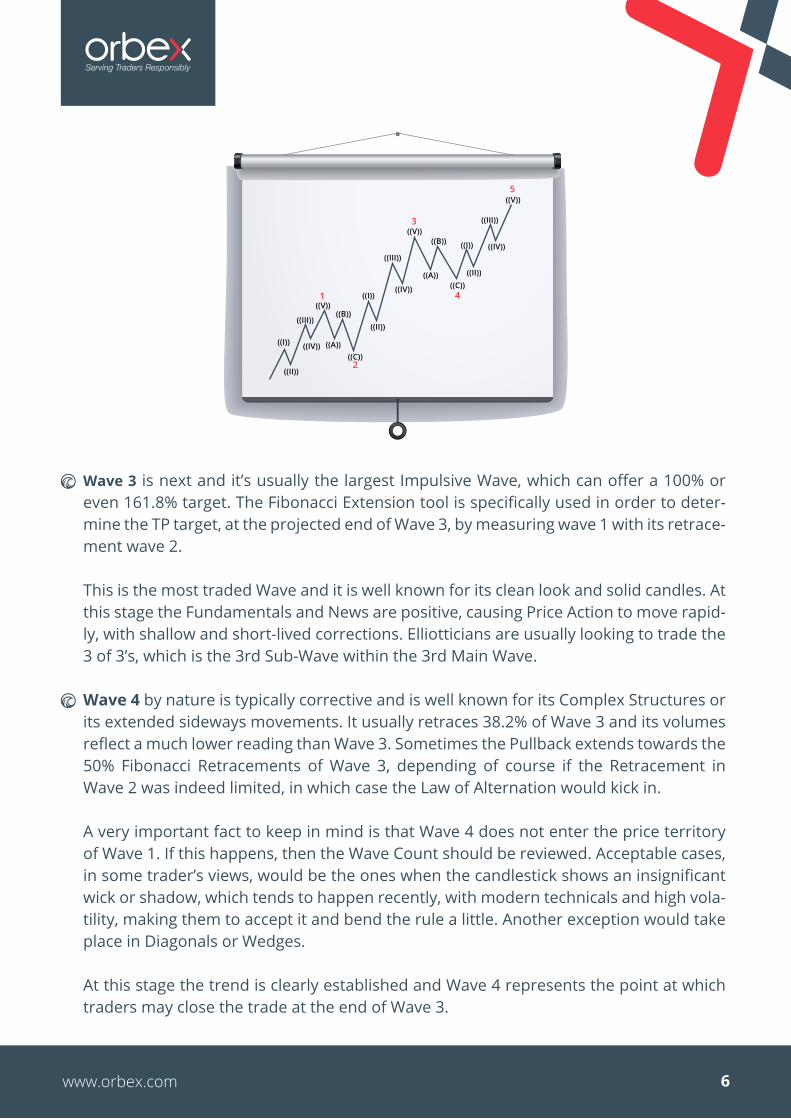
Wave 3 is next and it’s usually the largest Impulsive Wave, which can offer a 100% or even 161.8% target. The Fibonacci Extension tool is specifically used in order to deter-mine the TP target, at the projected end of Wave 3, by measuring wave 1 with its retrace-ment wave 2.
This is the most traded Wave and it is well known for its clean look and solid candles. At this stage the Fundamentals and News are positive, causing Price Action to move rapid-ly, with shallow and short-lived corrections. Elliotticians are usually looking to trade the 3 of 3’s, which is the 3rd Sub-Wave within the 3rd Main Wave.
Wave 4 by nature is typically corrective and is well known for its Complex Structures or its extended sideways movements. It usually retraces 38.2% of Wave 3 and its volumes reflect a much lower reading than Wave 3. Sometimes the Pullback extends towards the 50% Fibonacci Retracements of Wave 3, depending of course if the Retracement in Wave 2 was indeed limited, in which case the Law of Alternation would kick in.
A very important fact to keep in mind is that Wave 4 does not enter the price territory of Wave 1. If this happens, then the Wave Count should be reviewed. Acceptable cases, in some trader’s views, would be the ones when the candlestick shows an insignificant wick or shadow, which tends to happen recently, with modern technicals and high vola-tility, making them to accept it and bend the rule a little. Another exception would take place in Diagonals or Wedges.
At this stage the trend is clearly established and Wave 4 represents the point at which traders may close the trade at the end of Wave 3.
6www.orbex.com
((I))
((I))
((I))
((II))
((II))
((II))
((III))
((III))
((III))
((IV))
((IV))
((IV))
((V))((B))
((B))
((A))
((A))
((C))
((C))1
((V))5
((V))3
4
2
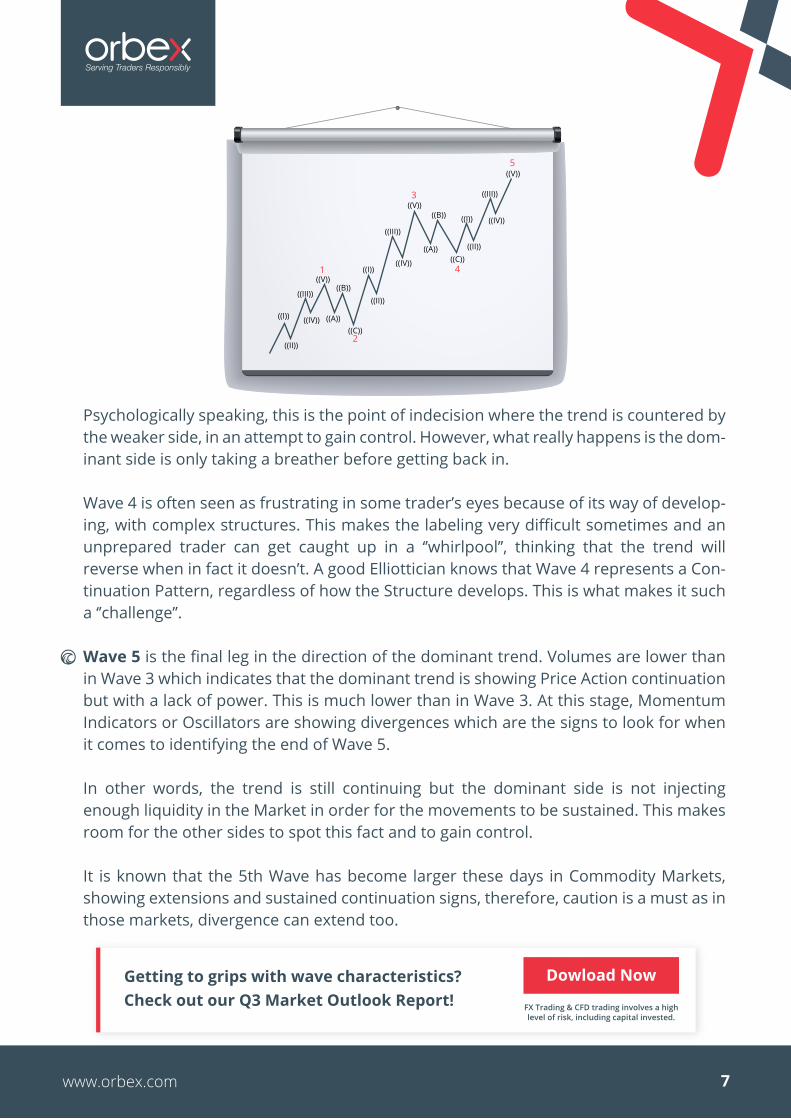
Psychologically speaking, this is the point of indecision where the trend is countered by the weaker side, in an attempt to gain control. However, what really happens is the dom-inant side is only taking a breather before getting back in.
Wave 4 is often seen as frustrating in some trader’s eyes because of its way of develop-ing, with complex structures. This makes the labeling very difficult sometimes and an unprepared trader can get caught up in a ‘’whirlpool’’, thinking that the trend will reverse when in fact it doesn’t. A good Elliottician knows that Wave 4 represents a Con-tinuation Pattern, regardless of how the Structure develops. This is what makes it such a ‘’challenge’’.
Wave 5 is the final leg in the direction of the dominant trend. Volumes are lower than in Wave 3 which indicates that the dominant trend is showing Price Action continuation but with a lack of power. This is much lower than in Wave 3. At this stage, Momentum Indicators or Oscillators are showing divergences which are the signs to look for when it comes to identifying the end of Wave 5.
In other words, the trend is still continuing but the dominant side is not injecting enough liquidity in the Market in order for the movements to be sustained. This makes room for the other sides to spot this fact and to gain control.
It is known that the 5th Wave has become larger these days in Commodity Markets, showing extensions and sustained continuation signs, therefore, caution is a must as in those markets, divergence can extend too.
7www.orbex.com
((I))
((I))
((I))
((II))
((II))
((II))
((III))
((III))
((III))
((IV))
((IV))
((IV))
((V))((B))
((B))
((A))
((A))
((C))
((C))1
((V))5
((V))3
4
2
https://www.orbex.com/en/quarter-report?ref_id=c6389https://www.orbex.com/en/quarter-report?ref_id=c6389https://www.orbex.com/en/quarter-report?ref_id=c6389https://www.orbex.com/en/quarter-report?ref_id=c6389https://www.orbex.com/en/quarter-report?ref_id=c6389https://www.orbex.com/en/quarter-report?ref_id=c6389
Getting to grips with wave characteristics? Check out our Q3 Market Outlook Report! FX Trading & CFD trading involves a high
level of risk, including capital invested.
ABC CORRECTIVE TREND
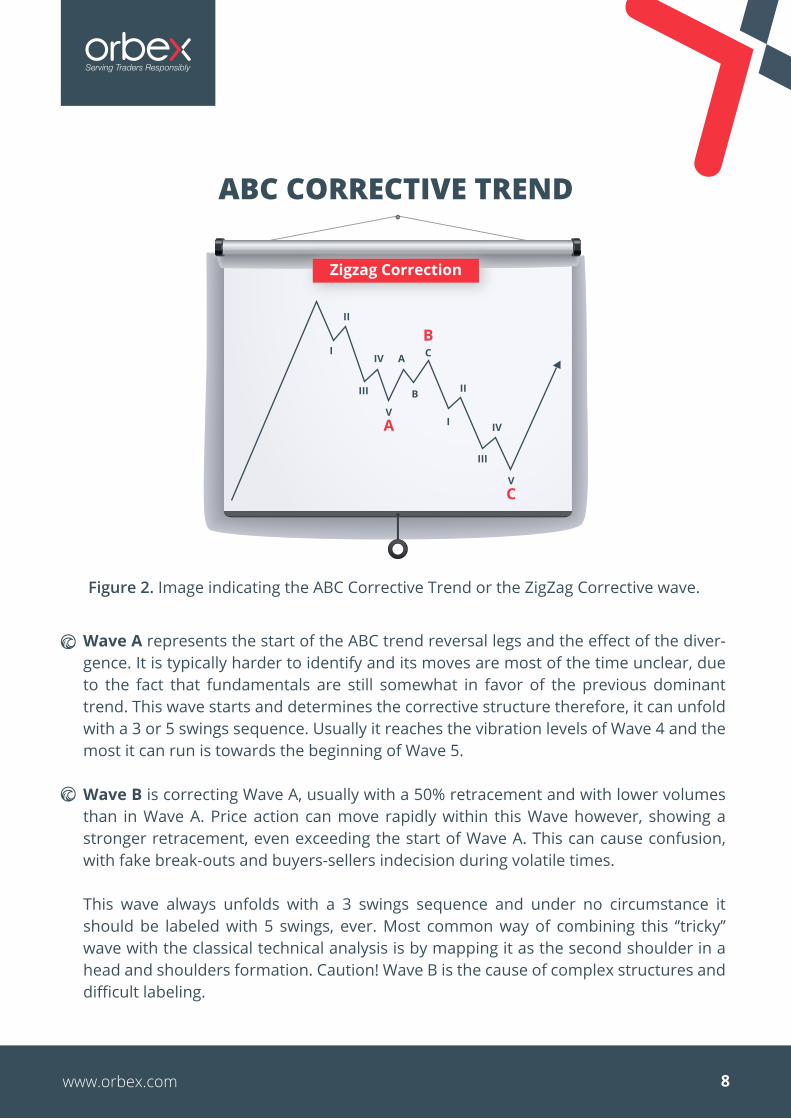
Figure 2. Image indicating the ABC Corrective Trend or the ZigZag Corrective wave.
Wave A represents the start of the ABC trend reversal legs and the effect of the diver-gence. It is typically harder to identify and its moves are most of the time unclear, due to the fact that fundamentals are still somewhat in favor of the previous dominant trend. This wave starts and determines the corrective structure therefore, it can unfold with a 3 or 5 swings sequence. Usually it reaches the vibration levels of Wave 4 and the most it can run is towards the beginning of Wave 5.
Wave B is correcting Wave A, usually with a 50% retracement and with lower volumes than in Wave A. Price action can move rapidly within this Wave however, showing a stronger retracement, even exceeding the start of Wave A. This can cause confusion, with fake break-outs and buyers-sellers indecision during volatile times.
This wave always unfolds with a 3 swings sequence and under no circumstance it should be labeled with 5 swings, ever. Most common way of combining this ‘’tricky’’ wave with the classical technical analysis is by mapping it as the second shoulder in a head and shoulders formation. Caution! Wave B is the cause of complex structures and difficult labeling.
8www.orbex.com
I
I
II
IIIII
III
IV
IV
A
B
C
VA
VC
B
Zigzag Correction
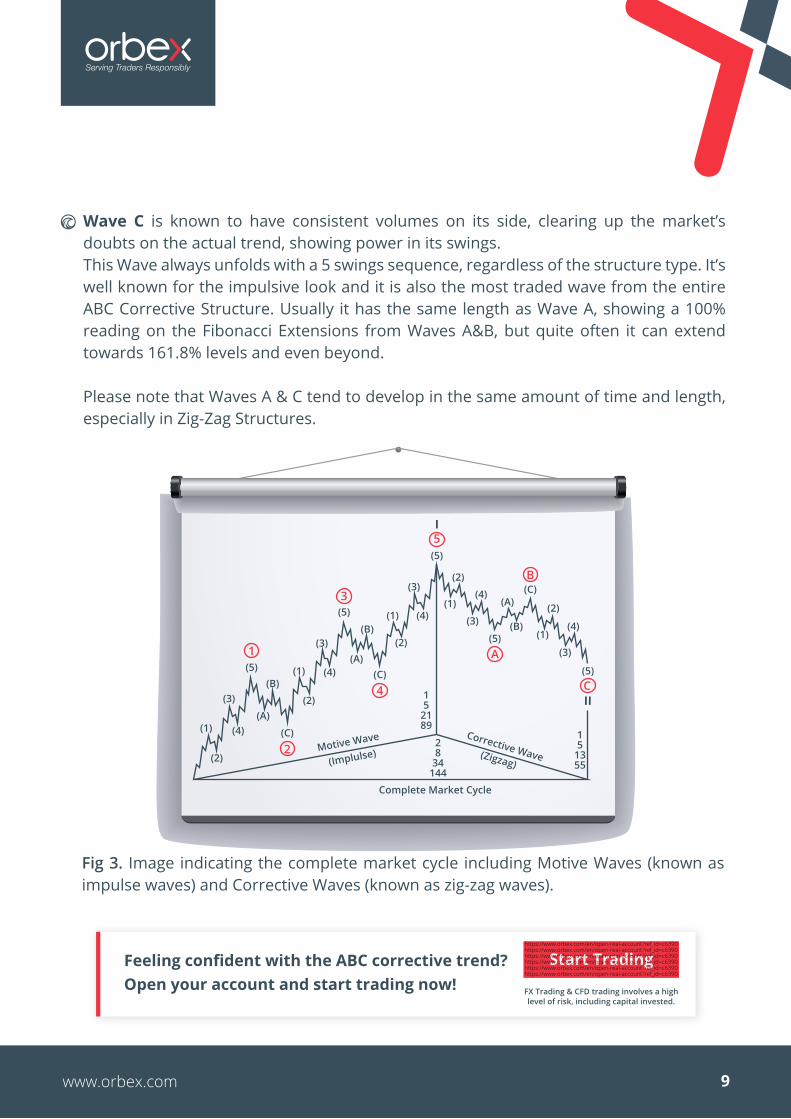
Wave C is known to have consistent volumes on its side, clearing up the market’s doubts on the actual trend, showing power in its swings.This Wave always unfolds with a 5 swings sequence, regardless of the structure type. It’s well known for the impulsive look and it is also the most traded wave from the entire ABC Corrective Structure. Usually it has the same length as Wave A, showing a 100% reading on the Fibonacci Extensions from Waves A&B, but quite often it can extend towards 161.8% levels and even beyond.
Please note that Waves A & C tend to develop in the same amount of time and length, especially in Zig-Zag Structures.
Fig 3. Image indicating the complete market cycle including Motive Waves (known as impulse waves) and Corrective Waves (known as zig-zag waves).
9www.orbex.com
1
I
II
2
A
(1)
(1)
(1)(1)
(1)
(2)
(2)
(2)
15
2189
28
34144
15
1355
(2)
(2)
(3)
(3)
(3)
(3)
(3)
(4)
(4)
(4)
(4)
(4)
(A)
(A)
(A)
(5)(B)
(B) (B)
(C)
(5)
(5)
(5)
(C)
(C)
(5)C
Complete Market Cycle
3
5
4
B
Feeling confident with the ABC corrective trend? Open your account and start trading now! FX Trading & CFD trading involves a high
level of risk, including capital invested.
https://www.orbex.com/en/open-real-account?ref_id=c6390https://www.orbex.com/en/open-real-account?ref_id=c6390https://www.orbex.com/en/open-real-account?ref_id=c6390https://www.orbex.com/en/open-real-account?ref_id=c6390https://www.orbex.com/en/open-real-account?ref_id=c6390https://www.orbex.com/en/open-real-account?ref_id=c6390
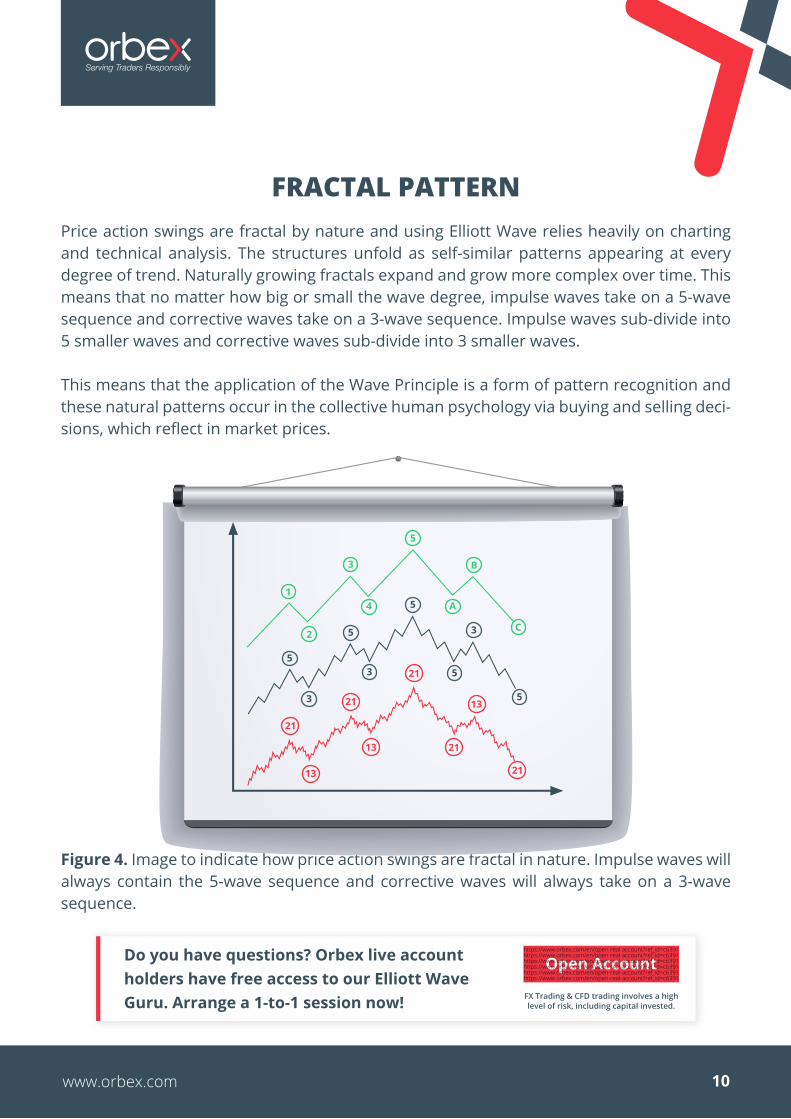
Price action swings are fractal by nature and using Elliott Wave relies heavily on charting and technical analysis. The structures unfold as self-similar patterns appearing at every degree of trend. Naturally growing fractals expand and grow more complex over time. This means that no matter how big or small the wave degree, impulse waves take on a 5-wave sequence and corrective waves take on a 3-wave sequence. Impulse waves sub-divide into 5 smaller waves and corrective waves sub-divide into 3 smaller waves.
This means that the application of the Wave Principle is a form of pattern recognition and these natural patterns occur in the collective human psychology via buying and selling deci-sions, which reflect in market prices.
Figure 4. Image to indicate how price action swings are fractal in nature. Impulse waves will always contain the 5-wave sequence and corrective waves will always take on a 3-wave sequence.
FRACTAL PATTERN
10www.orbex.com
41
2
5
3
A
B
C
5
5
5
5
5
3
3
3
Do you have questions? Orbex live account holders have free access to our Elliott Wave Guru. Arrange a 1-to-1 session now! FX Trading & CFD trading involves a high
level of risk, including capital invested.
https://www.orbex.com/en/open-real-account?ref_id=c6391https://www.orbex.com/en/open-real-account?ref_id=c6391https://www.orbex.com/en/open-real-account?ref_id=c6391https://www.orbex.com/en/open-real-account?ref_id=c6391https://www.orbex.com/en/open-real-account?ref_id=c6391https://www.orbex.com/en/open-real-account?ref_id=c6391
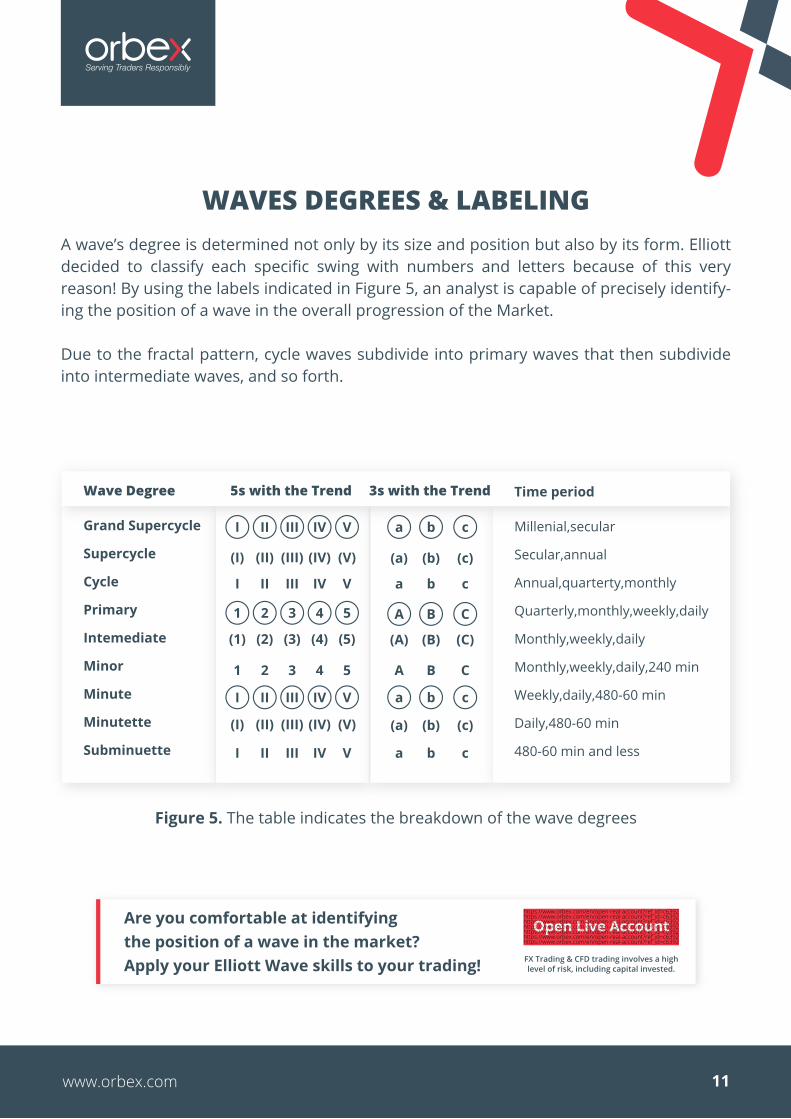
A wave’s degree is determined not only by its size and position but also by its form. Elliott decided to classify each specific swing with numbers and letters because of this very reason! By using the labels indicated in Figure 5, an analyst is capable of precisely identify-ing the position of a wave in the overall progression of the Market.
Due to the fractal pattern, cycle waves subdivide into primary waves that then subdivide into intermediate waves, and so forth.
Figure 5. The table indicates the breakdown of the wave degrees
WAVES DEGREES & LABELING
11www.orbex.com
Wave Degree
Grand Supercycle
Supercycle
Cycle
Primary
Intemediate
Minor
Minute
Minutette
Subminuette
5s with the Trend 3s with the Trend Time period
Millenial,secular
Secular,annual
Annual,quarterty,monthly
Quarterly,monthly,weekly,daily
Monthly,weekly,daily
Monthly,weekly,daily,240 min
Weekly,daily,480-60 min
Daily,480-60 min
480-60 min and less
I II III a b c
a b c
(a) (b) (c)
A B C
(A) (B) (C)
A B C
a b c
(a) (b) (c)
a b c
IV V
(I) (II) (III) (IV) (V)
I II III IV V
I II III IV V
(I) (II) (III) (IV) (V)
I II III IV V
1 2 3 4 5
1 2 3 4 5
(1) (2) (3) (4) (5)
Are you comfortable at identifying the position of a wave in the market? Apply your Elliott Wave skills to your trading! FX Trading & CFD trading involves a high
level of risk, including capital invested.
https://www.orbex.com/en/open-real-account?ref_id=c6392https://www.orbex.com/en/open-real-account?ref_id=c6392https://www.orbex.com/en/open-real-account?ref_id=c6392https://www.orbex.com/en/open-real-account?ref_id=c6392https://www.orbex.com/en/open-real-account?ref_id=c6392https://www.orbex.com/en/open-real-account?ref_id=c6392https://www.orbex.com/en/open-real-account?ref_id=c6392
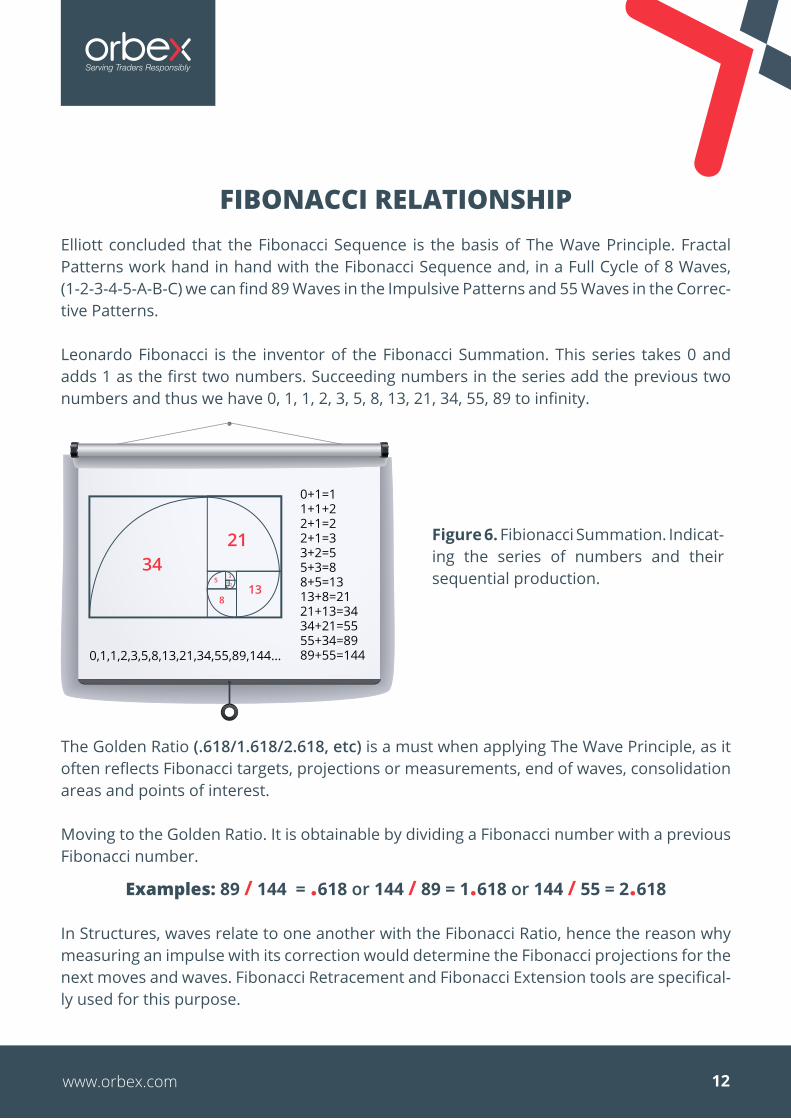
Elliott concluded that the Fibonacci Sequence is the basis of The Wave Principle. Fractal Patterns work hand in hand with the Fibonacci Sequence and, in a Full Cycle of 8 Waves, (1-2-3-4-5-A-B-C) we can find 89 Waves in the Impulsive Patterns and 55 Waves in the Correc-tive Patterns.
Leonardo Fibonacci is the inventor of the Fibonacci Summation. This series takes 0 and adds 1 as the first two numbers. Succeeding numbers in the series add the previous two numbers and thus we have 0, 1, 1, 2, 3, 5, 8, 13, 21, 34, 55, 89 to infinity.
Figure 6. Fibionacci Summation. Indicat-ing the series of numbers and their sequential production.
The Golden Ratio (.618/1.618/2.618, etc) is a must when applying The Wave Principle, as it often reflects Fibonacci targets, projections or measurements, end of waves, consolidation areas and points of interest.
Moving to the Golden Ratio. It is obtainable by dividing a Fibonacci number with a previous Fibonacci number.
Examples: 89 / 144 = .618 or 144 / 89 = 1.618 or 144 / 55 = 2.618
In Structures, waves relate to one another with the Fibonacci Ratio, hence the reason why measuring an impulse with its correction would determine the Fibonacci projections for the next moves and waves. Fibonacci Retracement and Fibonacci Extension tools are specifical-ly used for this purpose.
FIBONACCI RELATIONSHIP
12www.orbex.com
3421
13
0,1,1,2,3,5,8,13,21,34,55,89,144...
8
53
21
0+1=11+1+22+1=22+1=33+2=55+3=88+5=1313+8=2121+13=3434+21=5555+34=8989+55=144
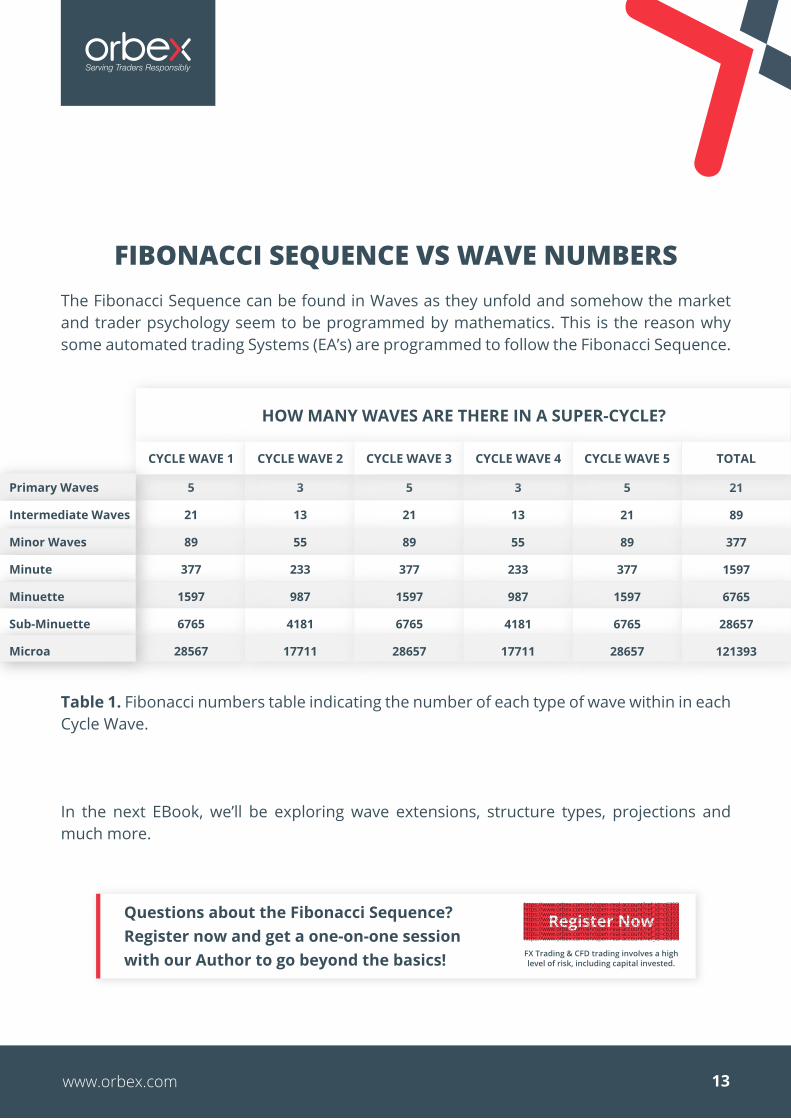
The Fibonacci Sequence can be found in Waves as they unfold and somehow the market and trader psychology seem to be programmed by mathematics. This is the reason why some automated trading Systems (EA’s) are programmed to follow the Fibonacci Sequence.
Table 1. Fibonacci numbers table indicating the number of each type of wave within in each Cycle Wave.
In the next EBook, we’ll be exploring wave extensions, structure types, projections and much more.
FIBONACCI SEQUENCE VS WAVE NUMBERS
13www.orbex.com
5
21
89
377
1597
6765
28567
3
13
55
233
987
4181
17711
5
21
89
377
1597
6765
28657
3
13
55
233
987
4181
17711
5
21
89
377
1597
6765
28657
21
89
377
1597
6765
28657
121393
HOW MANY WAVES ARE THERE IN A SUPER-CYCLE?
CYCLE WAVE 1 CYCLE WAVE 2 CYCLE WAVE 3 CYCLE WAVE 4 CYCLE WAVE 5 TOTAL
Primary Waves
Intermediate Waves
Minor Waves
Minute
Minuette
Sub-Minuette
Microa
Questions about the Fibonacci Sequence? Register now and get a one-on-one session with our Author to go beyond the basics! FX Trading & CFD trading involves a high
level of risk, including capital invested.
https://www.orbex.com/en/open-real-account?ref_id=c6393https://www.orbex.com/en/open-real-account?ref_id=c6393https://www.orbex.com/en/open-real-account?ref_id=c6393https://www.orbex.com/en/open-real-account?ref_id=c6393https://www.orbex.com/en/open-real-account?ref_id=c6393https://www.orbex.com/en/open-real-account?ref_id=c6393https://www.orbex.com/en/open-real-account?ref_id=c6393https://www.orbex.com/en/open-real-account?ref_id=c6393
Risk warning: Forex, Commodities and CFDs (OTC Trading) are leveraged products that carry a substantial risk of loss up to your invested capital and may not be suitable for everyone. Please ensure that you understand fully the risks involved and do not invest money you cannot afford to lose. The information provided can under no circumstances be considered as a recommendation to engage in any trade. © Orbex Limited All rights reserved Our company is licensed by the Cyprus Securities & Exchange Commission - (CySEC – License Number 124/10), which has been passported in the European Union through the MiFID Directive.

![Identifying Elliott Wave Patterns [ChartSchool]](https://static.documents.pub/doc/80x56/577c813f1a28abe054ac1417/identifying-elliott-wave-patterns-chartschool.jpg)


