| Presented By Date GETTING DATA ANALYTICS INTO PRODUCTION: BRIDGING THE GAP BETWEEN DATA SCIENCE AND PRODUCT DEVELOPMENT Unleashing Data Excellence 2016, Amsterdam Michelle Gregory 7 November 2016
Transcript
|
Presented By
Date
GETTING DATA ANALYTICS INTO PRODUCTION: BRIDGING THE GAP BETWEEN DATA SCIENCE AND PRODUCT DEVELOPMENT
Unleashing Data Excellence 2016, Amsterdam
Michelle Gregory
7 November 2016
2
£6 billion
2015 revenue
7,200
170
Employees
Countries served
2,500 Journals
30,000 Books
3,500 Healthcare institutions
3
What we do: we help scientists and health professionals to get better outcomes and become more productive
We combine content and data with analytics and technology to help:
RESEARCHERS
to make new discoveries and
have more impact on society
CLINICIANS
to treat patients better
and save more lives
NURSES
to get jobs and help
save lives
4
Where we are going: our products and services are becoming decision support tools, built on high quality content and data
Answers ROS
Data
User is:
“searching”
“doing”
Content “reading”
Research
Corporate
R&D
Clinical
practitioners
Nursing
students
Woodhead Gray’s
Anatomy Fundamentals Cell
Science
Direct Knovel Clinical Key Evolve
Knovel
Materials Infermed Sherpath
Enabling
technologies
1. Standard architecture, next-gen search & recommendation
2. Access hubs for user applications
3. Big data platforms
4. Semantic enrichment & knowledge graphs
5. Machine learning
5
Our capabilities: best content, advanced data analytics, product development
Content & data
Product
State-of-the-art
technology
|
• For a traditional B2B company, the transition to data and analytics as a service has not always been intuitive
• Backend processing was separated from product usage
• Quality of content and tools determined independently from end products
• No shared metrics of success
• Does not allow for iterative testing of analytic products
Data does not get pushed to the products to be exposed to users, nor is it gathered from platforms and analyzed offline.
Can’t separate our data scientists from product development and marketing
Unleashing data: a combination of data, advanced analytics and product development
Outline 1. Accuracy versus quality: Chemical entity extraction 2. Shared metrics: Topic identification 3. How to get data where data doesn’t exist: Academic family trees
|
Reaxys: Automatic chemical entity recognition
Challenge: Content from 450 journals is manually annotated for chemical entities and their properties
| 8
Approach: apply advanced NLP and ML to automate extraction
Hurdles • Are there existing tools that are good enough? • QA functions questions accuracy required from machines • Product assumes humans are always correct • Suppliers are not incentivized to use modern analytic methods • To get any improvements in, entire workflows will have to change
New articles / Patent - unannotated Prediction model Predictions
| 9
Approach: apply advanced NLP and ML to automate extraction
Solutions • Are there existing tools that are good enough? Identified third party tools and in-house expertise • QA functions questions accuracy required from machines QA process is different than accuracy. Accuracy for NLP is measured in terms of F-scores. A QA claim 96% accurate is not the same as a 96% F-score • Product assumes humans are always correct When algorithms predict differently than humans, they are thought to be wrong. However, when humans are measured by the same scientific standards, we see they don’t always agree with each other.
• Suppliers are not incentivized to use modern analytic methods Efficiency gains can only be realized if contracts with suppliers are renegotiated • To get any improvements in, entire workflows will have to change To find the right balance between humans and machines, we need to be able to incorporate the automation while not taking the human out of the loop. We also need to be able to learn from the work that humans do
| 10
Outcomes • Quality. Within 6 months we had tools with good enough quality to
do automatically. • Cost. Within 8 months, contracts renegotiated with suppliers,
resulting in 1 million in annualized savings • Scalability. Within 1 year, able to extract chemical compounds from
450 journals to over 16000.
Reaxys: Automatic chemical entity recognition
Major takeaways • Organization. While the data scientist saw the value of this
approach, the feasibility required data scientists to work side by side with domain experts, QA functions, and product.
• Quality. There was a lot of cross-education on quality, what it means, how it is measured. Accuracy and fit for purpose are related, but not synonymous.
|
Science direct: Topics and definitions
SD. A platform for researchers to search
for articles in Elsevier content.
Problem, User Need and Opportunity:
New product designed to make their work
flow easier--researchers need answers to
questions.
Proposed Solution:
Integrate book and journal content
on ScienceDirect by leveraging our Smart
Content capabilities, to provide content in
context, aligned to the problem it solves for
the researcher.
Use Cases: “I need to quickly get authoritative information on words or concepts that are new to me” “I want to better understand the article” “I need both the foundational information and the latest developments in this area”
Hurdles: what are our metrics of success? How accurate we are in tagging data? How good
are our algorithms at finding definitions and methods in book content? What if we have the
best algorithms but the UI is not very useful?
|
Approach
12
ANALYTICS
Subscribed Usage
Unsubscribed Usage
ARTICLE PAGE NEW! TOPIC PAGE CHAPTER PAGE USAGE DATA
GOOGLE
Free content extracted from books features a Definition and
links to Chapter pages containing relevant books content. Experimenting to decide
minimum amount of content
Links to book chapter full text (subscribed) or abstract
(unsubscribed) on SD
Relevant concepts in journal articles highlights and
hyperlinked to new machine generated “Topic pages”
Topic pages also indexed by web search engines
Subscribed usage and unsubscribed
turnaways drives ‘value based’ selling and commissioning
|
13
Buyer response n% think the new features and usage statistics would increase their e-book purchasing
from ScienceDirect
n% think that the integrated content would increase e-book usage
n% would expect an increase in the value of their purchases
User Response 89% of users found the topic page helpful “This would be great, I would read all of this. I would have been pleased with this page [when writing
my paper], it would have saved me a lot of time” M, Senior Research Associate, Neuroscience
“this is exactly the kind of thing I would be looking for. I’m used to bland Wikipedia, this is more on-
point and technical, …it would certainly save me a lot of time” J, Senior Research Associate,
Neuroscience & Pharmacology
Use cases and engagement have been validated
Analytics results (quantitative and qualitative)
0,0%
2,0%
4,0%
6,0%
8,0%
10,0%
12,0%
V0 V1 V2 V3 V4 V5 V6 V7
CT
R
| 14
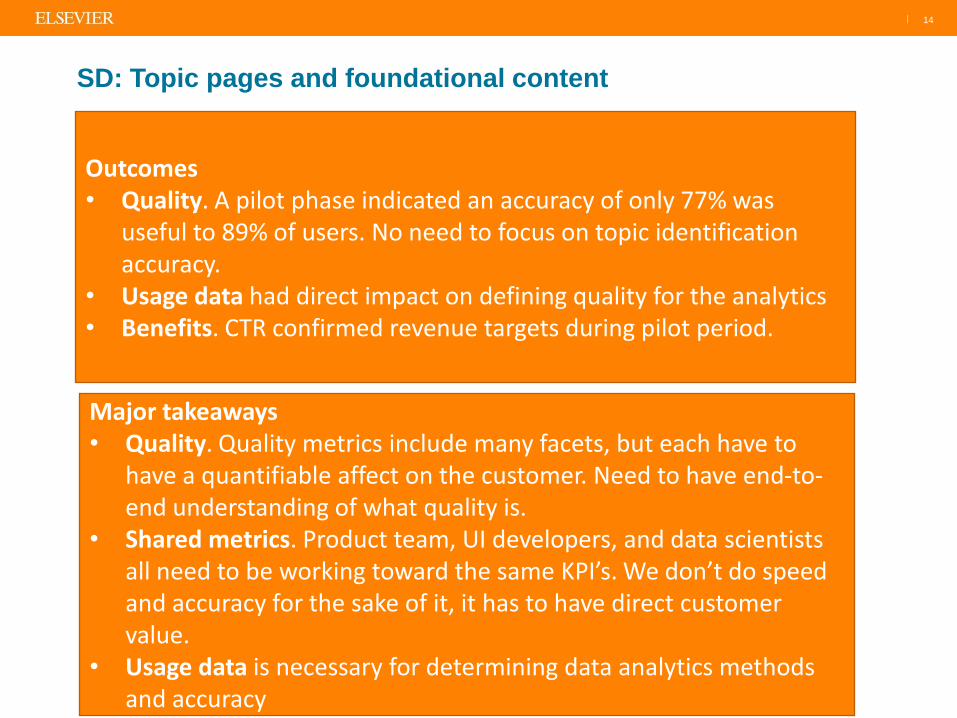
Outcomes • Quality. A pilot phase indicated an accuracy of only 77% was
useful to 89% of users. No need to focus on topic identification accuracy.
• Usage data had direct impact on defining quality for the analytics • Benefits. CTR confirmed revenue targets during pilot period.
SD: Topic pages and foundational content
Major takeaways • Quality. Quality metrics include many facets, but each have to
have a quantifiable affect on the customer. Need to have end-to-end understanding of what quality is.
• Shared metrics. Product team, UI developers, and data scientists all need to be working toward the same KPI’s. We don’t do speed and accuracy for the sake of it, it has to have direct customer value.
• Usage data is necessary for determining data analytics methods and accuracy
|
How to get data where data doesn’t exist: Academic Family Trees
• Need: Academic family-trees • Be aware of conflict of interests: for example in reviewer selection or funding
panelists
• Recommendations such as article/people in Mendeley or ROS Communities
• Dilemma: • How can I get it right if I do not have data?
• What would be the optimal roadmap to grow a hackathon model to a full scale product?
art clip taken from https://teamupstartup.com
• High Quality: ONLY IF YOU CAN GET IT RIGHT
• Chicken and Egg problem: most data analytic ideas are killed in infancy because (evaluation) data does not exist or cannot be collected cheaply
|
Heuristic Model
(baseline)
Email Campaign
(Crowd Sourcing)
Supervised ML Model
Background Enhancement
of Existing Product
ML Model enhanced with
User Data or Subscription
Info
New Product I: Collective Data
Value
New Product II: Individual Data Point
16
Approach: Evolve through models, platforms and products to grow the data and the analytical models in an agile way in a least costly path
• A heuristic model suggesting a guess will simplify the question from who to Yes or No
• Different ML models: • Varying amount of need on training data • Varying mount of cost to train
• Each model will generate (the best available) guesses for the
next manual data collection. Model will be improved iteratively with better and larger data
• Click-through data can offer an additional data, which may be low quality but sufficient for initial stages
art clip taken from http://oneguestatatime.com/blog-2/organic-growth
|
Heuristic Model
(baseline)
Email Campaign
(Crowd Sourcing)
Supervised ML Model
Background Enhancement
of Existing Product
ML Model enhanced with
User Data or Subscription
Info
New Product I: Collective Data
Value
New Product II: Individual Data Point
17
Hosting Product to grow the model
• Acquire data/users from different business-sectors to accelerate data growth. Different products have different engagements, number of users, opt-in behaviors, or adoption/development cost
• Understand the impact of the accuracy on different products 1. Products benefitting from the model without explicitly
mentioning showing results (implicit application) 2. Products explicitly showing collective data 3. Products explicitly showing individual data
| 18
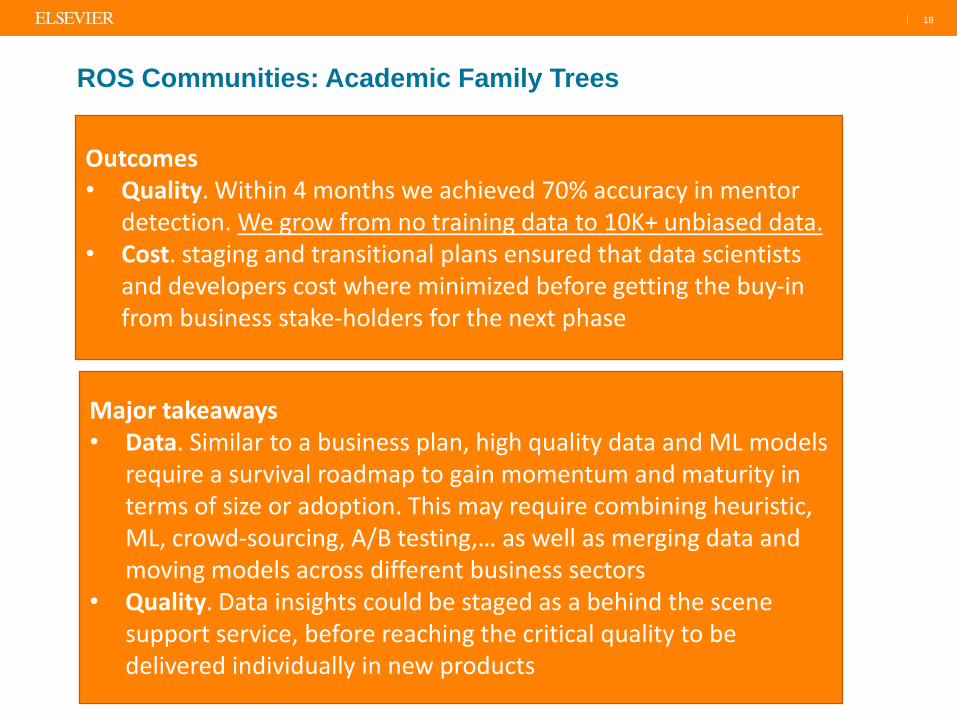
Outcomes • Quality. Within 4 months we achieved 70% accuracy in mentor
detection. We grow from no training data to 10K+ unbiased data. • Cost. staging and transitional plans ensured that data scientists
and developers cost where minimized before getting the buy-in from business stake-holders for the next phase
ROS Communities: Academic Family Trees
Major takeaways • Data. Similar to a business plan, high quality data and ML models
require a survival roadmap to gain momentum and maturity in terms of size or adoption. This may require combining heuristic, ML, crowd-sourcing, A/B testing,… as well as merging data and moving models across different business sectors
• Quality. Data insights could be staged as a behind the scene support service, before reaching the critical quality to be delivered individually in new products
|
Summary
Quality
• Need a wholistic approach that includes (1) quality of content; (2) accuracy of algorithms; and (3) fit for purpose
• Shared understanding of what quality is
Shared KPI’s
• Data scientists, software developers, and product people need to be working toward the same goal
• If a product metric is to increase revenue, then there have to be metrics in place to demonstrate how algorithms contribute to that
Product usage informs analytics
• User testing informs data quality needs
• User testing provides data where none was previously available
• Usage data confirms KPI’s
Organizational structure
• Data scientists need to be closely linked to product and software development
• All functions need to have incentive to work together (shared KPI’s)