Page 1
Elsevier Editorial System(tm) for Applied Thermal Engineering
Manuscript Draft
Manuscript Number:
Title: Numerical simulations of a prechamber autoignition cogeneration engine operating on natural gas
Article Type: Research Paper
Section/Category:
Keywords: autoignition; prechamber; cogeneration; computational fluid dynamics
Corresponding Author: Mr Stefan Heyne, MSc
Corresponding Author's Institution: Energy and Environment
First Author: Stefan Heyne, MSc
Order of Authors: Stefan Heyne, MSc; Grégory Millot; Daniel Favrat, Professor
Manuscript Region of Origin:
Abstract: A numerical simulation of a prechamber autoignition gas engine has been performed based on an
experimental test case. With a simplified finite-rate/eddy-dissipation model for the combustion of natural gas,
it was possible to properly reproduce the experiment considering the combustion duration, ignition timing
and overall energy balance. However the predefined empiric constant of the eddy-dissipation model had to
be increased by a factor of 10. A modification of the original cylindrical-conical prechamber geometry to a
simpler cylindrical one was tested with the simulation model. The influence of burnt gases inside the
prechamber was assessed simulating the mixture formation inside the prechamber. The simulations showed
little effect of taking into account the non-homogeneities in the gas phase on the combustion duration. The
simulation showed that the new and cylindrical geometry envisaged did not show any improvement in the
combustion homogeneity inside the prechamber and its volume (limited by the real engine geometry) is in
fact not sufficient to properly ignite the main chamber. The model can be used to further guide design
modifications of the prechamber engine to improve performance.
Page 3
Numerical simulations of a prechamber
autoignition cogeneration engine operating on
natural gas
S. Heyne, G. Millot and D. Favrat ∗
aIndustrial Energy Systems Laboratory, Ecole Polytechnique Federale de
Lausanne, 1015 Lausanne, Switzerland
Abstract
A numerical simulation of a prechamber autoignition gas engine has been performed
based on an experimental test case. With a simplified finite-rate/eddy-dissipation
model for the combustion of natural gas, it was possible to properly reproduce the
experiment considering the combustion duration, ignition timing and overall energy
balance. However the predefined empiric constant of the eddy-dissipation model had
to be increased by a factor of 10. A modification of the original cylindrical-conical
prechamber geometry to a simpler cylindrical one was tested with the simulation
model. The influence of burnt gases inside the prechamber was assessed simulating
the mixture formation inside the prechamber. The simulations showed little effect
of taking into account the non-homogeneities in the gas phase on the combustion
duration. The simulation showed that the new and cylindrical geometry envisaged
did not show any improvement in the combustion homogeneity inside the precham-
ber and its volume (limited by the real engine geometry) is in fact not sufficient to
properly ignite the main chamber. The model can be used to further guide design
modifications of the prechamber engine to improve performance.
Preprint submitted to Elsevier 2 October 2008
Manuscript
Page 4
Key words: autoignition, prechamber, cogeneration, computational fluid dynamics
PACS: 07.20 Pe
1 Introduction
A prechamber autoignition concept for stationary cogeneration engines is cur-
rently being developed at the Industrial Energy Systems Laboratory (LENI).
To better understand and guide the experimental work, a numerical simula-
tion of the experimental set-up has been performed. Autoignition in an engine
being strongly dependent on local conditions, direct coupling between compu-
tational fluid dynamics and chemistry was applied to have a high resolution
of the computational domain. The engine concept under development is based
on former work on unscavanged prechamber ignition with spark plugs where
fluid dynamics simulations were successfully used to optimise the precham-
ber shape. The efficiency of the engine concept to reduce emissions below
the Swiss emission limits for stationary for both natural gas and biogas was
demonstrated [1–3]. The new engine concept is based on autoignition of the
gas mixture inside a heated unscavanged prechamber. Through the tempera-
ture control of a limited volume (prechamber) the concept can be considered
to be similar as, but easier to control than homogeneous charge compression
ignition (HCCI), an engine concept with very low NOx emissions. The poten-
tial of this new prechamber autoignition concept has been demonstrated by
experimental studies [4].
∗ Corresponding author.
Email address: [email protected] (D. Favrat).
2
Page 5
Numerical studies with varying levels of detail have been extensively used to
study HCCI combustion. Aceves et al. [5] have validated a multi-zone model on
an HCCI engine operating with propane. Heat release rate, HC and CO emis-
sions as well as pressure traces were predicted with good agreement. Kong [6]
studied natural gas/DME HCCI combustion using CFD with detailed chem-
istry. Combustion and operation limits of the engine as well as the influence of
the fuel composition were well reproduced by the simulations. Zheng et al. [7]
simulated a prechamber autoignition engine with direct injection of natural
gas using the GRI3.0 reaction mechanism [8]. The engine concept studied in
this paper is different from their concept in the fact that air and fuel are mixed
prior to admission in the engine and no pilot injection into the prechamber
is used. Ignition is triggered inside the prechamber by means of a resistive
heating of the prechamber walls. As a numerical study using detailed chem-
istry proved difficulties in convergence and was very intensive in calculation
time [9], a simplified combustion model implemented in the commercial code
Fluent is used in this work. The mixture formation as well as changes in the
prechamber geometry are investigated.
2 Simulation
To simplify simulations, the valves are not represented and a closed system is
modelled. During the experiment, the inlet valve is closed at 130 ◦CA before
top dead centre (BTDC) only, but in order to account for the gas motion due
to the piston movement, simulations are started at bottom dead centre (BDC).
The geometry is reduced to one quarter of the cylinder given the periodicity
imposed by the four nozzle orifices of the prechamber. The mesh is made up
3
Page 6
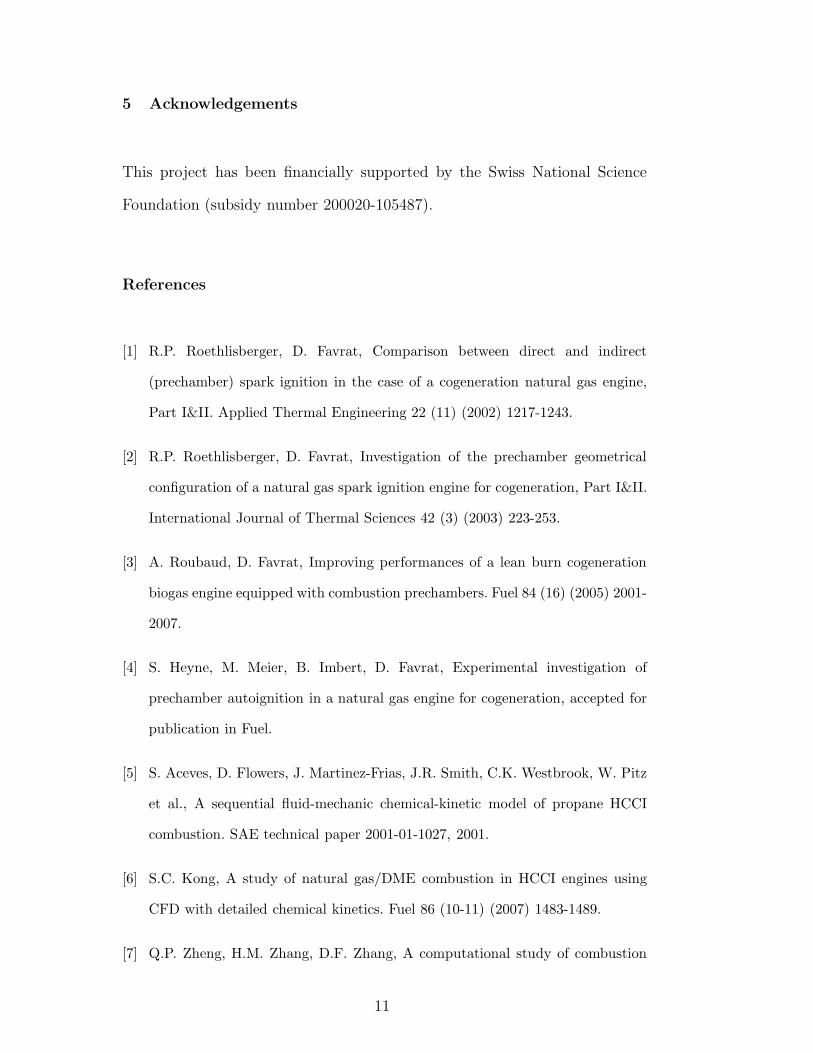
of hexahedral cells. The piston movement is controlled by a slider-crank shaft
law and the mesh is updated using the Layering method, adding or deleting
mesh layers from a surface of the dead volume. The mesh size decreases from
400 000 to 200 000 during compression and increases up to 480 000 during
expansion as illustrated in Fig. 1. The simulations presented in this paper
represent five different cases (1). Two different prechamber geometries were
investigated: the original cylindrical-conical prechamber shape (geometry 1)
used during the experiments and a simpler cylindrical one (geometry 2). The
two shapes are illustrated in Fig. 2. There is no notable difference in the
mesh for the two prechamber geometries simulated. In a previous study it has
been shown that the temperature distribution in the original prechamber is
too stratified to obtain a homogeneous ignition [9]. Therefore a new geometry,
constrained by the real engine cylinder head geometry was tested. The volume
of geometry 2 is 490 mm3 compared to 1630mm3 for geometry 1. The engine
dimensions and simulated experimental conditions are given in Table 1. For
further information the reader is referred to [4].
In order to investigate the mixture formation for both geometries, non-reactive
simulations have been run, assuming burnt gases inside the prechamber and
a mixture of fresh gases and burnt gases in the main chamber. Subsequent,
reactive calculations for both geometries, assuming a homogeneous gas phase,
have been run for both geometries, and one simulation taking into account
combustion and mixture formation for the original prechamber geometry. In
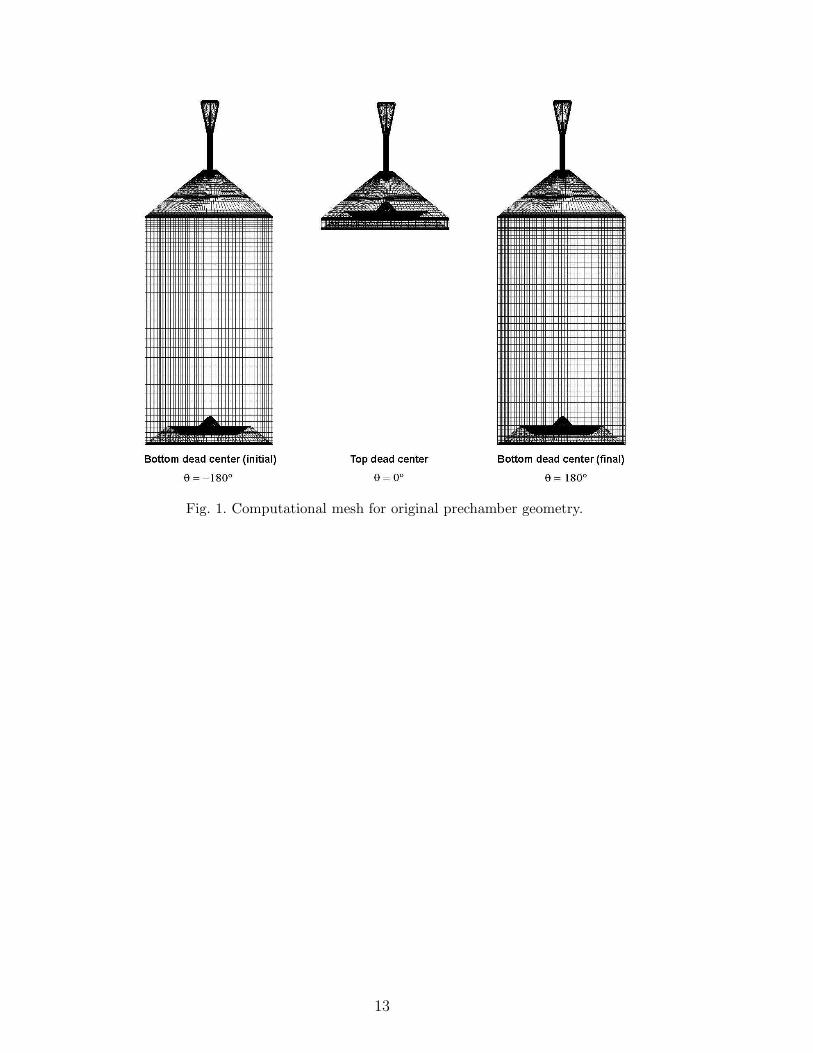
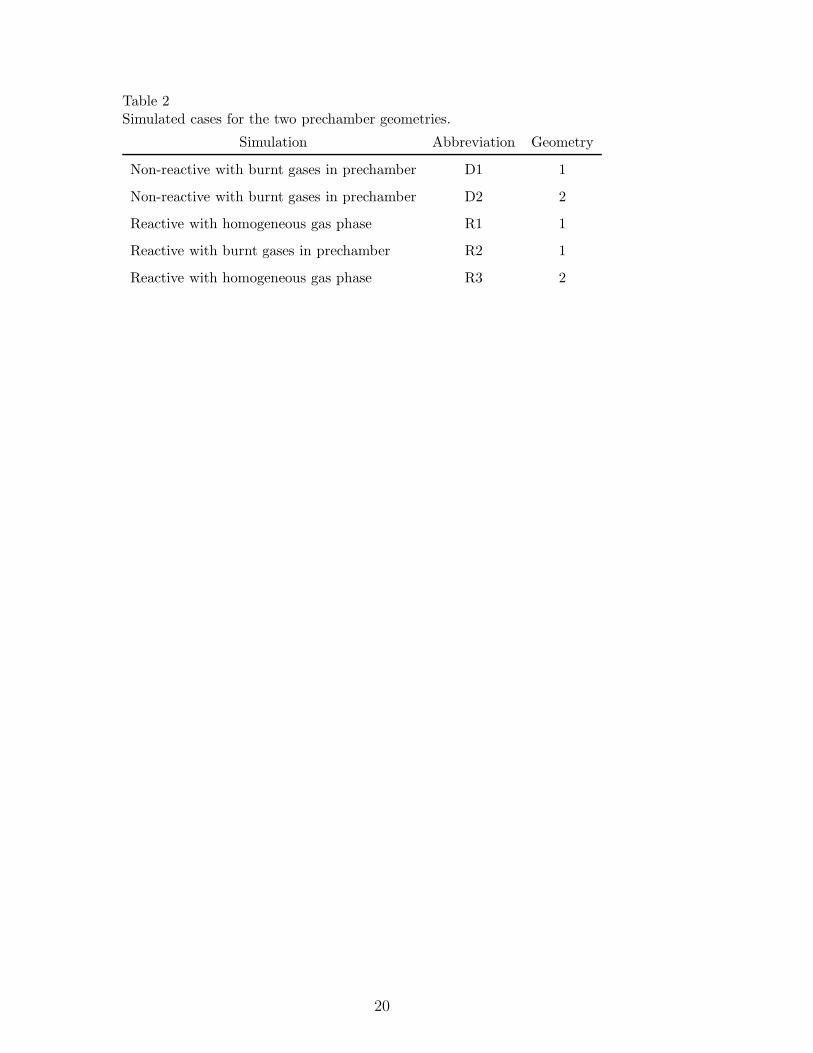
the following, the simulations will be referred to as indicated in Table 2.
The chemistry is represented by a global reaction model for natural gas repre-
sented by methane, ethane and propane. The composition of the gas is known
from the experiments and higher hydrocarbons have been neglected. It has
4
Page 7
been shown that a good representation of natural gas combustion is feasible
with this simplification [10]. To model combustion chemistry, the Fluent model
finite-rate/eddy-dissipation is used. The reaction rate is both calculated based
on an finite-rate Arrhenius model (FR) and an eddy-dissipation model (ED)
developed by Magnussen and Hjertager [11], the smaller of both values being
kept. The reaction rate of the species i is Ri =∑
r min(
RFRi,r , RED
i,r
)
where:
RFRi,r = Mi
(
ν′′
i,r − ν′
i,r
)
∏
j
[Cj,r]
(
η′
j,r+η
′′
j,r
)
ArTβre−
Ea,r
RT (1)
REDi,r = ν
′
i,rMiAρǫ
kmin
(
minR
(
YR
ν′
R,rMR
)
, B
∑
P YP∑N
j ν′′
j,rMj
)
(2)
with Mi the molar mass of species i, ν′
i,r and ν′′
i,r the stoichiometric coefficient
for the reactant respectively product i for reaction r, Cj the molar concen-
tration of species j in reaction r, η′
j,r and η′′
j,r the rate exponents for reaction
respectively product species j in reaction r, Ar the pre-exponential factor for
reaction r, β the temperature exponent, Ea the activation energy and R the
universal gas constant. For the eddy dissipation model, A and B denote em-
piric constants, YP the mass fraction of any product species P , YR that of a
particular reactant R. ǫ represents the turbulent dissipation rate and k the
kinetic energy. Due to the relatively low temperature before ignition, it is the
Arrhenius law that controls chemistry and determines autoignition whereas
the EDC controls the flame speed during combustion. The empirical constant
A of the EDC is generally set to a numeric value of 4 ([11]). Based on the
combustion duration of the experiment this value was adjusted and increased
by a factor of 10. This adaption is consistent with other work where the value
of both A and B have been increased by a factor of 8 for simulating turbulent
premixed flames [11]. The kǫ-Realizable model and standard wall functions
5
Page 8
are used to model turbulence. Thermal effects in the diffusion equation are
neglected. The Fluent database values are used for parameters of Arrhenius
laws and polynomial interpolations of heat capacities.
The boundary conditions to be specified are the wall temperature for both
prechamber and main chamber. The prechamber temperature is measured by
a thermocouple during the experiments. For the main chamber, based on a
heat balance taking into account the cooling circuit, the mean temperature of
the cylinder gases and the heat transfert coefficients and a mean wall tempera-
ture. The latter had been evaluated during a former work [9]. Initial conditions
include mixture composition, pressure, temperature and level of turbulence.
Two different cases simulated have to be considered here. Simulations with ho-
mogeneous composition all over the gas phase (simulations R1 and R3) simply
use the mixture composition calculated based on the relative air-to-fuel ratio
λ = 1.31 from the experiments and the burnt gases left in the dead volume.
When taking into account the mixture formation inside the prechamber (sim-
ulations D1,D2 and R2), it is assumed that the gases inside the prechamber
are initially composed of burnt gases only. For the main chamber the same
mixing rule as for the homogeneous cases applies. The initial pressure for the
simulations could not be based on the measured value as the signal is very
noisy at BDC due to the valve motion and the induced pressure fluctuations.
In addition, it has to be accounted for the fact, that during the experiment
the valves are only closing at 130◦CA BTDC. Therefore, this value is calcu-
lated for an adiabatic compression in order to obtain the experimental value
of maximum pressure for a motored cycle without combustion, assuming that
the pressure at BDC is not very dependant on the intake gas composition.
Once composition, pressure and trapped mass are known, the temperature
6
Page 9
is obtained by the ideal gas law. For simulations D1, D2 and R2, the tem-
perature of the gases inside the prechamber is assumed to be equal to the
experimentally measured exhaust gas temperature. The level of initial turbu-
lence is based on literature and preliminary simulations. A summary of the
boundary and initial conditions for the different simulations is given in Table
3.
3 Results
The investigation of mixture formation for the two geometries showed that the
original prechamber shape results in a very homogeneous distribution consid-
ering the relative air-to-fuel ratio λ. Fig. 3 shows the range of λ at 27◦CA
BTDC in a cut plane of the prechamber and illustrates well that the maximal
value of λ for geometry 1 is about 1.6 in the top centre region of the precham-
ber. For geometry 2 little mixing of the burnt gases and the fresh gases occurs
and the burnt gases are actually only compressed at the top of the prechamber.
The λ value exceeds 2 in the top of the prechamber. The relative air-to-fuel
ratio being an important parameter for ignition timing, the original geometry
seems more favourable for homogeneous ignition. The main reason for the bad
mixing for geometry 2 is the fact that the swirl motion - induced by the holes
connecting prechamber and main chamber which are inclined by 10◦ in the
radial direction - dies out due to the constant small prechamber diameter. For
the original prechamber shape it is mainly this swirl that renders the mixture
more homogeneous. In addition, a stronger effect of recirculation for geometry
1 enhances the mixing.
The reactive calculations all showed good agreement with the experimental
7
Page 10
ignition timing and combustion duration. Table 4 illustrates that the moment
of 5% heat release θ5% coincides acceptably well with the experimental data
for the two simulations R1 and R2. Simulation R2, taking into account the
mixture formation in the prechamber shows a particularly good agreement.
The same applies for the combustion duration. Simulation R3 results in an
earlier ignition and a longer combustion duration. The parameter ∆ignition in
Table 4 represents the delay between the complete ignition of the prechamber,
indicated by a small pressure peak, and the moment of 5% heat release in the
main chamber. It can be interpreted as a measure of the capability of the
prechamber to ignite the main chamber. It can be seen that for geometry 2,
the value is more than 3 times higher compared to geometry 1. This indicates
that the volume of geometry 2 is not sufficient to rapidly ignite the main
chamber.
The fact that the volume of the new prechamber geometry is not sufficient to
properly ignite the main chamber can also be observed in Fig. 4, illustrating
the flame front at 5% heat release for each simulation. For simulation R3
it shows that the jets issuing from the prechamber are not penetrating deep
enough into the main chamber to properly ignite the mixture. The combustion
in the main chamber in consequence is rather controlled by the heating due to
compression than by the prechamber jets. Comparing simulations R1 and R2
it can be observed that for the homogenous gas phase simulation R1, the jets
are penetrating deeper into the main chamber. This results in consequence in
a slightly shorter combustion duration. Due to the higher fuel concentration
inside the prechamber, the energy release is higher and the velocity of the
gases leaving the prechamber is more elevated compared to simulation R2.
The differences in the overall combustion duration ∆combustion are negligible
8
Page 11
between the two simulations. It has to be mentioned that for all simulations - as
for the experiment - the ignition timing is very early. This could be influenced
by reducing the prechamber wall temperature in order to shift ignition closer
to TDC.
A comparison of the pressure traces for simulations R1 and R2 with the mea-
sured pressure trace illustrated in Fig. 5 shows that the peak pressure is over
predicted by both simulations. Simulation R2 results in a lower peak pressure
indicating the necessity of taking into account the mixture inhomogeneities
for the simulations. The over prediction of the pressure in the simulations re-
sides in the fact that pressure losses due to crevice flow are not modelled. In
addition the combustion is complete for both simulations whereas during the
experiment a non-negligible amount of unburned hydrocarbons is measured.
A comparison of the experimental case and simulation R2 considering the en-
ergy balance is illustrated in Table 5. As only the compression and combustion
phase are modelled, it is not possible to detail the heat flux Qtotal and the en-
ergy flux leaving with the exhaust gases Eexhaust for the simulation. The sum of
both results from the calculation of the overall energy balance. It can be seen
that for both the experiment and simulation, the order of magnitude given in
literature [12] are attained. This holds except for the high value of unburned
hydrocarbons measured in the experiments. An engine geometry specifically
designed for the prechamber concept would be necessary to reduce this value.
Based on the simulations, an instantaneous energy balance was established as
shown in Fig. 6. The very low imbalance in the overall energy balance shows
that the simulation is well in accordance with the real case. Small deviations
are noted during the combustion process that can be attributed to numerical
instabilities. Both the overall and instantaneous energy balance can be used
9
Page 12
to further validate the model based on experimental measurements.
4 Conclusions
A numerical model for the simulation of a compression and combustion cycle
for a prechamber autoignition has been developed. With a finite-rate/eddy-
dissipation model it was possible to well represent an experimental test case.
Scaling of the empiric constant A of the eddy-dissipation model by a factor
of 10 was however necessary. Two different prechamber geometries have been
tested to assess their respective combustion performance. The small cylindri-
cal prechamber has shown to be too small to properly ignite the main cham-
ber. The mixture formation in the cylindrical-conical prechamber geometry
is more favourable for a homogeneous ignition. The combustion timing and
duration are well represented in the simulations. An overall energy balance
of the simulation is in good agreement with the experimental case. The com-
bustion was complete for the simulations, thus under predicting the unburned
hydrocarbon emissions. The numerical model can be used to guide future de-
sign modifications of the prechamber engine. Further work might be carried
out on validating the scaled model with further experimental data. A full en-
gine cycle simulation would be necessary to completely compare the energy
balances. The model could be used to investigate the influence of cycle-by-
cycle fluctuations on the combustion timing that were observed during the
experiments.
10
Page 13
5 Acknowledgements
This project has been financially supported by the Swiss National Science
Foundation (subsidy number 200020-105487).
References
[1] R.P. Roethlisberger, D. Favrat, Comparison between direct and indirect
(prechamber) spark ignition in the case of a cogeneration natural gas engine,
Part I&II. Applied Thermal Engineering 22 (11) (2002) 1217-1243.
[2] R.P. Roethlisberger, D. Favrat, Investigation of the prechamber geometrical
configuration of a natural gas spark ignition engine for cogeneration, Part I&II.
International Journal of Thermal Sciences 42 (3) (2003) 223-253.
[3] A. Roubaud, D. Favrat, Improving performances of a lean burn cogeneration
biogas engine equipped with combustion prechambers. Fuel 84 (16) (2005) 2001-
2007.
[4] S. Heyne, M. Meier, B. Imbert, D. Favrat, Experimental investigation of
prechamber autoignition in a natural gas engine for cogeneration, accepted for
publication in Fuel.
[5] S. Aceves, D. Flowers, J. Martinez-Frias, J.R. Smith, C.K. Westbrook, W. Pitz
et al., A sequential fluid-mechanic chemical-kinetic model of propane HCCI
combustion. SAE technical paper 2001-01-1027, 2001.
[6] S.C. Kong, A study of natural gas/DME combustion in HCCI engines using
CFD with detailed chemical kinetics. Fuel 86 (10-11) (2007) 1483-1489.
[7] Q.P. Zheng, H.M. Zhang, D.F. Zhang, A computational study of combustion
11
Page 14
in compression ignition natural gas engine with separated chamber. Fuel 84
(12-13) (2005) 1515-1523.
[8] G.P. Smith, D.M. Golden, M. Frenklach, N.W. Moriarty, B. Eiteneer, M.
Goldenberg et al., GRI Mech 3.0.
http://www.me.berkeley.edu/gri\_mech/releases.html; 2002.
[9] D. Wunsch, S. Heyne, J.B. Vos, D. Favrat, Numerical flow simulation of a
natural gas engine equipped with an unscavanged auto-ignition prechamber.
Proceeding from the 3rd European Combustion Meeting, 2007.
[10] A. Turbiez, A. El Bakali, J.F. Pauwels, A. Rida, P. Meunier, Experimental
study of a low pressure stoichiometric premixed methane, methane/ethane,
methane/ethane/propane and synthetic natural gas flames. Fuel 83 (7-8) (2004)
933-941.
[11] B. Magnussen, H. Hjertager, On mathematical modeling of turbulent
combustion with special emphasis on soot formation and combustion.
Proceedings of the Combustion Insitute (1976) 719-29.
[12] J.B. Heywood. Internal combustion engine fundamentals. McGraw-Hill
International Editions, Automotive Technology Series, 1988.
12
Page 15
Fig. 1. Computational mesh for original prechamber geometry.
13
Page 16
Fig. 2. Original prechamber(geometry 1) and cylindrical prechamber (geometry 2)shape.
14
Page 17
Fig. 3. Lambda distribution for both prechamber geometries. Simulations D1 andD2.
15
Page 18
Fig. 4. Flame front at 5% heat release for simulations R1,R2 and R3. Iso-surfacesfor 95% of initial CH4 concentration (red) and 10% of initial CH4 concentration(blue).
16
Page 19
Fig. 5. Pressure curve for simulations R1 and R2 in comparison to the experimentalpressure curve.
17
Page 20
Fig. 6. Instantaneous energy balance for simulation R2.
18
Page 21
Table 1Engine dimensions and simulated experimental conditions.
Bore [mm] 95.25
Stroke [mm] 114.3
Piston rod length [mm] 222.25
Compression ratio ǫ 13
RPM [min−1] 1500
Relative air-to-fuel ratio λ 1.3
Natural gas composition CH4/C2H6/C3H8/CO2/N2
(mole-%) 90.3/5.2/1.1/1.1/2.3
19
Page 22
Table 2Simulated cases for the two prechamber geometries.
Simulation Abbreviation Geometry
Non-reactive with burnt gases in prechamber D1 1
Non-reactive with burnt gases in prechamber D2 2
Reactive with homogeneous gas phase R1 1
Reactive with burnt gases in prechamber R2 1
Reactive with homogeneous gas phase R3 2
20
Page 23
Table 3Boundary and initial conditions for the simulations (in parenthesis: prechamber gasphase composition and temperature for simulations D1,D2 and R2). Based on theexperimental test case (engine speed 1500 min−1, relative air-to-fuel ratio λ = 1.3,compression ratio CR=13.
Boundary conditions
Main chamber wall temperature (K) 376
Prechamber wall temperature (K) 793.2
Initial conditions
Mass fraction (%)
CH4 3.537 (0)
C2H6 0.320 (0)
C3H8 0.100 (0)
CO2 1.018 (11.96)
H2O 0.725 (9.41)
O2 20.93 (5.626)
N2 73.37 (73.37)
Pressure (bar) 0.86
Temperature (K) 353.4 (718)
Turbulent kinetic energy (m2/s2) 5
Turbulent dissipation rate (m2/m3) 1000
21
Page 24
Table 4Ignition and combustion timing for the experiment and the different simulations.
θ5% θ90% ∆combustion ∆ignition
Experiment -18◦ -2◦ 16◦ -
Simulation R1 (Geometry 1) -20.7◦ -2.9◦ 17.8◦ 4.3◦
Simulation R2 (Geometry 1) -17.5◦ 0.6◦ 18.1◦ 5.1◦
Simulation R3 (Geometry 2) -14.2◦ 9.3◦ 23.5◦ 16.3◦
22
Page 25
Table 5Overall energy balance. Experimental and simulated values. Orders of magnitudeindicated in literature[12].
Etotal Pbrake Qtotal Eexhaust Eunburnt
Experiment (W) 17890 5814 6368 4586 1122
% Etotal 100 32.5 35.6 25.6 6.3
Simulation R2 (W) 17890 7636 10254 ≈ 0
% Etotal 100 42.7 53.3 ≈ 0
Literature values (%) 100 25-38 18-41 22-45 1-5
23