33
Elsevier required licence: © <2017>. This manuscript version is made available under the CC‐BY‐NC‐ND 4.0 license http://creativecommons.org/licenses/by‐nc‐nd/4.0/

Elsevier required licence: © <2017>. This manuscript version is made available under the
CC‐BY‐NC‐ND 4.0 license http://creativecommons.org/licenses/by‐nc‐nd/4.0/

1
Biodecolorization of textile azo dye using Bacillus sp. strain CH12 isolated from alkaline lake 1
Awoke Guadiea,d, Samson Tizazua, Meseretu Meleseb, Wenshan Guoc, Huu Hao Ngoc, Siqing 2
Xiad,* 3
aCollege of Natural Sciences, Arba Minch University, Arba Minch, Ethiopia 4
bBiological and Cultural Diversity Research Center, Arba Minch, Ethiopia 5
cCentre for Technology in Water and Wastewater, School of Civil and Environmental 6
Engineering, University of Technology Sydney, Sydney, NWS 2007, Australia 7
dState Key Laboratory of Pollution Control and Resource Reuse, College of Environmental 8
Science and Engineering, Tongji University, Shanghai, China 9
10
Abstract 11
Textile azo dye decolorizing bacteria were isolated from alkaline Lakes Abaya and Chamo using 12
Reactive Red 239 (RR239) dye. Through subsequent screening process, strain CH12 was selected 13
to investigate the effects of nutrient supplement, DO, pH, temperature, dye concentration and types 14
on decolorization. Based on 16S rRNA gene sequence analysis, strain CH12 was identified as 15
Bacillus sp. Decolorization efficiencies were significantly enhanced with carbon (≥98%) and 16
organic nitrogen (~100%) supplements. Complete decolorization was also observed under anoxic 17
and anaerobic conditions, and at the temperature of 30ºC and the pH of 10. However, the azo dye 18
decolorization efficiency of strain CH12 was significantly reduced when NaNO3 (1 8%) was 19
supplemented or under aerobic culturing condition ( 6%), indicating that RR239 was less 20
preferred electron acceptor. Overall, strain CH12 can be a promising candidate for decolorization 21
applications due to its potential to effectively decolorize higher RR239 concentrations (50 250 22
mg/L) and six additional dyes. 23
24
Keywords 25
Alkaline lake; Bacillus sp; Biodecolorization; Strain CH12; Reactive Red 329 26
27
*Corresponding author. P.O. Box 200092, Shanghai, China. Tel.: +86 21 65980440 28
E-mail address: [email protected] 29
30
31

2
1. Introduction 32
Discharge of wastewater from textile, paper, leather, food, plastic and cosmetic industries causes 33
serious environmental pollution [1, 2]. In textile industry, the main environmental concern is 34
colored water originated from dyeing process. Currently, there are more than 100,000 different 35
commercially available dyes at market [3], and their annual production capacity has been 36
estimated to be over 7 105 tones [4]. They are chemically diverse in nature and can be divided into 37
azo, reactive, triphenylmethane, heterocyclic and polymeric dyes [5]. Azo dyes are one of the most 38
widely used dyes and can account for 70% of the total dye production [1]. They have one or more 39
azo groups (R1–N=N–R2) and aromatic rings mostly substituted by sulfonate groups [1, 5, 6]. 40
41
Since dyes are designed to be chemically and photolytically stable, they are highly persistent in 42
natural environments [1, 7, 8]. During dyeing process, approximately 10–15% of the dye is 43
released into wastewater stream and can cause serious environmental and health hazards [9]. 44
Disposal of dye containing wastewater into aquatic ecosystem reduces photosynthetic activities by 45
impeding the light penetration into deeper layers [1, 3, 10], which leads to the depletion of 46
dissolved oxygen (DO) and the loss of biodiversity in the aquatic environment [4]. There are also 47
considerable evidences that certain anaerobic metabolites of dyes are toxic, carcinogenic and 48
mutagenic agents to microorganisms, aquatic life and human beings [2]. These highlight the need 49
of treating textile dye containing effluent before discharging it into water bodies. The removal of 50
color from wastewaters is often more problematic than the removal of the soluble colorless organic 51
substances [5]. 52
53
A wide range of biological, chemical and physical methods have been used to treat textile dye 54
effluents [1, 11]. Although the physical and chemical methods are technically feasible for 55
treatment of color wastewater, they have inherent drawbacks such as high operative cost, 56
formation of hazardous byproducts and intensive energy consumption [9, 10, 12]. As a viable 57
alternative, biological treatment methods using aerobic and anaerobic microorganisms [6, 11] have 58
received increasing interest owing to their high effectiveness, lower sludge production and 59
ecofriendly nature [4]. It has been reported that many microorganisms, such as fungi [7], algae [10] 60
and bacteria [3, 5, 13] can be used for the decolorization of dye wastewater. Bhatt et al. [15] 61

3
mentioned that isolation of such microorganisms has greatly contribute to dye removal in both 62
developed and developing countries. 63
64
Several studies have isolated and characterized dye decolorizing bacteria from textile effluent 65
discharging sites [3, 9, 13-17]. For instance, Arora et al. [9] and Asad et al. [3] isolated effluent 66
adapted microorganisms (Bacillus firmus and Halomonas sp., respectively) that had the potential 67
of reducing textile azo dyes. Other dye decolorizing bacteria, such as Pseudomonas aeruginosa 68
[15] and Comamonas sp. UVS [13] were also isolated from waste contaminated sites. However, 69
only a few works were devoted to isolate and characterize microorganisms from dye-70
uncontaminated environment for treating textile dye contain contained effluents [18-20]. 71
72
Given the characteristics of textile wastewater, the present study hypothesized that dye degrading 73
organisms might be isolated from alkaline lake environment. Since textile industries use different 74
salt and sodium hydroxide in wet processing steps for dye fixation, the effluents are characterized 75
by high salinity and alkalin alkalinity (pH 11.0 11.5) [21]. Hence, the bioremediation in such 76
environment requires the presence of alkaliphilic and halophilic microorganisms, which are able to 77
adapt and physiologically function under such harsh conditions. Soda lakes represent a stable 78
alkaline environment with diverse microorganisms, which may have a potential for 79
biotechnological applications [22, 23]. Generally, alkaliphilic microorganisms have an optimal 80
growth pH around 10. Thus, they are mainly found in extremely alkaline environment, such as 81
Western Soda Lakes in the United States and the Rift Valley Lakes in East Africa [23]. 82
83
In this study, dye degrading microorganisms were isolated from two East African Rift Valley 84
Lakes Abaya and Chamo in Ethiopia, which were not contaminated by any industrial waste. No 85
research has been conducted to investigate the potential of microorganisms from these lakes to 86
treat industrial wastewater. Samples enriched in Reactive Red 239 (RR 239) dye containing 87
mineral salt media (MSM) were used to isolate morphologically distinct colonies. The effects of 88
nutrient supplement, culturing conditions, pH, temperature, dye concentrations and types of dye on 89
decolorization were evaluated using the best isolate. 90
91

4
2. Materials and methods 92
2.1. Experimental setup 93
Batch experiment of dye decolorization was conducted in 1000 mL capacity reactor (Fig. 1). The 94
reactor was sealed to ensure an anoxic condition. It had a tightened lid with two holes for gas 95
removal and sampling. Gas products (particularly carbon dioxide that contributes to pH drop) from 96
the reactor were removed using potassium hydroxide (KOH) solution. A sampling tube was 97
inserted deep into the reactor at one side and attached to a sterile syringe on the other side. When 98
the sample was drawn with a sterile syringe, the opening and closing of the tube was regulated 99
with a control valve. Since the system was designed to be anoxic, the valve was immediately 100
closed after sampling to prevent the flow of gas into the reactor. 101
Fig. 1 102
103
2.2. Source of microbial culture 104
Alkaline sediment samples were collected from the Ethiopian Rift Valley Lakes of Abaya and 105
Chamo. The rationale of using these alkaline lake inocula is that the alkaliphilic microorganisms in 106
these lakes may be able to adapt to the alkaline environment of dye contaminated wastewater and 107
contribute to decolorization. The triplicate average pH values of Abaya and Chamo were 8.5±0.4 108
and 9.1±0.2, respectively. Detailed physico-chemical characteristics of the lakes are given in Table 109
1. 110
Table 1 111
112
2.3. Media composition 113
Mineral salt media used by Arora et al. [9] was modified by adjusting the pH to alkaline range. 114
The composition includes (g/L): Na2HPO4 (3.6), KH2PO4 (1.0), (NH4)2SO4 (1.0), MgSO4 (1.0), 115
CaCl2 (0.10), FeC6H5O7 (0.01) and 10 mL/L of trace element solution. The trace element solution 116
has the following composition (mg/L): H3BO3 (30.0), ZnSO4.7H2O (10.0), Na2MoO4.2H2O (3.0), 117
MnCl2.4H2O (3.0), NiCl2.6H2O (2.0), CoCl2.6H2O (1.0), and CuCl2.2H2O (1.0). Stock solutions of 118
glucose (50%, w/v) and yeast extract (10%, w/v) were sterilized separately and added to the media 119
to maintain final concentrations of 0.5% (w/v) and 0.01% (w/v), respectively. During MSM-agar 120

5
plate preparation, 2% (w/v) agar was added to the media. An alkaline pH of the media was 121
maintained by using separately sterilized Na2CO3 (25%, w/v). 122
123
2.4. Dyes 124
All dyes used in this study were pure reactive dyes, and were generously donated by Ayka Addis and 125
Adei Abeba textile factory in Ethiopia. Reactive Red 239, a commonly used commercial reactive 126
dye, was chosen for acclimatization, screening and decolorization experiments. In addition, other 127
reactive dyes with different chemical structures, including Reactive Red 120, Reactive Red 141, 128
Reactive Yellow 84, Reactive Yellow 160, Reactive Blue 198 and Reactive Blue 19 were used to 129
investigate the decolorizing ability of the best isolate obtained from RR 239 experiment. All dyes 130
used in this study contain halogen (chlorine/fluorine) and sodium sulfonate (SO3Na) groups in their 131
molecular formula. The detailed descriptions of the dyes are given in Table 2. 132
Table 2 133
134
2.5. Enrichment, isolation and screening of dye degrading microorganisms 135
Alkaline sediment samples collected aseptically from Lakes Abaya and Chamo were enriched in 136
azo dye containing MSM. Sterilized MSM containing 10 mg/L RR 239 was inoculated with 137
sediment samples (10%, w/v) and incubated at ambient temperature under anoxic condition. Ten 138
percent of samples were further transferred to fresh dye containing media within a week when 139
constant decolorization was achieved. After each transfer, the enriched samples were serially 140
diluted (10-1 10-7) and plated on MSM agar containing 10 mg/L of RR 239 and then incubated 141
under anoxic condition at ambient temperature. Finally, 135 morphologically different colonies 142
were isolated and further purified via spread plate method. The colonies were stored at 4 °C for 143
immediate use. The samples were also stored at 70°C using 15% glycerol. 144
145
Each pure isolate was tested for color removal in liquid MSM containing RR 239. A loop full of 146
cell culture from each slant were taken and allowed to growing aerobically in 250 mL capacity of 147
Erlenmeyer flask containing sterilized liquid MSM (100 mL) without dye. The flasks were 148
incubated on shaker at 120 revolution per minute (rpm) at ambient temperature for 4 5 days. 149
Then, the aerobically grown cells (10%, v/v) were cultured in the batch reactor containing liquid 150

6
MSM and 10 mg/L of RR 239. The preparation were incubated at ambient temperature under 151
anoxic condition. Decoloriation activities were monitored visually and using UV-visible 152
spectrophotometer (UV/VIS spectrophotometer RS-295 model, India). 153
154
For further screening, seven isolates that could completely decolorize 10 mg/L of RR 239 in liquid 155
MSM within 24 h were grown aerobically and then portion of these cultures (10%, v/v) were 156
allowed to growing under anoxic condition in MSM containing more higher concentration of RR 157
239 (50 200 mg/L) to select the most effective decolorizer. 158
159
2.6. Identification of the best isolate 160
Morphological, physiological, biochemical and molecular characterizations were conducted to 161
identify the best isolate. Genomic DNA was extracted using a freeze-thaw method modified by 162
Moore and his colleagues [24]. 16S rDNA was amplified using polymerase chain reaction (PCR) 163
with universal eubacteria specific primers of A8f (5’-CTGAGCCAGGATCAACTCT-3’) and 164
H1542r (5’-TGCGGCTGGATCACCTCCTT-3’) [25]. 165
166
Fifty-microliter reaction mixtures were prepared by mixing 2 μL template DNA (5–10 ng), 25 μL 167
Taq PCR Master Mix (Invitrogen®), 2 μL (10 μM) of each primer, 2 μL bovine serum albumins (0.8 168
μg μL-1 final concentrations) and 17 μL of distilled water. PCR amplifications was carried out using 169
a Thermal Cycler (Techne TC-412, Barloworld Scientific, UK) at 95oC for 5 min initial denaturation 170
followed by 30 cycles of denaturation at 94oC for 30 s, annealing at 55oC for 30 s and extension at 171
72oC for 1 min. The final elongation was held at 72oC for 7 min prior to cooling at 4oC. 172
173
The PCR products were purified using ExoSAP-IT cleanup kit (USB Corporation) according to the 174
manufacturer’s instruction. Cleaned PCR products were sequenced by BigDye® Terminator Cycle 175
Sequencing Kit (Applied Biosystems) according to the manufacture´s instruction using reverse 176
primer H1542R. 177
178
The partial 16S rRNA gene sequences were aligned using CLUSTALW program in MEGA 6 179
software [26]. Reference 16S rRNA gene sequences were retrieved from NCBI GenBank database 180

7
using BLASTn. The phylogenetic relationship of the sequences to closest matches in public database 181
was constructed using Neighbor-Joining Method [27]. The evolutionary distances were computed 182
using the Tamura-Nei method [28] and were in the units of the number of base substitutions per site. 183
The stability and reliability of the relationships of the lineages on the inferred trees was tested by 184
bootstrap analysis [29] for 1000 replicates. 185
186
2.7. Biodecolorization assay 187
In order to determine the wavelength of the maximum absorbance, 100 mg/L of RR 239 dye was 188
prepared and scanned in the range of 190 800 nm using the UV-visible spectrophotometer. Then, 189
λmax of RR 239 dye was considered at one absorbance unit. Calibration curve was also prepared 190
using concentration ranged from 1 100 mg/L of RR 239 dye. From the concentration and the 191
measured absorbance data, a calibration curve was constructed. For other six dyes tested, λmax and 192
calibration curves were constructed following the same way. 193
194
The extent of decolorization was determined by measuring the absorbance (at λmax = 541 nm) of 195
the samples at a 24 h interval (i.e. 0, 24, 48, 72 and 96 h). To ensure that all the decolorization 196
were biologically mediated, MSM containing dye without inoculum served as the control was 197
carried out in parallel. 198
199
For analysis, 10 mL of the liquid sample was aseptically collected from the reactor every 24 h and 200
centrifuged at 4000 rpm for 40 min. The centrifuged cell-free supernatant samples were measured 201
at 541 nm using the aforementioned spectrophotometer. The percentage decolorization was 202
calculated using Eq. (1): 203
Decolorization (%) = A 100 (1) 204
where, Ao = initial absorbance, At = absorbance after time t 205
206
2.8. Effects of different parameters on azo dye decolorization 207
2.8.1. Effects of different carbon and nitrogen sources on decolorization 208

8
Experiments were conducted using different carbon sources such as: glucose, maltose, trisodium 209
citrate and starch (each with 0.5 g/L) and media without carbon source. The concentrations of RR 210
239 and inoculum were fixed at 100 mg/L and 10% (v/v) inoculum size, respectively. 211
212
To evaluate the effects of nitrogen on decolorization activity, organic and inorganic nitrogen 213
sources such as peptone, yeast extract, NaNO3, NaNO2 and (NH4)2SO4 were added to nitrogen free 214
MSM containing 100 mg/L of RR 239. The concentrations of organic and inorganic nitrogen were 215
0.01 g/L and 1 g/L, respectively. MSM without yeast and any other nitrogen sources were also 216
prepared and used as a control. The media were inoculated with 10% (v/v) culture and incubated 217
under anoxic condition at ambient temperature. 218
2.8.2. Effects of different culture conditions on decolorization 219
The effects of various culture conditions such as agitation, aeration, anoxic and anaerobic states on 220
the decolorization of RR 239 were examined. Agitation was achieved on a rotary shaker running at 221
120 rpm. Anoxic and aerobic cultures were also achieved by using full volume of the reactor and 222
continuous air supply, respectively. All experiments were conducted at ambient temperature and 223
alkaline pH with an initial dye concentration (RR 239) of 100 mg/L. The residue of RR 239 (UV-224
visible spectroscopy analysis), cell dry weight [30] and DO (Environmental multi-meter Hatch 225
model 40d, India) were monitored as a function of time. 226
227
2.8.3. Effects of pH and temperature on decolorization 228
To study the effects of pH on decolorization, a range of pH values (6 11) were evaluated. The 229
initial pH values were adjusted using NaOH and HCl. The incubation was conducted in liquid MSM 230
containing 100 mg/L of RR 239. 231
232
The decolorization of RR 239 by the best isolate was studied at different temperatures including 15, 233
20, 25, 30, 35, 40 and 45 °C. Aerobically grown culture (10%, v/v) was used to inoculate RR 239 234
dye containing (100 mg/L) MSM and incubated in adjustable incubator. The UV-visible 235
spectroscopic measurements were carried out every 24 h. 236
237
2.8.4. Effects of dye concentration and dye types on decolorization 238

9
To determine the maximum RR 239 concentration that the best isolate could tolerate and its effects 239
on decolorization, experiments with different initial dye concentrations (50, 100, 150, 200 and 250 240
mg/L) were performed in liquid MSM. 241
242
To evaluate the decolorization of the best isolate on dyes other than RR 239, the isolate was 243
exposed to Reactive Red 120, Reactive Red 141, Reactive Yellow 84, Reactive Yellow 160, 244
Reactive Blue 198 and Reactive Blue 19 each with a concentration of 100 mg/L. Each dye types 245
were prepared separately and added to MSM. Then, each preparation were inoculated with 246
aerobically grown culture of the best isolate (10%, v/v). A control group without inoculum was 247
performed for each type of dye preparations. Samples were aseptically collected every 24 h and 248
analyzed. 249
250
2.9. Statistical analysis 251
All data were presented as the mean value of three measurements ± standard error. The standard 252
error and significant level were calculated using SPSS version 20.0 software. The paired-sample t-253
test and one-way analysis of variance (ANOVA) with Tukey post hoc test were done to obtain 254
statistical significance between mean values. Pearson correlation analysis was also performed to 255
analyze the relationship between the number of isolates and the physico-chemical values of the 256
lakes. Differences were considered significant if p<0.05. 257
258
3. Results and discussion 259
3.1. Isolation and characterization of dye decolorizing bacterial isolates 260
Dye decolorization using alkaliphilic microorganisms was carried out for almost a year (from 261
November 2014 to September 2015). As shown in Fig. 2, a total of 135 morphologically distinct 262
colonies were isolated from Abaya and Chamo Lakes. Since each isolate was not selected based on 263
clear zone formation on dye containing solid media, the decolorization potential of each isolate was 264
examined in dye containing liquid MSM. The isolates which showed color removal within 14 days 265
of incubation were considered as decolorizer (103 isolates) otherwise considered as non-decolorizer 266
(32 isolates). The majority of dye decolorizers (including the best isolate) were obtained from Lake 267
Chamo (78.6%) (Fig. 2). This is most likely related to the physico-chemical characteristics of the 268

10
lake. Indeed, statistical analysis showed that the two microbial sampling sites were significantly 269
different in pH and salinity. Lake Chamo had higher pH (9.1±0.2) and salinity (1154.5±0.6 mg/L) 270
values than Lake Abaya (Table 1). The numbers of isolates were also strongly correlated with the 271
lakes’ pH and salinity. 272
Fig. 2 273
274
The color removal efficiencies of 103 decolorizers were varied significantly (5-100%), of which 39 275
isolates achieved decolorization efficiency 91% within 96 h (Supplementary data Table 1). 276
Particularly, seven isolates showed complete decolorization at 24 h, and they were further tested at 277
higher RR 239 dye concentration (50 200 mg/L). After testing, isolate CH12 (hereafter called strain 278
CH12) was found to remove 92 100% and 100% of RR 239 dye at 24 and 72 h respectively, which 279
significantly differed from the other six isolates (Supplementary data Table 2). 280
281
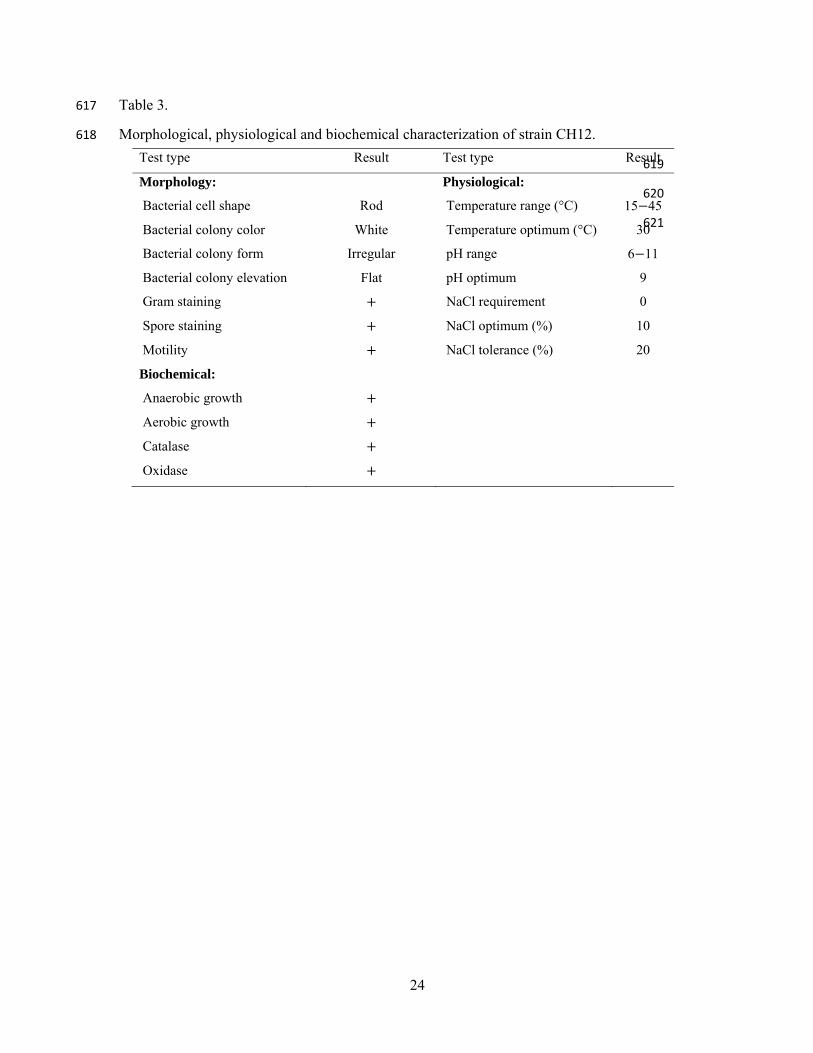
Morphological and biochemical characterizations showed that strain CH12 was found to be motile, 282
rod in shape, white in color, positive for catalase, oxidase, spore and Gram staining tests. 283
Physiologically, strain CH12 grew in a wide range of temperature (15 45°C), pH values (6 11) and 284
NaCl concentrations (0-20%), with the optimum being 30°C, 10 and 10%, respectively (Table 3). As 285
a result, strain CH12 can be categorized under genus Bacillus based on these morphological, 286
biochemical and physiological characterizations. 287
Table 3 288
289
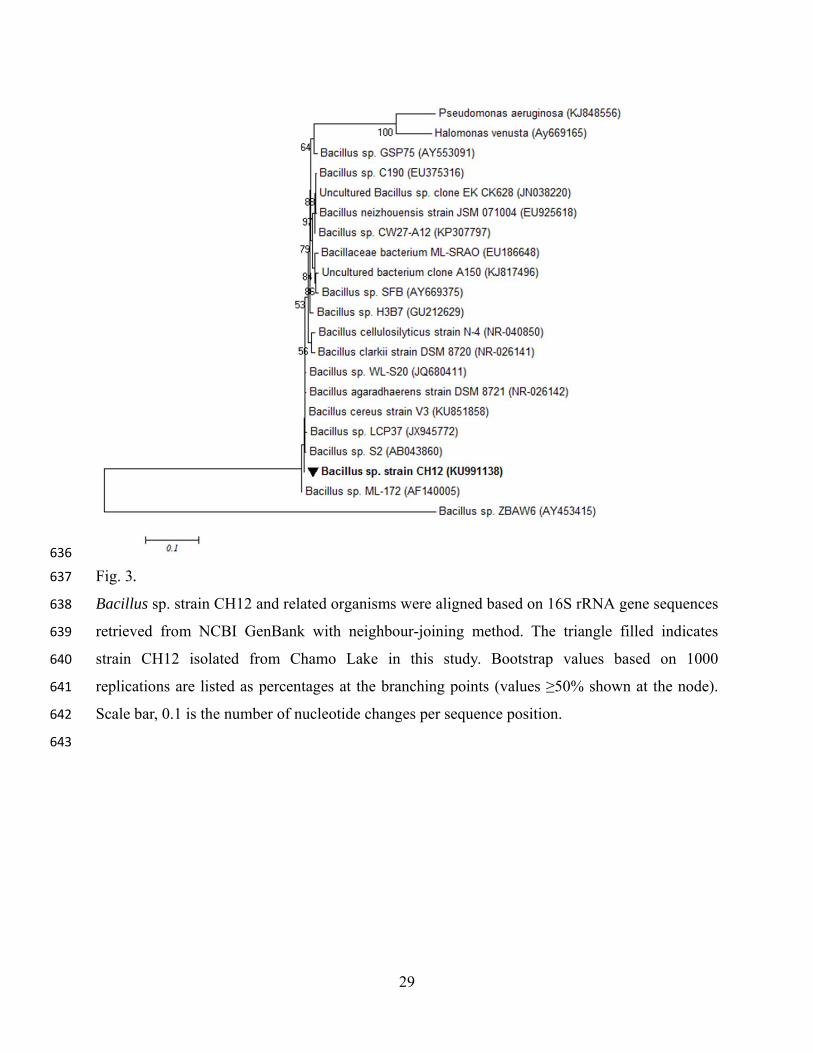
Using 16S rRNA gene sequencing, the taxonomic position of strain CH12 was also determined. 290
The phylogenetic analysis showed that strain CH12 belongs to the domain bacteria particularly to 291
the phylum Firmicutes (Fig. 3). The 16S rRNA gene sequence forms a stable clade with typical 292
strains of all genus Bacillus. The strain forms the same branch with Bacillus sp. S2, Bacillus sp. 293
LCP37, Bacillus cereus strain V3, Bacillus agaradhaerens strain DSM 8721 and Bacillus sp. WL-294
S20 with a higher 16S rRNA gene sequence similarity (99%). However, in the same phylum with 295
higher gene sequence similarity (99%), the strain forms a distinct tree branch with Bacillus sp. 296
ZBAW6. The strain also showed a distinct lineage with Halomonas venusta and Pseudomonas 297
aeruginosa from another phylum used as an outgroup. Based on 16S rRNA gene sequence 298

11
similarity, strain CH12 can be grouped in the genus Bacillus and designated as Bacillus sp. strain 299
CH12. The 16S rRNA gene sequence of Bacillus sp. strain CH12 isolated in this study was 300
deposited under GenBank with accession number KU991138. 301
Fig. 3 302
303
Bacillus strains are ubiquitous in activated sludge and have been found to degrade different dye 304
groups [1, 9, 16]. Recently, there is also an attempt to use moderately alkaliphilic Bacillus cereus 305
for textile dye treatment [31], which is the way to find better fit microbial isolate to the nature of 306
textile effluent. 307
308
In order to learn more about alkaline sample inoculum for textile dye treatment, the decolorization 309
efficiency of Bacillus sp. strain CH12 was compared with previously reported microbial isolates 310
from uncontaminated non-alkaline, uncontaminated alkaline and contaminated environmental 311
samples (Table 4). In this study, Bacillus sp. strain CH12 isolated from uncontaminated alkaline 312
Lake Chamo showed better dye removal efficiency (95 100%) than the Bacillus sp. isolated from 313
uncontaminated but non-alkaline (30 47%) environmental samples [19, 20]. However, 314
comparable dye decolorization (93 100) was observed from uncontaminated alkaline samples 315
collected in India [32] and China [18] (Table 4). Compared to effluent adapted microbial isolates 316
[3, 4, 8, 33, 34], which exhibit a wide range of decolorization efficiency (50 100%), the alkaline 317
lake strain CH12 showed comparable/higher dye removal efficiency (Table 4). This finding clearly 318
indicated that alkaliphilic microbial isolates could be a better candidate for textile dye 319
decolorization (Table 4). It has been reported that the pH tolerance of decolorizing bacteria is quite 320
important because reactive azo dyes bind to cotton fibers by addition or substitution mechanisms 321
under alkaline conditions [21]. Thus, under application condition, using alkaline lake microbial 322
isolate (i.e. Bacillus sp. strain CH12) can significantly enhance dye decolorization efficiency by 323
avoiding chemical costs used to re-adjust alkaline textile effluent to neutral pH range, because 324
most traditional textile wastewater treatment systems employ neutrophilic microorganisms that 325
work at neutral pH value. 326
Table 4 327
328

12
3.2. Effects of different parameters on azo dye decolorization 329
3.2.1. Effects of different carbon and nitrogen sources on decolorization 330
Dye decolorization efficiency by strain CH12 was significantly influenced by medium composition. 331
During the entire incubation period of strain CH12, the effect of carbon source on RR 239 332
decolorization efficiency was found in the order of glucose (95 100%) > maltose (91 100%) > 333
trisodium citrate (72 100%) > starch (69 99%) > carbon-free (27 51%) (Fig. 4a). Compared to 334
carbon-free MSM culture growth, the decolorization efficiencies were significantly enhanced using 335
different carbon sources, which elucidated the requirement of sufficient electron donors for the 336
growth and maintenance of strain CH12. Another possible explanation of the higher decolorization 337
using organic carbon source could be the nutritional contribution of the sources, which resulted in 338
fast growth of the organism. When strain CH12 actively grow, oxygen was depleted and an anoxic 339
environment was created, which might be favorable for the anaerobic reduction of the dye. In the 340
absence of additional carbon sources, dye decolorization efficiency increased from 25% at 24 h to 341
51% at 96 h, suggesting that the yeast extract might be deaminated and used as a carbon source; or 342
biologically degraded end products of RR 239 might have been used as a carbon source. In addition, 343
the ability of the strain to use starch efficiently presented a practical advantage. In most cases, textile 344
industries use starch for sizing purpose, which will be washed in the subsequent processing steps, 345
leading to excessive concentration of starch in textile effluent [16, 35]. In this case, the organisms 346
may not need any input of other additional carbon source to bring about efficient dye decolorization. 347
348
The effects of organic and inorganic nitrogen sources are shown in Fig. 4b. Compared to inorganic 349
nitrogen sources, decolorization efficiency was significantly improved for cultures supplemented 350
with organic nitrogen [peptone and yeast extract ( 90%) within 24 h]. During 24 h incubation 351
period, the cultures with NaNO3 (1%, p=0.660) and NaNO2 (2%, p=0.127) showed lower 352
percentage of decolorization than the non-nitrogen supplemented culture (14%), but the difference 353
was not statistically significant. Organic and inorganic nitrogen affected RR 239 decolorization of 354
the strain CH12 in the order of yeast extract (95 100) > peptone (90 100%) > (NH4)2SO4 355
(34 75%) > nitrogen-free (14 52%) > NaNO2 (2 25%) >NaNO3 (1 8%) (Fig. 4b). Visual 356
observation also clearly showed the effects of the different nitrogen source on RR 239 357
decolorization (Supplementary Fig. 1). The lower decolorization efficiency for the culture 358
13
supplemented with NaNO3 suggested that nitrate as an electron acceptor might be preferencially 359
consumed by strain CH12. Previous studies have also reported that NaNO3 supplemented culture 360
leads to lower decolorization efficiency [4, 11, 12]. 361
Fig. 4 362
363
3.2.2. Effects of pH and temperature on dye decolorization 364
As shown in Fig. 5a, the decolorization activity of strain CH12 was evaluated by adjusting the 365
initial pH of the MSM from 6 to 11. During the entire incubation periods, optimum decolorization 366
results (p<0.05) were obtained at pH 9 and 10 (≥95.2 2.3%, p=0.924), compared with minimum 367
values at pH 6 (41.8 4.0 62.2 0.6%, p<0.05). At pH 8 (80 93%) and pH 11 (76 91%), strain 368
CH12 exhibited almost similar decolorization efficiency (p=0.993). Strain CH12 performing 369
decolorization best at alkaline pH range has practical importance to develop industrial wastewater 370
treatment/bioprocess that have alkaline nature. Since textile industries use different salt and sodium 371
hydroxide before dyeing steps, the effluents are characterized by high salinity and alkaline medium 372
[21]. The results of this study are consistent with previous findings [4, 8]. Chen et al. [4] reported 373
that the most suitable pH for color removal was between 5.5 and 10.0 under anoxic conditions. 374
375
Temperature is also one of the most important operating parameter that can influence the growth 376
and metabolic activity of the microorganisms involved in wastewater treatment. It was reported that 377
lower and higher temperature values significantly inhibited the growth of organism and the activity 378
of the enzymes that were responsible for decolorization [4]. In this study, the effects of temperature 379
was investigated by considering a wide range of temperature values (15 45°C) and the 380
decolorization results differed significantly. Strain CH12 showed enhanced decolorization when the 381
temperature was increased from 15 to 25°C, reached the plateau between 25 and 35°C, and the 382
decolorizing activity was suppressed (50 to 33%) when the temperature further increased to 45°C 383
(Fig. 5b). This might be due to the loss of cell viability or the deactivation of the enzymes 384
responsible for decolorization [4, 8]. The optimum decolorization efficiency of the strain was found 385
at 25-35°C (94 100%, p>0.05) which favored the growth of mesophilic bacteria. Mesophilic 386
organisms are traditionally used as color wastewater treatment, because treatment at high 387
temperature is considered uneconomical. 388

14
Fig. 5 389
390
3.2.3. Effects of different culture conditions on decolorization 391
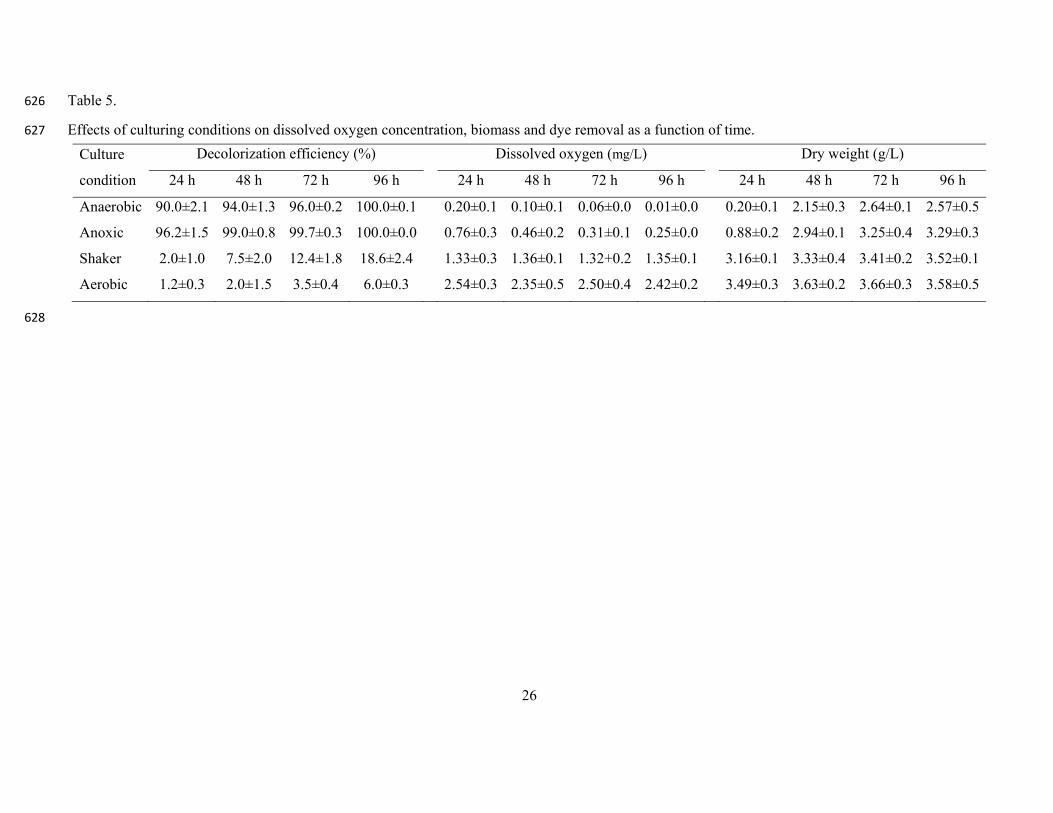
Table 5 shows the decolorization efficiency, DO and dry weight results of anaerobic, anoxic, 392
shaker and aerobic conditions. During the entire experimental period, the DO concentrations were 393
found the highest for aerobic culture (2.35±0.3 2.54±0.5 mg/L) followed by shaker 394
(1.32±0.2 1.36±0.1 mg/L). Nevertheless, the strain CH12 incubated under shaker and aerobic 395
conditions showed significantly (p<0.05) reduced decolorization efficiency (2 18.6% and 396
1.2 6.0%, respectively) compared to the anoxic and anaerobic cultures. 397
398
On the other hand, although lower DO values were recorded for anoxic (0.25±0.0 0.76±0.3 mg/L) 399
and anaerobic (0.01±0.0 0.20±0.1) conditions (Table 5), anaerobic and anoxic cultures of strain 400
CH12 contributed to the highest color removal efficiency (90 100% and 96 100%, respectively) 401
within four-day incubation. Compared to the anaerobic cell culture, the color removal by the 402
anoxic culture in the first and second day was better, which might be related to the higher biomass 403
recorded (Table 5). With relatively better oxygen availability, the anoxic culture could use oxygen 404
for rapid proliferation and utilize the dye when oxygen is depleted in the system. The results are 405
consistent with previous findings. For instance, Chen et al. [4] mentioned that Aeromonas 406
hydrophila under anaerobic and anoxic conditions showed enhanced Red RBN decolorization 407
efficiency. Compared to agitated culture, Pseudomonas aeruginosa incubated without agitation 408
exhibited almost two-fold higher decolorization activity [15]. Other studies also suggested that 409
microbial degradation of azo dyes was often an enzymatic reaction linked to anaerobiosis,and was 410
inhibited by oxygen,which could compete with the azo group as the electron receptor in the 411
oxidation of reduced electron carriers, i.e. NADH [11]. 412
Table 5 413
414
3.2.4. Effects of dye concentration and type of dye on decolorization 415
The dye concentration of textile industry wastewater is commonly in the range of 16 20 mg/L [5]. 416
However, the effect of much higher initial dye concentration (50 250 mg/L) on strain CH12 417
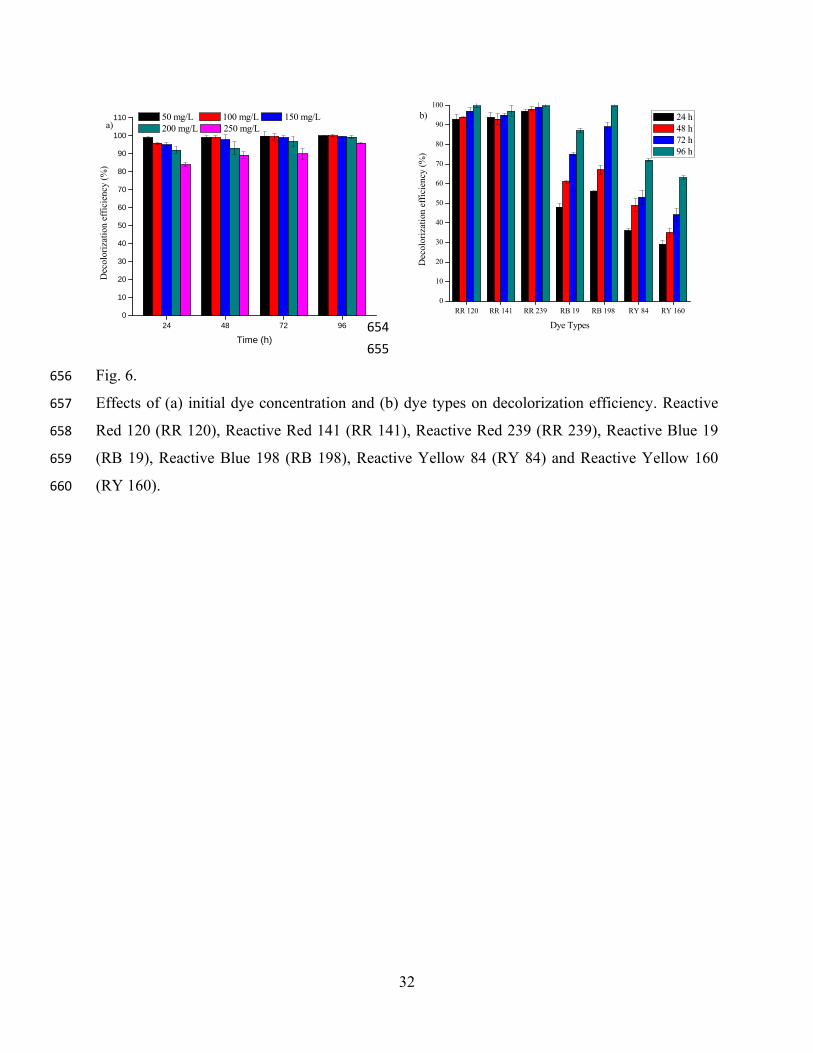
decolorization potential was evaluated in this study. In the first day of culture incubation, the 418

15
decolorization efficiency of the strain was found to be ≥96% for lower initial dye concentrations 419
(50 100 mg/L) and 84 95% for higher initial dye concentrations (150 250 mg/L) which was 420
significantly differ (p=0.031) among dye concentrations (Fig. 6a). However, after 96 h of 421
incubation period, strain CH12 exhibited almost equal percentage of decolorization (p>0.05) for all 422
dye concentrations (Fig. 6a). This means that an acceptable high color removal could be achieved 423
by strain CH12 for a wide range of initial dye concentrations. Previous studies showed that dye 424
concentration could influence the efficiency of microbial dye decolorization through a combination 425
of factors including toxicity imposed by higher dye concentrations [15]. However, the results from 426
the present study demonstrated that higher dye concentration (250 mg/L) was not toxic to strain 427
CH12 (Fig. 6a). Thus, this culture may hold great potential for treating industrial wastewater 428
containing high dye concentration. 429
Fig. 6 430
431
Textile industries are known to use different types of dyes and the effluents contain different 432
dyestuffs [1, 36]. To examine if strain CH12 can degrade other commonly used textile dyes, the 433
culture medium was supplemented with 100 mg/L of six different dyes (Table 2). During the first 434
day of incubation, strain CH12 showed significantly different decolorization efficiency variations 435
for Red (>90%), Blue (<60%) and Yellow (<40%) reactive dyes (Fig. 6b). At the end of the fourth 436
day, decolorization efficiency of the strain was improved (63 100%) for all dye types, suggesting 437
that under application condition strain CH12 could be used to decolorize complex dye effluent 438
with minor acclimation. Similar results (20 100%) were also obtained by Chen et al. [4] with an 439
extended period (seventh day incubation) using Aeromonas hydrophila DEC1. The variations of 440
decolorization for different dyes by strain CH12 might be attributable to the structural diversity of 441
the dyes (Fig. 6b). In fact, it has been reported that decolorization variation depends on the 442
structure and complexity of dyes, particularly on the nature and position of substituent in the 443
aromatic rings [1]. For instance, the half-life of hydrolyzed Reactive Blue 19 is about 46 years at 444
pH 7 and temperature of 25 ºC [36]. However, strain CH12 showed relatively better decolorization 445
efficiency for Blue dyes (48 100%) than Yellow dyes (30 72%) (Fig. 6b). 446
447
4. Conclusion 448
16
Batch experiments of azo dye decolorization using alkaliphilic microorganisms were conducted 449
under anoxic condition. During the screening activity, strain CH12 was found to be the most 450
efficient decolorizer (92 100%) within the first day of incubation using RR 239 dye 451
concentrations of 50-200 mg/L. The decolorization efficiency of strain CH12 was significantly 452
enhanced when the MSM was supplemented with carbon and organic nitrogen sources. The 453
presence of nitrate and nitrite significantly reduced the strain decolorization efficiency, indicating 454
that RR 239 dye was not a preferential electron acceptor. Decolorization efficiency of strain CH12 455
was also found to be the highest when incubated under anaerobic and anoxic conditions than under 456
aerobic condition, suggesting that the process of dye decolorization might involve oxygen sensitive 457
metabolic activities. Strain CH12 exhibited ability of decolorizing seven different types of dyes 458
with elevated dye concentrations which proves the biotechnological potential of this strain for 459
textile effluents treatment. 460
461
Acknowledgements 462
This work was supported by Arba Minch University (GOV/AMU/TH14/CNS/Bio/13/2015) and 463
China Scholarship Council, the National Science and Technology Pillar Program 464
(2013BAD21B03). 465
466
467

17
References 468
[1] R.G. Saratale, G.D. Saratale, J.S. Chang, S.P. Govindwar 469
Bacterial decolorization and degradation of azo dyes: A review 470
J. Taiwan Inst. Chem. Eng., 42 (2011), pp. 138-157. 471
[2] C.C. Hsueh, B.Y. Chen 472
Exploring effects of chemical structure on azo dye decolorization characteristics by Pseudomonas 473
luteola 474
J. Hazard. Mater., 154 ( 2008), pp. 703-710. 475
[3] S. Asad, M.A. Amoozegar, A.A. Pourbabaee, M.N. Sarbolouki, S.M.M. Dastghei 476
Decolorization of textile azo dyes by newly isolated halophilic and halotolerant bacteria 477
Bioresour. Technol., 98 (2007), pp. 2082–2088. 478
[4] K. Chen, J. Wu, D. Liou, S. Hwang 479
Decolorization of the textile dyes by newly isolated bacterial strains 480
J. Biotechnol., 101 (2003), pp. 57-68. 481
[5] I.M. Banat, P. Nigam, D. Singh, R. Marchant 482
Microbial decolorization of textile dye containing effluents: A review 483
Bioresour. Technol., 58 (1996), pp. 217-227. 484
[6] S. Sreelatha, C.N. Reddy, G. Velvizhi, S.V. Mohan 485
Reductive behaviour of acid azo dye based wastewater: Biocatalyst activity in conjunction with 486
enzymatic and bio-electro catalytic evaluation 487
Bioresour. Technol., 188 (2015), pp. 2–8. 488
[7] P.A. Ramalho, M.H. Cardoso, A. Cavaco-Paulo, M.T. Ramalho 489
Characterization of azo reduction activity in a novel ascomycete yeast strain 490
Appl. Environ. Microbiol., 70 (2004), pp. 2279-2288. 491
[8] H. Wang, J.Q. Su, X.W. Zheng, Y. Tian, X.J. Xiong, T.L. Zheng 492
Bacterial decolorization and degradation of the reactive dye Reactive Red 180 by Citrobacter sp. 493
CK3 494
Int. Biodeterior. Biodegrad., 63 (2009), pp. 395–399. 495
[9] S. Arora, H.S. Sain, K. Singh 496
Decolorization optimization of a mono azo disperse dye with Bacillus firmus: Identification of a 497

18
degradation product 498
Color. Technol., 123 (2007), pp. 184–190. 499
[10] N. Daneshvar, M. Ayazloo, A. Khataee, M. Pourhassan 500
Biological decolorization of dye solution containing malachite green by microalgae Cosmarium sp 501
Bioresour. Technol., 12 (2006), pp. 121-128. 502
[11] A.B. dos Santos, F.J. Cervantes, J.B. van Lier 503
Review paper on current technologies for decolorization of textile wastewaters: Perspectives for 504
anaerobic biotechnology 505
Bioresour. Technol., 98 (2007), pp. 2369–2385. 506
[12] M. Ramya, B. Anusha , S. Kalavathy 507
Decolorization and biodegradation of indigo carmine by a textile soil isolate Paenibacillus larvae 508
Biodegradation, 19 (2008), pp. 283–291. 509
[13] U.U. Jadhav, V.V. Dawkar, G.S. Ghodake, S.P. Govindwar 510
Biodegradation of direct red 5B, a textile dye by newly isolated Comamonas sp. UVS 511
J. Hazard. Mater., 158 (2008), pp. 507–516. 512
[14] D.C. Kalyani, P.S. Patil, J.P. Jadhav, S.P. Govindwar 513
Biodegradation of reactive textile dye Red BLI by an isolated bacterium Pseudomonas sp. SUK1 514
Bioresour. Technol., 99 (2008), pp. 4635–4641. 515
[15] N. Bhatt, K. Patel, C. Haresh, D. Madmwar 516
Decolorization of diazo-dye reactive blue 172 by Pseudomonas aeruginosa NBAR12 517
J. Basic Microbiol., 45 (2005), pp. 407–418. 518
[16] N. Chand, R.H. Sajedi, A.S. Nateri, K. Khajeh, M. Rassa 519
Fermentative desizing of cotton fabric using alpha-amylase-producing Bacillus strain: Optimization 520
of simultaneous enzyme production and desizing 521
Process Biochem., 49 (2014), pp. 1884–1888. 522
[17] P. Nigam, I.M. Banat, D. Singh, R. Marchant 523
Microbial process for the decolorization of textile effluent containing azo, diazo and reactive dyes 524
Process Biochem., 31 (1996), pp. 435-442. 525
[18] J. Guo, J. Zhou, D. Wang, K. Tamura, P. wang, M.S. Uddin 526
A novel moderately halphilic bacterium for decolorization azo dye under high salt condition 527

19
Biodegradation, 19 (2008), pp. 15-19. 528
[19] R. Leena, D.S. Raj 529
Bio-decolourization of textile effluent containing Reactive Black-B by effluent-adapted and non-530
adapted bacteria 531
Afr. J. Biotechnol., 7 (2008), pp. 3309-3313. 532
[20] O.D. Olukanni, A.A. Osuntoki, G.O. Gbenle 533
Textile effluent biodegradation potentials of textile effluent-adapted and non-adapted bacteria 534
Afr. J. Biotechnol., 5 (2006), pp. 1980-1984. 535
[21] S. Ali, Z. Khatri, A. Khatri, A. Tanwari 536
Integrated desizing-bleaching-reactive dyeing process for cotton towel using glucose oxidase enzyme 537
J. Clean. Prod., 66 (2014), pp. 562-567. 538
[22] M.A. Amoozegar, P. Schumann, M. Hajighasemi, M. Ashengroph, M.R. Razavi 539
Salinicoccus iranensis sp. nov., a novel moderate halophle 540
Int. J. Syst. Evol. Microbiol., 58 (2008), pp. 178-183. 541
[23] K. Horikoshi 542
Alkaliphiles: Some applications of their products for biotechnology 543
Microbiol. Mol. Biol. Rev., 63 (1999), pp. 735-750. 544
[24] E.R.B. Moore, A. Arnscheidt, A. Krüger, C. Strompl, M. Mau 545
Simplified protocols for the preparation of genomic DNA from bacterial cultures 546
A.D.L Akkermans, J.D. van Elsas, F.J. Bruijn (eds.), Molecular Microbial Ecology Manual, Kluwer 547
Academic Press, Dordrecht (1999), pp. pp.1-15. 548
[25] S.J. Giovannoni 549
The Polymerase Chain Reaction 550
John Wiley and Sons Ltd., London (1991), pp 177-201. 551
[26] K. Tamura, G. Stecher, D. Peterson, A. Filipski, S. Kumar 552
MEGA6: Molecular evolutionary genetics analysis version 6.0 553
Mol. Biol. Evol., 30 (2013), pp. 2725-2729. 554
[27] N. Saitou, M. Nei 555
The neighbor-joining method: A new method for reconstructing phylogenetic trees 556
Mol. Biol. Evol., 4 (1987), pp. 406-425. 557
20
[28] K. Tamura, M. Nei 558
Estimation of the number of nucleotide substitutions in the control region of mitochondrial DNA in 559
humans and chimpanzees 560
Mol. Biol Evol., 10 (1993), pp. 512-526. 561
[29] J. Felsenstein 562
Confidence limits on phylogenies: An approach using the bootstrap 563
Evolution, 39 (1985), pp. 783-791. 564
[30] American Public Health Association (APHA) 565
Standard Methods for the Examination of Water and Wastewater 566
(20th ed.) American Public Health Association, Washington DC (1998). 567
[31] S. Lalnunhlimi, V. Krishnaswamy 568
Decolorization of azo dyes (Direct Blue 151 and Direct Red 31) by moderately alkaliphilic bacterial 569
consortium 570
Braz .J. Microbiol., 47 (2016), pp. 39-46. 571
[32] R. Birmole, S. Patade, V. Sirwaiya, F. Bargir, K. Aruna 572
Biodegradation study of Reactive Blue 172 by Shewanella haliotis DW01 isolated from lake sediment 573
Indian. J. Sci. Res., 5 (2014), pp. 139-152. 574
[33] O. Anjaneya, S.Y. Souche, M. Santoshkumar, T.B. Karegoudar 575
Decolorization of sulfonated azo dye Metanil Yellow by newly isolated bacterial strains: Bacillus sp. 576
strain AK1 and Lysinibacillus sp. strain AK2. 577
J. Hazard. Mater., 190 (2011), pp. 351-358. 578
[34] F. Elisangela, Z. Andrea, D.G. Fabio, R.M. Cristiano, D.L. Regina, C.P. Artur 579
Biodegradation of textile azo dyes by a facultative Staphylococcus arlettae strain VN-11 using a 580
sequential microaerophilic/aerobic process 581
Int. Biodeterior. Biodegrad., 63 (2009), pp. 280-288. 582
[35] M.A. Imran, T. Hussain, M.H. Memon, M.M.A. Rehman 583
Sustainable and economical one-step desizing, scouring and bleaching method for industrial scale 584
pretreatment of woven fabrics 585
J. Clean. Prod., 108 (2015), pp. 494-502. 586
[36] O. Hao, H. Kim, P. Chiang 587
21
Decolorization of wastewater: Critical reviews 588
Environ. Sci. Technol., 30 (2000), pp. 449-505. 589
590
Figure Legends 591
Fig. 1. Schematic of the decolorization reactor setup. 592
Fig. 2. The number of isolates from Lakes Abaya and Chamo over time. 593
Fig. 3. Bacillus sp. strain CH12 and related organisms were aligned based on 16S rRNA gene 594
sequences retrieved from NCBI GenBank with neighbour-joining method. The triangle filled 595
indicates strain CH12 isolated from Chamo Lake in this study. Bootstrap values based on 1000 596
replications are listed as percentages at the branching points (values ≥50% shown at the node). 597
Scale bar, 0.1 is the number of nucleotide changes per sequence position. 598
Fig. 4. The effects of different nutritional supplements [(a) carbon sources, (b) nitrogen sources] on 599
decolorization efficiency. 600
Fig. 5. The effects of pH (a) and temperature (b) on decolorization efficiency. 601
Fig. 6. Effects of (a) initial dye concentration and (b) dye types on decolorization efficiency. 602
Reactive Red 120 (RR 120), Reactive Red 141 (RR 141), Reactive Red 239 (RR 239), Reactive 603
Blue 19 (RB 19), Reactive Blue 198 (RB 198), Reactive Yellow 84 (RY 84) and Reactive Yellow 604
160 (RY 160). 605
606

22
Table 1. 607
Physico-chemical characteristics of Abaya and Chamo Lakes. 608
Parameter Abaya Chamo
pH 8.5±0.4 9.1±0.2
Salinity (mg/L) 638.0±0.1 1154.5±0.6
Chloride (mg/L) 74.2±0.3 141.0±0.1
Alkalinity (as CaCO3 mg/L) 528.0±1.8 814.0±4.8
Potassium (mg/L) 12.0 19.80 20.0 22.50
Temperature (°C ) 23.8±2.4 25.3±2.1
Conductivity(ms/cm) 1.3±0.4 2.0±0.4
TDS (mg/L) 757.0±1.9 980.0±4.6
TSS (mg/L) 248.0±0.1 350.2±0.5
TS (mg/L) 1005.2±0.3 1330.0±0.1
DO (mg/L) 4.5±0.3 4.8±0.2
DO = Dissolved oxygen, TDS = Total dissolved Solids, TSS=Total suspended solids, TS=Total solids 609
610
611

23
Table 2. 612
Characteristics of the dyes used in this study. 613
Color Index Name Common/Product Name Molecular Formula Molecular Weight (g/mol) λmax (nm)
Reactive Red 239 Everzol Red 3BS C31H19ClN7Na5O19S6 1136.32 541
Reactive Red 141 Procion Red HE7B C52H34Cl2N14O26S8 1597.00 544
Reactive Red 120 Evercion Red HE3B C44H24Cl2N14Na6O20S6 1469.98 535
Reactive Yellow 84 Procion Yellow HE4R C56H38Cl2N14Na6O20S6 1628.22 411
Reactive Yellow 160 Reactive Yellow 160 ME4G C25H22ClN9Na2O12S3 818.13 415
Reactive Blue 198 Evercion Blue HEGN C41H30Cl4N14Na4O14S4 1304.80 520
Reactive Blue 19 Remazol Brilliant Blue R C22H16N2Na2O11S3 626.54 594
λmax= Maximum wavelength 614
615
616
24
Table 3. 617
Morphological, physiological and biochemical characterization of strain CH12. 618
619
620
621
Test type Result Test type Result
Morphology: Physiological:
Bacterial cell shape Rod Temperature range (°C) 15 45
Bacterial colony color White Temperature optimum (°C) 30
Bacterial colony form Irregular pH range 6 11
Bacterial colony elevation Flat pH optimum 9
Gram staining NaCl requirement 0
Spore staining NaCl optimum (%) 10
Motility NaCl tolerance (%) 20
Biochemical:
Anaerobic growth
Aerobic growth
Catalase
Oxidase

25
Table 4. 622
Comparison of textile dye removal efficiency of this study and other studies. 623
Microbial isolate/s Sample type Dye type (conc., mg/L) pH Time (h) Decolorization (%) Reference
Bacillus sp. strain CH12 Rift Valley alkaline lake sediment Reactive Red 239 (100) 9.0 10.0 24 96 95 100 This study
Bacillus sp. Non-contaminated soil Reactive Black B (Nm) Neutral 240 30 [19]
Bacillus sp. (N1 to N6) Non-contaminated soil Seven dyes mixed (56) Nm 336 40-47 [20]
Bacillus cereus Alkaline soda soil sample Direct Blue 151 (200) 9.5 120 93 [31]
Shewanella haliotis DW01 Alkaline Lake water sediment Reactive Blue 172 (50) 9.5 12 93 [32]
Halomonas sp. strain GTW Alkaline coastal sediment sample Reactive Red K-2BP (100) 6.5 8.5 24 98 100 [18]
Bacillus sp. strain Ak1 Dye contaminated soil Metanil Yellow (200) 5.5 9.0 24 99 [33]
Staphylococus arlettae strain VN-11 Textile effluent AS Four dye mixed (400) 7.0 10 48 >97 [34]
Citrobacter sp. CK3 Textile mill AS Reactive Red 180 (200) 6.0 10.0 24 120 70 96 [8]
Comamonas sp. UVS Dye contaminated soil Direct Red 5B (50) 6.0-12.0 6 13 78 100 [13]
Paenibacillus larvae Textile industry AS Indigo Carmine (100) 6.0 8.0 4 10 88 100 [12]
Halomonas aquamarina D2 Textile industry effluents Remazol Black B (50) 5.0 11.0 96 50 72 [3]
Pseudomonas aeruginosa NBAR12 Dye contaminated soil Reactive Blue 172 (500) 7.0 42 83 [15]
Aeromonas hydrophila DEC1 Textile AS Red RBN (3000) 5.5 10.0 8 >90 [4]
AS=Activated sludge, Nm=Not mentioned 624
625
26
Table 5. 626
Effects of culturing conditions on dissolved oxygen concentration, biomass and dye removal as a function of time. 627
Culture
condition
Decolorization efficiency (%) Dissolved oxygen (mg/L) Dry weight (g/L)
24 h 48 h 72 h 96 h 24 h 48 h 72 h 96 h 24 h 48 h 72 h 96 h
Anaerobic 90.0±2.1 94.0±1.3 96.0±0.2 100.0±0.1 0.20±0.1 0.10±0.1 0.06±0.0 0.01±0.0 0.20±0.1 2.15±0.3 2.64±0.1 2.57±0.5
Anoxic 96.2±1.5 99.0±0.8 99.7±0.3 100.0±0.0 0.76±0.3 0.46±0.2 0.31±0.1 0.25±0.0 0.88±0.2 2.94±0.1 3.25±0.4 3.29±0.3
Shaker 2.0±1.0 7.5±2.0 12.4±1.8 18.6±2.4 1.33±0.3 1.36±0.1 1.32+0.2 1.35±0.1 3.16±0.1 3.33±0.4 3.41±0.2 3.52±0.1
Aerobic 1.2±0.3 2.0±1.5 3.5±0.4 6.0±0.3 2.54±0.3 2.35±0.5 2.50±0.4 2.42±0.2 3.49±0.3 3.63±0.2 3.66±0.3 3.58±0.5
628

27
KOH
Dye containing waste
Sampling tube
Control
Syringe
Gas removing tube
Reactor
Gas collector
629
Fig. 1. 630
Schematic of the decolorization reactor setup. 631
632

28
0
5
10
15
20
25
30
35
40N
umbe
r of
tota
l iso
late
s
Time (Day)
Lake Chamo Lake Abaya
1 2 3 5 64 7 8 9-14 >14
633
Fig. 2. 634
The number of isolates from Lakes Abaya and Chamo over time. 635
29
636
Fig. 3. 637
Bacillus sp. strain CH12 and related organisms were aligned based on 16S rRNA gene sequences 638
retrieved from NCBI GenBank with neighbour-joining method. The triangle filled indicates 639
strain CH12 isolated from Chamo Lake in this study. Bootstrap values based on 1000 640
replications are listed as percentages at the branching points (values ≥50% shown at the node). 641
Scale bar, 0.1 is the number of nucleotide changes per sequence position. 642
643

30
24 48 72 960
10
20
30
40
50
60
70
80
90
100
110 Trisodium Citrate Glucose Maltose Starch Carbon-free
Dec
olor
izat
ion
effi
cien
cy (
%)
Time (h)
a)
24 48 72 960
10
20
30
40
50
60
70
80
90
100
110 NaNO3 NaNO
2 (NH
4)
2SO
4 Yeast Extract
Peptone Nitrogen-free
Dec
olor
izat
ion
effi
cien
cy (
%)
Time (h)
b)
644
Fig. 4. 645
The effects of different nutritional supplements [(a) carbon sources, (b) nitrogen sources] on 646
decolorization efficiency. 647
648
649

31
24 48 72 960
10
20
30
40
50
60
70
80
90
100
110 pH=6 pH=7 pH=8 pH=9 pH=10 pH=11
Dec
olor
izat
ion
effi
cien
cy (
%)
Time (h)
a)
24 48 72 960
10
20
30
40
50
60
70
80
90
100
110 15 oC 20 oC 25 oC 30 oC
35 oC 40 oC 45 oC
Dec
olor
izat
ion
effi
cien
cy (
%)
Time (h)
b)
650
Fig. 5. 651
The effects of pH (a) and temperature (b) on decolorization efficiency. 652
653
32
RR 120 RR 141 RR 239 RB 19 RB 198 RY 84 RY 1600
10
20
30
40
50
60
70
80
90
100
Dec
olor
izat
ion
effi
cien
cy (
%)
Dye Types
24 h 48 h 72 h 96 h
b)
654
655
Fig. 6. 656
Effects of (a) initial dye concentration and (b) dye types on decolorization efficiency. Reactive 657
Red 120 (RR 120), Reactive Red 141 (RR 141), Reactive Red 239 (RR 239), Reactive Blue 19 658
(RB 19), Reactive Blue 198 (RB 198), Reactive Yellow 84 (RY 84) and Reactive Yellow 160 659
(RY 160). 660
24 48 72 960
10
20
30
40
50
60
70
80
90
100
110 50 mg/L 100 mg/L 150 mg/L 200 mg/L 250 mg/L
Dec
olor
izat
ion
effi
cien
cy (
%)
Time (h)
a)


