47
© Emaar 2008 Emaar Properties PJSC Corporate Presentation June 9 th , 2011
© Emaar 2008
Emaar Properties PJSCCorporate Presentation
June 9th, 2011

© Emaar 2011
EMAAR OVERVIEW
2

© Emaar 2011
Emaar Properties is the largest publicly-listed property developer in the MENA region
Market Cap(1): AED 19.7bn (US$5.36 bn)
Revenues: FY 2009 AED 8.4 bn (US$2.29 bn)FY 2010 AED 12.15 bn (US$ 3.31 bn)
Net Operating Profit: FY 2009 AED 2.3 bn (US$ 0.63 bn)FY 2010 AED 3.03 bn (US$ 0.82 bn)
Hotels: 9 hotels and resorts (1,457 keys)462 serviced apartments (including 144 units of Armani Hotel recently opened in Burj Khalifa)
Recurring Revenue: Approx. 650,000 sqm of recurring revenue generating assets
Residential Units Delivered: Over 32,000 since 2001
NAV/Share (2): AED 8.9
(1) As of 31/MAR/2011(2) As at 31/DEC/2010
EMAAR at a Glance
3
© Emaar 2011* Includes land held by associated companies and takes into account 100% of the land in each country (not proportionate data).
EMAAR’s Strategy & Goals
4
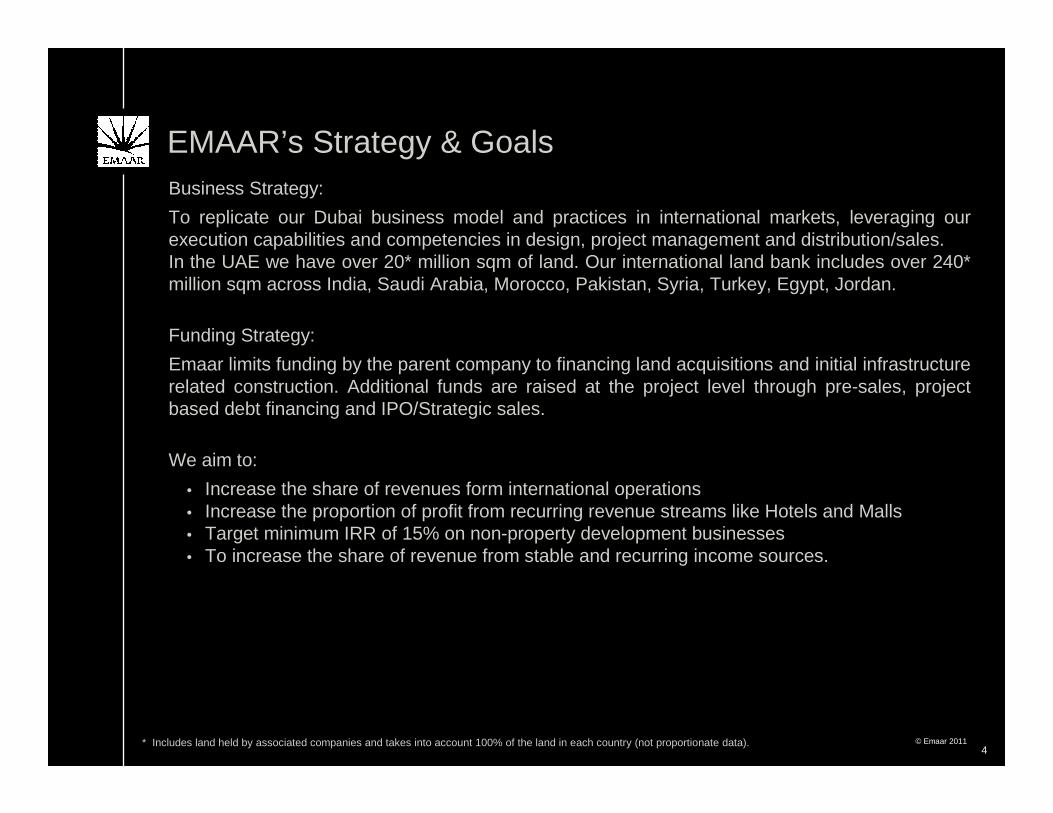
Business Strategy:
To replicate our Dubai business model and practices in international markets, leveraging our execution capabilities and competencies in design, project management and distribution/sales.In the UAE we have over 20* million sqm of land. Our international land bank includes over 240* million sqm across India, Saudi Arabia, Morocco, Pakistan, Syria, Turkey, Egypt, Jordan.
Funding Strategy:
Emaar limits funding by the parent company to financing land acquisitions and initial infrastructure related construction. Additional funds are raised at the project level through pre-sales, project based debt financing and IPO/Strategic sales.
We aim to:
• Increase the share of revenues form international operations• Increase the proportion of profit from recurring revenue streams like Hotels and Malls• Target minimum IRR of 15% on non-property development businesses• To increase the share of revenue from stable and recurring income sources.

© Emaar 2011
EMAAR’s Business Strategy
5
• Emaar’s medium term strategy will continue to focus on monetising core assets when they are of sufficient size, with the ultimate aim of providing these business units with further growth capital.
• In Dubai, Emaar will re-focus on affordable housing for mid income earners. This will target the majority of the Dubai demographic, previously not catered for low construction costs remaining a competitive advantage
• Development of Rental / Mall assets in countries including Egypt, Turkey and Syria providing longer term stable stream of cash flows and revenues.
• Concentrate on completing development of existing significant land bank, establish the brand (similar to Dubai) and further expansion in developing markets with high rate of return given Emaar’s material International land bank, in certain markets Emaar will monetise some of these assets where demand and prices are acceptable through considering land sales.

© Emaar 2011
EMAAR’s Group 2010 Performance Highlights
Note: Please refer to Appendix 1 for summarised financials for the period ended 2010.6
Performance highlights/Key Achievements during 2010 included:
• Burj Khalifa: Official opening of Burj Khalifa (Tallest Tower in the world) in January 2010.
• Armani Hotel: Official opening of the first Armani Hotel in Burj Khalifa
• Dubai and International RE: Hand over of 3,500 units in Dubai and internationally including handover of 770 units in Burj Khalifa by YE2010, and 270 Units in Q1, 2011
• Hospitality and shopping mall subsidiaries contribute significantly to revenue
• Hospitality: 87% Average occupancy Q1, 2011
• Malls: Average Footfall of 3.92 million per month in 201013.5 million visitors in Q1, 2011
• International: Hand over of International RE units in Turkey (Tuscan Valley) and Syria (Eighth Gate). Revenue also recognized in Egypt and The Kingdom of Saudi Arabia in 2010/2011

© Emaar 2011
EMAAR’s Group 2010 Performance Highlights Con’t
1. Fair value and cost of Investment Property and Fixed assets as at 31 December 2010
Profitability | Stable performance in tough market conditions
• Revenues for 2010 were AED 12.150 bn (versus 2009 AED 8.413 bn)
• Net Operating Profit 2010 were AED 3.034 bn (versus 2009 AED 2.324 bn)
Balance Sheet as at 31 Dec 2010 | remains robust
• Total Assets at AED 62,504m
• Investment properties and fixed assets at AED 16,649m (fair value of AED 22,923m)1
• Development Property at AED 26,492m (fair value of AED 45,543m)1
• Consolidated Group Debt at AED 11,169m (2009 AED 8,625m) as International RE development expansion was funded through local borrowings. Net debt at AED 6,128m (2009 AED 6,328m)
7

© Emaar 2011
EMAAR Key Group Divisions
Provide stable and recurring revenue generation
Growth Engine
Property Development
UAE
Property Development
UAE
Property DevelopmentInternational
Property DevelopmentInternational
Malls and
Retail
Malls and
Retail
•Market leading developer in Dubai Developer of the flagship project Burj Khalifa
•Market leading developer in Dubai Developer of the flagship project Burj Khalifa
•Active in 10 targeted high growth countries
•Forming JVs with strong local partners to leverage off local expertise
•Active in 10 targeted high growth countries
•Forming JVs with strong local partners to leverage off local expertise
•Current retail space of over 500,000 sqmGLA
•Current retail space of over 500,000 sqmGLA
HotelsResorts &Hospitality
HotelsResorts &Hospitality
•Developer, owner and manager of Armani branded hotels and resorts (1st Armani Hotel opened in Burj Khalifa with 160 keys)
•9 hotels (1,457 keys) 462 serviced apartments
•Own 5 star premium global brand “The Address Hotels and Resorts”
•Developer, owner and manager of Armani branded hotels and resorts (1st Armani Hotel opened in Burj Khalifa with 160 keys)
•9 hotels (1,457 keys) 462 serviced apartments
•Own 5 star premium global brand “The Address Hotels and Resorts”
8

© Emaar 2011
Strong Record of Execution
Cumulative Number Units Delivered
9
8,04810,227
13,185 14,226 14,768 15,173
4,870
5,965
8,217
12,15214,686
17,813
-
5,000
10,000
15,000
20,000
25,000
30,000
35,000
2005 2006 2007 2008 2009 2010
Villas Apartments
12,918
16,192
21,402
26,378
29,454
32,986

© Emaar 2011
INVESTMENT HIGHLIGHTS
10

© Emaar 2011
Shareholder’s Value – NAV Computation (AED million)
Book value Fair value Book value Fair value
Cash and bank balances 5,042 5,042 2,267 2,267
Trade and other recievables 3,757 3,757 4,192 4,192
Development properties 26,492 45,543 31,076 50,556
Investment in associates 7,592 7,237 7,861 8,000
Securities and loans to associates 2,926 2,926 2,942 2,942
Investment properties 8,110 13,265 8,546 14,981
Fixed assets 8,539 9,658 6,822 7,827
Goodwill 46 46 439 439
Total assets 62,504 87,474 64,145 91,204
Total liabilities (incl. minority interest) (31,435) (33,099) (35,468) (37,638)
Net Asset Value 31,069 54,375 28,677 53,566
Number of Shares Outstanding 6,091 6,091 6,091 6,091
Net Asset Value per Share (AED) 5.1 8.9 4.7 8.8
2010 2009
Fair value is carried out by CBRE and other reputed valuers for land included in development properties, investment properties and revenue generating fixed assets – Year end 2010
11

© Emaar 2011
Shareholder’s Value – NAV Computation (AED million)
Fair value is carried out by CBRE and other reputed valuers for land included in development properties, investment properties and revenue generating fixed assets – Year end 2010
2010 2009
Net Asset Value as per consolidated balance sheet (AED
millions)
31,069 28,677
Add : Fair value in excess of book value for Development
properties (AED millions)
17,332 17,306
Add : Fair value of assets in excess of book value for
Investment Properties (AED millions)
5,155 6,435
Add : Fair value of assets in excess of book value for Fixed
Assets (AED millions)
1,119 1,005
Add : Fair value investment in listed associates in excess of
the book value (AED millions)
(300) 143
Net book value including Fair Market Value of land and
investments (AED millions)
54,375 53,566
Number of Shares Outstanding 6,091 6,091
Net Asset Value per Share (AED) 8.9 8.8
12

© Emaar 2011
Evolution of Emaar Group Revenue
13
9,641
1,076
-
5,675
2,101
637
8,401
2,776
973
-
2,000
4,000
6,000
8,000
10,000
2008 2009 2010
Dubai Operations Leasing & Hospitality International
AE
D m
illi
on
s
90%
10%
67%
69%
25%23%
8% 8%

© Emaar 2011
Fair Value of Development Properties(AED million)
Note : The India numbers include the JV with APIIC , Hyderabad only and does not include Emaar MGF as the Company has filed a DRHP for potential IPO.
Book value Fair value Book value Fair value
UAE 14,933 20,258 20,436 27,481
Egypt 4,531 12,538 4,210 9,361
India 64 2,902 73 2,935
Turkey 2,424 2,758 2,245 2,482
KSA 1,734 2,462 1,570 3,219
Pakistan 613 1,383 523 1,400
Lebanon 366 980 329 785
Syria 484 918 392 1,202
Morocco 318 318 293 779
Canada & USA 1,026 1,026 1,003 911
Total Value 26,492 45,543 31,076 50,556
2010 2009
14

© Emaar 2011
Fair Value of Investment Properties
15
(AED million)
Book value Fair value Book value Fair value
Dubai Mall & Marina Mall 6,807 10,855 7,075 11,166
Burj Dubai (Souk Al Bahar and other
retail locations)
392 681 403 894
Burj Dubai Business Square 166 527 373 1,427
Gold & Diamond Park 181 373 183 644
Dubai Marina (Retail) 49 226 50 281
Other (plots/schools/ camps) 382 382 325 325
Other retail locations 133 221 137 244
Total Value 8,110 13,265 8,546 14,981
2010 2009

© Emaar 2011
Fair Value of Fixed Assets(AED million)
Book value Fair value Book value Fair value
Hotels, Convention centre & Service
Appartments
4,064 5,019 2,762 3,339
District Cooling Plant 383 383 406 406
Emaar Business Park 107 271 113 541
At The Top 143 143 - -
Leisure and Entertainment & Medical
centre
972 972 877 877
Other assets (Self occupied, CWIP,
Sales center etc.)
2,871 2,871 2,664 2,664
Total value of Fixed Assets 8,539 9,658 6,822 7,827
2010 2009
16
© Emaar 2011
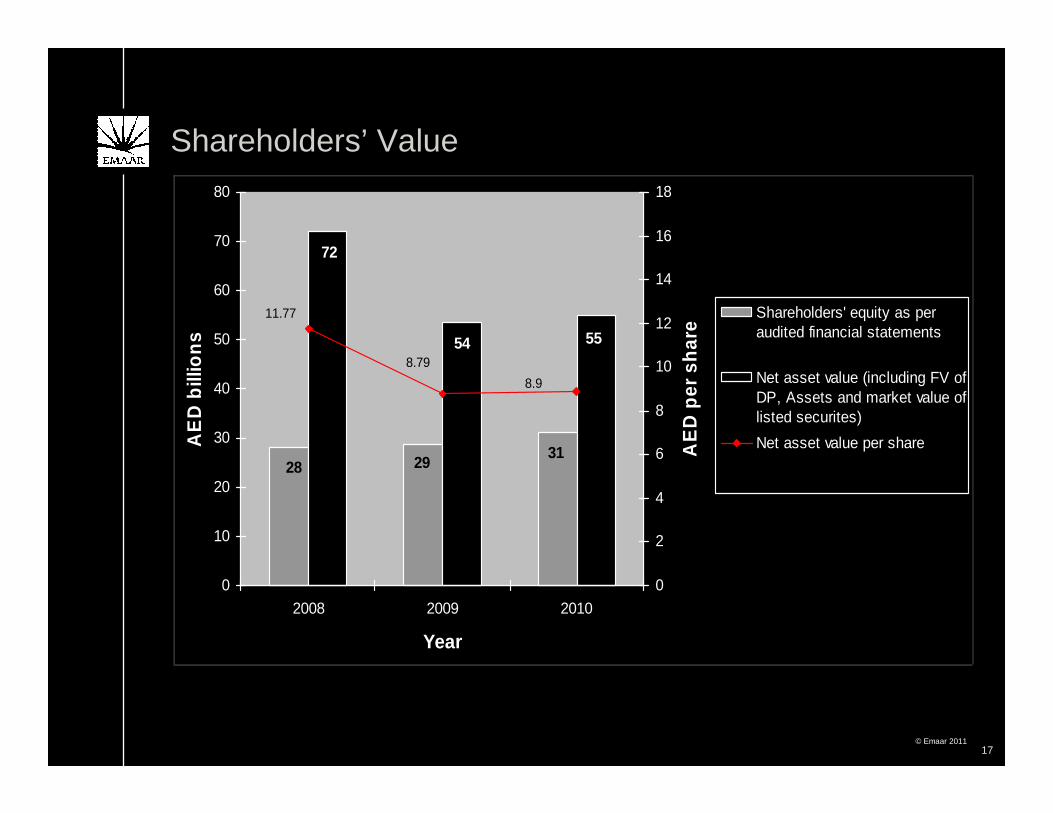
Shareholders’ Value
17
312928
5554
72
8.9
11.77
8.79
0
10
20
30
40
50
60
70
80
2008 2009 2010
Year
AE
D b
illio
ns
0
2
4
6
8
10
12
14
16
18
AE
D p
er s
har
e
Shareholders' equity as peraudited financial statements
Net asset value (including FV ofDP, Assets and market value oflisted securites)
Net asset value per share

© Emaar 2011
REGIONAL OPERATIONS
18
© Emaar 2011
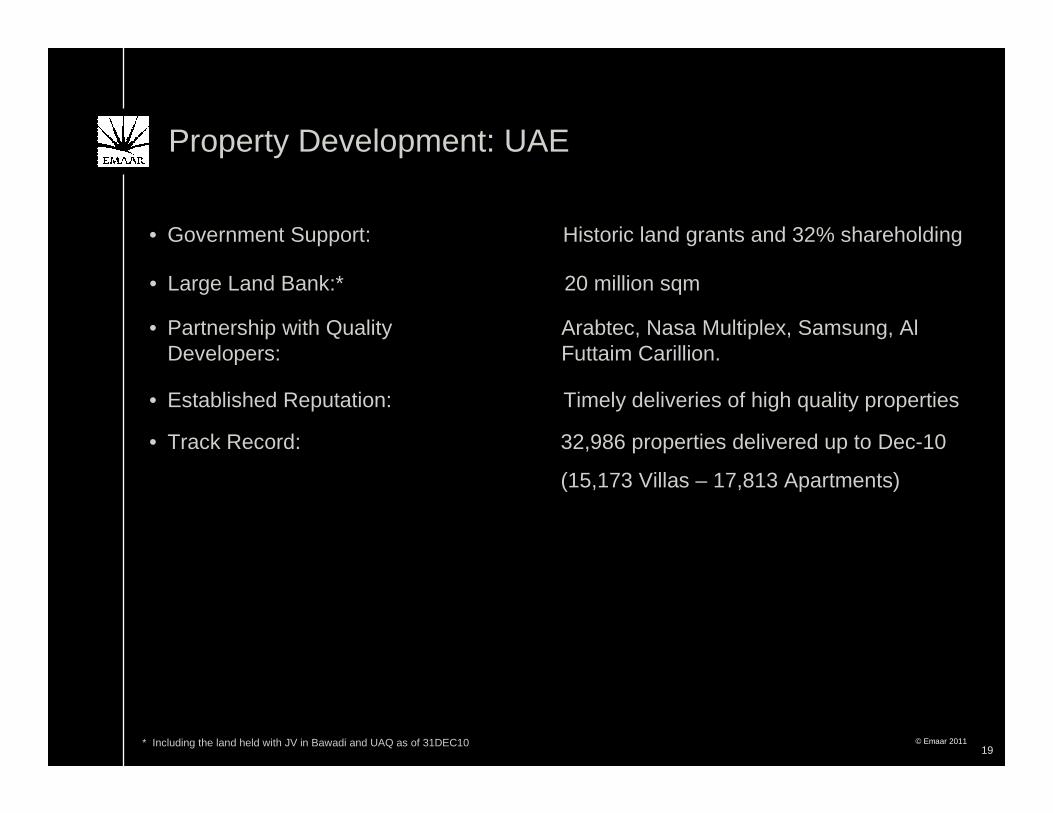
• Government Support: Historic land grants and 32% shareholding
Property Development: UAE
• Large Land Bank:* 20 million sqm
• Partnership with Quality Developers:
Arabtec, Nasa Multiplex, Samsung, Al Futtaim Carillion.
• Established Reputation: Timely deliveries of high quality properties
• Track Record: 32,986 properties delivered up to Dec-10
(15,173 Villas – 17,813 Apartments)
* Including the land held with JV in Bawadi and UAQ as of 31DEC1019

© Emaar 2011
Dubai RE – Key Strengths• All Dubai RE projects are under construction, with no speculative, Dubai RE development projects
included within forecasts. The majority of developments under construction will complete within the next 2 years
• Pre-sales model utilised, with the cash inflows from customers instalments financing the bulk of constructions costs
• Conservative construction methodology, if sufficient pre-sales levels not achieved, projects are rescheduled. Contracts signed with contractors provide Emaar with the flexibility to reschedule projects / development phases without incurring material costs / charges from contractors for work which does not go ahead
• Over 75% of units in developments currently under construction pre-sold
• Customer default rates on pre-sold developments were low in 2009 and 2010, with the bulk of instalments already made by customers
• Emaar’s Dubai RE developments are situated in prime locations which will be the focus of any sales activity over the forecast period
20

© Emaar 2011
Regional Business Highlights
21
Projects Units under
development
Deliveries 2011 Deliveries 2012 Deliveries 2013
Downtown Dubai 2,016 320 947 749
Downtown Dubai Commercial units (Sq Ft) 1,353,034 974,501 378,533 -
Dubai Marina Commercial units (Sq Ft) 758,237 758,237 - -
Umm Al Quwain 277 277 - -
Arabian Ranches 89 89 -
Grand Total (Excluding Commercial Units) 2,382 686 947 749
Grand Total - Commercial Units (Sq Ft) 2,111,271 1,732,738 378,533 -

© Emaar 2011
INTERNATIONAL OPERATIONS
22

© Emaar 2011
International RE – Unit Sales to DateEmaar has achieved an overall sales level of 75% in its International business
23
As of 31 March 2011As of 31 March 2011
Units Released
Egypt Emaar Misr for Development S.A.E. 2,495 1,753 70%
KSA Emaar Middle East 434 299 69%
Pakistan Emaar DHA Islamabad Limited 285 199 70%
Emaar GIGA Karachi Limited 213 55 26%
Syria Emaar IGO 1,013 695 69%
Morocco Emaar Tinja 123 49 40%
Turkey Emaar Turkey 186 123 66%
Lebanon Metn Renaissance Holding 307 208 68%
Associates India Emaar MGF 15,508 12,118 78%
Jordan Samarah Project Dead Sea 114 65 57%
Grand Total 20,678 15,564 75%
% sales achieved
Subsidiaries
Country Entity Unit Sale achieved

© Emaar 2011
International Business Highlights
As of 31 March 2011As of 31 March 2011
24
Country EntityUnits
CompletedUnits Under
DevelopmentTo be Developed
2011-2013Deliveries
2009 Deliveries
2010Deliveries
2011Deliveries
2012Deliveries
2013
Subsidiaries
Egypt Emaar Misr 100 1,829 3,684 - 100 380 1,325 1,066
KSA Emaar Middle East 32 523 866 - 31 133 381 481
Emaar DHA Islamabad 78 198 47 40 11 91 98 -
Emaar GIGA Karachi - 300 300 - - - 300 -
Syria Emaar IGO 443 0 971 32 262 72 77 192
Morocco Emaar Tinja - 123 107 - - - 123 107
Canada Emaar Properties (Canada) Ltd. 65 43 - 21 11 40 36 -
Turkey Emaar Turkey 174 54 740 96 6 24 102 457
Lebanon Metn Renaissance - 147 535 - - 87 154 147
Total 892 3,217 7,250 189 421 827 2,596 2,450
Associates
India Emaar MGF 100 15,408 - - 100 2,524 3,850 4,230
Jordan Samarah Project 68 115 219 - 22 26 55 122
Total 168 15,523 219 - 122 2,550 3,905 4,352
Grand Total 1060 18,740 7,469 189 543 3,377 6,500 6,802
Pakistan

© Emaar 2011
International RE – Key Strengths• Successful expansion of Emaar’s RE development model to several International locations. This
has enabled Emaar to both grow and at the same time, limit concentration risk to the Dubai real estate market
• For the International RE developments, Emaar have purchased land banks (solely or with JV partners). The cost of these International land banks has already been paid for.
• A number of large project’s are coming on line, each with localised demand and supply characteristics, in particular
• EME – Several projects in construction, with over 400 units launched to date and significant pre-sales levels achieved.
• Egypt – Demand characteristics are solid, with a growing population and a lack of supply. Emaar has three major developments under construction, with approx. 1,700 units sold to date.
• Turkey – Real estate market remains robust, particularly in central Istanbul, where Emaar owns a prime land plot. Sales in central Istanbul to commence in 2011, with further launches of other Emaar developments also due, including launches of Phase 2,3 & 4 of the Tuscan Valley development (over 66% of inventory successfully pre-sold in Phase 1)
• Despite market conditions, Emaar concluded a number of successful development launches Internationally. With global economic conditions forecast to improve in 2011, and improved Emaar brand awareness, Emaar remains confident of the success of the new launches over the forecast period.
25

© Emaar 2011
SEGMENTS
26

© Emaar 2011
Malls – Key Strengths• Significant Gross Leasable Area (“GLA”) – 2009 saw all of the Dubai located Malls assets opened,
representing 5.28m SqFt of GLA, with GLA Occupancy at 90% across all assets (Dec 2010) and significant interest on remaining units resulted from success of The Dubai Mall. In terms of turnover, major brands are in the top ranking of each operator across the world.
• The Dubai Mall - Assets include The Dubai Mall, which opened in Nov-08 and is one of the largest malls in the world, with 3.65m Sq Ft GLA. The Dubai Mall had 92% GLA Occupancy (Dec 2010). The remaining units are under final stage of leasing the selection of tenants is carefully done to suits tenants mix and at landlord terms.
• Preferable Lease Terms - Non-anchor tenants typically on 3-5 year lease contracts, with anchor tenants agreeing to between 10 – 20 year tenancy agreements.
• Rental Income for 2010 was AED 1.9 billion
27

© Emaar 2011
Malls – Key Strengths (Cont’)• Impressive and Growing Footfall - Overall footfall trend positive across Mall Division in 2010, with
The Dubai Mall now the busiest mall as measured by footfall in Dubai Since opening in Nov-08. The Mall recorded 47 million visitors in 2010 and highest-ever quarterly footfall of 13.5 million visitors in Q1 2011.
• Diversified Lease Payment Risk - Tenants across the Malls divisions, with lease payment risk diversified across many counterparties. Key anchor tenants, made up of high quality, large regional and international businesses
• High Margin Assets - Malls assets generate significant cash as a result of low maintenance capexand operational expenses, and are forecast to generate net annual cash flows of c. AED1,250m when fully operational.
• Exclusive Tenants - Malls division have a number of exclusive tenants who do not have retail outlets anywhere else in the UAE / [GCC] including Bloomingdales and Galleries Lafayette
• New Attractions – further attractions coming on line across the Malls assets in 2010 and 2011, which will help to further increase footfall – these attractions included:
• Impressive and Growing Footfall - Overall footfall trend positive across Mall Division in 2010, with The Dubai Mall now the busiest mall as measured by footfall in Dubai Since opening in Nov-08. The Mall recorded 47 million visitors in 2010 and highest-ever quarterly footfall of 13.5 million visitors in Q1 2011.
• Diversified Lease Payment Risk - Tenants across the Malls divisions, with lease payment risk diversified across many counterparties. Key anchor tenants, made up of high quality, large regional and international businesses
• High Margin Assets - Malls assets generate significant cash as a result of low maintenance capexand operational expenses, and are forecast to generate net annual cash flows of c. AED1,250m when fully operational.
• Exclusive Tenants - Malls division have a number of exclusive tenants who do not have retail outlets anywhere else in the UAE / [GCC] including Bloomingdales and Galleries Lafayette
• New Attractions – further attractions coming on line across the Malls assets in 2010 and 2011, which will help to further increase footfall – these attractions included:
• Reel Cinema 22 Screen Cineplex (the largest and No. 1 cinema in Dubai based on admissions)
• SEGA Republic (76,000 Sqft indoor theme park)
• Indoor Aquarium and Olympic size Ice Rink
• Kidzania (children’s entertainment facility), and
• The Gourmet Tower and the Reel Cinema at The Dubai Marina Mall
• Reel Cinema 22 Screen Cineplex (the largest and No. 1 cinema in Dubai based on admissions)
• SEGA Republic (76,000 Sqft indoor theme park)
• Indoor Aquarium and Olympic size Ice Rink
• Kidzania (children’s entertainment facility), and
• The Gourmet Tower and the Reel Cinema at The Dubai Marina Mall28

© Emaar 2011
Dubai Mall Footfall Trend
29
1.74
2.27
2.78
3.42
4.15
3.753.57
4.174.47
0.00
0.50
1.00
1.50
2.00
2.50
3.00
3.50
4.00
4.50
5.00
Q1 -
2009
Q2 -
2009
Q3 -
2009
Q4 -
2009
Q1 -
2010
Q2 -
2010
Q3 -
2010
Q4 -
2010
Q1 -
2011
No
. o
f V
isit
ors
in
millio
n
Dubai Mall Average Monthly Footfall

© Emaar 2011
At The Top Footfall Trend
30
97
246219
348
384
0
50
100
150
200
250
300
350
400
450
Q1 - 2010 Q2 - 2010 Q3 - 2010 Q4 - 2010 Q1-2011
No
. o
f V
isit
ors
in
th
ou
sa
nd
s
At The Top - Footfall
© Emaar 2011
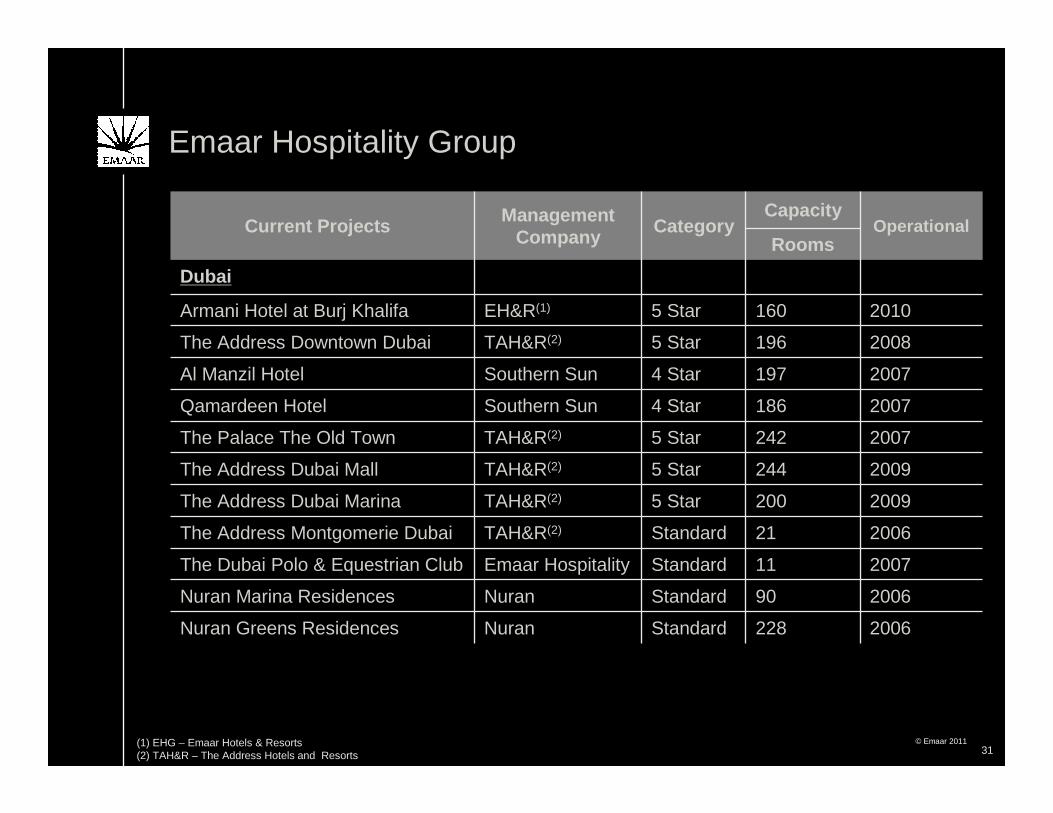
Current Projects Management Company
CategoryCapacity
OperationalRooms
Dubai
Armani Hotel at Burj Khalifa EH&R(1) 5 Star 160 2010
The Address Downtown Dubai TAH&R(2) 5 Star 196 2008
Al Manzil Hotel Southern Sun 4 Star 197 2007
Qamardeen Hotel Southern Sun 4 Star 186 2007
The Palace The Old Town TAH&R(2) 5 Star 242 2007
The Address Dubai Mall TAH&R(2) 5 Star 244 2009
The Address Dubai Marina TAH&R(2) 5 Star 200 2009
The Address Montgomerie Dubai TAH&R(2) Standard 21 2006
The Dubai Polo & Equestrian Club Emaar Hospitality Standard 11 2007
Nuran Marina Residences Nuran Standard 90 2006
Nuran Greens Residences Nuran Standard 228 2006
(1) EHG – Emaar Hotels & Resorts(2) TAH&R – The Address Hotels and Resorts
Emaar Hospitality Group
31

© Emaar 2011
The Address Downtown
The PalaceThe Address Dubai Mall
The Address Dubai Marina
Al Manzil Qamardeen
No of rooms - YTD 17,640 21.780 21,960 18,000 17,730 16,740
Occ% 96% 90% 90% 80% 89% 83%
ADR 1,535 1,216 1,297 933 718 618
Revpar 1,472 1,100 1,173 744 639 512
Room Revenue 25,963 23,964 25,753 13,386 11,334 8,578
All above figures are in AED and exclude tax/service charge
Emaar Hospitality Group
The AddressDowntown
The PalaceThe AddressDubai Mall
The Address Dubai Marina
Al Manzil Qamardeen
No of rooms - YTD 71,540 88,330 89,060 73,000 71,905 67,890
Occ% 86% 77% 79% 62% 76% 70%
ADR 1,296 1,059 1,116 749 628 531
Revpar 1,112 819 884 463 475 369
Room Revenue 79,587 72,357 78,706 33,831 34,183 25,075
All above figures are in AED and exclude tax/service charge
YTD March 2011
FY 2010
32
© Emaar 2011
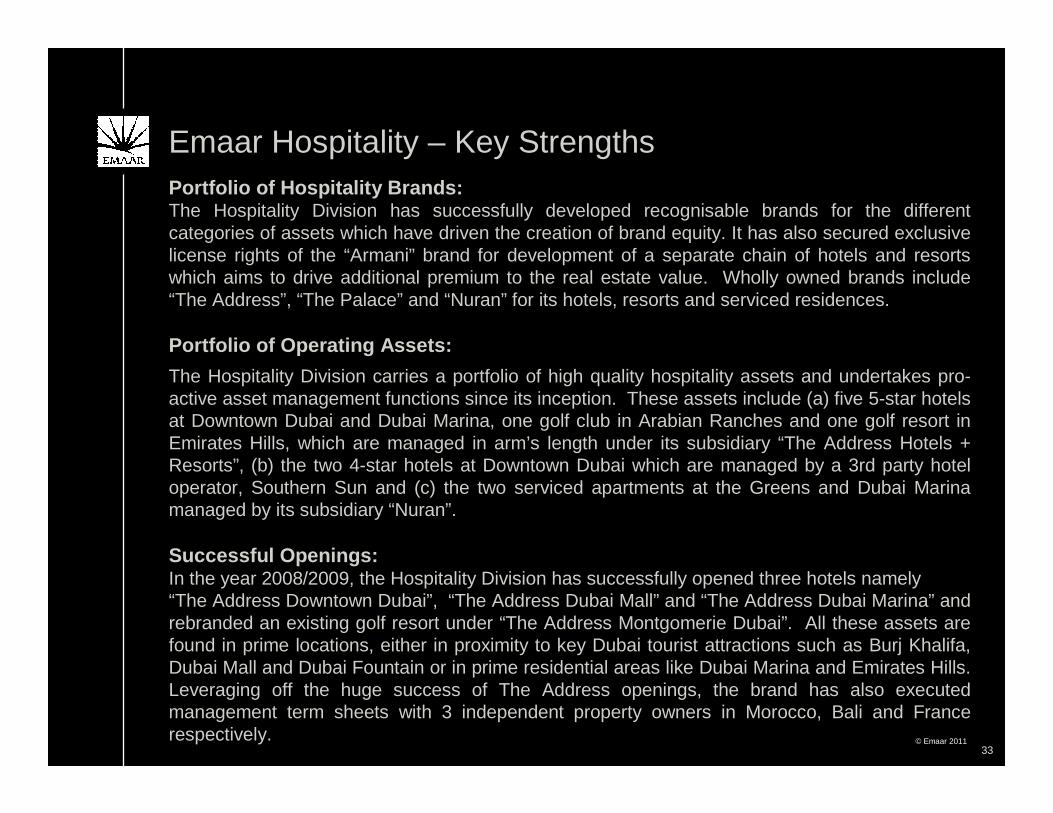
Emaar Hospitality – Key Strengths Portfolio of Hospitality Brands: The Hospitality Division has successfully developed recognisable brands for the different categories of assets which have driven the creation of brand equity. It has also secured exclusive license rights of the “Armani” brand for development of a separate chain of hotels and resortswhich aims to drive additional premium to the real estate value. Wholly owned brands include “The Address”, “The Palace” and “Nuran” for its hotels, resorts and serviced residences.
Portfolio of Operating Assets:
The Hospitality Division carries a portfolio of high quality hospitality assets and undertakes pro-active asset management functions since its inception. These assets include (a) five 5-star hotels at Downtown Dubai and Dubai Marina, one golf club in Arabian Ranches and one golf resort in Emirates Hills, which are managed in arm’s length under its subsidiary “The Address Hotels + Resorts”, (b) the two 4-star hotels at Downtown Dubai which are managed by a 3rd party hotel operator, Southern Sun and (c) the two serviced apartments at the Greens and Dubai Marina managed by its subsidiary “Nuran”.
Successful Openings:In the year 2008/2009, the Hospitality Division has successfully opened three hotels namely “The Address Downtown Dubai”, “The Address Dubai Mall” and “The Address Dubai Marina” and rebranded an existing golf resort under “The Address Montgomerie Dubai”. All these assets are found in prime locations, either in proximity to key Dubai tourist attractions such as Burj Khalifa, Dubai Mall and Dubai Fountain or in prime residential areas like Dubai Marina and Emirates Hills. Leveraging off the huge success of The Address openings, the brand has also executed management term sheets with 3 independent property owners in Morocco, Bali and France respectively.
Portfolio of Hospitality Brands: The Hospitality Division has successfully developed recognisable brands for the different categories of assets which have driven the creation of brand equity. It has also secured exclusive license rights of the “Armani” brand for development of a separate chain of hotels and resortswhich aims to drive additional premium to the real estate value. Wholly owned brands include “The Address”, “The Palace” and “Nuran” for its hotels, resorts and serviced residences.
Portfolio of Operating Assets:
The Hospitality Division carries a portfolio of high quality hospitality assets and undertakes pro-active asset management functions since its inception. These assets include (a) five 5-star hotels at Downtown Dubai and Dubai Marina, one golf club in Arabian Ranches and one golf resort in Emirates Hills, which are managed in arm’s length under its subsidiary “The Address Hotels + Resorts”, (b) the two 4-star hotels at Downtown Dubai which are managed by a 3rd party hotel operator, Southern Sun and (c) the two serviced apartments at the Greens and Dubai Marina managed by its subsidiary “Nuran”.
Successful Openings:In the year 2008/2009, the Hospitality Division has successfully opened three hotels namely “The Address Downtown Dubai”, “The Address Dubai Mall” and “The Address Dubai Marina” and rebranded an existing golf resort under “The Address Montgomerie Dubai”. All these assets are found in prime locations, either in proximity to key Dubai tourist attractions such as Burj Khalifa, Dubai Mall and Dubai Fountain or in prime residential areas like Dubai Marina and Emirates Hills. Leveraging off the huge success of The Address openings, the brand has also executed management term sheets with 3 independent property owners in Morocco, Bali and France respectively.
33

© Emaar 2011
Emaar Hospitality – Key Strengths (Cont’)High Margin Lease Income:
The operations of Nuran Serviced Apartments have generated regular, high margin annuity income from low maintenance prime assets in Dubai. Occupancy levels have averaged about 69% in 2010 between both properties achieving an EBITDA totalling AED19m with an implied yield of 19% on Net Book Value and they have achieved investment payback in 2010.
Key Leisure Assets:
Hospitality Division also manages multiple leisure assets across Dubai complementing the residential lifestyle offering under Emaar Properties, including 2 golf clubs, 5 health clubs, a Polo & Equestrian Club and a Yacht Club. These leisure businesses whose customer base is largely Dubai residents provided a well balanced exposure for the group since the hospitality assets are targeted at mostly transient visitors to Dubai, thus further diversifying Emaar income streams.
Armani Hotel Launch:
The first Armani branded hotel opened in Dubai in April 2010. The asset is located within Burj Khalifa and is furnished with bespoke designs from the Armani / Casa home furnishings collection and exclusive F&B outlets. Further Armani Hotels & Resorts will be launched going forward in this collaboration with Giorgio Armani.
High Margin Lease Income:
The operations of Nuran Serviced Apartments have generated regular, high margin annuity income from low maintenance prime assets in Dubai. Occupancy levels have averaged about 69% in 2010 between both properties achieving an EBITDA totalling AED19m with an implied yield of 19% on Net Book Value and they have achieved investment payback in 2010.
Key Leisure Assets:
Hospitality Division also manages multiple leisure assets across Dubai complementing the residential lifestyle offering under Emaar Properties, including 2 golf clubs, 5 health clubs, a Polo & Equestrian Club and a Yacht Club. These leisure businesses whose customer base is largely Dubai residents provided a well balanced exposure for the group since the hospitality assets are targeted at mostly transient visitors to Dubai, thus further diversifying Emaar income streams.
Armani Hotel Launch:
The first Armani branded hotel opened in Dubai in April 2010. The asset is located within Burj Khalifa and is furnished with bespoke designs from the Armani / Casa home furnishings collection and exclusive F&B outlets. Further Armani Hotels & Resorts will be launched going forward in this collaboration with Giorgio Armani.
34

© Emaar 2011
FINANCIAL HIGHLIGHTS
35
© Emaar 2011
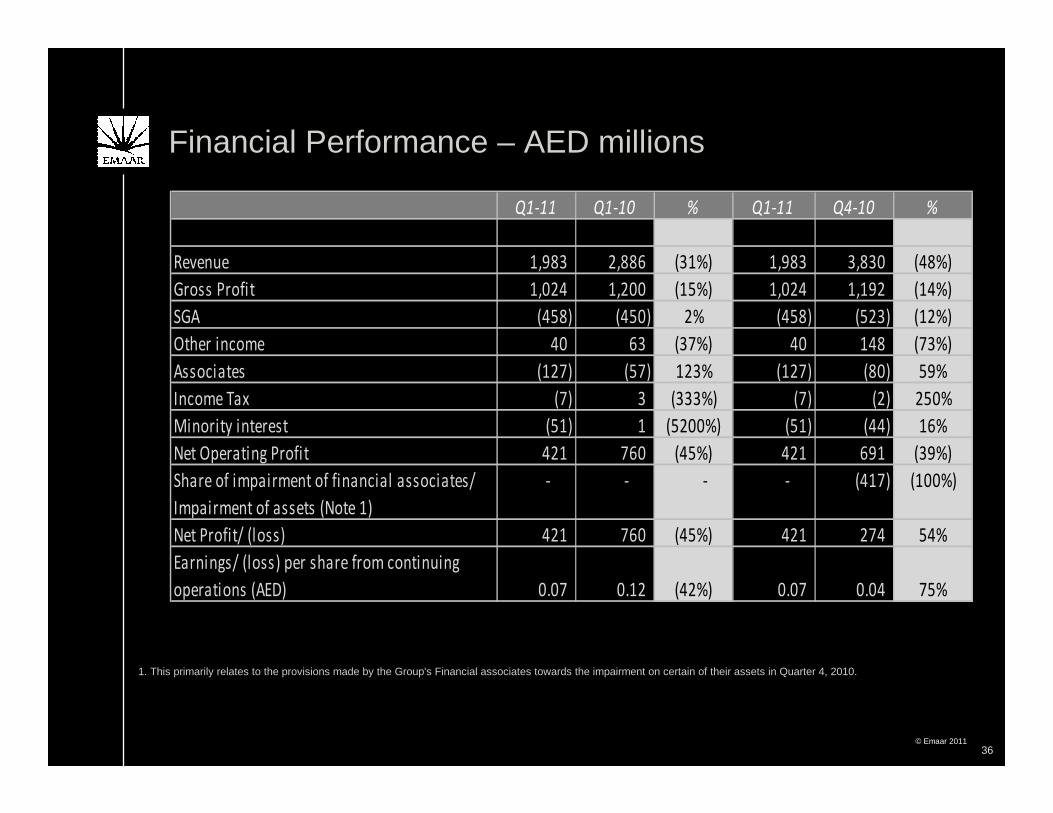
Financial Performance – AED millions
1. This primarily relates to the provisions made by the Group's Financial associates towards the impairment on certain of their assets in Quarter 4, 2010.
36
Q1-11 Q1-10 % Q1-11 Q4-10 %
Revenue 1,983 2,886 (31%) 1,983 3,830 (48%)
Gross Profit 1,024 1,200 (15%) 1,024 1,192 (14%)
SGA (458) (450) 2% (458) (523) (12%)
Other income 40 63 (37%) 40 148 (73%)
Associates (127) (57) 123% (127) (80) 59%
Income Tax (7) 3 (333%) (7) (2) 250%
Minority interest (51) 1 (5200%) (51) (44) 16%
Net Operating Profit 421 760 (45%) 421 691 (39%)
Share of impairment of financial associates/
Impairment of assets (Note 1)
- - - - (417) (100%)
Net Profit/ (loss) 421 760 (45%) 421 274 54%
Earnings/ (loss) per share from continuing
operations (AED) 0.07 0.12 (42%) 0.07 0.04 75%

© Emaar 2011
Financial Performance – AED millions
1.The impact relating to disposal of subsidiary primarily relates to the exchange differences resulting from transfer of rights to operate the estate agency and property services business in United Kingdom (UK), Europe and Asia upon disposal of Group's share in its UK Subsidiary, Hamptons Group Limited. 2.This primarily relates to the provisions made by the Group's Financial associates towards the impairment on certain of their assets in Quarter 4 in 2010.
37
Q4-10 Q3-10 % Q4-10 Q4-09 % 2010 2009 %
Revenue 3,830 2,782 38% 3,830 2,984 28% 12,150 8,413 44%
Gross Profit 1,192 1,030 16% 1,192 1,424 (16%) 4,546 4,100 11%
SGA (523) (446) 17% (523) (544) (4%) (1,918) (1,911) -
Other income 148 118 25% 148 117 26% 635 455 40%
Associates (80) (20) 300% (80) (87) (8%) (199) (380) (48%)
Income Tax (2) (2) - (2) 13 (115%) (1) 23 (104%)
Minority interest (44) 7 - (44) - - (29) 37 (178%)
Net Operating Profit 691 687 1% 691 923 (25%) 3,034 2,324 31%
Loss on disposal of subsidiary (Note 1) - - - - - - (53) - -
Impairment and provisions relating to Group's
Financial associate discontinued operations
(Note 2)
(417) (75) 456% (417) (203) 105% (533) (1,997) (73%)
Net Profit/ (loss) 274 612 (55%) 274 720 (62%) 2,448 327 649%
Earnings/ (loss) per share from continuing
operations (AED) 0.04 0.10 (60%) 0.04 0.12 (67%) 0.40 0.34 18%
Earnings/ (loss) per share from discontinued
operations (AED) - - - - - - - (0.29) -
© Emaar 2011
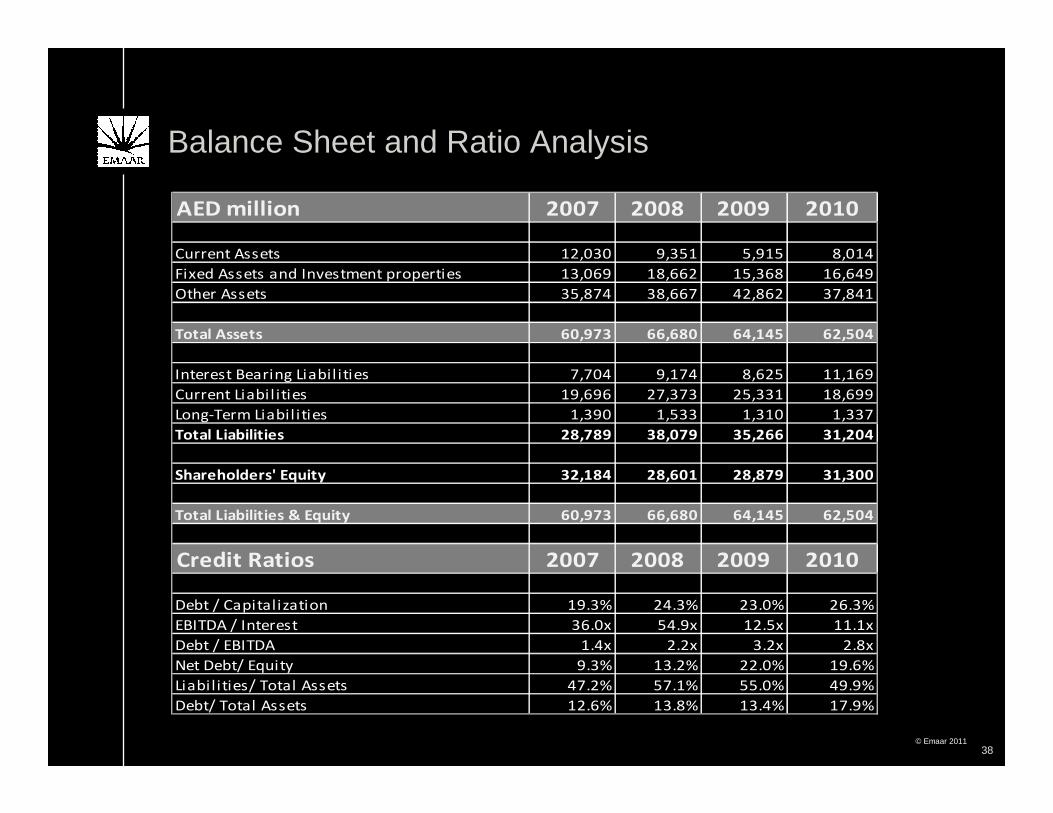
Balance Sheet and Ratio Analysis
38
AED million 2007 2008 2009 2010
Current Assets 12,030 9,351 5,915 8,014
Fixed Assets and Investment properties 13,069 18,662 15,368 16,649
Other Assets 35,874 38,667 42,862 37,841
Total Assets 60,973 66,680 64,145 62,504
Interest Bearing Liabil ities 7,704 9,174 8,625 11,169
Current Liabil ities 19,696 27,373 25,331 18,699
Long-Term Liabil ities 1,390 1,533 1,310 1,337
Total Liabilities 28,789 38,079 35,266 31,204
Shareholders' Equity 32,184 28,601 28,879 31,300
Total Liabilities & Equity 60,973 66,680 64,145 62,504
Credit Ratios 2007 2008 2009 2010
Debt / Capitalization 19.3% 24.3% 23.0% 26.3%
EBITDA / Interest 36.0x 54.9x 12.5x 11.1x
Debt / EBITDA 1.4x 2.2x 3.2x 2.8x
Net Debt/ Equity 9.3% 13.2% 22.0% 19.6%
Liabilities/ Total Assets 47.2% 57.1% 55.0% 49.9%
Debt/ Total Assets 12.6% 13.8% 13.4% 17.9%

© Emaar 2011
THANK YOU
39
© Emaar 2011
APPENDIX
40

© Emaar 2011
Country Current
UAE* 20.92
Kingdom of Saudi Arabia 172.76
Morocco 16.23
Egypt 14.73
Pakistan 6.51
Syria 0.30
Turkey 1.86
Jordan 1.75
USA & Canada 3.00
Lebanon 0.65
Land area in millions sqm
Land Bank (including associates)
• Includes 6.5 million sq. mtr. of land in Bawadi development on which the Emaar’s JV with Bawadi has sole development rights. Emaar owns 50% shares in the JV. India land bank details have been removed as company has filed Draft Red Herring Prospectus with Securities and Exchange Board of India.
• As of June 2011 41

© Emaar 2011
Principal of a large construction co. (Giga)Government authority
One of India's largest real estate developers
Morocco
Pakistan
ONA Group
Haji RafiqDefense Housing Authority
Leading real estate company in Saudi Arabia
Morocco's largest conglomerate
Government backed fund
Strategic JV with elite group of Syrian
Jordan
Syria
King Abdullah II Fund for Development
Invest Group Overseas
Saudi Arabia
India
Al Oula
MGF
SAGIA Government authority
CountryCountry PartnerPartner BackgroundBackground
Strong and Influential Strategic
with influential shareholderswith influential shareholders
business leadersbusiness leaders
42

© Emaar 2011
Board of DirectorsChairman: Mohamed Ali Alabbar
Vice Chairman: Hussain Al QemziManaging Director: Ahmad Al Matrooshi
Low PingCEO
Amit Jain
Group CFOIssam Galadari
CEO Emaar Dubai
Ayman HamdyCompany Secretary
& Director Legal
Other Businesses
Nasser Rafi – CEO Malls
Arif Amiri – CEO Retail
Patrick Heuze – CEO Hospitality and
Emaar Hotels & Resorts
The above is only the key people at the group level, kindly refer to our website www.emaar.com for full management structure and profiles.
Experienced & Highly Qualified Management Team
Naaman AtallahCOO Emaar Dubai
Sergio Casari
CEO International
43

© Emaar 2011
EMAAR PROPERTIES
PJSC
KSA - EEC 30.50%
MGF-India 45%
Syria 60%
Turkey 100%
Canada 100%
Lebanon 60%
Turner Int’l ME 50%
MENA Hamptons 100%
HOTELS & RESORTS
100%
HOSPITALITY 100%
MALLS 100%
Industries & Investments
40%
EMAAR INTERNATIONAL
EMAAR INVESTMENTS
KSA - EME 61%
Emaar Pakistan 67%
APIC-India 74%
JV with Bawadi50%
EMAAR DUBAIProperty
Development Projects - 100%
Group Structure
Emrill Services 33.33%
District Cooling 100%
Capital Partner 100%
Emaar Utilities 100%
Emaar America 100%
Dead Sea Co. of Tourism 37.2%
Amlak 48.08%
Dubai Mall 100%
Emaar Retail 100%
Int’l Malls 100%
Reel Cinema 100%
Giorgio Armani Hotels 100%
Misr - Egypt 100%
Int’l Jordan 100%
Emaar OnaparJV ( Morocco)
50%
44
Nuran LLC 100%
The Address Hotels 100%
Emaar Hotel Management
100%
Emaar Leisure Group 100%
Emaar Int’l Hospitality
100%Morocco T,S&O
100%

© Emaar 2011
2011•Middle East Spa Awards 2011 - Best Hotel Spa, The Spa at The Palace – The Old Town, Downtown Dubai•Middle East Spa Awards 2011 • First runner-up Best Signature Body Treatment, The Address Dubai Mall, Downtown Dubai•Middle East Spa Awards 2011 • First runner-up Best Signature Facial Treatment, The Spa, The Address Downtown Dubai, and The Spa at The Address Dubai Marina•ISO 9001: 2008 certification • Quality Management Emaar Community Management
2010•Euromoney Best Developer in the UAE•Euromoney Top Honours - Best Developer of Residential and mix-use projects in the UAE and Turkey•Arabian Property Awards, The Address Dubai Mall- Best Hotel Construction and Design•Arabian Property Awards, The Address Montgomerie, Best Golf Course in Dubai
2009•Euromoney Best Developer in the Middle East and North Africa•Euromoney Top Laurels – Best developer in the UAE and Best developer in Saudi Arabia•Middle East Business Global Competitiveness Excellence Award and the Mohammed Bin Rashid Al Maktoum Business Award (MRM Award)
2008•Emaar Turkey receives ISO 9001:2000 quality certification•Emaar Properties wins MRM awards in Real Estate Development Category
Awards
45

© Emaar 2011
Emaar Properties PJSC, for themselves and for Emaar Group, give notice that:The particulars of this presentation do not constitute any part of an offer or a contract.
Given that the presentation contains information based on forecasts and roll outs, all statements contained in this presentation are made without responsibility on the part of Emaar Properties PJSC, their advisors, or members of Emaar Group (including their directors, officers and employees).
None of the statements contained in this presentation is to be relied upon as a statement or representation of fact.
All parties must satisfy themselves as to the correctness of each of the statements contained in this presentation.
Emaar Properties PJSC and members of the Emaar Group do not make or give, and neither members of the Emaar Group nor any of their directors or officers or persons in their employment or advisors has any authority to make or give, any representation or warranty whatsoever in relation to this presentation.
This presentation may not be stored, copied, distributed, transmitted, retransmitted or reproduced, in whole or in part, in any form or medium without the permission of Emaar Properties PJSC.
Disclaimer
46

© Emaar 2011
Thank You
www.emaar.com
47


![[TRANSLATION FROM ARABIC] Emaar Properties PJSC Corporate ...](https://static.documents.pub/doc/80x56/61f0e875ec66ee0e72497ec3/translation-from-arabic-emaar-properties-pjsc-corporate-.jpg)

