+ All Categories
Home > Documents > EMBARGOED_Complete August 2nd, 2011 NYC NY1-Marist Poll Release and Tables

EMBARGOED_Complete August 2nd, 2011 NYC NY1-Marist Poll Release and Tables

Date post: 07-Apr-2018
Category:
Upload: michael-gareth-johnson
View: 221 times
Download: 0 times
Share this document with a friend
16
 Marist College Institute for Public Opinion Poughkeepsie, NY 12601 Phone 845.575.5050 Fax 845.575.5111 www.maristpoll.marist.edu NY1-Marist Poll Bloomberg’s Approval Rating Stagnates *** Complete Tables for Poll Appended *** EMBARGOED UNTIL 8 P.M. on Tuesday, August 2, 2011 Contact: Lee M. Miringoff Barbara L. Carvalho Mary E. Azzoli Marist College 845.575.5050 This NY1-Marist Poll Reports: New York City Mayor Michael Bloomberg continues to struggle in the court of public opinion. Bloomberg’s job approval rating stands at 39% among registered voters citywide. And, while the mayor has improved on the issues of education and the budget, he still has a long way to go to win over the city’s electorate. A majority of voters -- 54% -- still disapprove of how Bloomberg is handling the city’s public schools. And, they are lukewarm about his handling of the city’s budget. Not surprisingly, 51% of voters also think New York City is headed in the wrong direction. Looking at the mayor’s job approval rating, almost four in ten registered voters in New York City -- 39% -- give Bloomberg positive marks. This includes 8% who think Bloomberg is doing an excellent job in o ffice and 31% who report he is doing a good one. Slightly more than one-third of voters -- 35% -- say he is doing a fair job while 23% believe he is performing poorly. Only 4% are unsure how to rate the mayor. When NY1-Marist last reported Bloomberg’s job approval rating in March, 40% praised the mayor. 38% marked him as “fair,” and 21% gave Bloomberg failing grades. At that time,  just 1% was unsure how to rate him. “Roughly one and a half years into his third term as mayor, it is not surprising that New Yorkers’ views of Bloomberg's job performance are pretty much set,” says Dr. Lee M. Miringoff, Director of The Marist College Institute for Public Opinion. There has been little change on this question among Democrats. 37% of Democrats in New York City now think Bloomberg is doing either an excellent or good job in o ffice. In late March, 41% held this view. Among Republicans, 39% currently give the mayor high marks. 44% shared this opinion in March. The news is somewhat better among n on-enrolled voters. More non-enrolled voters now believe the mayor is doing well in office. 40% of
Transcript

8/6/2019 EMBARGOED_Complete August 2nd, 2011 NYC NY1-Marist Poll Release and Tables

http://slidepdf.com/reader/full/embargoedcomplete-august-2nd-2011-nyc-ny1-marist-poll-release-and-tables 1/16


Marist College Institute for Public OpinionPoughkeepsie, NY 12601 Phone 845.575.5050 Fax 845.575.5111 www.maristpoll.marist.edu

NY1-Marist Pol l

Bloomberg’s Approval Rating Stagnates

*** Complete Tables for Poll Appended ***

EMBARGOED UNTIL 8 P.M. on Tuesday, August 2, 2011

Contact: Lee M. MiringoffBarbara L. CarvalhoMary E. AzzoliMarist College845.575.5050

This NY1-Marist Poll Reports:

New York City Mayor Michael Bloomberg continues to struggle in the court of public opinion.

Bloomberg’s job approval rating stands at 39% among registered voters citywide. And,

while the mayor has improved on the issues of education and the budget, he still has a long

way to go to win over the city’s electorate. A majority of voters -- 54% -- still disapprove of

how Bloomberg is handling the city’s public schools. And, they are lukewarm about his

handling of the city’s budget. Not surprisingly, 51% of voters also think New York City is

headed in the wrong direction.

Looking at the mayor’s job approval rating, almost four in ten registered voters in New York

City -- 39% -- give Bloomberg positive marks. This includes 8% who think Bloomberg is

doing an excellent job in office and 31% who report he is doing a good one. Slightly morethan one-third of voters -- 35% -- say he is doing a fair job while 23% believe he is

performing poorly. Only 4% are unsure how to rate the mayor.

When NY1-Marist last reported Bloomberg’s job approval rating in March, 40% praised the

mayor. 38% marked him as “fair,” and 21% gave Bloomberg failing grades. At that time,

 just 1% was unsure how to rate him.

“Roughly one and a half years into his third term as mayor, it is not surprising that New

Yorkers’ views of Bloomberg's job performance are pretty much set,” says Dr. Lee M.

Miringoff, Director of The Marist College Institute for Public Opinion.

There has been little change on this question among Democrats. 37% of Democrats in New

York City now think Bloomberg is doing either an excellent or good job in office. In late

March, 41% held this view. Among Republicans, 39% currently give the mayor high marks.

44% shared this opinion in March. The news is somewhat better among non-enrolled

voters. More non-enrolled voters now believe the mayor is doing well in office. 40% of

8/6/2019 EMBARGOED_Complete August 2nd, 2011 NYC NY1-Marist Poll Release and Tables

http://slidepdf.com/reader/full/embargoedcomplete-august-2nd-2011-nyc-ny1-marist-poll-release-and-tables 2/16

Page 2 of 3

these voters give the mayor a “thumbs-up” while 32% did so in NY1-Marist’s previous

survey.

Throughout the five boroughs, Bloomberg’s job approval rating has remained mostly

consistent since the previous poll. A majority of voters in Manhattan -- 55% -- praise

Bloomberg’s time in office. In March, 59% thought this to be the case. In Queens andStaten Island, 37% approve of how the mayor is doing his job. This compares with 35%

who held this view in NY1-Marist’s previous survey. 32% of those in Brooklyn applaud

Bloomberg’s job performance while 35% did so a few months back. And, in the Bronx, 31%

currently give Bloomberg above average marks. In March, 36% did the same.

Better But Not Good Grades for Bloomberg’s Handling of Schools

A majority of registered voters in New York City -- 54% -- disapprove of how Mayor

Bloomberg is handling the city’s public schools. 36%, however, approve, and 10% are

unsure. Bloomberg has improved somewhat on this issue. In NY1-Marist’s previous survey,

prior to former New York City Schools Chancellor Cathie Black’s dismissal, 65%

disapproved of the mayor’s approach while 27% approved. Eight percent, at the time, were

unsure.

The perception of Bloomberg’s handling of education in New York City has improved

regardless of political party. 41% of Republicans, 38% of non-enrolled voters, and 35% of

Democrats now give the mayor a gold star when it comes to his handling of the public

schools while 36%, 30%, and 24%, respectively, held these views in March.

The Great Budgetary Divide 

When it comes to Bloomberg’s handling of the city’s budget, voters divide. 46% of

registered voters disapprove of how the mayor is addressing the issue while 43% approve.

11% are unsure.

Mayor Bloomberg has made some inroads with voters on this issue. A majority -- 56% --

disapproved of the mayor’s approach in NY1-Marist’s March survey. 38%, at that time,

approved, and 6% were unsure.

Democrats and non-enrolled voters are the key. 48% of Democrats and 39% of those not

enrolled in any party now disapprove of how Bloomberg is handling the city’s budget. In

March, 58% and 53%, respectively, shared this view. Among Republicans, a majority --

53% -- are dissatisfied with Mayor Bloomberg on this issue. This compares with 47% who

felt this way in March.

8/6/2019 EMBARGOED_Complete August 2nd, 2011 NYC NY1-Marist Poll Release and Tables

http://slidepdf.com/reader/full/embargoedcomplete-august-2nd-2011-nyc-ny1-marist-poll-release-and-tables 3/16

Page 3 of 3

Direction of New York City Still Off the Track, Says Majority  

A slim majority of New York City registered voters -- 51% -- thinks the city is moving in the

wrong direction. Four in ten -- 40% -- believe the Big Apple is traveling along the correct

path, and 9% are unsure.

Little has changed on this question since NY1-Marist’s March survey. At that time, 53%

reported New York City needed a new compass while 42% said the city’s trajectory was on

target. Five percent, then, were unsure.

Bloomberg’s Legacy Remains Intact

Despite Bloomberg’s mixed reviews, nearly four in ten voters -- 38% -- believe the mayor will

be remembered positively. Included here are 10% who think he will be remembered as one

of the city’s best mayors and 28% who report he will be thought of as an above average

mayor. 39% say his legacy will be about average. 12% believe his name will be

synonymous with a below average job, and 11% think Bloomberg will be remembered as

one of the worst mayors in New York City’s history.

Perceptions of Bloomberg’s legacy remain unchanged since March. In the previous poll,

39% reported Bloomberg will leave behind a positive legacy. 37% thought the mayor’s

contributions would be perceived as about average. 15% reported he would be recalled as

a below average leader, and one in ten -- 10% -- predicted Bloomberg would be perceived

as one of the city’s worst mayors.

8/6/2019 EMBARGOED_Complete August 2nd, 2011 NYC NY1-Marist Poll Release and Tables

http://slidepdf.com/reader/full/embargoedcomplete-august-2nd-2011-nyc-ny1-marist-poll-release-and-tables 4/16

How the Survey was Conducted

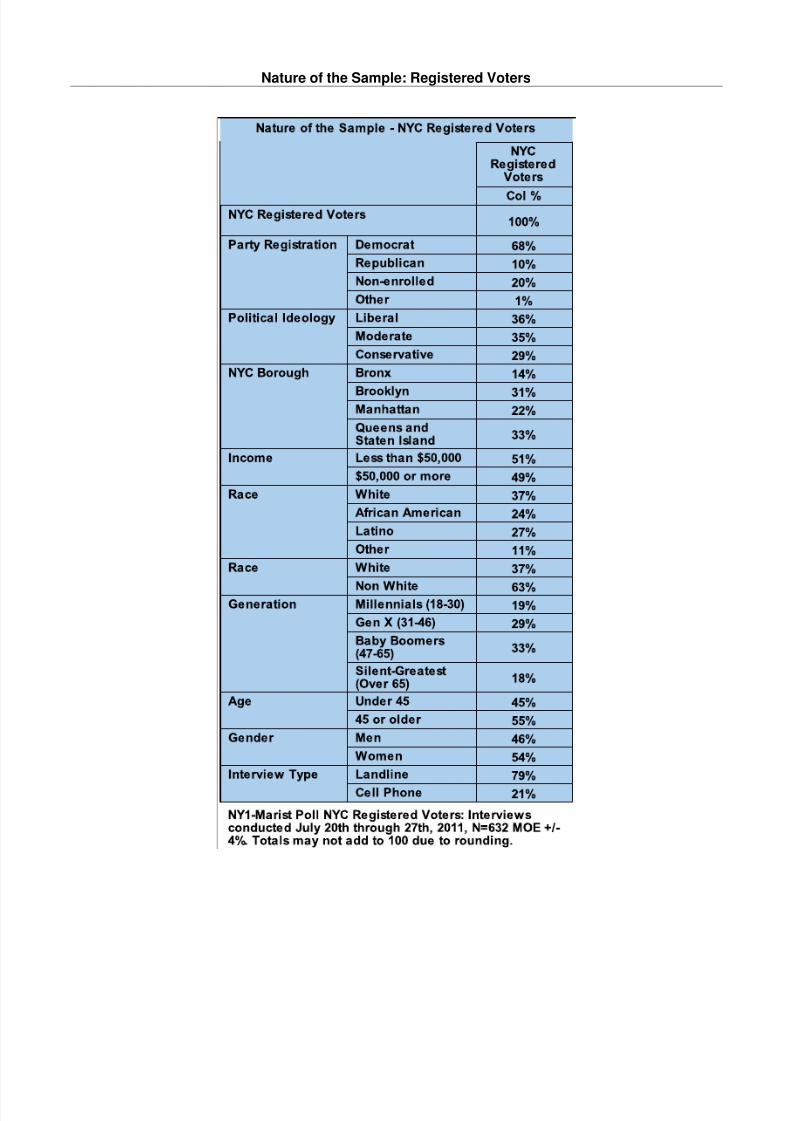
Nature of the Sample: New York City Poll of 808 Adults

This survey of 808 New York City adults was conducted on July 20 th, 2011 through July 27th, 2011.

Adults 18 years of age and older residing in the five boroughs of New York City were interviewed by

telephone. Telephone numbers were selected based upon a list of telephone exchanges fromthroughout the city. The exchanges were selected to ensure that each borough was represented in

proportion to its population. To increase coverage, this land-line sample was supplemented by

respondents reached through random dialing of cell phone numbers. The two samples were then

combined. Results are statistically significant within ±3.5 percentage points. There are 632 registered

voters. The results for this subset are statistically significant within ±4.0 percentage points. The error

margin increases for cross-tabulations.

8/6/2019 EMBARGOED_Complete August 2nd, 2011 NYC NY1-Marist Poll Release and Tables

http://slidepdf.com/reader/full/embargoedcomplete-august-2nd-2011-nyc-ny1-marist-poll-release-and-tables 5/16

Nature of the Sample: Adults

8/6/2019 EMBARGOED_Complete August 2nd, 2011 NYC NY1-Marist Poll Release and Tables

http://slidepdf.com/reader/full/embargoedcomplete-august-2nd-2011-nyc-ny1-marist-poll-release-and-tables 6/16

Nature of the Sample: Registered Voters

8/6/2019 EMBARGOED_Complete August 2nd, 2011 NYC NY1-Marist Poll Release and Tables

http://slidepdf.com/reader/full/embargoedcomplete-august-2nd-2011-nyc-ny1-marist-poll-release-and-tables 7/16

Mayor Michael Bloomberg Approval RatingAsked of NYC Registered Voters:  

Question Wording: Would you rate the job Mayor Michael Bloomberg is doing in office as

excellent, good, fair, or poor?

8/6/2019 EMBARGOED_Complete August 2nd, 2011 NYC NY1-Marist Poll Release and Tables

http://slidepdf.com/reader/full/embargoedcomplete-august-2nd-2011-nyc-ny1-marist-poll-release-and-tables 8/16

Mayor Michael Bloomberg Approval Rating Over TimeAsked of NYC Registered Voters:  

Question Wording: Would you rate the job Mayor Michael Bloomberg is doing in office as

excellent, good, fair, or poor?

New York City Registered Voters

Would you rate the job Mayor Michael Bloomberg is doing in office as excellent,

good, fair, or poor?

Excellent/Good Excellent Good Fair Poor Unsure

August 2011 39% 8% 31% 35% 23% 4%

March 2011 40% 9% 31% 38% 21% 1%

February 2011 44% 10% 34% 29% 26% 1%

January 6, 2011 37% 11% 26% 34% 26% 3%

October 20, 2010 50% 14% 36% 30% 15% 5%

September 10, 2010 49% 11% 38% 31% 18% 2%

August 10, 2010 49% 13% 36% 33% 16% 2%

April 13, 2010 56% 13% 43% 29% 13% 2%

October 30, 2009 54% 14% 40% 33% 12% 1%

October 22, 2009 58% 17% 41% 30% 11% 1%

September 21, 2009 59% 17% 42% 29% 11% 1%

July 8, 2009 58% 15% 43% 27% 13% 2%

May 13, 2009 59% 13% 46% 25% 14% 2%

February 20, 2009 52% 14% 38% 32% 15% 1%

November 2008 59% 21% 38% 28% 11% 2%

October 2008 68% 29% 39% 21% 11% <1%

February 2008 66% 22% 44% 25% 6% 3%

July 2007 66% 21% 45% 22% 8% 4%

March 2006 65% 20% 45% 24% 10% 1%

November 4, 2005 63% 17% 46% 28% 9% <1%

November 1, 2005 64% 19% 45% 28% 7% 1%

October 2005 65% 22% 43% 27% 7% 1%

September 2005 61% 15% 46% 30% 8% 1%

August 2005 53% 14% 39% 34% 12% 1%

July 2005 58% 15% 43% 27% 12% 3%

June 10, 2005 49% 11% 38% 35% 15% 1%

June 2, 2005 55% 12% 43% 32% 12% 1%

April 2005 48% 8% 40% 35% 16% 1%

March 2005 43% 8% 35% 34% 21% 2%

December 2004 46% 6% 40% 35% 18% 1%

September 2004 42% 7% 35% 35% 21% 2%

April 2004 40% 7% 33% 38% 19% 3%

March 2002 50% 8% 42% 29% 6% 15%

Marist Poll New York City Registered Voters

8/6/2019 EMBARGOED_Complete August 2nd, 2011 NYC NY1-Marist Poll Release and Tables

http://slidepdf.com/reader/full/embargoedcomplete-august-2nd-2011-nyc-ny1-marist-poll-release-and-tables 9/16


Bloomberg on Public SchoolsAsked of NYC Registered Voters:  

Question Wording: Do you approve or disapprove of how Mayor Michael Bloomberg is

handling the public schools?

8/6/2019 EMBARGOED_Complete August 2nd, 2011 NYC NY1-Marist Poll Release and Tables

http://slidepdf.com/reader/full/embargoedcomplete-august-2nd-2011-nyc-ny1-marist-poll-release-and-tables 10/16

Bloomberg on Public Schools Over TimeAsked of NYC Registered Voters:  

Question Wording: Do you approve or disapprove of how Mayor Michael Bloomberg is

handling the public schools?

New York City Registered Voters

Do you approve or disapprove of how

Mayor Michael Bloomberg is handling the

public schools?

Approve Disapprove Unsure

Row % Row % Row %

August 2011 36% 54% 10%

March 2011 27% 65% 8%

July 2009 53% 38% 9%

Marist Poll New York City Registered Voters

8/6/2019 EMBARGOED_Complete August 2nd, 2011 NYC NY1-Marist Poll Release and Tables

http://slidepdf.com/reader/full/embargoedcomplete-august-2nd-2011-nyc-ny1-marist-poll-release-and-tables 11/16

 Bloomberg on the City’s Budget

Asked of NYC Registered Voters:  

Question Wording: Do you approve or disapprove of how Mayor Michael Bloomberg is

handling the city’s budget?

8/6/2019 EMBARGOED_Complete August 2nd, 2011 NYC NY1-Marist Poll Release and Tables

http://slidepdf.com/reader/full/embargoedcomplete-august-2nd-2011-nyc-ny1-marist-poll-release-and-tables 12/16

Bloomberg on the City’s Budget Over TimeAsked of NYC Registered Voters:  

Question Wording: Do you approve or disapprove of how Mayor Michael Bloomberg ishandling the city’s budget?

New York City Registered Voters

Do you approve or disapprove of how Mayor

Michael Bloomberg is handling the city's

budget?

Approve Disapprove Unsure

Row % Row % Row %

August 2011 43% 46% 11%

March 2011 38% 56% 6%

July 2009 49% 41% 10%

Marist Poll New York City Registered Voters

8/6/2019 EMBARGOED_Complete August 2nd, 2011 NYC NY1-Marist Poll Release and Tables

http://slidepdf.com/reader/full/embargoedcomplete-august-2nd-2011-nyc-ny1-marist-poll-release-and-tables 13/16

 New York City Direction

Asked of NYC Registered Voters:  

Question Wording: In general, thinking about the way things are going in New York City, do

you feel things are going in the right direction or that things are going in the wrong direction?

8/6/2019 EMBARGOED_Complete August 2nd, 2011 NYC NY1-Marist Poll Release and Tables

http://slidepdf.com/reader/full/embargoedcomplete-august-2nd-2011-nyc-ny1-marist-poll-release-and-tables 14/16


New York City Direction Over TimeAsked of NYC Registered Voters:  

Question Wording: In general, thinking about the way things are going in New York City, do

you feel things are going in the right direction or that things are going in the wrong direction?

New York City Registered Voters

In general, thinking about the way things are going in New York

City, do you feel things are going in the right direction or that things

are going in the wrong direction?

Right

direction

Wrong

directionUnsure

August 2011 40% 51% 9%

March 2011 42% 53% 5%

February 2011 52% 44% 4%

January 6, 2011 38% 53% 9%

October 20, 2010 40% 47% 13%

September 10, 2010 46% 44% 10%

August 10, 2010 44% 47% 9%

April 27, 2010 41% 48% 11%

April 13, 2010 47% 45% 8%

October 30, 2009 56% 34% 10%

October 22, 2009 58% 33% 9%

September 21, 2009 54% 38% 8%

July 8, 2009 52% 38% 10%

May 13, 2009 53% 40% 7%

February 20, 2009 37% 49% 14%

November 2008 45% 47% 8%

March 2006 64% 30% 6%

November 4, 2005 69% 26% 5%

November 1, 2005 68% 23% 9%

October 2005 69% 23% 8%

September 2005 64% 28% 8%

August 2005 60% 31% 9%

July 2005 62% 29% 9%

June 2005 54% 37% 9%

December 2004 54% 41% 5%

September 2004 51% 43% 6%

Marist Poll New York City Registered Voters

8/6/2019 EMBARGOED_Complete August 2nd, 2011 NYC NY1-Marist Poll Release and Tables

http://slidepdf.com/reader/full/embargoedcomplete-august-2nd-2011-nyc-ny1-marist-poll-release-and-tables 15/16

Bloomberg’s LegacyAsked of NYC Registered Voters:  

Question Wording: When Michael Bloomberg finishes his third term as New York City mayor in

2013, do you think he will be remembered as one of the best mayors in New York City history,

above average, about average, below average, or as one of the worst mayors in New York

City’s history?

8/6/2019 EMBARGOED_Complete August 2nd, 2011 NYC NY1-Marist Poll Release and Tables

http://slidepdf.com/reader/full/embargoedcomplete-august-2nd-2011-nyc-ny1-marist-poll-release-and-tables 16/16

Bloomberg’s Legacy Over TimeAsked of NYC Registered Voters:  

Question Wording: When Michael Bloomberg finishes his third term as New York City mayor in

2013, do you think he will be remembered as one of the best mayors in New York City history,

above average, about average, below average, or as one of the worst mayors in New York

City’s history?

New York City Registered Voters

When Michael Bloomberg finishes his third term as

New York City mayor in 2013, do you think he will be

remembered as one of the best mayors in New York

City history, above average, about average, below

average, or as one of the worst mayors in New York

City's history?

One of the

best mayors

Above

average

About

average

Below

average

One of the

worst

mayors

Row % Row % Row % Row % Row %

August 2011 10% 28% 39% 12% 11%

March 2011 10% 29% 37% 15% 10%

January 6, 2011 12% 27% 35% 15% 10%

August 10, 2010 12% 34% 38% 11% 5%

Marist Poll New York City Registered Voters


Recommended