+ All Categories
Home > Documents > Embedded Linux Conference February 21st, 2017 … Linux Conference February 21st, 2017 Portland, ......

Embedded Linux Conference February 21st, 2017 … Linux Conference February 21st, 2017 Portland, ......

Date post: 08-May-2018
Category:
Upload: trinhthuy
View: 218 times
Download: 1 times
Share this document with a friend
32
Embedded Linux Conference February 21st, 2017 Portland, OR, USA About the Need to Power Instrument the Linux Kernel Patrick Titiano, System Power Management Expert, BayLibre co-founder. www.baylibre.com
Transcript

Embedded Linux ConferenceFebruary 21st, 2017Portland, OR, USA

About the Need to Power Instrument the Linux Kernel Patrick Titiano,System Power Management Expert,

BayLibre co-founder.www.baylibre.com

Today’s Special

§ Introduction

§ Power Instrumentation:

§ Why?

§ What’s needed?

§ What’s available?

§ What’s missing?

§ Conclusion & Next Steps

§ Q&A

Introduction

§ A major issue the Linux Community faces regarding power management is the lack of power data and instrumentation

§ Dev boards missing probe points

§ Power Measurement equipment expensive / not affordable for many developers,

§ Poor power data publicly available

§ This situation is not expected to change in the future

§ Believed that it is only of interest of a handful of developers, where actually everyone is concerned!

§ This is forcing ad hoc/custom techniques to be used over and over again.

§ Even if not much can be done on the HW side, power instrumenting the Linux Kernel with standard tooling could definitively help.

Power Instrumentation:Why?

Power Instrumentation: Purposes (1)

§ Holy grail #1: enable dynamic measurement (estimation) of the platform power consumption / battery life, without any power measurement circuitry

§ Any developer could debug power management on any board, with no need of a special (expensive) board

Power Instrumentation: Purposes (2)

§ Detect power leaks by dynamically monitoring (tracking) devices power state (Active / Idle / Disabled)

§ Unnecessary running clocks

§ Unnecessary running devices

§ Inadequate CPUFreq/CPUIdle states

§ CPU cores running too fast, low-power C-States not entered

§ Unnecessary powered-on regulators

§ …

Power Instrumentation: Purposes (3)

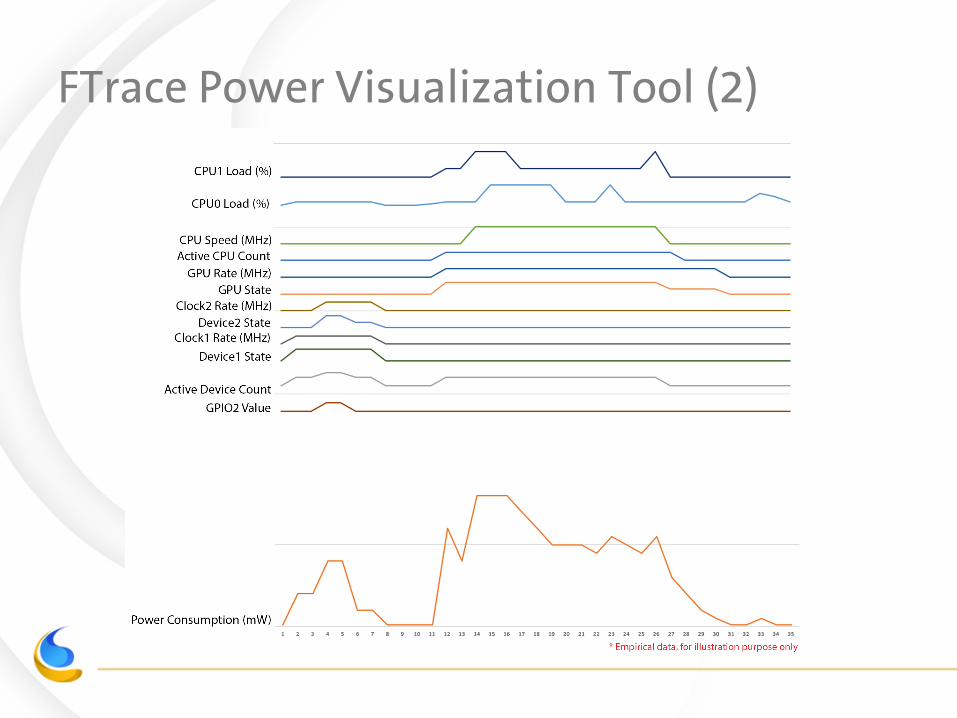
§ Capture system power trace, and post-process it to

§ Generate use-case power statistics,

§ Generate power charts

§ Enable more efficient power debugging

§ Enable power consumption regression tracking automation

§ Integrate Continuous Integration (CI) frameworks (KernelCI, PowerCI, fuego, …)

Power Instrumentation: Purposes (4)

§ Model nextgen platform power consumption

§ Applying power data of next SoC revision to an existing power trace

§ (… We could even imagine comparing platforms to platforms … 😉)

Power Instrumentation: Purposes (5)

§ Holy Grail #2: closed-loop power management policies

§ Prediction may be improved by measuring the “real” impact of heuristics decisions on platform power consumption

§ E.g. EAS (Energy-Aware Scheduler) platform knowledge could be extended beyond CPU cores

§ Could open the door to self-learning policies / IA / deep learning

§ No more need to fine-tune policies by hand, just let the policies learn the platform!

Power Instrumentation:What’s needed?

What’s needed? (1)

1. SW Power Probe points

§ Regulator / Clock / Power Domain / CPU Frequency / CPU Idle / device / GPIO / … power transitions

§ Timestamped

What’s needed? (2)

2. Power consumption data

§ How much power is consumed by a given device in a given power state

§ SoC internal peripherals (CPU, GPU, RAM, UART, I2C, SPI, GPIO, …)

§ E.g. UART devices consumes 5uW (*) when suspended, 100uW (*) when active

§ Platform peripherals (LCD display, wireless devices, flash devices, sensors, ...)

§ E.g. eMMC device consumes 500uW (*) when suspended, 40mW (*) when active

* Empirical data, for illustrative purpose only

What’s needed? (3)

3. Power Analysis Tools

§ Power trace plotting

§ Power trace statistics post-processing

§ Generic / Cross-platform Tools

§ Vendors already have some custom tools of their own, e.g.

§ Qualcomm’s Snapdragon Profiler (requires Android)

§ Google’s Android Systrace (may require Android too 😉)

Power Instrumentation:What’s available?

FTrace Power Events (1)

§ Kernel Probe Points

§ FTrace standard power events

§ RuntimePM events (idle/resume/suspend),

§ Clock Management events (enable/disable/set_rate),

§ CPU power management events (cpuidle/cpufreq/hotplug),

§ Suspend/Resume events,

§ Regulator events (enable/disable/set_voltage),

§ GPIO events (direction/value).

§ FTrace custom events

§ Specific for a given platform

FTrace Power Events (2)

§ To trace power events with FTrace

§ Enable CONFIG_FTRACE, CONFIG_DYNAMIC_FTRACE flags in kernel .config file

§ Mount debugfs

# mount -t debugfs nodev /sys/kernel/debug

§ Enable relevant events

# echo 1 > /sys/kernel/debug/tracing/events/power/enable

§ Empty trace buffer

# echo > /sys/kernel/debug/tracing/trace

§ Enable tracing

# echo 1 > /sys/kernel/debug/tracing/trace_on

§ Trace file /sys/kernel/debug/tracing/trace generated with enabled power events

* Note that debugfs interface is used for educational purpose here, but “trace-cmd” binary tool can be used.

FTrace Power Events (3)

§ Example of collected power trace

FTrace Power Events (4)

§ References:

§ https://www.kernel.org/doc/Documentation/trace/ftrace.txt

§ https://www.kernel.org/doc/Documentation/trace/events-power.txt

§ http://elinux.org/Ftrace

§ https://events.linuxfoundation.org/slides/2010/linuxcon_japan/linuxcon_jp2010_rostedt.pdf

Power Instrumentation:What’s missing?

Missing Power “Database” (1)

§ Power consumed by all devices of the platform, in any power state

§ Not much data published so far, whereas critical

§ Usually only battery lifetime for selected use-cases

§ Multi-platform database

§ Mandatory, to enable generic/standard tools

§ Example (empirical data, for illustrative purpose only)# cat […]/ftpwrdec/configs/arm64/arm/juno.pdb# This is a sample power database file, in a human-readable format.# Device power data format: name (as listed in ftrace), active_pwr (uW) suspended_pwr (uW)devA, 10000, 10devB, 1230000, 20# CPU power data format: cluster id (as listed in ftrace), cpu id (as listed in ftrace), [frequency (MHz), power (uW)] ...0, 0, [600, 300000], [900, 800000], [1200, 1200000]1, 0, [200, 100000], [300, 150000], [500, 200000]

§ Note Android already manages similar power database

§ power profile, defined in platform/frameworks/base/core/res/res/xml/power_profile.xml

Missing Power “Database” (2)

§ Device Tree could also be a candidate

§ Device Tree #1 purpose IS to describe the platform to the kernel,

§ Generic / Stable / Multi-platform,

§ Mandatory for new platforms, existing platforms progressively converted

§ « Just a single attribute » to be added to device attributes# cat arch/arm/boot/dts$ cat omap4-panda-common.dtsi/ {[…]&uart2 {

[…]active-power = <200>; /* [1] */suspended-power = <5>; /* [1] */

};&hdmi {

[…]active-power = <7000>; /* [1] */suspended-power = <30>; /* [1] */

};[…]

[1] Empirical data, for illustrative purpose only

Missing Power “Database” (3)

§ Power data in Device Tree could be reused by other Kernel components.

§ FTrace

§ E.g. power data added to the trace log

§ Kernel power management policies could reuse it

§ EAS (Energy-Aware Scheduler ) / Closed-loop heuristics / deep learning algorithms

§ Also accessible from userspace

§ /proc/device-tree/

§ Existing libraries to read DT attributes, e.g. https://github.com/jviki/dtree

§ But

§ Could be more difficult to maintain if part of the kernel

§ Longer review process

§ How would device tree maintainers test/validate the data?

FTrace « descrambling » tool (1)

§ Static trace analysis

1. Generate power statistics,

2. Reformat power trace for standard or dedicated plotting tools

§ Multi-platform

§ To handle custom power events and reuse power consumption database

§ Could be run directly on the platform or on a host machine

§ Very useful for automation / Continuous Integration /power regression tracking

§ Build servers automatically run target use-cases, capture trace, generate the analysis, and generate reports highlighting regressions

§ Power consumption issues could be automatically detected upfront

FTrace « descrambling » tool (2)

§ Example# ./ftpwrdec --plat=arm-juno mypowerftraceValid trace file found, descrambling it… done.|------------------------------------------------------------|| Statistics | Min | Max | Avg | Count || Power Consumption | 50mW | 2000mW | 530mW | || CPU Loads | | | | || CPU0 | 12% | 42% | 27% | || CPU1 | 05% | 35% | 20% | || CPU Idle Time | | | | || CPU0 | 10ms | 543ms | 121ms | || CPU1 | 44ms | 876ms | 465ms | || CPU Frequencies | | | | || CPU0 | 300MHz| 800MHz | | || CPU1 | 300MHz| 800MHz | | || CPU Frequency Changes | | | | 88 | | Active Devices | 05 | 10 | | || Device Power Transitions | | | | 69 || Active Clocks | 20 | 30 | | || Clock Transitions | | | | 50 ||[…] ||------------------------------------------------------------|’Mypowerftrace.xyz’ data plotting file generated.Done.#

FTrace Power Visualization Tool (1)

§ Static analysis of a trace is not sufficient

§ We need a visualization tool that could help us understand the dynamics of the system

§ Like kernelshark does for cpu processes

§ Plotting in a smart way power events together with the power consumption

§ Pointing a data point on the power consumption curve may highlight

§ Power consumption,

§ Current device power states,

§ Changes compared to previous data point,

§ ...

FTrace Power Visualization Tool (2)

FTrace Power Visualization Tool (2)

FTrace Power Visualization Tool (3)

Power Instrumentation:Conclusion & What’s Next?

Summary

§ Bright side:

§ Linux kernel has all infrastructure in place for power instrumentation

§ FTrace power / scheduling / performance / events

§ More relevant events may be relatively easy to be added

§ Tracing performance impact limited to RAM usage

§ Dark Side:

§ Missing power consumption data

§ Missing standard analysis/plotting userspace tools

Next Steps

§ Next Steps

1. Collect more feedback and interest from experts during ELC,

2. Define the power database (incl. device tree vs userspace DB),

• Probably the most difficult step as it will require a lot of experimentation, and support from vendors

3. Develop FTrace power events post-processing tool,

4. Develop power trace visualization tool, and…Make it the de-facto standard tool for power debugging 😉

Q & A

Thank you!


Recommended