VDC Research Group, Inc. | 679 Worcester Road, Suite 2 | Natick, MA 01760 USA | +1.508.653.9000 | www.vdcresearch.com ` Research Highlights: EMBEDDED SOFTWARE 2009 MARKET INTELLIGENCE SERVICE Selected Findings from the 2009 Embedded System Engineering Survey for Survey Participants VDC Research Group November 2009 All rights reserved
Transcript
VDC Research Group, Inc. | 679 Worcester Road, Suite 2 | Natick, MA 01760 USA | +1.508.653.9000 | www.vdcresearch.com
`
Research Highlights:
EMBEDDED SOFTWARE
2009 MARKET INTELLIGENCE SERVICE
Selected Findings from the 2009 Embedded System Engineering Survey for Survey Participants
MESSAGE TO OUR RESEARCH PARTICIPANTS Thank you for your participation in VDC’s embedded market research. We greatly appreciate you sharing your insights and requirements. We hope you find the following survey data of interest and look forward to hearing from you again in the course of our future research on the embedded market. METHODOLOGY To develop this report VDC employed the following methodology: An extensive survey was e-mailed to over 50,000 embedded systems engineers with the primary purpose of understanding the market’s interest, opinions, and trends. Developers surveyed include subscribers to eg3.com, Ganssle Group, EmbeddedGurus.net, LinkedIn Embedded Systems Groups, and Google and Yahoo discussion forums, as well as from VDC’s embedded developer panel. Entry into a drawing for an Amazon.com gift certificate was offered as an incentive to respond. VDC received over 780 interview responses. SUMMARY OF CONTENTS Included in this report are survey data relating to:
• Developer demographics • Current/Future Project requirements and trends
FOR MORE INFORMATION ON THE EMBEDDED MARKET
READ VDC’S EMBEDDED WEBLOG For updates on the latest embedded news visit: http://www.ontargetembedded.blogspot.com VISIT THE VDC WEBSITE Information on VDC’s embedded software practice is available at: http://www.vdcresearch.com COPYRIGHT 2009 – VDC RESEARCH GROUP All data in this research summary are proprietary to VDC Research and may not be distributed in reproduced form without prior permission of VDC Research.
FOR MORE INFORMATION ON THE EMBEDDED MARKET READ VDC’S EMBEDDED WEBLOG For the latest embedded news visit and register at: http://blog.vdcresearch.com/embedded_sw/ VISIT THE VDC WEBSITE Additional information on VDC’s embedded software practice is available at: http://www.vdcresearch.com
Survey Respondents Segmented by Geographic Sub-Region(Percent of Respondents)
North America 27.3% 781India/Pakistan/Bangladesh 34.7% 781Western Continental Europe (excluding Scandinavia) 9.2% 781UK and Ireland 4.7% 781Eastern Europe 3.1% 781Latin/South America 1.7% 781Africa 0.3% 781Middle East 4.6% 781Scandinavia 2.3% 781Japan/South Korea 0.5% 781Oceania 2.6% 781East Asia (excluding Japan, S. Korea, Oceania, India, Pakistan, Bangladesh) 6.0% 781Other Europe/Middle East/Africa 3.1% 781
Types of Company/organization for which Respondents Work(Percent of Respondents)
Embedded systems/device manufacturer 38.9% 781Software/tools vendor 5.8% 781Board vendor 2.2% 781Semiconductor supplier (e.g., Intel, Texas Instruments) 2.7% 781Semiconductor IP vendor (e.g., ARM, MIPS) 0.5% 781Engineering services company or systems integrator (e.g., Wipro) 15.9% 781Consultancy or independent consultant 10.6% 781Research/government institution 5.8% 781Academic institution 9.1% 781Other 8.6% 781
Note: Percentages sum to over 100% due to multiple responses.
Percent of Respondents' Time Spent in Different Tasks over the Course of the Current Project
Survey Respondents Segmented by the Target Industry/application of their Current Project
Estimate of the Number and Types of Full-time Engineers that are Working on Respondents' Current Projects
Page 3 of 10 VDC Research Group, Inc. | Copyright 2009
The Embedded Software Market Intelligence Program: 2009 Service YearEmbedded System Engineering Survey Data Highlights
Value N =
All Survey Respondents
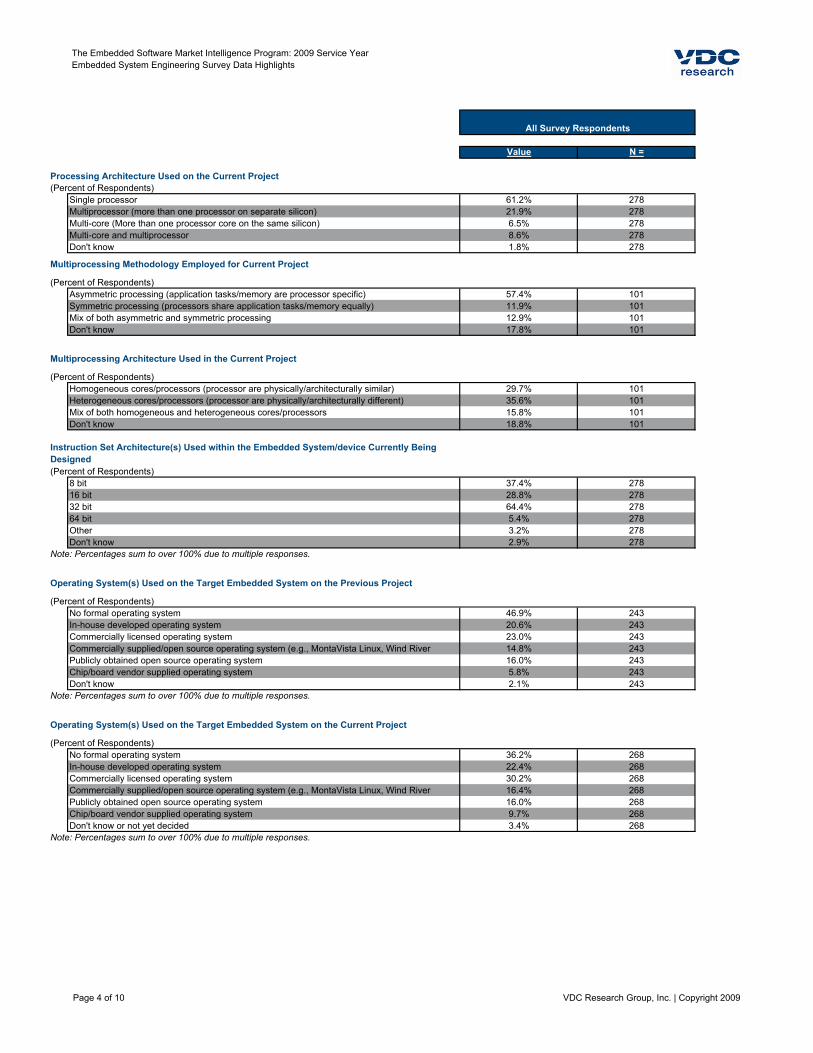
Processing Architecture Used on the Current Project(Percent of Respondents)
Single processor 61.2% 278Multiprocessor (more than one processor on separate silicon) 21.9% 278Multi-core (More than one processor core on the same silicon) 6.5% 278Multi-core and multiprocessor 8.6% 278Don't know 1.8% 278
(Percent of Respondents)Asymmetric processing (application tasks/memory are processor specific) 57.4% 101Symmetric processing (processors share application tasks/memory equally) 11.9% 101Mix of both asymmetric and symmetric processing 12.9% 101Don't know 17.8% 101
(Percent of Respondents)Homogeneous cores/processors (processor are physically/architecturally similar) 29.7% 101Heterogeneous cores/processors (processor are physically/architecturally different) 35.6% 101Mix of both homogeneous and heterogeneous cores/processors 15.8% 101Don't know 18.8% 101
(Percent of Respondents)8 bit 37.4% 27816 bit 28.8% 27832 bit 64.4% 27864 bit 5.4% 278Other 3.2% 278Don't know 2.9% 278
Note: Percentages sum to over 100% due to multiple responses.
(Percent of Respondents)No formal operating system 46.9% 243In-house developed operating system 20.6% 243Commercially licensed operating system 23.0% 243Commercially supplied/open source operating system (e.g., MontaVista Linux, Wind River 14.8% 243Publicly obtained open source operating system 16.0% 243Chip/board vendor supplied operating system 5.8% 243Don't know 2.1% 243
Note: Percentages sum to over 100% due to multiple responses.
(Percent of Respondents)No formal operating system 36.2% 268In-house developed operating system 22.4% 268Commercially licensed operating system 30.2% 268Commercially supplied/open source operating system (e.g., MontaVista Linux, Wind River 16.4% 268Publicly obtained open source operating system 16.0% 268Chip/board vendor supplied operating system 9.7% 268Don't know or not yet decided 3.4% 268
Note: Percentages sum to over 100% due to multiple responses.
Multiprocessing Architecture Used in the Current Project
Instruction Set Architecture(s) Used within the Embedded System/device Currently Being Designed
Operating System(s) Used on the Target Embedded System on the Previous Project
Operating System(s) Used on the Target Embedded System on the Current Project
Multiprocessing Methodology Employed for Current Project
Page 4 of 10 VDC Research Group, Inc. | Copyright 2009
The Embedded Software Market Intelligence Program: 2009 Service YearEmbedded System Engineering Survey Data Highlights
Value N =
All Survey Respondents
(Mean of Respondents, 1= Not at all important, 5 = Very important)Familiar programming interface 3.76 221Variety of microprocessors supported 3.32 213Availability of development tools 4.27 224Security 3.24 225Technical capabilities 4.21 219Real-time capabilities/performance 4.13 220Reliability/stability 4.58 217Small footprint 3.63 213Support for multi-core architectures 2.50 209Run-time royalty cost 3.99 208Overall cost 4.18 218Support for multiprocessing architectures 2.66 211Virtualization capabilities 2.30 205Size of developer community 3.19 216Bundled software components 3.36 214
Note: Percentages sum to over 100% due to multiple responses.
(Percent of Respondents)$0 (Free) 5.8% 398$1 to $999 14.8% 398$1,000 to $1,999 13.3% 398$2,000 to $2,999 4.3% 398$3,000 to $3,999 5.0% 398$4,000 to $4,999 8.0% 398$5,000 to $7,499 8.0% 398$7,500 to $9,999 4.8% 398$10,000 to $12,499 7.5% 398$12,500 to $14,999 2.3% 398$15,000 to $19,999 1.8% 398$20,000 to $24,999 3.0% 398$25,000 to $29,999 2.3% 398$30,000 to $39,999 2.5% 398$40,000 to $49,999 1.0% 398$50,000 to $59,999 3.0% 398$60,000 to $74,999 1.3% 398$75,000 to $99,999 1.5% 398$100,000 to $124,999 1.0% 398$125,000 to $149,999 0.3% 398$150,000 to $174,999 0.0% 398$175,000 to $199,999 0.0% 398$200,000 or more per developer per year 0.5% 398Don't know 8.0% 398
Expected Change in Respondents' Tool Budgets(Percent of Respondents)
Increase 30.8% 422Remain about the same 40.8% 422Decrease 13.3% 422Don't know 15.2% 422
(Average of Respondents)Mean 28.7% 221Weighted Mean (by number of lines of code) 16.7% 197Weighted (by project team size and tools budget) Annualized (by project length) Mean 17.2% 187Median 10.0% 221
Approximate Cost Budgeted for All of the Tools Respondents are Using on the Current Project
Expected Percent Increase (or Decrease) in the Total Lines of Software Code for the Next Project
Page 7 of 10 VDC Research Group, Inc. | Copyright 2009
The Embedded Software Market Intelligence Program: 2009 Service YearEmbedded System Engineering Survey Data Highlights
Note: Percentages sum to over 100% due to multiple responses.
Language(s) Used to Design Algorithms for Current Project
Language(s) Used to Describe IC/SoC Designs for Current Project
Language(s) Used to Develop Software for Current Project
Page 8 of 10 VDC Research Group, Inc. | Copyright 2009
The Embedded Software Market Intelligence Program: 2009 Service YearEmbedded System Engineering Survey Data Highlights
Value N =
All Survey Respondents
(Average of Respondents)Mean 15.2 448Median 12.0 448
(Percent of Respondents)More than 6 months ahead of schedule 3.7% 4933 to 6 months ahead of schedule 6.1% 4931 to 2 months ahead of schedule 4.7% 493On schedule 38.7% 4931-to 2 months behind schedule 20.3% 4933 to 6 months behind schedule 11.8% 493More than 6 months behind schedule 7.5% 493Don't know 7.3% 493
Age of Respondents(Average of Respondents)
Mean 37.6 390Median 36.0 390
(Average of Respondents)Mean 12.2 390Median 10.0 390
(Average of Respondents)Mean 4.1 392Median 3.0 392
Number of Years Working at Current Company(Average of Respondents)
Mean 5.9 390Median 4.0 390
(Percent of Respondents)Much better than last year 5.9% 393Better than last year 11.2% 393About the same as last year 21.6% 393Worse than last year 39.4% 393Much worse than last year 14.5% 393Don't know 7.4% 393
(Percent of Respondents)Staff layoffs 32.9% 386Across-the-board salary decrease 13.5% 386Hiring Freeze 42.0% 386Promotion/salary increase freeze 35.5% 386Non-labor related budget cuts 32.4% 386None of the above 22.3% 386Don't know 9.8% 386
Note: Percentages sum to over 100% due to multiple responses.
Number of Years Experience Designing Embedded Systems
Adherence to Schedule for Current project (or Best Estimate Upon Completion)
Estimate of the Total Project Length in Calendar Months (Actual Time from Initial Specification to Shipment)
Number of Projects on which Respondents are Currently Working (that Require 5% or more of their Work Time)
Description of the Health of the Current Engineering Job Market in the Country of Respondent
Cost Reduction Measures Conducted by Respondent's Company over the Past 6 Months
Page 9 of 10 VDC Research Group, Inc. | Copyright 2009
The Embedded Software Market Intelligence Program: 2009 Service YearEmbedded System Engineering Survey Data Highlights
Value N =
All Survey Respondents
(Percent of Respondents)Staff layoffs 21.2% 381Across-the-board salary decrease 8.3% 381Hiring Freeze 28.2% 381Promotion/salary increase freeze 25.1% 381Non-labor related budget cuts 24.1% 381None of the above 26.7% 381Don't know 20.7% 381
Note: Percentages sum to over 100% due to multiple responses.
(Mean of Respondents)Working at the office 74.9% 379Working from home 14.3% 379Working at a client site 7.4% 379Working on the road (conference, industry event, traveling, etc.) 3.3% 379
Annual Salary of Survey Respondents(Average of Respondents)
Mean $62,508 316Median $50,000 316
Percent of Time Spent in Different Work Environments
Expected Cost Reduction Measures by Respondent's Company over the Next 6 Months
Page 10 of 10 VDC Research Group, Inc. | Copyright 2009
FOR MORE INFORMATION ON THE EMBEDDED MARKET READ VDC’S EMBEDDED WEBLOG For the latest embedded news visit and register at: http://blog.vdcresearch.com/embedded_sw/ VISIT THE VDC WEBSITE Additional information on VDC’s embedded software practice is available at: http://www.vdcresearch.com