76
EMEFCY GROUP LIMITED ANNUAL REPORT FOR THE YEAR ENDED 31 DECEMBER 2016 For personal use only

EMEFCY GROUP LIMITED ANNUAL REPORT FOR THE YEAR ENDED 31 DECEMBER 2016F
or p
erso
nal u
se o
nly

For
per
sona
l use
onl
y

Emefcy Group LimitedABN 52 127 734 196
Annual reportfor the year ended 31 December 2016
For
per
sona
l use
onl
y
Emefcy Group Limited ABN 52 127 734 196
Annual report - 31 December 2016
ContentsPage
Corporate Directory 1Directors' Report 2
Auditor's Independence Declaration 27Financial Statements
Consolidated Statement of Profit or Loss and Other Comprehensive Income 28Consolidated Statement of Financial Position 29Consolidated Statement of Changes in Equity 30Consolidated Statement of Cash Flows 31
Notes to the Consolidated Financial Statements 32Directors' Declaration 63Independent Auditor's Report 64Shareholder information 68
For
per
sona
l use
onl
y
Emefcy Group LimitedCorporate directory
Directors Mr Richard IrvingExecutive Chairman
Mr Eytan LevyManaging Director & Chief Executive Officer (CEO)
Mr Ross HaghighatNon-Executive Director
Mr Peter MarksNon-Executive Director
Mr Robert Wale (appointed 5 April 2016)Non-Executive Director
Company Secretary Mr Ross Kennedy
Registered Office Suite 1, 1233 High StreetArmadale VIC 3143AustraliaPhone: +61 (0)3 9824 5254Fax: +61 (0)3 9822 7735
Principal Place of Business 7 Ha'eshel StreetCaesarea Industrial Park P.O. Box 3171 30889IsraelPhone: +972 4 6277555Fax: +972 4 6277556
Share Registry Boardroom Pty LtdLevel 12, 225 George Street,Sydney, New South Wales, 2000, AustraliaPhone: 1300 737 760 (local)Fax: +61 (0)2 9290 9600 (international)
Auditors BDO East Coast PartnershipTower 4, Level 18, 727 Collins Street,Melbourne, Victoria, 3008, Australia
Solicitors Hall & Wilcox LawyersLevel 11, Rialto South Tower, 525 Collins Street,Melbourne, Victoria, 3000, Australia
Bankers National Australia Bank (NAB)Melbourne, Victoria, Australia
Securities Quoted Australian Securities Exchange- Ordinary Fully Paid Shares (Code: EMC)
Website www.emefcy.com
Emefcy Group Limited 1
For
per
sona
l use
onl
y

Emefcy Group LimitedDirectors' Report31 December 2016
The directors present their report for the consolidated entity consisting of Emefcy Group Limited and the entities itcontrolled at the end of, or during, the year ended 31 December 2016. Throughout the report, the consolidatedentity is referred to as the Group.
Directors
The following persons held office as directors of Emefcy Group Limited during the financial year:
Mr Richard Irving, Executive ChairmanMr Eytan Levy, Managing Director & Chief Executive Officer (CEO)Mr Ross Haghighat, Non-Executive DirectorMr Peter Marks, Non-Executive DirectorMr Robert Wale, Non-Executive Director (appointed 5 April 2016)Mr Phillip Hains, Director (resigned 5 April 2016)
Principal activities
The Company's principal activities during the course of the financial year were:
• the research, development and commercialisation of innovative wastewater treatment systemsincorporating Membrane Aerated Biofilm Reactor ("MABR") based wastewater treatment technology foruse in decentralised settings;
• implementing the multi-faceted China strategy;• implementing the US strategy based on an initial Recycle as a Service ("RaaS") development phase and
appointment of regional manufacturing representatives;• developing the larger scale SUBRE product ready for field testing; and• progressing the Electrogenic Bio Reactor ("EBR") technology for potential use in certain industrial
wastewater applications.
Aside from the global commercialisation of the MABR based wastewater treatment technologies and thecommencement of activities to establish global manufacturing facilities in China, there were no other significantchanges in the nature of the Company's principal activities during the financial year.
Dividends
No dividends have been paid during the financial year. The directors do not recommend that a dividend be paidin respect of the financial year (2015: $nil).
Review of operations
1 Global Commercialisation
Management has presented the innovative MABR based technology at numerous international exhibitions andconferences throughout the year, including the prestigious WEFTEC conference held in New Orleans in the USA,as well as exhibitions in Europe, Australia and Asia.
Numerous delegations have been hosted at the Group’s Caesarea Israel offices, manufacturing facility andnearby in-field demonstration sites.
As a result of these efforts, regional sales capabilities have been established on four continents:
• Middle East (Israel);• Americas (US Virgin Islands, and a demonstration facility with Stanford University’s Codiga Resource RecoveryCenter);• Africa (Ethiopia); and• Asia (China).
Of all these markets, China offers the greatest near term growth opportunities. In February 2016, the ChineseCentral Government released its next Five Year Plan which includes Central Government funding to increase theproportion of remote Chinese villages with wastewater treatment from 10% to 70%.
Emefcy Group Limited 2
For
per
sona
l use
onl
y
Emefcy Group LimitedDirectors' Report31 December 2016(continued)
Review of operations (continued)
1 Global Commercialisation (continued)
The Company has entered into four strategic partnership distribution agreements in mainland China:
• Wuxi Municipal Design Institute, a subsidiary of Wuxi Guolian Environmental & Energy Group Co. Ltd. (“WuxiGuolian”), a leading state-owned enterprise wastewater treatment plant operator and provider of environmentalprotection services throughout Jiangsu, mainland China, and international markets.• Beijing Sinorichen Environmental Protection Corp. Ltd. (“Sinorichen”), a leading firm specialising in wastewatertreatment consulting and engineering services, throughout Beijing Province and Northern China;• Jiangsu Jinzi Environmental Technology Company, Ltd. (“Jinzi”), a leading environmental protection companyfocusing on the design, building and operation of wastewater treatment systems for rural communities in theCentral and Southern Provinces of China;• China Gezhouba Group Investment Holding Co., Ltd, ("CGGC INV"), a highly regarded global engineeringgroup, is considering the utilisation of up to 10,000 Membrane Aerated Biofilm Reactor (MABR) Modules in theHubei, Hebei, and Guangdong Provinces in rural China with initial projects under negotiation.
The next steps include the deployment of demonstration units to each of the distribution partners to confirm thetechnical performance capabilities of the Emefcy MABR technology under local conditions, assist in gainingprovincial certifications and promote the technology to potential customers.
The Company’s first commercial installation of the MABR wastewater treatment solution was successfullyinaugurated at Ha’Yogev, Israel on 19 September 2016.
Mr Wermus, CEO of the Yuvalei HaEmek municipality articulated his enthusiasm for Emefcy’s MABR solutionwhich, for the first time, enables the community of Ha'Yogev the benefit of a state of the art treatment of theirwaste water with very low energy operating costs, as well as the supply of ample treated water for theiragricultural irrigation needs. He further commented about Emefcy’s project having a range of unmatched keybenefits, including lower commissioning costs, superior environmental performance, lower ongoing operatingcosts than its competitors, as well as being neighbourhood friendly and built from long life components.
This new municipal MABR facility serves the rural farming community of 1,000 homes, agricultural fields as wellas local dairy needs. Its demographics are representative of hundreds of thousands of rural communitiesworldwide, especially in China, where under the current 5 Year plan, more than 110,000 such “off-grid”communities are currently seeking innovative, cost effective and decentralised wastewater treatment solutions.
On 27 January 2017, the official inauguration of the Group’s second MABR based wastewater treatmentinstallation took place at Bordeaux in St Thomas, US Virgin Islands.
Mr. James E. Grum, Chief Engineer of Virgin Islands Wastewater Management Authority, expressed hissatisfaction with the MABR solution and noted that it met every parameter originally declared in the initialspecifications provided in Emefcy's proposal. He added that Emefcy’s sweet spot is having a range of unmatchedkey benefits, including lower commissioning costs, low maintenance, superior environmental performance, lowenergy requirements, as well as being neighbourhood friendly.
For this project Emefcy partnered with SD&C Inc, who served as the general contractor for the project,responsible for installing and commissioning the plant.
Mr. Tony Adibe, CEO of SD&C said, "We are excited to have teamed up with Emefcy to deliver this innovativeand low energy wastewater treatment system to the US Virgin Islands. We look forward to this being a showcaseto address the ever-growing wastewater treatment and reuse needs of municipalities and resorts throughout theCaribbean Islands."
2 Product development
A number of significant product development milestones were achieved during the year.
The Company’s first commercial installation of the MABR wastewater treatment solution was successfullyinaugurated at Ha’Yogev, Israel on 19 September 2016.
Emefcy Group Limited 3
For
per
sona
l use
onl
y

Emefcy Group LimitedDirectors' Report31 December 2016(continued)
Review of operations (continued)
2 Product development (continued)
The Company is now manufacturing a more efficient and cost effective second generation MABR wastewatertreatment solution, incorporating a larger diameter spiral and improved product components.
Key benefits of the Emefcy MABR wastewater treatment solution include:
• Up to 90% lower energy costs than traditional biological process wastewater treatment and water reusesystems;• Neighbourhood friendly characteristics including significant reduced noise levels, smaller land footprint andvirtually no odour compared to traditional wastewater facilities;• Modular design is readily scaleable and deployable to remote locations; and• Being designed for decentralised systems, MABR has much lower capital expenditure requirements andoperation costs, when compared to traditional centralised systems.
A third generation, and more cost effective MABR wastewater treatment solution is being designed specifically formanufacture and deployment in China later this year.
An even larger scale version of the MABR based wastewater treatment solution called “SUBRE” has beendeveloped for deployment in existing municipal waste water treatment facilities - to substantially reduce theenergy costs of wastewater treatment, and with much more friendly neighbourhood characteristics - especiallywith much reduced noise and odour levels. A prototype is currently undergoing field tests ahead of potentialdeployment later in 2017. The SUBRE product is estimated to have significant worldwide potential sales.
Work is continuing on the Electrogenic Bio Reactor (“EBR”) technology with a dedicated development team. TheEBR has a laboratory pilot operating, and is planned to have a field pilot at the end of the year.
3 Manufacturing
The Group has made significant advances during the year in establishing manufacturing facilities at its Or’Akivasite in northern Israel. A full production team has been employed and QAQC systems implemented. Productionunits for sales, including demonstration units for China, are being manufactured at this facility.
As part of the integrated strategy for China, agreements have been entered into to establish a high volume,Group owned manufacturing facility in the Changzhou Industrial Park in Jiangsu Province on favourable terms.This facility is expected to be fully operational later in 2017.
Event since the end of the financial year
No other matter or circumstance has arisen since 31 December 2016 that has significantly affected, or maysignificantly affect the consolidated entity's operations, the results of those operations, or the consolidated entity'sstate of affairs in future financial years.
Likely developments and expected results of operations
The Group expects to continue to roll out the commercialisation of MABR wastewater treatment solutions with acontinuing focus on meeting the large market potential in China, and other developing countries. This includesthe establishment of a high volume manufacturing facility in Changzhou China, which currently is underway.
The Group is also refining the business model and identifying potential market opportunities for the operation andmaintenance of wastewater treatment solutions, and the offering of recycled water for reuse, referred to as“Reuse as a Service”.
Product development is also continuing, with the development of the third generation MABR wastewatertreatment solution for manufacture in China, further field tests and commercial deployment of SUBRE andon-going research and development of the EBR product.
Emefcy Group Limited 4
For
per
sona
l use
onl
y

Emefcy Group LimitedDirectors' Report31 December 2016(continued)
Information on directors
Richard Irving Executive Chairman
Qualifications B. Sc. (First class honours) in Electrical Engineering, Manchester University, UKM. Sc. Electrical Engineering, Manchester University, UK
Experience andexpertise
Richard is based in Silicon Valley, co-founded Pond Venture Partners in 1997 andbrings 30 years' experience in venture capital, business management, marketing andengineering with over 30 start-ups. Richard has participated in over $3B of IPOs,acquisitions, and private financings.Richard has worked in technology companies since 1982 including chip design atAT&T Bell Labs 1982-86, Marketing Dept Manager AMD 1986 - 1989, VP Graphics,Imaging & Multimedia at Brooktree 1990 - 1994 and has been self-employed at IrvingInternational (technology consulting 1989 & 1994 - 1997).Richard joined the Board of Emefcy Group Limited on 18 December 2015 in the roleof Executive Chairman.
Other currentdirectorships
None
Former directorshipsin last 3 years
None
Specialresponsibilities
Executive ChairmanMember of the Remuneration and Nomination Committee
Interest in shares Richard has an indirect interest through Pond Venture Nominees III Limited in28,944,080 shares in the Company.
Interest in options Direct interest in 500,000 employee options with an exercise price of 30 cents and500,000 employee options with an exercise price of 40 cents.
Contractual rights toshares
As noted above, Mr Irving has an indirect interest in Pond Venture Nominees IIILimited, which is one of the Vendors of Emefcy Limited (Israel). Pursuant to theEmefcy - Savcor Share Purchase Agreement dated 8 October 2015, Pond VentureNominees III Limited has an entitlement to Deferred Shares in the Company, subjectto defined milestones being met. The first milestone has already been satisfied,resulting in the issue of a further 7,314,692 shares in the Company during the 2016year. In the event of the second milestone being satisfied, Pond Venture Nominees IIILimited will be issued a further 7,320,499 shares in the Company.
Emefcy Group Limited 5
For
per
sona
l use
onl
y
Emefcy Group LimitedDirectors' Report31 December 2016(continued)
Information on directors (continued)
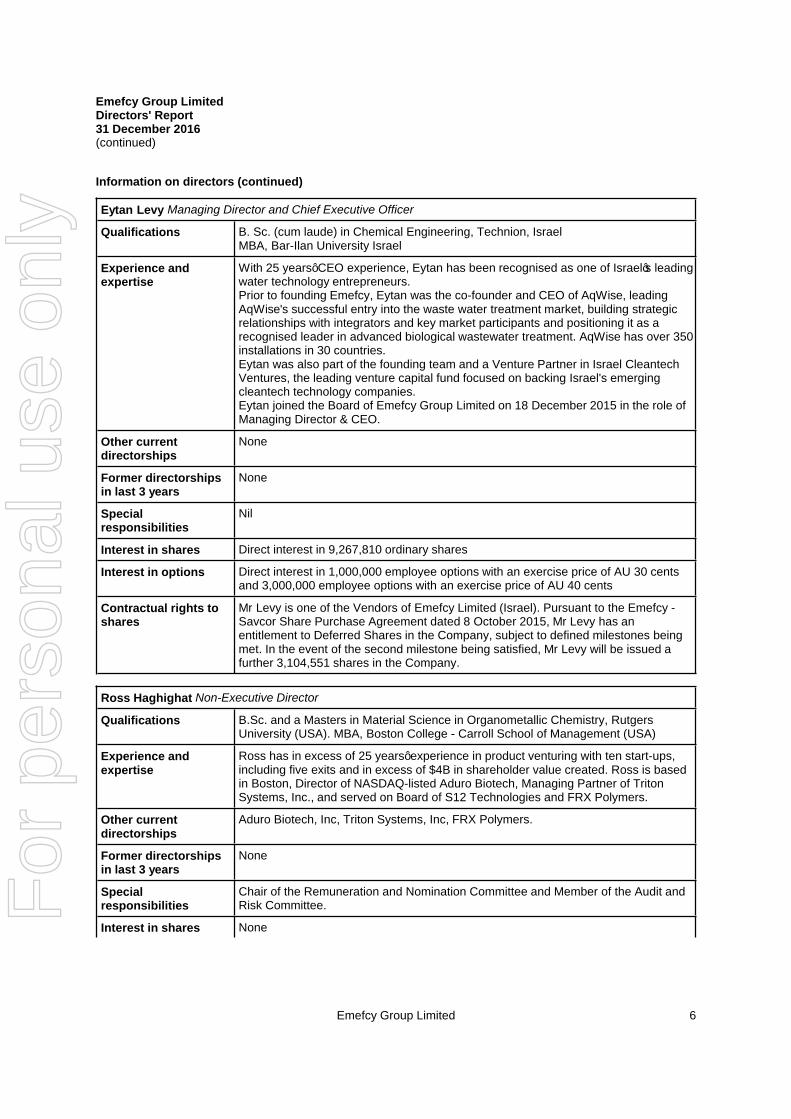
Eytan Levy Managing Director and Chief Executive Officer
Qualifications B. Sc. (cum laude) in Chemical Engineering, Technion, IsraelMBA, Bar-Ilan University Israel
Experience andexpertise
With 25 years’ CEO experience, Eytan has been recognised as one of Israel’s leadingwater technology entrepreneurs.Prior to founding Emefcy, Eytan was the co-founder and CEO of AqWise, leadingAqWise's successful entry into the waste water treatment market, building strategicrelationships with integrators and key market participants and positioning it as arecognised leader in advanced biological wastewater treatment. AqWise has over 350installations in 30 countries.Eytan was also part of the founding team and a Venture Partner in Israel CleantechVentures, the leading venture capital fund focused on backing Israel's emergingcleantech technology companies.Eytan joined the Board of Emefcy Group Limited on 18 December 2015 in the role ofManaging Director & CEO.
Other currentdirectorships
None
Former directorshipsin last 3 years
None
Specialresponsibilities
Nil
Interest in shares Direct interest in 9,267,810 ordinary shares
Interest in options Direct interest in 1,000,000 employee options with an exercise price of AU 30 centsand 3,000,000 employee options with an exercise price of AU 40 cents
Contractual rights toshares
Mr Levy is one of the Vendors of Emefcy Limited (Israel). Pursuant to the Emefcy -Savcor Share Purchase Agreement dated 8 October 2015, Mr Levy has anentitlement to Deferred Shares in the Company, subject to defined milestones beingmet. In the event of the second milestone being satisfied, Mr Levy will be issued afurther 3,104,551 shares in the Company.
Ross Haghighat Non-Executive Director
Qualifications B.Sc. and a Masters in Material Science in Organometallic Chemistry, RutgersUniversity (USA). MBA, Boston College - Carroll School of Management (USA)
Experience andexpertise
Ross has in excess of 25 years’ experience in product venturing with ten start-ups,including five exits and in excess of $4B in shareholder value created. Ross is basedin Boston, Director of NASDAQ-listed Aduro Biotech, Managing Partner of TritonSystems, Inc., and served on Board of S12 Technologies and FRX Polymers.
Other currentdirectorships
Aduro Biotech, Inc, Triton Systems, Inc, FRX Polymers.
Former directorshipsin last 3 years
None
Specialresponsibilities
Chair of the Remuneration and Nomination Committee and Member of the Audit andRisk Committee.
Interest in shares None
Emefcy Group Limited 6
For
per
sona
l use
onl
y

Emefcy Group LimitedDirectors' Report31 December 2016(continued)
Information on directors (continued)
Interest in options Direct interest in 500,000 employee options with an exercise price of AU 30 cents and500,000 employee options with an exercise price of AU 40 cents.
Contractual rights toshares
None
Peter Marks Non-Executive Director
Qualifications B.Ec, LLB and Graduate Diploma in Commercial Law, Monash University, Melbourne,AustraliaMBA degree from the University of Edinburgh, Scotland
Experience andexpertise
Peter has in excess of 30 years’ experience in corporate finance, specialising incapital raisings (for listed and unlisted companies), underwriting, IPOs and venturecapital transactions, including KPMG Corporate Finance Ltd (Australia) and MerrillLynch.Has acted as Director and Chairman for a number of listed entities in the ASX andAIM.Peter has been a Director of the Company since 12 March 2015.
Other currentdirectorships
Prana Biotechnology Limited (listed on ASX and NASDAQ) and Noxopharm Ltd
Former directorshipsin last 3 years
Armadale Capital plc (listed on AIM)
Specialresponsibilities
Member of the Remuneration and Nomination Committee and Chair of the Audit andRisk Committee.
Interest in shares Indirect interest in 1,854,403 shares
Interest in options Direct interest in 500,000 options with an exercise price of 30 cents and 500,000options with an exercise price of 40 cents.Indirect interest in 400,000 share options with an exercise price of 15 cents.
Contractual rights toshares
None
Emefcy Group Limited 7
For
per
sona
l use
onl
y

Emefcy Group LimitedDirectors' Report31 December 2016(continued)
Information on directors (continued)
Phillip Hains Non-Executive Director and Joint Company Secretary (resigned 5 April 2016)
Qualifications Master of Business Administration from RMIT, Melbourne Australia and a PublicPractice Certificate from the Institute of Chartered Accountants, Australia and NewZealand.
Experience andexpertise
Phillip is a Chartered Accountant operating a specialist public practice, ‘The CFOSolution'.The CFO Solution focuses on providing back-office support, financial reporting andcompliance systems for listed public companies. A specialist in the public companyenvironment, Mr Hains has served the needs of a number of company boards andtheir related committees. He has over 20 years’ experience in providing businesseswith accounting, administration, compliance and general management services.
Other currentdirectorships
None
Former directorshipsin last 3 years
BKM Management Limited (ASX: BKM) from 7 December 2012 to 25 June 2014West Wits Mining Limited (ASX: WWI) from 1 February 2011 to 3 May 2013
Specialresponsibilities
Member of the Audit and Risk Committee
Interest in shares Indirect interest in 468,111 shares
Interest in options Indirect interest in 250,000 share options with an exercise price of AU 15 cents.
Contractual rights toshares
None
Rob Wale Non-Executive Director (appointed 5 April 2016)
Qualifications Bachelor of Science (BSc), Mech. Eng, Uni of Wollongong (Aust).
Experience andexpertise
Robert brings over 30 years of executive-level experience in the global water industryincluding strategic, business, sales, marketing and operations roles in Australia, USA,China and throughout the Asia Pacific region. Rob has managed internationalbusinesses ranging from early-stage start-ups to companies generating revenues of$400m per annum. He has served as General Manager of the Water Group at LucasEngineering & Construction, Vice President for Asia-Pacific for Siemens Water Group,Managing Director for Veolia Water Services & Systems, Vice President, Sales &Marketing Asia-Pacific for US Filter, and General Manager and Vice PresidentTechnical and Business Development at Memtec Ltd. Since 2008, he has beenManaging Director of BlueSand Consulting Pty Ltd, developing & reviewing waterbusiness strategies for companies, investors, multinational companies and banks.Robert has been a Director of the Company since 5 April 2016.
Other currentdirectorships
Nil
Former directorshipsin last 3 years
None
Specialresponsibilities
Development of the RaaS business model.
Interest in shares None
Emefcy Group Limited 8
For
per
sona
l use
onl
y

Emefcy Group LimitedDirectors' Report31 December 2016(continued)
Information on directors (continued)
Interest in options 500,000 options over ordinary shares with an exercise price of 35 cents each
Contractual rights toshares
None
Company secretary
The company secretary is Ross Kennedy. Ross Kennedy was appointed to the position of company secretary on23 December 2015. Ross was previously Company Secretary and Executive General Manager of St BarbaraLimited for ten years. Ross is an experienced Company Secretary, holding the professional qualifications ofFellow Governance Institute of Australia; Fellow Australian Institute of Company Directors; and CharteredAccountant.
Phillip Hains resigned as Joint Company Secretary on 5 April 2016.
Meetings of directors
The number of meetings of the Group's Board of Directors and of each board committee held during the yearended 31 December 2016, and the number of meetings attended by each director were:
Full Meetings of committees
Board
Audit
Remunerationand
Nomination
A B A B A BMr Richard Irving** 16 16 - - - -Mr Eytan Levy 15 16 3 4 1 1Mr Ross Haghighat 16 16 4 4 1 1Mr Peter Marks(appointed 5 April 2016)** 12 12 - - - -Mr Robert Wale** 16 16 - - - -Mr Phillip Hains (resigned5 April 2016) 3 4 3 3 - -
A = Number of meetings attendedB = Number of meetings held during the time the director held office or was a member of the committee duringthe year** = Not a member of the relevant committee
Environmental regulation
The Company has deployed a MABR waste water solution in the US Virgin Islands, which is subject to USA EPAregulations. The consolidated entity is not subject to any other significant environmental regulation underAustralian Commonwealth or State law, Israel law or any other foreign jurisdiction.
Remuneration report (Audited)
The directors present the Emefcy Group Limited 2016 remuneration report, outlining key aspects of ourremuneration policy and framework, and remuneration awarded this year.
(a) Principles used to determine the nature and amount of remuneration
The objective of the consolidated entity's executive reward framework is to ensure reward for performance iscompetitive and appropriate for the results delivered. The framework aligns executive reward with theachievement of strategic objectives and the creation of value for shareholders, and conforms to the market bestpractice for the delivery of reward. The Board of Directors ('the Board') ensures that executive reward satisfiesthe following key criteria for good reward governance practices:
• competitiveness and reasonableness;• acceptability to shareholders;
Emefcy Group Limited 9
For
per
sona
l use
onl
y

Emefcy Group LimitedDirectors' Report31 December 2016(continued)
Remuneration report (Audited) (continued)
(a) Principles used to determine the nature and amount of remuneration (continued)
• performance linkage / alignment of executive compensation; and• transparency.
The Remuneration and Nomination Committee is responsible for determining and reviewing remunerationarrangements for its Directors and Executives. The performance of the consolidated entity depends on the qualityof its Directors and Executives. The remuneration philosophy is to attract, motivate and retain high performanceand high quality personnel.
The Remuneration and Nomination Committee has established an executive remuneration framework that ismarket competitive and complementary to the reward strategy of the consolidated entity, including:
(a) Alignment to shareholders' interests:• has achievement of strategic goals as a core component of plan design;• focuses on sustained growth in shareholder wealth, consisting of growth in share price and in time,
delivering constant or increasing return on assets as well as focusing the executives on key non-financialdrivers of value; and
• attracts and retains high calibre executives.
(b) Alignment to program participants' interests:• rewards capability and experience;• reflects competitive reward for contribution to growth in shareholder wealth; and• provides a clear structure for earning rewards.
In accordance with best practice corporate governance, the structure of Non-Executive Directors and executiveremuneration are separate.
Non-executive Directors remuneration
Fees and payments to Non-Executive Directors reflect the demands and responsibilities of their role.Non-Executive Directors' fees and payments are reviewed annually by the Remuneration and NominationCommittee. The Remuneration and Nomination Committee may, from time to time, receive advice fromindependent remuneration consultants to ensure Non-Executive Directors' fees and payments are appropriateand in line with the market. The Chairman's fees are determined independently to the fees of otherNon-Executive Directors based on comparative roles in the external market. The Chairman is not present at anydiscussions relating to the determination of his own remuneration. Non-Executive Directors may receive shareoptions but do not receive other incentives.
Non-executive Directors may also be engaged on specific projects, on arms length terms, approved by the fullBoard with the relevant Director abstaining.
ASX listing rules require the aggregate Non-executive Directors remuneration be determined periodically by ageneral meeting. The most recent determination was that shareholders approved an aggregate remuneration of$US 385,000.
Executive remuneration
The consolidated entity aims to reward executives with a level and mix of remuneration based on their positionand responsibility, which has both fixed and variable components.
The executive remuneration and reward framework has four components:
• base pay and non-monetary benefits;• short-term performance incentives;• share-based payments; and• other remuneration such as superannuation and long service leave.
The combination of these comprises the executive's total remuneration.
Emefcy Group Limited 10
For
per
sona
l use
onl
y
Emefcy Group LimitedDirectors' Report31 December 2016(continued)
Remuneration report (Audited) (continued)
(a) Principles used to determine the nature and amount of remuneration (continued)
Executive remuneration (continued)
Fixed remuneration, consisting of base salary, superannuation and non-monetary benefits, are reviewed annuallyby the Remuneration and Nomination Committee, based on individual and business unit performance, the overallperformance of the consolidated entity and comparable market remunerations.
Executives may receive their fixed remuneration in the form of cash or other fringe benefits (for example motorvehicle benefits) where it does not create any additional costs to the consolidated entity and provides additionalvalue to the executive.
A short-term incentive ('STI') program is planned to be designed to align the targets of the business units with thetargets of those executives responsible for meeting those targets. STI payments may be granted to executivesbased on specific annual targets and key performance indicators ('KPI's') being achieved. KPI's include meetingor exceeding budget goals for the year. The short term incentives payable in respect of 2016 include meeting orexceeding agreed strategic goals for the year.
Long-term incentives ('LTI') include share-based payments. An employee option plan was approved byshareholders on 17 November 2015. Options are awarded to executives as a long-term incentive and retentionincentive measures. Employee options for the majority of the year have an exercise price calculated as the fiveday VWAP up to the date of the option grant, plus 10%. For Israeli employees, options commence vesting aftertwelve months service and are fully vested after three years and expire after four years. For non-Israeliemployees, options vest 100% after three years and expire after four years. To be eligible to exerciseperformance options, an executive must remain in continuous employment with the company up to and includingthe exercise date.
Consolidated entity performance and link to remuneration
The Remuneration and Nomination Committee is of the opinion that the adoption of performance basedcompensation will continue to increase shareholder wealth if maintained over the coming years.
Key management personnel bonuses are awarded at the discretion of the Remuneration and NominationCommittee on the basis of the individual’s performance during the financial year.
Directors consider that the option program and the exercise prices provide incentives to management andDirectors which are aligned with the interests of shareholders to lift the value of the company in the medium term.Remuneration for employees is directly linked to the share price performance of the consolidated entity throughthe employee option program.
(b) Details of remuneration
Amounts of remuneration (shown in USD)
The following table shows details of the remuneration expense recognised for the Group's executive keymanagement personnel for the current and previous financial year measured in accordance with therequirements of the accounting standards.
Emefcy Group Limited 11
For
per
sona
l use
onl
y

Emefcy Group LimitedDirectors' Report31 December 2016(continued)
Remuneration report (Audited) (continued)
(b) Details of remuneration (continued)
Amounts of remuneration (shown in USD) (continued)
Short-term benefitsPost-employment
benefitsLong-termbenefits Share-based payments
2016 Cash salary and fees Superannuation
Longserviceleave
Equitysettledshares
Equity settledoptions Total
StandardSpecial
projects*
Total cashsalary and
fees inclusiveof specialprojects Bonus Non-monetary
$ $ $ $ $ $ $ $ $ $
Non-executive directors:Peter Marks 60,234 44,618 104,852 - - - - - 80,045 184,897
Phillip Hains 11,164 - 11,164 - - - - - 11,164
Robert Wale 22,544 15,029 37,573 - - - - - 69,366 106,939
Ross Haghighat 74,586 55,773 130,359 - - - - - 77,202 207,561
Total 168,528 115,420 283,948 - - - - - 226,613 510,561
Executive directors:Richard Irving 130,136 55,773 185,909 - - - - - 77,202 263,111
Eytan Levy 244,591 - 244,591 114,896 - 44,641 - - 186,878 591,006
Total 374,727 55,773 430,500 114,896 - 44,641 - - 264,080 854,117
Other key managementpersonnel:Ross Kennedy 59,863 7,436 67,299 7,436 - - - 4,538 79,273
Ronen Shechter 172,089 - 172,089 24,606 - 30,709 - - - 227,404
Emefcy Group Limited 12
For
per
sona
l use
onl
y

Emefcy Group LimitedDirectors' Report31 December 2016(continued)
Remuneration report (Audited) (continued)
(b) Details of remuneration (continued)
Amounts of remuneration (shown in USD) (continued)
2016 Short-term benefitsPost-employment
benefitsLong-termbenefits Share-based payments
Cash salary and fees Superannuation
Longserviceleave
Equitysettledshares
Equity settledoptions Total
StandardSpecial
projects*
Total cashsalary and
fees inclusiveof specialprojects Bonus Non-monetary
$ $ $ $ $ $ $ $ $ $Yaron Bar-Tal 162,771 - 162,771 24,996 - 24,347 - - 14,781 226,895
Lior Zitershpiler 92,478 - 92,478 23,131 - 15,560 - - 9,854 141,023
Ilan Wilf 93,526 - 93,526 23,522 - 13,710 - - 84,308 215,066
Total 580,727 7,436 588,163 103,691 - 84,326 - - 113,481 889,661
Grand total 1,123,982 178,629 1,302,611 218,587 - 128,967 - - 604,174 2,254,339
*Short-term cash salary and fee remuneration, classified as ‘special projects,’ comprises remuneration paid to KMP’s in relation to one-off, ad hoc projects throughout the year.Such remuneration is not expected to re-occur in the future.
Emefcy Group Limited 13
For
per
sona
l use
onl
y

Emefcy Group LimitedDirectors' Report31 December 2016(continued)
Remuneration report (Audited) (continued)
(b) Details of remuneration (continued)
Amounts of remuneration (shown in USD) (continued)
Short-term benefitsPost-employment
benefitsLong-term
benefits Share-based payments
2015Cash salaryand fees** Bonus Non-monetary Superannuation
Long serviceleave
Equity settledshares
Equity settledoptions Total
$ $ $ $ $ $ $ $
Non-executive directors:Peter Marks 36,490 - - - - - 10,291 46,781
Phillip Hains 36,490 - - - - - 4,650 41,140
Ross Haghighat 1,530 - - - - 2,851 4,381
Vincent Savage 21,894 4,650 26,544
Total 96,404 - - - - - 22,442 118,846
Executive directors:Richard Irving 3,570 - - - - 2,851 6,421
Eytan Levy 7,239 - - - - 86,058 93,297
Total 10,809 - - - - - 88,909 99,718
Other key managementpersonnel:Ross Kennedy 1,989 - - - 356 2,345
Ronen Shechter 6,960 - - - - - 6,960
Yaron Bar-Tal 5,484 473 5,957
Lior Zitershpiler 2,302 316 2,618
Total 16,735 - - - - - 1,145 17,880
Grand total 123,948 - - - - - 112,496 236,444
**There were no special projects in 2015.
Emefcy Group Limited 14
For
per
sona
l use
onl
y

Emefcy Group LimitedDirectors' Report31 December 2016(continued)
Remuneration report (Audited) (continued)
(b) Details of remuneration (continued)
Issue of shares
The number of shares in the company held during the period by each Director and other Key ManagementPersonnel, including their personally related parties, are set out below.
2016
Balance at thestart of the
yearReceived as
compensationOptions
exercisedNet change
other Total
Non-Executive DirectorsPeter Marks 1,547,052 - 307,351 - 1,854,403Phillip Hains (resigned 5 April2016) 468,111 - - (468,111) -Robert Wale (appointed 5 April2016) - - - - -Ross Haghighat - - - - -
2,015,163 - 307,351 (468,111) 1,854,403
Executive DirectorsRichard Irving 21,629,388 - - 7,314,692 28,944,080Eytan Levy 6,409,416 - - 2,858,394 9,267,810
28,038,804 - - 10,173,086 38,211,890
Key Management PersonnelRoss Kennedy 210,000 - - - 210,000Ronen Shechter 6,409,416 - - 2,858,394 9,267,810Yaron Bar-Tal 269,183 - - 512,966 782,149Lior Zitershpiler 224,319 - - 101,577 325,896Ilan Wilf - - - - -
7,112,918 - - 3,472,937 10,585,855
Total 37,166,885 - 307,351 13,177,912 50,652,148
2015
DirectorsPeter Marks 1,297,052 - - 250,000 1,547,052Phillip Hains (resigned 5 April2016) 418,111 - - 50,000 468,111
1,715,163 - - 300,000 2,015,163
Executive directorsRichard Irving 21,629,388 - - - 21,629,388Eytan Levy 6,409,416 - - - 6,409,416
28,038,804 - - - 28,038,804
Ross Kennedy 210,000 - - - 210,000Ronen Shechter 6,409,416 - - - 6,409,416Yaron Bar-Tal 269,183 - - - 269,183Lior Zitershpiler 224,319 - - - 224,319
7,112,918 - - - 7,112,918
Total 36,866,885 - - 300,000 37,166,885
Emefcy Group Limited 15
For
per
sona
l use
onl
y

Emefcy Group LimitedDirectors' Report31 December 2016(continued)
Remuneration report (Audited) (continued)
(b) Details of remuneration (continued)
Issue of options
The number of options over ordinary shares in the company held during the period by each Director and other Key Management Personnel, including their personally relatedparties, are set out below. An Employee Option Plan was approved by shareholders on 17 November 2015. Refer to description of Long Term Incentives under executiveremuneration for details.
2016Balance at
start of yearGranted as
compensationOptionExpired
Net changeother
Balance atend of year
Vested &Exercisable*
Escrowed /Unvested
DirectorsPeter Marks 1,707,351 - - (307,351) 1,400,000 1,400,000 -Phillip Hains (resigned 5 April 2016) 326,870 - - (326,870) - - -Robert Wale (appointed 5 April 2016) - 500,000 - - 500,000 - 500,000Ross Haghighat 1,000,000 - - - 1,000,000 1,000,000 -Richard Irving 1,000,000 - - - 1,000,000 1,000,000 -Eytan Levy 4,000,000 - - - 4,000,000 1,000,000 3,000,000
8,034,221 500,000 - (634,221) 7,900,000 4,400,000 3,500,000
Key Management PersonnelRoss Kennedy 200,000 - - - 200,000 - 200,000Ronen Shechter - - - - - - -Yaron Bar-Tal 265,768 - - - 265,768 88,584 177,184Lior Zitershpiler 177,178 - - - 177,178 59,090 118,088Ilan Wilf - 1,500,000 - - 1,500,000 - 1,500,000
642,946 1,500,000 - - 2,142,946 147,674 1,995,272
Total 8,677,167 2,000,000 - (634,221) 10,042,946 4,547,674 5,495,272
Emefcy Group Limited 16
For
per
sona
l use
onl
y

Emefcy Group LimitedDirectors' Report31 December 2016(continued)
Remuneration report (Audited) (continued)
(b) Details of remuneration (continued)
Issue of options (continued)
2015Balance at
start of yearGranted as
compensationOptionExpired
Net changeother
Balance atend of year
Vested &Exercisable*
Escrowed /Unvested
DirectorsPeter Marks - 1,707,351 - - 1,707,351 707,351 1,000,000Phillip Hains (resigned 5 April 2016) - 326,870 - - 326,870 326,870 -Ross Haghighat - 1,000,000 - - 1,000,000 - 1,000,000Richard Irving - 1,000,000 - - 1,000,000 - 1,000,000Eytan Levy - 4,000,000 - - 4,000,000 1,000,000 3,000,000
- 8,034,221 - - 8,034,221 2,034,221 6,000,000
Key Management PersonnelRoss Kennedy - 200,000 - - 200,000 - 200,000Ronen Shechter - - - - - - -Yaron Bar-Tal - 265,768 - - 265,768 - 265,768Lior Zitershpiler - 177,178 - - 177,178 - 177,178
- 642,946 - - 642,946 - 642,946
Total - 8,677,167 - - 8,677,167 2,034,221 6,642,946
In accordance with AASB2 Share Based Payments and the relevant International Guidance Instructions, the above table includes employee options that have been agreed tobe issued but were not formally granted as at 31 December 2015 and 31 December 2016.
*Options vested and exercisable as at 31 December
Emefcy Group Limited 17
For
per
sona
l use
onl
y

Emefcy Group LimitedDirectors' Report31 December 2016(continued)
Remuneration report (Audited) (continued)
(b) Details of remuneration (continued)
Share-based payments granted as compensation during the year
For the period, options were issued to directors as approved by shareholders and to Key Management Personnelunder the Savcor Group Limited Employee Share Option Plan (2015). In accordance with AASB 2 Share BasedPayments IGI 4, the tables include employee options agreed to be issued up to and including 31 December 2016,even though for registration with Israeli tax authorities and other reasons, they may not have been formallygranted as at 31 December 2016. Key Management Personnel options vest subject to the employee continuingto be employed by the company at the vesting date.
Details of options granted to directors and other key management personnel as compensation during thereporting period are as follows:
Emefcy Group Limited 18
For
per
sona
l use
onl
y

Emefcy Group LimitedDirectors' Report31 December 2016(continued)
Remuneration report (Audited) (continued)
(b) Details of remuneration (continued)
Share-based payments granted as compensation during the year (continued)
2016 Grant dateNo. of options
grantedNo. of options
vested
Fair value peroption at grant
date Exercise price Expiry dateDate
exercisable
Value ofoptions atgrant date
US$ AU$ US$
Non-Executive DirectorsPeter Marks - - - - - - -
Phillip Hains (resigned 5 April2016) - - - - - - - -
Robert Wale (appointed 5 April2016) 11/04/2016 500,000 - 0.2592 250,000 AU0.35 13/04/2020 13/04/2017 64,795
0.2592 250,000 AU0.35 13/04/2020 13/04/2018 64,795
Ross Haghighat - - - - - - - -
Executive DirectorsRichard Irving - - - - - - - -
Eytan Levy - - - - - - - -
Total 500,000 - 129,590
Key Management PersonnelRoss Kennedy - - - - - - - -
Ronen Shechter - - - - - - - -
Yaron Bar-Tal - - - - - - - -
Lior Zitershpiler - - - - - - -
Ilan Wilf 15/06/2016 1,000,000 - 0.3881 AU0.93 31/05/2020 17/06/2017 388,124
01/11/2016 500,000 - 0.5344 AU0.74 31/10/2019 01/11/2017 267,193
Total - 1,500,000 - - - - - 784,907
Emefcy Group Limited 19
For
per
sona
l use
onl
y

Emefcy Group LimitedDirectors' Report31 December 2016(continued)
Remuneration report (Audited) (continued)
(b) Details of remuneration (continued)
Share-based payments granted as compensation during the year (continued)
For the period 1 January 2015 to 17 December 2015, options were issued to directors as part of the director remuneration packages, and as the company was in the earlystages of restructuring, there are no performance conditions associated with these options.
Details of options granted to directors and other key management personnel as compensation during the prior financial year are as follows:
1 January 2015 to 17December 2015 Grant date
No. of optionsgranted
No. of optionsvested
Fair value peroption at grant
date Exercise price Expiry dateDate
exercisable
Value ofoptions atgrant date
US$ AU$ US$
DirectorsPeter Marks 05/06/2015 400,000 400,000 0.0186 AU 0.15 05/06/2017 05/06/2015 7,440
Phillip Hains 05/06/2015 250,000 250,000 0.0186 AU 0.15 05/06/2017 05/06/2015 4,650
Vincent Savage 05/06/2015 250,000 250,000 0.0186 AU 0.15 05/06/2017 05/06/2015 4,650
Total - 900,000 900,000 - - - - 16,740
*The historical value of the 900,000 options has been eliminated at acquisition date 18 December 2015.
For the period 18 December 2015 to 31 December 2015, options were issued to directors as approved by shareholders and to Key Management Personnel under the SavcorGroup Limited Employee Share Option Plan (2015). In accordance with AASB 2 Share Based Payments IGI 4, the tables include employee options agreed to be issued up toand including 31 December 2015, even though for registration with Israeli tax authorities and other reasons, that may not have been formally granted as at 31 December 2015.Key management personnel options vest subject to the employee continuing to be employed by the company at the vesting date. As employee options form part of theremuneration package of employees, and the company is in the early stages of commercialisation, there were no performance conditions associated with these options in2015.
Emefcy Group Limited 20
For
per
sona
l use
onl
y
Emefcy Group LimitedDirectors' Report31 December 2016(continued)
Remuneration report (Audited) (continued)
(b) Details of remuneration (continued)
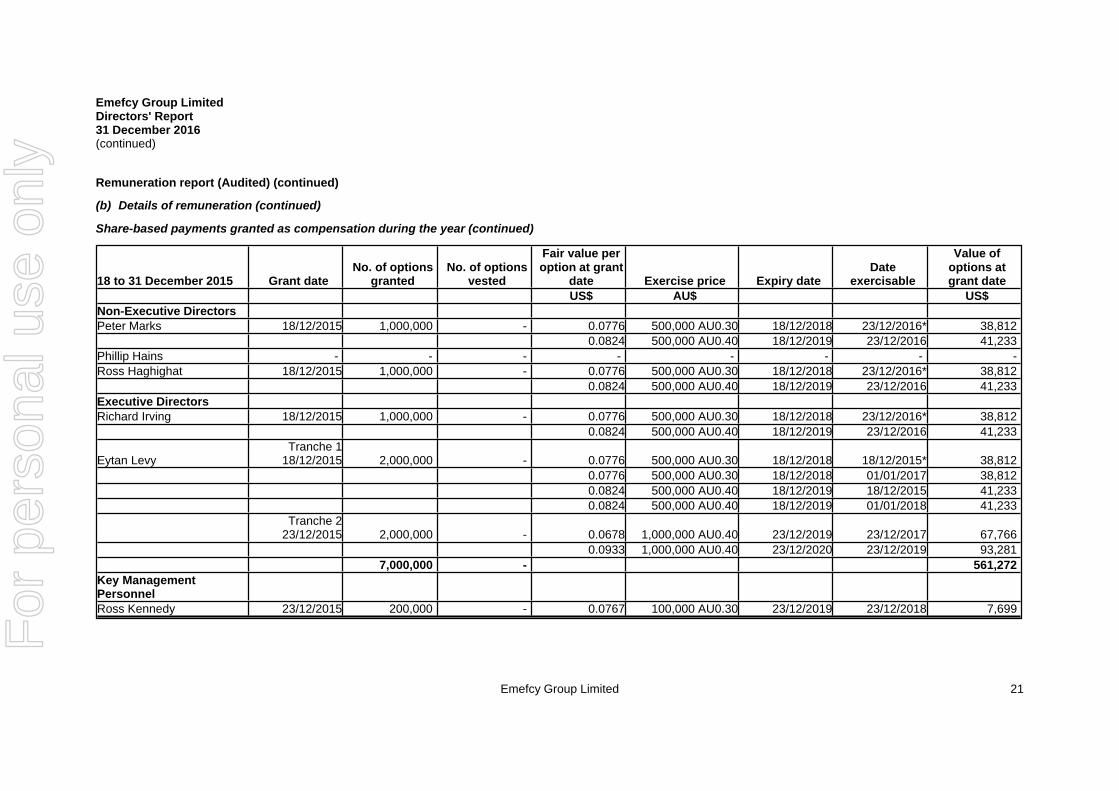
Share-based payments granted as compensation during the year (continued)
18 to 31 December 2015 Grant dateNo. of options
grantedNo. of options
vested
Fair value peroption at grant
date Exercise price Expiry dateDate
exercisable
Value ofoptions atgrant date
US$ AU$ US$
Non-Executive DirectorsPeter Marks 18/12/2015 1,000,000 - 0.0776 500,000 AU0.30 18/12/2018 23/12/2016* 38,812
0.0824 500,000 AU0.40 18/12/2019 23/12/2016 41,233
Phillip Hains - - - - - - - -
Ross Haghighat 18/12/2015 1,000,000 - 0.0776 500,000 AU0.30 18/12/2018 23/12/2016* 38,812
0.0824 500,000 AU0.40 18/12/2019 23/12/2016 41,233
Executive DirectorsRichard Irving 18/12/2015 1,000,000 - 0.0776 500,000 AU0.30 18/12/2018 23/12/2016* 38,812
0.0824 500,000 AU0.40 18/12/2019 23/12/2016 41,233
Eytan LevyTranche 1
18/12/2015 2,000,000 - 0.0776 500,000 AU0.30 18/12/2018 18/12/2015* 38,812
0.0776 500,000 AU0.30 18/12/2018 01/01/2017 38,812
0.0824 500,000 AU0.40 18/12/2019 18/12/2015 41,233
0.0824 500,000 AU0.40 18/12/2019 01/01/2018 41,233
Tranche 223/12/2015 2,000,000 - 0.0678 1,000,000 AU0.40 23/12/2019 23/12/2017 67,766
[space] 0.0933 1,000,000 AU0.40 23/12/2020 23/12/2019 93,281
7,000,000 - 561,272
Key ManagementPersonnelRoss Kennedy 23/12/2015 200,000 - 0.0767 100,000 AU0.30 23/12/2019 23/12/2018 7,699
Emefcy Group Limited 21
For
per
sona
l use
onl
y
Emefcy Group LimitedDirectors' Report31 December 2016(continued)
Remuneration report (Audited) (continued)
(b) Details of remuneration (continued)
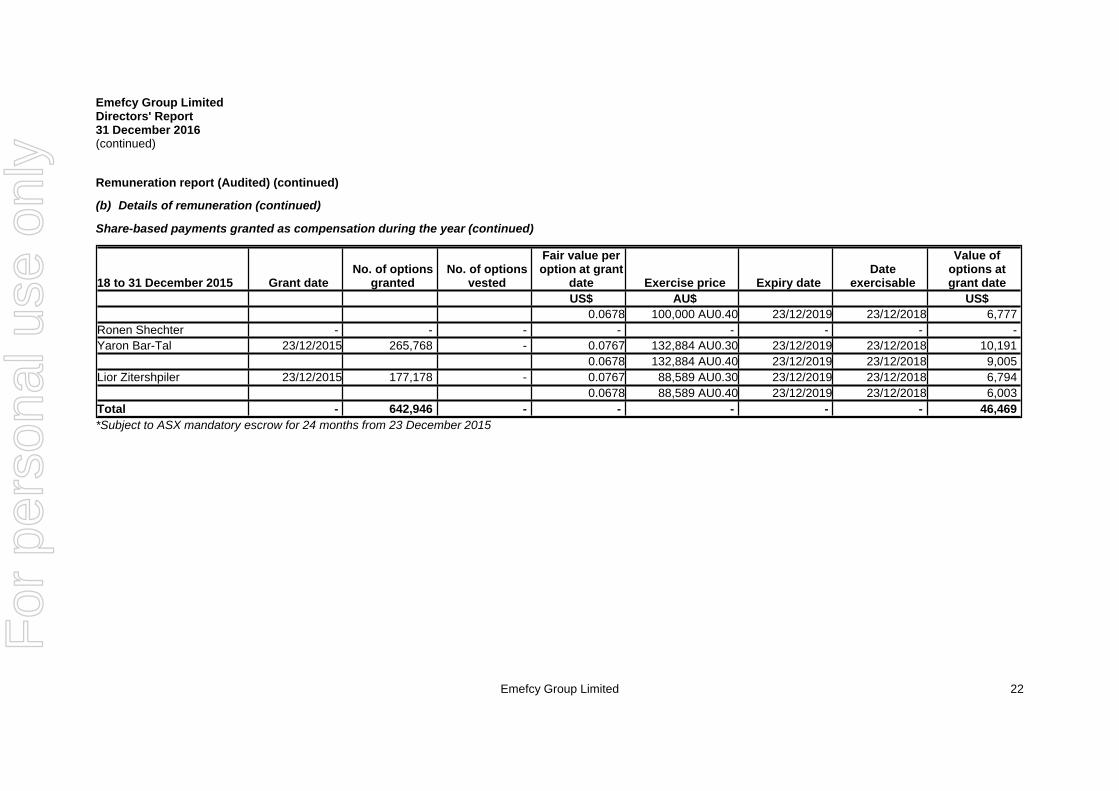
Share-based payments granted as compensation during the year (continued)
18 to 31 December 2015 Grant dateNo. of options
grantedNo. of options
vested
Fair value peroption at grant
date Exercise price Expiry dateDate
exercisable
Value ofoptions atgrant date
US$ AU$ US$
0.0678 100,000 AU0.40 23/12/2019 23/12/2018 6,777
Ronen Shechter - - - - - - - -
Yaron Bar-Tal 23/12/2015 265,768 - 0.0767 132,884 AU0.30 23/12/2019 23/12/2018 10,191
0.0678 132,884 AU0.40 23/12/2019 23/12/2018 9,005
Lior Zitershpiler 23/12/2015 177,178 - 0.0767 88,589 AU0.30 23/12/2019 23/12/2018 6,794
0.0678 88,589 AU0.40 23/12/2019 23/12/2018 6,003
Total - 642,946 - - - - - 46,469
*Subject to ASX mandatory escrow for 24 months from 23 December 2015
Emefcy Group Limited 22
For
per
sona
l use
onl
y
Emefcy Group LimitedDirectors' Report31 December 2016(continued)
Remuneration report (Audited) (continued)
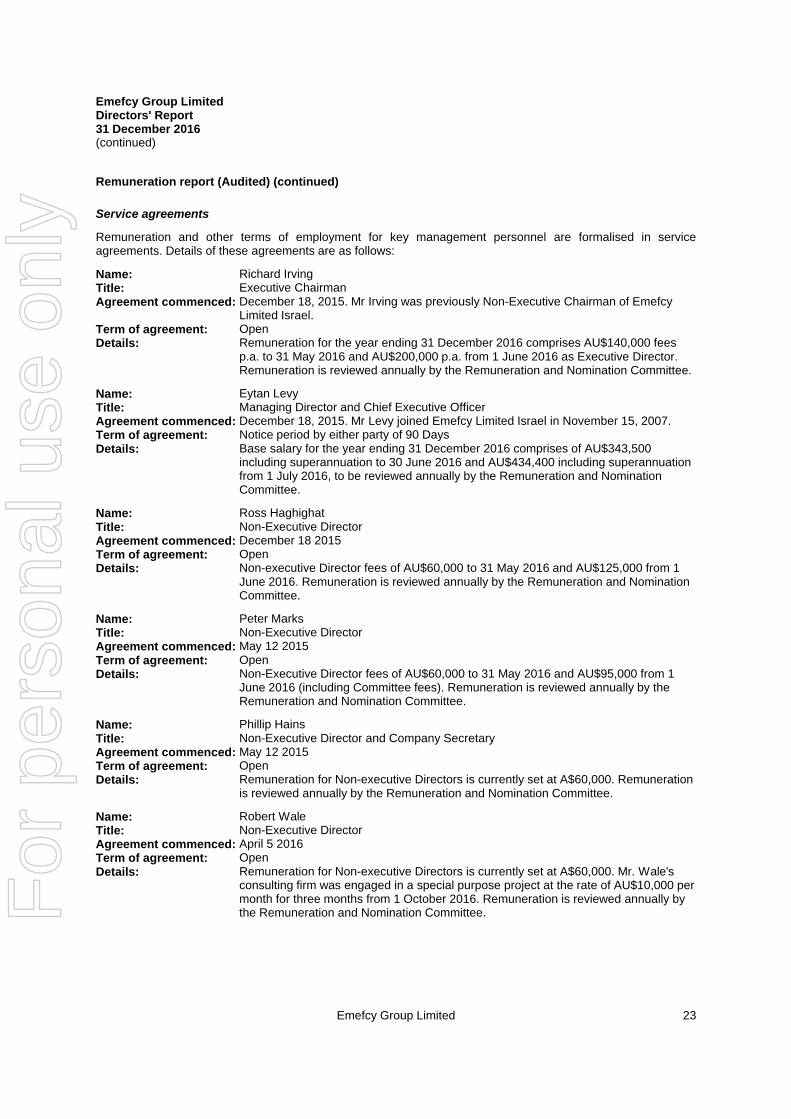
Service agreements
Remuneration and other terms of employment for key management personnel are formalised in serviceagreements. Details of these agreements are as follows:
Name: Richard IrvingTitle: Executive ChairmanAgreement commenced: December 18, 2015. Mr Irving was previously Non-Executive Chairman of Emefcy
Limited Israel.Term of agreement: OpenDetails: Remuneration for the year ending 31 December 2016 comprises AU$140,000 fees
p.a. to 31 May 2016 and AU$200,000 p.a. from 1 June 2016 as Executive Director.Remuneration is reviewed annually by the Remuneration and Nomination Committee.
Name: Eytan LevyTitle: Managing Director and Chief Executive OfficerAgreement commenced: December 18, 2015. Mr Levy joined Emefcy Limited Israel in November 15, 2007.Term of agreement: Notice period by either party of 90 DaysDetails: Base salary for the year ending 31 December 2016 comprises of AU$343,500
including superannuation to 30 June 2016 and AU$434,400 including superannuationfrom 1 July 2016, to be reviewed annually by the Remuneration and NominationCommittee.
Name: Ross HaghighatTitle: Non-Executive DirectorAgreement commenced: December 18 2015Term of agreement: OpenDetails: Non-executive Director fees of AU$60,000 to 31 May 2016 and AU$125,000 from 1
June 2016. Remuneration is reviewed annually by the Remuneration and NominationCommittee.
Name: Peter MarksTitle: Non-Executive DirectorAgreement commenced: May 12 2015Term of agreement: OpenDetails: Non-Executive Director fees of AU$60,000 to 31 May 2016 and AU$95,000 from 1
June 2016 (including Committee fees). Remuneration is reviewed annually by theRemuneration and Nomination Committee.
Name: Phillip HainsTitle: Non-Executive Director and Company SecretaryAgreement commenced: May 12 2015Term of agreement: OpenDetails: Remuneration for Non-executive Directors is currently set at A$60,000. Remuneration
is reviewed annually by the Remuneration and Nomination Committee.
Name: Robert WaleTitle: Non-Executive DirectorAgreement commenced: April 5 2016Term of agreement: OpenDetails: Remuneration for Non-executive Directors is currently set at A$60,000. Mr. Wale's
consulting firm was engaged in a special purpose project at the rate of AU$10,000 permonth for three months from 1 October 2016. Remuneration is reviewed annually bythe Remuneration and Nomination Committee.
Emefcy Group Limited 23
For
per
sona
l use
onl
y

Emefcy Group LimitedDirectors' Report31 December 2016(continued)
Remuneration report (Audited) (continued)
Service agreements (continued)
Name: Ross KennedyTitle: Company Secretary & Advisor to the BoardAgreement commenced: December 24 2015Term of agreement: Notice period by either party of 60 days.Details: Mr Kennedy receives fees through a private consulting company of A$6,500 per
month to 31 July 2016 and AU$8,000 per month from 1 August 2016. An additionalAU$10,000 per month for special purpose project work from 1 December 2016.
Name: Ronen ShechterTitle: Chief Technology Officer, Emefcy LimitedAgreement commenced: Mr Shechter joined Emefcy Limited Israel in November 15, 2007Term of agreement: Notice period by either party of 90 DaysDetails: Base salary for the year ending 31 December 2016 of US$202,800 including
superannuation, to be reviewed annually by the Remuneration and NominationCommittee.
Name: Yaron Bar-TalTitle: Vice President of Engineering, Emefcy LimitedAgreement commenced: Mr Bar-Tal joined Emefcy Limited Israel in May 8, 2013Term of agreement: Notice period by either party of 90 DaysDetails: Base salary for the year ending 31 December 2016 of US$187,120 including
superannuation, to be reviewed annually by the Remuneration and NominationCommittee.
Name: Lior ZitershpilerTitle: Vice President of FinanceAgreement commenced: Mr Zitershpiler joined Emefcy Limited Israel in March 16, 2014Term of agreement: Notice period by either party of 30 DaysDetails: Base salary for the year ending 31 December 2016 comprises of US$99,150 to July
2016 and US$120,450 from 1 August 2016 including superannuation, to be reviewedannually by the Remuneration and Nomination Committee.
Name: Ilan WilfTitle: Vice President of Global Sales and Business Development, Emefcy LimitedAgreement commenced: Mr Ilan Wilf joined Emefcy Limited Israel in May 30, 2016Term of agreement: Notice period by either party of 60 DaysDetails: Base salary for the year ending 31 December 2016 of US$174,200 including
superannuation, to be reviewed annually by the Remuneration and NominationCommittee.
[This concludes the Remuneration Report, which has been audited]
Emefcy Group Limited 24
For
per
sona
l use
onl
y

Emefcy Group LimitedDirectors' Report31 December 2016(continued)
Shares under option
Unissued ordinary shares
Unissued ordinary shares of Emefcy Group Limited under option at the date of this report are as follows:
Date options granted Expiry date Issue price of shares Number under option
5 June 2015 5 June 2017 AU 15 cents 650,00018 December 2015 18 December 2018 AU 30 cents 2,500,00018 December 2015 18 December 2019 AU 40 cents 2,500,00028 January 2016 31 July 2018 AU 30 cents 2,000,00028 January 2016 31 January 2019 AU 40 cents 2,000,00011 April 2016 13 April 2020 AU 35 cents 500,00029 February 2016 23 December 2019 AU 30 cents 431,47329 February 2016 23 December 2019 AU 40 cents 431,47329 February 2016 28 February 2020 AU 30 cents 100,00029 February 2016 29 February 2020 AU 40 cents 100,00023 March 2016 23 March 2020 AU 30 cents 75,00023 March 2016 23 March 2020 AU 40 cents 75,00023 March 2016 3 May 2016 AU 30 cents 50,00023 March 2016 12 April 2020 AU 40 cents 50,00017 May 2016 16 May 2020 AU 59 cents 400,00017 May 2016 28 May 2020 AU 59 cents 100,00018 May 2016 18 May 2020 AU 40 cents 1,000,00018 May 2016 18 May 2021 AU 40 cents 1,000,00015 June 2016 31 May 2020 AU 93 cents 1,000,00025 July 2016 31 July 2018 AU 64 cents 1,800,00025 July 2016 25 July 2020 AU 79 cents 250,00025 August 2016 25 July 2020 AU 87 cents 325,0001 August 2016 1 August 2018 AU 70 cents 55,00023 September 2016 25 September 2020 AU 1.00 dollar 200,00027 October 2016 31 October 2019 AU 64 cents 100,00027 October 2016 26 October 2020 AU 1.07 dollars 350,0001 November 2016 31 October 2020 AU 74 cents 500,00023 September 2016 9 November 2020 AU 1.00 dollar 200,0009 February 2017 9 February 2021 AU 1.00 dollar 350,00027 February 2017 10 January 2021 AU 0.84 cents 25,0001 March 2017 20 December 2020 AU 0.87 cents 75,000
19,192,946Insurance of officers and indemnities
(a) Insurance of officers
The company has indemnified the Directors and executives of the company for costs incurred, in their capacity asa Director or executive, for which they may be held personally liable, except where there is a lack of good faith.
During the financial year, the company paid a premium in respect of a contract to insure the Directors andexecutives of the company against a liability to the extent permitted by the Corporations Act 2001. The contract ofinsurance prohibits disclosure of the nature of the liability and the amount of the premium.
Emefcy Group Limited 25
For
per
sona
l use
onl
y

For
per
sona
l use
onl
y

Collins Square, Tower Four Level 18, 727 Collins Street Melbourne VIC 3008 GPO Box 5099 Melbourne VIC 3001 Australia
Tel: +61 3 9603 1700 Fax: +61 3 9602 3870 www.bdo.com.au
BDO East Coast Partnership ABN 83 236 985 726 is a member of a national association of independent entities which are all members of BDO Australia Ltd ABN 77 050 110 275, an Australian company limited by guarantee. BDO East Coast Partnership and BDO Australia Ltd are members of BDO International Ltd, a UK company limited by guarantee, and form part of the international BDO network of independent member firms. Liability limited by a scheme approved under Professional Standards Legislation, other than for the acts or omissions of financial services licensees.
DECLARATION OF INDEPENDENCE BY DAVID GARVEY TO THE DIRECTORS OF EMEFCY GROUP LIMITED
As lead auditor of Emefcy Group Limited for the year ended 31 December 2016, I declare that, to the
best of my knowledge and belief, there have been:
1. No contraventions of the auditor independence requirements of the Corporations Act 2001 in
relation to the audit; and
2. No contraventions of any applicable code of professional conduct in relation to the audit.
This declaration is in respect of Emefcy Group Limited and the entities it controlled during the period.
David Garvey
Partner
BDO East Coast Partnership
Melbourne, 30 March 2017
For
per
sona
l use
onl
y

Emefcy Group LimitedConsolidated Statement of Profit or Loss and Other Comprehensive IncomeFor the year ended 31 December 2016
Consolidated entity
Revenues
Notes2016
$2015
$
Operating revenue 2 792,424 -Interest revenue 19,234 1,179TestingExpensesCost of sales (2,007,202) -Research and development expenses (2,044,774) -Sales and marketing expenses (949,818) (125,705)Administrative expenses (1,909,589) (553,637)Corporate consulting fees (1,443,547) (99,700)Director expense (1,036,615) (90,622)Legal expenses (254,026) (76,432)Amortisation and depreciation (298,828) (70,922)Listing expense recognised on acquisition 12 (1,000,000) (7,801,624)Finance costs (11,711) (32,520)Foreign exchange gain / (loss) 1,079,544 (238,517)Loss before income tax (9,064,908) (9,088,500)
Income tax expense 4 - -
Loss for the year (9,064,908) (9,088,500)
Other comprehensive incomeItems that may be reclassfied to profit or loss:Exchange differences on translation of foreign operations (881,143) 226,173
Other comprehensive income / (loss) for the year net of tax (881,143) 226,173
Total comprehensive loss for the year (9,946,051) (8,862,327)
Total comprehensive loss for the year is attributable to:Owners of Emefcy Group Limited (9,946,051) (8,862,327)
Losses per share for profit from continuing operations attributableto the ordinary equity holders of the Group:Basic loss per share 25 (0.04) (0.13)Diluted loss per share 25 (0.04) (0.13)
The above Consolidated Statement of Profit or Loss and Other Comprehensive Income should be read inconjunction with the accompanying notes. All amounts are presented in US dollars unless stated differently.
Emefcy Group Limited 28
For
per
sona
l use
onl
y

Emefcy Group LimitedConsolidated Statement of Financial PositionAs at 31 December 2016
Consolidated entity
Notes2016
$2015
$
ASSETSCurrent assetsCash and cash equivalents 5 22,870,848 8,478,927Short term deposits 114,706 -Restricted cash 18,761 32,127Trade and other receivables 6 712,609 204,206Inventories 7 452,454 194,969Prepayments 205,023 68,137
Total current assets 24,374,401 8,978,366
Non-current assetsOther receivables 49,373 2,357Property, plant and equipment 8 1,039,460 823,720Intangible assets 9 2,133,548 2,286,877
Total non-current assets 3,222,381 3,112,954
Total assets 27,596,782 12,091,320
LIABILITIESCurrent liabilitiesTrade and other payables 10 1,371,331 617,519Provisions 11 123,113 -Other financial liabilities 12 1,000,000 -
2,494,444 617,519
Total current liabilities 2,494,444 617,519
Non-current liabilitiesOther payables 10 1,038,689 1,111,745Other financial liabilities 12 - 1,000,000
Total non-current liabilities 1,038,689 2,111,745
Total liabilities 3,533,133 2,729,264
Net assets 24,063,649 9,362,056
EQUITYContributed equity 13 53,129,419 28,481,775Other reserves 14 (654,970) 226,173Accumulated losses (28,410,800) (19,345,892)
Total equity 24,063,649 9,362,056
The above Consolidated Statement of Financial Position should be read in conjunction with the accompanyingnotes.
Emefcy Group Limited 29
For
per
sona
l use
onl
y

Emefcy Group LimitedConsolidated Statement of Changes in EquityFor the year ended 31 December 2016
Consolidated entity Notes
Contributedequity
$Other reserves
$
Accumulatedlosses
$Total
$
Balance at 1 January 2015 12,660,392 - (10,257,392) 2,403,000
Loss for the period - - (9,088,500) (9,088,500)Other comprehensive profit / (loss) - 226,173 - 226,173Total comprehensive income forthe year - 226,173 (9,088,500) (8,862,327)
Transactions with owners in theircapacity as owners:Issue of ordinary shares, net oftransaction costs 13 15,727,586 - - 15,727,586Issue of options 13 93,797 - - 93,797
15,821,383 - - 15,821,383
Balance at 31 December 2015 28,481,775 226,173 (19,345,892) 9,362,056
Balance at 1 January 2016 28,481,775 226,173 (19,345,892) 9,362,056
Loss for the period - - (9,064,908) (9,064,908)Other comprehensive profit / (loss) - (881,143) - (881,143)Total comprehensive income forthe year - (881,143) (9,064,908) (9,946,051)
Transactions with owners in theircapacity as owners:Issue of ordinary shares, net oftransaction costs 13 22,946,283 - - 22,946,283Issue of options 13 1,701,361 - - 1,701,361
24,647,644 - - 24,647,644
Balance at 31 December 2016 53,129,419 (654,970) (28,410,800) 24,063,649
The above Consolidated Statement of Changes in Equity should be read in conjunction with the accompanyingnotes.
Emefcy Group Limited 30
For
per
sona
l use
onl
y
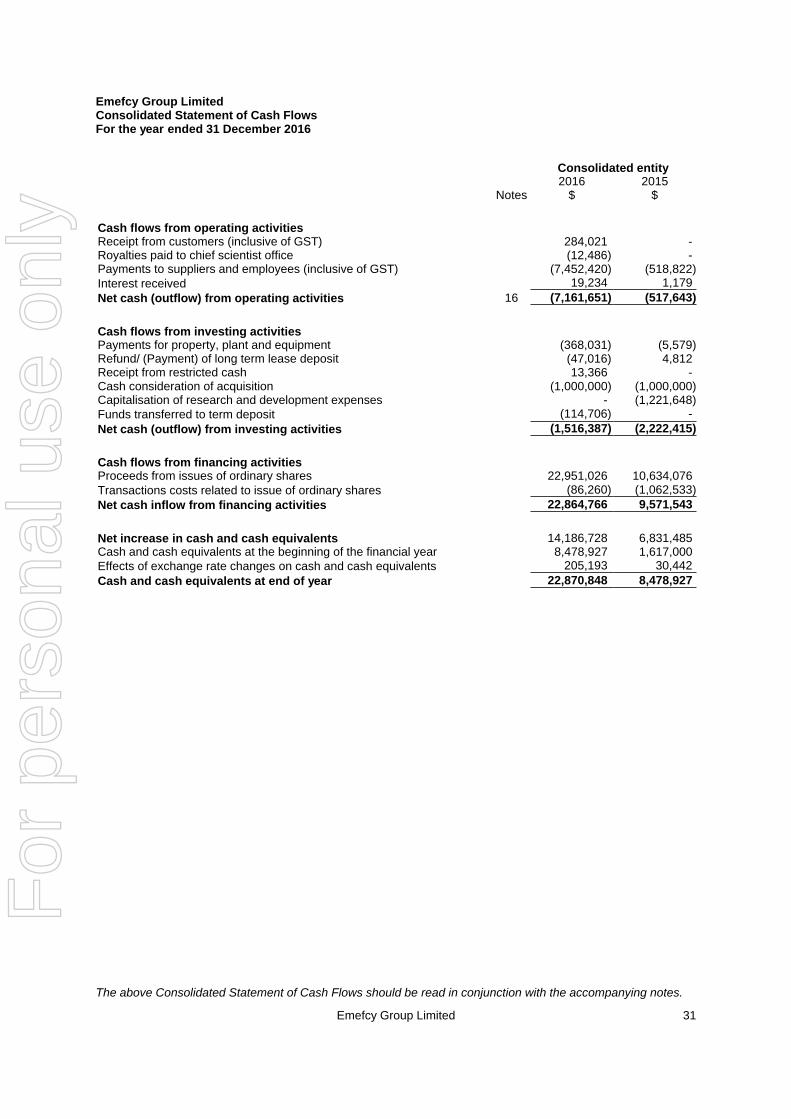
Emefcy Group LimitedConsolidated Statement of Cash FlowsFor the year ended 31 December 2016
Consolidated entity
Notes2016
$2015
$
Cash flows from operating activitiesReceipt from customers (inclusive of GST) 284,021 -Royalties paid to chief scientist office (12,486) -Payments to suppliers and employees (inclusive of GST) (7,452,420) (518,822)Interest received 19,234 1,179
Net cash (outflow) from operating activities 16 (7,161,651) (517,643)
Cash flows from investing activitiesPayments for property, plant and equipment (368,031) (5,579)Refund/ (Payment) of long term lease deposit (47,016) 4,812Receipt from restricted cash 13,366 -Cash consideration of acquisition (1,000,000) (1,000,000)Capitalisation of research and development expenses - (1,221,648)Funds transferred to term deposit (114,706) -
Net cash (outflow) from investing activities (1,516,387) (2,222,415)
Cash flows from financing activitiesProceeds from issues of ordinary shares 22,951,026 10,634,076Transactions costs related to issue of ordinary shares (86,260) (1,062,533)
Net cash inflow from financing activities 22,864,766 9,571,543
Net increase in cash and cash equivalents 14,186,728 6,831,485Cash and cash equivalents at the beginning of the financial year 8,478,927 1,617,000Effects of exchange rate changes on cash and cash equivalents 205,193 30,442
Cash and cash equivalents at end of year 22,870,848 8,478,927
The above Consolidated Statement of Cash Flows should be read in conjunction with the accompanying notes.
Emefcy Group Limited 31
For
per
sona
l use
onl
y

Emefcy Group LimitedNotes to the Consolidated Financial Statements31 December 2016
1 Summary of significant accounting policies
(a) Corporate information
The Financial Report of Emefcy Group Limited and its controlled entities (the “Group”) for the year ended 31December 2016 was authorised for issue in accordance with a resolution of the Directors on the 30
thday of
March 2017.
Emefcy Group Limited is a for profit listed public company limited by shares incorporated and domiciled inAustralia whose shares are publicly traded on the Australian Securities Exchange (“ASX”). The Company'sprincipal activities are research, development and commercialisation of wastewater treatment solutions.
(b) Basis of preparation
These general purpose Financial Statements have been prepared in accordance with Australian AccountingStandards and interpretations issued by the Australian Accounting Standards Board and the Corporations Act2001.
The financial statements also comply with International Financial Reporting Standards (IFRS) as issued by theinternational accounting standards board.
The financial report has been prepared on an accruals basis and is based on historical costs. The financial reportis presented in United States Dollars, which is the Group’s presentation currency. All values are rounded to thenearest dollar unless otherwise stated.
Management is required to make judgements, estimates and assumptions about carrying values of assets andliabilities that are not readily apparent from other sources. The estimates and associated assumptions are basedon historical experience and various other factors that are believed to be reasonable under the circumstance, theresults of which form the basis of making the judgements. Actual results may differ from these estimates. Theestimates and underlying assumptions are reviewed on an ongoing basis. Revisions to accounting estimates arerecognised in the period in which the estimate is revised if the revision affects only that period, or in the period ofthe revision and future periods if the revision affects both current and future periods.
Judgements made by management in the application of Australian Accounting Standards that have significanteffects on the financial statements and estimates with a significant risk of material adjustments in the next yearare disclosed, where applicable, in the relevant notes to the financial statements (refer to Note 1 (aa)).
Accounting policies are selected and applied in a manner which ensures that the resulting financial informationsatisfies the concepts of relevance and reliability, thereby ensuring that the substance of the underlyingtransactions or other events is reported.
(i) Going concern
The financial statements have been prepared on a going concern basis, which contemplates continuity of normalbusiness activities and the realisation of assets and discharge of liabilities in the normal course of business.
(ii) New and amended standards adopted by the group
The Group has adopted all of the new, revised or amending Accounting Standards and Interpretations issued bythe Australian Accounting Standards Board ('AASB') that are mandatory for the current reporting period.
Any new, revised or amending Accounting Standards or Interpretations that are not yet mandatory have not beenearly adopted. The adoption of these Accounting Standards and Interpretations did not have any significantimpact on the financial performance or financial position of the consolidated entity.
All other accounting standards adopted by the Group are consistent with the most recent Annual Report for theyear ended 31 December 2015.
Emefcy Group Limited 32
For
per
sona
l use
onl
y
Emefcy Group LimitedNotes to the Consolidated Financial Statements31 December 2016(continued)
1 Summary of significant accounting policies (continued)
(b) Basis of preparation (continued)
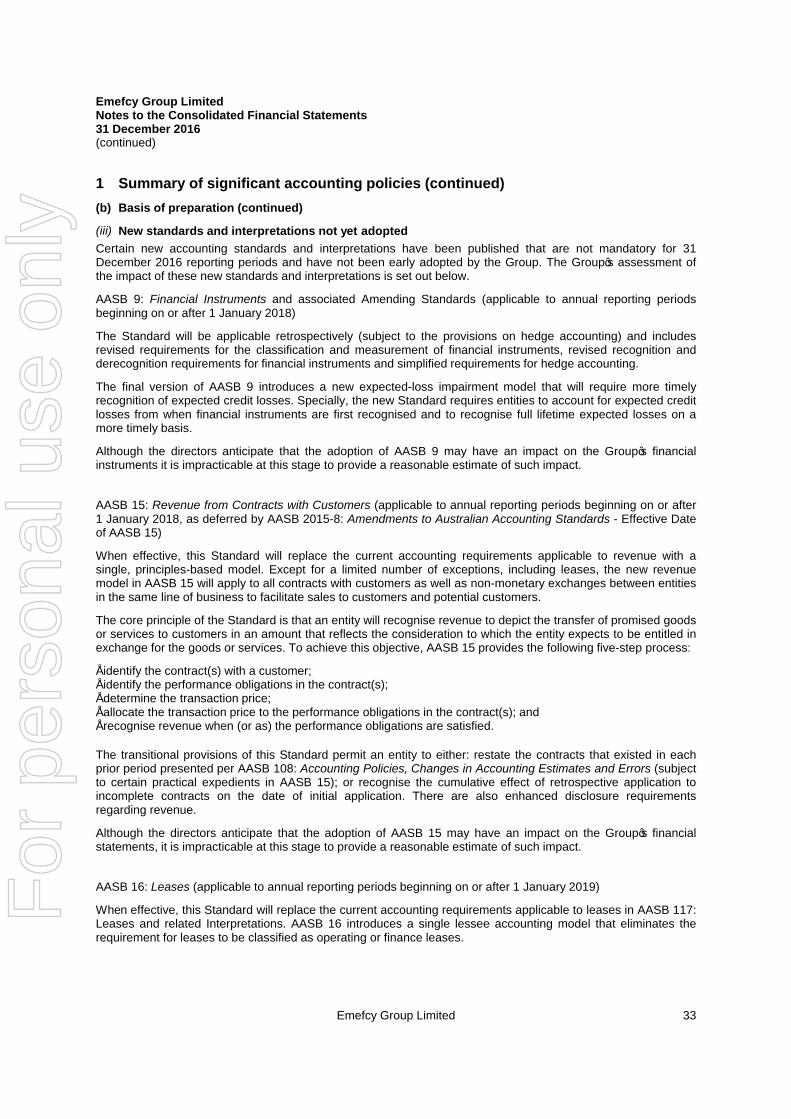
(iii) New standards and interpretations not yet adopted
Certain new accounting standards and interpretations have been published that are not mandatory for 31December 2016 reporting periods and have not been early adopted by the Group. The Group’s assessment ofthe impact of these new standards and interpretations is set out below.
AASB 9: Financial Instruments and associated Amending Standards (applicable to annual reporting periodsbeginning on or after 1 January 2018)
The Standard will be applicable retrospectively (subject to the provisions on hedge accounting) and includesrevised requirements for the classification and measurement of financial instruments, revised recognition andderecognition requirements for financial instruments and simplified requirements for hedge accounting.
The final version of AASB 9 introduces a new expected-loss impairment model that will require more timelyrecognition of expected credit losses. Specially, the new Standard requires entities to account for expected creditlosses from when financial instruments are first recognised and to recognise full lifetime expected losses on amore timely basis.
Although the directors anticipate that the adoption of AASB 9 may have an impact on the Group’s financialinstruments it is impracticable at this stage to provide a reasonable estimate of such impact.
AASB 15: Revenue from Contracts with Customers (applicable to annual reporting periods beginning on or after1 January 2018, as deferred by AASB 2015-8: Amendments to Australian Accounting Standards - Effective Dateof AASB 15)
When effective, this Standard will replace the current accounting requirements applicable to revenue with asingle, principles-based model. Except for a limited number of exceptions, including leases, the new revenuemodel in AASB 15 will apply to all contracts with customers as well as non-monetary exchanges between entitiesin the same line of business to facilitate sales to customers and potential customers.
The core principle of the Standard is that an entity will recognise revenue to depict the transfer of promised goodsor services to customers in an amount that reflects the consideration to which the entity expects to be entitled inexchange for the goods or services. To achieve this objective, AASB 15 provides the following five-step process:
• identify the contract(s) with a customer;• identify the performance obligations in the contract(s);• determine the transaction price;• allocate the transaction price to the performance obligations in the contract(s); and• recognise revenue when (or as) the performance obligations are satisfied.
The transitional provisions of this Standard permit an entity to either: restate the contracts that existed in eachprior period presented per AASB 108: Accounting Policies, Changes in Accounting Estimates and Errors (subjectto certain practical expedients in AASB 15); or recognise the cumulative effect of retrospective application toincomplete contracts on the date of initial application. There are also enhanced disclosure requirementsregarding revenue.
Although the directors anticipate that the adoption of AASB 15 may have an impact on the Group’s financialstatements, it is impracticable at this stage to provide a reasonable estimate of such impact.
AASB 16: Leases (applicable to annual reporting periods beginning on or after 1 January 2019)
When effective, this Standard will replace the current accounting requirements applicable to leases in AASB 117:Leases and related Interpretations. AASB 16 introduces a single lessee accounting model that eliminates therequirement for leases to be classified as operating or finance leases.
Emefcy Group Limited 33
For
per
sona
l use
onl
y

Emefcy Group LimitedNotes to the Consolidated Financial Statements31 December 2016(continued)
1 Summary of significant accounting policies (continued)
(b) Basis of preparation (continued)
(iii) New standards and interpretations not yet adopted (continued)
The main changes introduced by the new Standard include:
• recognition of a right-to-use asset and liability for all leases (excluding short-term leases with less than 12months of tenure and leases relating to low-value assets);• depreciation of right-to-use assets in line with AASB 116: Property, Plant and Equipment in profit or loss andunwinding of the liability in principal and interest components;• variable lease payments that depend on an index or a rate are included in the initial measurement of the leaseliability using the index or rate at the commencement date;• by applying a practical expedient, a lessee is permitted to elect not to separate non-lease components andinstead account for all components as a lease; and• additional disclosure requirements.
The transitional provisions of AASB 16 allow a lessee to either retrospectively apply the Standard tocomparatives in line with AASB 108 or recognise the cumulative effect of retrospective application as anadjustment to opening equity on the date of initial application.
Although the directors anticipate that the adoption of AASB 16 will impact the Group's financial statements, it isimpracticable at this stage to provide a reasonable estimate of such impact.
All other pending Standards issued have no application to the Group.
(c) Principles of consolidation
(i) Subsidiaries
Subsidiaries are all entities over which the Group has control. The Group controls an entity when the Group isexposed to, or has rights to, variable returns from its involvement with the entity and has the ability to affect thosereturns through its power to direct the activities of the entity. Subsidiaries are fully consolidated from the date onwhich control is transferred to the Group. They are deconsolidated from the date that control ceases.
Intercompany transactions, balances and unrealised gains on transactions between the Group are eliminated.Unrealised losses are also eliminated unless the transaction provides evidence of the impairment of the assettransferred. Accounting policies of subsidiaries have been changed where necessary to ensure consistency withthe policies adopted by the Group.
(d) Operating segments
Operating segments are presented using the 'management approach', where the information presented is on thesame basis as the internal reports provided to the Chief Operating Decision Makers ('CODM'). The CODM isresponsible for the allocation of resources to operating segments and assessing their performance.
(e) Revenue recognition
Revenue is recognised to the extent that it is probable that the economic benefits will flow to the Group and therevenue can be reliably measured. The following specific recognition criteria must also be met before revenue isrecognised.
Interest - control of the right to receive the interest payment.
(f) Contract revenue
Contract revenue and expenses are recognised in accordance with the percentage of completion method. Forfixed price contracts, the stage of completion is measured by reference to expenditure incurred to date as apercentage of estimated total expenditure for each contract.
Where it is probable that a loss will arise from the contract, the excess of total costs over revenue is recognisedimmediately as an expense.
Emefcy Group Limited 34
For
per
sona
l use
onl
y

Emefcy Group LimitedNotes to the Consolidated Financial Statements31 December 2016(continued)
1 Summary of significant accounting policies (continued)
(f) Contract revenue (continued)
Where the outcome of a contract cannot be reliably estimated, contract costs are recognised as an expense asincurred, and where it is probable that the costs will be recovered, revenue is recognised to the extent of costsincurred.
(g) Government grants
Grants from the government are recognised at their fair value where there is a reasonable assurance that thegrant will be received and the group will comply with all attached conditions. Note 10 provides further informationon how the group accounts for government grants.
When the grant relates to an expense item, it is recognised as income over the periods necessary to match thegrant on a systematic basis to the costs that it is expected to compensate.
Grants received from the Government of Israel that are required to be repaid by payment of royalties on salesrevenue or refunded if relevant conditions are not met are recorded as a financial liability (refer to Note 10 forfurther details).
(h) Leases
The minimum lease payments of operating leases, where the lessor effectively retains substantially all of the risksand benefits of ownership of the leased item, are recognised as an expense on a straight-line basis.
(i) Employee benefits
(i) Wages and salaries, annual leave and sick leave
Liabilities for wages and salaries, including non-monetary benefits, annual leave and accumulating sick leaveexpected to be settled within 12 months of the reporting date are recognised in other payables in respect ofemployees' services up to the reporting date and are measured at the amounts expected to be paid when theliabilities are settled.
(ii) Other long-term employee benefit obligations
The liability for annual leave and long service leave not expected to be settled within 12 months of the reportingdate are measured as the present value of expected future payments to be made in respect of services providedby employees up to the reporting date using the projected unit credit method. Consideration is given to expectedfuture wage and salary levels, experience of employee departures and periods of service. Expected futurepayments are discounted using market yields at the reporting date on corporate bonds with terms to maturity andcurrency that match, as closely as possible, the estimated future cash outflows.
(iii) Share-based payments
Under AASB 2 Share Based Payments, the consolidated entity must recognise the fair value of shares granted todirectors, employees and consultants as remuneration as an expense on a pro-rata basis over the vesting periodin profit or loss with a corresponding adjustment to equity.
The consolidated entity provides benefits to employees (including directors) of the consolidated entity in the formof share based payment transactions, whereby employees render services in exchange for shares or rights overshares ("equity-settled transactions"). The cost of these equity-settled transactions with employees (includingdirectors) is measured by reference to fair value at the date they are granted. The fair value is determined usingthe binomial model.
(j) Cash and cash equivalents
Cash and short-term deposits in the Consolidated Statement of Financial Position comprise cash at bank and inhand and short-term deposits with an original maturity of three months or less.
For the purposes of the Consolidated Statement of Cash Flow, cash and cash equivalents consist of cash andcash equivalents as defined above.
Emefcy Group Limited 35
For
per
sona
l use
onl
y

Emefcy Group LimitedNotes to the Consolidated Financial Statements31 December 2016(continued)
1 Summary of significant accounting policies (continued)
(k) Financial asset
Financial assets in the Consolidated Statement of Financial Position comprises of short-term deposits with anoriginal maturity of three months or more.
(l) Restricted cash
Restricted cash is invested in highly liquid deposits, which are used mainly as security for guarantees provided tolessors of office and production premises.
(m) Trade and other receivables
Trade and other receivables are recognised initially at fair value and subsequently measured at amortised costusing the effective interest method, less an allowance for impairment, once they become over due by more than60 days. A separate account records the impairment.
An allowance for a doubtful debt is made when there is objective evidence that the Group will not be able tocollect the debts. The criteria used to determine that there is objective evidence that an impairment loss hasoccurred include whether the Financial Asset is past due and whether there is any other information regardingincreased credit risk associated with the Financial Asset. Bad debts which are known to be uncollectible arewritten-off when identified.
(n) Property, plant and equipment
Property, plant and equipment are stated at historical cost less depreciation. Historical cost includes expenditurethat is directly attributable to the acquisition of the items. Subsequent costs are included in the asset's carryingamount or recognised as a separate asset, as appropriate, only when it is probable that future economic benefitsassociated with the item will flow to the consolidated entity and the cost of the item can be measured reliably. Thecarrying amount of the replaced part is derecognised. AII other repairs and maintenance are charged to profit orloss during the reporting period in which they are incurred.
Depreciation on plant and equipment is calculated using the straight-line method to allocate their cost or revaluedamounts, net of their residual values, over their estimated useful lives, as follows:
Computers and peripheral equipment: 3-15 yearsOffice furniture and equipment: 3-15 yearsProduction line: 4-10 yearsLeasehold improvements: Over the shorter of the term of the lease or useful life of the asset
The assets' residual values and useful lives are reviewed, and adjusted if appropriate, at each reporting date.
An asset's carrying amount is written down immediately to its recoverable amount if the asset's carrying amountis greater than its estimated recoverable amount.
Gains and losses on disposals are determined by comparing proceeds with carrying amount. These are includedin profit or loss.
(o) Inventories
Raw materials, work in progress and finished goods are stated at the lower of cost and net realisable value. Costcomprises direct materials, direct labour and an appropriate proportion of variable and fixed overheadexpenditure, the latter being allocated on the basis of normal operating capacity. Costs are assigned to individualitems of inventory on basis of weighted average costs. Costs of purchased inventory are determined afterdeducting rebates and discounts. Net realisable value is the estimated selling price in the ordinary course ofbusiness less the estimated costs of completion and the estimated costs necessary to make the sale.
Emefcy Group Limited 36
For
per
sona
l use
onl
y

Emefcy Group LimitedNotes to the Consolidated Financial Statements31 December 2016(continued)
1 Summary of significant accounting policies (continued)
(p) Foreign currency translation
(i) Functional Currency
Items included in the financial statements of each of the Group’s entities are measured using the currency of theprimary economic environment in which the entity operates (‘the functional currency’). The financial statements ofEmefcy Group Limited (the parent entity of the Group) are measured in Australian Dollars which is that entity’sfunctional currency.
(ii) Presentation Currency
The consolidated financial statements are presented in US Dollars, which is the Group’s presentation currency.
(iii) Translation and balances
Transactions in foreign currencies are converted to the functional currency at the exchange rate at the date of thetransaction. Amounts payable to and by the Group outstanding at reporting date and denominated in foreigncurrencies have been converted to local currency using rates prevailing at the end of the financial year. Allexchange differences are taken to profit or loss.
(iv) Group companies
The results of foreign subsidiaries and the parent entity are translated to US Dollars at the exchange rate at thedate of the transaction. Assets and liabilities of foreign subsidiaries and the Australian parent are translated to USDollars at exchange rates prevailing at balance date. All resulting exchange differences are recognised in othercomprehensive income and in the foreign currency translation reserve in equity.
(q) Foreign operations
The assets and liabilities of foreign operations are translated into US dollars using the exchange rates at the dateof the transaction. The revenues and expenses of operations not dominated in US dollars are translated into USdollars using the exchange rates at the date of the transaction, which approximate the rates at the dates of thetransactions, for the period. All resulting foreign exchange differences are recognised in other comprehensiveincome through the foreign currency reserve in equity.
(r) Income tax
Deferred income tax is provided on all temporary differences at the reporting date between the tax bases ofassets and liabilities and their carrying amounts for financial reporting purposes.
Deferred income tax liabilities are recognised for all taxable temporary differences except where the deferredincome tax liability arises from the initial recognition of an asset or liability in a transaction that is not a businesscombination and, at the time of the transaction, affects neither the accounting loss nor taxable profit or loss.
Deferred income tax assets are recognised for all deductible temporary differences, carry-forward of unused taxassets and unused tax losses, to the extent that it is probable that taxable profit will be available against whichthe deductible temporary differences, and the carry-forward of unused tax assets and unused tax losses can beutilised except where the deferred income tax asset relating to the deductible temporary differences arises fromthe initial recognition of an asset or liability in a transaction that is not a business combination and, at the time oftransaction, affects neither the accounting loss nor taxable profit or loss.
The carrying amount of deferred income tax assets is reviewed at each reporting date and reduced to the extentthat it is no longer probable that sufficient taxable profit will be available to allow all or part of the deferred incometax asset to be utilised.
Deferred income tax assets and liabilities are measured at the tax rates that are expected to apply to the yearwhen the asset is realised or the liability is settled, based on tax rates (and tax laws) that have been enacted orsubstantively enacted at reporting date.
Income taxes relating to items recognised directly in equity are recognised in equity and not in profit or loss.
Emefcy Group Limited 37
For
per
sona
l use
onl
y

Emefcy Group LimitedNotes to the Consolidated Financial Statements31 December 2016(continued)
1 Summary of significant accounting policies (continued)
(s) Goods and Services Tax (GST)
Revenues, expenses and assets are recognised net of the amount of GST, except:
• where the GST incurred on a purchase of goods and services is not recoverable from the taxation authority,in which case the GST is recognised as part of the cost of acquisition of the asset or as part of the expenseitem as applicable; and
• receivables and payables are stated with the amount of GST included.
Cash flows arising from operating activities are included in the Consolidated Statement of Cash Flow on a grossbasis (i.e. including GST) and the GST component of cash flows arising from investing and financing activities,which is recoverable from, or payable to, the taxation authority are classified as operating cash flows.Commitments and contingencies are disclosed net of the amount of GST recoverable from, or payable to, thetaxation authority. The net amount of GST recoverable from or payable to, the taxation authority is included aspart of the receivables or payables in the Consolidated Statement of Financial Position.
(t) Intangible assets
Intangible assets are initially measured at cost. Following initial recognition, intangible assets are carried at costless any accumulated amortisation and any accumulated impairment losses. The useful lives of intangible assetsare assessed to be either finite or indefinite. Intangible assets with finite lives are amortised over the useful lifeand assessed for impairment whenever there is an indication that the intangible asset may be impaired. Theamortisation period and the amortisation method for an intangible asset with a finite useful life is reviewed at leastat each financial year end. Changes in the expected useful life or the expected pattern of consumption of futureeconomic benefits embodied in the asset are accounted for by changing the amortisation period or method, asappropriate, which is a change in an accounting estimate. The amortisation expense on intangible assets withfinite lives is recognised in profit or loss in the expense category consistent with the function of the intangibleasset.
Research and development
Research costs are expensed as incurred.
An intangible asset arising from development expenditure on an internal project is recognised only when theGroup can demonstrate the technical feasibility of completing the intangible asset so that it will be available foruse or sale, its intention to complete and its ability to use or sell the asset, how the asset will generate futureeconomic benefits, the availability of resources to complete the development and the ability to measure reliablythe expenditure attributable to the intangible asset during its development.
Following initial recognition of the development expenditure, the cost model is applied requiring the asset to becarried at cost less any accumulated amortisation and accumulated impairment losses. Any expenditure socapitalised is amortised over the period of expected benefits from the related project.
The carrying value of an intangible asset arising from development expenditure is tested for impairment annuallywhen the asset is not available for use, or more frequently when an indication of impairment arises during thereporting period.
Amortisation will commence when the assets are ready for use.
(u) Impairment of non-financial assets
The carrying values of non-financial assets are tested for impairment whenever events or changes incircumstances indicate that the carrying amount may not be recoverable.
Emefcy Group Limited 38
For
per
sona
l use
onl
y

Emefcy Group LimitedNotes to the Consolidated Financial Statements31 December 2016(continued)
1 Summary of significant accounting policies (continued)
(u) Impairment of non-financial assets (continued)
An impairment loss is recognised for the amount by which the asset's carrying amount exceeds its recoverableamount. Recoverable amount is the higher of an asset's fair value less costs to sell and value in use. For thepurposes of assessing impairment, assets are grouped at the lowest levels for which there are separatelyidentifiable cash inflows that are largely independent of the cash inflows from other assets or groups of assets(cash-generating units). Non-financial assets that suffer impairment are tested for possible reversal of theimpairment whenever events or changes in circumstances indicate that the impairment may have reversed.
Impairment exists when the carrying value of an asset exceeds its estimated recoverable amount. The asset isthen written down to its recoverable amount.
(v) Trade and other payables
Trade and other payables are carried at amortised cost and represent liabilities for goods and services providedto the Group prior to the end of the financial year that are unpaid and arise when the Group becomes obliged tomake future payments in respect of the purchase of these goods and services. Licensing fees are recognised asan expense when it is confirmed that they are payable by the Group.
(w) Contributed equity
Ordinary shares are classified as equity. Any transaction costs arising on the issue of ordinary shares arerecognised directly in equity as a reduction (net of tax) of the share proceeds received.
(x) Provisions
A provision is recognised if, as a result of a past event, the Group has a present legal or constructive obligationthat can be estimated reliably and it is probable that an outflow of economic benefits will be required to settle theobligation. Where applicable, provisions are determined by discounting the expected future cash flows at apre-tax rate that reflects current market assessments of the time value of money and the risks specific to theliability.
Onerous contractsAn onerous contract is considered to exist where the Group has a contract under which the unavoidable cost ofmeeting the contractual obligations exceed the economic benefits estimated to be received. Present obligationsexisting under onerous contracts are recognised as a provision to the extent that the present obligations exceedthe benefits estimated to be received.
(y) Earnings per share
Basic earnings per share is calculated as net loss attributable to members, adjusted to exclude costs of servicingequity (other than dividends), divided by the weighted average number of ordinary shares, adjusted for any bonuselement.
Diluted earnings per share is calculated as net loss attributable to members, adjusted for:
• costs of servicing equity (other than dividends);• the after tax effect of dividends and interest associated with dilutive potential ordinary shares that have been
recognised as expenses; and• other non-discretionary changes in revenues or expenses during the period that would result from the dilution
of potential ordinary shares; divided by the weighted average number of ordinary shares and dilutive potentialordinary shares, adjusted for any bonus element.
(z) Investments and other financial assets
Investments and other financial assets are initially measured at fair value. Transaction costs are included as partof the initial measurement, except for financial assets at fair value through profit or loss. They are subsequentlymeasured at either amortised cost or fair value depending on their classification. Classification is determinedbased on the purpose of the acquisition and subsequent reclassification to other categories is restricted.
Emefcy Group Limited 39
For
per
sona
l use
onl
y

Emefcy Group LimitedNotes to the Consolidated Financial Statements31 December 2016(continued)
1 Summary of significant accounting policies (continued)
(z) Investments and other financial assets (continued)
Financial assets are derecognised when the rights to receive cash flows from the financial assets have expired orhave been transferred and the consolidated entity has transferred substantially all the risks and rewards ofownership.
Impairment of financial assets
The consolidated entity assesses at the end of each reporting period whether there is any objective evidence thata financial asset or group of financial assets is impaired. Objective evidence includes significant financial difficultyof the issuer or obligor; a breach of contract such as default or delinquency in payments; the lender granting to aborrower concessions due to economic or legal reasons that the lender would not otherwise do; it becomesprobable that the borrower will enter bankruptcy or other financial reorganisation; the disappearance of an activemarket for the financial asset; or observable data indicating that there is a measurable decrease in estimatedfuture cash flows.
The amount of the impairment allowance for financial assets carried at cost is the difference between the asset'scarrying amount and the present value of estimated future cash flows, discounted at the current market rate ofreturn for similar financial assets.
(aa)Significant Accounting Estimates and Assumptions
The carrying amounts of certain assets and liabilities are often determined based on estimates and assumptionsof future events. The key estimates and assumptions that have a significant risk of causing a material adjustmentto the carrying amounts of certain assets and liabilities within the next annual reporting period are:
(i) Fair Value of Financial Liability
Contingent consideration is classified either as equity or a financial liability. Amounts classified as a financialliability are subsequently remeasured to fair value with changes in fair value recognised in profit or loss.
The company assessed the fair value of the financial milestone payments and government grant liabilities, whichincorporate a number of key estimates and assumptions. For further details, please refer to note 10 Trade andOther Payables and note 12 Other Financial Liabilities.
(ii) Income tax
The Group is subject to income taxes in the jurisdictions in which it operates. Significant judgement is required indetermining the provision for income tax. There are many transactions and calculations undertaken during theordinary course of business for which the ultimate tax determination is uncertain. The Group recognises liabilitiesfor anticipated tax audit issues based on the Group's current understanding of the tax law. Where the final taxoutcome of these matters is different from the carrying amounts, such differences will impact the current anddeferred tax provisions in the period in which such determination is made.
(iii) Share-based payment transactions
The consolidated entity measures the share based listing expense and the cost of equity-settled transactions withemployees by reference to the fair value of the equity instruments at the date at which they are granted. The fairvalue is determined by using the Binomial model taking into account the terms and conditions upon which theinstruments were granted. The accounting estimates and assumptions relating to equity-settled share-basedpayments would have no impact on the carrying amounts of assets and liabilities within the next annual reportingperiod but may impact profit or loss and equity.
For further details, please refer to note 19 Share Based Payments.
Emefcy Group Limited 40
For
per
sona
l use
onl
y

Emefcy Group LimitedNotes to the Consolidated Financial Statements31 December 2016(continued)
1 Summary of significant accounting policies (continued)
(aa)Significant Accounting Estimates and Assumptions (continued)
(iv) Fair value measurement hierarchy
The consolidated entity is required to classify all assets and liabilities, measured at fair value, using a three levelhierarchy, based on the lowest level of input that is significant to the entire fair value measurement, being: Level1: Quoted prices (unadjusted) in active markets for identical assets or liabilities that the entity can access at themeasurement date; Level 2: Inputs other than quoted prices included within Level 1 that are observable for theasset or liability, either directly or indirectly; and Level 3: Unobservable inputs for the asset or liability.Considerable judgement is required to determine what is significant to fair value and therefore which category theasset or liability is placed in can be subjective.
The fair value of assets and liabilities classified as level 3 is determined by the use of valuation models. Theseinclude discounted cash flow analysis or the use of observable inputs that require significant adjustments basedon unobservable inputs.
For the year ended 31 December 2016, the consolidated entity has had to measure financial liabilities at fairvalue at Level 3 in respect of a Government Grant Liability recorded at note 10 and Other Financial Liabilities atnote 12. Information on the estimation of the fair value of these financial liabilities is set out in note 20.
Emefcy Group Limited 41
For
per
sona
l use
onl
y

Emefcy Group LimitedNotes to the Consolidated Financial Statements31 December 2016(continued)
2 Operating revenue
Consolidated entity2016
$2015
$
Operating revenueMABR sales in Israel 230,224 -MABR sales outside of Israel 552,428 -Other income 9,772 -
792,424 -
3 Segment information
The Group recognises its operations in Israel as a reporting segment.
The Company has identified its operating segment based on the internal reports that are reviewed and used bythe management team and Board of Directors (who are identified as the Chief Operating Decision Makers(CODM)) in assessing performance and determining the allocation of resources.
The operating segment are identified by the CODM based on the manner in which the expenses are incurred,and for the purpose of making decisions about resource allocation and performance assessment. Discretefinancial information about the operating segment is reported by the executive management team to the Board ona regular basis.
For the financial year ended 31 December 2016, there is no segment information to be disclosed for the newsubsidiary based in Hong Kong as there were no material reportable activities during the period.
2016Israel
$Total
$
Segment revenueOperating revenue 792,424 792,424Unallocated revenue - corporate - 19,234
792,424 811,658
Segment expenseSegment depreciation and amortisation expense (298,828) (298,828)Segment expense (5,875,821) (5,875,821)Unallocated expenses - corporate - (3,701,917)
(6,174,649) (9,876,566)
Net result 5,382,225 9,064,908
AssetsSegment assets 11,411,444 11,411,444Unallocated assets - corporate - 16,185,338
11,411,444 27,596,782
LiabilitiesSegment liabilities (2,221,343) (2,221,343)Unallocated liabilities - corporate - (1,311,790)
(2,221,343) (3,533,133)
Other informationAcquisitions of PPE 368,031 368,031Non current assets by geographical location 3,222,381 3,222,381
Emefcy Group Limited 42
For
per
sona
l use
onl
y

Emefcy Group LimitedNotes to the Consolidated Financial Statements31 December 2016(continued)
3 Segment information (continued)
2015Note Israel
$Total
$
Segment revenueUnallocated revenue - corporate (i) - 1,179Segment expenseSegment depreciation and amortisation expense (70,922) (70,922)Segment expense (741,380) (741,380)Unallocated expenses - corporate (ii) - (8,277,377)
(812,302) (9,089,679)
Net result (812,302) (9,088,500)
AssetsSegment assets 3,965,532 3,965,532Unallocated assets - corporate (iii) - 8,125,788
3,965,532 12,091,320
LiabilitiesSegment liabilities (1,573,718) (1,573,718)Unallocated liabilities - corporate (iv) - (1,155,546)
(1,573,718) (2,729,264)
Other informationAcquisitions of PPE 5,579 5,579Acquisitions of intangible assets 1,652,427 1,652,427Non current assets by geographical location 3,112,955 3,112,955
(a) Unallocated revenue - interest
Consolidated entity2016
$2015
$
Unallocated revenue 19,234 1,179
(b) Unallocated expenses
Australia2016
$2015
$
Listing expense recognised on reverse acquisition - (5,801,624)Other acquisition cash consideration (1,000,000) (2,000,000)Other corporate expenses (2,701,917) (475,753)
(3,701,917) (8,277,377)
Emefcy Group Limited 43
For
per
sona
l use
onl
y

Emefcy Group LimitedNotes to the Consolidated Financial Statements31 December 2016(continued)
3 Segment information (continued)
(c) Unallocated assets
Australia2016
$2015
$
Cash and cash equivalents 16,089,087 8,011,400Other receivables 80,281 61,477Prepayments 15,970 52,911
16,185,338 8,125,788
(d) Unallocated liabilities
Australia2016
$2015
$
Trade and other payables (311,790) (155,546)Other liabilities (1,000,000) (1,000,000)
(1,311,790) (1,155,546)
Intersegment transactions
Intersegment transactions are made at market rates. Intersegment transactions are eliminated on consolidation.
4 Income tax expense
The Group has not commenced significant trading. At its current stage of operational development the Group isnot in a position to satisfy the accounting criteria of AASB112: Income Taxes to bring to account the benefit of itstax losses. Accordingly no current or deferred income tax benefits have yet been brought to account.
(a) Income tax expense
Consolidated entity2016
$2015
$
Current taxCurrent tax - -Total current tax expense - -
Deferred income taxTotal deferred tax expense/(benefit) - -
Income tax expense - -
Emefcy Group Limited 44
For
per
sona
l use
onl
y
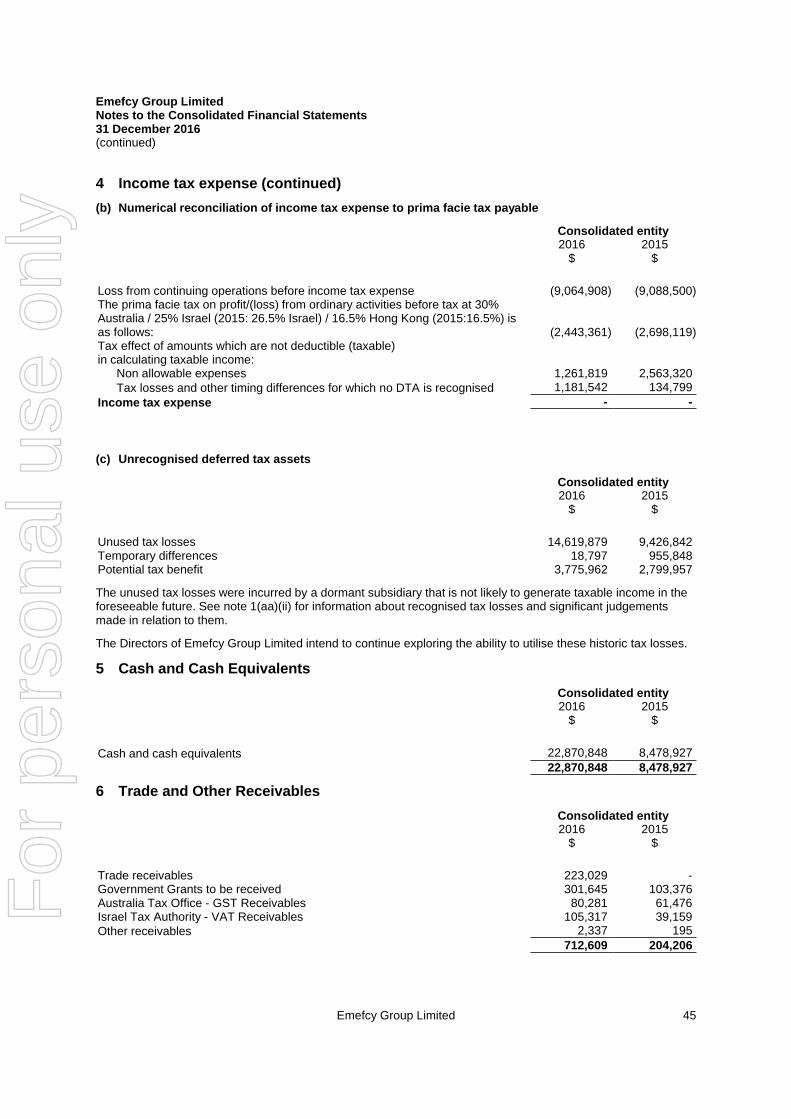
Emefcy Group LimitedNotes to the Consolidated Financial Statements31 December 2016(continued)
4 Income tax expense (continued)
(b) Numerical reconciliation of income tax expense to prima facie tax payable
Consolidated entity2016
$2015
$
Loss from continuing operations before income tax expense (9,064,908) (9,088,500)The prima facie tax on profit/(loss) from ordinary activities before tax at 30%Australia / 25% Israel (2015: 26.5% Israel) / 16.5% Hong Kong (2015:16.5%) isas follows: (2,443,361) (2,698,119)Tax effect of amounts which are not deductible (taxable)in calculating taxable income:
Non allowable expenses 1,261,819 2,563,320Tax losses and other timing differences for which no DTA is recognised 1,181,542 134,799
Income tax expense - -
9,064,908 9,088,500
(c) Unrecognised deferred tax assets
Consolidated entity2016
$2015
$
Unused tax losses 14,619,879 9,426,842Temporary differences 18,797 955,848Potential tax benefit 3,775,962 2,799,957
The unused tax losses were incurred by a dormant subsidiary that is not likely to generate taxable income in theforeseeable future. See note 1(aa)(ii) for information about recognised tax losses and significant judgementsmade in relation to them.
The Directors of Emefcy Group Limited intend to continue exploring the ability to utilise these historic tax losses.
5 Cash and Cash Equivalents
Consolidated entity2016
$2015
$
Cash and cash equivalents 22,870,848 8,478,92722,870,848 8,478,927
6 Trade and Other Receivables
Consolidated entity2016
$2015
$
Trade receivables 223,029 -Government Grants to be received 301,645 103,376Australia Tax Office - GST Receivables 80,281 61,476Israel Tax Authority - VAT Receivables 105,317 39,159Other receivables 2,337 195
712,609 204,206
Emefcy Group Limited 45
For
per
sona
l use
onl
y
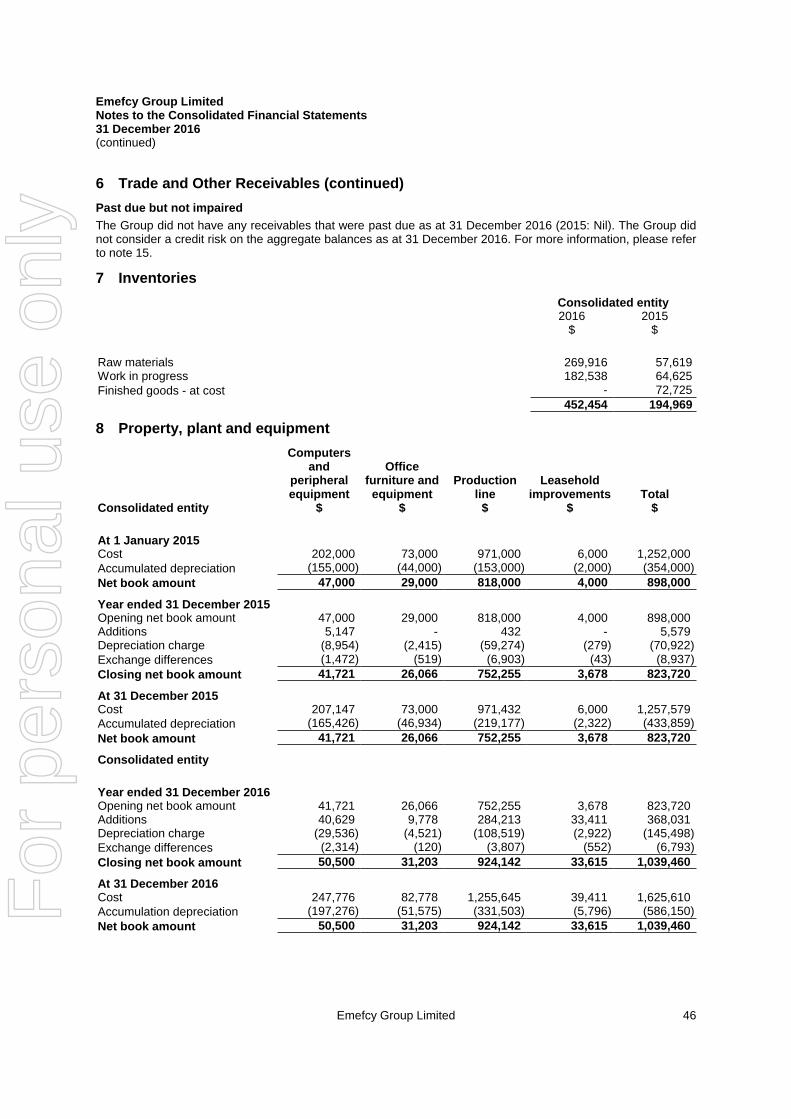
Emefcy Group LimitedNotes to the Consolidated Financial Statements31 December 2016(continued)
6 Trade and Other Receivables (continued)
Past due but not impaired
The Group did not have any receivables that were past due as at 31 December 2016 (2015: Nil). The Group didnot consider a credit risk on the aggregate balances as at 31 December 2016. For more information, please referto note 15.
7 Inventories
Consolidated entity2016
$2015
$
Raw materials 269,916 57,619Work in progress 182,538 64,625Finished goods - at cost - 72,725
452,454 194,969
8 Property, plant and equipment
Consolidated entity
Computersand
peripheralequipment
$
Officefurniture and
equipment$
Productionline
$
Leaseholdimprovements
$Total
$
At 1 January 2015Cost 202,000 73,000 971,000 6,000 1,252,000Accumulated depreciation (155,000) (44,000) (153,000) (2,000) (354,000)
Net book amount 47,000 29,000 818,000 4,000 898,000
Year ended 31 December 2015Opening net book amount 47,000 29,000 818,000 4,000 898,000Additions 5,147 - 432 - 5,579Depreciation charge (8,954) (2,415) (59,274) (279) (70,922)Exchange differences (1,472) (519) (6,903) (43) (8,937)
Closing net book amount 41,721 26,066 752,255 3,678 823,720
At 31 December 2015Cost 207,147 73,000 971,432 6,000 1,257,579Accumulated depreciation (165,426) (46,934) (219,177) (2,322) (433,859)
Net book amount 41,721 26,066 752,255 3,678 823,720
Consolidated entity
Year ended 31 December 2016Opening net book amount 41,721 26,066 752,255 3,678 823,720Additions 40,629 9,778 284,213 33,411 368,031Depreciation charge (29,536) (4,521) (108,519) (2,922) (145,498)Exchange differences (2,314) (120) (3,807) (552) (6,793)
Closing net book amount 50,500 31,203 924,142 33,615 1,039,460
At 31 December 2016Cost 247,776 82,778 1,255,645 39,411 1,625,610Accumulation depreciation (197,276) (51,575) (331,503) (5,796) (586,150)
Net book amount 50,500 31,203 924,142 33,615 1,039,460
Emefcy Group Limited 46
For
per
sona
l use
onl
y

Emefcy Group LimitedNotes to the Consolidated Financial Statements31 December 2016(continued)
8 Property, plant and equipment (continued)
All depreciation and impairment charges are included within depreciation, amortisation and impairment ofnon-financial assets.
9 Intangible assets
Consolidated entityNon-Current assets
Capitaliseddevelopment
costs$
Year ended 31 December 2015Opening net book amount 575,000Additions 1,711,877
Closing net book amount 2,286,877
Year ended 31 December 2016Opening net book amount 2,286,877Additions -Amortisation charge (153,329)
Closing net book amount 2,133,548
Capitalised development costs relates to the development of wastewater treatment technology - MembraneAerated Bio Reactor (MABR). The nature of costs capitalised includes salaries and wages for research anddevelopment staff, technical equipment, materials, patent costs and any other costs associated with building thewastewater treatment technologies. These assets are now currently being sold during the current financial period.
Capitalised development expenditure is stated at cost less accumulated amortisation less any impairment lossesare amortised over the period of expected future sales from the related projects which is estimated to be 15years.
Emefcy Group Limited 47
For
per
sona
l use
onl
y

Emefcy Group LimitedNotes to the Consolidated Financial Statements31 December 2016(continued)
10 Trade and other payables
Consolidated entity2016
$2015
$
CurrentTrade payables 936,292 495,958Accrued expenses 249,284 58,306Government grants 185,755 63,255
1,371,331 617,519
Non-currentGovernment grants 1,038,689 1,111,745
1,038,689 1,111,745
Government Grant Liability
The Group participates in programs sponsored by the Office of the Chief Scientist (“OCS”), for the support ofresearch and development projects. In exchange for the Chief Scientist's participation in the programs, the Groupis required to pay royalties to the Chief Scientist at a rate between 3% and 3.5% of sales to end customers ofproducts developed with funds provided by the Chief Scientist, if and when such sales are recognised. As of 31December 2016, the Group has received grants amounted to US$1,478,000. As of December 31, 2016 and2015, the Group recognised a liability to the OCS in the amount of $957,828 and $993,000, respectively for theobligation for future royalty payments. The recognition of a liability for the Group to repay the grants from futureroyalty payments is based on its estimation at the end of each year. The discounted rate used by the Group forthe liability is 13.7%. As of 31 December 2016, royalties of US$12,486 have been paid.
The Group has also participated in programs sponsored by the Ministry of National Infrastructures (“MNI”), for thesupport of research and development projects. In exchange for the MNI's participation in the programs, theCompany is required to pay royalties to the MNI at a rate of 5% of the sales to end customers of productsdeveloped with funds provided by the MNI, if and when such sales are recognized. As of 31 December 2016, theGroup received grants in the total amount of US$297,000 and no royalties were paid. As of 31 December 2016and 2015, the Group recognized a liability to the MNI in the amount of $266,616 and $182,000, respectively. Theexceptions of the Group to pay the grants are based on its estimation at the end of each year. The discountedrate used by the Group for the liability is 13.7%.
11 Current liabilities - Provisions
Consolidated entity2016
$2015
$
ProvisionsProvision - Onerous contracts 123,113 -
Emefcy Group Limited 48
For
per
sona
l use
onl
y

Emefcy Group LimitedNotes to the Consolidated Financial Statements31 December 2016(continued)
12 Other financial liabilities
Consolidated entity2016
$2015
$
CurrentAcquisition milestone 2 payable 1,000,000 -
1,000,000 -
Non-currentAcquisition milestone 1 payable - 1,000,000
- 1,000,000
As part of the transaction between Emefcy Group Limited and Emefcy Limited (Israel), a maximum liability ofUS$2 million is payable to a shareholder of Emefcy Limited (Israel) on completion of the acquisition in lieu ofreceiving shares in Emefcy Group Limited subsequent to the satisfaction of the two commercial milestones(US$1 million per milestone). The transaction was completed on 18 December 2015. Details of the twocommercial milestones and the satisfaction of the milestones are as follow:
Milestone 1 - A module of the SABRE (Spiral Aerobic Biofilm Reactor) (now referred as MABR) has beendelivered to the first customer's site on, or before 18 June 2016. Having met the milestone on 29 March 2016 andcompleting of an additional capital raising in a private placement on 25 July 2016, the Group paid the first US$1million to the shareholder on 10 August 2016.
Milestone 2 - The achievement of cumulative US$2 million in sales within 24 months of the transactioncompletion date. As at 31 December 2016, the directors of the Group are satisfied that the second milestone willbe achieved in the next few months and has provided for the amount payable.
13 Contributed equity
2016No.
2015No.
2016$
2015$
Ordinary shares (a) 279,551,054 199,937,410 51,271,509 28,325,226Options (b) 18,742,946 15,856,590 1,857,910 156,549Share capital 298,294,000 215,794,000 53,129,419 28,481,775
(a) Ordinary Shares - Fully Paid Number of shares $
NotesOpening balance 1 January 2015 4,324,138 12,597,640Elimination of issued capital in Emefcy Limited (Israel) (4,324,138) -Capital raising - Emefcy Limited (Israel) - 797,079Savcor issued capital at pre-acquisition 42,671,357 -Deemed fair value of consideration to Savcor shareholders onReverse acquisition - 6,077,632Shares issued to Emefcy Limited (Israel) vendors on Reverseacquisition 65,000,000 -Issue of shares AU$0.20 pursuant to the Prospectus 69,066,053 9,836,997Shares issued to consultants during the year 700,000 99,700
177,437,410 29,409,048Transaction costs arising on share issue (iii) - (1,083,822)Deferred consideration shares to be issued (i) 22,500,000 -Balance 31 December 2015 199,937,410 28,325,226
Emefcy Group Limited 49
For
per
sona
l use
onl
y

Emefcy Group LimitedNotes to the Consolidated Financial Statements31 December 2016(continued)
13 Contributed equity (continued)
Number of shares $Opening balance 1 January 2016 177,437,410 28,325,226Shares issued to consultants during the year 150,000 81,517Private placement issued at AU$0.64 per share 49,400,000 22,595,948Exercise of options 7,563,644 355,078Deferred consideration shares to be issued 22,500,000 -
257,051,054 51,357,769Transaction costs arising on share issue - (86,260)Deferred consideration shares to be issued (ii) 22,500,000 -
Balance 31 December 2016 279,551,054 51,271,509
(i) Deferred consideration
The deferred consideration shares relate to the obligation for the Company to issue a further 22,500,000 sharesto Emefcy Limited (Israel) vendors upon the satisfaction of the first milestone that a module of the SABRE (SpiralAerobic Biofilm Reactor) has been delivered to the first customer’s site on, or before 18 June 2016. Thismilestone was satisfied on 29th March 2016.
(ii) Deferred Consideration - Milestone 2
The deferred consideration shares relate to the obligation for the Company to issue a further 22,500,000 sharesto Emefcy Limited (Israel) vendors upon the satisfaction of the second milestone which is "Emefcy has enteredinto firm contractual engagements representing an aggregate US$2 million (including all associated grants andincentives) within 24 months of the date of completion of the transaction between Emefcy Group Limited andEmefcy Limited (18 December 2015). As at 31 December 2016, the Directors are satisfied that the secondmilestone will be achieved in the next few months.
(iii) Transaction costs relating to share issues
Under AASB 132, incremental costs that are directly attributable to issuing new shares should be deducted fromequity. The share issue expense relates to costs directly attributable to the issuing of new shares, costsassociated with the listing have been deducted from equity.
Ordinary shares
Ordinary shares entitle the holder to participate in dividends and the proceeds on winding up of the Company inproportion to the number of shares held. At shareholder meetings, each ordinary share is entitled to one votewhen a poll is called; otherwise each shareholder has one vote on a show of hands.
(b) Options
2015 Number of options $wOpening balance (i) 89,900 62,752Elimination of issued options in Emefcy Limited (Israel) (i) (89,900) -Unlisted options issued in Emefcy (ii) - 3,175Unlisted options issued in Savcor 8,213,644 -Unlisted options issued to Directors pursuant to the Prospectus 5,000,000 90,622Unlisted options issued to employees 2,642,946 -
Balance at 31 December 2015 15,856,590 156,549
Emefcy Group Limited 50
For
per
sona
l use
onl
y

Emefcy Group LimitedNotes to the Consolidated Financial Statements31 December 2016(continued)
13 Contributed equity (continued)
(iv) Options (continued)
2016 Number of options $wOpening balance 15,856,590 156,549Reversal of unlisted options issued to employees (2,642,946) -Unlisted options issued to Directors pursuant to the Prospectus - 289,212Unlisted options issued to employees 5,587,946 281,685Unlisted options issued to Consultants 6,555,000 921,100Unlisted options issued to Directors 2,500,000 263,942Exercised options (7,563,644) -Cancelled options (1,550,000) (54,578)
Balance at 31 December 2016 18,742,946 1,857,910
(i) These options were cancelled as part of the transaction involving the acquisition of Emefcy Group Limited.
(ii) Unlisted Options issued in Emefcy under the Employee Stock Option Plan (ESOP)
Under the ESOP, options to purchase ordinary shares of the Company may be granted, from time-to-time, toemployees, advisors, directors, consultants and service providers of the Company, each option granted can beexercised to one ordinary share of the Company. The default vesting schedule is for 33.33% to vest one yearfrom the commencement date, and an additional 8.33% thereof to vest at the end of each successivethree-month period thereafter, subject to continued employment or service.
(c) Summary of all unlisted options in existence
Grant date Expiry date Exercise priceNumber under
option5 June 2015 5 June 2017 AU 15 cents 650,00018 December 2015 18 December 2018 AU 30 cents 2,500,00018 December 2015 18 December 2019 AU 40 cents 2,500,00028 January 2016 31 July 2018 AU 30 cents 2,000,00028 January 2016 31 January 2019 AU 40 cents 2,000,00011 April 2016 13 April 2020 AU 35 cents 500,00029 February 2016 23 December 2019 AU 30 cents 431,47329 February 2016 23 December 2019 AU 40 cents 431,47329 February 2016 28 February 2020 AU 30 cents 100,00029 February 2016 29 February 2020 AU 40 cents 100,00023 March 2016 23 March 2020 AU 30 cents 75,00023 March 2016 23 March 2020 AU 40 cents 75,00023 March 2016 12 April 2020 AU 30 cents 50,00023 March 2016 12 April 2020 AU 40 cents 50,00017 May 2016 16 May 2020 AU 59 cents 400,00017 May 2016 28 May 2020 AU 59 cents 100,00018 May 2016 18 May 2020 AU 40 cents 1,000,00018 May 2016 18 May 2021 AU 40 cents 1,000,00015 June 2016 31 May 2020 AU 93 cents 1,000,00025 July 2016 31 July 2018 AU 64 cents 1,800,00025 July 2016 25 July 2020 AU 79 cents 250,00025 August 2016 25 July 2020 AU 87 cents 325,0001 August 2016 1 August 2018 AU 70 cents 55,00023 September 2016 25 September 2020 AU 1.00 dollar 200,00027 October 2016 31 October 2019 AU 64 cents 100,00027 October 2016 26 October 2020 AU 1.07 dollar 350,0001 November 2016 31 October 2020 AU 74 cents 500,00023 September 2016 9 November 2020 AU 1.00 dollar 200,000
18,742,946
Emefcy Group Limited 51
For
per
sona
l use
onl
y

Emefcy Group LimitedNotes to the Consolidated Financial Statements31 December 2016(continued)
13 Contributed equity (continued)
(v) Summary of all unlisted options in existence (continued)
The general terms and conditions of the options were:
• No dividends or voting rights attached;• Exercise price set at a premium to Value Weighted Average Price (VWAP) of five days prior to the date of
entitlement;• Subject to vesting periods; and• All shares allotted upon exercise of options will upon allotment rank pari passu in all respect with other
shares.
14 Reserve
Consolidated entity2016
$2015
$
Foreign currency reserve (654,970) 226,173
Foreign currency translation reserve
The foreign currency translation reserve is used to record exchange differences on translation of foreigncontrolled subsidiaries. Amounts are reclassified to profit or loss when the investment is disposed of.
15 Financial risk management
The Group’s activities expose it to a variety of financial risks: market risk (including currency risk, interest rate riskand price risk), credit risk and liquidity risk. The Group’s overall risk management program focuses on theunpredictability of financial markets and seeks to minimise potential adverse effects on the financial performanceof the Group. The Group uses different methods to measure different types of risk to which it is exposed.
The Board provides principles for overall risk management, as well as policies covering specific areas, such asforeign exchange risk, interest rate risk, credit risk and investment of excess liquidity.
(a) Market risk
(i) Foreign exchange risk
The Group undertakes certain transactions denominated in foreign currency and is exposed to foreign currencyrisk through foreign exchange rate fluctuations.
Foreign exchange rate risk arises from future commercial transactions and recognised financial assets andfinancial liabilities denominated in a currency that is not the Group’s functional currency. The Group does notmake use of derivative financial instruments to hedge foreign exchange risk.
The carrying amounts of the Group’s foreign currency denominated monetary assets and liabilities at thereporting date are as follows:
Consolidatedentity 31 December 2016 31 December 2015
ILS$
EUR$
AUD$
ILS$
EUR$
AUD$
Assets 8,596,089 12,864 1,918,788 3,582,754 187,873 1,086,839Liabilities (2,047,337) - (165,977) (1,573,718) - (155,546)
(6,548,752) (12,864) (1,752,811) (2,009,036) (187,873) (931,293)
Emefcy Group Limited 52
For
per
sona
l use
onl
y
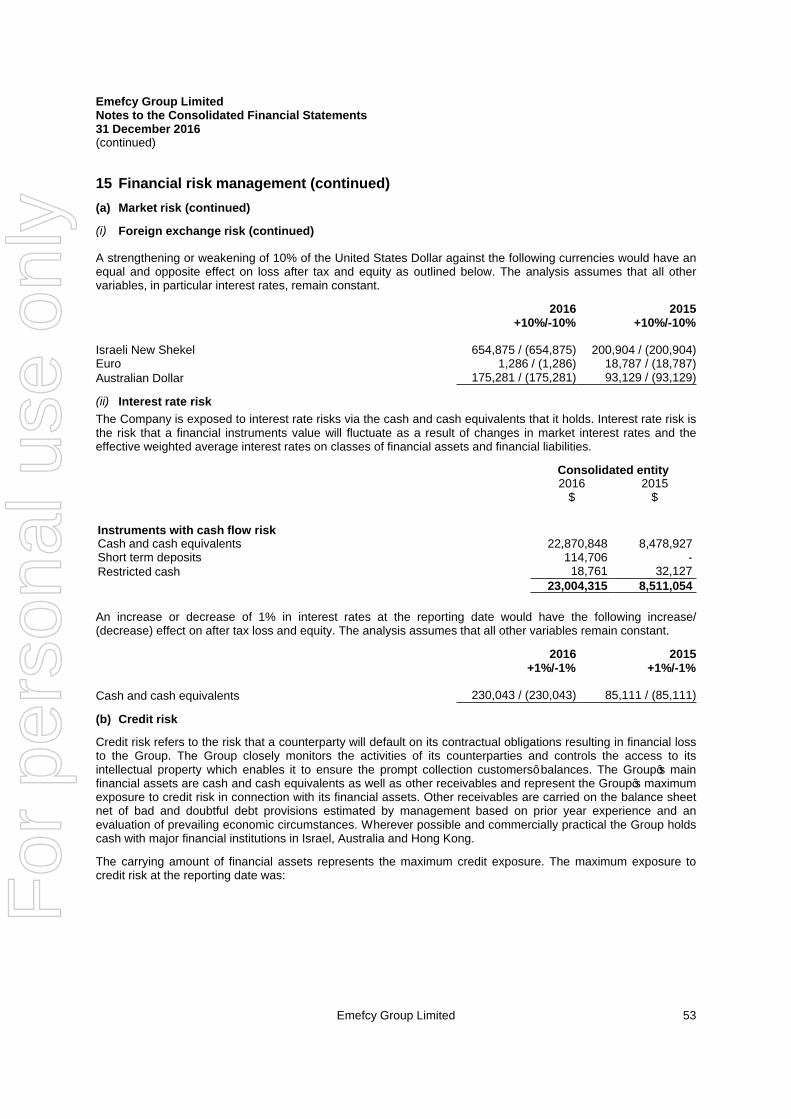
Emefcy Group LimitedNotes to the Consolidated Financial Statements31 December 2016(continued)
15 Financial risk management (continued)
(a) Market risk (continued)
(i) Foreign exchange risk (continued)
A strengthening or weakening of 10% of the United States Dollar against the following currencies would have anequal and opposite effect on loss after tax and equity as outlined below. The analysis assumes that all othervariables, in particular interest rates, remain constant.
2016 2015+10%/-10% +10%/-10%
wIsraeli New Shekel 654,875 / (654,875) 200,904 / (200,904)Euro 1,286 / (1,286) 18,787 / (18,787)Australian Dollar 175,281 / (175,281) 93,129 / (93,129)
(ii) Interest rate risk
The Company is exposed to interest rate risks via the cash and cash equivalents that it holds. Interest rate risk isthe risk that a financial instruments value will fluctuate as a result of changes in market interest rates and theeffective weighted average interest rates on classes of financial assets and financial liabilities.
Consolidated entity2016
$2015
$
Instruments with cash flow riskCash and cash equivalents 22,870,848 8,478,927Short term deposits 114,706 -Restricted cash 18,761 32,127
23,004,315 8,511,054
An increase or decrease of 1% in interest rates at the reporting date would have the following increase/(decrease) effect on after tax loss and equity. The analysis assumes that all other variables remain constant.
2016 2015+1%/-1% +1%/-1%
wCash and cash equivalents 230,043 / (230,043) 85,111 / (85,111)
(b) Credit risk
Credit risk refers to the risk that a counterparty will default on its contractual obligations resulting in financial lossto the Group. The Group closely monitors the activities of its counterparties and controls the access to itsintellectual property which enables it to ensure the prompt collection customers’ balances. The Group’s mainfinancial assets are cash and cash equivalents as well as other receivables and represent the Group’s maximumexposure to credit risk in connection with its financial assets. Other receivables are carried on the balance sheetnet of bad and doubtful debt provisions estimated by management based on prior year experience and anevaluation of prevailing economic circumstances. Wherever possible and commercially practical the Group holdscash with major financial institutions in Israel, Australia and Hong Kong.
The carrying amount of financial assets represents the maximum credit exposure. The maximum exposure tocredit risk at the reporting date was:
Emefcy Group Limited 53
For
per
sona
l use
onl
y

Emefcy Group LimitedNotes to the Consolidated Financial Statements31 December 2016(continued)
15 Financial risk management (continued)
(b) Credit risk (continued)
Consolidated entity2016
$2015
$
Cash and cash equivalents 22,870,848 8,478,927Short term deposits 114,706 -Restricted cash 18,761 32,127Trade and other receivables 712,609 204,206
23,716,924 8,715,260
(c) Liquidity risk
Liquidity risk is the risk that the consolidated entity will not be able to meet its financial obligations as they falldue. Prudent liquidity risk management implies maintaining sufficient cash balances and access to equityfunding.
Maturity profile
The table below analyses the consolidated entity’s financial liabilities into relevant maturity groupings based onthe remaining period at the reporting date to the contractual maturity date. The amounts disclosed in the table arethe contracted undisclosed cash flows.
Contractual maturities of financial liabilities Less than6 months
Greaterthan 6
months
Totalcontractual
cashflows
Carryingamount
At 31 December 2016 $ $ $ $
Trade and other payables 1,371,331 1,038,689 2,410,020 2,410,020Other accounts payable - 1,000,000 1,000,000 1,000,000
1,371,331 2,038,689 3,410,020 3,410,020
At 31 December 2015Trade and other payables 617,519 1,111,745 1,729,264 1,729,264Other accounts payable - 1,000,000 1,000,000 1,000,000
Total non-derivatives 617,519 2,111,745 2,729,264 2,729,264
(d) Capital risk management
The Group's objectives when managing capital are to safeguard the Group's ability to continue as a goingconcern and to maintain an optimal capital structure so as to maximise shareholder value. In order to maintain orachieve an optimal capital structure, the Group may issue new shares or reduce its capital, subject to theprovisions of the Group's constitution. The capital structure of the Group consists of equity attributed to equityholders of the Group, comprising contributed equity, reserves and accumulated losses. By monitoringundiscounted cash flow forecasts and actual cash flows provided to the Board by the Group's Management theBoard monitors the need to raise additional equity from the equity markets.
Emefcy Group Limited 54
For
per
sona
l use
onl
y

Emefcy Group LimitedNotes to the Consolidated Financial Statements31 December 2016(continued)
16 Cash flow information
Reconciliation of loss after income tax to net cashflow from operating activities
Consolidated entity2016
$2015
$
Loss for the period (9,064,908) (9,088,500)Adjustment for
Depreciation and amortisation expenses 298,828 70,922Equity issued for nil consideration 1,782,878 190,322Fair value adjustment 61,930 6,077,632Accrued capital raising costs - (21,289)Foreign exchange differences (1,079,544) 188,464Provision for losses 123,113 -Listing expense recognised on acquisition 1,000,000 -
Change in operating assets and liabilities:Increase in trade and other receivables (508,403) (5,564)(Increase) / decrease in other current assets (394,371) 263,106Increase in accounts payable 618,826 807,264Increase in other payables - 1,000,000
Net cashflow used in operating activities (7,161,651) (517,643)
17 Events occurring after the reporting period
No matters or circumstances have arisen since the end of the reporting period which significantly affected or maysignificantly affect the operations of the economic entity, the result of those operations or the state of affairs of theeconomic entity in subsequent financial years.
18 Subsidiaries
NamePlace ofincorporation
Ownership interest
2016 2015Parent EntityEmefcy Group Limited Australia N/A N/ASubsidiaries of Emefcy Group LimitedEmefcy Limited (Israel) Israel 100% 100%Emefcy Limited (Hong Kong) Hong Kong 100% N/A
Emefcy Group Limited 55
For
per
sona
l use
onl
y

Emefcy Group LimitedNotes to the Consolidated Financial Statements31 December 2016(continued)
19 Share-based payments
On 10th August 2016, 150,000 shares were issued to a consultant at an issue price of AU$0.71 per share and a total transactional value of AU$106,500 (US$ 81,517) asidentified in Note 13 - Contributed equity.
Employee Option Plan
A share option plan has been established by the consolidated entity and approved by shareholders at a general meeting, whereby the consolidated entity may, at the discretionof the Remuneration and Nomination Committee, grant options over ordinary shares in the company to certain key management personnel of the consolidated entity. Theoptions are issued for nil consideration and are granted in accordance with performance guidelines established by the Nomination and Remuneration Committee.
Set out below are summaries of options granted under the plan:
2016
Grant date Expiry DateBalance at the
start of the year Exercise Price Granted Exercised VestedCancelled /
ReversedBalance at the
end of the yeara
11/03/2015 1/12/2016 4,227,868 A$0.06 - 4,227,868 - - -27/03/2015 1/12/2016 528,483 A$0.06 - 528,483 - - -5/06/2015 1/12/2016 153,610 A$0.06 - 153,610 - - -
22/06/2015 1/12/2016 1,844,777 A$0.06 - 1,844,777 - - -29/07/2015 1/12/2016 558,906 A$0.06 - 558,906 - - -5/06/2015 5/06/2017 900,000 A$0.15 - 250,000 650,000 - 650,000
18/12/2015 18/12/2018 2,500,000 A$0.30 - - - - 2,500,00018/12/2015 18/12/2019 2,500,000 A$0.40 - - - - 2,500,00023/12/2015 23/12/2019 321,473 A$0.30 - - - 321,473* -23/12/2015 23/12/2019 1,321,473 A$0.40 - - - 1,321,473* -23/12/2015 23/12/2019 1,000,000 A$0.40 - - - 1,000,000* -28/01/2016 31/07/2018 - A$0.30 2,000,000 - 2,000,000 - 2,000,00028/01/2016 31/01/2019 - A$0.40 2,000,000 - - - 2,000,00011/04/2016 13/04/2020 - A$0.35 500,000 - - - 500,00029/02/2016 28/02/2020 - A$0.30 1,418,973 - 143,824 762,500 656,47329/02/2016 28/02/2020 - A$0.40 1,418,973 - 143,824 762,500 656,47317/05/2016 28/05/2020 - A$0.59 100,000 - - - 100,000
Emefcy Group Limited 56
For
per
sona
l use
onl
y

Emefcy Group LimitedNotes to the Consolidated Financial Statements31 December 2016(continued)
19 Share-based payments (continued)
Employee Option Plan (continued)
Grant date Expiry DateBalance at the
start of the year Exercise Price Granted Exercised VestedCancelled /
ReversedBalance at the
end of the year17/05/2016 16/05/2020 - A$0.59 400,000 - - - 400,00018/05/2016 18/05/2020 - A$0.40 1,000,000 - - - 1,000,00018/05/2016 18/05/2021 - A$0.40 1,000,000 - - - 1,000,00015/06/2016 31/05/2020 - A$0.93 1,000,000 - - - 1,000,00025/07/2016 31/07/2018 - A$0.64 1,800,000 - 1,800,000 - 1,800,00025/07/2016 25/07/2020 - A$0.79 250,000 - - - 250,00025/08/2016 25/07/2020 - A$0.87 350,000 - - 25,000 325,0001/08/2016 1/08/2018 - A$0.70 55,000 - 55,000 - 55,000
23/09/2016 26/09/2020 - A$1.00 200,000 - - - 200,00027/10/2016 31/10/2019 - A$0.64 100,000 - 100,000 - 100,00017/10/2016 27/10/2020 - A$1.07 350,000 - - - 350,0001/11/2016 1/11/2020 - A$0.74 500,000 - - - 500,000
23/09/2016 9/11/2020 - A$1.00 200,000 - - - 200,00015,856,590 14,642,946 7,563,644 4,307,648 4,192,946 18,742,946
*Options were reversed andre-approved during 2016.
Weighted average exercise price 0.47
Emefcy Group Limited 57
For
per
sona
l use
onl
y

Emefcy Group LimitedNotes to the Consolidated Financial Statements31 December 2016(continued)
19 Share-based payments (continued)
Employee Option Plan (continued)
2015
Grant dateExpiry
Date
Balance atthe start of
the yearExercise
Price Granted Exercised VestedBalance at the
end of the year11/03/2015 1/12/2016 - A$0.06 4,227,868 - 4,227,868 4,227,86827/03/2015 1/12/2016 - A$0.06 528,483 - 528,483 528,4835/06/2015 1/12/2016 - A$0.06 153,610 - 153,610 153,61022/06/2015 1/12/2016 - A$0.06 1,844,777 - 1,844,777 1,844,77729/07/2015 1/12/2016 - A$0.06 558,906 - 558,906 558,9065/06/2015 5/06/2017 - A$0.15 900,000 - 900,000 900,00018/12/2015 18/12/2018 - A$0.30 2,500,000 - - 2,500,00018/12/2015 18/12/2019 - A$0.40 2,500,000 - - 2,500,00023/12/2015 23/12/2019 - A$0.30 321,473 - - 321,47323/12/2015 23/12/2019 - A$0.40 1,321,473 - - 1,321,47323/12/2015 23/12/2019 - A$0.40 1,000,000 - - 1,000,000
15,856,590 - 8,213,644 15,856,590
Weighted average exercise price 0.21
The weighted average remaining contractual life of options outstanding at year end is 2.60 years (2015: 2.30years).
(i) Fair value of options granted
For the options granted during the current financial year, the valuation model inputs used to determine the fairvalue at the grant date are outlined below. The expected volatility reflects the assumption that the historicalvolatility is indicative of future trends, which may also not necessarily be the actual outcome.
Grant dateExpiry
DateShare price at
grant dateExpected
Volatility (%)Exercise
PriceDividend
yield
Risk-freeinterest
rateFair value at
grant date$ $
a28/01/2016 31/07/2018 A$0.21 100% A$0.30 Nil 1.85% US$0.105428/01/2016 31/01/2019 A$0.21 100% A$0.40 Nil 1.90% US$0.103911/04/2016 13/04/2020 A$0.46 100% A$0.35 Nil 1.92% US$0.338029/02/2016 28/02/2020 A$0.22 100% A$0.30 Nil 1.84% US$0.142129/02/2016 28/02/2020 A$0.22 100% A$0.40 Nil 1.83% US$0.130417/05/2016 28/05/2020 A$0.62 100% A$0.59 Nil 1.74% US$0.433217/05/2016 16/05/2020 A$0.62 100% A$0.59 Nil 1.74% US$0.433218/05/2016 18/05/2020 A$0.60 100% A$0.40 Nil 1.73% US$0.450818/05/2016 18/05/2021 A$0.60 100% A$0.40 Nil 1.85% US$0.476415/06/2016 31/05/2020 A$0.79 100% A$0.93 Nil 1.64% US$0.525725/07/2016 31/07/2018 A$0.74 100% A$0.64 Nil 1.40% US$0.416825/07/2016 25/07/2020 A$0.74 100% A$0.79 Nil 1.54% US$0.502925/08/2016 25/07/2020 A$0.74 100% A$0.87 Nil 1.48% US$0.48771/08/2016 1/08/2018 A$0.65 100% A$0.70 Nil 1.36% US$0.330623/09/2016 26/09/2020 A$0.93 100% A$1.00 Nil 1.71% US$0.632527/10/2016 31/10/2019 A$0.92 100% A$0.64 Nil 1.72% US$0.634017/10/2016 27/10/2020 A$0.92 100% A$1.07 Nil 1.86% US$0.61531/11/2016 1/11/2020 A$0.96 100% A$0.74 Nil 1.86% US$0.702923/09/2016 9/11/2020 A$0.93 100% A$1.00 Nil 1.73% US$0.6396
Emefcy Group Limited 58
For
per
sona
l use
onl
y

Emefcy Group LimitedNotes to the Consolidated Financial Statements31 December 2016(continued)
19 Share-based payments (continued)
(a) Expenses arising from share-based payment transactions
Consolidated entity2016
$2015
$
Share based payment expenseConsultant Share based payments 1,002,617 99,700Employee Share based payments 227,107 -Director Share based payments 553,154 90,622
1,782,878 190,322
20 Recognised fair value measurements
Fair value hierarchy
All assets and liabilities for which fair value is measured or disclosed are categorised according to the fair valuehierarchy as follows:
• Level 1 - Quoted prices (unadjusted) in active markets for identical assets or liabilities;• Level 2 - Inputs other than quoted prices included in Level 1 that are observable for the asset or liability,
either directly or indirectly; and• Level 3 - Inputs for the assets or liability that are not based on observable market data (unobservable inputs).
2016 Level 1 Level 2 Level 3 Totala $ $ $ $
Recurring fair value measurementsFinancial liabilitiesGovernment grant liability - - 1,224,444 1,224,444Other financial liabilitiesAcquisition milestone 2 payable (note 12) - - 1,000,000 1,000,000
- - 2,224,444 2,224,444
2015 Level 1 Level 2 Level 3 Totala $ $ $ $
Recurring fair value measurementsFinancial liabilitiesGovernment grant liability - - 1,175,000 1,175,000Other financial liabilitiesAcquisition milestone 1 payable (note 12) - - 1,000,000 1,000,000
- - 2,175,000 2,175,000
Disclosed fair values
The group also has assets and liabilities which are not measured at fair value, but for which fair values aredisclosed in the notes to the financial statements.
Due to their short-term nature, the carrying amount of trade receivables and payables are assumed toapproximate their fair values because the impact of discounting is not significant.
Valuation techniques and assumptions used to derive Level 3 fair values recognised in the financialstatements
The fair value of the government grant liability is determined by the expected time period that the grant liability isto be repaid from the royalty stream from future revenue discounted over time at a rate of 13.7% (2015: 14.9%)
Emefcy Group Limited 59
For
per
sona
l use
onl
y

Emefcy Group LimitedNotes to the Consolidated Financial Statements31 December 2016(continued)
20 Recognised fair value measurements (continued)
Reconciliation of Level 3 fair value movements
The following table sets out the movements in Level 3 fair values for recurring measurements.
Government grant $Opening Balance at 1 January 2015 595,000Adjustment to fair value of liability 580,000Closing Balance at 31 December 2015 1,175,000Adjustment to fair value of liability 49,444
Closing Balance at 31 December 2016 1,224,444
21 Key Management Personnel Disclosures
Compensation
The aggregate compensation made to directors and other members of key management personnel of the Groupis set out below:
Consolidated entity2016
$2015
$
Short-term employee benefits 1,650,165 811,955Share based payments 604,174 95,756
2,254,339 907,711
The above Key Management Personnel disclosures represents the remuneration of Key Management Personneldefined in the Remuneration Report and paid or payable for the 12 months ended 31 December 2016 and 31December 2015 by Emefcy Limited (Israel) and amounts payables by Emefcy Group Limited (the legal parent)from 18 December 2015 to 31 December 2015.
For more information on Key Management Personnel Compensation disclosed under the Corporations Act 2001,please refer to Remuneration Report contained under Directors’ Report.
22 Remuneration of auditors
During the year the following fees were paid or payable for services provided by the auditor of the parent entity,its related practices and non-related audit firms:
BDO East Coast Partnership
Audit and other assurance services
Consolidated entity2016
$2015
$
Audit and review of financial statements - BDO East Coast Partnership 53,214 36,490Audit and review of the financial statements – BDO Israel 23,600 14,920
Total remuneration for audit and other assurance services 76,814 51,410
(i) Taxation services
Taxation servicesTax compliance services - BDO East Coast Partnership 13,973 -
Emefcy Group Limited 60
For
per
sona
l use
onl
y

Emefcy Group LimitedNotes to the Consolidated Financial Statements31 December 2016(continued)
23 Commitments
(a) The Company leases premises for the year ended 31 December 2016. The aggregate minimum rentalcommitments under the non-cancellable rent agreements as at 31 December 2016 are $1,160,000. Totalrent expenses for the years ended 31 December 2016 and 2015 were $139,000 and $141,000,respectively.
(b) The Company leases its motor vehicles under lease agreements. As at 31 December 2016, theminimum payment under these operating leases is $49,373.
(c) As at 31 December 2016 and 2015, the Company provided a bank guarantee for the fulfilment of itslease commitments in the amount of approximately $19,000 and $32,000, respectively.
(d) The Company has a government grant liability of $1,224,444 for details refer to Note 10 - Trade andother payables.
24 Related party transactions
Parent entity
Emefcy Group Limited is the legal parent entity in the consolidated entity.
Subsidiaries
Interests in subsidiaries are set out in note 18.
Key management personnel
Disclosures relating to key management personnel are set out in note 21 and the remuneration report in thedirectors' report.
Loans to/from related parties
There were no loans to or from related parties at the current and previous reporting date.
Other than the issue of shares and options, no other related party transactions have been entered into betweenkey management personnel and the group during the financial year 2016 and 2015.
25 Loss per share
(a) Basic loss per share
Consolidated entity2016 2015
Loss attributable to the ordinary equity holders of the Company (0.04) (0.13)
(b) Diluted loss per share
Consolidated entity2016 2015
Loss attributable to the ordinary equity holders of the Company (0.04) (0.13)
Emefcy Group Limited 61
For
per
sona
l use
onl
y
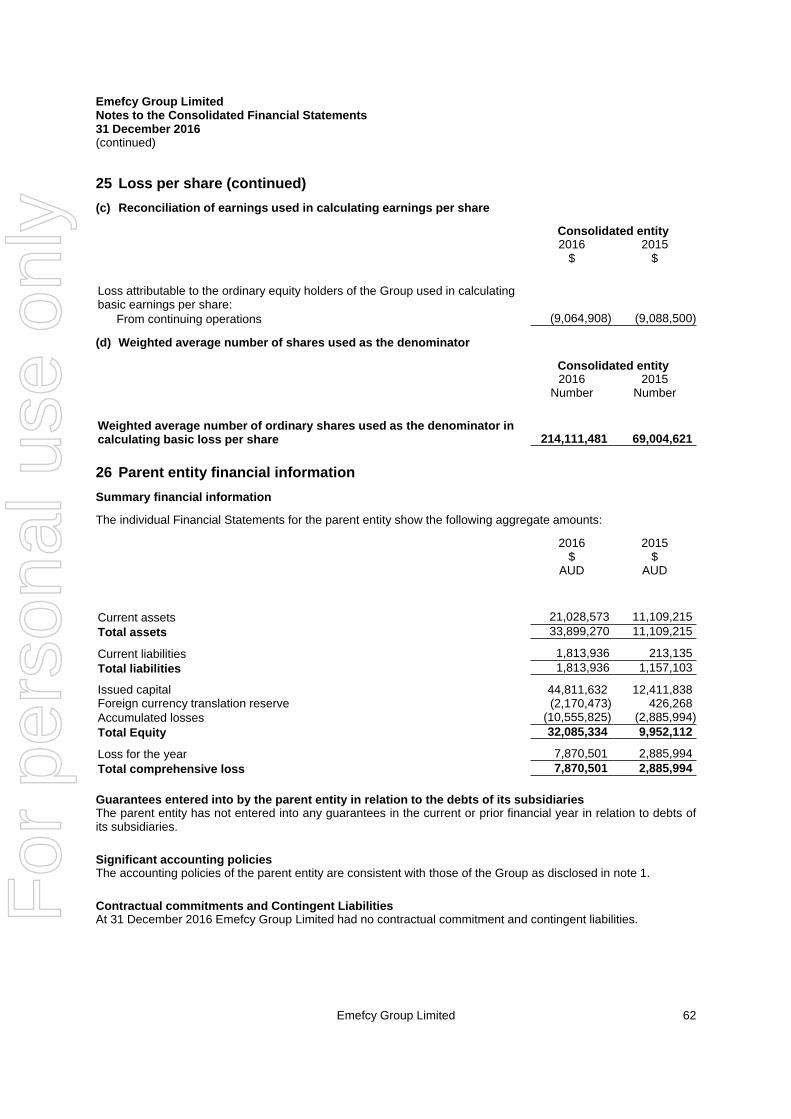
Emefcy Group LimitedNotes to the Consolidated Financial Statements31 December 2016(continued)
25 Loss per share (continued)
(c) Reconciliation of earnings used in calculating earnings per share
Consolidated entity2016
$2015
$
Loss attributable to the ordinary equity holders of the Group used in calculatingbasic earnings per share:
From continuing operations (9,064,908) (9,088,500)
(d) Weighted average number of shares used as the denominator
Consolidated entity2016
Number2015
Number
Weighted average number of ordinary shares used as the denominator incalculating basic loss per share 214,111,481 69,004,621
26 Parent entity financial information
Summary financial information
The individual Financial Statements for the parent entity show the following aggregate amounts:
2016$
AUD
2015$
AUD
- -Current assets 21,028,573 11,109,215
Total assets 33,899,270 11,109,215
Current liabilities 1,813,936 213,135
Total liabilities 1,813,936 1,157,103
Issued capital 44,811,632 12,411,838Foreign currency translation reserve (2,170,473) 426,268Accumulated losses (10,555,825) (2,885,994)
Total Equity 32,085,334 9,952,112
Loss for the year 7,870,501 2,885,994
Total comprehensive loss 7,870,501 2,885,994
Guarantees entered into by the parent entity in relation to the debts of its subsidiariesThe parent entity has not entered into any guarantees in the current or prior financial year in relation to debts ofits subsidiaries.
Significant accounting policiesThe accounting policies of the parent entity are consistent with those of the Group as disclosed in note 1.
Contractual commitments and Contingent LiabilitiesAt 31 December 2016 Emefcy Group Limited had no contractual commitment and contingent liabilities.
Emefcy Group Limited 62
For
per
sona
l use
onl
y

For
per
sona
l use
onl
y
Collins Square, Tower Four Level 18, 727 Collins Street Melbourne VIC 3008 GPO Box 5099 Melbourne VIC 3001 Australia
Tel: +61 3 9603 1700Fax: +61 3 9602 3870 www.bdo.com.au
BDO East Coast Partnership ABN 83 236 985 726 is a member of a national association of independent entities which are all members of BDO Australia Ltd ABN 77 050 110 275, an Australian company limited by guarantee. BDO East Coast Partnership and BDO Australia Ltd are members of BDO International Ltd, a UK company limited by guarantee, and form part of the international BDO network of independent member firms. Liability limited by a scheme approved under Professional Standards Legislation, other than for the acts or omissions of financial services licensees.
INDEPENDENT AUDITOR'S REPORT
To the members of Emefcy Group Limited
Report on the Audit of the Financial Report
Opinion
We have audited the financial report of Emefcy Group Limited (the Company) and its subsidiaries (the
Group), which comprises the consolidated statement of financial position as at 31 December 2016, the
consolidated statement of profit or loss and other comprehensive income, the consolidated statement
of changes in equity and the consolidated statement of cash flows for the year then ended, and notes
to the financial report, including a summary of significant accounting policies and the directors’
declaration.
In our opinion the accompanying financial report of the Group, is in accordance with the Corporations
Act 2001, including:
(i) Giving a true and fair view of the Group’s financial position as at 31 December 2016 and of its
financial performance for the year ended on that date; and
(ii) Complying with Australian Accounting Standards and the Corporations Regulations 2001.
Basis for opinion
We conducted our audit in accordance with Australian Auditing Standards. Our responsibilities under
those standards are further described in the Auditor’s Responsibilities for the Audit of the Financial
Report section of our report. We are independent of the Group in accordance with the Corporations
Act 2001 and the ethical requirements of the Accounting Professional and Ethical Standards Board’s
APES 110 Code of Ethics for Professional Accountants (the Code) that are relevant to our audit of the
financial report in Australia. We have also fulfilled our other ethical responsibilities in accordance
with the Code.
We confirm that the independence declaration required by the Corporations Act 2001, which has been
given to the directors of the Company, would be in the same terms if given to the directors as at the
time of this auditor’s report.
We believe that the audit evidence we have obtained is sufficient and appropriate to provide a basis
for our opinion.
For
per
sona
l use
onl
y

2
Key audit matters
Key audit matters are those matters that, in our professional judgement, were of most significance in
our audit of the financial report of the current period. These matters were addressed in the context of
our audit of the financial report as a whole, and in forming our opinion thereon, and we do not provide
a separate opinion on these matters.
Contract revenue recognition How the matter was addressed in our audit
During the year, the group commenced trading of
products and recognised contract revenue of $782,652
in accordance with AASB 111 Construction Contracts.
The Group applies the percentage of completion
method in recognising revenue. This method requires a
higher degree of judgement in determining the
revenue recognised in the financial year and as a result
was key focus area for our audit.
The accounting policy for revenue recognition is
described in Note 1(f), and revenue is disclosed in Note
2 of the accompanying financial statements.
Our procedures to address the risk of material
misstatement relating to the recognition of contract
revenue included:
• Review of the Group’s revenue recognition
policy to ensure it complied with Australian
Accounting Standards
• Reviewing a sample of revenue contracts and
evaluating the stage of completion
calculation to ensure that the Group’s
accounting policy had been correctly applied
• On a samples basis, we vouched the expenses
assigned to each project to agree the clerical
accuracy and completeness of the
calculation
• Holding discussions with key management
personnel and project engineers to
understand and evaluate management’s
assessment and associated assumptions in
determining the percentage of completion
• Reviewing the calculation for loss making
contracts to agree they had been correctly
accounted under Australian Accounting
Standards.
Government grants How the matter was addressed in our audit
Government grants received by the Company’s
subsidiary in Israel are recognised as a liability as they
are required to be repaid over time, with the timing of
repayment varying based on the timing of recognition
of revenue. Grant liabilities are therefore recognised
at their fair value.
There is a risk that the company may incorrectly
Our procedures in respect of this area included:
• Reviewing the terms of the Grant Agreements
and ensuring that they were reflected in the
calculation of the liability
• Holding discussions with key management
personnel to understand management’s forecast
revenue and associated assumptions in
For
per
sona
l use
onl
y

3
calculate the fair value of their liabilities.
The accounting policy for government grants is
described in Note 1(g), and the breakdown of the
associated liability is disclosed in Note 10 of the
accompanying financial statements.
determining the fair value of the grant liability
• Agreed the key assumptions, inputs and royalty
rates to the approved budget and to the terms
of the underlying Grant Agreements
• Evaluating the discount rate applied to calculate
the fair value in conjunction with our valuation
experts and to a report prepared by an
independent valuation expert.
Other information
The directors are responsible for the other information. The other information comprises the
information contained in the directors’ report for the year ended 31 December 2016, but does not
include the financial report and our auditor’s report thereon, which we obtained prior to the date of
this auditor’s report, and the chairman’s address, which is expected to be made available to us after
that date.
Our opinion on the financial report does not cover the other information and we do not express any
form of assurance conclusion thereon.
In connection with our audit of the financial report, our responsibility is to read the other information
identified above and, in doing so, consider whether the other information is materially inconsistent
with the financial report or our knowledge obtained in the audit or otherwise appears to be materially
misstated.
If, based on the work we have performed on the other information that we obtained prior to the date
of this auditor’s report, we conclude that there is a material misstatement of this other information,
we are required to report that fact. We have nothing to report in this regard.
When we read the chairman’s address, if we conclude that there is a material misstatement therein,
we are required to communicate the matter to the directors and will request that it is corrected. If it
is not corrected, we will seek to have the matter appropriately brought to the attention of users for
whom our report is prepared.
Responsibilities of the directors for the Financial Report
The directors of the Company are responsible for the preparation of the financial report that gives a
true and fair view in accordance with Australian Accounting Standards and the Corporations Act 2001
and for such internal control as the directors determine is necessary to enable the preparation of the
financial report that gives a true and fair view and is free from material misstatement, whether due to
fraud or error.
In preparing the financial report, the directors are responsible for assessing the ability of the group to
continue as a going concern, disclosing, as applicable, matters related to going concern and using the
going concern basis of accounting unless the directors either intend to liquidate the Group or to cease
operations, or has no realistic alternative but to do so.
For
per
sona
l use
onl
y

4
Auditor’s responsibilities for the audit of the Financial Report
Our objectives are to obtain reasonable assurance about whether the financial report as a whole is free
from material misstatement, whether due to fraud or error, and to issue an auditor’s report that
includes our opinion. Reasonable assurance is a high level of assurance, but is not a guarantee that an
audit conducted in accordance with the Australian Auditing Standards will always detect a material
misstatement when it exists. Misstatements can arise from fraud or error and are considered material
if, individually or in the aggregate, they could reasonably be expected to influence the economic
decisions of users taken on the basis of this financial report.
A further description of our responsibilities for the audit of the financial report is located at the
Auditing and Assurance Standards Board website (http://www.auasb.gov.au/Home.aspx) at:
http://www.auasb.gov.au/auditors_files/ar2.pdf
This description forms part of our auditor’s report.
Report on the Remuneration Report
Opinion on the Remuneration Report
We have audited the Remuneration Report included in pages 9 to 24 of the directors’ report for the
year ended 31 December 2016.
In our opinion, the Remuneration Report of Emefcy Group Limited, for the year ended 31 December
2016, complies with section 300A of the Corporations Act 2001.
Responsibilities
The directors of the Company are responsible for the preparation and presentation of the
Remuneration Report in accordance with section 300A of the Corporations Act 2001. Our responsibility
is to express an opinion on the Remuneration Report, based on our audit conducted in accordance with
Australian Auditing Standards.
BDO East Coast Partnership
David Garvey
Melbourne, 30 March 2017 For
per
sona
l use
onl
y

Emefcy Group LimitedShareholder information31 December 2016
The shareholder information set out below was applicable as at 29 March 2017.
A. Distribution of equity securities
Analysis of numbers of equity security holders by size of holding:
Class of equity securityOrdinary shares
Holding Shares Options
1 - 1000 165,116 -1,001 - 5,000 2,034,979 -5,001 - 10,000 3,701,692 1,810,00010,001 - 100,000 28,819,493 17,382,946100,001 and over 203,721,506 -
238,442,786 19,192,946There were 437 holders of less than marketable parcel of ordinary shares.
All issued ordinary shares carry one vote per share.
Share options do not carry the right to vote.
B. Equity security holders
Twenty largest quoted equity security holders
The names of the twenty largest holders of Ordinary Fully Paid Ordinary Shareholders are listed below:
Shareholders Ordinary shares
Number heldPercentage ofissued shares
POND VENTURE NOMINEES 111 LIMITED 28,944,080 12.14%EMPLOYEE EQUITY ADMINISTRATION PTY LTD 14,166,593 5.94%JAGEN PTY LTD 11,644,393 4.88%CITICORP NOMINEES PTY LIMITED 10,453,212 4.38%PLAN B VENTURES I LLC 9,691,162 4.06%MR HAO JING 7,890,000 3.31%ISRAEL CLEANTECH VENTURES (CAYMAN) 1 (A) L P 6,448,369 2.70%PLAN B VENTURES II LLC 6,327,016 2.65%J P MORGAN NOMINEES AUSTRALIA LIMITED 5,843,902 2.45%BRISPOT NOMINEES PTY LTD <HOUSE HEAD NOMINEE A/C> 5,760,689 2.42%MELIC PTY LIMITED <MELIC UNIT A/C> 5,000,000 2.10%UBS NOMINEES PTY LTD 4,892,809 2.05%DR STUART LLOYD PHILLIPS & MRS FIONA JANE PHILLIPS <SL & FJPHILLIPS S/FUND A/C> 3,722,500 1.56%JOHN W KING NOMINEES PTY LTD 3,717,129 1.56%ENERGY TECHNOLOGY VENTURES LLC 3,500,853 1.47%LILLIS SERVICES PTY LTD 3,243,874 1.36%HSBC CUSTODY NOMINEES (AUSTRALIA) LIMITED-GSCO ECA 2,730,399 1.15%MRS QUNYAN WU 2,668,891 1.12%NATIONAL NOMINEES LIMITED 2,285,382 .96%GE VENTURES LIMITED 2,007,859 .84%Total balance of remaining holders 97,503,674 40.90%
238,442,786 100.00%
Emefcy Group Limited 68
For
per
sona
l use
onl
y

Emefcy Group LimitedShareholder information31 December 2016(continued)
B. Equity security holders (continued)
Options
Quantity Exercise Price Expiry Date Holders2,000,000 AU$0.30 31 July 2018 12,000,000 AU$0.40 31 July 2019 1650,000 AU$0.15 5 June 2017 2100,000 AU$0.64 31 October 2019 12,500,000 AU$0.30 16 December 2018 42,500,000 AU$0.40 16 December 2019 42,000,000 AU$0.40 18 May 2021 2500,000 AU$0.35 13 April 2020 2100,000 AU$0.30 23 December 2019 1100,000 AU$0.40 23 December 2019 11,800,000 AU$0.64 31 July 2018 355,000 AU$0.70 1 August 2018 1200,000 AU$1.00 26 September 2020 3200,000 AU$1.00 9 November 2020 1350,000 AU$1.00 9 February 2021 2331,473 AU$0.30 23 December 2019 3331,473 AU$0.40 23 December 2019 3100,000 AU$0.30 28 February 2020 1100,000 AU$0.40 28 February 2020 175,000 AU$0.30 23 March 2020 175,000 AU$0.40 23 March 2020 150,000 AU$0.30 12 April 2020 150,000 AU$0.40 12 April 2020 1400,000 AU$0.59 16 May 2020 1100,000 AU$0.59 28 May 2020 11,000,000 AU$0.93 31 May 2020 1250,000 AU$0.79 25 July 2020 3325,000 AU$0.86 26 July 2020 7350,000 AU$1.07 27 October 2020 5575,000 AU$0.87 20 December 2020 325,000 AU$0.84 10 January 2021 119,192,946 63
C. Substantial holders
Substantial holders in the company are set out below:
Numberheld Percentage
POND VENTURE NOMINEES 111 LIMITED 28,944,080 12.13%EMPLOYEE EQUITY ADMINISTRATION PTY LTD 14,166,593 5.94%Total Number of Shares Held by Substantial Shareholders 43,110,673 18.07%
Emefcy Group Limited 69
For
per
sona
l use
onl
y

Emefcy Group LimitedShareholder information31 December 2016(continued)
Shareholder enquiries
Shareholders with enquiries about their shareholdings should contact the share registry:
Boardroom Pty LtdLevel 12, 225 George Street, Sydney, NSW, 2000, Australia
Telephone: 1300 737 760 (local), +61 2 9290 9600 (international)Email: [email protected]
Change of address, change of name, consolidation of shareholdings
Shareholders should contact the Share Registry to obtain details of the procedure required for any of thesechanges.
Annual report
Shareholders do not automatically receive a hard copy of the Company's Annual Report unless they notify theShare Registry in writing. An electronic copy of the Annual Report can be viewed on the company's website:www.emefcy.com
Tax file numbers
It is important that Australian resident Shareholders, including children, have their tax file number or exemptiondetails noted by the Share Registry.
CHESS (Clearing House Electronic Subregister System)
Shareholders wishing to move to uncertified holdings under the Australian Securities Exchange CHESS systemshould contact their stockbroker.
Uncertified share register
Shareholding statements are issued at the end of each month that there is a transaction that alters the balance ofan individual/company's holding.
Company Secretary
The name of the Company Secretary is Mr Ross Kennedy.
Registered office
The address of the registered office is Suite 1, 1233 High Street, Armadale, VIC, 3143, Australia.Phone: +61 (0)3 9824 5254
Stock exchange listing
Quotation has been granted for all the ordinary shares of the Group on all member exchanges of the AustraliaSecurities Exchange Limited.
Listing rule 4.10.19 disclosure
For the purposes of ASX Listing Rule 4.10.19, the Board confirms that during the period from 1 January 2016 to31 December 2016, the Company used its cash and assets readily convertible to cash in a manner consistentwith its stated business objectives.
Emefcy Group Limited 70
For
per
sona
l use
onl
y

For
per
sona
l use
onl
y

www.emefcy.com
For
per
sona
l use
onl
y


