27
Emerging communities in Merton
| Date post: | 01-Jan-2016 |
| Category: |
Documents |
| Upload: | adena-william |
| View: | 25 times |
| Download: | 0 times |

Merton Population Profile
•2001 Census population 187908
• 9th smallest population in London
Source 2001 Census http://www.statistics.gov.uk/
•Population density similar to Ealing, Brent, Waltham Forest, Newham.
•Less density than inner London partly due to commons and parks
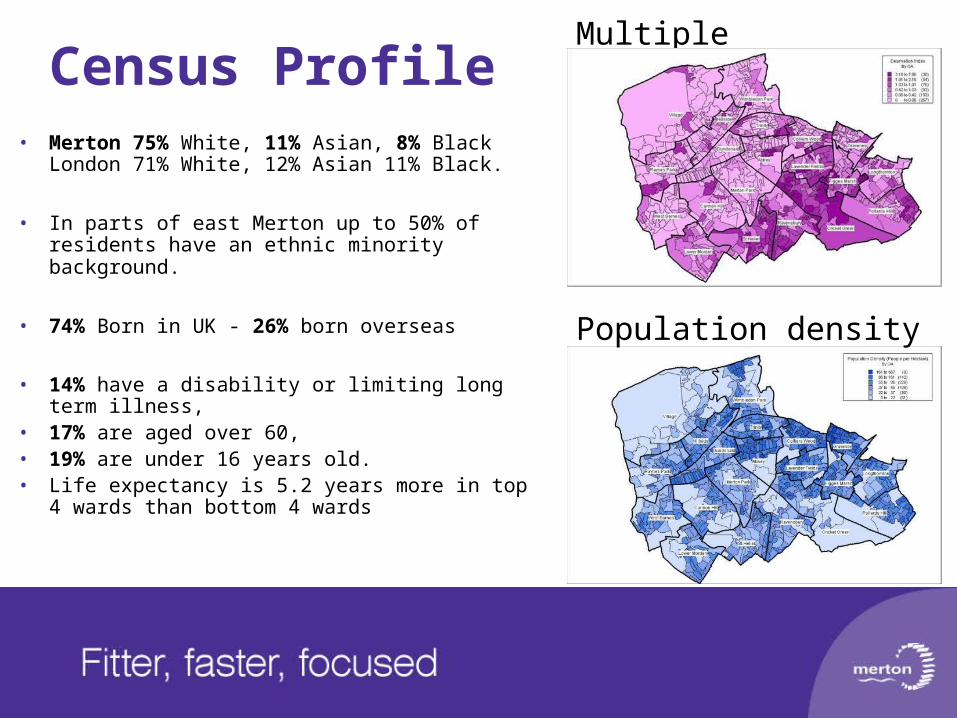
Census Profile• Merton 75% White, 11% Asian, 8% Black
London 71% White, 12% Asian 11% Black.
• In parts of east Merton up to 50% of residents have an ethnic minority background.
• 74% Born in UK - 26% born overseas
• 14% have a disability or limiting long term illness, • 17% are aged over 60, • 19% are under 16 years old. • Life expectancy is 5.2 years more in top 4 wards
than bottom 4 wards
Population density
Multiple Deprivation
Population Estimates
Census 187908
• ONS 2005 mid year estimates 194700 3.6% increaseAssumption 900 net migration
Data Management and Analysis Group GLA
– higher estimate 195557 4.1% increase– lower estimate 192220 2.3% increase
ONS 2007 projection grant allocation 195464 4% increase
• assumptions about births deaths and national and international migration

Population Estimate Methodology
International Migration
International Passenger Survey
National Migration
GP registrations
2001 Census DeathsBirths
+ -
+ - +
Sources of inaccuracy Visitor Switchers
Local Knowledge
• Electoral register• GP registrations• National Insurance registrations
• Languages in schools• Translation Service

Electoral register
• Local data suggests our population may be higher
• Electoral register 2002 134484• Electoral register 2006 137374
• 2.15% increase between 2002 – 2006
• 2001 Census x 2.15% = 191946.1
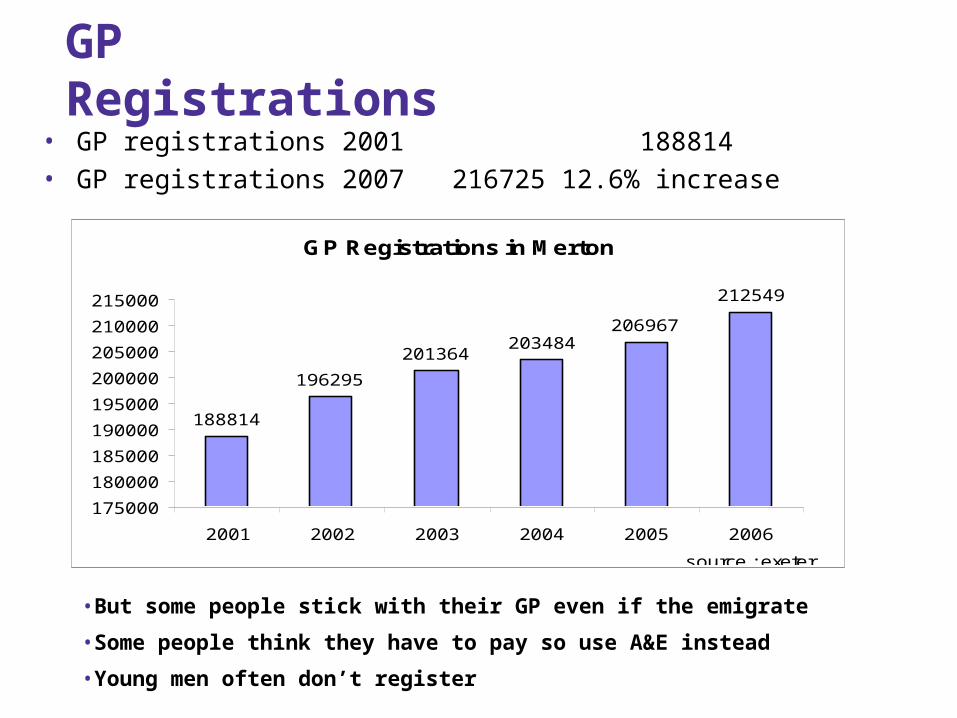
GP Registrations• GP registrations 2001 188814 • GP registrations 2007 216725 12.6% increase
GP Registrations in Merton
188814
196295
201364203484
206967
212549
175000
180000
185000
190000
195000
200000
205000
210000
215000
2001 2002 2003 2004 2005 2006
source : exeter
•But some people stick with their GP even if the emigrate
•Some people think they have to pay so use A&E instead
•Young men often don’t register

National Insurance registrations
• Registrations from non-UK nationals risen from 3590 in 2003/04 to 6470 in 2005/06
• making a total of 18100 extra people.
• If these are added to the 2001 census
• Merton’s population would be 206008
• 9% higher than the census.
2002/03 2003/04 2004/05 2005/06
All 3990 3590 4050 6470
South Africa 780 610 700 1180Poland 140 250 500 1150Australia 240 220 220 390Pakistan 140 150 240 300Sri Lanka 420 300 270 270India 130 140 140 220Lithuania 30 50 110 180Ghana 130 140 180 180Germany 70 110 150 170New Zealand 150 90 80 160Slovak Rep 10 10 60 130Mauritius 40 60 60 120France 120 70 80 120
Source: Department Work and Pensions
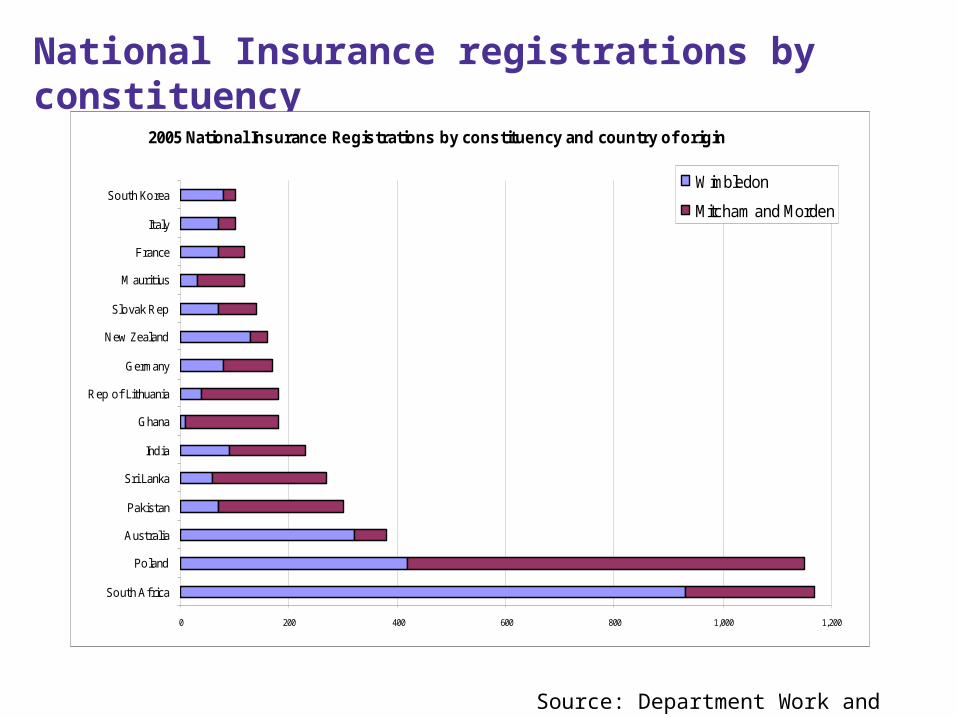
National Insurance registrations by constituency
Source: Department Work and Pensions
2005 National Insurance Registrations by constituency and country of origin
0 200 400 600 800 1,000 1,200
South Africa
Poland
Australia
Pakistan
Sri Lanka
India
Ghana
Rep of Lithuania
Germany
New Zealand
Slovak Rep
Mauritius
France
Italy
South Korea Wimbledon
Mitcham and Morden
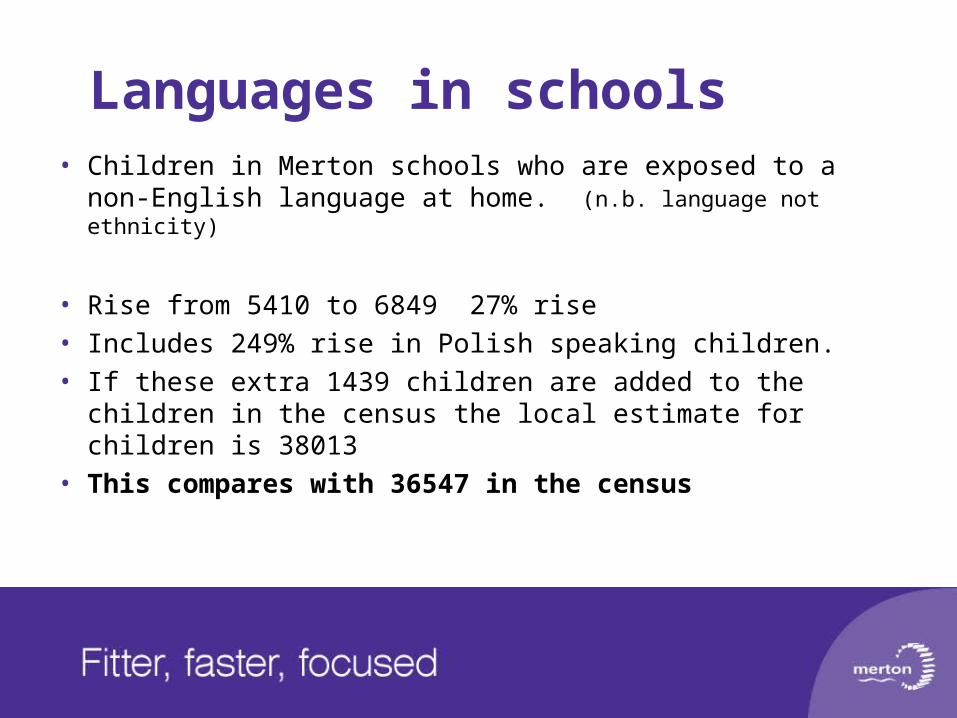
Languages in schools• Children in Merton schools who are exposed to a non-
English language at home. (n.b. language not ethnicity)
• Rise from 5410 to 6849 27% rise • Includes 249% rise in Polish speaking children. • If these extra 1439 children are added to the children
in the census the local estimate for children is 38013 • This compares with 36547 in the census
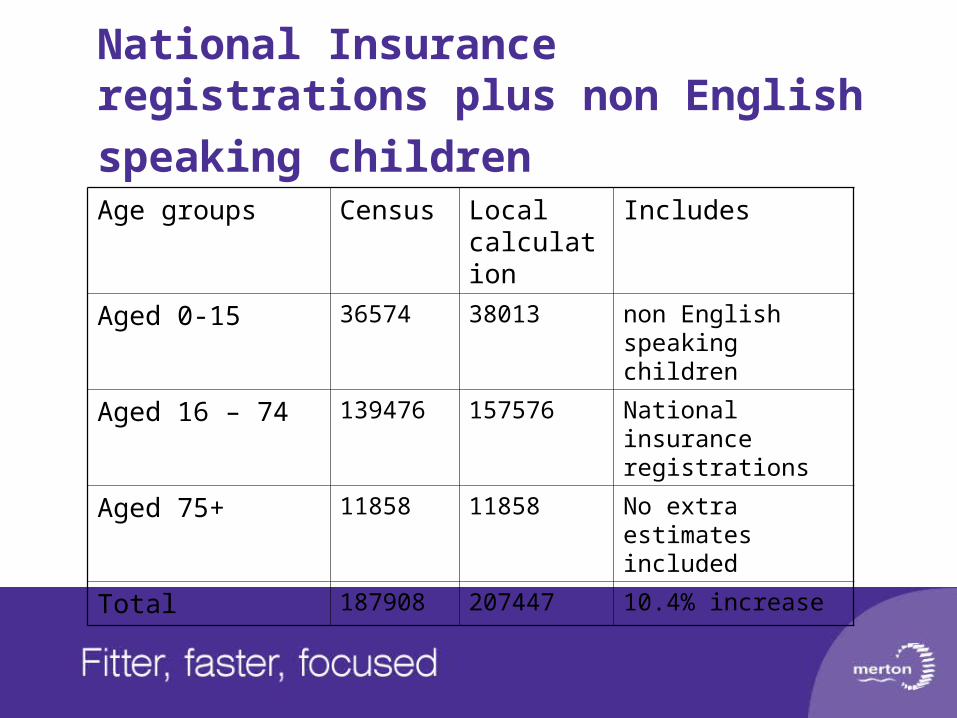
National Insurance registrations plus
non English speaking children Age groups Census Local
calculationIncludes
Aged 0-15 36574 38013 non English speaking children
Aged 16 – 74 139476 157576 National insurance registrations
Aged 75+ 11858 11858 No extra estimates included
Total 187908 207447 10.4% increase
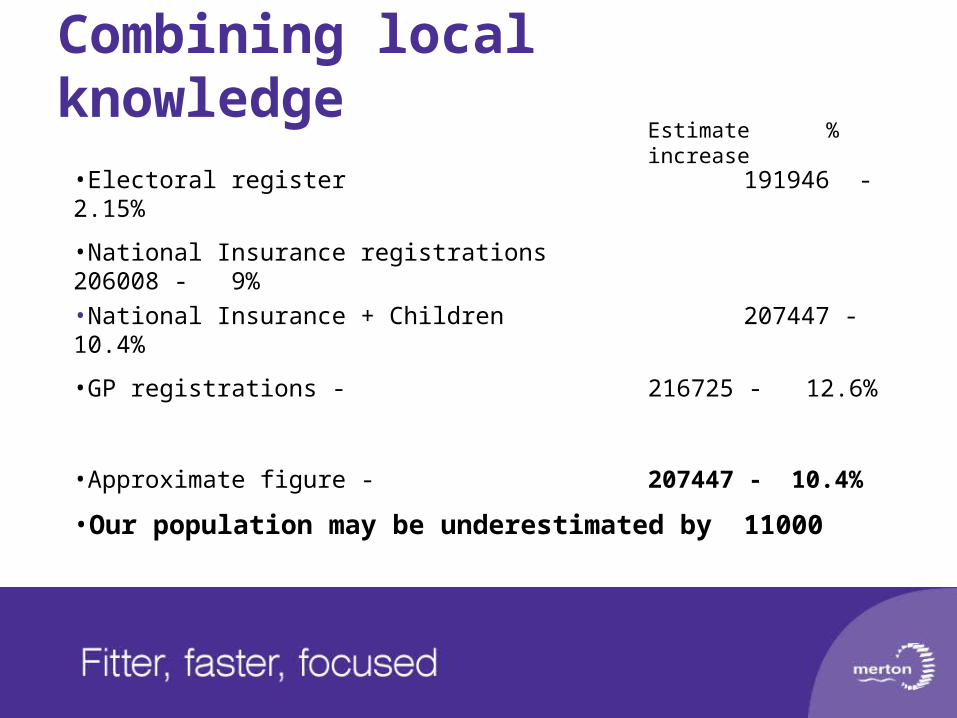
Combining local knowledge
•Electoral register 191946 - 2.15%
•National Insurance registrations 206008 - 9%
•National Insurance + Children 207447 - 10.4%
•GP registrations - 216725 - 12.6%
•Approximate figure - 207447 - 10.4%
•Our population may be underestimated by 11000
Estimate % increase
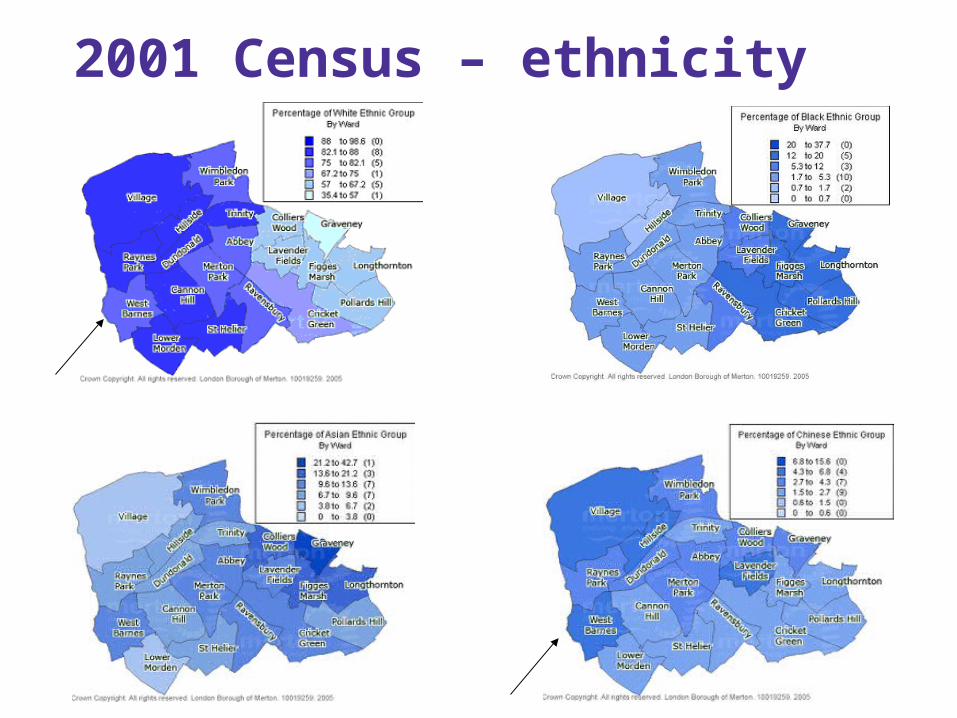
2001 Census – ethnicity

Translation RequestsTranslation requests 2003- 2007
0
100
200
300
400
500
600
700
800
900
1000
2003/2004 2004/2005 2005/2006 2006/2007
Tamil
Somali
Persian
Arabic
Urdu
French
Albanian
Polish
Portuguese
Spanish
Thai

Translation Requests (- Tamil)
Translation requests 2003- 2007without Tamil
0
50
100
150
200
250
300
350
400
2003/2004 2004/2005 2005/2006 2006/2007
Somali
Persian
Arabic
Urdu
French
Albanian
Polish
Portuguese
Spanish
Thai
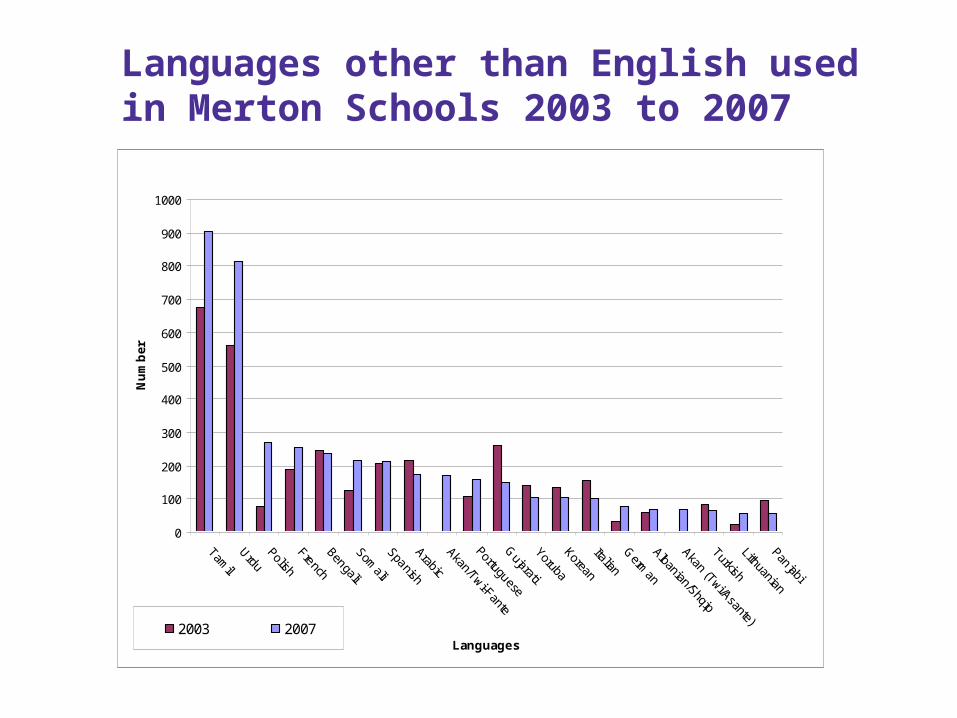
Languages other than English used in Merton Schools 2003 to 2007
0
100
200
300
400
500
600
700
800
900
1000
Tamil
UrduPolishFrenchBengaliSom
aliSpanishArabicAkan/Twi-Fante
PortugueseG
ujaratiYorubaKoreanItalianG
erman
Albanian/Shqip
Akan (Twi/Asante)
TurkishLithuanianPanjabi
Languages
Nu
mb
er
2003 2007

PUPILS WITH TAMIL MOTHER TONGUE

PUPILS WITH URDU MOTHER TONGUE
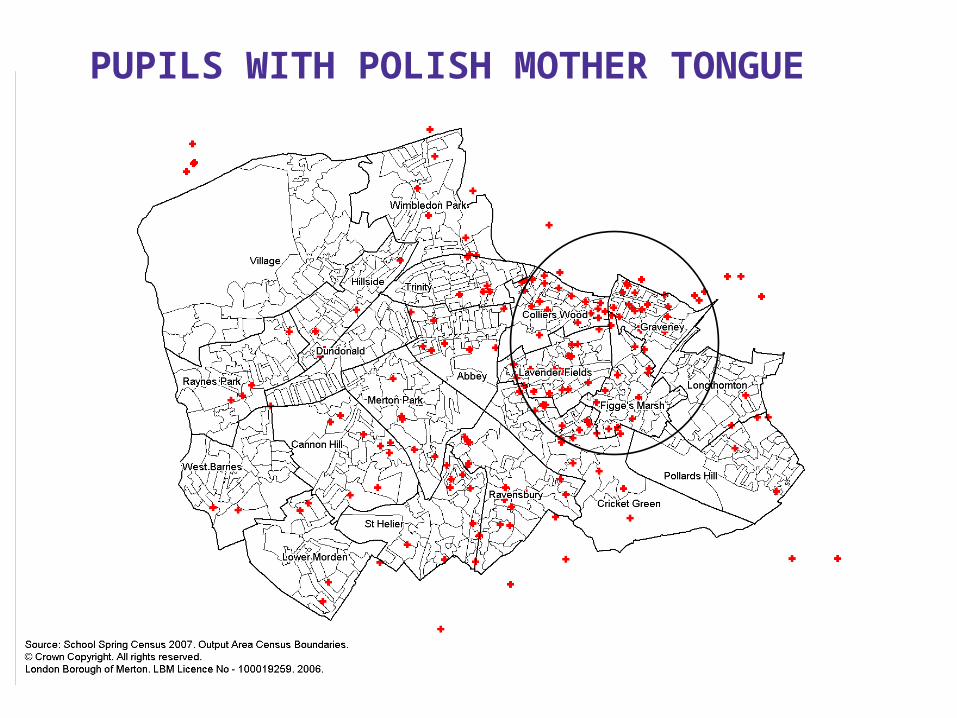
PUPILS WITH POLISH MOTHER TONGUE

Electoral registerSouth Africa and Poland
South Africa Poland
Gra 14.33%Lav 12.57%Col 11.08%Fig 6.93%Cri 5.92%Lon 5.16%Abb 4.92%Rav 4.63%St H 4.25%Trin 4.06%
Dun 14.46%Trin 10.33%Abb 10.20%Hill 9.32%WimP 9.32%Ray 8.50%Col 6.83%MerP 6.02%Wba 5.61%
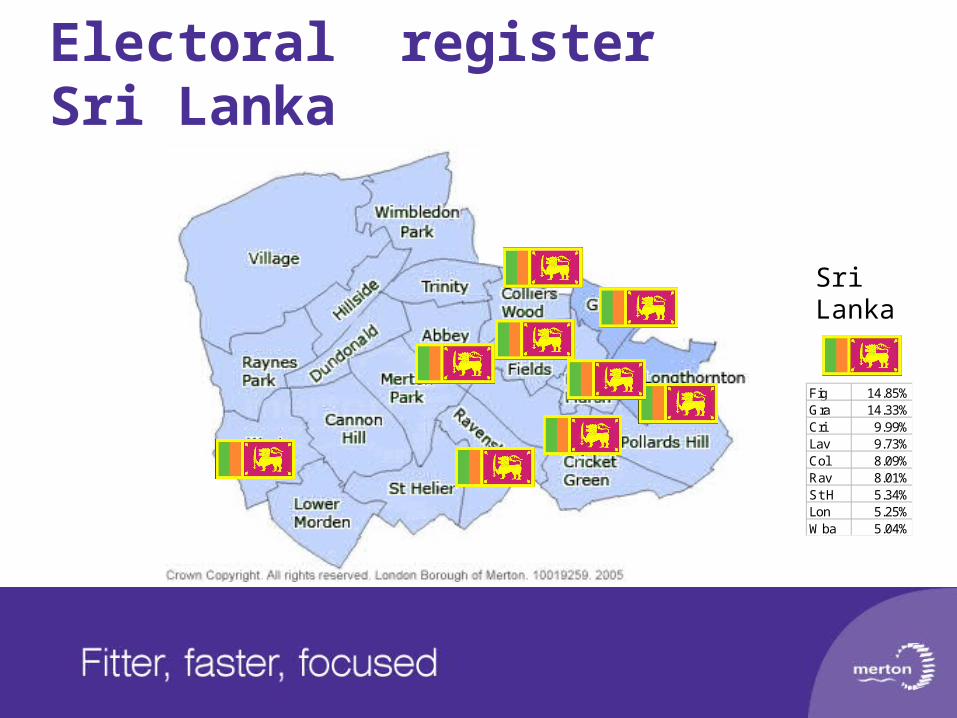
Electoral register Sri Lanka
Sri Lanka
Fig 14.85%Gra 14.33%Cri 9.99%Lav 9.73%Col 8.09%Rav 8.01%St H 5.34%Lon 5.25%Wba 5.04%
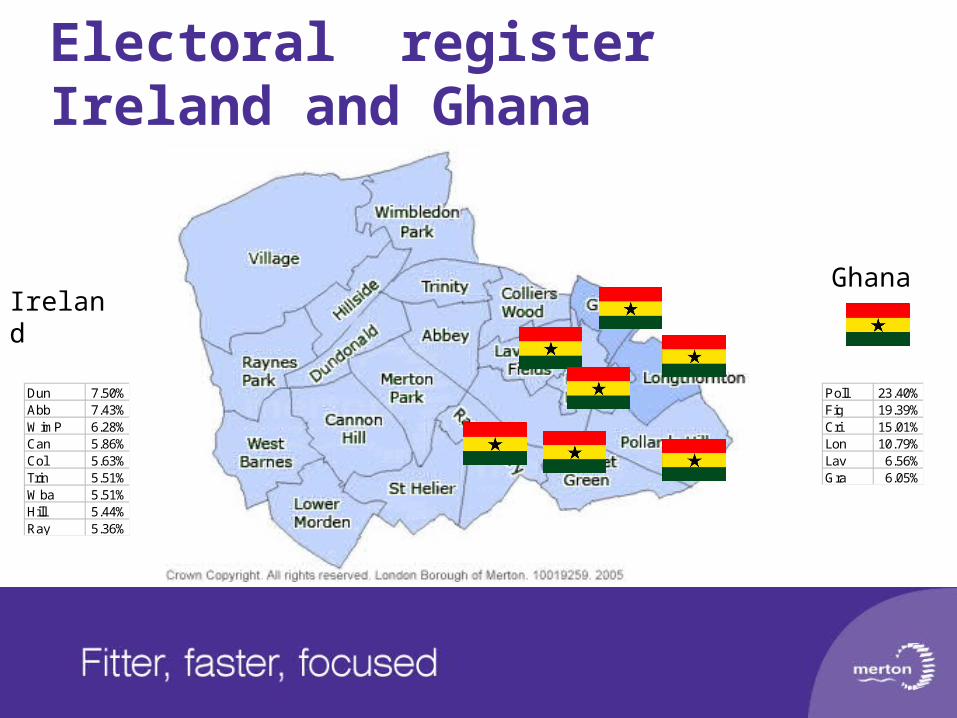
Electoral register Ireland and Ghana
Ireland Ghana
Poll 23.40%Fig 19.39%Cri 15.01%Lon 10.79%Lav 6.56%Gra 6.05%
Dun 7.50%Abb 7.43%WimP 6.28%Can 5.86%Col 5.63%Trin 5.51%Wba 5.51%Hill 5.44%Ray 5.36%
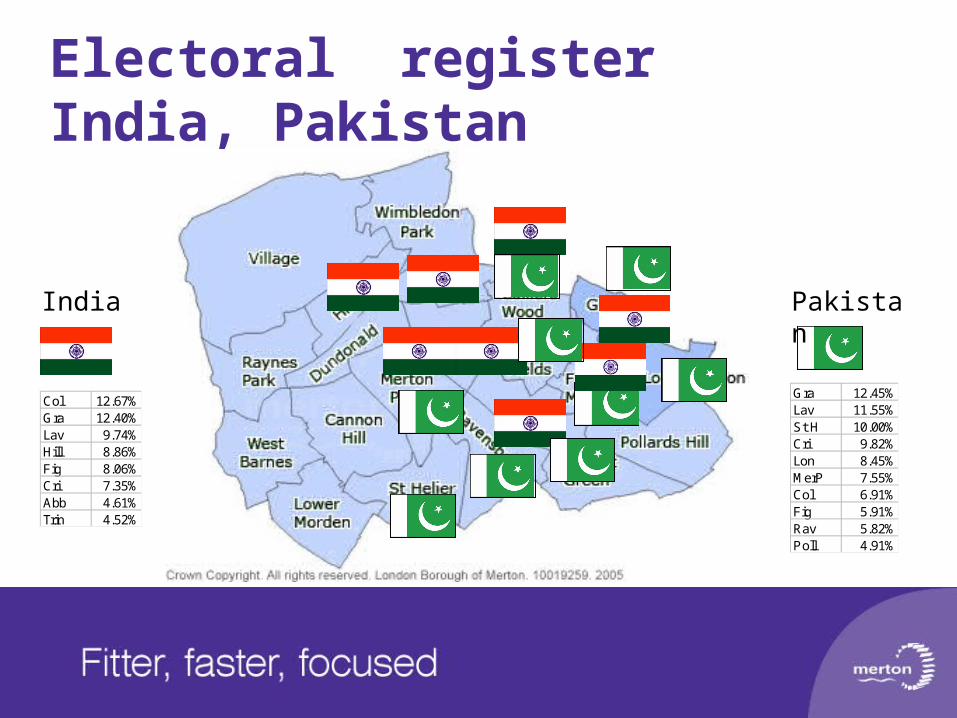
Electoral register India, Pakistan
Gra 12.45%Lav 11.55%St H 10.00%Cri 9.82%Lon 8.45%MerP 7.55%Col 6.91%Fig 5.91%Rav 5.82%Poll 4.91%
Col 12.67%Gra 12.40%Lav 9.74%Hill 8.86%Fig 8.06%Cri 7.35%Abb 4.61%Trin 4.52%
India Pakistan

National Insurance Registrations 2002-2006
Electoral Register 2007
Translation requests 2007
Languages in Schools 2007
South Africa South Africa Tamil TamilPoland Ireland Portuguese UrduAustralia Sri Lanka Somali PolishPakistan Poland Persian FrenchSri Lanka Ghana Arabic BengaliIndia India Polish SomaliLithuania Pakistan Urdu SpanishGhana Italy French ArabicGermany Germany Albanian Akan/Twi-FanteNew Zealand France Dari (Afghan) PortugueseSlovak Rep Australia GujaratiMauritius Portugal YorubaFrance Spain KoreanItaly New ItalianSouth Korea Jamaica GermanPortugal Nigeria Albanian/ShqipHungary Netherlands Akan (Twi/Asante)Brazil Lithuania TurkishNetherlands Zimbabwe LithuanianRep of Ireland Mauritius Panjabi
Combining local Information

Racial Incidents in Merton

Further Questions
• Does this seem accurate?
• What other local information do we have?


