Emerging Dominance of Aquaculture: Emerging Dominance of Aquaculture: The Future of the Seafood Market The Future of the Seafood Market and Fisheries Management and Fisheries Management James L. Anderson James L. Anderson Department of Environmental and Natural Resource Department of Environmental and Natural Resource Economics Economics University of Rhode Island University of Rhode Island Kingston, RI 02879 Kingston, RI 02879 USA USA IIFET 2008 IIFET 2008 Nha Nha Trang Trang , Vietnam , Vietnam July 21 July 21 - - 25, 2008 25, 2008
Transcript
Emerging Dominance of Aquaculture:Emerging Dominance of Aquaculture:The Future of the Seafood MarketThe Future of the Seafood Market
and Fisheries Managementand Fisheries Management
James L. AndersonJames L. AndersonDepartment of Environmental and Natural Resource Department of Environmental and Natural Resource
EconomicsEconomicsUniversity of Rhode Island University of Rhode Island
Aquaculture will dominate the seafood Aquaculture will dominate the seafood market market –– esp. international tradeesp. international tradeWinners will control costs and manage for Winners will control costs and manage for marketsmarketsFisheries managed more like Fisheries managed more like ‘‘aquacultureaquaculture’’------ winwinAquaculture sectors managed more like Aquaculture sectors managed more like fisheries (US marine aquaculture) fisheries (US marine aquaculture) ------ loselose
Seafood SectorSeafood SectorExtremely Complex and Diverse Extremely Complex and Diverse –– 100s of species, many technologies, many areas100s of species, many technologies, many areas
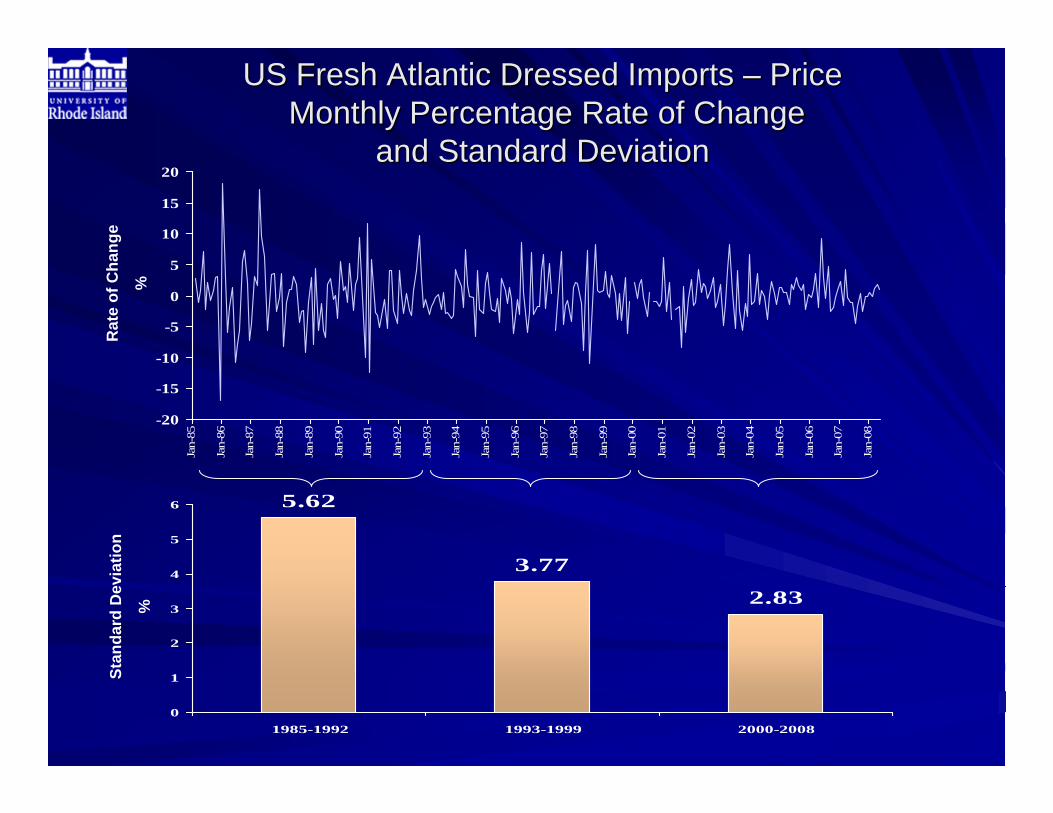
Highly InternationalHighly InternationalBureaucratic Regulatory Environment Bureaucratic Regulatory Environment FragmentedFragmentedWastefulWastefulMarketing is Not Advanced Marketing is Not Advanced Highly Misunderstood by Consumers Highly Misunderstood by Consumers including Chefs including Chefs Volatile Volatile –– in Prices and Quantitiesin Prices and Quantities
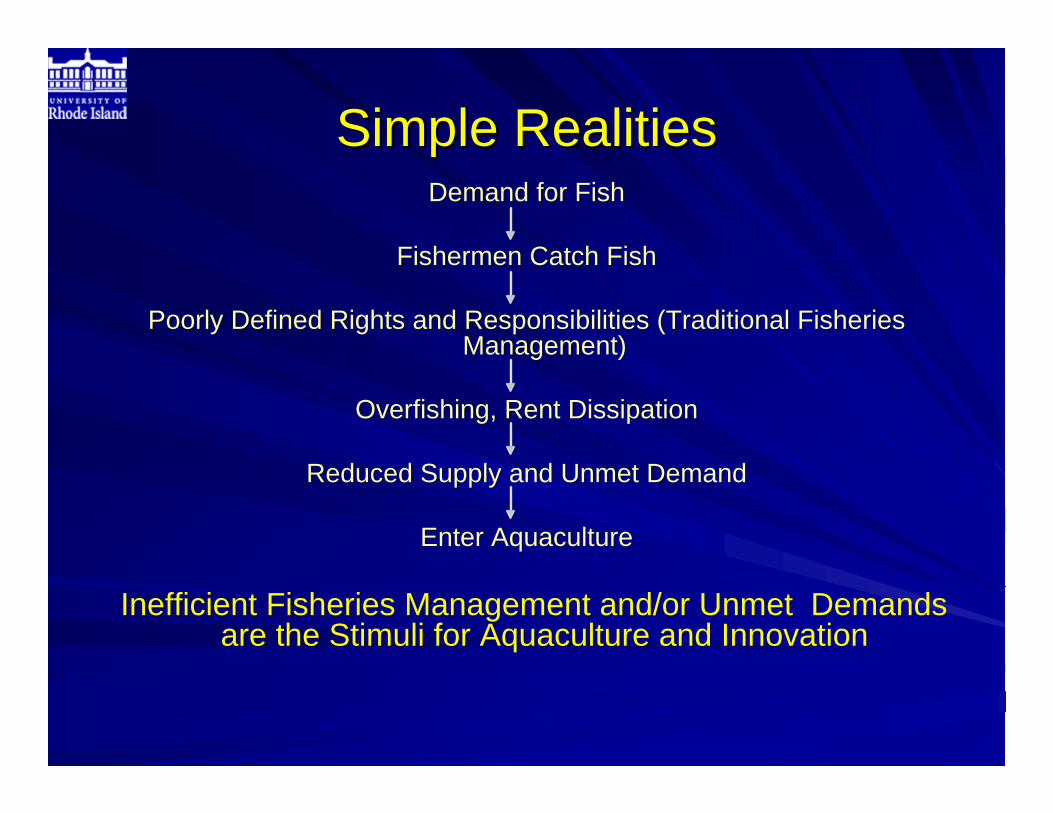
Simple RealitiesSimple RealitiesDemand for Fish
Fishermen Catch Fish
Poorly Defined Rights and Responsibilities (Traditional Fisheries Management)
Overfishing, Rent Dissipation
Reduced Supply and Unmet Demand
Enter Aquaculture
Inefficient Fisheries Management and/or Unmet Demands are the Stimuli for Aquaculture and Innovation
Simple RealitiesSimple RealitiesPeople whose lives depend on the harvest of seafood People whose lives depend on the harvest of seafood
want:want:
–– Better control of cost Better control of cost –– Minimize environmental/exogenous shocksMinimize environmental/exogenous shocks–– Better control fish stock and growth rates Better control fish stock and growth rates –– Manage to meet the market demandManage to meet the market demand–– Sustainable profitsSustainable profits
CONTROLCONTROLof production and marketing throughof production and marketing through
Ownership, Information and TechnologyOwnership, Information and Technology
If the Future will be Dominated If the Future will be Dominated by Aquacultureby Aquaculture
What does it mean for the future of the What does it mean for the future of the seafood sector?seafood sector?
What does it mean for the future of What does it mean for the future of fisheries/aquaculture management?fisheries/aquaculture management?
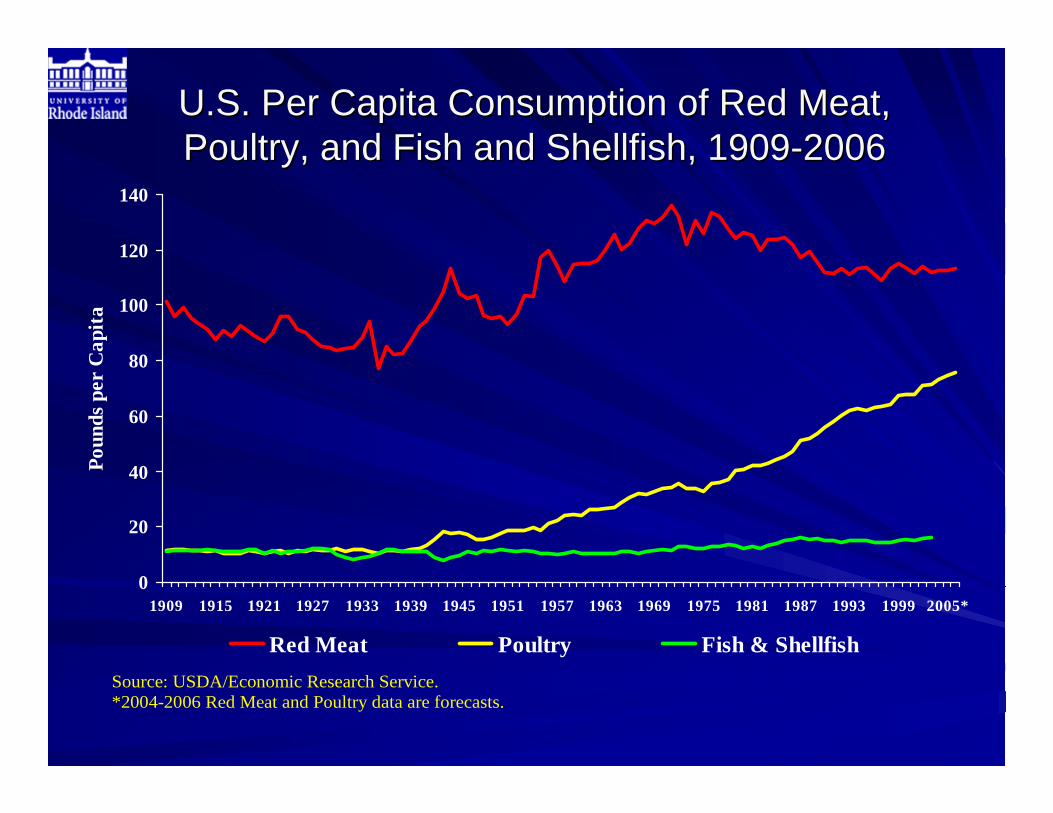
U.S. Per Capita Consumption of Red Meat, U.S. Per Capita Consumption of Red Meat, Poultry, and Fish and Shellfish, 1909Poultry, and Fish and Shellfish, 1909--20062006
Source: USDA/Economic Research Service. *2004-2006 Red Meat and Poultry data are forecasts.
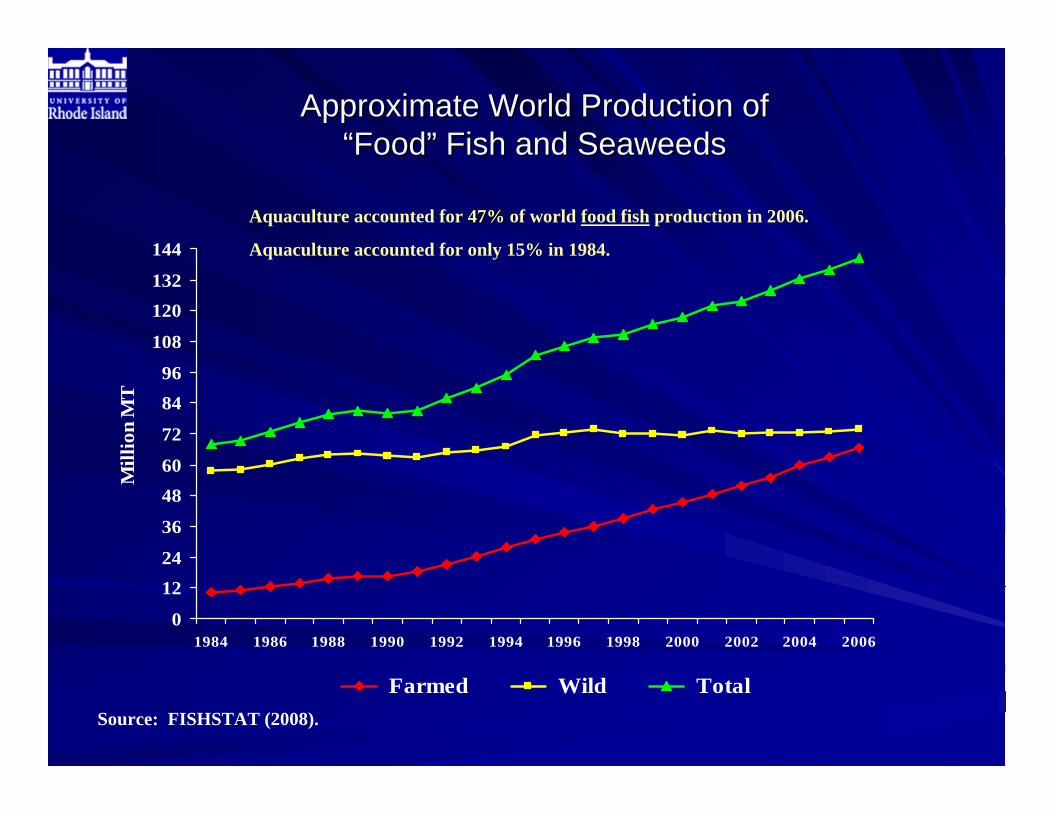
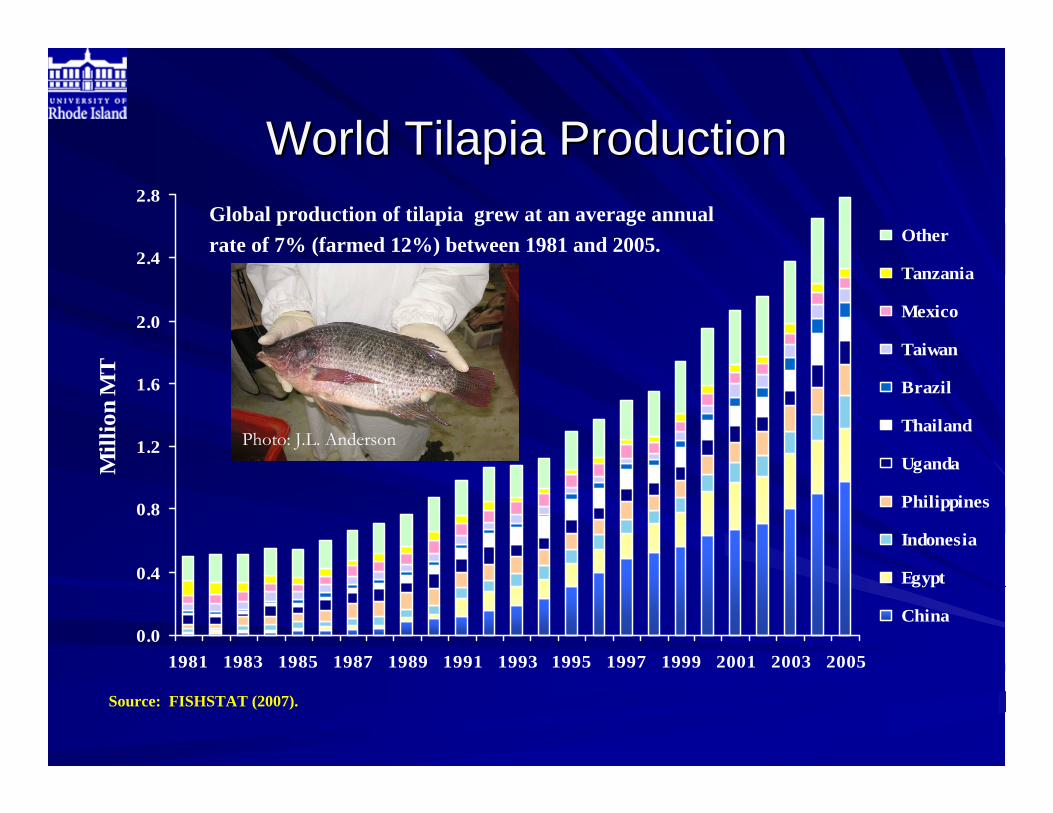
Aquaculture accounted for 47%47% of world food fish production in 2006.
Aquaculture accounted for only 15% in 1984.
Source: FISHSTAT (2008).
To develop expectations about the future of To develop expectations about the future of the seafood sector, we must consider the seafood sector, we must consider
aquaculture and fisheries interact?aquaculture and fisheries interact?
In the ecosystem? In the ecosystem? In the market ?In the market ?
Aquaculture and Fisheries: Aquaculture and Fisheries: EcosystemEcosystem
Use of wild fish for inputsUse of wild fish for inputs
Disease transmission and related interactions Disease transmission and related interactions
Intentional releases or unintentional escapesIntentional releases or unintentional escapes
Use or enhancement of habitatUse or enhancement of habitat
The growth of aquaculture influences The growth of aquaculture influences fisheries through its use of wild fish as fisheries through its use of wild fish as
inputsinputs
FeedFeed–– Small pelagics for fishmeal and fish oilSmall pelagics for fishmeal and fish oil
BroodstockBroodstock–– Salmon (in past)Salmon (in past)–– Shrimp (mostly in past)Shrimp (mostly in past)
A Note on A Note on ““The Feed IssueThe Feed Issue””Using fish to feed fish is Using fish to feed fish is ““unsustainableunsustainable”” (ex. salmon, shrimp farming)(ex. salmon, shrimp farming)
Growth of aquaculture farming will exhaust the fishmeal Growth of aquaculture farming will exhaust the fishmeal and fish oil supply and cause overfishing and fish oil supply and cause overfishing –– This is a fisheries management/governance problem This is a fisheries management/governance problem
not an aquaculture problemnot an aquaculture problem
RealityRealityThe majority of fishmeal is used by poultry and pigsThe majority of fishmeal is used by poultry and pigsIncreasing relative price of fishmeal & fish oil Increasing relative price of fishmeal & fish oil –– Provides economic incentives for innovationProvides economic incentives for innovation–– Improving feed conversion ratios, new feed Improving feed conversion ratios, new feed
formulations/substitutes, new speciesformulations/substitutes, new species
Aquaculture and DiseaseAquaculture and DiseaseAquaculture and Disease
Example:
Parasite, B. ostreae, was introduced (probably) into France in oysters imported from California which originated from the NMFS Aquaculture Lab in CT
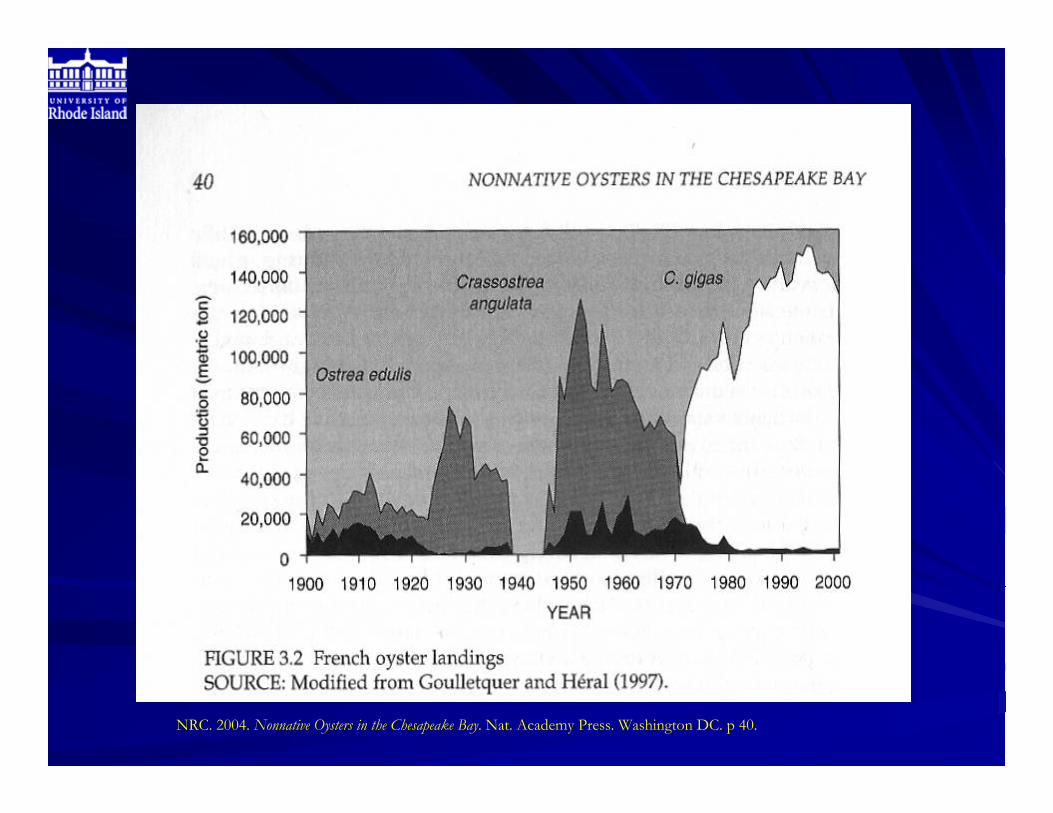
Example:Example:
Parasite, Parasite, B. ostreae,B. ostreae, was introduced was introduced (probably) into France in oysters (probably) into France in oysters imported from California which imported from California which originated from the NMFS Aquaculture originated from the NMFS Aquaculture Lab in CT Lab in CT
NRC. 2004. Nonnative Oysters in the Chesapeake Bay. Nat. Academy Press. Washington DC. p 40.
NRC. 2004. Nonnative Oysters in the Chesapeake Bay. Nat. Academy Press. Washington DC. p 16.
Chesapeake Bay Oyster Chesapeake Bay Oyster ““FisheryFishery””Management OptionsManagement Options
Replenish/Restore oyster habitat = Replenish/Restore oyster habitat = AquacultureAquacultureOyster sanctuaries (fallow fields) = Oyster sanctuaries (fallow fields) = AquacultureAquacultureIntroduce disease resistant native oysters = Introduce disease resistant native oysters = AquacultureAquacultureIntroduce triploid native oysters that grow fast enough to Introduce triploid native oysters that grow fast enough to harvest before they get disease = harvest before they get disease = AquacultureAquacultureIntroduce triploid Asian Introduce triploid Asian C. C. ariakensisariakensis oysters = oysters = AquacultureAquacultureIntroduce diploid Asian Introduce diploid Asian C. C. ariakensisariakensis oysters = oysters = AquacultureAquaculture
Traditional Fisheries Management is Largely Irrelevant!Traditional Fisheries Management is Largely Irrelevant!
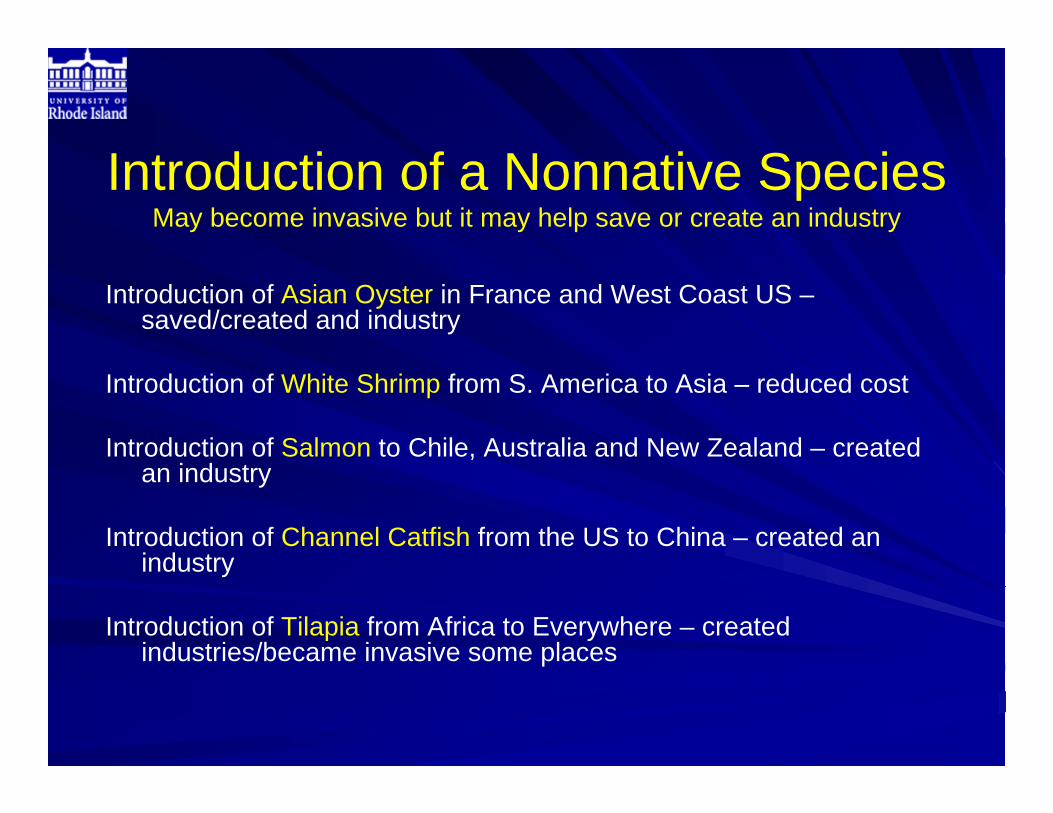
Introduction of a Nonnative SpeciesMay become invasive but it may help save or create an industry
Introduction of Asian Oyster in France and West Coast US –saved/created and industry
Introduction of White Shrimp from S. America to Asia – reduced cost
Introduction of Salmon to Chile, Australia and New Zealand – created an industry
Introduction of Channel Catfish from the US to China – created an industry
Introduction of Tilapia from Africa to Everywhere – created industries/became invasive some places
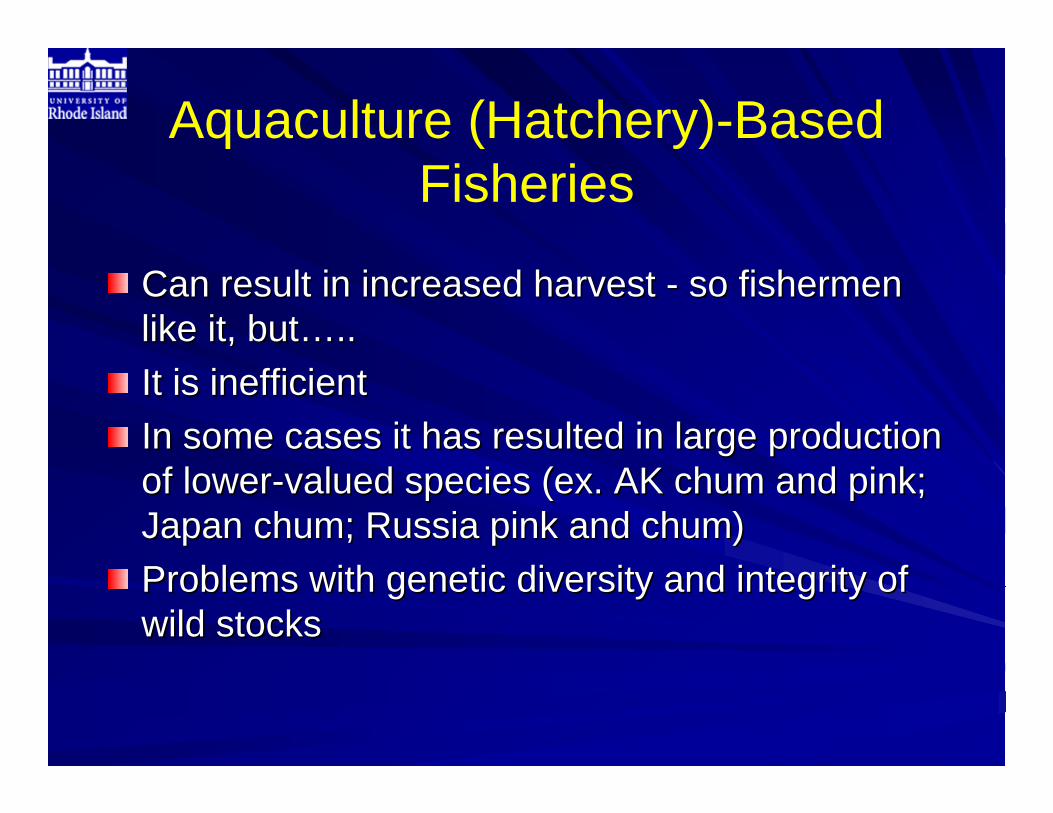
Aquaculture (Hatchery)-Based Fisheries
Can result in increased harvest Can result in increased harvest -- so fishermen so fishermen like it, butlike it, but……....It is inefficientIt is inefficientIn some cases it has resulted in large production In some cases it has resulted in large production of lowerof lower--valued species (ex. AK chum and pink; valued species (ex. AK chum and pink; Japan chum; Russia pink and chum)Japan chum; Russia pink and chum)Problems with genetic diversity and integrity of Problems with genetic diversity and integrity of wild stockswild stocks
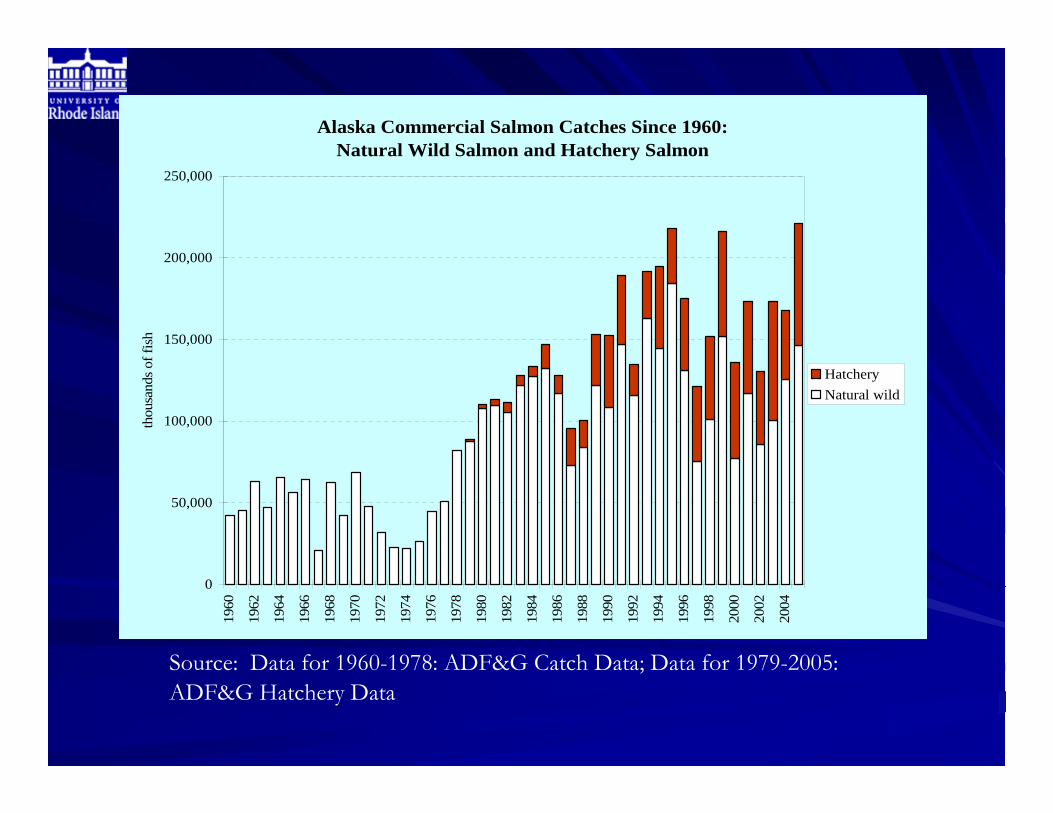
Alaska Commercial Salmon Catches Since 1960: Natural Wild Salmon and Hatchery Salmon
0
50,000
100,000
150,000
200,000
250,000
1960
1962
1964
1966
1968
1970
1972
1974
1976
1978
1980
1982
1984
1986
1988
1990
1992
1994
1996
1998
2000
2002
2004
thou
sand
s of f
ish
HatcheryNatural wild
Source: Data for 1960-1978: ADF&G Catch Data; Data for 1979-2005: ADF&G Hatchery Data
Aquaculture (Hatchery)-Based Fisheries: Integrity of wild stocksntegrity of wild stocks
Hatchery fish do not face the same selective Hatchery fish do not face the same selective pressure as wild stockspressure as wild stocksHatchery releases can displace wild stocks and Hatchery releases can displace wild stocks and compete for food and habitatcompete for food and habitat
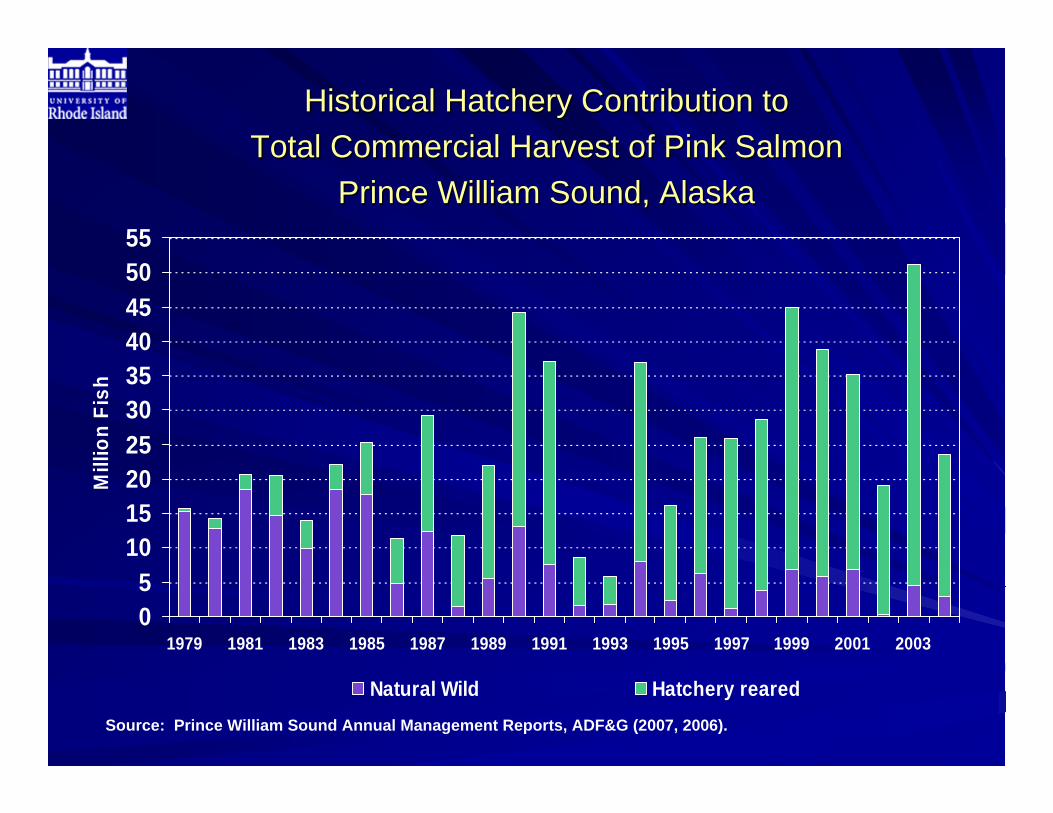
Historical Hatchery Contribution to Historical Hatchery Contribution to Total Commercial Harvest of Pink Salmon Total Commercial Harvest of Pink Salmon
Prince William Sound, AlaskaPrince William Sound, Alaska
Source: Prince William Sound Annual Management Reports, ADF&G (2007, 2006).
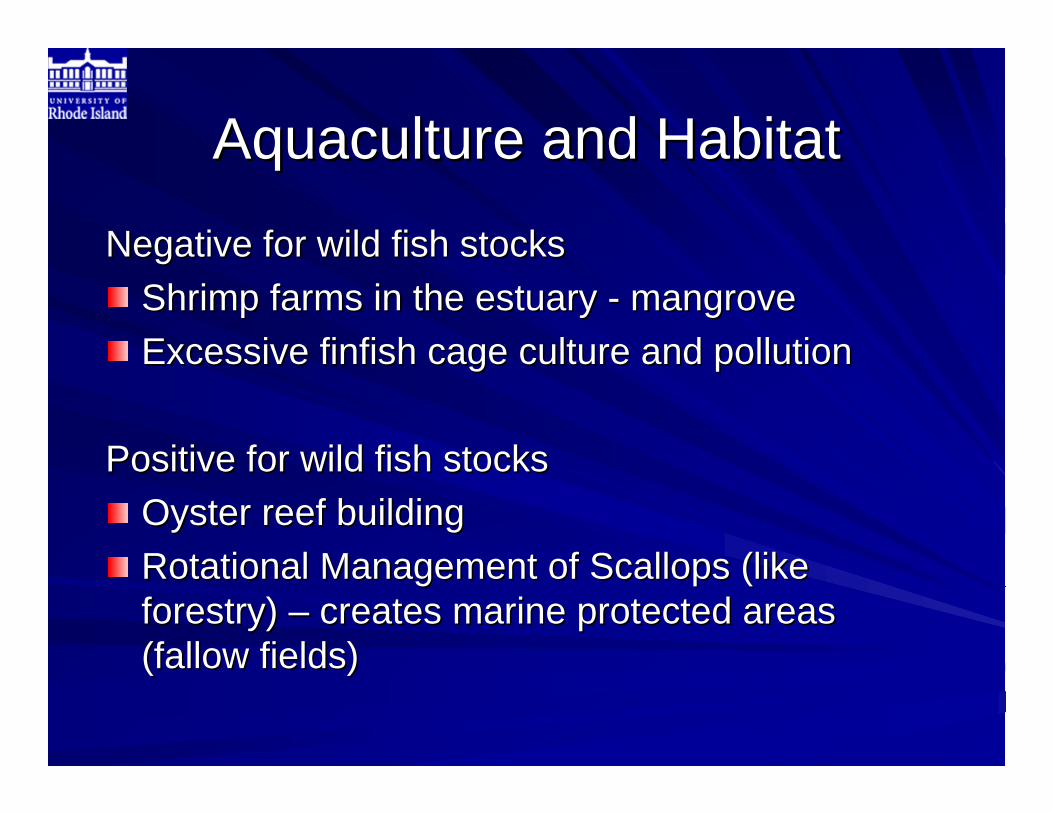
Negative for wild fish stocksNegative for wild fish stocksShrimp farms in the estuary Shrimp farms in the estuary -- mangrovemangroveExcessive finfish cage culture and pollutionExcessive finfish cage culture and pollution
Positive for wild fish stocksPositive for wild fish stocksOyster reef buildingOyster reef buildingRotational Management of Scallops (like Rotational Management of Scallops (like forestry) forestry) –– creates marine protected areas creates marine protected areas (fallow fields) (fallow fields)
Aquaculture and fisheries interact in the Aquaculture and fisheries interact in the ecosystem.ecosystem.
Aquaculture Aquaculture isis a fisheries management option. a fisheries management option.
Very little economic research has been done to Very little economic research has been done to evaluate the interactions.evaluate the interactions.
Aquaculture and Fisheries: Aquaculture and Fisheries: International Trade and the MarketInternational Trade and the Market
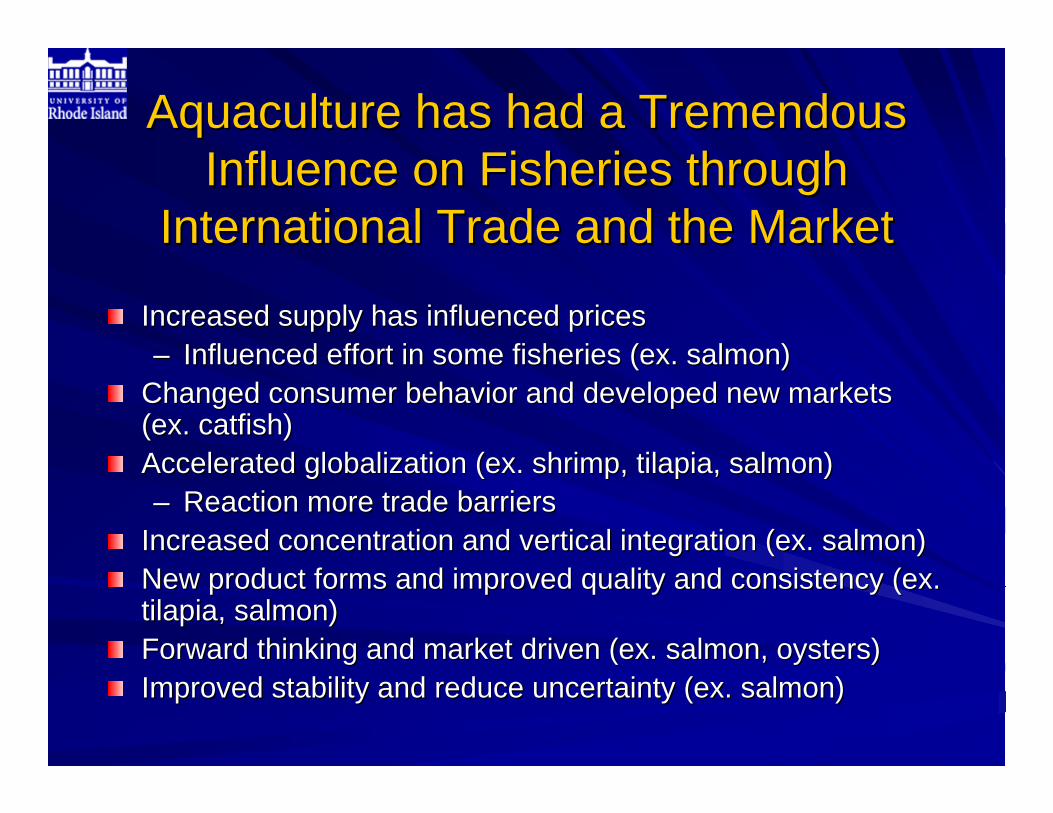
Aquaculture has had a Tremendous Aquaculture has had a Tremendous Influence on Fisheries through Influence on Fisheries through
International Trade and the MarketInternational Trade and the Market
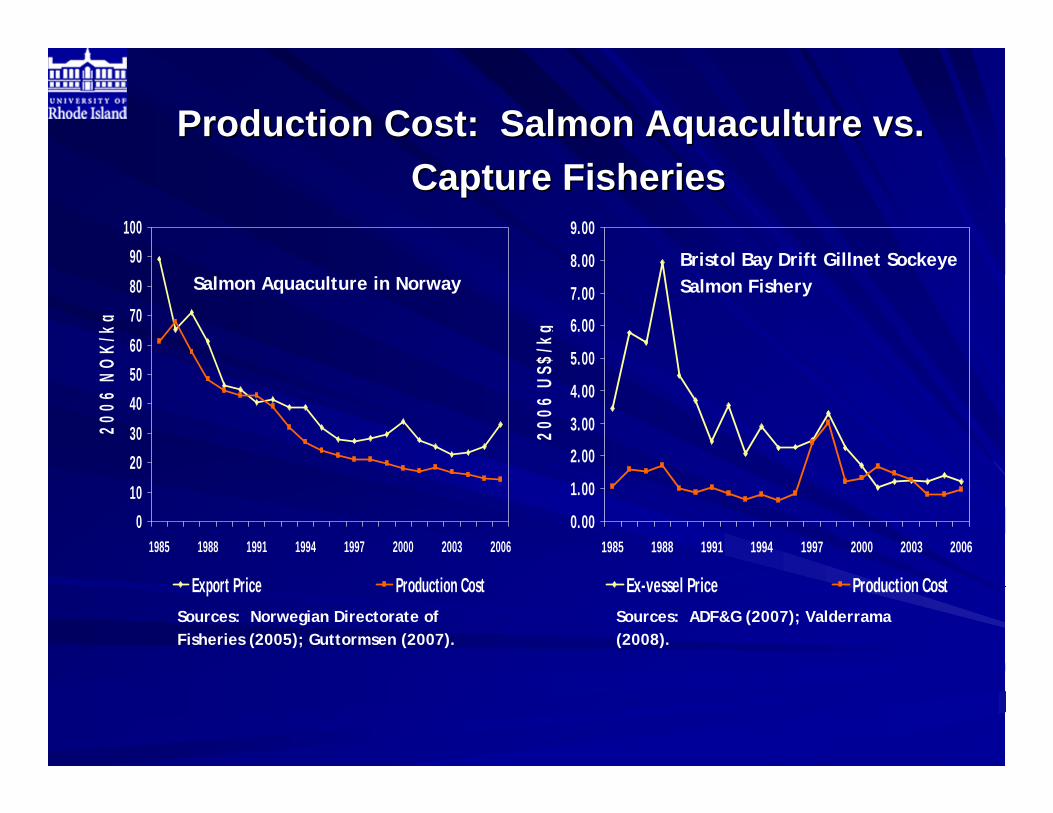
Increased supply has influenced prices Increased supply has influenced prices –– Influenced effort in some fisheries (ex. salmon) Influenced effort in some fisheries (ex. salmon)
Changed consumer behavior and developed new markets Changed consumer behavior and developed new markets (ex. catfish) (ex. catfish) Accelerated globalization (ex. shrimp, tilapia, salmon)Accelerated globalization (ex. shrimp, tilapia, salmon)–– Reaction more trade barriersReaction more trade barriers
Increased concentration and vertical integration (ex. salmon)Increased concentration and vertical integration (ex. salmon)New product forms and improved quality and consistency (ex. New product forms and improved quality and consistency (ex. tilapia, salmon)tilapia, salmon)Forward thinking and market driven (ex. salmon, oysters)Forward thinking and market driven (ex. salmon, oysters)Improved stability and reduce uncertainty (ex. salmon)Improved stability and reduce uncertainty (ex. salmon)
Growing Market Share and Growing Market Share and Product InnovationProduct Innovation
Consistently AvailableConsistently AvailableConsistent QualityConsistent QualityStable or Declining CostStable or Declining CostMeet Consumer DemandsMeet Consumer Demands
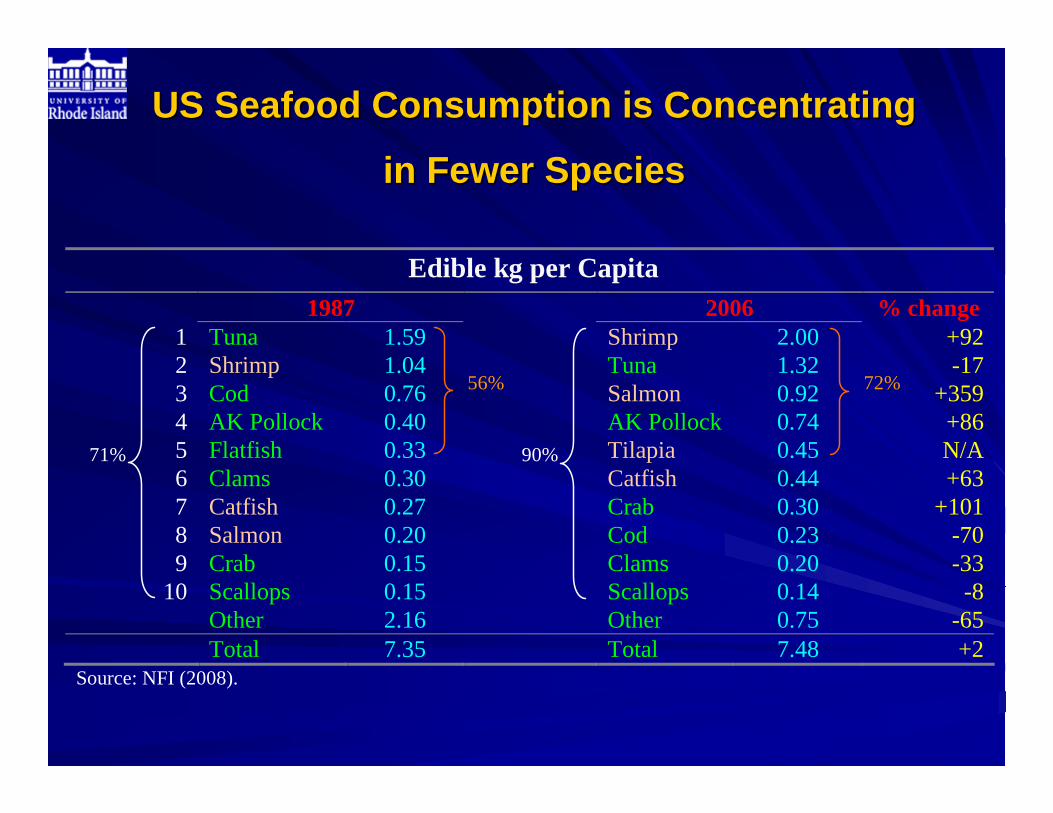
10 Scallops 0.15 Scallops 0.14 -8 Other 2.16 Other 0.75 -65 Total 7.35 Total 7.48 +2
Source: NFI (2008).
71% 90%
56% 72%
US Seafood Consumption is ConcentratingUS Seafood Consumption is Concentrating
in Fewer Speciesin Fewer Species
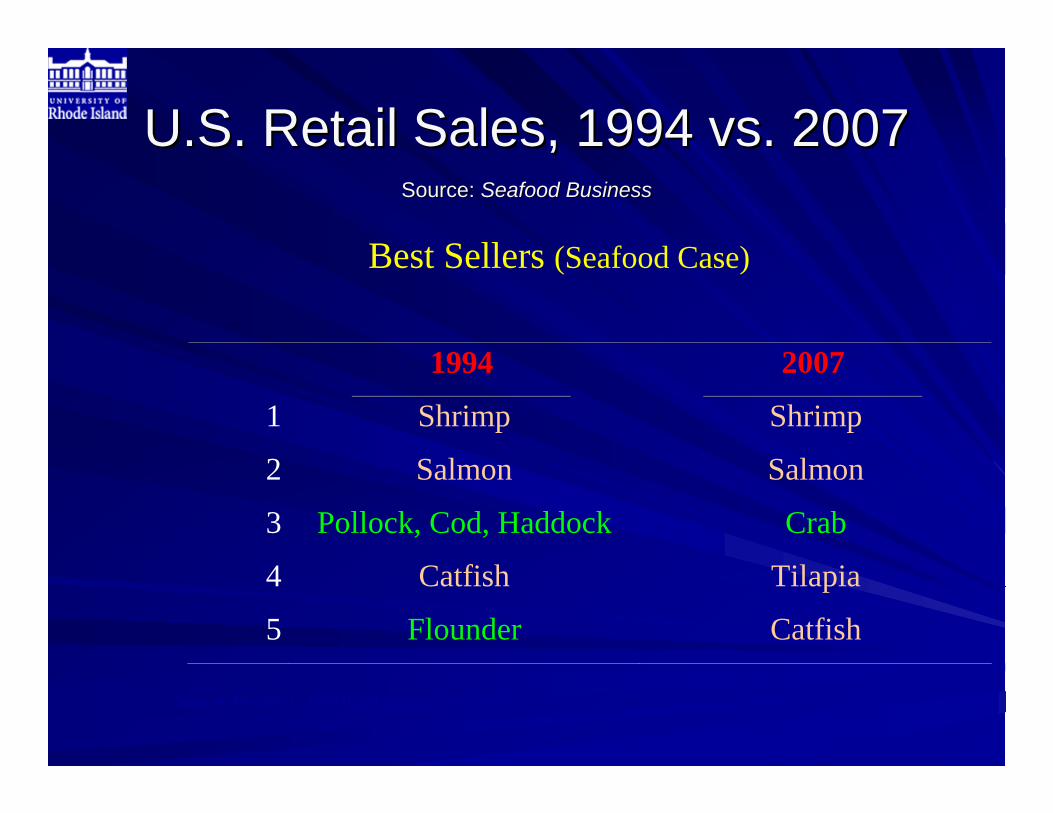
U.S. Retail Sales, 1994 vs. 2007U.S. Retail Sales, 1994 vs. 2007Source: Source: Seafood BusinessSeafood Business
1994 2007
1 Shrimp Shrimp
2 Salmon Salmon
3 Pollock, Cod, Haddock Crab
4 Catfish Tilapia
5 Flounder Catfish
Best Sellers (Seafood Case)
Sources: Perkins, C. (1994) and Robinson, F. (2004)
Large Retailer and Chain Large Retailer and Chain Restaurant Demands have:Restaurant Demands have:
Encouraged vertical and horizontal integrationEncouraged vertical and horizontal integrationStimulated globalizationStimulated globalizationEncouraging various certification programs Encouraging various certification programs ––Sustainability and SafetySustainability and Safety–– Farmed SalmonFarmed Salmon–– Wild SalmonWild Salmon–– ShrimpShrimp–– Alaska PollockAlaska Pollock
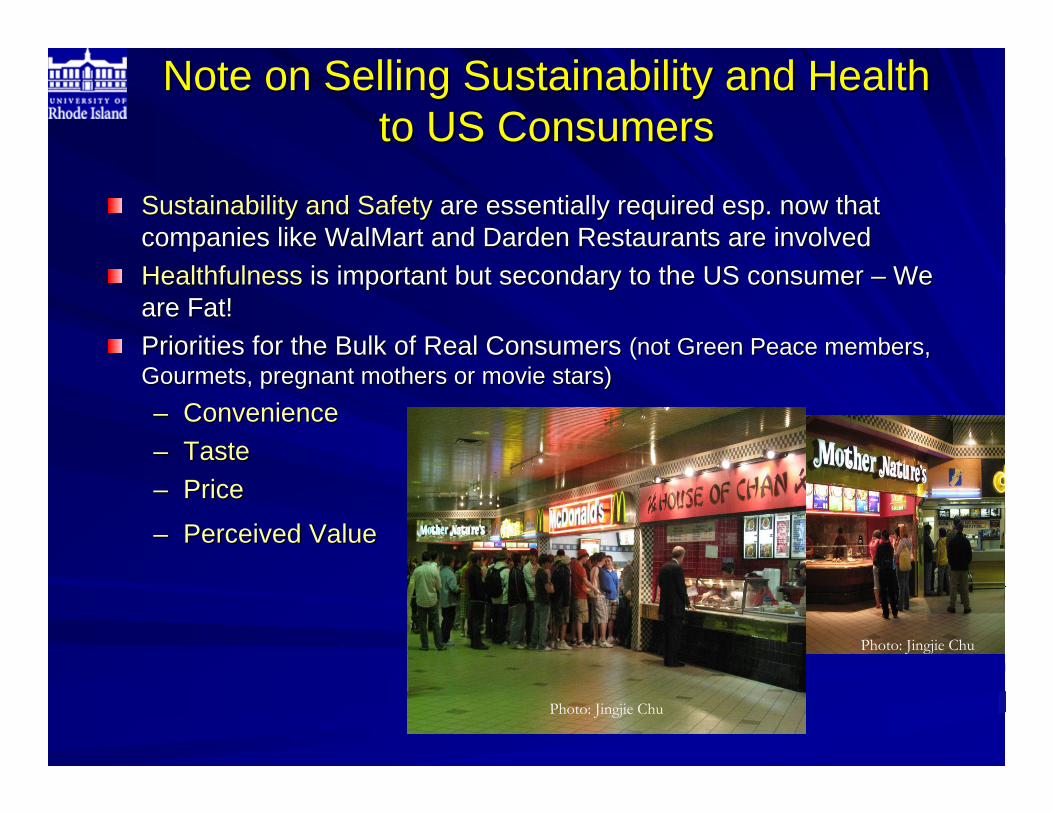
Note on Selling Sustainability and Health Note on Selling Sustainability and Health to US Consumersto US Consumers
Sustainability and SafetySustainability and Safety are essentially required esp. now that are essentially required esp. now that companies like WalMart and Darden Restaurants are involvedcompanies like WalMart and Darden Restaurants are involvedHealthfulnessHealthfulness is important but secondary to the US consumer is important but secondary to the US consumer –– We We are Fat!are Fat!Priorities for the Bulk of Real Consumers Priorities for the Bulk of Real Consumers (not Green Peace members, (not Green Peace members, Gourmets, pregnant mothers or movie stars)Gourmets, pregnant mothers or movie stars)–– ConvenienceConvenience–– TasteTaste–– PricePrice
–– Perceived ValuePerceived Value
Photo: Jingjie Chu
Photo: Jingjie Chu
0.00
0.50
1.00
1.50
2.00
2.50
3.00
3.50
4.00
4.50
5.00
5.50
6.00
6.50
7.00
7.50
1990 1992 1994 1996 1998 2000 2002 2004 2006 2008
2000
US$
/lb
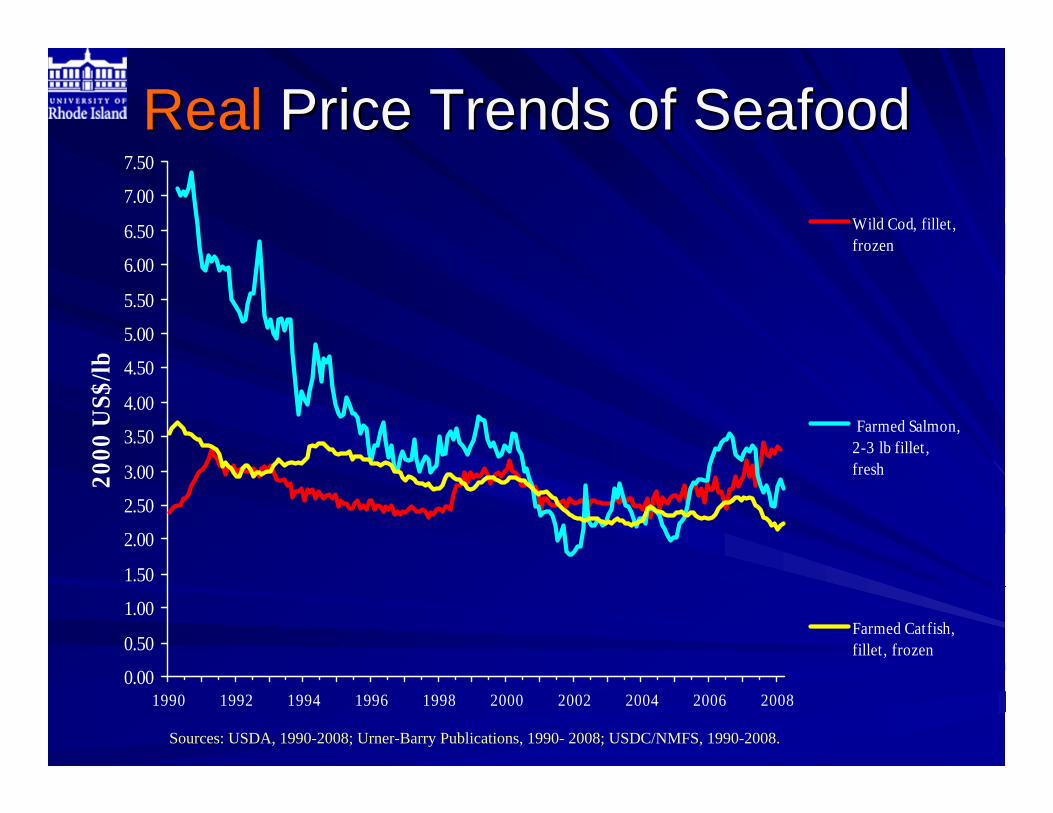
Wild Cod, fillet,frozen
Farmed Salmon,2-3 lb fillet ,fresh
Farmed Catfish,fillet, frozen
RealReal Price Trends of SeafoodPrice Trends of Seafood
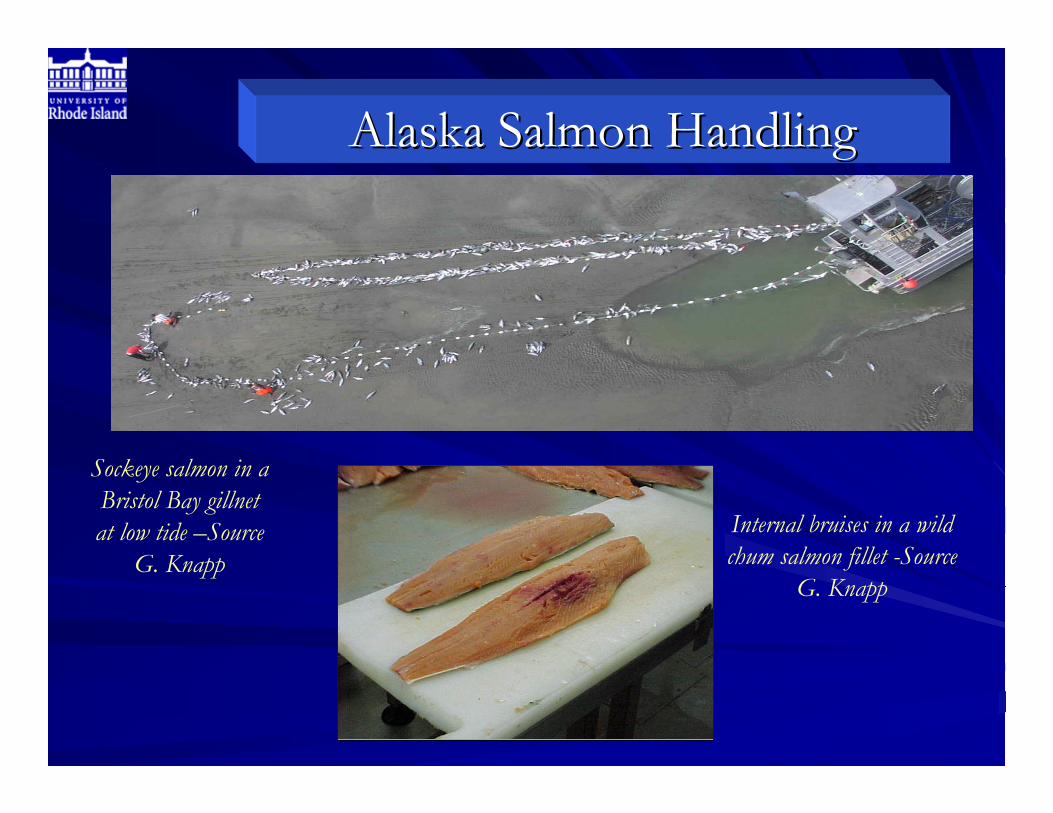
Internal bruises in a wild chum salmon fillet -Source
G. Knapp
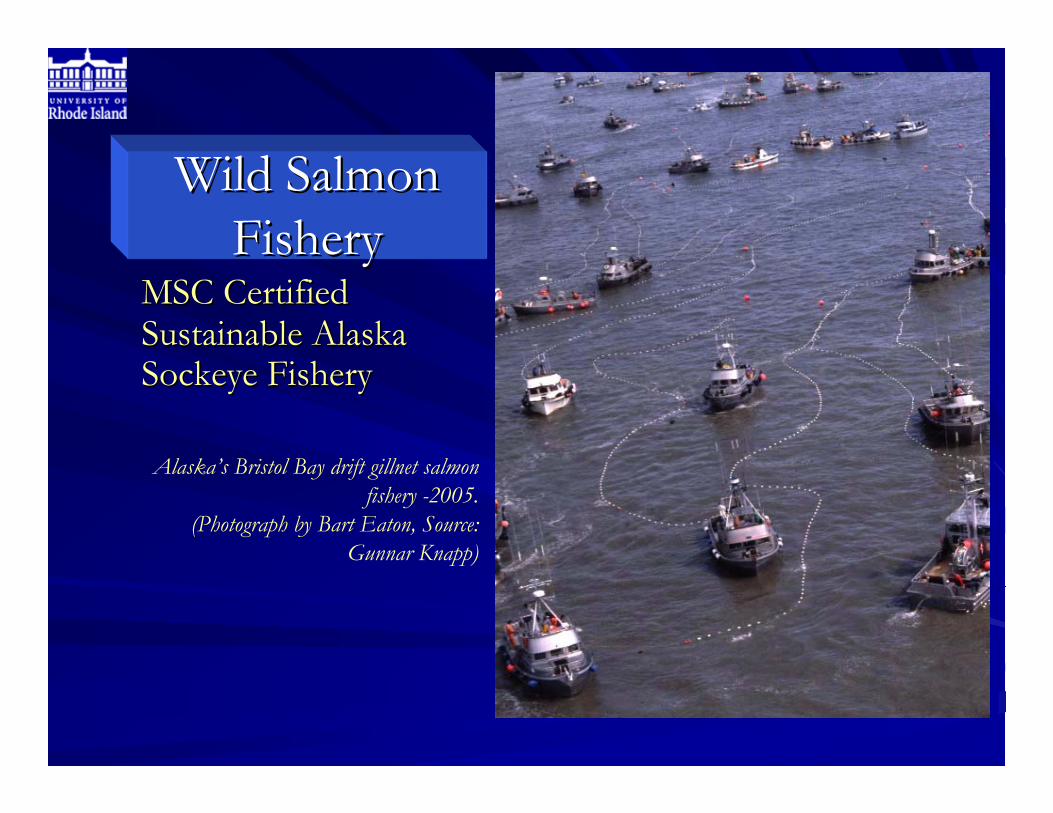
Alaska Salmon Handling Alaska Salmon Handling
Sockeye salmon in a Bristol Bay gillnet at low tide –Source
G. Knapp
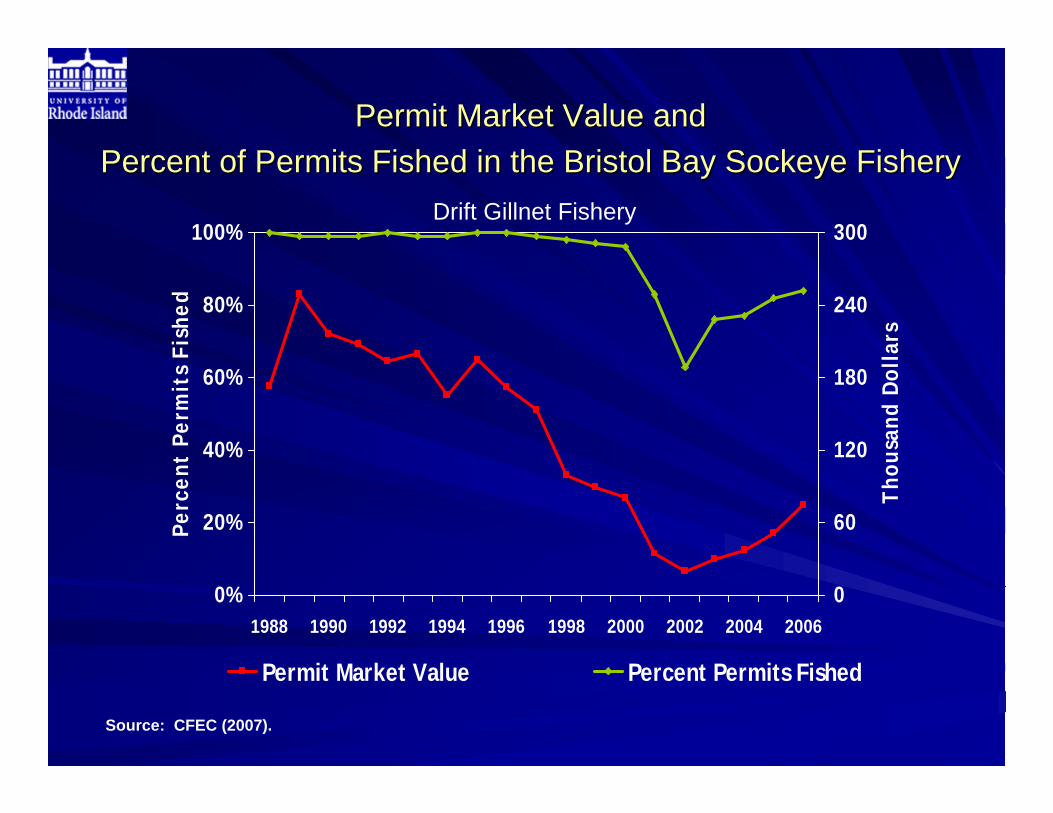
Permit Market Value and Permit Market Value and Percent of Permits Fished in the Bristol Bay Sockeye Fishery Percent of Permits Fished in the Bristol Bay Sockeye Fishery
Source: CFEC (2007).
0%
20%
40%
60%
80%
100%
1988 1990 1992 1994 1996 1998 2000 2002 2004 2006
Perc
ent
Perm
its
Fish
ed
0
60
120
180
240
300
Tho
usan
d D
olla
rs
Permit Market Value Percent Permits Fished
Drift Gillnet Fishery
Competition with farmed salmon has Competition with farmed salmon has increased efficiency through reduction of increased efficiency through reduction of efforteffort–– Bristol Bay Salmon, AlaskaBristol Bay Salmon, Alaska
Competition with farmed salmon has Competition with farmed salmon has increased efficiency through attempts to increased efficiency through attempts to restructure the fleet restructure the fleet –– Chignik Salmon Coop., AlaskaChignik Salmon Coop., Alaska
The Aquaculture Sector Creates The Aquaculture Sector Creates New MarketsNew Markets
Salmon Farmers created new markets in Salmon Farmers created new markets in southern USsouthern USFarmed Salmon created new markets premium Farmed Salmon created new markets premium wild salmonwild salmonNew Products New Products –– PinPin--BoneBone--Out Salmon FilletOut Salmon FilletNew markets are all being developed by New markets are all being developed by aquaculturistsaquaculturists: ex. sturgeon, barramundi, tilapia, : ex. sturgeon, barramundi, tilapia, basabasa, oysters, cobia, mussels and many other , oysters, cobia, mussels and many other species species
0
50
100
150
200
250
300
350
400
450
500
1990 1992 1994 1996 1998 2000 2002 2004 2006 2008
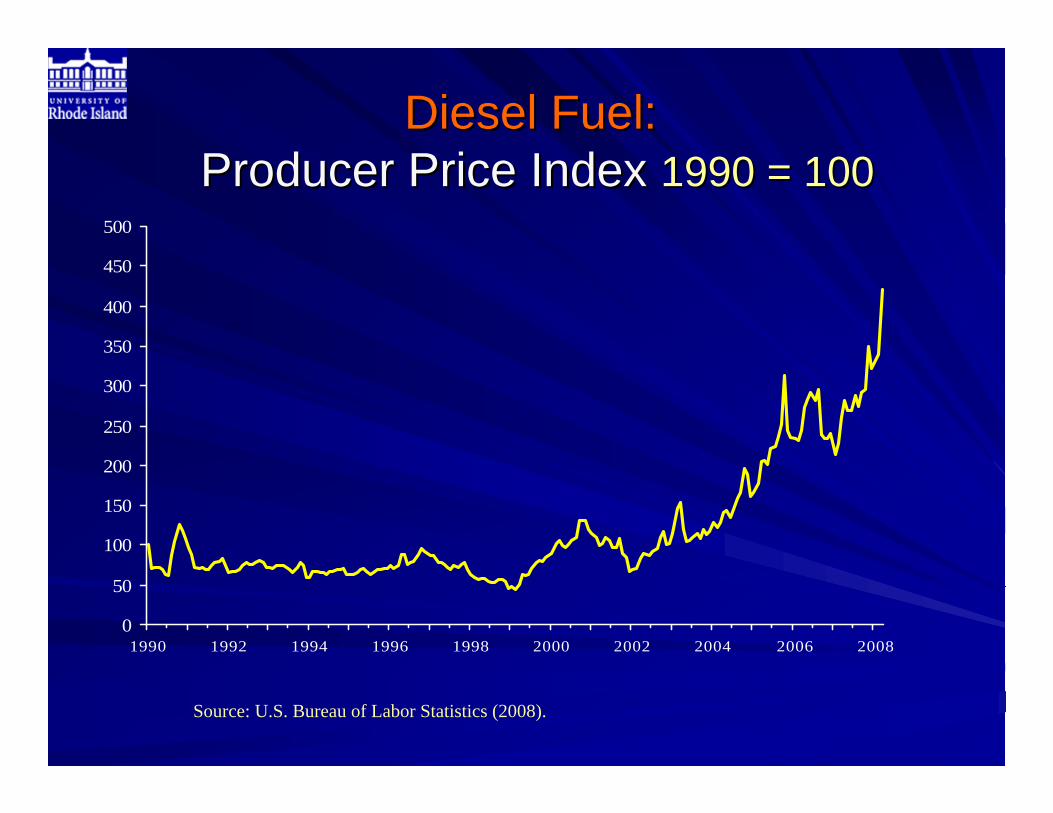
Diesel Fuel: Diesel Fuel: Producer Price Index Producer Price Index 1990 = 1001990 = 100
Source: U.S. Bureau of Labor Statistics (2008).
Implications of Rising Fuel CostImplications of Rising Fuel Cost
Stronger competitive position of Stronger competitive position of farmedfarmed fish fish and shellfish and shellfish
over:over:WildWild--caughtcaught seafood seafood
0
300
600
900
1,200
1,500
1991 1993 1995 1997 1999 2001 2003 2005 2007
US$
/MT
Fishmeal
Soybean meal
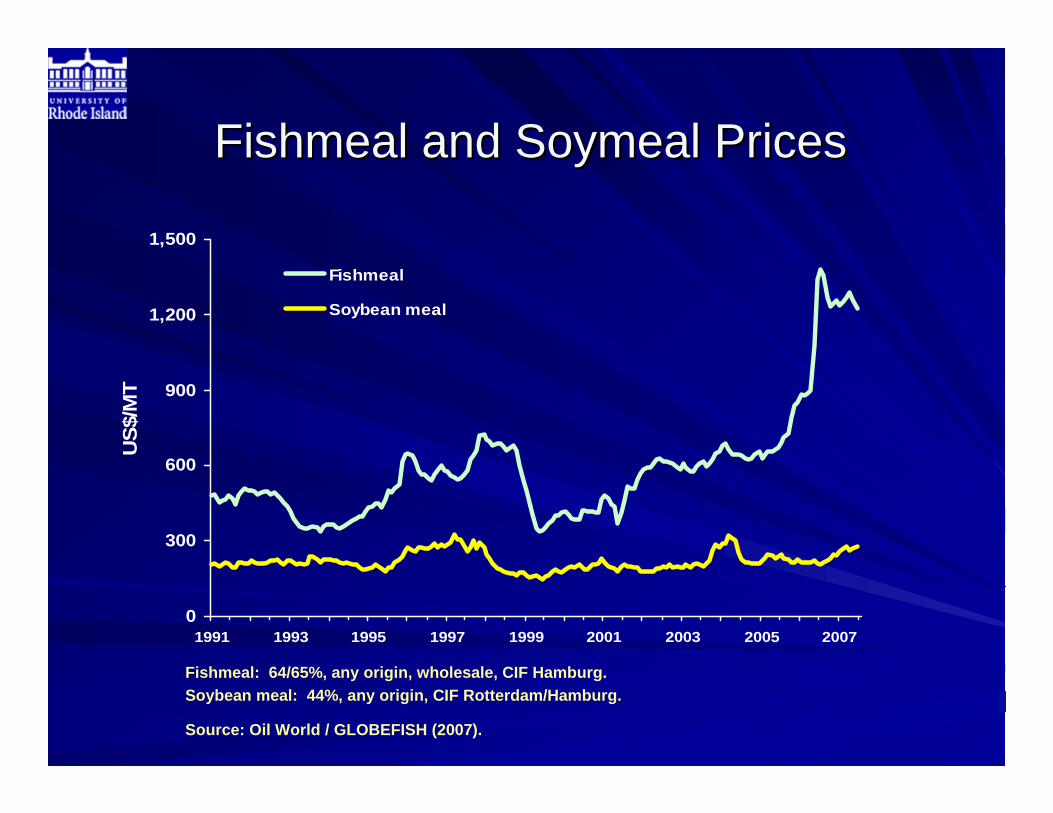
Fishmeal and Soymeal PricesFishmeal and Soymeal Prices
Fishmeal: 64/65%, any origin, wholesale, CIF Hamburg.Soybean meal: 44%, any origin, CIF Rotterdam/Hamburg.
Source: Oil World / GLOBEFISH (2007).
Implications of Rising Feed CostImplications of Rising Feed Cost
Stronger competitive position of farmed Stronger competitive position of farmed shellfish (clams, oyster, mussels, scallops) shellfish (clams, oyster, mussels, scallops)
compared to: compared to: Farmed Finfish and Shrimp Farmed Finfish and Shrimp
Beef, Pork and ChickenBeef, Pork and Chicken
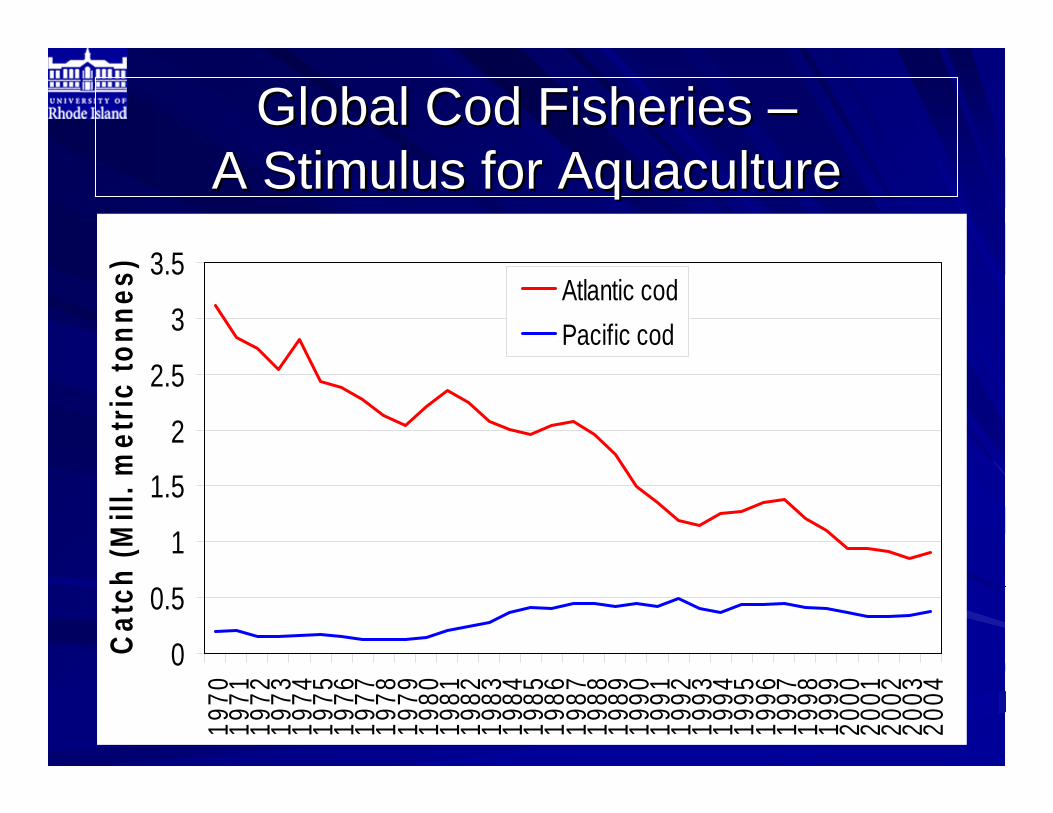
Global Cod Fisheries Global Cod Fisheries ––A Stimulus for AquacultureA Stimulus for Aquaculture
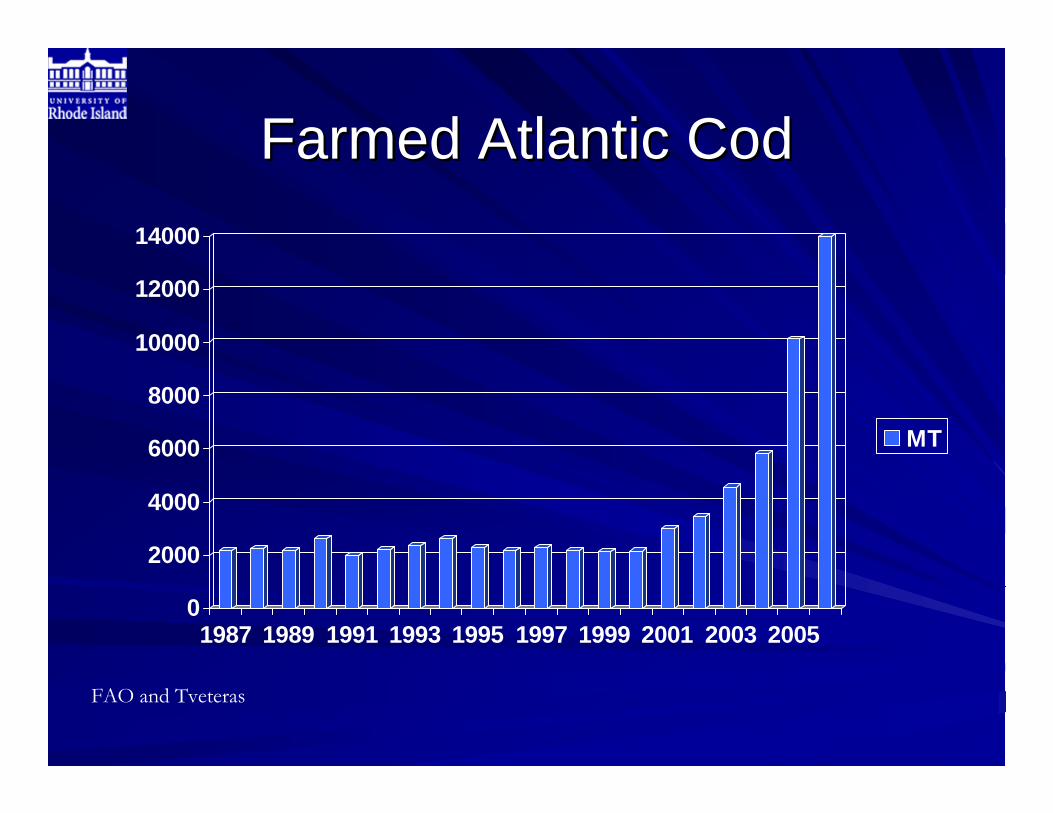
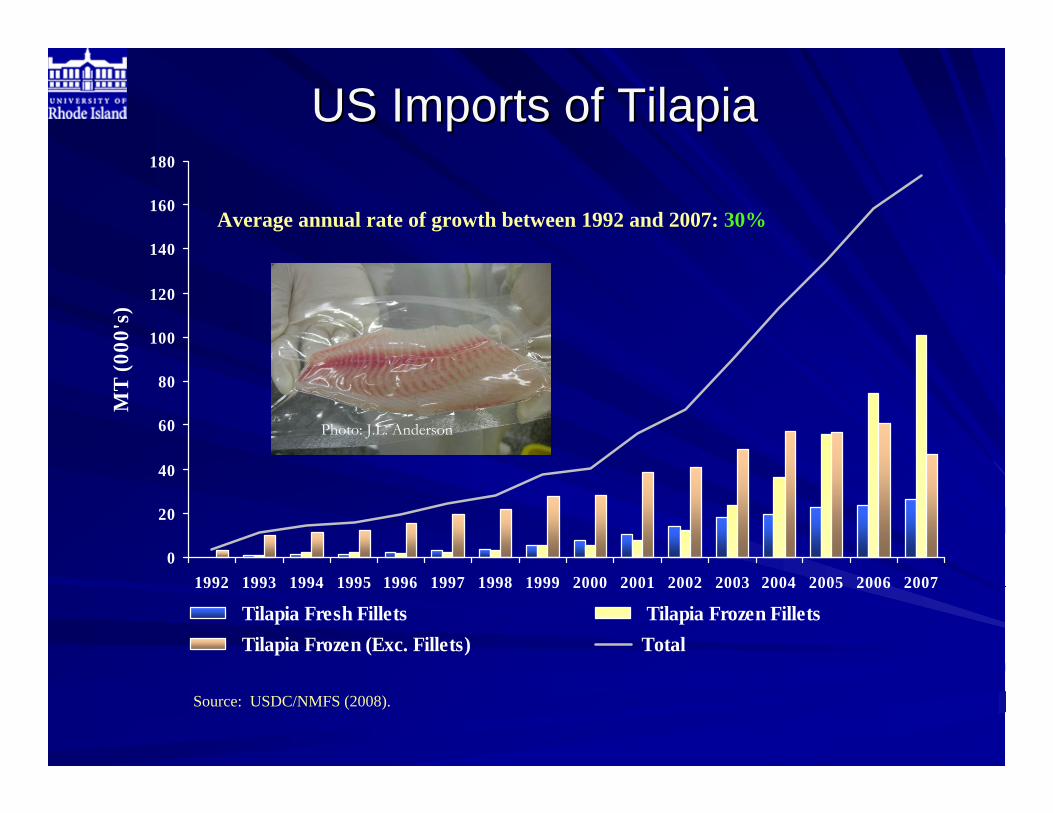
Average annual rate of growth between 1992 and 2007: 30%
Photo: J.L. Anderson
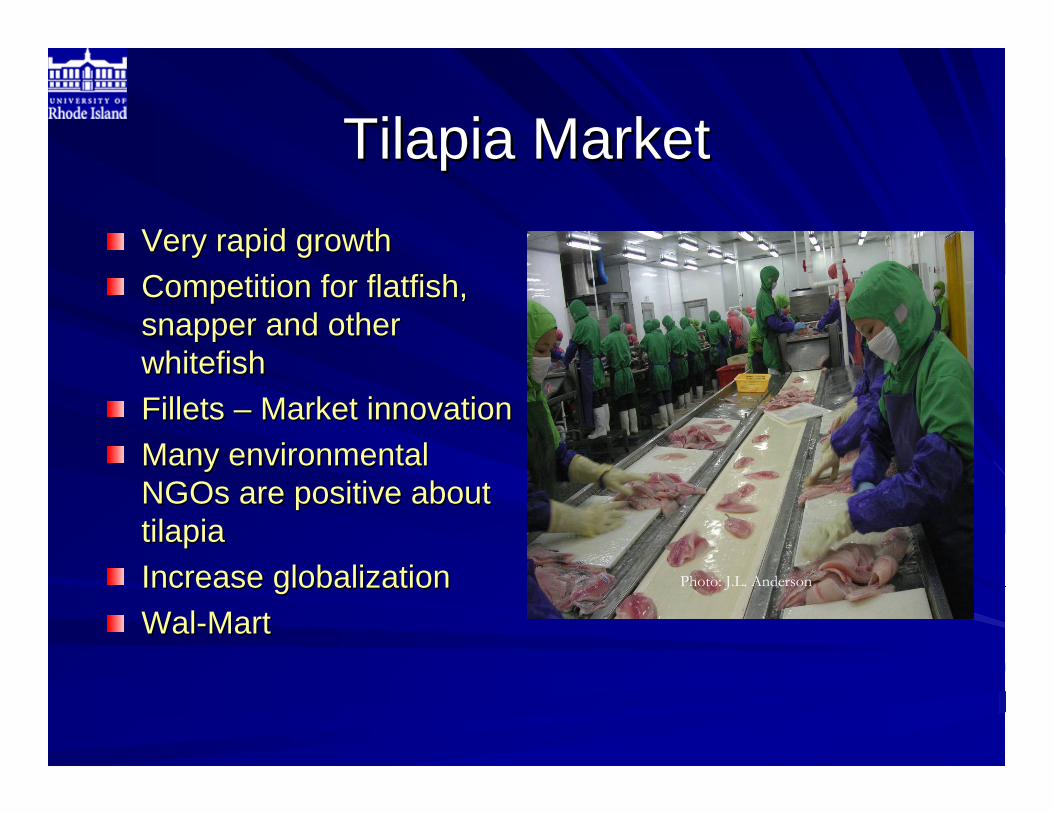
Tilapia MarketTilapia MarketVery rapid growthVery rapid growthCompetition for flatfish, Competition for flatfish, snapper and other snapper and other whitefishwhitefishFillets Fillets –– Market innovationMarket innovationMany environmental Many environmental NGOs are positive about NGOs are positive about tilapiatilapiaIncrease globalizationIncrease globalizationWalWal--MartMart
Photo: J.L. Anderson
U.S. Imports of Salmon vs. TilapiaU.S. Imports of Salmon vs. TilapiaActual (1989Actual (1989--2006) and Forecast (20072006) and Forecast (2007--
With all this technological change, one might With all this technological change, one might expect countries that think they are expect countries that think they are
adaptive and entrepreneurial adaptive and entrepreneurial -- like the US like the US –– to be leadersto be leaders
Maybe NotMaybe NotTimes are ChangingTimes are Changing
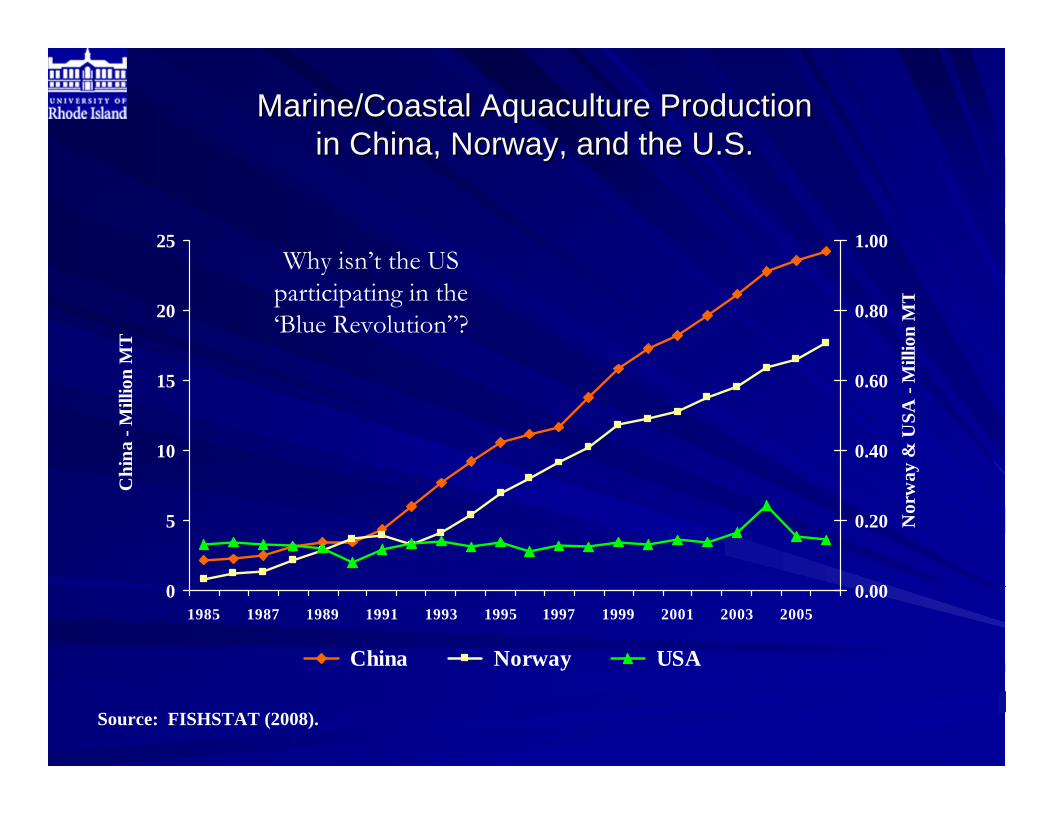
Marine/Coastal Aquaculture Production Marine/Coastal Aquaculture Production in China, Norway, and the U.S.in China, Norway, and the U.S.
Why isn’t the US participating in the ‘Blue Revolution”?
Fisheries Management Fisheries Management --““The integrated process of information gathering, analysis, The integrated process of information gathering, analysis,
planning, decisionplanning, decision--making, allocation of resources and making, allocation of resources and formulation and enforcement of fishery regulations by which the formulation and enforcement of fishery regulations by which the fisheryfishery
management authoritymanagement authority controlscontrols the the present and future behavior of present and future behavior of interested parties in the fisheriesinterested parties in the fisheries,,
in order to ensure the continued productivity of the living in order to ensure the continued productivity of the living resources.resources.”” (FAO 1999). (FAO 1999).
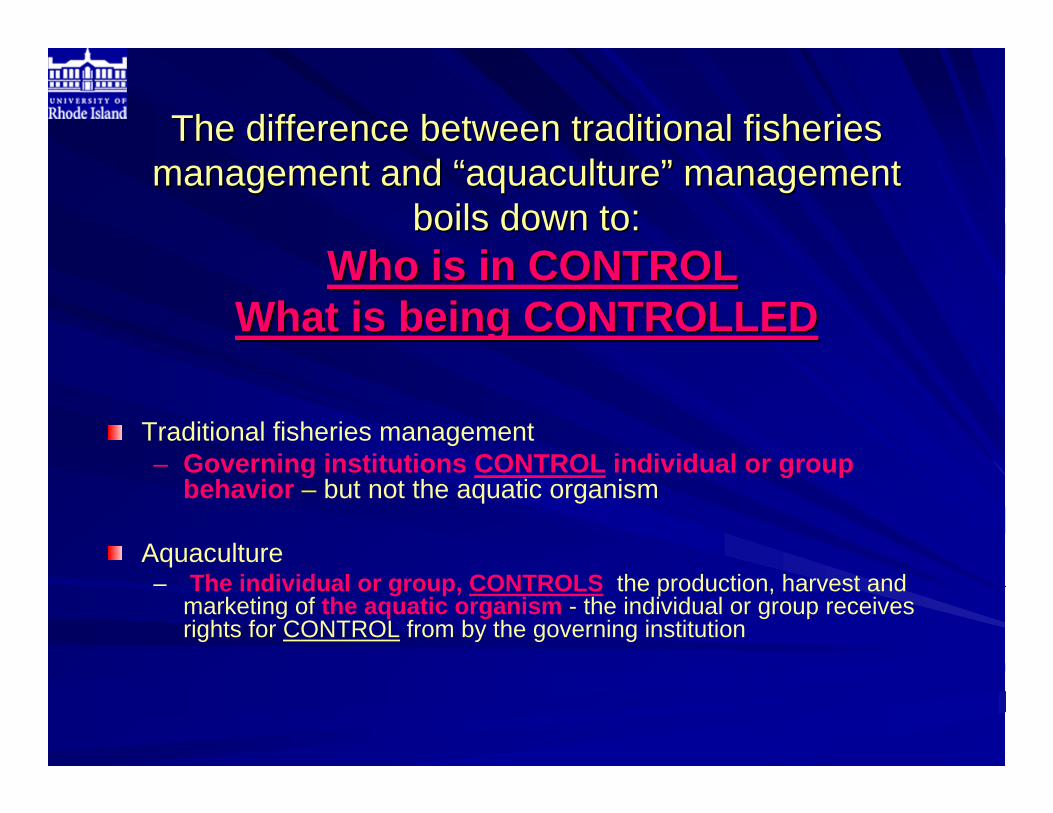
The difference between traditional fisheries The difference between traditional fisheries management and management and ““aquacultureaquaculture”” management management
boils down to:boils down to:Who is in CONTROLWho is in CONTROL
What is being CONTROLLEDWhat is being CONTROLLED
Traditional fisheries management – Governing institutions CONTROL individual or group
behavior – but not the aquatic organism
Aquaculture– The individual or group, CONTROLS the production, harvest and
marketing of the aquatic organism - the individual or group receives rights for CONTROL from by the governing institution
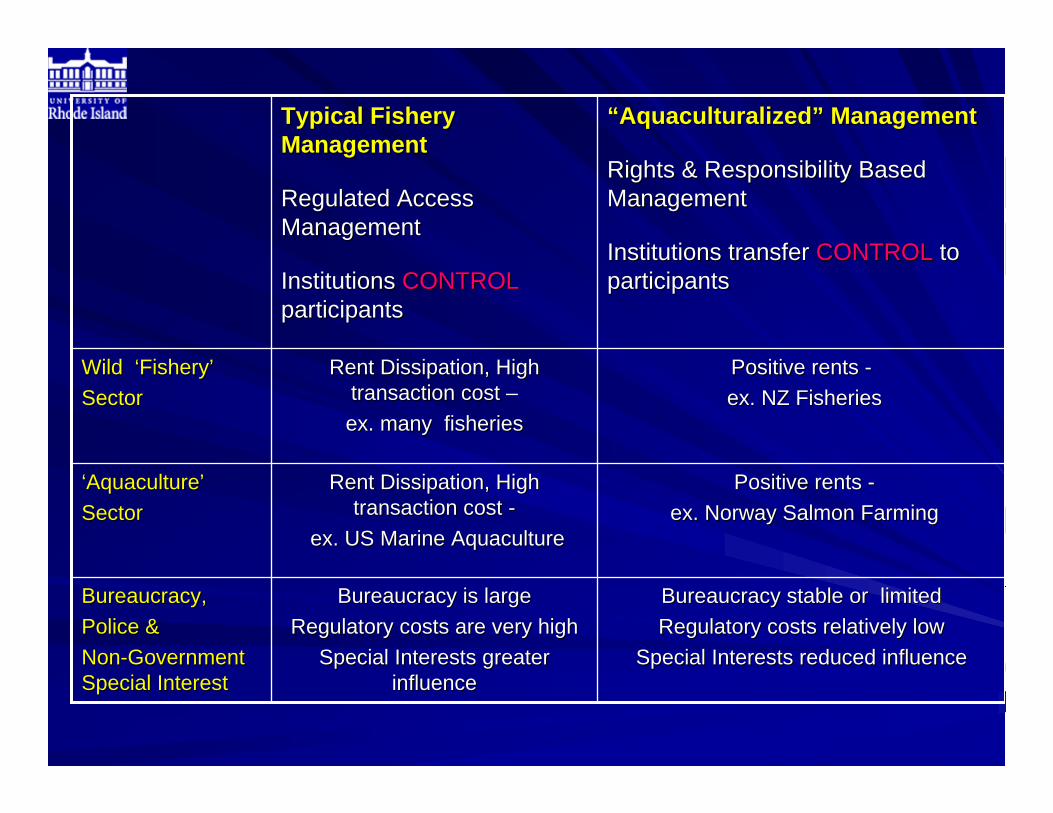
Institutions Institutions CONTROL CONTROL participantsparticipants
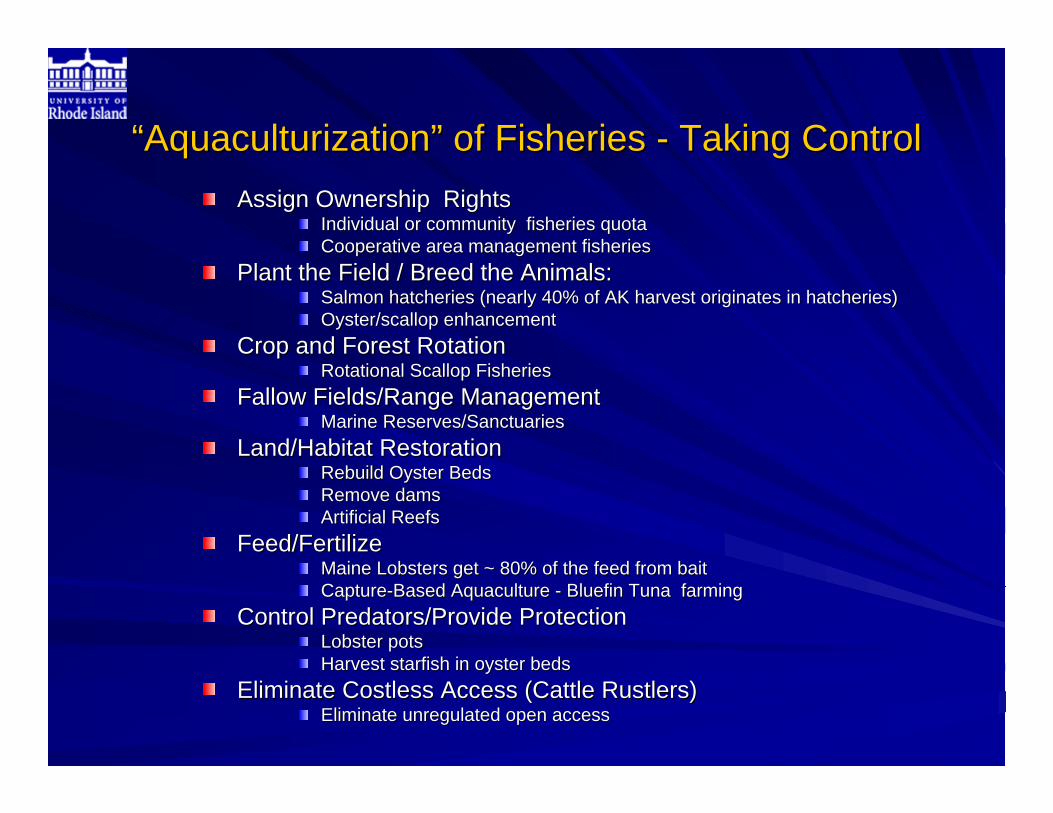
““AquaculturizationAquaculturization”” of Fisheries of Fisheries -- Taking ControlTaking ControlAssign Ownership RightsAssign Ownership Rights
Individual or community fisheries quota Individual or community fisheries quota Cooperative area management fisheriesCooperative area management fisheries
Plant the Field / Breed the Animals: Plant the Field / Breed the Animals: Salmon hatcheries (nearly 40% of AK harvest originates in hatcheSalmon hatcheries (nearly 40% of AK harvest originates in hatcheries)ries)Oyster/scallop enhancementOyster/scallop enhancement
Crop and Forest Rotation Crop and Forest Rotation Rotational Scallop FisheriesRotational Scallop Fisheries
Feed/Fertilize Feed/Fertilize Maine Lobsters get ~ 80% of the feed from baitMaine Lobsters get ~ 80% of the feed from baitCaptureCapture--Based Aquaculture Based Aquaculture -- BluefinBluefin Tuna farmingTuna farming
Control Predators/Provide Protection Control Predators/Provide Protection Lobster pots Lobster pots Harvest starfish in oyster bedsHarvest starfish in oyster beds
Eliminate Costless Access (Cattle Rustlers) Eliminate Costless Access (Cattle Rustlers) Eliminate unregulated open accessEliminate unregulated open access
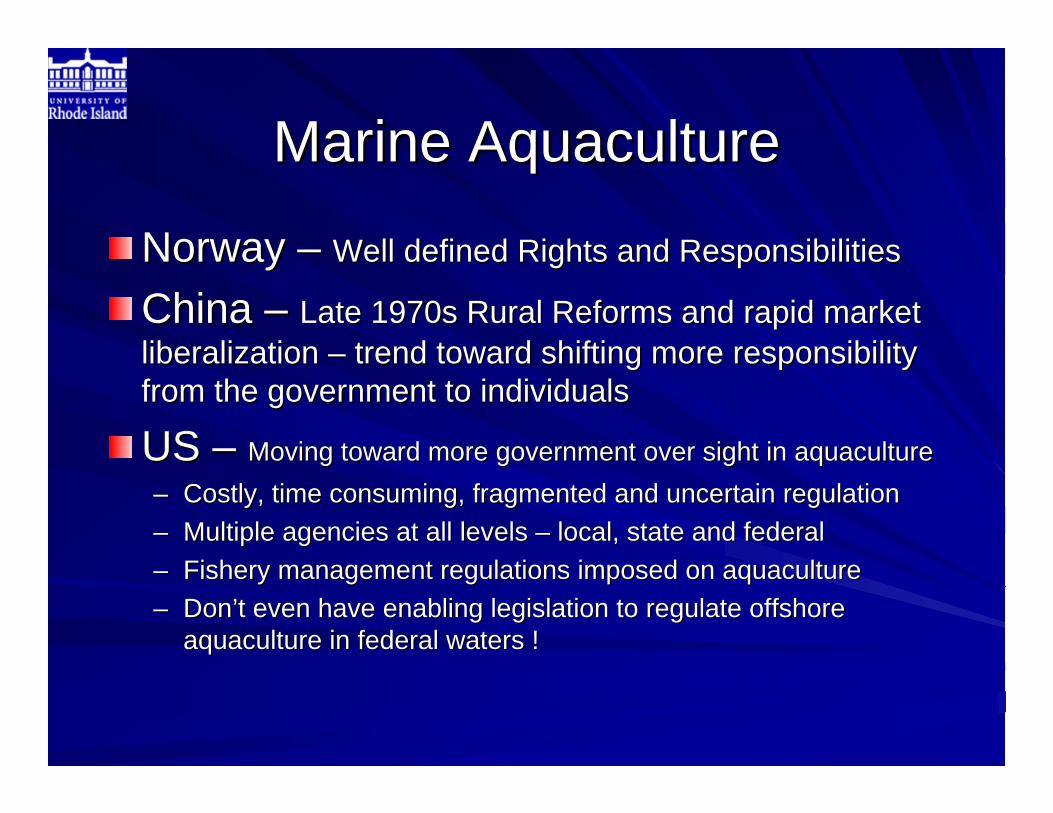
Marine AquacultureMarine Aquaculture
Norway Norway –– Well defined Rights and ResponsibilitiesWell defined Rights and Responsibilities
China China –– Late 1970s Rural Reforms and rapid market ate 1970s Rural Reforms and rapid market liberalization liberalization –– trend toward shifting more responsibility trend toward shifting more responsibility from the government to individualsfrom the government to individuals
US US –– Moving toward more government over sight in aquacultureMoving toward more government over sight in aquaculture–– Costly, time consuming, fragmented and uncertain regulationCostly, time consuming, fragmented and uncertain regulation–– Multiple agencies at all levels Multiple agencies at all levels –– local, state and federal local, state and federal –– Fishery management regulations imposed on aquacultureFishery management regulations imposed on aquaculture–– DonDon’’t even have enabling legislation to regulate offshore t even have enabling legislation to regulate offshore
aquaculture in federal waters !aquaculture in federal waters !
Note on ChinaNote on China
Photo: Jingjie ChuPhoto: J.L. Anderson
Photo: Jingjie Chu
0
1,000,000
2,000,000
3,000,000
4,000,000
5,000,000
6,000,000
7,000,000
8,000,000
9,000,000
10,000,000
1976
1978
1980
1982
1984
1986
1988
1990
1992
1994
1996
1998
2000
2002
2004
2006
Export ValueImport Value
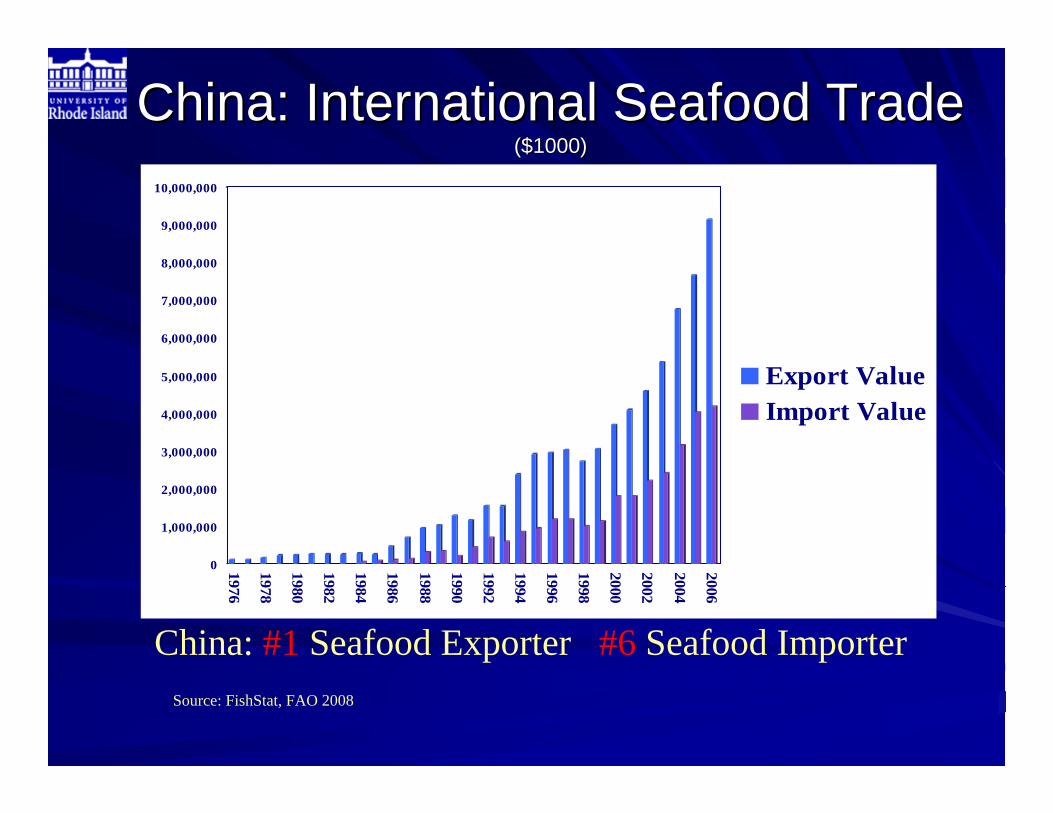
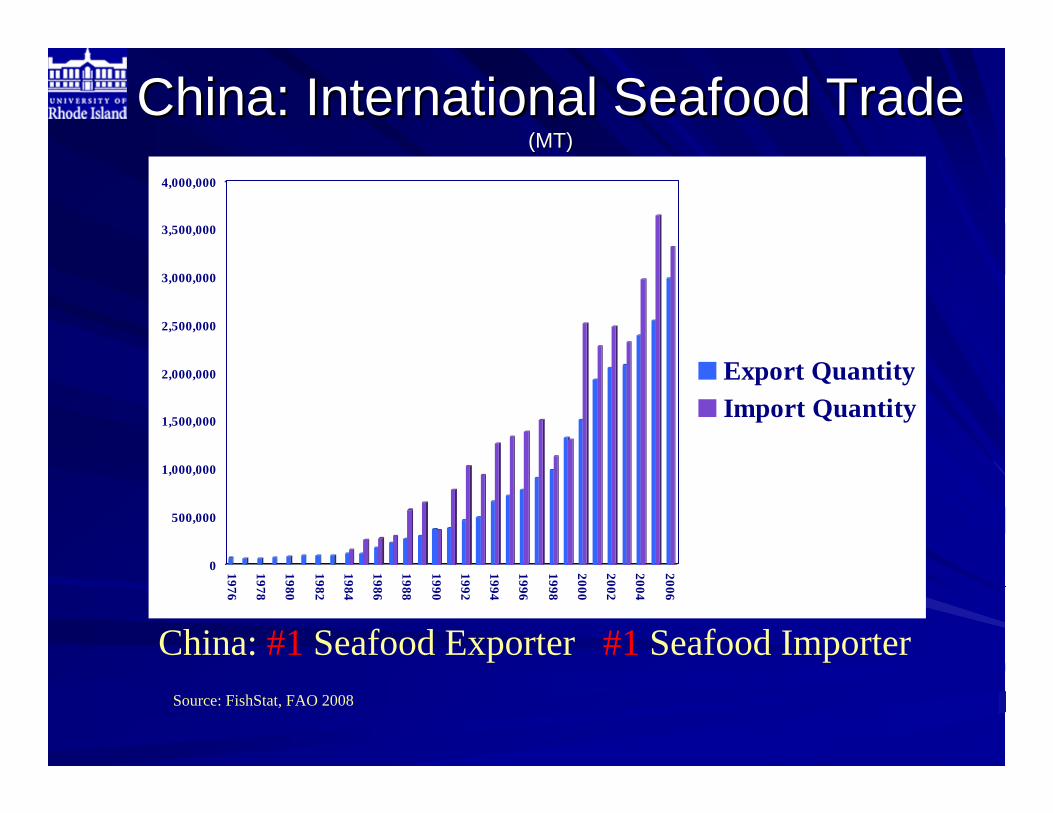
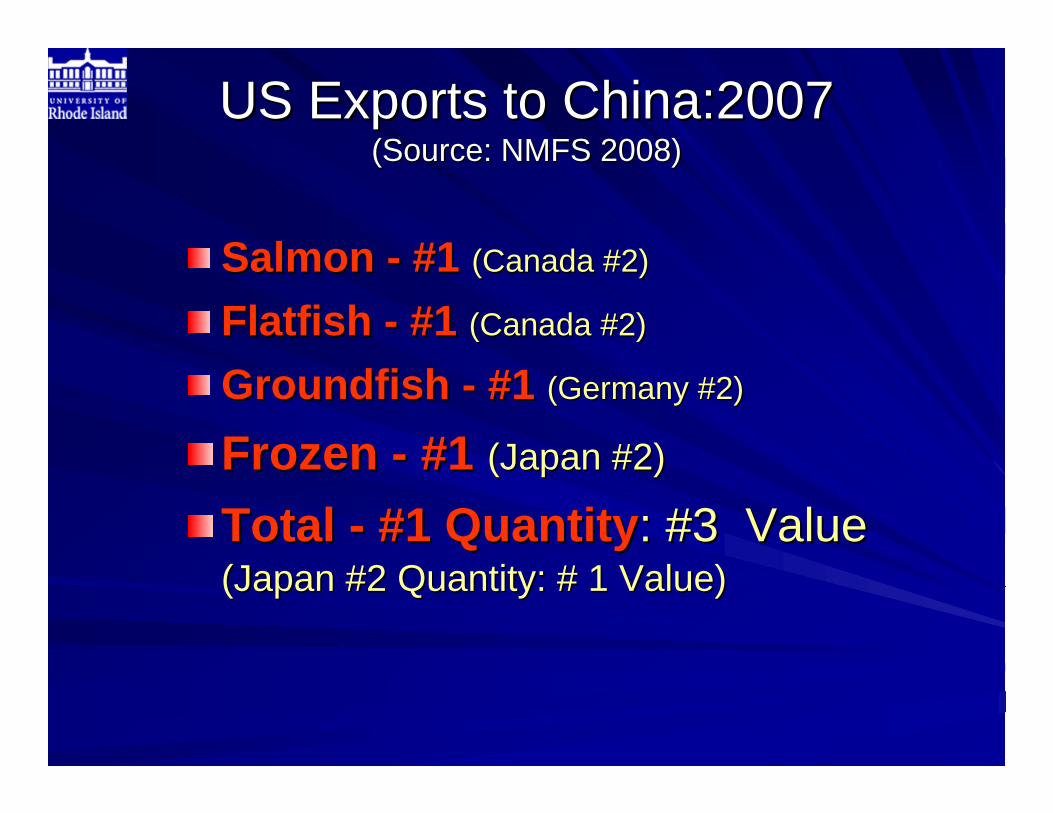
China: International Seafood Trade China: International Seafood Trade ($1000)($1000)
Total Total -- #1 Quantity#1 Quantity: #3 Value : #3 Value (Japan #2 Quantity: # 1 Value)(Japan #2 Quantity: # 1 Value)
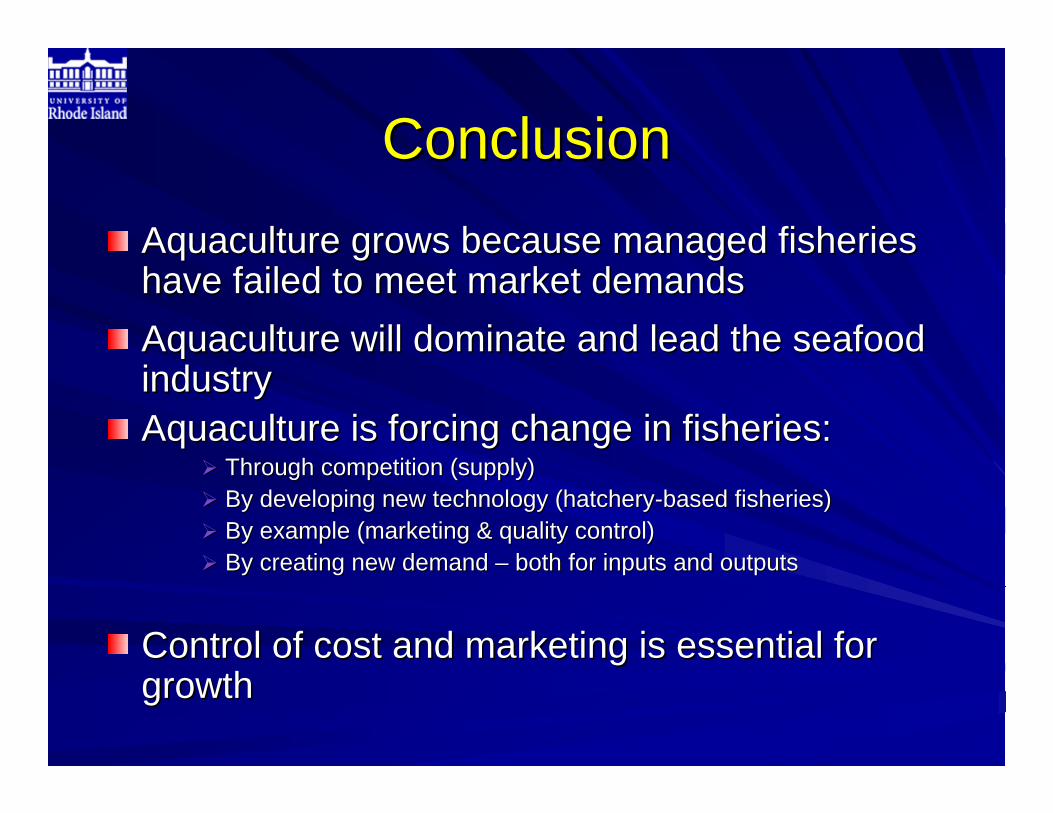
ConclusionConclusionAquaculture grows because managed fisheries Aquaculture grows because managed fisheries have failed to meet market demandshave failed to meet market demandsAquaculture will dominate and lead the seafood Aquaculture will dominate and lead the seafood industry industry Aquaculture is forcing change in fisheries: Aquaculture is forcing change in fisheries:
Through competition (supply)Through competition (supply)By developing new technology (hatcheryBy developing new technology (hatchery--based fisheries)based fisheries)By example (marketing & quality control)By example (marketing & quality control)By creating new demand By creating new demand –– both for inputs and outputsboth for inputs and outputs
Control of cost and marketing is essential for Control of cost and marketing is essential for growthgrowth
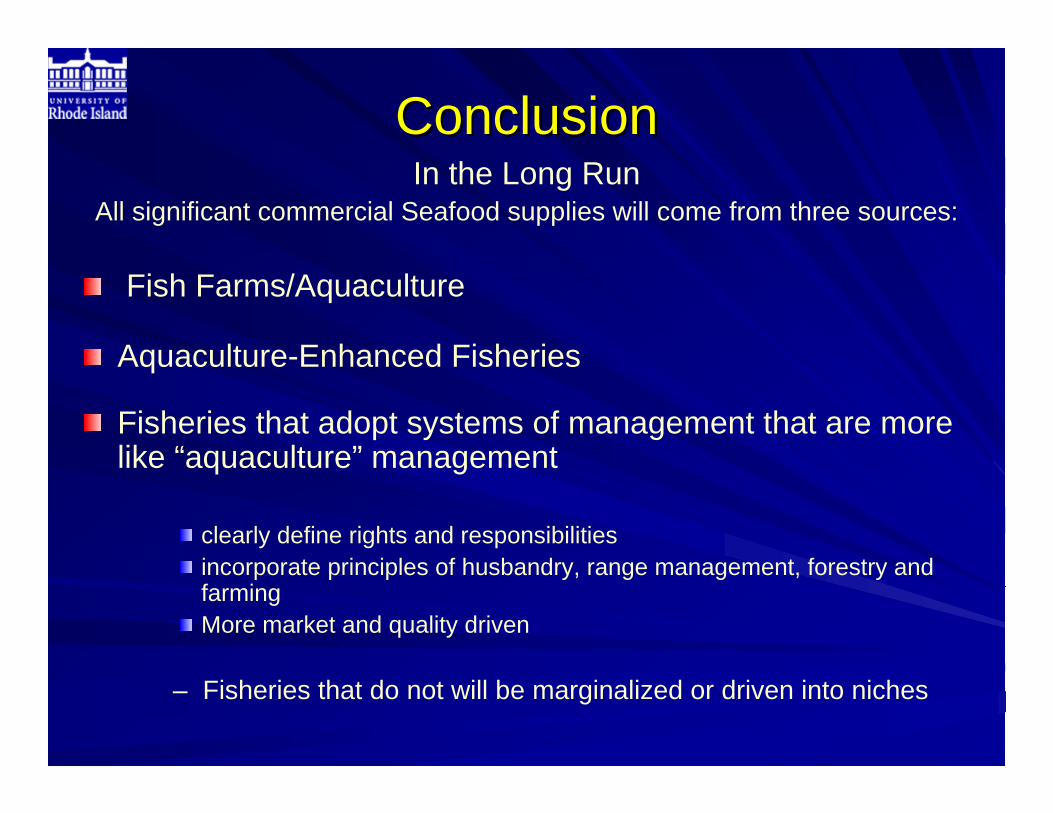
ConclusionConclusionIn the Long Run
All significant commercial Seafood supplies will come from three sources:
Fish Farms/Aquaculture
Aquaculture-Enhanced Fisheries
Fisheries that adopt systems of management that are more like “aquaculture” management
clearly define rights and responsibilitiesincorporate principles of husbandry, range management, forestry and farming More market and quality driven
– Fisheries that do not will be marginalized or driven into niches