Page 1
Emerging Land Issues in African Agriculture:
Implications for Food Security and
Poverty Reduction Strategies
T.S. Jayne, Jordan Chamberlin, and Milu Muyanga1
Paper presented as part of Stanford University’s Global Food Policy and Food Security
Symposium Series, sponsored by the Center for Food Security and the Environment and the
Freeman Spogli Institute for International Studies,
January 12, 2012, Stanford, California
1All authors are with Michigan State University’s Food Security Group, Department of
Agricultural, Food, and Resource Economics. Jayne is Professor International Development,
currently on leave with the Indaba Agricultural Policy Research Institute in Lusaka, Zambia.
Chamberlin and Muyanga are PhD candidates at MSU. The authors acknowledge the generous
support provided for this study by the Bill and Melinda Gates Foundation, the US Agency for
International Development, Economic Growth and Agricultural Trade Division. We also thank
Stanford University’s Center for Food Security and the Environment for additional support for the
preparation of this study. This study has benefited from the thoughtful comments of Derek
Byerlee, Walter Falcon, Diana Grusczynski, Derek Headey, Stein Holden, Mywish Maredia,
Nicole Mason, Chewe Nkonde, and David Tschirley. The views expressed in this paper are those
of the authors only.
Author contact: [email protected]
For more information on the Stanford Global Food Policy and Food Security Symposium Series,
see: http://foodsecurity.stanford.edu/events/series/global_food_policy_series/
Page 2
Page 2 of 56
Executive summary:
Despite the fact that sub-Saharan Africa in 2012 contains much of the world’s unutilized
and underutilized arable land, a significant and growing share of Africa’s farm households
live in densely populated areas. Based on two alternative spatial databases capable of
estimating populations at the level of one square kilometer and distinguishing between
arable and non-arable land, we find that in at least four of the 10 countries analyzed, 25%
of the rural population resides in areas exceeding 500 persons per square kilometer,
estimated by secondary sources as an indicative maximum carrying capacity for areas of
rain-fed agriculture in the region. The apparent paradox of a large proportion of Africa’s
rural population living in densely populated conditions amidst a situation of massive
unutilized land is resolved when the unit of observation moves from land units to people.
A review of nationally representative farm surveys shows a tendency of (1) declining mean
farm size over time within densely populated smallholder farming areas; (2) great
disparities in landholding size within smallholder farming areas, leading to highly
concentrated and skewed patterns of farm production and marketed surplus; (3) half or
more of rural farm households are either buyers of grain or go hungry because they are too
poor to afford to buy food; most households in this category control less than one hectare
of land; and (4) a high proportion of farmers in densely populated areas perceive that it is
not possible for them to acquire more land through customary land allocation procedures,
even in areas where a significant portion of land appears to be unutilized.
Ironically, there has been little recognition of the potential challenges associated with
increasingly densely populated and land-constrained areas of rural Africa, despite the fact
that a sizeable and increasing share of its rural population live in such areas. Inadequate
access to land and inability to exploit available unutilized land are issues that almost never
feature in national development plans or poverty reduction strategies. In fact, especially
since the rise of world food prices after the mid-2000s, many African governments have
made concerted efforts to transfer land out of customary tenure (under the control of
traditional authorities) to the state or to private individuals who, it is argued, can more
effectively exploit the productive potential of the land to meet national food security
objectives. Such efforts have nurtured the growth of a relatively well-capitalized class of
“emergent” African farmers. The growing focus on how best to exploit unutilized land in
Africa has arguably diverted attention from the more central and enduring challenge of
implementing agricultural development strategies that effectively address the continent’s
massive rural poverty and food insecurity problems, which require recognizing the
growing land constraints faced by much of its still agrarian-based population. The final
section of the paper considers research and policy options for addressing these problems.
Page 3
Page 3 of 56
Emerging Land Issues in African Agriculture:
Implications for Food Security and Poverty Reduction Strategies
T.S. Jayne, Jordan Chamberlin, and Milu Muyanga
1. Introduction
In his 2010 Presidential Address of the Agricultural and Applied Economics Association,
Thomas Hertel raised the specter of a Malthusian “perfect storm” hitting the world’s arable
land base. Could the rising demand for food, increased use of farmland for fuel, more
extreme weather events, and reactive responses by rattled governments quickly exhaust the
world’s remaining arable land? There is widespread agreement that accelerating
productivity growth on existing farmland has the brightest prospects for relieving these
pressures. But under very plausible scenarios, the global demand for new farm land could
rise sharply, potentially triggering a rush for new arable land. Ironically, Sub-Saharan
Africa, the most food insecure continent in the world, has the largest and cheapest supply
of unutilized arable land in the world (Fischer and Shah, 2010).2
From this global context, this paper assesses the potential impacts of rising demand for
agricultural land in Africa in the context of the continent’s longstanding challenges: how
to address its hunger problems and the livelihoods of its poor people, the majority of whom
live in rural areas.
This study is motivated by the need to understand the nature and magnitude of land
constraints in African agriculture, the impacts of status-quo policies on food security and
poverty, and the implications for development strategy. To our knowledge, there has been
little recognition of the potential challenges associated with increasingly densely populated
and land-constrained areas of rural Africa. Nor has there been sufficient discussion of how
institutions and policies relating to land access would need to be modified to provide the
greatest prospects for achieving broad-based agricultural growth and reducing rural
poverty.
We begin by casting these issues within two important conceptual models of development
economics: the structural transformation and induced innovation processes. The
structural transformation process has long been considered by development economists to
be the main route through which poverty and hunger in Africa would be overcome. A
major feature of the structural transformation processes achieved in other parts of the
2 Fischer and Shah’s assessment is reported in Deininger and Byerlee 2011 (p.xxxiv). Of the 445.6 million
hectares of uncultivated arable land in the world, 201.5 million hectares are in sub-Saharan Africa, over 60%
more than in Latin America, which has the next most uncultivated arable land.
Page 4
Page 4 of 56
world was broad-based and small farm-led agricultural growth (Johnston and Kilby 1975;
Mellor 1976, Lipton 2005).3 This paper examines the potential for this kind of growth in
light of evidence that a growing proportion of the rural population is either landless or
resides on farms under one hectare, dependent on rain-fed agriculture in semi-arid
conditions, largely unable to feed themselves, and increasingly vulnerable to pressures on
customary authorities to relinquish land to non-local interests. The paper also draws upon
theories of induced innovation to explain how rising land pressures in many parts of Africa
are likely to be affecting the evolution of farming systems and the welfare of African
farmers.
We then present recent MSU work estimating the impacts of rising population densities on
household behavior and welfare, drawing on household panel survey data from several
countries in eastern and southern Africa. The final section of the paper considers the
implications of these findings for agricultural and poverty reduction strategies in Africa.
2. Data
This study draws on two types of data. First, we utilize regional databases describing
detailed spatial distributions of rural populations and arable land. Estimates of rural
population density are derived from two sources: the Global Rural-Urban Mapping Project
(GRUMP) at Columbia University4 and the AfriPop Project hosted at the University of
Florida.5 Both datasets provide gridded estimates of local population densities based on
census data at the most localized units available, and then mapping these populations into
grid cells corresponding to that reporting unit (obtained by dividing the county into, e.g.,
one square kilometer units). GRUMP and AfriPop differ principally in the means of
allocation: the GRUMP separates the urban and rural components of local population, with
the rural portion being equally allocated to all rural grid cells contained in the most
disaggregated spatial reporting unit of the most recent census. The AfriPop dataset uses
remotely-sensed data on landcover to weight this allocation, such that cells corresponding
to areas with evidence of human settlement receive higher allocation weights (than, say, a
cell that corresponds to forest or desert). Given the different sets of assumptions built into
the construction of these datasets, we use both datasets to give robustness to our analytical
conclusions.
3 In recent years a small number of scholars have questioned whether Africa’s development will follow this
structural transformation trajectory (e.g., Collier and Dercon 2009), an issue that we take up later in this
paper. 4 Data available from http://sedac.ciesin.columbia.edu/gpw/index.jsp See Balk et al (2004) for a description
of the methods used to compile the dataset. 5 Data available from http://www.clas.ufl.edu/users/atatem/index_files/AfriPop.htm. See Tatem et al (2007)
for a description of the methods used to compile the dataset.
Page 5
Page 5 of 56
Information on the portion of arable land within each grid cell was obtained from the
Global Agro-ecological Zones (GAEZ) 3.0 database.6 The GAEZ data consist of gridded
estimates of local land and agro-climatic resources -- including soils, terrain, land cover,
and a variety of climatic indicators -- as well as derived estimates of agricultural suitability
and potential yields for a variety of commodities under given management levels.
Drawing from the land cover components of the GAEZ database, we assembled three
definitions of “arable land”: areas classified as (a) under cultivation; (b) under cultivation
or grassland; and (c) under cultivation or grassland or forest/woodland. The reasoning
behind our adoption of multiple definitions was to evaluate the robustness of our analyses
to alternative definitions, with classification (a) reflecting currently available farmland, and
(b) and (c) reflecting potential available farmland if sufficient costs are incurred to convert
grassland and forest land to farming.7
Within a GIS, we combined the data on arable land and rural population at the level of one
square kilometer grid cells covering all of sub-Saharan Africa.8 Use of this data allows for
much greater localized variation in rural population densities than would be possible if
estimated at more aggregated spatial units. As we will see, this leads to some surprising
conclusions.
The second source of data is drawn from farm household surveys. These datasets are
generally nationally representative and carried out by the official national statistical
agencies or by local universities. In particular, this study utilizes data from Kenya and
Zambia between 1997 and 2010. The nationwide Egerton University/Tegemeo Institute
Rural Household Survey is a panel dataset tracking roughly 1,240 small-scale farm
households in 5 survey waves over the 13-year period from 1997 to 2010. The nationally
representative Zambia dataset was implemented by the Central Statistical Office and tracks
6 Data and information available at: http://www.iiasa.ac.at/Research/LUC/GAEZv3.0/ See Fischer et al
(2010) for methodological details of the database’s construction. 7 Some grid cells specified as already under cultivation appear to have been misclassified as savannah or
woodland; thus, moving from definition (a) to (b) and (c) implies a tradeoff between errors of omission and
commission; analyses of land pressures based on the broader definitions of “potentially arable” may be seen
as lower bounds on actual pressures. Land pressures would be intensified further after accounting for land
required for grazing and fallow. Rotational systems involving fallowing will be necessary in many areas of
Africa, e.g., Myiombo woodlands, where soils are leached and acidic. Under currently available
technologies, there would be major constraints on sustainable intensification which involved the elimination
of fallows (Holden, Otsuka, and Place 2012). Land issues that are particular to pastoral communities are
outside the scope of this study. 8 We excluded grid cells categorized as rural that contained less than 10% arable land or exceeded 2,000
persons per km2 based on the assumption that population densities over this level were approaching peri-
urban status or were mis-categorized.
Page 6
Page 6 of 56
over 6,000 small- and medium-scale households (0.1 to 20 hectares) surveyed in 2001,
2004 and 2008. Details of both data sets are contained in Jayne et al (2010).9
3. Conceptual Framework: the Role of Land in Affecting Development
Trajectories
Structural transformation
Smallholder-led structural transformation is considered by most development economists
to be the major pathway from a semi-subsistence agrarian society to a more prosperous,
food secure, and diversified economy. The pioneering work of Johnston and Mellor
(1961), Johnston and Kilby (1975) and Mellor (1976) first documented the structural
transformation process in the regions of Asia that experienced Green Revolutions. The
structural transformation process starts with an exogenous productivity shock (e.g., the
creation and mass adoption of new farm technology), causing a build-up of purchasing
power by millions of small farmers. These millions of farmers subsequently spend and re-
cycle more money through the economy, igniting demand and employment growth in non-
farm sectors, which in turn increases the demand for food and other farm products in a
virtuous cycle in which the rural and urban labor forces provide a market for each other.
Rising demand for food and fiber products attracts private investment flows into the
storage, transport, processing, and retailing stages of commodity value chains, further
expanding employment and diversifying the economy. Over time, broad-based income
growth causes the share of food in overall consumption to fall, making available more
disposable income to fuel the development of non-farm sectors. As the demand for non-
farm goods and services rise, the labor force responds by shifting gradually from the farm
to non-farm sectors, the demand for education and job skills rises, and the economy
becomes increasingly diversified and urban. Rural households are pulled off the farm by
better paying non-farm jobs, not pushed into low-paying desperation jobs in the towns due
to poor prospects in agriculture.
Recently, the feasibility of a small-farm based structural transformation in Africa has been
questioned by some scholars (e.g., Collier and Dercon 2009), and, by their actions, a
growing number of African policy makers.10
These views have been bolstered by
9 Each of these surveys instruments, which contain the details of the types of information collected and used
in this study, can be viewed and downloaded at http://www.aec.msu.edu/fs2/kenya/index.htm, and
http://www.aec.msu.edu/fs2/zambia/index.htm. 10
For example, Zambia’s 1995 Land Act provides the rationale for state conversion of substantial portions of
land from customary tenure (where smallholder farming is located) to state land to enable land to be more
productivity utilized by local entrepreneurs, investors, and farming blocks. Curiously, the Zambian
government’s position is that conversion to state land is necessary to provide the means for the state to invest
in requisite transport infrastructure, irrigation and electricity to support farm intensification; the reasons why
Page 7
Page 7 of 56
frustration over the slow rate of development in African agriculture. There is increasing
receptivity to viewing large-scale farm development in Africa at least as a complement if
not an alternative to broad-based smallholder-led agricultural growth.
Yet, clearly, agricultural growth alone is not sufficient for poverty reduction; the
distribution of the growth is critical. Johnston and Kilby (1975); Mellor (1976), and more
recently Deininger and Squire (1998), and Vollrath (2007) have demonstrated that
relatively egalitarian land distribution patterns have tended to generate more broadly based
growth, and consequently higher rates of economic growth than in cases where land
distribution was highly concentrated. The basic reason for this is that broad-based
agricultural growth tends to generate greater second-round expenditures in support of local
non-tradable goods and services in rural areas and towns. These multiplier effects tend to
be much weaker when the source of agricultural growth is concentrated in relatively few
hands. Another argument for small-farm led development has to do with the productivity
advantages of farms operated primarily with family labor as opposed to hired labor
(Hayami and Otsuka 1993; Binswanger, Deininger and Feder 1995; Vollrath 2007). Thus
the rate of growth is likely to be affected by the distribution of assets in the agricultural
sector, particularly land.
Moreover, evidence indicates that not only does the initial distribution of assets affect the
rate of economic growth, but it also affects the poverty-reducing effects of the growth that
does occur. For example, Ravallion and Datt (2002) found that the initial percentage of
landless households significantly affected the elasticity of poverty to non-farm output in
India. In a sample of 69 countries, Gugerty and Timmer (1999) found that, in countries
with an initial “good” distribution of assets, both agricultural and non-agricultural growth
greatly benefitted the poorest households with positive poverty reducing effects. In
countries with a “bad” distribution of assets, however, economic growth was skewed
toward wealthier households, causing the gap between rich and poor to widen. It is
especially noteworthy that in this latter group of countries, agricultural growth was
associated with greater increases in inequality than was non-agricultural growth. Mellor,
Johnston, Lipton and others clearly documented that productivity growth on millions of
small farms in Green Revolution Asia was crucial to structural transformation and rapid
poverty reduction. They contrasted the Asian experience with parts of Latin America,
which also achieved agricultural growth, but not in an inclusive way. Latifundia estates
expanded production impressively in many cases while millions of small peasant farms
remained mired in poverty and were often dispossessed of their land.11
A major lesson for
similar intensive public investments are not considered in agricultural development strategies for customary
lands or in national poverty reduction strategies are not addressed in the document. 11
Land and credit policies biased toward large-scale agriculture have been found to dispossess small farmers
of their land, encourage mechanized rather than labor-intensive production, and largely fail to reduce rural
poverty even during periods of rapid agricultural growth (Lopez and Valdes 2000; World Bank 2009). Latin
America has the most concentrated farm structure of all regions of the world. Landholding size Gini
Page 8
Page 8 of 56
Africa from these contrasting experiences of smallholder-led Asia and estate-led Latin
America is that if we want agricultural growth to rapidly reduce poverty, it must be broad-
based.
Land intensification and yield gaps
The brightest prospects for agricultural-led structural transformation would be if it could
be achieved through productivity-enhancing yield growth on currently utilized farmland.
Productivity growth on existing farmland would both ease the demand for new farmland
being brought into production as well as help to conserve the world’s remaining forests
from being destroyed to meet rising food needs (Hertel 2011). Land productivity growth
could occur either through yield growth or shifts in crop area to higher-valued crops or a
combination of both. Farm surveys are already showing evidence of gradual increases in
the share of cropped area devoted to high-return agricultural activities in some regions,
especially on relatively small farms.12
Much greater potential for this form of productivity
growth will depend on the pace of food and input market development, improvements in
physical infrastructure, investments in commodity value chains for high-value
commodities, and stable marketing and trade policies.
The potential for yield growth of the basic staples is enormous. Actual yields in Sub-
Saharan Africa show a persistently yawning gap compared to attainable yields, i.e., yields
that could be attained if available technologies and management practices were used
(Fischer, Byerlee and Edmeades 2009; Licker et al 2010). Maize yields even in the
breadbasket regions of Africa average roughly 25% of attainable yields, and seldom
exceed 40% (Deininger and Byerlee 2011). Given that roughly half of all cropland in sub-
Saharan Africa is devoted to staple grains, closing the yield gap even partially could
simultaneously improve the world’s supply-demand food balance and contribute to rural
poverty reduction in Africa.
However, given current food and input prices, it is unclear how far yield gaps could be
narrowed in a way that would be profitable for farmers. Recent studies from the region
show that recommended fertilizer application rates are often not profitable or are highly
risky given the soil conditions and drought-prone environments that farmers live in (Xu et
al. 2009; Marenya and Barrett 2009; Smaling et al 2003; Sheahan 2011, Burke 2011).
coefficients reported by Vollrath (2007) range from 0.81 for Latin America, to 0.59 for South Asia, to 0.49
for Sub-Saharan Africa. 12
Farm survey data from Kenya and Zambia show that fresh fruits and vegetables, dairy, and other forms of
animal production are rising as a share of total farm production, and that this trend is associated with
improvements in the reliability of food markets (Jayne et al. 2010). In Kenya, horticulture production as a
share of total farm production is especially high on small farms, suggesting that land-constrained households
may, at the margin, be devoting more of their scarce area to crops with relatively high returns (Kimenju and
Tschirley, 2009).
Page 9
Page 9 of 56
Other studies conclude that optimal fertilizer application rates on maize appear to be much
lower than official recommendations, and that these optimal levels are fairly close to
observed application rates on farmers’ fields given existing input and output prices and
response rates (Matsumoto and Yamano 2009; Sheahan 2011). Improvements in
agronomic practices and measures to reduce transport costs could promote the profitability
of fertilizer use and lead to higher optimal application rates. Along with output market
development, these interventions could help farmers to close the currently high yield gap.
Another factor that would help farmers around the world close the yield gap is increased
global food prices (Hertel 2011). If global food prices should rise, as they are projected to
do for at least the next 10 years (e.g., OECD 2011),13
farmers may have great incentives to
intensify their use of modern inputs and use more intensive management practices. The
issue of which African farmers would be able to respond to these price incentives and the
potential income distributional effects is treated later.
Rising population densities and induced innovation
Increasing rural population density is a third factor that may contribute to closing the yield
gap in African food production. The ways in which increasing population density affects
the evolution of farming systems was first laid out in the pioneering work of Esther
Boserup (1965). Growing population densities, land scarcity, and access to markets
generally leads to the intensification of land use, the development of land and labor
markets, investments in land-augmenting practices such as irrigation and drainage, and the
gradual emergence of individual property rights for land. These ideas were later
formalized in Hayami and Ruttan’s (1971) theory of induced innovation, which explains
how changes in relative prices of land, labor, and capital affect the evolution of farming
system to make more productive use of the scarce factor of production. Seminal works in
the induced innovation literature (e.g., Binswanger and Pingali 1988; Binswanger and
McIntire 1987) argued that increases in rural population density in sub-Saharan Africa
should induce a number of changes including greater intensification of land through the
use of fertilizer and improved seed, decreased fallows, investment in land-augmenting
technologies such as irrigation and drainage, more labor time devoted to each unit of land
cultivated (e.g., weeding labor per unit of land rises), the development of land, labor and
informal financial markets, increased landlessness, and declining availability of common
land for livestock (Table 1). Given this kind of innovation, Binswanger and McIntire argue
that through input intensification farmers can raise land productivity (i.e., either increased
yields or shifts to crops that offer higher net returns per unit of land), and maintain or raise
labor productivity growth even in the context of rising labor/land factor proportions. This
13
Reasons commonly stated for a secular rise in global food prices include rising incomes in populous
middle-income countries such as China and India, the rising use of food for fuel, and the apparent tightening
supply/demand balance in world oil markets.
Page 10
Page 10 of 56
literature has explained how agricultural systems in many parts of Africa have over the
past century transitioned from one end of the continuum in Table 1, shifting cultivation, to
the other side of the continuum, intensive annual or multiple cropping with less and less
land being held in fallow to restore soil productivity.
Outstanding policy questions deriving from rising land pressures
However, the induced innovation literature for the most part has not considered what lies
beyond the last stage of Boserup’s farming systems continuum in the context of more
intense land pressures and ever smaller farm sizes in increasingly densely populated rural
areas. Can land intensification and productivity growth be sustained in a linear trajectory
as population density rises without incurring diminishing returns from soil nutrient
depletion, the elimination of fallows, and scale-diseconomies on ever smaller farm sizes?
There are several reasons why declining farm size below a minimum level might be
associated with higher production and marketing costs. The first reason concerns soil
nutrient depletion. Using cross sectional data from 37 African countries, Dreschel et al
(2001) confirm a significant relationship between population density, reduced fallow
periods, and soil nutrient depletion in SSA farming systems. In their view, rising rural
population density is a major cause of declining per capita food production in many parts
of SSA. Restoring and improving soil fertility requires much more than nitrogen,
phosphorus, and potassium, hence greater use of conventional inorganic fertilizers, while
necessarily, certainly will not be sufficient to reach attainable yields. Second, the
efficiency advantages of small farms in relation to large-scale farms do not apply when
comparing, for example, 4 hectare vs. 0.5 hectare farm sizes. There may be scale
economies in input procurement, output marketing, and ability to obtain financing which
may disadvantage small farms (Collier and Dercon 2009). Survey data regardless of
location in SSA indicate that farms below one hectare tend to be net buyers of staple food
(Jayne et al. 2010). The FAO/IFDC argues that the “carrying capacity” of land for SSA
agriculture ranges between 100-500 persons per km2 depending on agro-ecological
potential for intensive production and market access conditions (Henao and Baanante
1999). The evidence presented below shows that a surprisingly high percentage of the
rural population lives in areas exceeding this upper range.
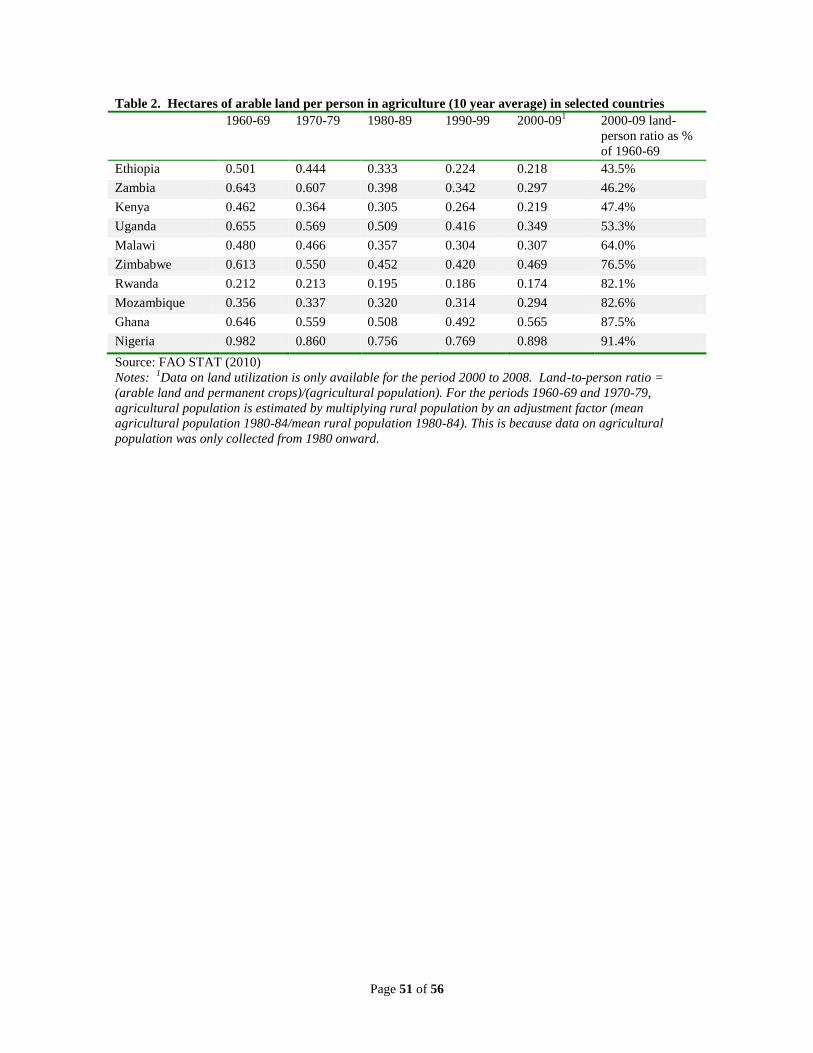
In fact, most of Sub-Saharan Africa has witnessed a gradual but steady decline in mean
farm size over the past 50 years as rural population growth has outstripped the growth in
arable land. Table 2 shows the changes in the ratio of land cultivated to agricultural
population over the past 5 decades for a number of African countries. About half of the
countries in Table 2 show a substantial decline in land-to-labor ratios in agriculture. In
Kenya’s case, for example, cultivated land per person in agriculture has declined from
0.462 hectares in the 1960s to 0.219 hectares in the 2000-08 period. A consistent story
Page 11
Page 11 of 56
emerges from farm survey data; most but not all countries show a gradual decline in
median and mean farm size over time. More comprehensive evidence of mounting
population pressures and land constraints in smallholder agriculture and why they
sometimes exist in environments of apparent land abundance are reserved for the following
section.
The following basic model allows us to synthesize the challenges for farming areas facing
rising land pressures in a structured way. Labor productivity in agriculture (Y/L) is
defined as the product of two terms: net farm income per unit of land (Y/A) and the ratio
of land to labor (A/L).
We focus on labor productivity in agriculture because it is normally considered to be the
closest reflection of returns to labor in agriculture. Y is defined as net farm income (gross
value of output minus all input costs such as seed, fertilizer, hired labor, etc., except own
family labor). In most of the countries shown in Table 2, A/L appears to be declining over
time, as rural population grows at a faster rate than arable land.14
This implies that in order
for labor productivity to rise over time, the net value of output, Y/A (net value of output per
unit land) must rise faster than the ratio A/L declines.
Raising the growth rate of Y/A puts a major burden on technology and changes in farmer
management practices to outpace the decline in A/L, which may be especially challenging
in the decades to come due to likely changes in weather patterns (Schlenker and Lobell
(2010). To reduce the dependence on technology to save the day, some extensification of
land might be needed (i.e., A may need to rise over time to sustain labor productivity
growth in agriculture. Hence, important questions arise over the feasibility of area
expansion, A, and whether and how arable land can be conserved for current and future
generations of rural African farmers as part of a long-term and broad-based structural
transformation development strategy. These questions relate front and center to current
policy issues about how best to utilize Africa’s available arable lands.
14
See Appendix 1 for data on rural population growth rates in SSA countries.
Page 12
Page 12 of 56
4. Evidence of Land Constraints in SSA
Distribution of arable land by rural population
There is a widespread view that sub-Saharan Africa is a land abundant region with low
rural population density. Tables 3a and 3b present the distribution of rural population
density in 10 countries according to the Global Rural-Urban Mapping Project (GRUMP)
and AfriPop spatial databases described in the data section. Use of this data allows for
much greater localized variation in rural population densities than has been typically
reported previously using more aggregated spatial units.
Both data sources indicate great variation in rural population densities. While the bottom
50% of the rural population in all countries live in relatively sparsely populated areas,
conforming to conventional perceptions, a sizeable proportion of the rural population are in
heavily populated areas exceeding 500 persons per km2. According to the GRUMP data in
Table 3a, over 25% of the rural population lives in areas exceeding 500 persons per km2 in
4 of the 10 countries examined in this study. According to AfriPop (Table 3b), at least
25% of the rural population lives in areas exceeding 500 persons per km2 in 5 of these 10
countries. Because rural population growth is rising faster than land under cultivation in
most countries, these proportions are most likely rising over time. Recall that according to
a joint FAO/IFDC report, the maximum carrying capacity of the land for intensive
cultivation in most areas is 500 persons per km2 (Henao and Baanante 1999); while this
threshold cannot be considered to be precise for all areas, e.g., those with multiple
cropping seasons and/or irrigation potential, it does give an first-order approximation of
land supporting capacity for the dryland farming conditions on which the vast majority of
Africa’s rural population is located. 15
A visual representation of the dispersion in rural population density on arable land is
shown for Kenya in Figure 1. Roughly 40 percent of Kenya’s rural population resides on
five percent of its arable land. On the other end of the continuum, three percent of the
population controls 20 percent of the nation’s arable land. An alternative visual
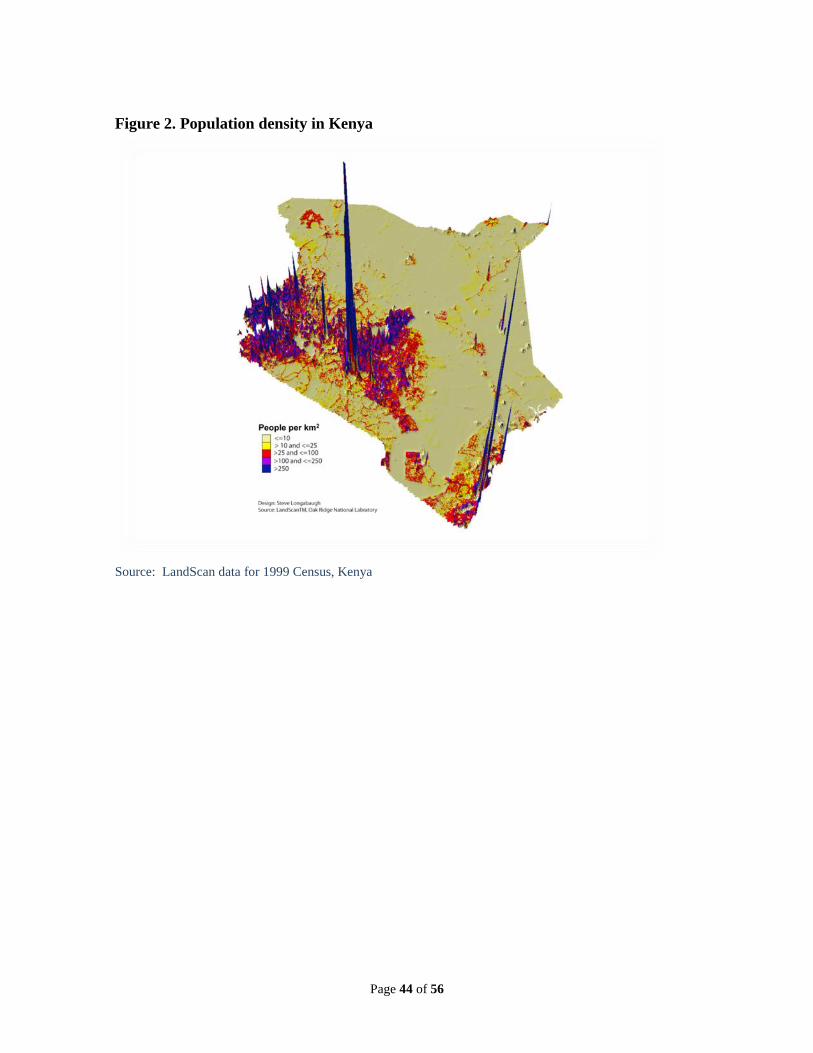
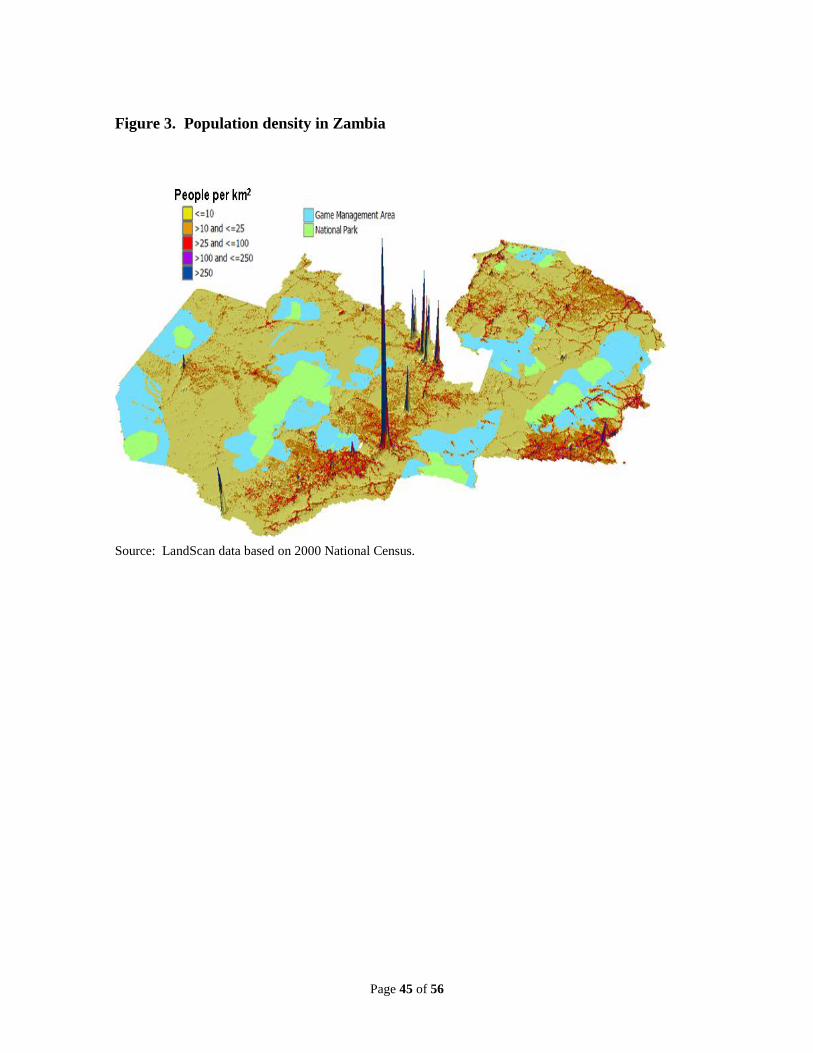
impression of the dispersion of population density is shown in Figures 2 and 3 for Kenya
and Zambia, respectively. Reasons for the large variations in rural population densities
are examined later in this section.
15
Binswanger and Pingali (1988) show that after accounting for soil and climate conditions as well as
potential technological options, it is possible to compute standardized agroclimatic population densities for
various countries measuring the number of people per million kilocalories of production potential. They
report that when countries are ranked conventionally by population per square kilometer of agricultural land,
Bangladesh comes first, India comes seventh, Kenya falls somewhere in the middle, and Niger is near the
bottom. When ranked by agro-climatic population density, the rankings change dramatically: Niger and
Kenya are more densely populated than Bangladesh is today, and India ranks only twenty-ninth on the list.
Page 13
Page 13 of 56
Moreover, the effects of increasing crowded rural areas are not confined to those living in
such areas. At least some part of rapid urbanization and its associated problems of the
spread of slums, health and sanitation problems, and congestion are due to inadequate
living standards in rural areas giving rise to migration. Jayne and Muyanga (forthcoming)
show that the net outflow of adult labor is four times higher from the top 20% of villages
ranked by population density than from the bottom 20% of villages. Therefore, the
question of appropriate development strategies for densely populated rural areas would
appear to be increasingly relevant to a significant portion of Africa’s population.
Trends in farm size and land concentration in customary lands16
Despite widespread acceptance that “pro-poor” agricultural growth is strongly associated
with equitable asset distribution, surprisingly little attention has been devoted to
quantifying land distribution patterns within Africa’s small-scale farming sector.17
To
examine the degree of concentration of land within African farming sectors, Table 4
presents basic information on farm size and distribution within the smallholder farm sector
in six countries for which nationwide survey data was available. As shown in column b,
mean farm size in the small farm sector range from 2.76 hectares in Zambia to 0.71
hectares in Rwanda in 2000. The three Rwanda surveys indicate that mean household land
access has declined significantly over the past 15 years.18
On a per capita basis, farm sizes range from 0.56 hectares per person in Zambia to 0.16
hectares per person in Rwanda in 2000 (Table 4, column c). Mean farm size figures mask
great variations in land access within the smallholder sector. After ranking all smallholders
by household per capita farm size, and dividing them into four equal quartiles, households
in the highest per capita farm size quartile controlled between eight to 20 times more land
than households in the lowest quartile. In Kenya, mean landholding size for the top and
bottom land quartiles were 1.10 and 0.08 hectares per capita, respectively. These figures
already include rented land, which is marginal for most countries examined. We also find
across all a tendency for the poorest households to control the least amount of land, and to
have relatively high labor-to-land ratios within their households. In this respect, Africa’s
rural poor are similar to those in much of Asia as reported by Sen (1990).
In each country, the bottom 25 percent of small-scale farm households are approaching
landlessness, controlling less than 0.12 hectares per capita. In Ethiopia and Rwanda, the
bottom land quartile controlled less than 0.03 hectares per capita. It is important to stress
16
Much of the material in this section draws from Jayne et al., 2003. 17
Some notable exceptions include Haggblade and Hazell, 1988, and Holden, Otsuka, and Place 2009. 18
Andre and Platteau (1998) present an in-depth case study which shows acute competition over land
and suggest a connection between land disputes and the civil war in 1994.
Page 14
Page 14 of 56
that these surveys contain only households engaged in agricultural production; households
not engaged in farming are not in the sample.
Nevertheless, it is possible that the bottom land quartile may contain mostly “Sunday
farmers” who are engaged primarily in off-farm activities for their livelihoods. To examine
this possibility, we compute income shares from crop production, animal and animal-
derived production, and off-farm income for each land quartile. As expected, off-farm
income shares are highest for the bottom land quartile and decline as landholding size
rises. However, in none of the five countries do households in the bottom land quartile
earn more than 50% of their total income, on average, from off-farm activities, despite
having very small farms. In Zambia, Rwanda, Mozambique and Ethiopia, the off-farm
income shares for households in the bottom land quartile were 38.5%, 34.5%, 15.9% and
12.7%, respectively. By contrast, this figure was 50% in Kenya, which can be attributed to
that country’s relatively developed and diversified economy, and which affords land-
constrained rural households greater opportunity to earn a livelihood through the labor
market.
Survey evidence also indicates declining landholding sizes over time. A nationally
representative survey of Kenya’s small-scale farm sector in 1977 carried out by the Central
Bureau of Statistics reports mean farm size ranging across provinces from 2.10 to 3.48
hectares (Greer and Thorbecke, 1986). By contrast, mean farm size in Egerton University’s
nationwide surveys from 1997 to 2010 show mean farm size to be 1.97 hectares per farm;
these longitudinal surveys show a decline in farm size even within that 13-year period.
Using survey data from Kenya, Jayne and Muyanga (forthcoming) examined how
population density is related to the amount of land inherited from the previous generation.
Respondents in a nationwide survey in 2007 were asked how much land was owned by the
father of the household head. The previous generation had considerably larger farms (3
times larger) than those of the current survey respondents themselves. Then, after ranking
respondents’ answers according to the population density of the village, the mean size of
parents’ farms was found to vary from 7.80 hectares in the low-density quintile of villages
to 4.41 hectares in the high-density quintile. Survey respondents were also asked about the
amount of land inherited by the household head from his father. This ranged from 1.49
hectares in villages in the low-density quintile to 0.89 hectares in the high-density quintile,
where the mean amount of land inherited by survey respondents was roughly one-fifth of
the total landholding size of the father. An important policy question might be how the
current generation of adults in the high population density areas with 1.30 hectares of land
or less are going to subdivide their land among their children when they reach their old age
(the average age of household heads was 48 years in 2010) and whether farming can
provide a viable livelihood for those remaining on the land. These findings are consistent
with Yamano et al (2009) who found that roughly a quarter of young men and women in
rural Kenya start their families without inheriting any land from their parents, forcing them
Page 15
Page 15 of 56
to either commit themselves to off-farm employment or buy land from an increasingly
active land sales market. We speculate that, because farm sizes in the high density areas
are already quite tiny and cannot be meaningfully subdivided much further, an increasingly
smaller fraction of people born on farms in Kenya will be able to remain there. This may
point to even higher rates of rural-to-urban migration in the future, or at least from
agriculture to non-agriculture.
In all countries, the various Gini coefficients displayed in Table 4 column (d) also indicate
a high degree of dispersion in farm size. The Ginis are comparable to those estimated for
much of Asia during the 1960s and 1970s (Haggblade and Hazell, 1988). Given relatively
homogeneous production technology, if land is allocated according to household size or
labor availability, we should find more equal land distribution in household per capita or
per adult land holdings than per household land holdings. This would imply that the Gini
coefficients of land holding by per capita and per adult measures should be smaller than
those of landholding per household. This is not the case in any of the five countries
examined. The Gini coefficients of per capita and per adult land holdings are virtually
unchanged in Kenya, Ethiopia, and Rwanda, and are even higher in Mozambique and
Zambia when family size is accounted for in the estimates of land distribution inequality.
What is the evidence on trends in landholding inequality over time within the small-farm
sectors? This is difficult to assess because of inevitable differences in sample design and
variable definitions across surveys; results must therefore be interpreted cautiously.
However, Haggblade and Hazell’s (1988) survey of available landholding Gini estimates
for Africa, Asia, and Latin America during the 1960s and 1970s provides some grounds for
comparison. They report that the basic sampling unit is landholdings, not households, and
thus landless households are excluded from these calculations. At least in this way, their
estimates are consistent with the data reported in this study. Their sample includes three of
the same country/farm sector combinations as in this study: Ethiopia, from 1976/77 survey
data; Kenya’s small-scale farming sector, from 1960; and Mozambique’s smallholder
sector from 1970.
On the basis of these comparisons, it appears that landholding concentration within the
small-scale farm sector has increased slightly to moderately over the past 20 to 30 years.
The Gini coefficients for landholdings per farm increased from 0.50 to 0.55 between 1960
and 1997 in Kenya; from 0.41 to 0.45 between 1970 and 1997 in Mozambique; and from
0.44 to 0.55 between 1976/77 and 1995/96 in Ethiopia. Ethiopia’s case in particularly
intriguing because it had undergone a radical land reform program during the 1970s there,
yet land concentration appears to have increased.
Probably the most robust case for changes in land concentration is in Rwanda, where
relatively consistent survey methods were used by the Ministry of Agriculture across three
surveys for 1984, 1990, and 2000. Changes in the distribution of land access in Rwanda
Page 16
Page 16 of 56
are shown in Table 4. Civil disruption undoubtedly has had a critical effect on land
distribution over this period. We find that mean household land access (use rights plus
rented land) has declined by 43% over this 16-year period, from 0.28 to 0.16 hectares per
capita. In absolute terms, the decline in farm size has been borne mostly by the relatively
large farms. Mean land access for households in the highest land quartile declined from
0.62 to 0.43 hectares per capita, while it declined from 0.07 to 0.02 hectares per capita for
the bottom land quartile. In relative terms, however, the dispersion in land access across
the distribution has widened. There was a nine-fold difference in mean land access per
capita between the top and bottom land quartiles in 1984, but this has worsened to a 21-
fold difference in 2000. While Gini coefficients from 1984 are not available, the Gini
coefficients of household access to land between 1990 and 2000 increased from 0.43 to
0.52. These results, though tentative, indicate that land concentration may be worsening
over time in many of the region’s small-scale farming sectors.
Relationship between farm size and household income
The importance of these findings for rural growth and poverty alleviation strategies
depends in part on the degree to which land allocation patterns influence household income
and poverty. If non-farm activities are able to compensate for small landholdings and
provide land-poor households with adequate alternative income sources, then disparities in
land ownership should not necessarily be a policy problem. To examine these issues, we
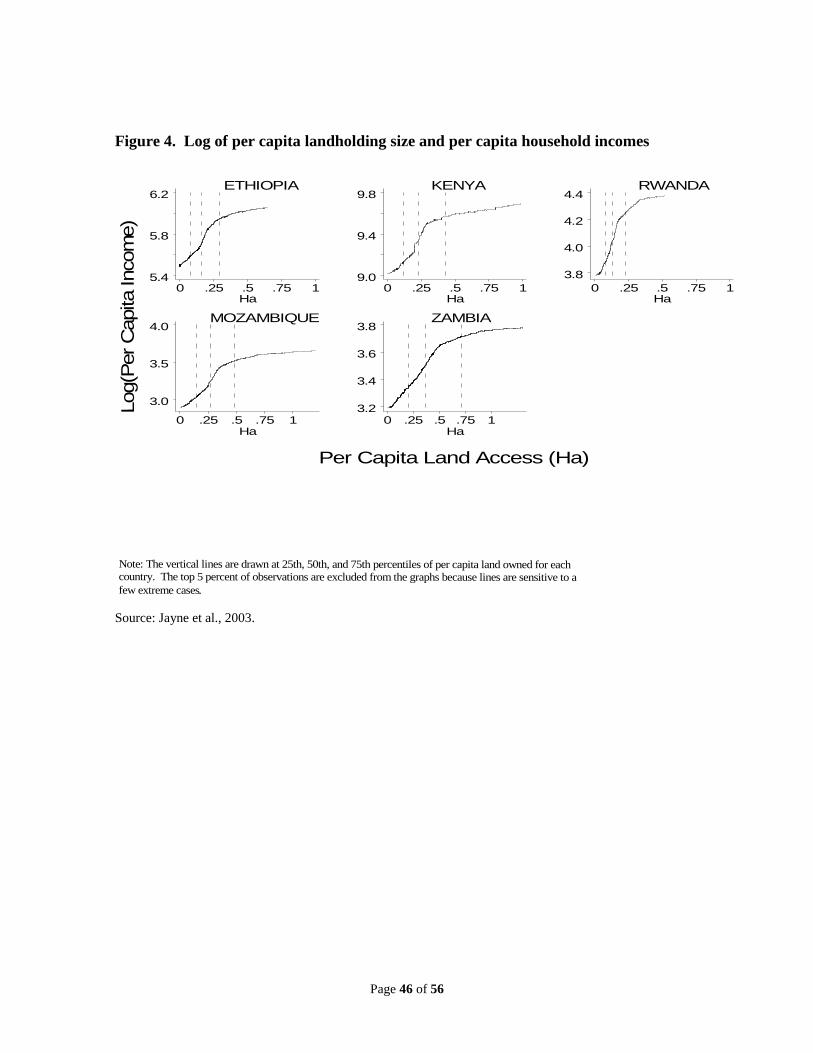
present bivariate graphs relating household per capita landholding size to household per
capita income, including non-farm income and crop income from rented land (Figure 4).
The three dashed vertical lines show the 25th
, 50th
, and 75th
percentiles of sampled
households along the x-axis. For example, 25% of the sample households in Kenya have
between zero and approximately 0.10 hectares per capita, while the top quartile owns on
average 1.1 hectares per capita.
In each country, we find a positive association between household per capita land holdings
and per capita income (the sum of crop, livestock, and off-farm income). The association
between household income and land is especially steep among households whose land size
is below the median level in each country (the middle dotted line in each country graph in
Figure 4). Because the vertical axis showing per capita income is in log form, we can read
differences in numbers as percent changes. For instance, the line for Kenya starts at the
log of per capita income at 9.2 and has a kink at 9.6. The difference between these two
points is 0.4, which indicates a 40 percent increase in per capita income when household
per capita land size increases from zero to 0.25 hectares. The same increase in land
holdings (from zero to 0.25 hectares) increases per capita income by more than 40 percent
in Rwanda, just less than 40 percent in Mozambique, and about 30 percent in Ethiopia. In
all four countries, the association between land and income becomes weaker somewhere
within the third land size quartile, and nearly disappears in the fourth quartile.
Page 17
Page 17 of 56
What do such land-income relationships mean for feasible smallholder-led development
pathways? Improving access to land among the most land-constrained smallholder
households would be a seemingly effective way to reduce poverty. For small farms, a very
small incremental addition to land access is associated with a large relative rise in income.
The structural transformation processes in Asia, as documented by Johnston and Kilby
(1975) and Mellor (1976), show that a smallholder-led agricultural strategy was necessary
to rapidly reduce rural poverty and induce demographic changes associated with structural
transformation. An inclusive smallholder-led strategy is likely to provide the greatest
potential to achieve agricultural growth with broad-based reductions in rural poverty in
most of sub-Saharan Africa as well. However, it is not at all clear how such a smallholder-
led agricultural strategy must be adapted to address the limitations of very small and
declining farm sizes in densely populated areas that are dependent on rain-fed production
systems with only one growing season per year.
Of course, nothing presented so far necessarily confirms that inadequate access to land is a
binding constraint on smallholder agriculture in Africa. It might be possible that rural
households could acquire more land if they chose to. And perhaps factors of production
other than land are the more binding constraint on agricultural intensification.
Is land expansion possible for smallholder farmers?
Zambia provides an interesting case study for exploring rural households’ perception about
the availability of unallocated land for future expansion of agricultural production. Zambia
has one of the lowest national population densities in sub-Saharan Africa and it is widely
believed that there is major potential for area expansion.
One of the questions asked of households in the nationally representative 2001 Post
Harvest Supplemental Survey (CSO 2001) was “Is there unallocated arable land that is
available to households in your village?” Nationwide, 44.1% of households felt that there
was unallocated arable land that was available in their village area. Table 5 presents
respondents’ answers to this question by province. Also included in the table is the
amount of unutilized arable land in each province according to Central Statistical Office
estimates in 2004.
The responses in Table 5 initially suggest that many households in Zambia perceive that
there is unallocated land available in their villages. This view is particularly strong in the
sparsely populated areas of Northwestern and Northern provinces, which incidentally also
have the biggest portions of arable and available land, and to a lesser extent in Central
Province. Central province is third in terms of available arable land. However, in the
major agricultural provinces of Eastern and Southern provinces, less that 40% of
respondents reported that unallocated arable land was still available in their areas. These
Page 18
Page 18 of 56
two provinces have, other than Western province, the lowest amount of unutilized arable
land.
One might expect that the “no” responses would be concentrated in the most densely
populated provinces, and the yes responses would be concentrated in sparsely populated
areas. This is not uniformly the case in Zambia. For instance Western Province has the
second lowest population density in Zambia but it contained the greatest proportion of
respondents indicating that no additional land was available. This is most likely because
many parts of Western Province are unsuitable or only marginal suitable to crop
cultivation, hence population density underestimates the degree to which population is
concentrated in a few productive areas.
Because 94% of Zambia’s land is in the customary tenure system, it is often implied that
there should be great scope for area expansion by African farmers. Metcalfe (2005) and
others, however, feel that this conclusion should be heavily qualified:
"Although it is sometimes stated that 94% of Zambia falls under customary tenure
from that proportion must be deducted the 8% of the country designated as national
parks and further 8% designated as forest reserves. From the remaining 76% must be
deducted 2% for urban areas and 12% as unspecified areas (e.g., state farms, property,
military, research stations, etc.). Finally, from the remaining 64% the Game
Management Areas (GMAs) that make up 23% of Zambia’s land area must be
considered" (p. 7).
These figures put into context the generally held notion that 80% of arable land in Zambia
remains uncultivated, and that 94% of its land is under customary tenure, implying that it is
available for smallholder agricultural development. According to Chizyuka et al. (2006),
land falling under customary administration is 62% of the country territory or 46,500
square kilometers, but this includes mountainous areas, marshes and swamps, areas that are
permanently flooded, infested with tsetse flies, and/or too arid to be suitable for intensive
crop production. These authors conclude that, in reality, a much smaller amount of viable
arable land is available for future generations of Zambian smallholders than is often
thought.
A paradox of land pressures amid land abundance?
Several conclusions emerge from the evidence presented so far. First, while many parts of
SSA are very sparsely populated, often leading to relatively low population densities when
computed over all rural area, a growing proportion of its population reside in fairly densely
populated areas of 500 persons per km2 or greater. This may resolve the apparent paradox
of land constraints amid the appearance of land abundance and massively under-utilized
land.
Page 19
Page 19 of 56
However, the major disparities in the population densities of 1km grid cells within each
country examined raises questions about how such extreme differences have arisen and
why hasn’t migration tended to equilibrate these differences over time? Why is much of
Africa’s rural population concentrated tightly in particular areas while vast areas
potentially suitable for agriculture remain largely unutilized? This question requires more
intensive investigation but for now, we forward three major factors explaining the
observed great variation in rural population densities:
1. Natural clustering of population to the most hospitable and fertile areas. These
areas include the highlands of eastern and southern Africa, the humid tropics of
West Africa, and coastal areas near natural ports and river confluences. After
accounting for the biophysical potential of land (an exercise being undertaken
currently), we anticipate that the variation in rural population density will decline
compared to those shown in Tables 3a and 3b.
2. Pattern of prior public investment. Potentially arable land can remain underutilized
because it has yet to receive the requisite public investment in physical
infrastructure (e.g., roads, electrification, irrigation), water, schools, health facilities
and other services required to raise the economic value of land and thereby attract
migration and settlement in these areas (Govereh 1999). Several governments have
shown a willingness to devote state resources to develop land for large-scale
commercial investment but much less so for smallholder-led agricultural
development.
3. Colonial segregation of Africans into reserves. A major factor in countries with a
colonial settler history such as Kenya, Malawi, Zimbabwe, and Zambia, has been
the historical and post-independence continuation of colonial tenure systems
separating “customary lands” from “state lands” (Deininger and Binswanger 1995;
Woodhouse 2003). Many areas under customary tenure are facing emerging land
constraints borne of steady rural population growth since independence. By
contrast, much of Africa’s unutilized arable land is under state authority, which is
not readily accessible for settlement by smallholder populations under prevailing
land allocation institutions. Post-independence governments have often allocated
land to non-farming elites in exchange for political support, contributing to land
underutilization while nearby farming areas exhibit signs of land pressures and
degradation (Kanyinga, 1998; Mbaria 2001; Stambuli 2002; Namwaya 2004). It is
perhaps not surprising then that median farm sizes are quite small and declining for
the vast majority of the farming population, as indicated in Table 4, while large
tracts of land in other parts of the country remain unutilized. This dual land-tenure
structure has impeded natural migration from processes 1 and 2.
Many of the “state vs. traditional chiefs” conflicts that have featured prominently in post-
independence Africa (Herbst, 2000) have centered on attempts by the state to wrest control
Page 20
Page 20 of 56
of customary lands. Politicians’ arguments for converting customary land to state land
normally focus on the need to allocate land to commercial entrepreneurs and capitalized
“emergent” farmers with the ability to use it productively, although as shown earlier there
is very little evidence to suggest that large-scale farms are more efficient than small-scale
farms. In areas where traditional authorities have succeeded in retaining control over
customary land, there are still numerous reports of land being allocated to local elites
having no legitimate claim to land in that area under traditional norms (Deininger and
Byerlee).19
Regardless of whether land is retained under customary or state control, several scholars
argue that African farmland is facing an “enclosure” process in the absence of efforts to
reverse it (Woodhouse 2003; Stambuli 2002). Woodhouse argues that much of Africa is
facing increased commodification and individualization of land driven by population
growth and increased pressure on remaining arable land regardless of land tenure regime.
This process appears to be intensified by the post-independence continuation of converting
unutilized customary land into titled property or state land for future allocation. While one
might be tempted to regard this as evidence of emerging land markets in Africa, in most
cases the processes of allocation are opaque; little public information about land
transaction prices have emerged in any country that could serve as a basis for price
discovery more broadly. Meanwhile, many customary (i.e., smallholder) farming areas are
facing intensifying land constraints borne of steady rural population growth since
independence, which is only made more acute by transfers of land from customary to state
land. An important literature in Kenya has documented the rapacious disempowerment of
local communities from their traditional lands, first by the colonialists and later by the
successive post-colonial governments (Juma, 1996; Kanyinga, 1998; Okoth-Ogendo,
1976). Post-independence Kenyan governments have largely retained the same institutions
despite recognizing the importance of land rights and even elevating it to a crucial post-
independence challenge (Republic of Kenya, 1965). While the modes of land access were
primarily through inheritance and the market, access to state land (and land converted from
customary to state land) has been a major instrument of patronage favoring the political
elite.20
For these reasons, it is perhaps not surprising that median farm sizes are quite
small and declining for a large proportion of the smallholder population, while large tracts
of land in other parts of the country continue to be allocated by the state to local elites and
foreign investors.
19
For example, in a recent study of “emergent” farmers (10-100 hectares) in Zambia, Sitko, Nkonde, and
Jayne (2012) found that most of the 186 farmers interviewed purchased or obtained a 99-year lease from
local authorities in customary lands. Of these, the majority entered into farming later in life after earning
enough money from urban employment to purchase land. These farmers are cultivating an average of 27% of
the land obtained, while over 90% of the surrounding small-scale farmers in the area own less than 5
hectares. 20
Namwaya (2004) reports that over 600,000 hectares of land, or roughly one-sixth of Kenya’s total land
area, are held by the families of the country’s three former presidents, and that most of this land is in
relatively high-potential areas.
Page 21
Page 21 of 56
5. When Do Agricultural Growth and Poverty Reduction Converge and
When Do They Diverge?
Returning now to several debates discussed in Section 3, some scholars and a growing
number of African governments believe that greater support for investment in large-scale
agriculture may be the best use of public funds for poverty reduction. Other analysts have
argued that overcoming Africa’s food security and poverty problems is primarily a
challenge of improving the uptake of productivity-enhancing green revolution
technologies. Consider, for example, Roger Thurow’s (2010) conclusion:
“Thus, more and more eyes are turning to Africa, agriculture's final frontier.
Africa was largely left out of the green revolution, the postwar movement to
push up crop yields in the hungriest parts of the world by promoting the use of
new seeds and new farming technology. And so agricultural production on the
continent could jump quickly if farmers there simply used existing seed,
fertilizer, and irrigation technology. And if more efficient networks were
developed to distribute and sell the harvests, boosting agricultural yields in
Africa could be a major step toward feeding not just the continent but also the
rest of the world.”
This section explains why the uptake of improved technology may indeed boost
agricultural yields and yet do very little to address rural poverty that is associated with
pervasive constraints on access to land and other productive assets. The recent experiences
of Zambia and Malawi illustrate how agricultural growth that is not broad-based may have
very little effect on rural poverty. Both countries have succeeded in doubling maize
production between the early and late 2000s. In both countries, the marked increase in
maize production coincides with the scaling-up of government input subsidy programs.
The national use of fertilizer and hybrid maize seed in both countries has roughly doubled
between 2004 and 2010 and yield growth in both countries has been the primary source of
the production booms (see Mason et al 2011, and Ricker-Gilbert, Jayne and Chirwa 2011
for details). In Zambia’s case, farmers have benefited from the purchase of maize at
above-market prices (roughly $275 per ton) through the Food Reserve Agency (FRA).
Together the input subsidy and maize price support programmes in Zambia accounted for
over 60 percent of the Ministry of Agriculture’s public budget over the past five years and
over 2% of the country’s GDP in 2010. These two programs also accounted for 90–96
percent of the total budget allocated to the ministry’s Poverty Reduction Programmes
(PRPs) during the 2006–2011 budget years. In Malawi, the input subsidy program alone
has exceeded 10% of the national budget in at least 2 of the past 5 years.
Page 22
Page 22 of 56
In spite of the impressive growth in grain yields and production, rural poverty in both
countries has declined very little over this time span. In Zambia, the rural poverty rate was
77.3 percent in 2004, 76.8 percent in 2006; while official poverty rate estimates for 2010
have not yet been released, preliminary estimates suggest that the rural poverty rate
remains in the range of 74–78 percent. So, why is it that maize production has increased
so impressively without making a serious dent in rural poverty?
Table 6 show data from the nationally representative 2011 Crop Forecast Survey to show
how maize production has varied according to farm size. Column A of Table 1 shows the
number of farmers in five farm size categories. Overall Zambia has an estimated 1,471,221
small- and medium-scale farmers (‘smallholder’ farmers), defined as farmers cultivating
between 0.1 and 20 hectares. Approximately 42 percent of them are cultivating less than
one hectare of land; 33.3 percent of the smallholder farms are cultivating 1–2 hectares; 2.9
percent are cultivating 5–10 hectares, and 0.5 percent are cultivating over 10 hectares
(column B). Farmers cultivating less than 2 hectares accounted for 75 percent of the total
number of farmers in Zambia’s smallholder farm sector.
Column C shows the estimated total maize production within each of the farm size
categories over a ‘baseline’ period (the three years covering the 2005/06 to 2007/08 crop
seasons). Column D shows the estimated maize production for these five farm size
categories in the 2010/11 crop season. Overall, maize production increased from an
average of 1,383,735 tonnes in the baseline period to 2,786,896 tonnes in the 2010/11
season.
Column E shows the change in maize production over this period for each farm size
category. Farmers cultivating less than one hectare contributed an additional 96,989 tonnes
to national maize production in 2010/11 compared to their average maize production
during the 3-year period 2005/06-2007/08. By dividing the additional maize production in
column E by the number of farms in each category as shown in Column A, we derive the
additional maize production per farm for each of the farm size categories, as shown in
Column F. When expressed on a per farm basis, it is apparent that farmers cultivating less
than one hectare produced 157.2 additional kilograms of maize per farm in 2011. Farmers
cultivating 1–2 hectares contributed 326,145 additional tonnes of maize in 2010/11, which
amounts to 666 kilograms of additional maize per farm. Farmers cultivating 2–5 hectares
contributed an additional 640,425 tonnes to national maize production in 2010/11, or 2.03
additional tonnes per household. The 2.9 percent of the farmers cultivating 5–10 hectares
contributed an additional 297,871 tonnes to national maize production in 2010/11, which
amounted to 7.04 tonnes of additional maize production per farm. And lastly, the 0.5
percent of farmers cultivating 10–20 hectares increased their maize production in 2010/11
by 6.3 tonnes per household in compared to the earlier baseline period.
Page 23
Page 23 of 56
The data in Table 6 show that very little of the increase in national maize production in
2010/11 came from the bottom category of farmers (less than one hectare cultivated) even
though they account for over 40 percent of the smallholder farms in Zambia and are among
the poorest of the rural poor. Given that their maize output increased by an average of just
three 50-kg bags per household between 2005/06-2007/08 and 2010/11, the national maize
bumper harvest is unlikely to have resulted in significant reductions in hunger and poverty
among this group of farmers. The main increase in national maize production (column E)
came from farmers in the 1–2, 2–5 and 5–10 hectare cultivated area categories. When
expressed in per farm terms, however, the major increases in maize production were
enjoyed by farmers cultivating over 5 hectares—farm households which constitute only 3.4
percent of all the smallholder farms in Zambia. Table 6 clearly shows that the increase in
maize production per farm is strongly related to farm size. However, the relatively small
increases in average maize production among the smallest farms is likely to have improved
their food security status substantially as a result of their harvesting even a few more 50-kg
bags of maize in 2010/11 than in the earlier period.
Table 7 uses the same Crop Forecast Survey data to examine the amount of subsidised
FISP fertiliser received during the 2010/11 crop season by farmers within the same five
categories. The number and percentage of farms in each category in 2010/11 are shown in
columns A and B, respectively. The percentage of farms receiving FISP fertiliser in each
category is presented in column C. Slightly over 14 percent of the farmers cultivating less
than one hectare received FISP fertiliser in the 2010/11 crop season. The average quantity
of fertilizer they received was 168 kg. Therefore, across all 596,334 households in the
category, the average household received 24.1 kg of FISP fertiliser (column D). By
contrast, over 50 percent of farmers in the 10–20 hectare cultivated category received FISP
fertiliser in 2010/11, receiving 657 kg per farm. Therefore, the average amount of FISP
fertiliser received by farmers in the 10–20 hectare category was 346 kg, about 14 times
more per farm than those in the less than one hectare category.
Column E shows the percentage of households selling maize. This ranges from 22.2
percent among the smallest farm size category to 86.8 percent among the largest. In terms
of quantities of maize expected to be sold, column F shows that, on average, about 135 kg
of maize will be sold for every farm in the less-than-one hectare category, compared to 1.7
tonnes per household in the 2–5 hectare category, and over 15.1 tonnes per household in
the 10–20 hectare category. Clearly, the benefits of the FRA maize support prices are
disproportionately enjoyed by the relatively large farmers over 5 hectares, even though
they constitute only 3.8 percent of the smallholder farm population.
The smallest farmers in Zambia—those cultivating less than 2 hectares who account for
over 70 percent of all the smallholder farms in the country —participated only marginally
in the maize production expansion of 2010/11. These farmers received relatively little FISP
Page 24
Page 24 of 56
fertiliser and sold very little maize, hence they were unable to benefit from the FRA
producer price of 65,000 kwacha per bag. The farmers benefiting the most from the
government’s expenditures on supporting maize prices were clearly those selling the most
maize. In contrast, about 30 percent of the relatively poor smallholder households actually
had to purchase more maize and maize meal than they produced to meet their families’
food needs and hence were adversely affected by a support price policy that raised maize
prices in the countryside. This disaggregated picture of Zambia’s maize production
expansion may reveal why rural poverty rates remain so high despite the record maize
harvests in the past several years. Similar conclusions emerge from Malawi (Ricker-
Gilbert, Jayne and Chirwa 2011).
The composition of the Zambian government’s public spending on agriculture reveals that
the lion’s share of its budget was devoted to maize price supports and input subsidies,
which were captured primarily by larger farmers (Figure 5). The types of scale-neutral
public investments that can promote productivity even on one-hectare farms, e.g.,
improved seed and agronomic research, farmer education and extension, physical
infrastructure, etc., receive about 20% of the public budget to agriculture across all
ministries.
This disaggregated picture of the distributional effects of growth – at least how it was
achieved in Zambia and Malawi – demonstrate the limitations of current approaches for
achieving green revolutions in Africa. Conventional approaches such as those focusing
largely on farm price supports and input subsidy programs may increase aggregate farm
output but have tended to produce concentrated benefits that are correlated with farm size
and asset wealth (Jayne, Mather, Mghenyi 2010), and therefore have done very little to
reduce rural poverty rates. The Zambia and Malawi experiences stress the need not only to
promote the use of improved technology but to do so in a way that somehow reaches –
directly or indirectly – farms in the bottom half of the asset distribution. Taking action to
expand access to land for smallholder farm production, as a complement to input
promotion and farm productivity programs, may be fundamental to effective national
agricultural development and poverty reduction policies.
Hertel (2011) concludes that there is substantial scope for endogenous intensification of
production in response to higher product prices, particularly in Africa, where fertilizer
application rates are low. Higher farm prices may indeed provide incentives for profitable
intensification to close the high yield gaps observed in the region (Fisher, Byerlee and
Edmeades 2009). The findings reported here for Zambia confirm previous evidence that
the African farming sector can quickly and robustly respond to higher food prices, but that
the response is likely to be concentrated among the largest farmers with the largest farms
and the greatest potential to respond to price incentives. Moreover, there are likely to be
Page 25
Page 25 of 56
severe food insecurity problems if farm intensification in Africa is driven by higher food
prices, because of the large proportion of resource poor farmers who have insufficient
access to land and other assets to produce a surplus through either intensification or
extensification, and are likely to remain net buyers of food (Jayne, Mather, Mghenyi
2010). Policy strategies to effectively broaden the base of farms that can respond to future
price signals and agricultural growth opportunities may increasingly require explicit
consideration of egalitarian approaches to expand and broaden access to unutilized arable
land in the region.
This raises questions, therefore, about the potential impact of promoting large-scale
investment in farmland in response to heightened global demand for food. Can the
promotion of large farms complement a small farm-led development approach, or at least
co-exist with it, without choking off the prospects for the latter? The recent World Bank
report on land by Deininger and Byerlee (2011) is guardedly optimistic for areas of Africa
that have abundant unutilized land coupled with huge “yield gaps” on existing farmland. In
such cases, they conclude that there may be a positive role for large-scale farm investment
without imposing major dislocation costs on local populations. They stress that due
diligence must be exercised to ensure that investment in farm land by outside interests does
minimal disruption to local interests and conclude that there is good potential for mutually
beneficial outcomes especially in land abundant areas with low population densities.
There are of course general equilibrium effects to be considered in such an approach. If
large-scale farm investment were successful in raising national production by, say, 10%,
how would this affect food prices, wage rates, and the course of future investment in the
agricultural sector? Could large-scale agricultural provide gainful employment for workers,
and possibly even raise agricultural wage rates? Would the pattern of private marketing
investment be shifted to procure supplies from large-volume sellers, and would this
marginalize the small-scale rural peasantry? Most importantly, how would the increased
power of a large-farm sector affect the political economy of public resource allocation?
Page 26
Page 26 of 56
6. Evidence on Impacts of Land Constraints
This section addresses how rising population density is affecting farmer behavior and the
evolutions of farming systems. This is the subject of a five-country study, currently in
progress, under the Guiding Investments in Sustainable Agricultural Markets Project
funded by the Bill and Melinda Gates Foundation. Insights from all five countries should
be available by August 2012. At this stage, only the Kenya results are complete. This
section summarizes the findings of econometric analysis of the impact of increasing
population density on some selected indicators of farm productivity and welfare in Kenya
(Jayne and Muyanga, forthcoming 2012).
Because population density is likely to be endogenous to many aspects of farming system
evolution, first-stage models of population density are estimated using an instrumental
variables approach, followed by the second-stage control function results using correlated
random effects. The major determinants of population density in 2009 were found to be
distances to infrastructural facilities, the population of the location in prior decades, and
amount of arable land in prior decades, village-level rainfall and variability of rainfall, soil
quality, and the agro-ecological potential of the area. For example, if households in
Location A are one kilometer closer to motorable roads, water sources, and healthcare
facilities than households in Location B, the population density in Location A is estimated
to be 0.32, 0.57 and 0.17 percent higher than in Location B. If Location A’s long-run
average annual rainfall is 100mm higher than Location B, the population density of
Location A is estimated to be roughly 11 percent higher than Location B. Increased
rainfall variability is associated with lower population density. As expected, land quality as
represented by the potential kilocalories obtainable from each 10km2 pixel of both
cultivated land increases population density by 7.2 percent.
Next we present the second-stage control function regression results of the impact of
increasing population density on selected agricultural production and household welfare
outcomes. Because of space limitations, we focus on only a few outcome variables of
interest.
Landholding size and cropped area
Landholding sizes and area in hectares cultivated per adult equivalent in the main season
decline with population density. Controlling for all observed variables, an increase in
population density by 100 persons per km2 is associated with 9 percent smaller farm sizes.
A similar increase in population density reduces area cropped per adult equivalent by about
8 percent. These relationships are highly statistically significant. A more complete
Page 27
Page 27 of 56
presentation of these relationships is revealed when we look at the post-estimation
simulations of the relationships between these outcome variables and population density,
holding all other factors constant. Figures 6a and 6b show that landholding size and area
cultivated per adult equivalent varies inversely with population density.
Input use intensity
The cost of purchased inputs per hectare (fertilizers, seeds, hired labor, and land
preparation costs) is used as an indication of land intensification. The intensity of
purchased inputs per hectare is found to be a non-linear concave function of population
density. Input intensity rises with population density to around 650 persons per km2;
beyond this population density threshold, input intensification declines. Further, the
intensity of purchased input use rises as land rental rates rise, and declines with increased
distances to motorable roads, signalling increased input costs. The intensity of purchased
input use also declines as we move from the relatively high-rainfall highlands to the semi-
arid lowlands.
Figures 6(c) and (d) show the simulated relationship between input use intensity on the y-
axis and population density on the x-axis, controlling for all the other variables. Both
fertilizer use and the use of all purchased inputs per hectare is an increasing function of the
population density up to roughly 660 persons per km2, and then declines beyond that.
Slightly less than 20% of the farm households in the sample are currently beyond this
threshold (Figure 4c). As shown in Figure 4d, the general input use intensity starts to
decline somewhere after 475 persons per km2; about 35 percent of the households in the
sample live in villages beyond this population density threshold.
What would explain these threshold effects? Market participation studies consistently
show that farm sales are related to farm size (Barrett 2008). If farm sizes decline beyond a
given point due to sub-division and land fragmentation caused by population pressures,
households are less likely to generate the cash from crop sales that would allow them to
purchase modern productivity-enhancing inputs. Less intensive input use then reinforces
small farms’ difficulties in producing a surplus. Furthermore, access to farm credit also
tends to be restricted for farmers with limited land and other assets that could otherwise act
as collateral. For these reasons, population density threshold effects may be very plausible
and may explain why in Kenya a number of important farm productivity indicators tend to
decline beyond a certain level of population density. This threshold is likely to be depend
on agricultural potential and perhaps market access; further testing of how these variables
may modify the relationship between population density and farm behavior is the subject
of ongoing research.
Page 28
Page 28 of 56
Household farm income
After controlling for other observed factors, net farm income per hectare is found to rise
with population density up to about 680 persons per km2, but fall off slightly thereafter.
Net farm income per adult equivalent, by contrast, shows a more sharp decline at a lower
population density threshold of about 550 persons per km2, following a pattern very similar
to input use intensification. All of these relationships are highly statistically significant.
The post-estimation simulation results are presented in Figures 6(e) and (f). Lower
distances to motorable roads are associated with higher farm incomes. Farm wage rates,
land rental rates, and fertilizer prices are all significantly inversely associated with farm
incomes per adult equivalent; only the first two input prices are significantly associated
with farm incomes per hectare.
These results apply to both crop and animal operations; results are similar when the
dependent variable is net crop income or net animal income. Intensive animal operations
such as zero-grazing dairy is significantly more commonly practiced in the high density
areas, producing higher levels of animal income per land unit. However, this is only
possible up to a certain population density level, beyond which farm sizes become too
small for economical operations. This evidence of a decline in partial land productivity at
high levels of rural population density is alarming, as it implies that land productivity
growth cannot be sustained simply by using other inputs more intensively per unit of land.
Animal income and milk production also show a similar plateau and drop off at 650
persons per km2. As Kenya’s rural population continues to grow,
21 a greater proportion of
the country’s rural areas will soon reach this apparent land productivity plateau. Currently,
most of the districts with mean population density greater than 650 persons per km2 are in
Nyanza and Western Provinces, with most in Central Province approaching this threshold.
In 2009, the 16 districts with greater than 650 persons per km2 accounted for 14.2% of
Kenya’s rural population and 1.3% of its rural land.
Household asset wealth and incomes
Lastly, we discuss the relationships between population density and household asset wealth
and total income per adult equivalent. The results show an unambiguously and statistically
significant negative relationship between household assets and population density. Holding
constant differences in asset wealth due to differences in infrastructural conditions, input
prices, rainfall quantity and variability, soil quality, agro-ecological potential and survey
years, we find that an increase of 100 persons per km2 is associated with a 7 percent
21
Fortunately, Kenya’s rural population growth rate has been declining from its peak at 3.4% in 1984 to
2.3% in 2008 according to the 2009 official census.
Page 29
Page 29 of 56
decline in asset wealth per adult equivalent. This relationship is shown graphically in
Figure 4(g).
By contrast, total household incomes tend to rise with population density up to a now
familiar threshold and thereafter decline. The post estimation simulations show a clearer
picture of these relationships. Total household incomes per adult equivalent rise with
population density up to roughly 550 persons per km2 and decline thereafter, as shown in
Figure 4(h). Higher population density is associated with smaller farm sizes, other factors
constant. Small farm sizes may be associated with diseconomies of scale in input
acquisition. Other factors constant, smaller farm sizes reduce the potential to produce
surpluses, which may in turn cause capital constraints that impede the demand for
purchased inputs and new technologies. These processes may explain why our results
indicate adverse effects of population density, beyond some threshold, on indicators of
farm intensification, farm income per unit of labor, and wealth.
7. Conclusions and Policy Implications
Despite the fact that sub-Saharan Africa in 2012 contains much of the world’s unutilized
and underutilized arable land, a significant and growing share of Africa’s farm households
are living in densely populated areas. These areas are characterized by small and declining
farm sizes for the majority of people living in them. Ironically, inadequate access to land
and inability to exploit available unutilized land are issues that almost never feature in
national development plans or poverty reduction strategies. To our knowledge, there has
been little recognition of the potential challenges associated with increasingly densely
populated and land-constrained areas of rural Africa, despite the fact that a sizeable and
increasing share of its rural population live in such areas.
Nationally representative farm surveys consistently show the following regularities: First,
there are great disparities in landholding size within smallholder farming areas. While the
top 10% of the rural population reside on farms ranging from 5 to 25 hectares, half or more
of Africa’s smallholder farms are below 1.2 hectares in size, and a quarter of the farms are
below 0.5 hectares, with limited or no potential for area expansion (Jayne et al. 2003).
Second, because of this pattern of landholding size distribution, farm production and
marketed surplus are similarly skewed. In most nationally-representative surveys in the
region that we have analyzed, the top 5% of farmers (not counting large-scale commercial
farmers) account for 50% of the marketed grain surplus (Jayne et al. 2010). Third, and in
stark contrast, half or more of rural farm households are unable to produce enough grain to
feed themselves and are either buyers of grain or go hungry because they are too poor to
afford to buy food. Most of the households owning less than one hectare of land fall into
Page 30
Page 30 of 56
this category regardless of their agro-ecological or market access conditions, and their
incomes tend to be below the poverty line. After controlling for agro-ecological
conditions, small farm size is highly correlated with income poverty (Jayne et al. 2003).
Fourth, a high proportion of farmers in densely populated areas perceive that it is not
possible for them to acquire more land through customary land allocation procedures, even
in areas where a significant portion of land appears to be unutilized (Stambuli, 2002;
Yamano et al. 2009; Jayne et al. 2009). Land markets, both formal and informal, appear to
on the rise (Woodhouse 2003; Holden, Otsuka, and Place 2009). In Kenya, roughly a
quarter of young men and women born in rural areas start their families without inheriting
any land from their parents, forcing them to either commit themselves to off-farm
employment or buy land from an increasingly active land sales market (Yamano et al.,
2009). And fifth, survey evidence points to increasing concentration of landholdings over
time as well as declining mean farm size (Jayne et al., 2003).
These concerns lead to policy questions about appropriate and feasible smallholder-led
agricultural strategies in the context of land-constrained farming systems and limited off-
farm employment opportunities to absorb redundant labor in densely populated rural areas.
Associated issues for research revolve around whether many farms are becoming, or have
already become, “too small” to generate meaningful production surpluses and participate in
broad-based inclusive agricultural growth processes given existing on-shelf production
technologies. Evidence presented earlier about population density being inversely related
to soil fertility and farm size might suggest the presence of threshold effects in the
relationship between population density and farm productivity, especially labor
productivity, as the intensification of labor and capital per unit of land may lead to
diminishing returns to labor and capital beyond some point. Other reasons for declining
agricultural productivity beyond some threshold level of rural population density may
include reduced fallows leading to soil fertility depletion, and the tendency to produce little
or no surplus production on very small farms with many residents, leading to difficulties of
purchasing needed cash inputs in the presence of incomplete rural financial markets. All
of these dynamics may be mutually reinforcing in the threshold relationships between
population density, farm sizes, and farm productivity. These relationships are likely to be
strongly conditioned by variables such as agro-ecological and market conditions. Future
research is needed to empirically investigate these conditioning influences.22
22
Evidence that may be in contradiction to these ideas is the experience of Machakos, Kenya (Tiffen et al
1994). They documented that, over the period from 1930 to 1995, rural population increased six-fold but
agricultural productivity increased ten-fold following decades of sustained private investments in land.
Reviewing this experience, Zaal and Oostendorp (2002) conclude that increased rural population density
provided some incentives for Bosrupian intensification, but that exogenous factors such as the coffee price
boom in the 1970s was at least as important.
Page 31
Page 31 of 56
Certainly, most of sub-Saharan Africa’s land area is not characterized by such dilemmas.
Most of the continent is sparsely populated. However, based on two alternative spatial
databases capable of estimating populations at the level of one square kilometer and
distinguishing between arable and non-arable land, a high proportion of rural people
nevertheless live in densely populated areas. This apparent paradox is resolved when the
unit of observation moves from land units to people. In at least four of the 10 countries
analyzed, 25% of the rural population resides in areas exceeding 500 persons per square
kilometer, which, by at least one account (Henao and Baanante 1999), is estimated to be
the maximum supporting capacity for areas of intensive crop cultivation in the region.
The evidence presented here suggests that there tends to be a fallacy in concluding that
most of the people in rural sub-Saharan Africa live in land abundant conditions. This has
created the false perception that the development challenge for the region is how to
productively utilize the continents’ underutilized land resources. In the past several
decades, and especially since the rise of world food prices, there have been concerted
efforts to transfer land out of customary tenure (under the control of traditional authorities)
to the state or to private individuals who, it is argued, can more effectively exploit the
productive potential of the land to meet national food security objectives. Such efforts
have nurtured the growth of a relatively well-capitalized class of “emergent” African
farmers, most of whom did not start out in agriculture but rather bought land earned from
salaried employment in the towns (Sitko, Nkonde, and Jayne forthcoming). These farmers
are well represented in many African countries’ powerful farm lobbies, disproportionately
enjoy the benefits of input subsidy and price support programs due to their relatively large
farm sizes, and become major forces lobbying for the continuation of such programs.
Moreover, some African governments are increasingly receptive to devoting state
resources to develop land for large-scale commercial investment (e.g., investments in
irrigation, electrification, and road infrastructure). Ironically, policy debates in the region
seldom address whether similar public investments in customary tenure areas could
generate even greater payoffs in terms of agricultural productivity growth and poverty
reduction. Instead, rural poverty is increasingly being viewed as a problem to be addressed
through social safety nets, food assistance, and input subsidy programs, even though the
evidence shows that the benefits of such programs are often also disproportionately
captured by the rural non-poor (Morris et al 2007; Xu et al 2009; Ricker-Gilbert, Jayne,
and Chirwa 2011; Banful 2011).
The growing focus on how best to exploit unutilized land in Africa has arguably diverted
attention from the more central and enduring challenge of implementing agricultural
development strategies that effectively address the continent’s massive rural poverty and
food insecurity problems, which require recognizing the growing land constraints faced by
Page 32
Page 32 of 56
much of the rural population. It may be increasingly relevant to ask whether structural
transformation processes may be retarded in situations in which the distribution of rural
assets are so highly skewed that a large strata of the rural population may be unable to
benefit from agricultural growth incentives that would otherwise generate broad-based
growth multipliers. In most of the national household surveys from Africa that we have
reviewed in Section 3, the distribution of land and other productive assets within the
smallholder sector is at least as skewed as in much of Asia at the time of their green
revolutions. Estimates of land concentration would certainly be worse if we accounted for
the large-scale farm sectors in these countries.
The literature on growth linkages indicates that the first-round beneficiaries of agricultural
growth generate important multiplier effects by increasing their expenditures on a range of
local off-farm and non-farm activities that create second-round benefits for a wide-range of
other households in the rural economy (Johnston and Mellor 1961; Mellor 1976). In much
of Africa, the consumption growth linkages have been found to be especially important
(Delgado and Minot 2000). The extent and magnitude of these second round effects
depend on how broadly spread the first-round growth is. The initial distribution of land
and other productive assets will clearly affect the size of these multipliers. If dynamic
labor and services markets can be developed, then other employment opportunities should
be easier to create in the very locations where the larger smallholders are investing and
raising their output and productivity. Pro-active public sector investment and policy
support in developing these labor and service markets will be a key determinant of the
magnitude of the growth linkages to be derived from agricultural growth.
Viewed in a static way, one could conclude that the only way out of poverty for the
severely land-constrained rural poor is to increase their access to land. Viewed within a
dynamic structural transformation framework, this group’s brightest prospect for escape
from poverty will most likely involve being pulled off the farm into productive non-farm
sectors. Farming will be increasingly unable to sustain the livelihoods of people born in
rural areas without substantial shifts in labor from agriculture to non-farm sectors.
Education, which played a crucial role in Asia by allowing households to exit agriculture
into more lucrative off-farm jobs, is relatively low in most areas of rural Africa by world
standards. Investments in rural education and communications are likely to become
increasingly important to facilitate structural transformation.
Therefore, while greater equity in landholdings is important to kick-starting inclusive rural
growth processes in the short- and medium run, an important long-run goal will be to pull
the rural poor out of agriculture and into skilled off-farm jobs through investments and
policies that support the processes of structural transformation.
Page 33
Page 33 of 56
Widespread anecdotal evidence suggests that potentially the greatest threat to broad-based
agricultural growth is the process of customary lands being sold or leased to a small but
growing class of African elites. These processes of elite capture of the political process
appear to be moving quite rapidly in a number of African countries. Before his
assassination in 2003, the Economic Advisor to the President of Malawi, Kalonga
Stambuli, wrote that:
I have seriously deplored the social injustice and economic marginalization
associated with land conversion from communal tenure to leasehold tenure mostly
enjoyed by the elite who also enjoyed a monopoly in the production of export crops.
Most deplorable is the fact that the abundance of idle land among estates explains
much of the low equilibrium trap to which our countries have been subjected. The
economic hegemony of the agricultural elite was compounded by state enterprise
expansion into the private sector, over-regulation, a stifling bureaucracy, and
totalitarian politics. Inadequate amounts of land available to farmers remains a
major constraint to supply response.23
These anecdotal reports are consistent with research pointing to the growing
commodification and individualization of land in customary areas (e.g., Woodhouse 2003).
Implications for Development Strategy
1. African governments and international donors could greatly relieve Africa’s growing
land problems (and related food security and poverty problems) by focusing on efforts
to sustainably improve crop and animal productivity. Closing the “yield gap” through
productivity growth can relieve the severity of land pressures in densely populated
areas and buy needed time for longer-run investments such as education and health
improvements to enable more rural people to integrate into gainful off-farm
employment. Higher food prices are likely to provide greater incentives for
intensification of input use and contribute to yield growth. Peak oil projections may
also fundamentally change the economics of global food production in ways that are
difficult to predict with accuracy now.24
Despite scepticism in some quarters about the
prospects for achieving smallholder-led development (Collier and Dercon 2009), this
path has been the way out of hunger and poverty for much of Asia and, historically,
23
Email from K. Stambuli to Professor Michael Weber, Michigan State University, February 13, 2003,
subject: “Elitist Land and Agricultural Policies”. 24
Peak Oil projections are based on the summation of individual producing nations’ petroleum production
over time. In its State of the World 2005, Worldwatch Institute observes that oil production is in decline in 33
of the 48 largest oil-producing countries. See http://en.wikipedia.org/wiki/Peak_oil for a review of over 150
reports.
Page 34
Page 34 of 56
most other areas of the world (Lipton 2005). Successful small farm intensification will
also help to conserve the world’s remaining forest land and biodiversity. For all of
these reasons, it would seemingly be in governments’ and donor agencies’ interests to
redouble their efforts to support small farm productivity growth.
2. However, closing the yield gap will in many cases require a reallocation of public
expenditures from price supports and input subsidy programs to investments that can
support productivity growth on one hectare farms. While the long-term strategy is to
effectively shift marginal farms out of agriculture and into productive non-farm jobs,
this cannot happen by pushing farmers out of the sector; broad-based rural productivity
growth will be required to pull households from the farm into non-agriculture. Hence
the need to provide greater public funding for activities that can achieve productivity
growth on one hectare farms. These include farmer extension programs that effectively
transfer improved technologies and agronomic practices onto farmers’ fields: planting
on time, the use of conservation tillage practices, scouting for appropriate use of
herbicides and pesticides, right plant population, soil testing to identify the nutrients
that need to be added back to the soil, appropriate fertilizer cocktails for addressing soil
nutrient deficiencies, including lime where acidic soils lock up phosphorus, use of
coated nitrogen to reduce leaching, improving soil structure and organic content,
investing in drainage, and of course public investments to generate improved seed
varieties. Widespread adoption of these practices will raise the response rates of
fertilizer application and are necessary to meaningfully close the wide yield gaps
observed in the region (Fischer, Byerlee and Edmeades 2009).
3. Commission comprehensive land audits in each country: Current land allocation
decisions are being made in an information void. Very few, if any, African countries
keep accessible databases on the amount of unutilized and underutilized arable land
available in each country’s customary and state lands. Nor has there been any
government report showing the amount of customary land that has been transferred
into private title or leasehold tenure in the past several decades. A comprehensive and
transparent land database would raise public awareness and provide the means to assess
the costs and benefits of alternative approaches to guide future land policy decisions.
4. Consider applying a land tax or user fees, with the lowest (or zero) rates being put on
intensively utilized land and highest rates on unutilized arable land. Similar taxes
could be considered for water use to support the efficient use of these scarce resources.
5. Especially because land appears to a relatively abundant resource in many parts of
Africa, an extensification strategy of pulling more land into productive use by the
existing farm population that currently lack adequate access to land is likely to be part
of the solution to addressing Africa’s food and hunger challenges. In many parts of the
region, governments may be able to improve access to land for rural households
through a coordinated strategy of public goods and services to raise the economic value
of customary land that is currently remote and under-utilized. This would involve
Page 35
Page 35 of 56
investments in infrastructure and service provision designed to link currently isolated
areas with existing road and rail infrastructure and through allied investment in
schools, health care facilities, electrification and water supply, and other public goods
required to induce migration, settlement, and investment in these currently under-
utilized areas. Such investments would also help to relieve population pressures in
areas where the carrying capacity of the land has been exceeded. The approach of
raising the economic value of land through public investments in physical and
marketing infrastructure and service provision was pursued successfully by Southern
Rhodesia and Zimbabwe starting in the 1960s with its “growth point” strategy in the
Gokwe area, once cleared of tsetse fly. Public investments in this once desolate but
agro-ecologically productive area induced rapid migration into Gokwe from heavily
populated rural areas, leading to the “white gold rush” of smallholder cotton production
in the 1970s and 1980s (Govereh, 1999).
Some areas for future research
(1) How are land-constrained farming systems evolving differently from more land-
abundant farming systems? Is there evidence of changing relative factor prices and
factor proportions in densely vs. sparsely smallholder production systems? How
does this affect the programmatic implications for rural development and poverty
reduction strategies?
(2) Can the general equilibrium effects of intensifying land access problems in sub-
Saharan Africa be quantified? For example, to what extent are urban migration and
the attendant problems of slums, health and sanitation problems, congestion, etc.,
exacerbated by the new generation’s declining ability to access sufficient land to
earn a livelihood in agriculture? To what extent do land access problems account
for the growing emigration of young Africans from densely populated areas (e.g.,
Ethiopia, Kenya, Malawi) to the Middle East, South Africa, and Europe?
(3) What kind of farming systems lies beyond the continuum defined by Boserup, and
Binswanger and Pingali, where population density has reached not only the level
required to induce sedentary agriculture, land intensification, and the substitution of
capital and labor for scarce land, but where population density has continued to rise
well beyond this point? How would a scenario of higher world food prices affect
land intensification incentives and the potential supporting capacity of rural lands
disaggregated by agro-ecological potential and market access conditions?
Page 36
Page 36 of 56
References
Andre, C., and J.-P. Platteau (1998). Land relations under unbearable stress: Rwanda
caught in the Malthusian trap. Journal of Economic Behavior and Organization,
34(1):1-47.
Balk, D., F. Pozzi, G. Yetman, U. Deichmann, and A. Nelson (2004). The Distribution of
People and the Dimension of Place: Methodologies to Improve the Global Estimation
of Urban Extents. Available at:
http://sedac.ciesin.columbia.edu/gpw/docs/UR_paper_webdraft1.pdf
Banful, A. (2011). Old problems in the new solutions? Politically motivated allocation of
program benefits and the “new” fertilizer subsidies. World Development 39(7): 1166-
1176.
Barrett, C.B. (2008). Smallholder Market Participation: Concepts and Evidence from
Eastern and Southern Africa. Food Policy, 33(4): 299-317.
Bassett, T. and D. Crummy (1993). Land in African Agrarian System. Madison,
University of Wisconsin Press.
Binswanger, H.P., Deininger, K. and Feder, G. (1995). Power distortions revolt and reform
in agricultural land relations. In: Behrman, J. and Srinivasan, T.N. (eds). Handbook of
development economics, Volume III. Amsterdam, the Netherlands: Elsevier Science
B.V.
Binswanger, H. and Ruttan, V. (1978). Induced Innovation: Technology, Institutions and
Development. Baltimore, MD: Johns Hopkins University Press.
Binswanger, H. andMcIntire, J. (1987). Behavioral and Material Determinants of
Production Relations in Land-abundant Tropical Agriculture. Economic Development
and Cultural Change, 36(1), 73-99.
Binswanger, H. and Pingali, P. (1998). Technological Priorities for Farming in Sub-
Saharan Africa. World Bank Research Observer, 3(1): 81-98.
Boserup, E. (1965). The Conditions of Agricultural Growth: The Economics of Agrarian
Change under Population Pressure. London: Allen & Unwin.
Burke, W. (2011). Maize Production in Zambia and Regional Marketing: Input
Productivity and Output Price Transmission. PhD dissertation, Michigan State
University.
Page 37
Page 37 of 56
Chimhowu, A. and P. Woodhouse (2006). Customary vs. Private Property Rights?
Dynamics and Trajectories of Vernacular Land Markets in Sub-Saharan Africa.
Journal of Agrarian Change 6(3): 346-371.
Chizyuka, R., R. Kamona, C. Ufwenuka, and M. Phiri (2006). National Report – Zambia:
Policies and Strategies for Agrarian Reform and Rural Development to Secure and
Improve Access to Natural Resources. Paper prepared for the International Conference
on Agrarian Reform and Rural Development (ICARRD) 7-10 March. Porto Alegre,
Brazil.
Colin, J-P., and P. Woodhouse (2010). Introduction: Interpreting Land Markets in Africa.
Africa 80(1): 1-13.
Collier, P. and S. Dercon (2009). African Agriculture in 50 Years: Smallholders in a
Rapidly Changing World. Expert meeting on how to feed the world in 2050, Economic
and Social Development Department. FAO, Rome.
Deninger, K., and L. Squire (1998). New Ways of Looking at Old Issues: Inequality and
Growth. Journal of Development Economics 57: 259-87.
Deininger, K. and D. Byerlee, with J. Lindsay, A. Norton, H. Selod, M. Stickler (2011).
Rising Global Interest in Farmland: Can it Yield Sustainable and Equitable Benefits?
World Bank, Washington, DC.
Delgado, C.L. and N. Minot. 2000. Agriculture in Tanzania Since 1986: Follower or
Leader of Growth. A World Bank Country Study. The World Bank.
Dreschel, P. L. Gyiele, D. Kunze, O. Cofie (2001). Population Density, Soil Nutrient
Depletion, and Economic Growth in sub-Saharan Africa. Ecological Economics 38:
251-258.
Erenstein, O. (2006). Intensification or extensification? Factors affecting technology use
in peri-urban lowlands along an agro-ecological gradient in West Africa. Agricultural
Systems, 90, 132-158.
Fischer, G. , F. Nachtergaele, S. Prieler, E. Teixeira, G. Tóth, H. van Velthuizen, L.
Verelst, and D. Wiber (2010) Global Agro‐Ecological Zones (GAEZ v3.0) Model
Documentation. IIASA/FAO, 2010. IIASA, Laxenburg, Austria and FAO, Rome, Italy.
Available at
http://www.iiasa.ac.at/Research/LUC/GAEZv3.0/docs/GAEZ_Model_Documentation.
pdf
Fischer, G and M. Shah (2010). Farmland Investments and Food Security: Statistical
Annex. Report prepared under the World Bank and International institute for Applied
System Analysis, Luxembourg.
Page 38
Page 38 of 56
Govereh, J., (1999). Impacts of Tsetse Control on Immigration and Household
Accumulation of Capital: Zambezi Valley, Zimbabwe. PhD Dissertation, Michigan
State University, East Lansing.
Greer, J. and E. Thorbecke (1986). Food Poverty and Consumption Patterns in Kenya.
International Labor Office, Vienna.
Gugerty, M., and C.P. Timmer (1999). Growth, Inequality and Poverty Alleviation:
Implications for Development Assistance. Mimeo.
Haggblade, S. and P. Hazell. 1988. Prospects for Equitable Growth in Rural Sub-Saharan
Africa, AGRAP Economic Discussion Paper 3, Washington D.C., World Bank.
Hayami, Y. and K. Otsuka (1993). The Economics of Contract Choice: An Agrarian
Perspective. Oxford University Press, Oxford.
Herbst, J. (2000). States and Power in Africa. Princeton, New Jersey: Princeton
University Press.
Hertel. T. (2011). The Global Supply and Demand for Agricultural Land in 2050: A
Perfect Storm in the Making? American Journal of Agricultural Economics 93(2):259-
275.
Henao, J. and C. Baanante (1999). Estimating rates of nutrient depletion in soils of
agricultural lands of Africa. IFDC Technical Bulletin T48, Muscle Shoals, Alabama.
Holden, S., Otsuka, K., Place, F, (eds.), 2009. The Emergence of Land Markets in Africa.
Washington, DC: Resources for the Future.
Jayne, T.S. T. Yamano, M. Weber, D. Tschirley, R. Benfica, A. Chapoto, and B. Zulu
(2003). Smallholder Income and Land Distribution in Africa: Implications for Poverty
Reduction Strategies. Food Policy, 28(3): 253-275.
Jayne, T.S., D. Mather, and E. Mghenyi. 2010. Principal Challenges Confronting
Smallholder Agriculture in Sub-Saharan Africa. World Development, 38(10): 1384-
1398
Jayne, T.S. and M. Muyanga (forthcoming 2012). Land Constraints in Kenya’s Densely
Populated Rural Areas: Implications for Food Security and Institutional Reform. Food
Security, volume 4.
Jayne, T.S., N. Mason, R. Myers, J. Ferris, D. Mather, N. Sitko, M. Beaver, N. Lenski, A.
Chapoto, D. Boughton (2010). Patterns and Trends in Food Staples Markets in Eastern
and Southern Africa: Toward the Identification of Priority Investments and Strategies
for Developing Markets and Promoting Smallholder Productivity Growth. International
Page 39
Page 39 of 56
Development Working Paper 104. Michigan State University.
http://www.aec.msu.edu/fs2/zambia/idwp104.pdf
Johnston, B.F. and P. Kilby (1975). Agriculture and Structural Transformation: Economic
Strategies in Late-Developing Countries. New York: Oxford University Press.
Johnston, Bruce F., and John Mellor (1961). The Role of Agriculture in Economic
Development. American Economic Review 51.4: 566-93.
Juma, C. 1996. Introduction. In Juma, C. and Ojwang, J.B. (eds.). In Land We Trust:
Environment, Private Property and Constitutional Change. African Centre for
Technology Studies (ACTS) environmental policy series: 7, Initiatives Publishers,
Nairobi, pp. 1-5.
Kanyinga, K. (1998). Politics and Struggles of Access to Land: ‘Grants from above’ and
‘squatters’ in Coastal Kenya, European Journal of Development Research, 10(2),
pages.
Kimenju, S. and D. Tschirley. 2009. Agriculture and Livelihood Diversification in Kenyan
Rural Households. Working Paper 29/2008, Egerton University, Tegemeo Institute,
Nairobi.
Lipton, M. (2005). Crop Science, Poverty, and the Family Farm in a Globalising World.
2020 Discussion Paper 40, International Food Policy Research Institute, Washington,
D.C.
Lopéz, R. and A. Valdés (2000). Fighting rural Poverty in Latin America: New Evidence
of the Effects of Education, Demographics, and Access to Land. Economic
Development and Cultural Change, 49(1): 197-211.
Marenya, P. and Barrett, C. (2009). State-conditional Fertilizer Yield Response on Western
Kenyan Farms. American Journal of Agricultural Economics, 91(4): 991-1006.
Mason, N., W. Burke, A. Shipekesa, and T. Jayne (2011). The 2011 Surplus in
Smallholder Maize Production in Zambia: Drivers, Beneficiaries, and Implications for
Agricultural and Poverty Reduction Policies. Working Paper 58, Food Security
Research Project, Lusaka, Zambia.
http://www.aec.msu.edu/agecon/fs2/zambia/index.htm
Matsumoto, T., and T. Yamano (2011). Optimal Fertilizer Use on Maize Production in
East Africa. In T. Yamano, K. Otsuka, and F. Place (eds.), Emerging Development of
Agriculture in East Africa: Markets, Soil and Innovations, p. 117-132. Springer,
Amsterdam.
Mbaria, J. (2001). We Ignore Land Issues at Our Peril, The Daily Nation, 16 August 2001,
Nairobi.
Page 40
Page 40 of 56
Mellor, J. (1976). The New Economics of Growth: A Strategy for India and the Developing
World. Ithaca: Cornell University Press.
Metcalfe, S. (2005). Landscape Conservation and Land Tenure in Zambia: Community
Trusts in the Kazungula Heartland. Untitled Working Paper. Lusaka and Washington,
D.C.: African Wildlife Foundation.
Morris, M., Kelly, V., Kopicki, R., & Byerlee, D. (2007). Fertilizer Use in African
Agriculture: Lessons Learned and Good Practice Guidelines. Agriculture and Rural
Development Division, World Bank, Washington, D.C.
Namwaya, O. (2004). Who owns Kenya?, East Africa Standard, October 1, 2004.
http://www.marsgroupkenya.org/pdfs/crisis/2008/02/large_landowners_in_Kenya.pdf
OECD-FAO (2011). Agricultural Outlook 2011-2020. Rome: FAO and OECD
Publishing. http://dx.doi.org/10.1787/agr_outlook-2011-en (last accessed December
14, 2011).
Okoth-Ogendo, H.W.O. (1976). African Land Tenure Reform. In Judith, H., Maitha, J.K.
and Senga, W.M. (ed). Agricultural Development in Kenya, and Economic Assessment.
Oxford University Press , Nairobi, 152-185.
Ravallion, M. and G. Datt. (2002). Why has economic growth been more pro-poor in some
states of India than others? Journal of Development Economics, 68(2002): 381–400.
Republic of Kenya. (1965). The Sessional Paper No. 10 of 1965 on African Socialism and
its Application to Planning in Kenya. Nairobi: Government Printer.
Ricker-Gilbert, J. and T.S. Jayne (2010). What are the Enduring Benefits of Fertilizer
Subsidies on Household Well-Being? Evidence from Malawi. Contributed Paper
Presentation at the African Association of Agricultural Economists Meetings,
September 19-23, 2010, Cape Town, South Africa.
Ricker-Gilbert, J., T. Jayne, and E. Chirwa (2011). Subsidies and crowding out: a double-
hurdle model of fertilizer demand in Malawi. American Journal of Agricultural
Economics 93(1): 26-42.
Ruttan, V. W. (1978). Induced institutional change. In (eds) Binswanger, H.P. & Ruttan,
V.W. Induced innovation: Technology, institutions and development, Baltimore,
United States, Johns Hopkins University Press.
Schlenker, D. and D. Lobell (2010). Robust Negative Impacts of Climate change on
African Agriculture. Environmental Research Letters 5(1): 014010.
Page 41
Page 41 of 56
Sen, Amartya (1990). Food, Economics, and Entitlements, in C. Eicher and J. Staatz
(eds.), Agricultural Development in the Third World, Baltimore, Johns Hopkins Press,
189-205.
Sheahan, M. (2011). Analysis of Fertilizer Profitability and Use in Kenya. MS thesis,
Michigan State University.
Sitko, N., C. Nkonde, and T.S. Jayne (forthcoming). Pathways for becoming an Emergent
Farmer in Zambia: Can current land and agricultural policies encourage smallholder
extensification? Working Paper, Food Security Research Project, Lusaka, Zambia.
Smaling, E., Nandwa, S., Prestele, H., Roetter, R., & Muchena, F. (1992). Yield response
of maize to fertilizers and manure under different agro-ecological conditions in Kenya.
Agriculture, Ecosystems & Environment, 41(3-4), 241-252.
Stambuli, K. (2002). Elitist Land and Agricultural Policies and the Food Problem in
Malawi. Journal of Malawi Society – Historical and Scientific, 55(2): 34-83
Tiffen, M., Mortimore, M. and Gichuki, F. (1994). More people, less erosion:
Environmental recovery in Kenya. Chichester, NY, United States, John Wiley.
Tatem, A.J., A.M. Noor, C. von Hagen, A. Di Gregorio, and S.I. Hay (2007). High
Resolution Population Maps for Low Income Nations: Combining Land Cover and
Census in East Africa. PLoS ONE 2(12): e1298. doi:10.1371/journal.pone.0001298
Thurow, R. (2010). The Fertile Continent. Foreign Affairs, November/December 2010.
Reprinted by permission at: http://globalfoodforthought.typepad.com/global-food-for-
thought/2010/11/roger-thurows-essay-in-foreign-affairs.html
Vollrath, D. (2007). Land Distribution and International Agricultural Productivity.
American Journal of Agricultural Economics 89(1): 202-216.
Woodhouse, P. (2003). African enclosures: A default model of development. World
Development, 31(10): 1705-1720.
Wiggins, S. (2000). Interpreting changes from the 1970s to the 1990s in African
agriculture through village studies. World Development, 28(4): 631–662.
Wikipedia (2011). Peak Oil, http://en.wikipedia.org/wiki/Peak_oil. Last accessed:
December 20, 2011.
World Bank. 2009. Awakening Africa’s Sleeping Giant: Prospects for Competitive
Commercial Agriculture in the Guinea Savannah Zone and Beyond. World Bank,
Washington, DC.
Page 42
Page 42 of 56
Xu, Z., Guan, Z., Jayne, T.S., & Black, R. (2009). Factors influencing the profitability of
fertilizer use on maize in Zambia. Agricultural Economics, 40(4), 437-446.
Yamano, T., Place, F., Nyangena, W., Wanjiku, J. and Otsuka, K. 2009. Efficiency and
equity impacts of land markets in Kenya. Chapter 5 in Holden, S.T., Otsuka, K. and
Place, F.M. (eds), The Emergence of Land Markets in Africa. Washington, DC:
Resources for the Future.
Zaal, F. and R. Oostendorp (2002). Explaining a Miracle: Intensification and the Transition
Towards Sustainable Small-scale Agriculture in Dryland Machakos and Kitui Districts,
Kenya. World Development, 30(7): 1271–1287.
Page 43
Page 43 of 56
Figure 1. Lorenz curve showing the percentage of arable land by percentage of rural
population in Kenya, 2009.
Gini coefficient: 0.51. Source: population data from 2009 Kenya National Bureau of Statistics Census;
arable land from Columbia University Global Rural-Urban Mapping Project (GRUMP). A Lorenz curve
shows the degree of inequality that exists in the distributions of two variables, and is often used to illustrate
the extent that income or wealth is distributed unequally in a particular society.
Page 44
Page 44 of 56
Figure 2. Population density in Kenya
Source: LandScan data for 1999 Census, Kenya
Page 45
Page 45 of 56
Figure 3. Population density in Zambia
Source: LandScan data based on 2000 National Census.
Page 46
Page 46 of 56
Figure 4. Log of per capita landholding size and per capita household incomes
ETHIOPIA
Ha0
Log(P
er C
apita Incom
e)
Per Capita Land Access (Ha)
.25 .5 .75 15.4
5.8
6.2KENYA
Ha0 .25 .5 .75 1
9.0
9.4
9.8RWANDA
Ha0 .25 .5 .75 1
3.8
4.0
4.2
4.4
MOZAMBIQUE
Ha0 .25 .5 .75 1
3.0
3.5
4.0ZAMBIA
Ha0 .25 .5 .75 1
3.2
3.4
3.6
3.8
Note: The vertical lines are drawn at 25th, 50th, and 75th percentiles of per capita land owned for eachcountry. The top 5 percent of observations are excluded from the graphs because lines are sensitive to a
few extreme cases.
Source: Jayne et al., 2003.
Page 47
Page 47 of 56
Figure 5. 2010 Budget allocation to Agriculture, Government of Zambia
Food Reserve Agency (56.5%)Farm Inputs Support Programme (21.8%)Other Min. Agriculture programs (14.7%)Other Ministry programs (7.0%)
56.5%
21.8%14.7%
7.0%
Source: Ministry of Finance published budget figures including supplemental spending.
Notes: Expenditures to agriculture accounted for 15.3% of total government budget in 2010. Other Ministry
of Agriculture programs included the Zambia Agricultural Research Institute (0.3% of total agricultural
budget), Veterinary and Tse Tse Control programs (1.0%), seed control and certification (0.2%), provincial
agricultural research stations (0.1%), Policy Analysis Unit (0.7%). Agricultural programs in other ministries
includes feeder roads, Central Statistical Office, Forestry, farm block, and resettlement programs.
Page 48
Page 48 of 56
Figure 6. Simulations from Kenya econometric results showing the relationship
between population density and variables of interest
Q1 Q2 Q3 Q4 Q5 .2
.4
.6
.8
Hecta
res p
er
adult e
quiv
ale
nt
0 150 315 475 660 1135 Persons/sq km
(a) Land holding by population density
Q1 Q2 Q3 Q4 Q5 .2
.25
.3
.35
.4
Hecta
res p
er
adult e
quiv
ale
nt
0 150 315 475 660 1135 Persons/sq km
(b) Area under crop by population density
Q1 Q2 Q3 Q4 Q5 .1
.12
.14
.16
.18
'000K
sh p
er
hecta
re
0 150 315 475 660 1135 Persons/sq km
. (c) Intensity of fertilizer input use per hectare
Q1 Q2 Q3 Q4 Q5 10
12
14
16
18 '0
00K
sh p
er
hecta
re
0 150 315 475 660 1135 Persons per sq km
. (d) Intensity of cash input use per hectare
Q1 Q2 Q3 Q4 Q5 10
15
20
25
30
35
'000K
Sh p
er
hecta
re
0 150 315 475 660 1135 Persons per sq km
. (e) Net farm income per hectare
Q1 [lowest] Q2 Q5 [highest] Q3 Q4 15
20
25
'000K
sh p
er
adult e
quiv
ale
nt
0 150 315 475 660 1135 Persons per sq km
. (f) Net farm income per adult equivalent
Page 49
Page 49 of 56
Q1 Q2 Q3 Q4 Q5 10
15
20
25
30
35 '0
00K
sh p
er
adult e
quiv
ale
nt
0 150 315 475 660 1135 Persons per sq km
. (g) Household asset value per adult equivalent
Q1 Q2 Q3 Q4 Q5 9.8
9.9
10.0
10.1
10.2
‘000K
sh p
er
ad
ult e
quiv
ale
nt
0 150 315 475 660 1135 Persons per sq km
. (h) Total household income per adult equivalent
Page 50
Page 50 of 56
Table 1. Farming operations in different farming systems
Forest fallow
system
Bush fallow
system
Short-fallow
system
Annual
cultivation
system
Multiple
cropping
system
Labor-land ratios
(reflecting pop.
density)
Low high
Land preparation no land
preparation
use of hoe to
loosen soil plow
animal-drawn
plow
animal drawn
plow and
tractor
fertilization ash ash manure, green
manure
green manure,
inorganic
fertilizer
Intensive use of
inorganic
fertilizer
weeding minimal
required as
length of fallow
decreases
weeding intensive
weeding
intensive
weeding
Source: condensed and adapted from Binswanger and Pingali (1988).
Page 51
Page 51 of 56
Table 2. Hectares of arable land per person in agriculture (10 year average) in selected countries
1960-69 1970-79 1980-89 1990-99 2000-091
2000-09 land-
person ratio as %
of 1960-69
Ethiopia 0.501 0.444 0.333 0.224 0.218 43.5%
Zambia 0.643 0.607 0.398 0.342 0.297 46.2%
Kenya 0.462 0.364 0.305 0.264 0.219 47.4%
Uganda 0.655 0.569 0.509 0.416 0.349 53.3%
Malawi 0.480 0.466 0.357 0.304 0.307 64.0%
Zimbabwe 0.613 0.550 0.452 0.420 0.469 76.5%
Rwanda 0.212 0.213 0.195 0.186 0.174 82.1%
Mozambique 0.356 0.337 0.320 0.314 0.294 82.6%
Ghana 0.646 0.559 0.508 0.492 0.565 87.5%
Nigeria 0.982 0.860 0.756 0.769 0.898 91.4%
Source: FAO STAT (2010)
Notes: 1Data on land utilization is only available for the period 2000 to 2008. Land-to-person ratio =
(arable land and permanent crops)/(agricultural population). For the periods 1960-69 and 1970-79,
agricultural population is estimated by multiplying rural population by an adjustment factor (mean
agricultural population 1980-84/mean rural population 1980-84). This is because data on agricultural
population was only collected from 1980 onward.
Page 52
Page 52 of 56
Table 3a. Rural population density distribution on land categorized as arable, GRUMP 2010
Percentiles of all pixels with arable land ranked by population density Mean across
all pixels 5th
10th 25th 50th 75th 90th 95th
Ethiopia 48 70 113 151 237 517 695 239
Ghana 32 44 70 128 653 1453 1775 440
Kenya 38 71 185 393 648 960 1170 465
Malawi 63 84 136 230 374 587 812 307
Mozambique 7 14 30 68 494 965 1394 287
Nigeria 36 45 91 194 458 1274 1687 401
Rwanda 162 229 346 450 558 780 1354 519
Tanzania 11 16 36 59 143 886 1546 228
Uganda 50 84 163 277 438 658 915 349
Zambia 7 12 23 332 944 1186 1210 450
Note: These estimates are based on all 1 km2 grid cells (“pixels”) categorized as rural and with at least 10%
of the grid cell being arable land and below 2000 persons per km2.
Data sources: Year 2010 population estimates from GRUMP; arable land is the share of all pixels classified
as “cultivated” in the GAEZ 3.0 database.
Table 3b. Rural population density distribution on land categorized as arable, AfriPop 2010
Percentiles of all pixels with arable land ranked by population density Mean across
all pixels 5th
10th 25th 50th 75th 90th 95th
Ethiopia 39 57 97 149 265 528 867 251
Ghana 17 31 89 365 990 1527 1755 585
Kenya 30 58 158 338 632 1077 1388 463
Malawi 56 71 105 166 246 351 487 217
Mozambique 6 9 26 50 101 764 1260 208
Nigeria 25 35 65 173 691 1361 1657 447
Rwanda 148 201 306 470 723 1083 1327 564
Tanzania 11 19 44 107 314 752 1106 262
Uganda 45 71 130 232 474 913 1238 375
Zambia 6 9 19 44 640 1361 1693 376
Note: These estimates are based on all 1 km2 grid cells (“pixels”) categorized as rural and with at least 10%
of the grid cell being arable land and below 2000 persons per km2.
Data sources: Year 2010 population estimates from AfriPop 2010; arable land is the share of all pixels
classified as “cultivated” in the GAEZ 3.0 database.
Page 53
Table 4. Land Distribution within the smallholder farm sectors in Selected African Countries
Country
(year of survey)
(a)
sample
size
(b)
Mean
farm size
(ha)
(c)
Farm Size (hectares per capita)
(d)
Gini Coefficients
mean Quartile Land per
household
Land per
capita
Land per
adult 1 2 3 4
Kenya, 1997 1146 2.28 0.41 0.08 0.17 0.31 1.10 0.55 0.56 0.54
Kenya, 2010 1146 1.86 0.32 0.07 0.12 0.25 1.12 0.57 0.59 0.56
Ethiopia, 1996 2658 1.17 0.24 0.03 0.12 0.22 0.58 0.55 0.55 0.55
Rwanda, 1984 2018 1.20 0.28 0.07 0.15 0.26 0.62 -- -- --
Rwanda, 1990 1181 0.94 0.17 0.05 0.10 0.16 0.39 0.43 0.43 0.41
Rwanda, 2000 1584 0.71 0.16 0.02 0.06 0.13 0.43 0.52 0.54 0.54
Malawi, 1998 5657 0.99 0.22 0.08 0.15 0.25 0.60 -- -- --
Zambia, 2001 6618 2.76 0.56 0.12 0.26 0.48 1.36 0.44 0.50 0.51
Mozambique, 1996 3851 2.10 0.48 0.1 0.23 0.4 1.16 0.45 0.51 0.48
Note: Numbers for Ethiopia, Rwanda, Mozambique, and Zambia, including Gini coefficients, are weighted to be nationally representative.
Sources: Kenya: Tegemeo Rural Household Surveys, Tegemeo Institute, Nairobi Kenya. Ethiopia: Central Statistical Authority surveys 1995 and 1997,
Government of Ethiopia, Rwanda: 1990 Ministry of Agriculture Survey. Malawi: Profile of Poverty in Malawi, 1998, National Economic Council, Malawi,
2000. Zambia: Central Statistical Office Post-Harvest Surveys. Mozambique: 1996 Ministry of Agriculture and Rural Development (MADER) Smallholder
Survey.
Page 54
54
Table 5. Perceptions of Availability of Arable Land in Zambia and Population Density, by Province, 2001.
Province Is there unallocated arable land? Arable &
unutilized
Arable and
unutilized minus
already cultivated
land (kms2)
(i.e., unutilized)
% Responding
Yes
% Responding
No
Central 57.9 42.1 65,800 64,679
Copperbelt 39.2 60.8 23,172 22,720
Eastern 32.6 67.4 6,769 3,935
Luapula 38.6 61.4 28,120 27,031
Lusaka 40.0 60.0 11,756 11,587
Northern 68.3 31.7 102,751 149,543
Northwestern 96.0 4.0 151,992 102,203
Southern 33.6 66.4 6,321 4,493
Western 23.3 76.7 1,877 879
Zambia 44.1 55.9 398,560 387,022
Source: Supplementary Survey to the Post Harvest Survey, 2001, Central Statistical Office, Lusaka, Zambia.
Page 55
55
Table 6: Smallholder maize production growth from the baseline period (2006–2008 harvest years) to 2011,
by farm size category
Total smallholder maize production
Total area
cultivated
Number of
farms,
2006-08 to
2011
% of
farms
Annual mean
during 2006-2008
baseline period
(MT)
2011 harvest
(MT)
Absolute
change (D-C)
(MT)
Increase in
maize output
per farm
(E*1,000/A)
(MT)
(A) (B) (C) (D) (E) (F)
0-0.99 ha 616,867 41.9% 212,335 309,324 96,989 157.2
1-1.99 ha 489,937 33.3% 381,293 707,438 326,145 665.7
2-4.99 ha 315,459 21.4% 490,102 1,130,527 640,425 2,030.1
5-9.99 ha 42,332 2.9% 196,848 494,719 297,871 7,036.6
10-20 ha 6,626 0.5% 103,156 144,888 41,732 6,298.4
Total 1,471,221 100% 1,383,735 2,786,896 1,403,161 953.7
Sources: MACO/CSO Crop Forecast Surveys, 2005/06-2007/08, 2010/11
Table 7. FISP fertiliser received (2010/11 crop season) and maize sales, 2011, by farm size category
Total area
cultivated
(maize + all
other crops)
Number of
farms
% of farms
(B)
% of farmers
receiving
FISP
fertilizer
kg of FISP
fertilizer
received per
farm household
% of
farmers
expecting to
sell maize
maize sales
(kg/farm
household)
(A) (C) (D) (E) (F)
0-0.99 ha 596,334 39.6% 14.3% 24.1 22.2 135
1-1.99 ha 499,026 33.1% 30.6% 69.3 47.7 609
2-4.99 ha 354,116 23.5% 45.1% 139.7 64.0 1,729
5-9.99 ha 49,410 3.3% 58.5% 309.7 82.1 6,613
10-20 ha 6,999 0.5% 52.6% 345.6 86.8 15,144
Total 1,505,885 100% 28.6% 77.1 42.7 950
Source: MACO/CSO Crop Forecast Survey, 2010/11
Page 56
56
Appendix 1.
Data sources:
[A] World Bank, http://data.worldbank.org/indicator/sp.pop.grow
[B] World Bank, http://data.worldbank.org/indicator/sp.rur.totl.zg?page=5
[C] World Bank, http://data.worldbank.org/indicator/sp.rur.totl.zs/countries
Period Ethiopia Ghana Kenya Malawi Mozambique Nigeria Rwanda Tanzania Uganda Zambia
Rural population 1960-69 2.2 1.8 2.9 2.3 1.9 1.4 2.5 2.7 3.1 1.5
growth rate (%/year) 1970-79 1.9 2.0 3.1 2.8 1.7 1.9 3.0 2.5 2.8 1.8
[A] 1980-89 2.7 2.3 3.4 3.8 0.3 1.7 3.5 2.5 3.0 3.1
1990-99 2.8 1.5 2.8 1.9 1.6 1.3 -0.4 2.6 3.1 3.5
2000-09 2.3 0.8 2.3 2.3 1.3 1.1 2.2 2.2 3.1 2.3
Urban population 1960-69 5.4 4.7 6.6 5.7 6.7 5.6 5.5 7.0 7.4 8.2
growth rate (%/year) 1970-79 3.9 3.1 7.9 7.2 10.7 5.1 7.1 9.3 4.2 6.0
[B] 1980-89 5.0 4.6 5.1 6.6 5.9 4.8 4.6 5.7 7.2 3.0
1990-99 4.7 4.5 3.7 5.0 6.7 4.4 10.4 4.6 4.1 1.6
2000-09 3.7 3.8 3.8 5.5 4.7 4.0 5.7 4.5 4.2 2.6
Percentage of population 1960-69 7.4 25.8 8.6 5.0 4.6 19.5 2.8 6.1 5.4 23.2
residing in urban areas (%) 1970-79 9.4 30.0 12.7 7.5 8.7 25.3 3.9 10.8 7.0 34.5
[C] 1980-89 11.4 33.1 16.9 10.2 16.5 31.5 5.0 16.6 9.1 39.7
1990-99 13.7 39.8 18.9 13.2 25.6 38.5 8.5 20.4 11.6 37.3
2000-09 16.0 47.4 20.7 17.2 34.1 45.8 16.7 24.1 12.5 35.1
data sources:
[A] http://data.worldbank.org/indicator/SP.POP.GROW
[B] http://data.worldbank.org/indicator/SP.RUR.TOTL.ZG?page=5
[C] http://data.worldbank.org/indicator/SP.RUR.TOTL.ZS/countries