DISCLOSURE APPENDIX CONTAINS ANALYST CERTIFICATIONS AND THE STATUS OF NON-US ANALYSTS. FOR OTHER IMPORTANT DISCLOSURES, visit www.credit-suisse.com/ researchdisclosures or call +1 (877) 291-2683. U.S. Disclosure: Credit Suisse does and seeks to do business with companies covered in its research reports. As a result, investors should be aware that the Firm may have a conflict of interest that could affect the objectivity of this report. Investors should consider this report as only a single factor in making their investment decision. 03 April 2012 Global Equity Research Emerging Markets (Strategy) Emerging Market Research Institute THEME Opportunities in an urbanising world Source: istockphoto.com In the hundred years between 1950 and 2050 the global population is undergoing an irreversible structural transition in the way we live. Drawn by the superior economic, lifestyle and social opportunities of urban dwelling, the world’s population is migrating from rural areas to cities. In 2009 the percentage of the planet’s population living in urban areas crossed the 50% threshold and by 2037 cities in developing nations will contain half the world’s total population. Urbanisation continues to provide one of the most significant drivers of growth for the global economy. Typically, as the share of a country’s urban population rises by 5 percentage points, there is an associated gain in per capita economic activity of 10%. It is critical that governments of rapidly urbanising countries effectively deliver the necessary policy mix, from urban planning with appropriate levels of investment into infrastructure and affordable housing, through to social programs allowing more balanced income distribution, necessary to ensure that the appropriate level of associated growth potential is unlocked as their populations urbanise. We identify the challenges and explore the opportunities for governments and investors as emerging market populations migrate towards cities. Credit Suisse Emerging Market Research Institute Thought Leadership from Credit Suisse Research and World-Leading Experts Research Analysts Alexander Redman 44 20 7883 6896 [email protected]Arun Sai 44 20 7883 0002 [email protected]
Transcript
DISCLOSURE APPENDIX CONTAINS ANALYST CERTIFICATIONS AND THE STATUS OF NON-US ANALYSTS. FOR OTHER IMPORTANT DISCLOSURES, visit www.credit-suisse.com/ researchdisclosures or call +1 (877) 291-2683. U.S. Disclosure: Credit Suisse does and seeks to do business with companies covered in its research reports. As a result, investors should be aware that the Firm may have a conflict of interest that could affect the objectivity of this report. Investors should consider this report as only a single factor in making their investment decision.
03 April 2012 Global
Equity Research Emerging Markets (Strategy)
Emerging Market Research Institute THEME
Opportunities in an urbanising world
Source: istockphoto.com
■ In the hundred years between 1950 and 2050 the global population is undergoing an irreversible structural transition in the way we live. Drawn by the superior economic, lifestyle and social opportunities of urban dwelling, the world’s population is migrating from rural areas to cities. In 2009 the percentage of the planet’s population living in urban areas crossed the 50% threshold and by 2037 cities in developing nations will contain half the world’s total population.
■ Urbanisation continues to provide one of the most significant drivers of growth for the global economy. Typically, as the share of a country’s urban population rises by 5 percentage points, there is an associated gain in per capita economic activity of 10%.
■ It is critical that governments of rapidly urbanising countries effectively deliver the necessary policy mix, from urban planning with appropriate levels of investment into infrastructure and affordable housing, through to social programs allowing more balanced income distribution, necessary to ensure that the appropriate level of associated growth potential is unlocked as their populations urbanise.
■ We identify the challenges and explore the opportunities for governments and investors as emerging market populations migrate towards cities.
Credit Suisse Emerging Market Research Institute
Thought Leadership from Credit Suisse Research and World-Leading Experts
Consumer 16.7% 7.9% 1.2 18.3Dongfeng Motors 489 HK Automobiles China 3.3% 18.3% 1.5 9.7 0.0%Great Wall Motor 2333 HK Automobiles China 3.3% 21.0% 2.1 10.7 1.0%Kia Motors 000270 KP Automobiles Korea 3.3% 16.2% 2.0 9.0 -0.5%Tata Motors TTM UN Automobiles India 3.3% 12.9% 1.4 12.8 2.0%Haier Elec Group 1169 HK Cons. Durables China 3.3% 22.4% 3.4 14.9 1.1%
Industrials 33.3% 8.5% 1.6 19.0Alstom ALO FP Capital Goods France 3.3% 14.4% 2.0 12.8 0.0%Assa Abloy ASSAB SS Capital Goods Sweden 3.3% 20.6% 3.6 14.7 0.8%Atlas Copco ATCOA SS Capital Goods Sweden 3.3% 21.1% 3.4 17.0 0.7%Dover Corporation DOV UN Capital Goods US 3.3% 16.7% 2.7 15.2 -0.1%Eaton Corporation ETN UN Capital Goods US 3.3% 13.8% 2.2 14.9 0.1%Illinois Tool Works, Inc. ITW UN Capital Goods US 3.3% 17.6% 2.6 15.1 0.2%United Tractors UNTR IJ Capital Goods Indonesia 3.3% 11.1% 2.8 20.1 0.7%Weichai Power Co. Ltd 2338 HK Capital Goods China 3.3% 26.7% 1.6 9.1 -0.1%Weir Group WEIR LN Capital Goods UK 3.3% 24.8% 4.2 15.8 0.5%Zoomlion Heavy Industry 1157 HK Capital Goods China 3.3% 10.2% 1.3 12.4 0.7%
Materials 16.7% 7.8% 1.2 15.7Grupo Mexico GMEXICOB MM Materials Mexico 3.3% 13.3% 1.7 13.3 -0.3%Iluka Resources ILU AT Materials Australia 3.3% 16.3% 3.0 10.4 -5.9%KGHM Polska Miedz KGH PW Materials Poland 3.3% 14.4% 1.2 9.7 1.4%Korea Zinc 010130 KP Materials Korea 3.3% 11.5% 1.7 11.8 0.5%Kumba Iron Ore KIO SJ Materials South Africa 3.3% 53.5% 7.2 14.4 -1.5%
Real Estate 16.7% 5.3% 0.9 18.9Alam Sutera ASRI IJ Real Estate Indonesia 3.3% 16.4% 3.7 16.9 1.2%China Overseas Land 688 HK Real Estate China 3.3% 10.0% 1.3 12.2 0.5%Country Garden 2007 HK Real Estate China 3.3% 10.1% 1.1 10.8 0.0%Evergrande Real Estate 3333 HK Real Estate China 3.3% 11.7% 1.1 8.7 -0.2%Soho China 410 HK Real Estate China 3.3% 12.9% 0.9 9.0 -0.1%
Utilities 16.7% 5.5% 1.2 20.9China Resources Power 836 HK Utilities China 3.3% 7.3% 1.2 18.4 0.1%CKI 1038 HK Utilities China 3.3% 9.5% 2.4 18.8 0.2%ENN Energy Holdings 2688 HK Utilities China 3.3% 10.8% 2.0 17.5 0.1%Guangdong Inv 270 HK Utilities China 3.3% 10.9% 1.4 12.4 0.3%Perusahaan Gas Negara PGAS IJ Utilities Indonesia 3.3% 13.3% 2.5 20.2 -0.1%
CFROI momentum ^
CFROI / CFROE *
HOLT Value/Cost *
Economic P/E *Country WeightCompany Bloomberg Ticker Industry Group
Notes: * Figures in bold are the respective sector group medians; ^ change in FY1 CFROI in last 3 months
Source: Credit Suisse HOLT, Credit Suisse research
03 April 2012
Emerging Market Research Institute 3
Selected emerging and developed market equity plays on urbanisation We argue that the most effective way for an equity investor to participate in the emerging markets urbanisation theme is a combination of domestic-oriented equity plays in select countries which we have identified as offering the best opportunities and pan-emerging or developed market export-oriented equity plays in relevant sectors. We launch an equal weighted basket (available shortly on Bloomberg: HTERURBN <Go>) of 30 stocks to gain exposure to this theme.
Direct domestic plays: The universe comprises stocks from China, Egypt, India, Indonesia, Nigeria, Pakistan, Philippines, Thailand and Vietnam (countries we have identified as those offering superior investment potential owing to their large populations, a current level of urbanisation associated with peak per capita GDP growth, low income inequality, uninterrupted access to capital markets, and preferably low or decreasing levels of corruption) in the following sector groups:
(v) Real estate (real estate development and services)
Indirect plays: We include large cap (in excess of US$5bn equity market capitalisation) pan-emerging or developed market stocks from those export-oriented sectors which we argue stand to benefit the most from the emerging market urbanisation theme: metals and mining, construction materials, capital goods and automobiles.
The Credit Suisse HOLT® selection methodology utilises an objective, cash flow based framework for comparing and valuing stocks on a global basis. HOLT makes systematic adjustments to accounting data, enabling companies to be comparable across time, sectors and regions.
From the above universe (out of a total of 360 names) we select 30 stocks based on ranks across three HOLT based categories:
■ Operational Quality (company’s track record of generating cash and managing growth, independent of future expectations);
■ Valuation (stock price warranted by the HOLT DCF framework based on forecast cash flows relative to the stock’s current market price, as well as HOLT valuation multiples)
■ Market sentiment (measured in terms of revisions to forecast CFROI levels and price momentum)
We select the four top scoring stocks from each sector group followed by the 10 highest ranking stocks which are not already included irrespective of their sector, with a limit of five stocks in the consumer and real estate sector groups and a limit of 10 stocks in other sector groups.
Those stocks which have an average trading volume of less than 5 million US dollars per day over the last six month period are excluded. In addition, stocks which have ownership and trading restrictions (for example India and China local listings) are also excluded. The basket is rebalanced semi-annually.
03 April 2012
Emerging Market Research Institute 4
Table of contents Selected emerging and developed market equity plays on urbanisation 3 Executive Summary 5 In 25 years half the world’s people will live in emerging market cities 8 Global urbanisation heat maps 12 Defining the countries in this study 14 A century of urbanisation 15 Urban growth over the next 40 years 17 The relationship between per capita economic growth and urbanisation 19
1. Per capita GDP in urban populations is generally superior to that in rural populations 19 2. Developed economies have comparable rural and urban per capita GDP growth rates while in emerging economies, urban populations exhibit stronger growth 24 3. There is evidence that larger cities have superior per capita GDP 25 4. Rapid urbanisation is usually associated with swift economic expansion 26 5. There is an urbanisation sweet-spot accompanied by peak per capita GDP growth 28 Statistical conclusions 29
Why have some regions urbanised less ‘successfully’ than others? 30 This begs the critical question: How successfully will China and India urbanise? 33 Further conclusions 35 Investment conclusions 35
The outlook for construction growth in urban housing and infrastructure 36 The emerging market consumer theme is linked to urbanisation 48 Education levels and human capital 51 Environmental and health implications 53 China 58 Egypt 59 India 60 Indonesia 61 Nigeria 62 Pakistan 63 Philippines 64 Thailand 65 Vietnam 66
03 April 2012
Emerging Market Research Institute 5
Executive Summary In the hundred years between 1950 and 2050 the global population is undergoing an irreversible structural transition in the way we live. Drawn by the superior economic, lifestyle and social opportunities of urban dwelling, the world’s population is migrating from rural areas—accounting for 70% of global population in 1950—to cities—accounting for 70% of global population by 2050 on United Nations projections. In 2009 the percentage of the planet’s population living in urban areas crossed the 50% threshold while the focus of urbanisation has now switched to developing nations as they rapidly industrialise. After 2020 the UN expects more people to live in cities than rural areas in developing nations and that by 2037, those cities will contain half the world’s total population.
In 2012, the population of the world’s cities will grow by an estimated 65 million people, equal to the population of France, with some 90% of this increase occurring in cities in developing nations as their citizens increasingly view urban migration as a path to prosperity.
There is a stronger, more persistent trend within developing nations for the population to be drawn into increasingly larger urban agglomerations—the proportion of urban population residing in cities of between one million and five million inhabitants and those in ‘megacities’ (10 million plus inhabitants) is growing quickest. Looking at the concentration of urban agglomerations of over one million inhabitants by country, by 2020, China will lead the world with 121, followed by India with 58 and the United States with 46.
The increase in urban population is heavily concentrated in relatively few countries: the 10 largest contributing countries account for a gain of 1.6 billion people over the next 40 years, or 57% of the global total, and of these, only the United States is outside either Non-Japan Asia or Africa. India contributes the highest number (an increase of 511 million people), followed by China (402 million), Nigeria (139 million) and Pakistan (133 million).
Urbanisation continues to represent one of the most significant drivers of growth for the global economy. Typically, as the share of a country’s urban population rises by five percentage points, there is an associated gain in per capita economic activity of 10%. It is critical that both central and local governments of rapidly urbanising countries effectively deliver the necessary policy mix, from urban planning with appropriate levels of investment into infrastructure and affordable housing, to social programmes allowing more balanced income distribution, necessary to ensure that the appropriate level of associated growth potential is unlocked as their populations migrate towards cities.
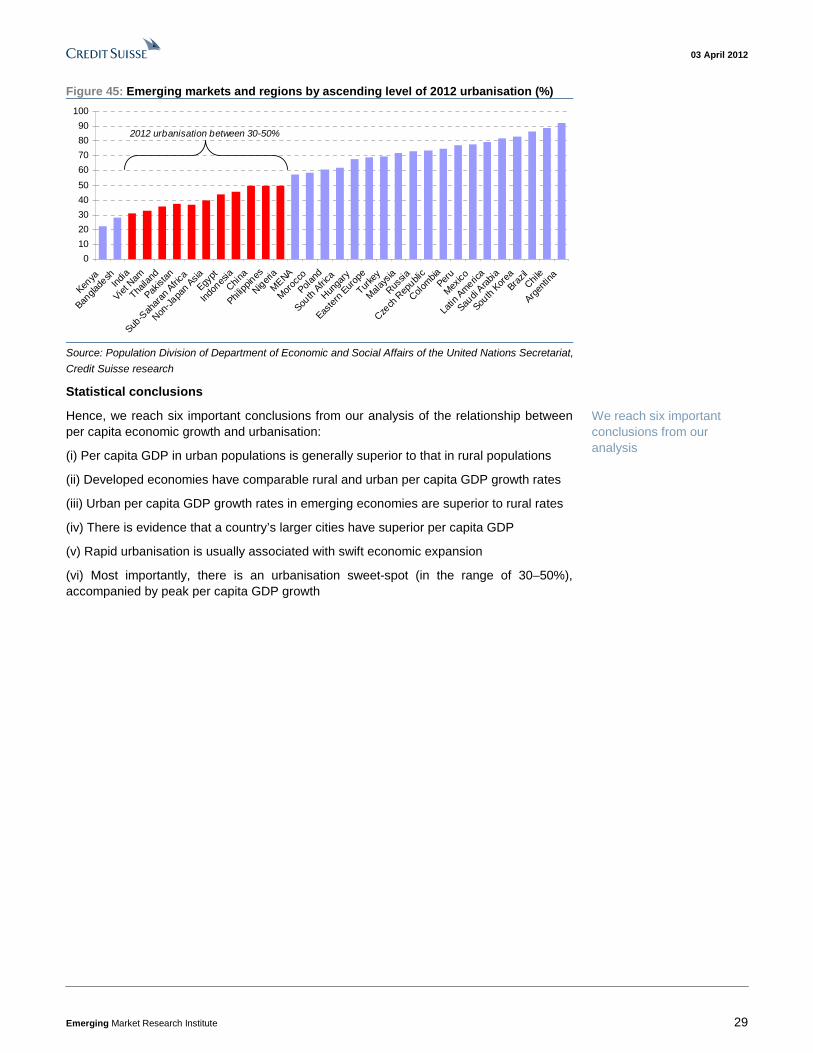
We reach six important conclusions from our analysis of the relationship between per capita economic growth and urbanisation: (i) per capita GDP is generally superior in urban relative to rural populations; (ii) developed economies have comparable rural and urban per capita GDP growth rates; (iii) emerging economies exhibit superior urban versus rural per capita GDP growth rates; (iv) there is evidence that the larger cities in a country have superior per capita GDP; (v) rapid urbanisation is usually associated with very swift economic expansion; and most importantly (vi) there is an urbanisation sweet-spot (30–50%) accompanied by peak per capita GDP growth (typically in excess of 6% in real terms).
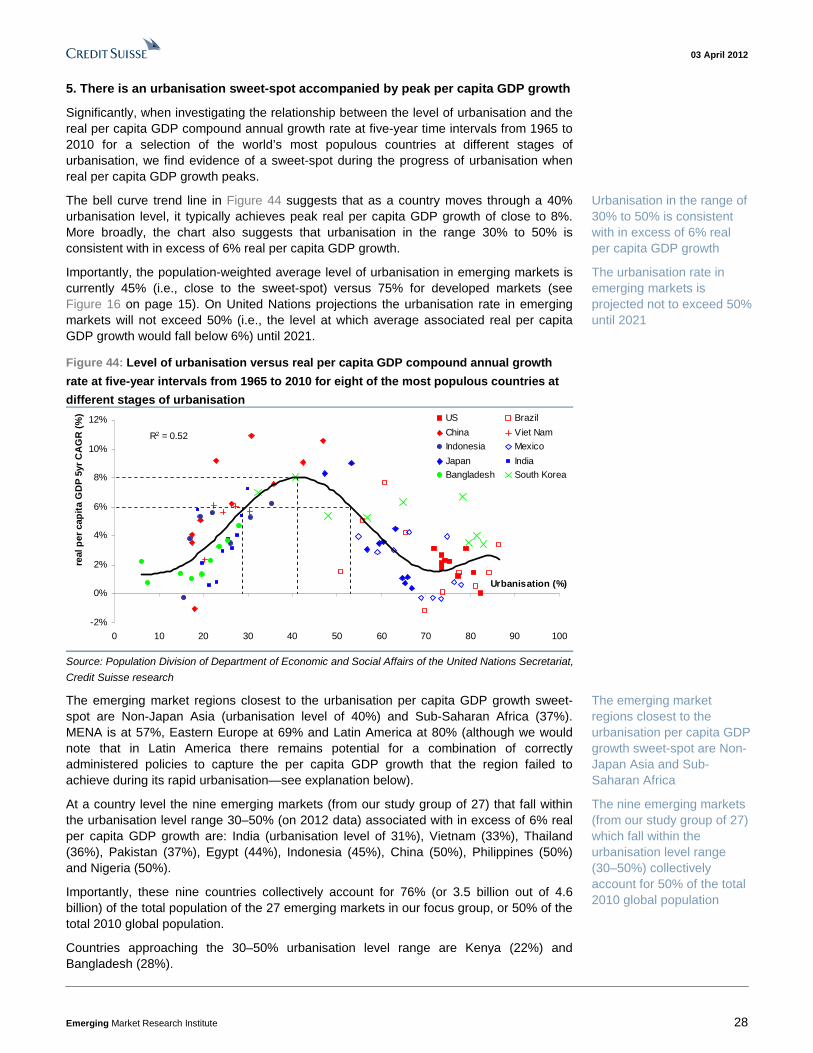
Importantly the population-weighted average level of urbanisation in emerging markets is currently 45% (i.e., within the sweet-spot) versus 75% for developed markets. On United Nations projections the urbanisation rate in emerging markets does not exceed 50% (i.e., the level at which average associated real per capita GDP growth would fall below 6%) until 2021, another decade from now. The emerging market regions closest to the urbanisation per capita GDP growth sweet-spot are Non-Japan Asia (urbanisation level of 40%) and Sub-Saharan Africa (37%).
A century of urbanisation
In 25 years half the world’s population will live in emerging market cities
Urban growth over the next 40 years
The relationship between per capita economic growth and urbanisation
03 April 2012
Emerging Market Research Institute 6
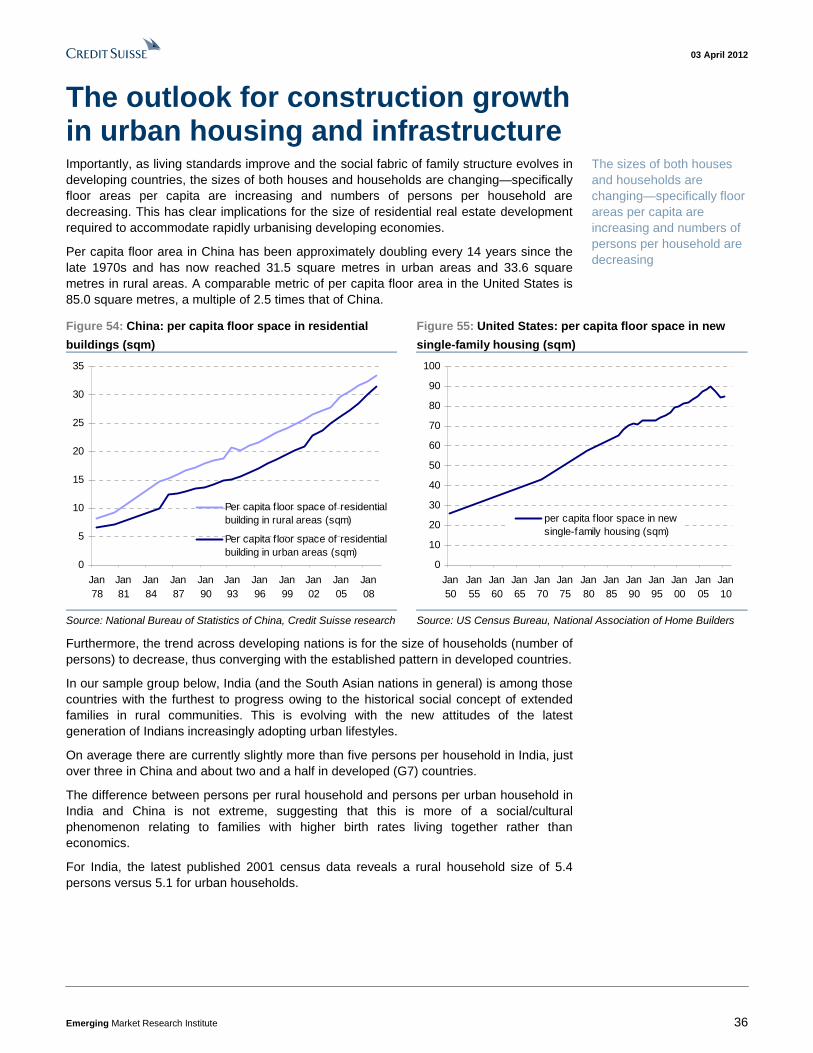
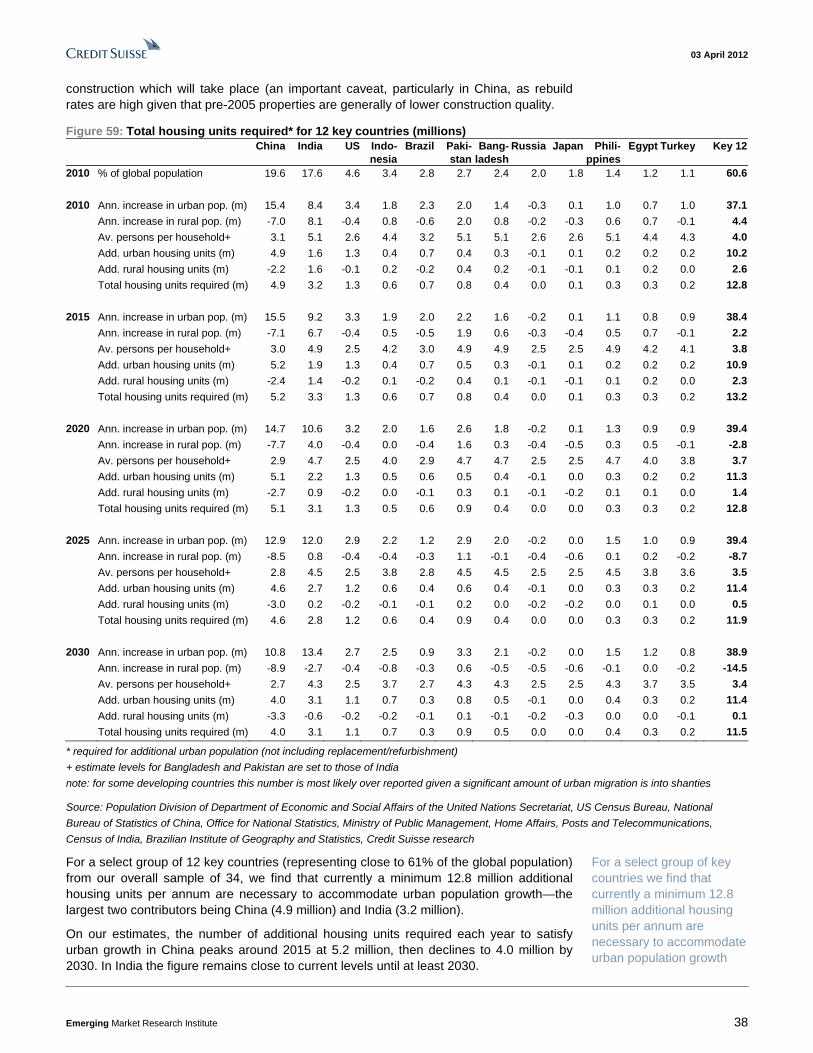
Using projections for both household size (we project convergence of emerging markets ultimately to the stabilised levels of developed markets) and increases in urban population, we are able to approximate the number of additional housing units required to 2030. Importantly though, our estimate only reflects the number of additional housing units which are necessary to accommodate urban population growth and does not include replacement or refurbishment of the existing housing stock: hence it is clearly an underestimation of the total construction which will take place (an important caveat, particularly in China as rebuild rates are high given that pre-2005 properties are generally of lower construction quality). For a select group of 12 key countries (representing close to 61% of the global population) we find that currently, a minimum of 250 million additional units are required for the next two decades until 2030 (assuming no additional demand for replacement and refurbishment). This demand alone equates to an average total of 110 million tonnes of steel and 250 million tonnes of cement per annum.
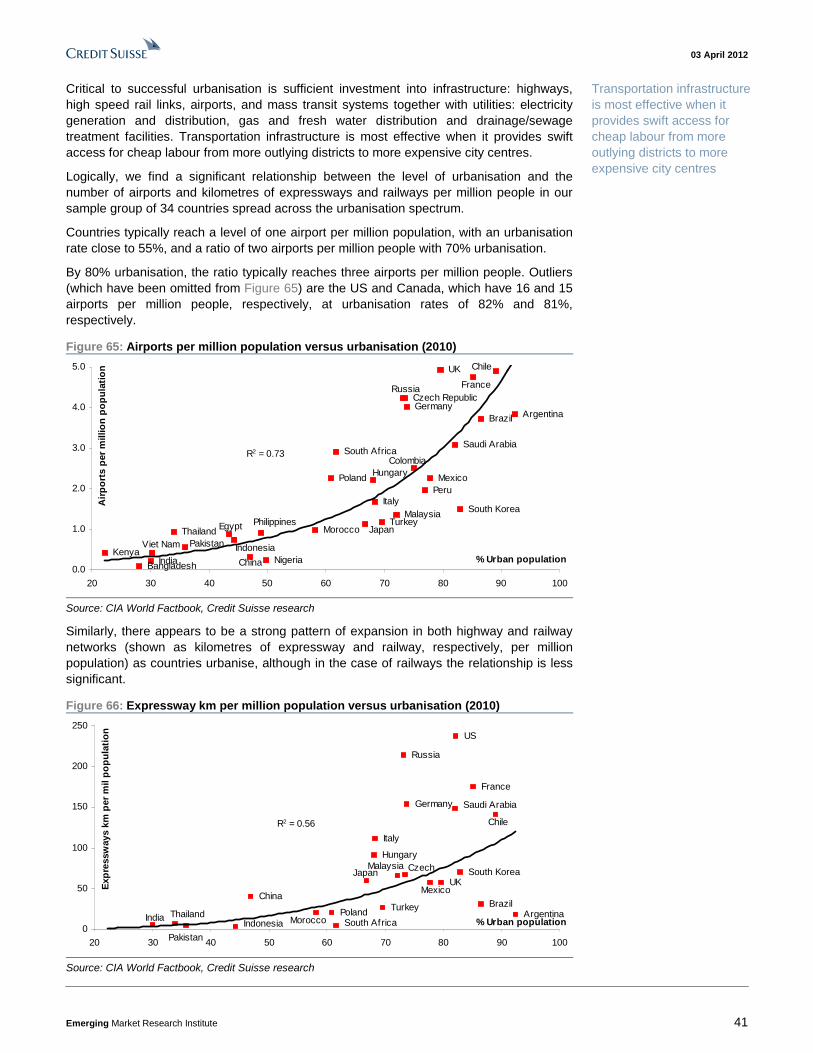
Critical to successful urbanisation is sufficient investment into infrastructure: highways, high speed rail links, airports, and mass transit systems together with utilities: electricity generation and distribution, gas and fresh water distribution and drainage/sewage treatment facilities. Transportation infrastructure is most effective when it provides cheap labour from more outlying districts with swift access to more expensive city centres.
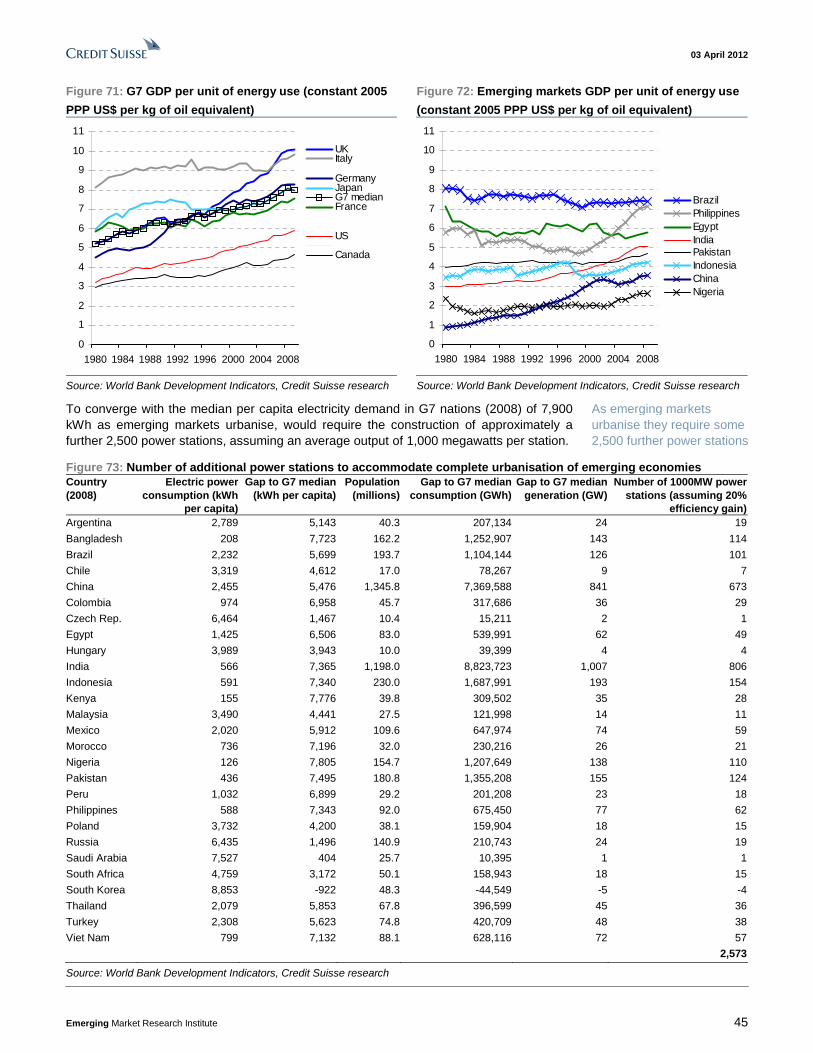
Assuming convergence of the density of infrastructure in emerging economies with that of present day developed nations we can project the demand over the coming decades for additional airports, railways and expressways across our sample of 27 emerging countries. The G7 countries have, on a simple average basis, 3.3 airports, 552 kilometres of railway and 184 kilometres of expressway per million of population, versus a simple average in emerging markets of 1.8 airports, 212 kilometres of railway and 53 kilometres of expressway per million people. A simple assumption that these emerging market ratios converge with those in the G7 would translate into the construction of an additional 11,500 airports, 2.1 million kilometres of railway and 600,000 kilometres of expressway. However, evolution in technology and differences in topography and population dispersion ultimately allows for more efficiently planned and managed infrastructure being developed in emerging economies, which can in many cases be more concentrated than for G7 precedents. Converging with existing emerging market averages would mean an aggregate ‘catch-up’ of relatively under-infrastructured countries building 5,500 airports, 650,000 kilometres of railway and 113,000 kilometres of expressway, albeit with the same caveats on more efficient infrastructure as mentioned above. Moreover, to converge with the median per capita electricity demand in G7 nations (2008) of 7,900 kWh as emerging markets urbanise, would require the construction of approximately a further 2,500 power stations, assuming an average output of 1,000 megawatts per station.
We argue that the best opportunities from the emerging markets urbanisation theme are those related to countries with the following combination of characteristics: (i) large total populations; (ii) a current urbanisation rate of 30–50%; (iii) a low GINI coefficient; (iv) uninterrupted access to capital markets, and (v) preferably a high or rising (i.e., improving) score on the Transparency International Corruption Perceptions Index. Hence, the most effective way for a dedicated emerging markets equity investor to participate in the developing markets urbanisation theme is either: (i) a basket of domestic oriented equity plays in China, Egypt, India, Indonesia, Nigeria, Pakistan, Philippines, Thailand and Vietnam which capture the peak per capita GDP growth rates these countries are delivering, or (ii) a basket of pan-emerging or developed market export oriented equity plays in the relevant sectors to capture the urbanisation theme in the nine countries above (primarily in the sectors of metals and mining, building materials, capital goods, consumer durables, autos).
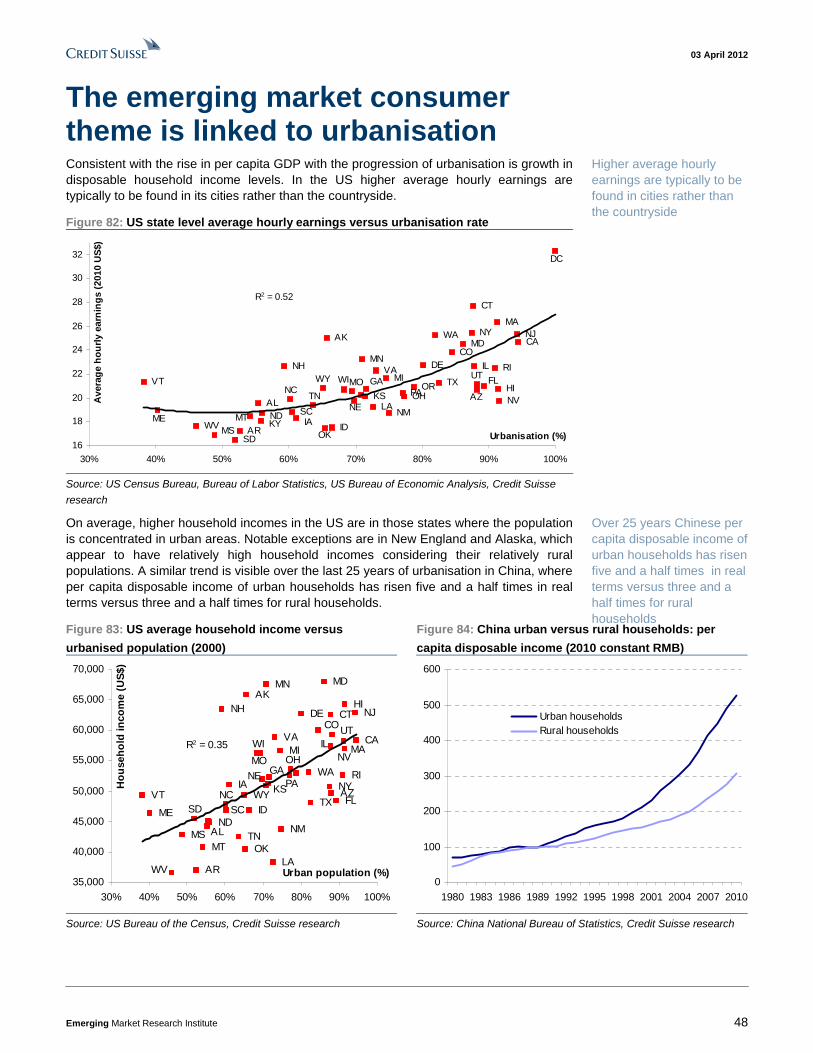
Consistent with the rise in per capita GDP and the progression of urbanisation is growth in disposable household income levels. In the US higher average hourly earnings are found typically in cities rather than in the countryside. A similar trend is visible over the past 25 years of urbanisation in China, where per capita disposable income of urban households
The outlook for construction growth in urban housing and infrastructure
Investment conclusions
The emerging market consumer theme is linked to urbanisation
03 April 2012
Emerging Market Research Institute 7
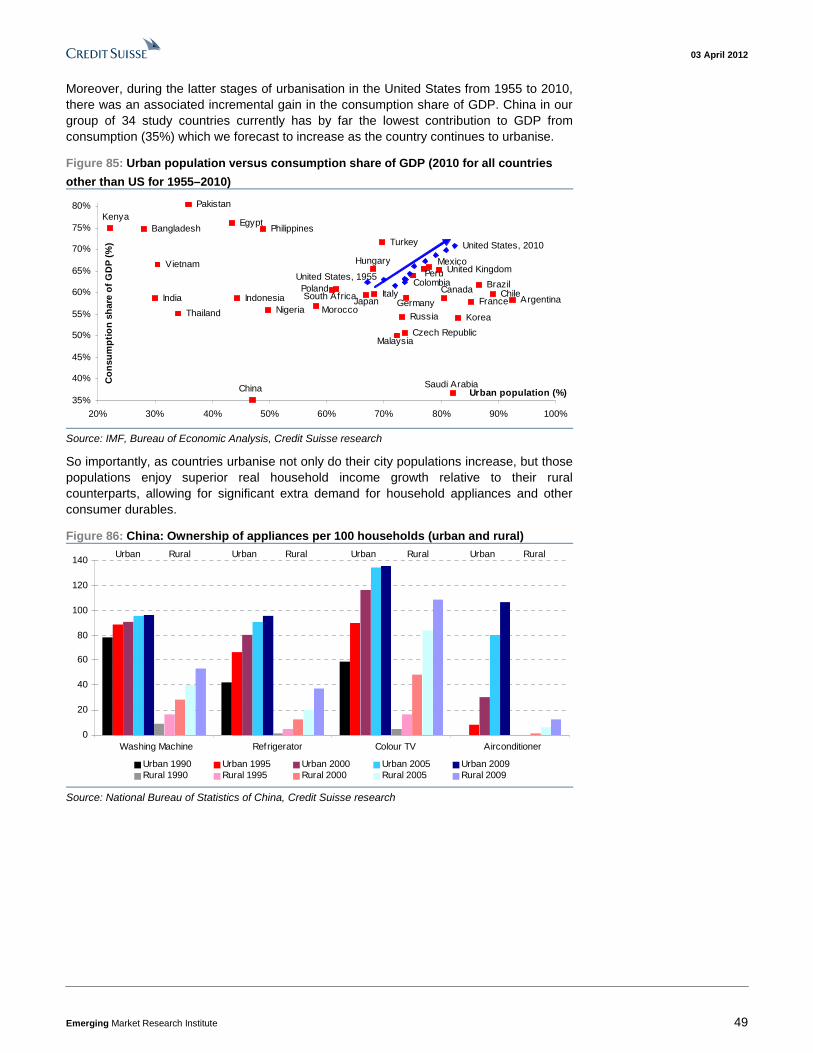
has risen five and a half times in real terms versus three and a half times for rural households. Moreover, during the latter stages of urbanisation in the United States from 1955 to 2010, there was an associated incremental gain in the consumption share of GDP. China, among our group of 34 study countries, currently has by far the lowest contribution to GDP from consumption (35%): we expect this to increase as it continues to urbanise. So importantly, as countries urbanise not only do their city populations tend to increase, but those populations tend to enjoy superior real household income growth relative to their rural counterparts, allowing for significant extra demand for household appliances and other consumer durables.
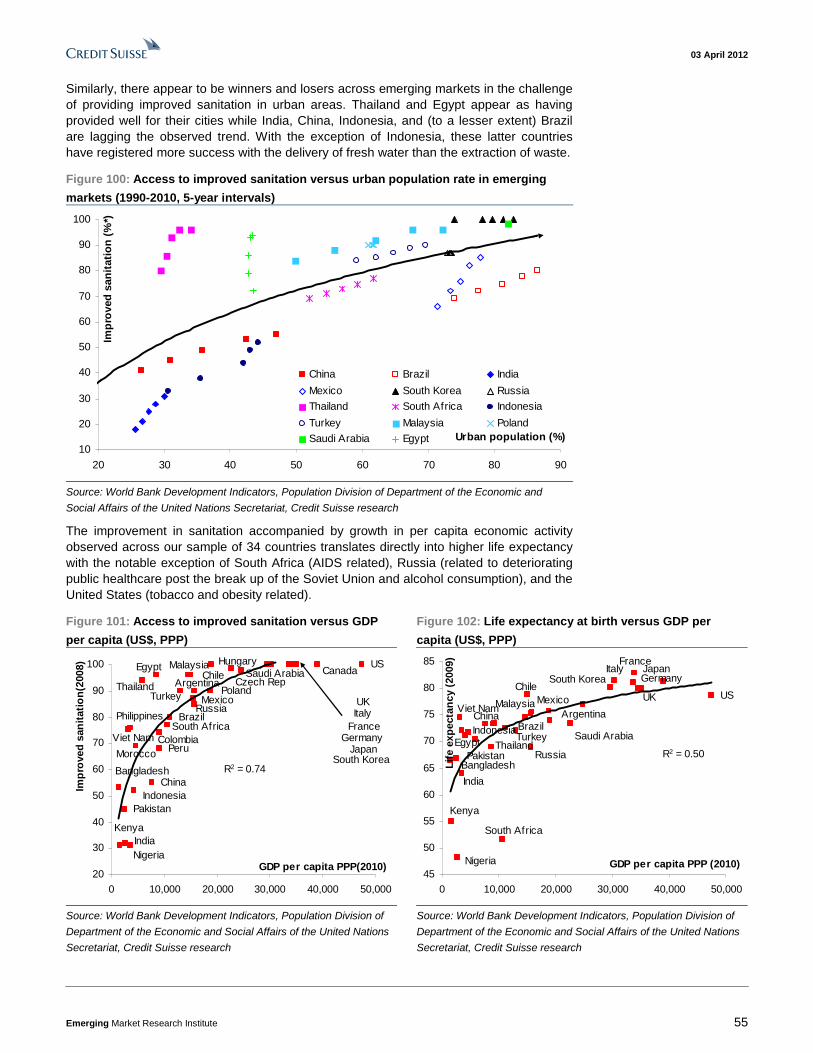
Critical to the growth and development of emerging economies is the strong association between rate of urbanisation and improved levels of education and productivity which, importantly, serve to boost the strength of a nation’s human capital. Typically a 10 percentage point increase in a country’s rate of urbanisation translates into a 10% greater tertiary education enrolment ratio. Growth in human capital delivered via investment in intangible infrastructure (education and research and development) is as critical to a city’s ultimate success as investment in physical infrastructure. As a direct consequence, higher rates of urbanisation are equally associated with greater investment in technology, research and development and thus a shift up in the value chain of economies enabling a higher delivery of per capita patents and trademarks.
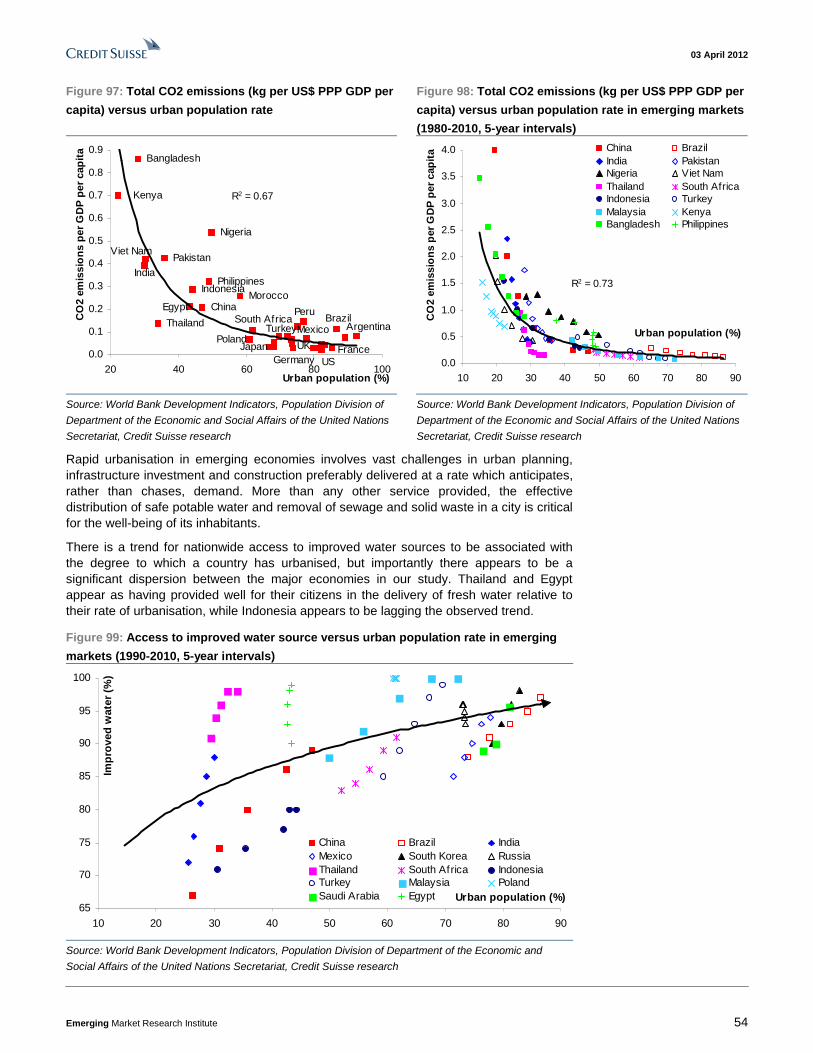
Efficiently planned and managed urban areas can yield significant improvements in the environmental impact of human activity for city dwellers relative to their rural counterparts—we find a strong inverse relationship between transport carbon dioxide emissions per capita and population density. Further evidence of city populations being relatively ‘greener’ than villages arises from the significant relationship between total carbon emissions per capita and urbanisation rate across our group of 34 emerging and developed economies. Striking reductions in per capita emissions are evident in China, Bangladesh, India and Vietnam during their initial phase of urbanisation in the 1980s and 1990s. Critical for the outlook on global emissions of greenhouse gasses will be the urban density which is ultimately achieved in the growing cities of China, India and other developing nations. Will they achieve the density of New York with its low per capita emissions or the higher emissions associated with lower density, more sprawling cities in the US sunbelt?
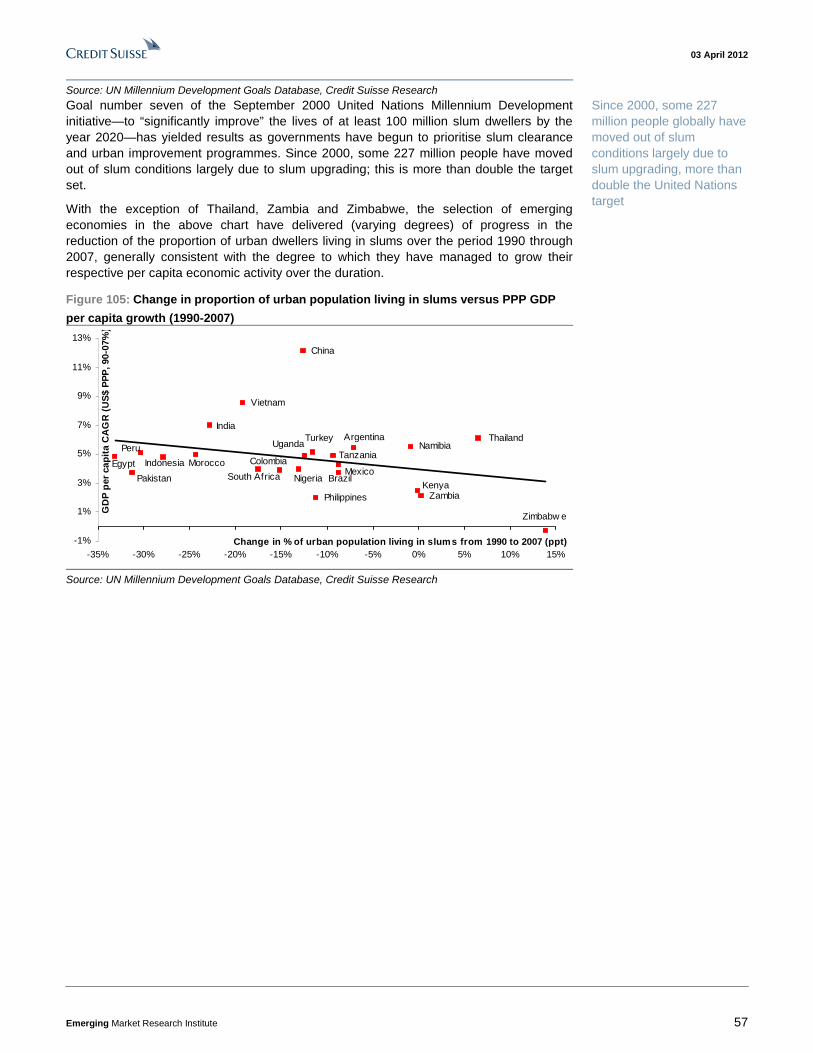
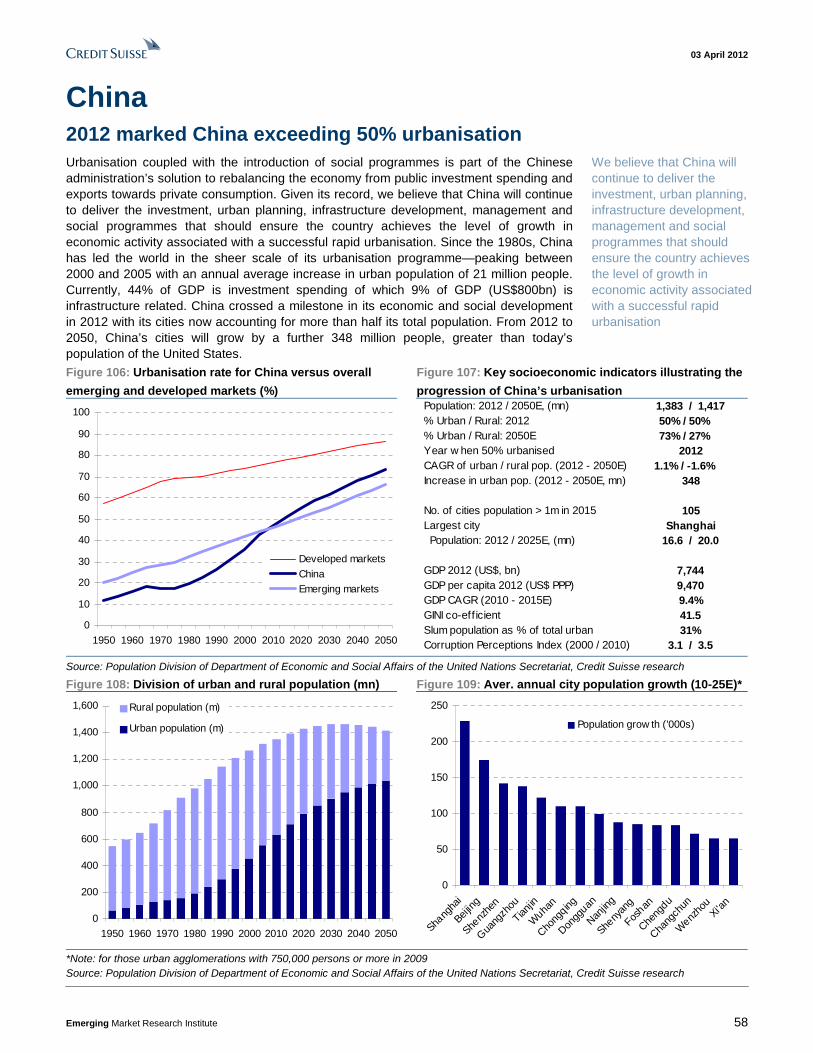
Urbanisation coupled with the introduction of social programmes is part of the Chinese Administration’s solution to rebalancing the economy from public investment spending and exports towards private consumption. Given its record, we believe that China will continue to deliver the investment, urban planning, infrastructure development, management and social programmes that will help it achieve the level of growth in economic activity associated with successful rapid urbanisation. Currently, 44% of GDP is investment spending, of which 9% (US$800bn) is infrastructure related. China has reached a milestone in its economic and social development in 2012, with its cities now accounting for more than half of its total population. From 2012 to 2050 China’s cities are projected to grow by a further 348 million people, more than the current population of the United States.
India will become the world’s most populous nation around 2025 on UN estimates, albeit with an urban population 39% smaller than that of China in the same year. The pace of urbanisation in India is now set to increase significantly, with a 2012–50 compound annual growth rate of 2.1%, double that of China’s. The Ministry of Urban Development estimates the required investment in urban infrastructure at US$800bn over the next 20 years, comprising US$350bn spent on roads and the rest on services including public transport, power, water and sewerage. The ministry, while recognising that India’s economic growth momentum cannot be sustained if urbanisation is not actively facilitated, notes that fundamental reforms in governance including urban planning will be essential to achieving this scale of investment.
Education levels and human capital
Environmental and health implications
China: 2012 marks China exceeding 50% urbanisation
India: Pace of urbanisation now changing up a gear
03 April 2012
Emerging Market Research Institute 8
In 25 years half the world’s people will live in emerging market cities In 2009 the percentage of the planet’s population living in urban1 areas crossed the 50% threshold. Initially a developed market phenomenon (a 50% urbanisation rate had been reached by 1950), the focus of urbanisation has switched to developing nations as they rapidly industrialise. After 2020 more people will also live in cities than rural areas in developing nations and by 2037 those cities will contain half the world’s total population.
Figure 2: World urban and rural population for developed
and developing regions (millions people)
Figure 3: World urban and rural population for developed
and developing regions (% of total)
0
1,000
2,000
3,000
4,000
5,000
6,000
7,000
1950 1970 1990 2010 2030 2050
World urban
Less dev. urban
World rural
Less dev. rural
More dev. urban
More dev. rural
2009
2020
0%
10%
20%
30%
40%
50%
60%
1950 1970 1990 2010 2030 2050
Less dev. urban
Less dev. rural
More dev. urban
More dev. rural
2037
Source: Population Division of Department of Economic and Social
Affairs of the United Nations Secretariat, Credit Suisse research
Source: Population Division of Department of Economic and Social
Affairs of the United Nations Secretariat, Credit Suisse research
This year the population of the world’s cities will grow by a further 65 million people, equal to the population of France, according to United Nations estimates. Of this total, some 90% of the world’s urban population increase will occur in cities in developing nations.
Figure 4: Divide between urban and rural population in
emerging and developed economies (millions)
Figure 5: Average annual increase in urban population for
emerging market regions and developed markets (millions)
Source: Population Division of Department of Economic and Social
Affairs of the United Nations Secretariat, Credit Suisse research
Source: Population Division of Department of Economic and Social
Affairs of the United Nations Secretariat, Credit Suisse research
1 In virtually all nations, official definitions ensure that the urban population includes all settlements with 20,000 or more inhabitants, but governments differ regarding what smaller settlements they include as urban centres – from those that include as urban all settlements with a few hundred inhabitants, to those that include only settlements with 20,000 or more inhabitants.
The focus of urbanisation has switched to developing nations as they rapidly industrialise
03 April 2012
Emerging Market Research Institute 9
The annual increase in the populations of developing nations’ cities will peak around 2035 at about 68 million from 59 million currently, while in developed countries the pace of incremental annual gain is already in structural decline from six million currently to four million by 2035, on UN estimates.
Looking at projections of the population in the world’s 15 largest urban agglomerations in 2025, we note that just two—Tokyo and New York City—are in developed countries.
Figure 6: Population history of the 15 largest urban agglomerations in 2025 (’000s)
0
5,000
10,000
15,000
20,000
25,000
30,000
35,000
40,000
Tokyo
Delhi
Mumba
i
São P
aulo
Dhaka
Mex
ico C
ity
New Y
ork
Kolkata
Shang
hai
Karac
hi
Lago
s
Kinshas
a
Beijing
Man
ila
Bueno
s Aire
s
1950 1960 1970 1980 1990 2000 2010 2020E 2025E
Source: Population Division of the Department of Economic and Social Affairs of the United Nations
Secretariat, Credit Suisse research
None of the projected 25 fastest growing major cities is in a developed country. The cities with the highest estimated 2000–25 compound annual growth rate in population, which had more than five million inhabitants in 2000, are all in Africa and the Indian subcontinent. Of the top 25 fastest growing major cities globally, seven are in China and six are in India.
Figure 7: Forecast population CAGR from 2000–25 for the world’s 25 fastest growing
urban agglomerations with population over five million in 2000 (%)
0
2
4
6
8
10
12
Kinsh
asa
Lago
s
Dhaka
Laho
re
Karac
hi
Shenz
hen
Chong
qingDel
hi
Banga
lore
Bogot
á
Hydera
bad
(India
)
Mumba
i
Chenn
ai
Baghd
ad
Kolka
ta
Beijin
g
Shang
hai
Man
ila
Gua
ngzh
ou
Tianjin
Lim
a
Wuha
n
Ista
nbul
Bangk
okCai
ro
1950-1975 1975-2000 2000-2025E
22.8%
Source: Population Division of the Department of Economic and Social Affairs of the United Nations
Secretariat, Credit Suisse research
Kinshasa, the capital of DR Congo, is projected to incrementally grow its population by more than any other city globally in the period from 2015 to 2020 at a rate of an additional 424,000 people per annum.
The populations of Kolkata, Lagos, Karachi, Mumbai, Dhaka, Delhi and Kinshasa will each rise by between 300,000 and 500,000 people per annum from now until at least 2025, on United Nations estimates. By comparison, the greatest population increase per annum
In 2035 the annual increase in the population of developing nation cities will peak at 68 million
All the projected 25 fastest growing major cities are within developing countries
Kolkata, Lagos, Karachi, Mumbai, Dhaka, Delhi and Kinshasa will incrementally grow their populations more than any other cities globally
03 April 2012
Emerging Market Research Institute 10
over the same period of all developed market cities is expected in New York City, of an average 81,000 people per annum. Hong Kong and Los Angeles are in joint second place, adding an average 61,000 people per annum.
Figure 8: Average incremental annual addition to the population for the fastest growing
cities globally for the three five years periods between 2010 and 2025E (sorted by
descending order of average annual population addition between 2015E to 2020E, ’000s)
0
50
100
150
200
250
300
350
400
450
500
Kinshas
aDel
hi
Dhaka
Mum
bai
Karac
hi
Lago
s
Kolka
ta
Shang
hai
Manila
Laho
re
Beijin
g
Kharto
um
Dar e
s Sala
am
Ho Chi
Minh C
ity
Nairob
i
Cairo
Chenn
ai
Chitta
gong
Banga
lore
Shenz
hen
Guang
zhou
Hydera
bad (
India
)
Baghd
ad
Chong
qing
Tianjin
10-15E 15E-20E 20E-25E
Source: Population Division of the Department of Economic and Social Affairs of the United Nations
Secretariat, Credit Suisse research
In developed markets the distribution of urban population across five ranges of city size (by number of people) is showing evidence of stabilising, with a small majority of the population (53%) living in smaller cities (of fewer than 500,000 people).
In contrast, there is a stronger, more persistent trend within developing nations for the population to be drawn into increasingly larger urban agglomerations—on United Nations projections, by 2015 over half the urban population will live in cities with over 500,000 inhabitants. The proportion of urban population residing in cities of between one million and five million inhabitants and those in megacities (10 million plus inhabitants) is growing at the quickest pace.
Figure 9: Distribution of urban population across city size
in developed markets (% of total urban)
Figure 10: Distribution of urban population across city
size in developing markets (% of total urban)
0%
10%
20%
30%
40%
50%
60%
70%
80%
90%
100%
1950 1960 1970 1980 1990 2000 2010 2020
10m+
5m-10m
1m-5m
500k-1m
<500k
0%
10%
20%
30%
40%
50%
60%
70%
80%
90%
100%
1950 1960 1970 1980 1990 2000 2010 2020
10m+
5m-10m
1m-5m
500k-1m
<500k
Source: Population Division of Department of Economic and Social
Affairs of the United Nations Secretariat, Credit Suisse research
Source: Population Division of Department of Economic and Social
Affairs of the United Nations Secretariat, Credit Suisse research
In developing economies, the proportion of urban populations residing in large cities and megacities (10 million plus) is growing at the quickest pace
03 April 2012
Emerging Market Research Institute 11
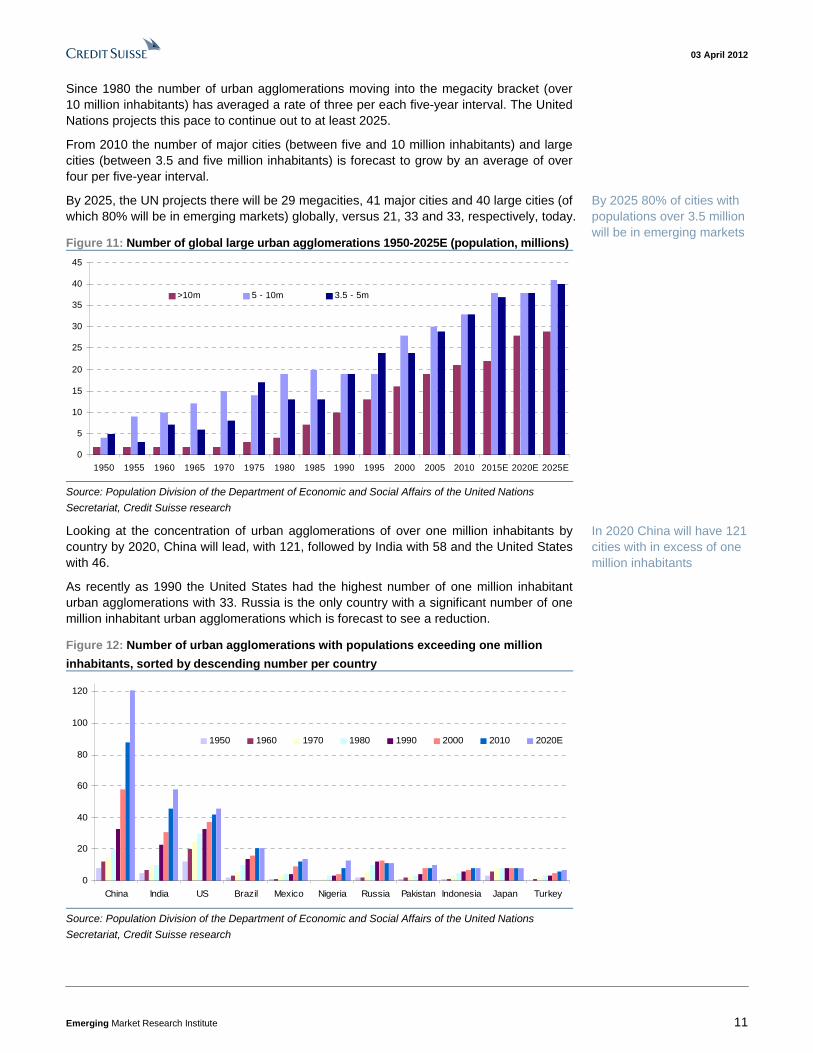
Since 1980 the number of urban agglomerations moving into the megacity bracket (over 10 million inhabitants) has averaged a rate of three per each five-year interval. The United Nations projects this pace to continue out to at least 2025.
From 2010 the number of major cities (between five and 10 million inhabitants) and large cities (between 3.5 and five million inhabitants) is forecast to grow by an average of over four per five-year interval.
By 2025, the UN projects there will be 29 megacities, 41 major cities and 40 large cities (of which 80% will be in emerging markets) globally, versus 21, 33 and 33, respectively, today.
Figure 11: Number of global large urban agglomerations 1950-2025E (population, millions)
Source: Population Division of the Department of Economic and Social Affairs of the United Nations
Secretariat, Credit Suisse research
Looking at the concentration of urban agglomerations of over one million inhabitants by country by 2020, China will lead, with 121, followed by India with 58 and the United States with 46.
As recently as 1990 the United States had the highest number of one million inhabitant urban agglomerations with 33. Russia is the only country with a significant number of one million inhabitant urban agglomerations which is forecast to see a reduction.
Figure 12: Number of urban agglomerations with populations exceeding one million
inhabitants, sorted by descending number per country
0
20
40
60
80
100
120
China India US Brazil Mexico Nigeria Russia Pakistan Indonesia Japan Turkey
1950 1960 1970 1980 1990 2000 2010 2020E
Source: Population Division of the Department of Economic and Social Affairs of the United Nations
Secretariat, Credit Suisse research
By 2025 80% of cities with populations over 3.5 million will be in emerging markets
In 2020 China will have 121 cities with in excess of one million inhabitants
03 April 2012
Emerging Market Research Institute 12
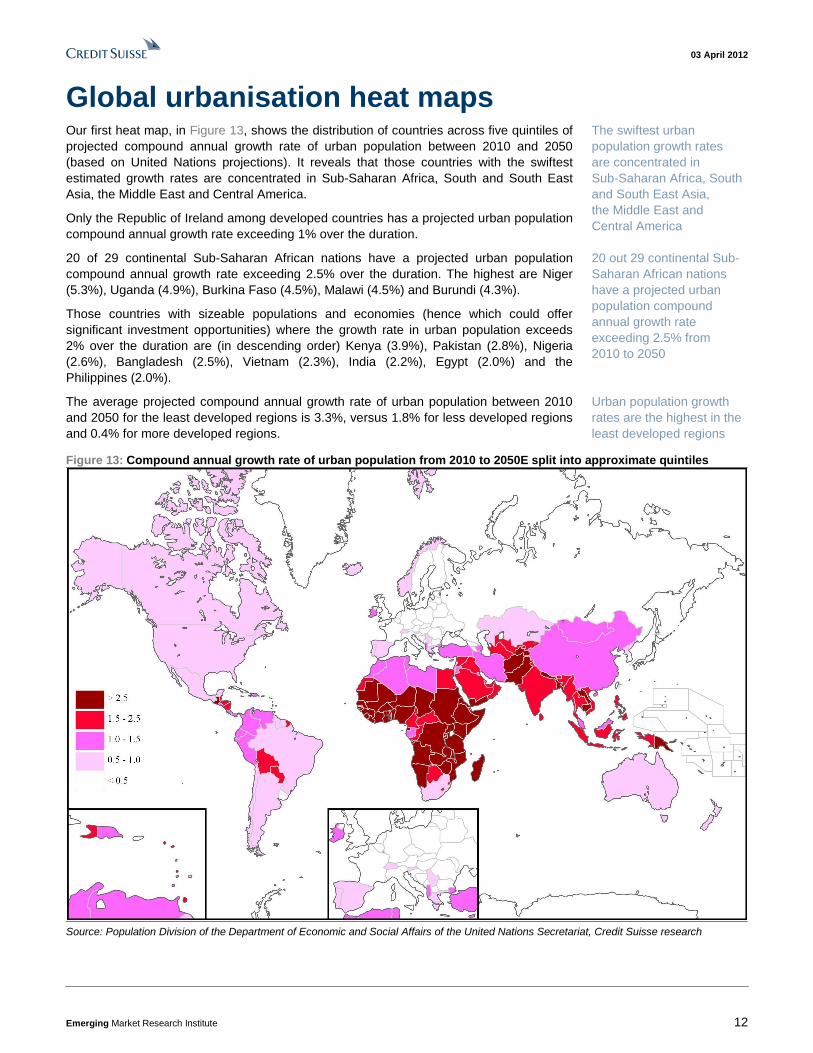
Global urbanisation heat maps Our first heat map, in Figure 13, shows the distribution of countries across five quintiles of projected compound annual growth rate of urban population between 2010 and 2050 (based on United Nations projections). It reveals that those countries with the swiftest estimated growth rates are concentrated in Sub-Saharan Africa, South and South East Asia, the Middle East and Central America.
Only the Republic of Ireland among developed countries has a projected urban population compound annual growth rate exceeding 1% over the duration.
20 of 29 continental Sub-Saharan African nations have a projected urban population compound annual growth rate exceeding 2.5% over the duration. The highest are Niger (5.3%), Uganda (4.9%), Burkina Faso (4.5%), Malawi (4.5%) and Burundi (4.3%).
Those countries with sizeable populations and economies (hence which could offer significant investment opportunities) where the growth rate in urban population exceeds 2% over the duration are (in descending order) Kenya (3.9%), Pakistan (2.8%), Nigeria (2.6%), Bangladesh (2.5%), Vietnam (2.3%), India (2.2%), Egypt (2.0%) and the Philippines (2.0%).
The average projected compound annual growth rate of urban population between 2010 and 2050 for the least developed regions is 3.3%, versus 1.8% for less developed regions and 0.4% for more developed regions.
Figure 13: Compound annual growth rate of urban population from 2010 to 2050E split into approximate quintiles
Source: Population Division of the Department of Economic and Social Affairs of the United Nations Secretariat, Credit Suisse research
The swiftest urban population growth rates are concentrated in Sub-Saharan Africa, South and South East Asia, the Middle East and Central America
20 out 29 continental Sub-Saharan African nations have a projected urban population compound annual growth rate exceeding 2.5% from 2010 to 2050
Urban population growth rates are the highest in the least developed regions
03 April 2012
Emerging Market Research Institute 13
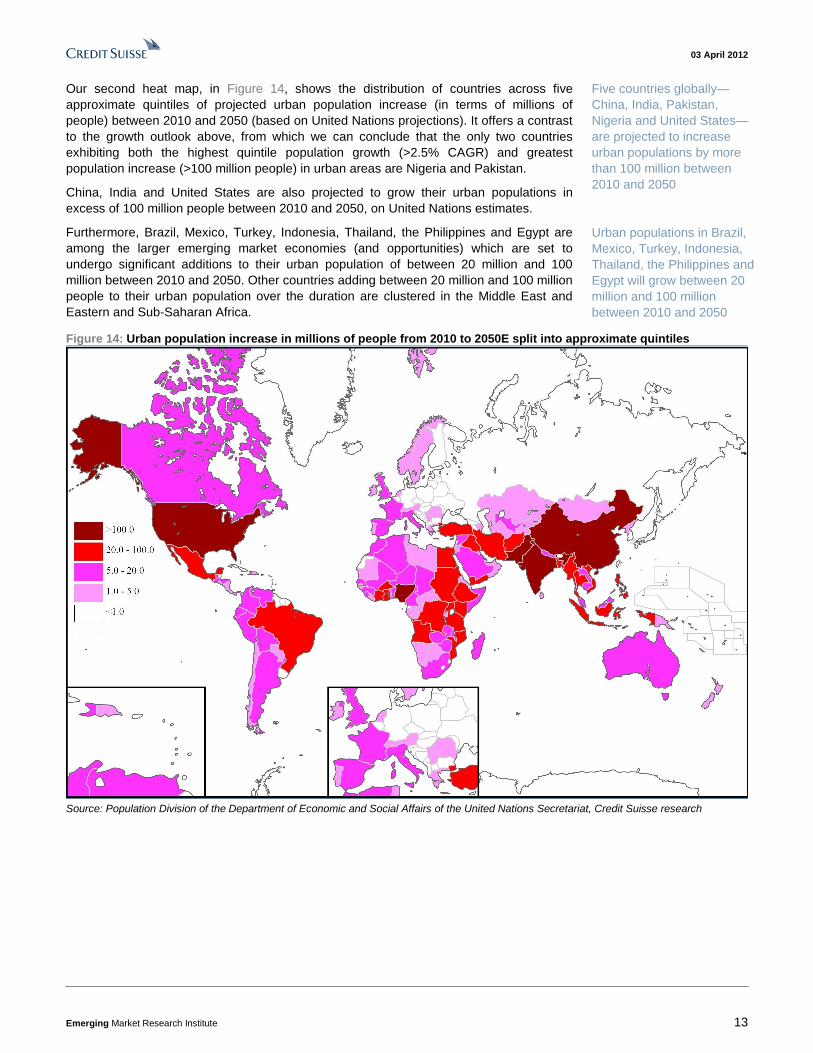
Our second heat map, in Figure 14, shows the distribution of countries across five approximate quintiles of projected urban population increase (in terms of millions of people) between 2010 and 2050 (based on United Nations projections). It offers a contrast to the growth outlook above, from which we can conclude that the only two countries exhibiting both the highest quintile population growth (>2.5% CAGR) and greatest population increase (>100 million people) in urban areas are Nigeria and Pakistan.
China, India and United States are also projected to grow their urban populations in excess of 100 million people between 2010 and 2050, on United Nations estimates.
Furthermore, Brazil, Mexico, Turkey, Indonesia, Thailand, the Philippines and Egypt are among the larger emerging market economies (and opportunities) which are set to undergo significant additions to their urban population of between 20 million and 100 million between 2010 and 2050. Other countries adding between 20 million and 100 million people to their urban population over the duration are clustered in the Middle East and Eastern and Sub-Saharan Africa.
Figure 14: Urban population increase in millions of people from 2010 to 2050E split into approximate quintiles
Source: Population Division of the Department of Economic and Social Affairs of the United Nations Secretariat, Credit Suisse research
Five countries globally—China, India, Pakistan, Nigeria and United States—are projected to increase urban populations by more than 100 million between 2010 and 2050
Urban populations in Brazil, Mexico, Turkey, Indonesia, Thailand, the Philippines and Egypt will grow between 20 million and 100 million between 2010 and 2050
03 April 2012
Emerging Market Research Institute 14
Defining the countries in this study This study focuses on a group of 34 countries: 27 emerging markets and the G7 group of industrialised nations. The emerging markets comprise the MSCI Emerging Markets classification countries and those MSCI Frontier countries that warranted inclusion given their population size and hence overall potential investment opportunity. These 27 countries represent 81% of the total 2010 emerging world population and 87% of free float-adjusted emerging and frontier equity market capitalisation (the only notable omission being Taiwan, which is excluded from the World Bank and UN data set).
Figure 15: UN projected population and urbanisation trends in emerging and developed countries and regions Country/Region Total
Source: Population Division of the Department of Economic and Social Affairs of the United Nations Secretariat, Credit Suisse research
Our study group of 27 emerging markets represents 81% of the total population and 87% of free float-adjusted equity market capitalisation
03 April 2012
Emerging Market Research Institute 15
A century of urbanisation In the hundred years between 1950 and 2050 the global population is undergoing an irreversible structural transition in the way we live. Drawn by the superior economic, lifestyle and social opportunities of urban dwelling, the world’s population is migrating from rural areas—accounting for 70% of global population in 1950—to cities—accounting for 70% of global population by 2050 on United Nations projections.
The process of urbanisation is integral to the development of a modern industrial economy. Initially led by the present day developed economies, it is now the emerging markets that offer the core growth potential in urbanising economies. Less developed regions are projected to urbanise from 45% of their population in 2010 to 66% by 2050 and the least developed regions, from 29% to 55% over the same period on United Nations estimates. In comparison, developed market regions will increase their urbanised population from 75% in 2010 to 86% by 2050.
Geographically, Figure 17 shows that there are wide differences in the degree to which each emerging market region has already urbanised, ranging from 37% in sub-Saharan Africa and 40% in Non-Japan Asia, to 80% in Latin America (as of 2010).
Clearly it is sub-Saharan Africa and Non Japan Asia at the lower end of the urbanised spectrum that have the greatest growth potential reaching 60% and 63%, respectively, by 2050 on United Nations projections.
It is these two growth regions on which we will focus most in this report.
Figure 16: Urbanisation for the world versus regional
development categories (United Nations definition, %)
Figure 17: Urbanisation in emerging market regions (%)
0
10
20
30
40
50
60
70
80
90
100
1950
1960
1970
1980
1990
2000
2010
2020
2030
2040
2050
Moredevelopedregions
World
Lessdevelopedregions
Leastdevelopedregions
0
10
20
30
40
50
60
70
80
90
100
1950
1960
1970
1980
1990
2000
2010
2020
2030
2040
2050
Latin America
EasternEurope
MENA
Non-JapanAsia
Sub-SaharanAfrica
Source: Population Division of Department of Economic and Social
Affairs of the United Nations Secretariat, Credit Suisse research
Source: Population Division of Department of Economic and Social
Affairs of the United Nations Secretariat, Credit Suisse research
Next we look at the same metric (percentage of urbanised population) for the 34 countries included in this study, subdivided into three groups: the G7 countries, those emerging markets where the pace of urbanisation is decelerating, and those emerging markets where the pace of urbanisation remains rapid or is accelerating.
In excess of two thirds of the populations of each of the G7 group of industrialised nations already reside in cities—over 85% in France in 2010—hence this level of current urbanisation coupled with significantly lower overall population growth (with the notable exception of the United States) than in developing economies, equates to lower overall urban growth prospects in developed economies versus their emerging market peers.
The way of life of the global population is undergoing an irreversible structural transition
Less developed regions are projected to urbanise from 45% of their population in 2010 to 66% by 2050 and the least developed regions from 29% to 55% over the same period
The two urban growth regions of sub-Saharan Africa and Non Japan Asia will be our greatest focus in this report
Two thirds of the populations of each of the G7 group of industrialised nations already reside in cities
03 April 2012
Emerging Market Research Institute 16
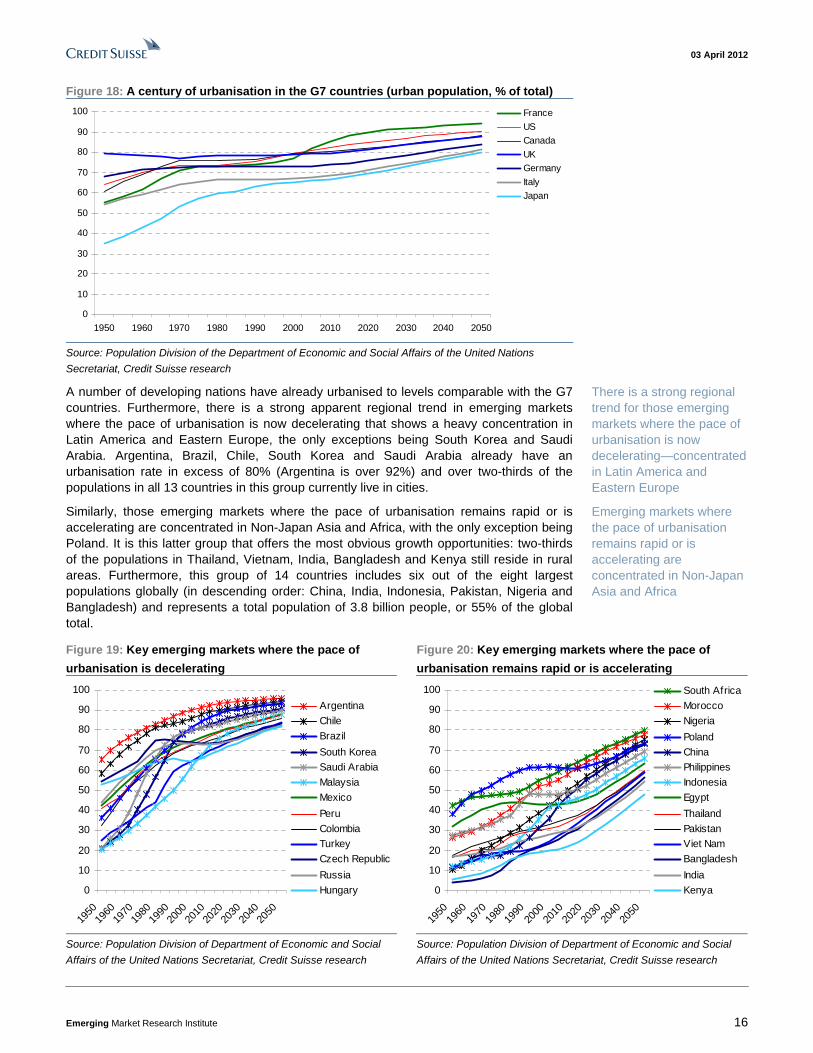
Figure 18: A century of urbanisation in the G7 countries (urban population, % of total)
Source: Population Division of the Department of Economic and Social Affairs of the United Nations
Secretariat, Credit Suisse research
A number of developing nations have already urbanised to levels comparable with the G7 countries. Furthermore, there is a strong apparent regional trend in emerging markets where the pace of urbanisation is now decelerating that shows a heavy concentration in Latin America and Eastern Europe, the only exceptions being South Korea and Saudi Arabia. Argentina, Brazil, Chile, South Korea and Saudi Arabia already have an urbanisation rate in excess of 80% (Argentina is over 92%) and over two-thirds of the populations in all 13 countries in this group currently live in cities.
Similarly, those emerging markets where the pace of urbanisation remains rapid or is accelerating are concentrated in Non-Japan Asia and Africa, with the only exception being Poland. It is this latter group that offers the most obvious growth opportunities: two-thirds of the populations in Thailand, Vietnam, India, Bangladesh and Kenya still reside in rural areas. Furthermore, this group of 14 countries includes six out of the eight largest populations globally (in descending order: China, India, Indonesia, Pakistan, Nigeria and Bangladesh) and represents a total population of 3.8 billion people, or 55% of the global total.
Figure 19: Key emerging markets where the pace of
urbanisation is decelerating
Figure 20: Key emerging markets where the pace of
urbanisation remains rapid or is accelerating
0
10
20
30
40
50
60
70
80
90
100
1950
1960
1970
1980
1990
2000
2010
2020
2030
2040
2050
Argentina
Chile
Brazil
South KoreaSaudi Arabia
Malaysia
Mexico
Peru
ColombiaTurkey
Czech Republic
Russia
Hungary
0
10
20
30
40
50
60
70
80
90
100
1950
1960
1970
1980
1990
2000
2010
2020
2030
2040
2050
South Africa
Morocco
Nigeria
Poland
ChinaPhilippines
Indonesia
Egypt
Thailand
PakistanViet Nam
Bangladesh
India
Kenya
Source: Population Division of Department of Economic and Social
Affairs of the United Nations Secretariat, Credit Suisse research
Source: Population Division of Department of Economic and Social
Affairs of the United Nations Secretariat, Credit Suisse research
There is a strong regional trend for those emerging markets where the pace of urbanisation is now decelerating—concentrated in Latin America and Eastern Europe
Emerging markets where the pace of urbanisation remains rapid or is accelerating are concentrated in Non-Japan Asia and Africa
03 April 2012
Emerging Market Research Institute 17
Urban growth over the next 40 years Between 2010 and 2050 the population of the world’s urban areas will increase by 2.8 billion people. Of this increase the United Nations projects that some 2.6 billion (or 94%) will live in cities in present day emerging markets while 181 million (or 6% of the total) will live in cities in developed economies.
Over the same timeframe, the global rural population is set to decline by 558 million people—by about 474 million (or 85%) in present day emerging markets and about 85 million (or 15%) in developed economies.
By regional development category, the fastest year-on-year growth rates in urban population over the next 40 years come in the least developed and less developed regions, and geographically, in Sub-Saharan Africa, the Middle East and North Africa and Non-Japan Asia.
Figure 21: Forecast urban population growth rates for the
world versus regional development categories (United
Nations definition, year-on-year % change)
Figure 22: Forecast urban population growth rates for
emerging market regions (year-on-year % change)
0.0
1.0
2.0
3.0
4.0
5.0
6.0
1960
1970
1980
1990
2000
2010
2020
2030
2040
2050
Leastdevelopedregions
Lessdevelopedregions
World
Moredevelopedregions
0.0
1.0
2.0
3.0
4.0
5.0
6.0
1960
1975
1990
2005
2020
2035
2050
Sub-SaharanAfrica
MENA
Non-JapanAsia
Latin America
EasternEurope
Source: Population Division of Department of Economic and Social
Affairs of the United Nations Secretariat, Credit Suisse research
Source: Population Division of Department of Economic and Social
Affairs of the United Nations Secretariat, Credit Suisse research
The increase in urban population is heavily concentrated in a relatively small number of countries: the ten countries with the largest contributions account for a gain of 1.6 billion over the next 40 years, or 57% of the global total. Of these ten, only the United States is outside of either Non-Japan Asia or Africa.
India contributes the highest number (an increase of 511 million people), followed by China (402 million), Nigeria (139 million), Pakistan (133 million) and the United States (104 million). Russia’s urban population declines over the same period—by 7 million people on United Nations estimates.
94% of the population growth of the world’s cities from 2010 to 2050 will be in emerging markets
The global rural population is set to decline by 558 million from 2010 to 2050
The ten countries with the largest contributions account for a gain of 1.6 billion over the next 40 years, or 57% of the global total. India’s urban population will grow by 511 million over the duration and China’s by 402 million
03 April 2012
Emerging Market Research Institute 18
Figure 23: Forecast increase in urban population from 2010 to 2050 versus increase
delivered from 1970 to 2010 (millions)
-500
50100
150200
250300
350400
450500
550
India
China
Nigeria
Pakist
an US
Indon
esia
Bangla
desh
Philip
pines
Egypt
Viet N
amBra
zil
Kenya
Turke
y
Mexico
Thaila
nd
Colom
bia
Saudi
Arabia
Malay
sia
Moroc
co UK
South
Africa Per
u
Canad
a
Argen
tina
Franc
eIta
lyChil
e
Czech
Rep
ublic
Hunga
ry
Polan
d
South
Korea
Germ
any
Japa
n
Russia
Urban population increase (70-10, m)
Urban population increase (10-50E, m)
Source: Population Division of the Department of Economic and Social Affairs of the United Nations
Secretariat, Credit Suisse research
Eight of the ten largest contributors to the incremental gain in global urban population are also in the top ten in terms of their compound annual growth rate in urban population over the same 40 year period—i.e., India, Nigeria, Pakistan, Indonesia, Bangladesh, the Philippines, Egypt and Vietnam.
The exceptions are China and the United States, which, despite the large numbers involved, show inferior growth prospects to Kenya and Thailand in our group of 34 countries.
The weakest urban population growth rates in present day emerging markets to 2050 are in Russia, South Korea, Poland, Hungary and the Czech Republic—these are, notably, also the five countries with the highest GDP per capita in our sample of 27 emerging markets.
Figure 24: Urban population compound annual growth
rate forecast from 2010 to 2050 versus growth delivered
from 1970 to 2010 for the highest growth countries (%)
Figure 25: Urban population compound annual growth
rate forecast from 2010 to 2050 versus growth delivered
from 1970 to 2010 for the lowest growth countries (%)
0%
1%
2%
3%
4%
5%
6%
Kenya
Pakist
an
Nigeria
Bangla
desh
Viet N
amIndi
a
Egypt
Philip
pines
Thaila
nd
Indon
esia
Saudi
Arabia
Mor
occo
Mal
aysia
China
Colom
bia
Turke
yPer
u
CAGR (70-10, %)
CAGR (10-50E, %)
-1%
0%
1%
2%
3%
4%
5%
South
Afri
ca
Canad
aUS
Mex
ico
Argen
tina UK
Chile
Brazil
Franc
eIta
ly
Czech
Rep
ublic
Hunga
ry
Polan
d
South
Kor
ea
Germ
any
Japa
n
Russia
CAGR (70-10, %)
CAGR (10-50E, %)
Source: Population Division of Department of Economic and Social
Affairs of the United Nations Secretariat, Credit Suisse research
Source: Population Division of Department of Economic and Social
Affairs of the United Nations Secretariat, Credit Suisse research
The weakest urban population growth rates in present day emerging markets to 2050 are projected in Russia, South Korea, Poland, Hungary and the Czech Republic
03 April 2012
Emerging Market Research Institute 19
The relationship between per capita economic growth and urbanisation Urbanisation continues to represent one of the most significant drivers of growth for the global economy.
It is critical that the central and local governments of rapidly urbanising countries deliver the necessary policy mix—from urban planning with appropriate levels of investment into infrastructure and affordable housing, to social programmes that facilitate more balanced income distribution, necessary to ensure the appropriate unlocking of associated growth potential as populations migrate towards cities.
We explore historical trends in urbanisation using the G7 countries as a helpful precedent to identify those emerging markets which offer the superior growth opportunities given their relative position in the evolution of their cities.
1. Per capita GDP in urban populations is generally superior to that in rural populations
The United States, which has 100 years of detailed urban population census data segmented by state, is a helpful precedent via which to examine the link between the progression of urbanisation and growth in per capita economic activity.
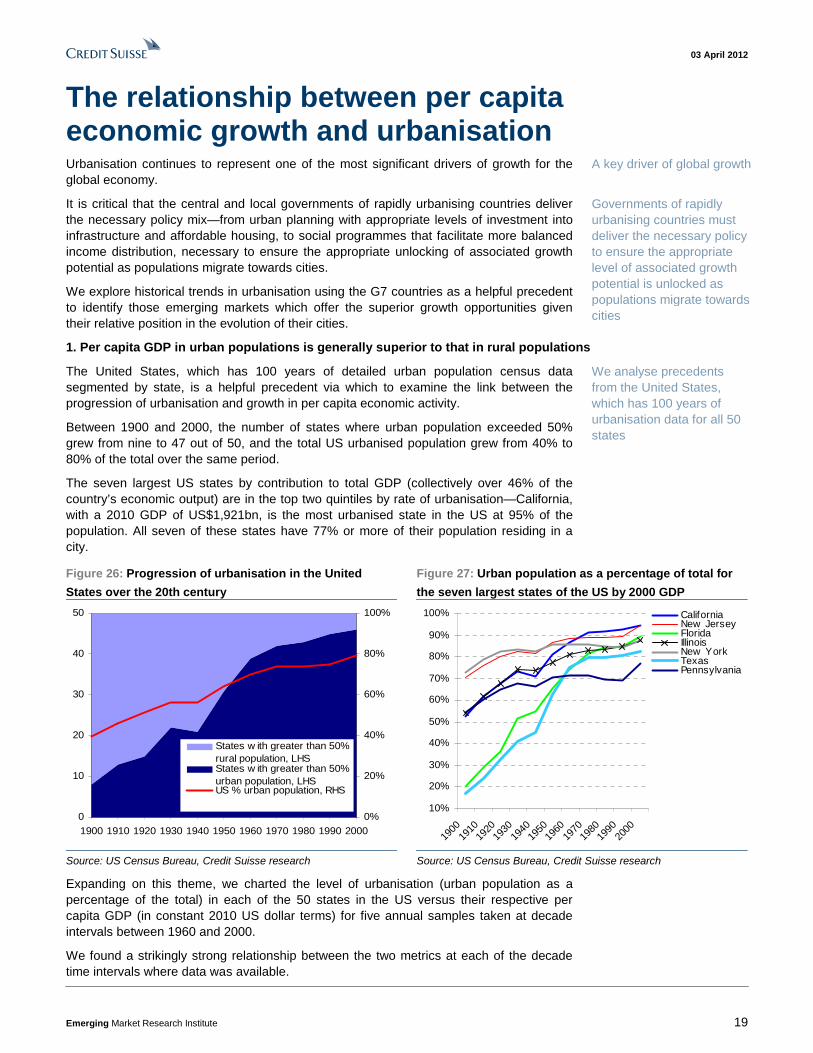
Between 1900 and 2000, the number of states where urban population exceeded 50% grew from nine to 47 out of 50, and the total US urbanised population grew from 40% to 80% of the total over the same period.
The seven largest US states by contribution to total GDP (collectively over 46% of the country’s economic output) are in the top two quintiles by rate of urbanisation—California, with a 2010 GDP of US$1,921bn, is the most urbanised state in the US at 95% of the population. All seven of these states have 77% or more of their population residing in a city.
Figure 26: Progression of urbanisation in the United
States over the 20th century
Figure 27: Urban population as a percentage of total for
Source: US Census Bureau, Credit Suisse research Source: US Census Bureau, Credit Suisse research
Expanding on this theme, we charted the level of urbanisation (urban population as a percentage of the total) in each of the 50 states in the US versus their respective per capita GDP (in constant 2010 US dollar terms) for five annual samples taken at decade intervals between 1960 and 2000.
We found a strikingly strong relationship between the two metrics at each of the decade time intervals where data was available.
A key driver of global growth
Governments of rapidly urbanising countries must deliver the necessary policy to ensure the appropriate level of associated growth potential is unlocked as populations migrate towards cities
We analyse precedents from the United States, which has 100 years of urbanisation data for all 50 states
03 April 2012
Emerging Market Research Institute 20
Figure 28: Urbanisation and economic activity: Urban population versus GDP per capita
for the 50 states of the US at decade intervals between 1960 and 2000 (constant 2010 $)
US Census Bureau, US Bureau of Economic Analysis, Credit Suisse research
Intuitively, there are several key reasons why per capita economic activity in urban areas should be superior to that in less populated areas:
(i) Employment shifts from lower value agricultural labour to higher value, more skilled jobs in manufacturing, services and finance, thus attracting the most talented in the workforce. Cities attract industry and jobs and hence contain the financial and human capital necessary for enhanced technology, research and development.
Charting the progression of employment in the agricultural sector as a percentage of total employment, against the percentage of urbanised population at five-year intervals from 1980 to 2007 (the final data point only being a two-year interval from 2005), shows a corresponding decline in the agricultural workforce as the sector has become increasingly mechanised and the labour force has migrated towards cities in search of work.
The process is reaching its natural conclusion within G7 industrialised nations, led by the UK and US, where less than 1.4% of their respective workforces are now involved in agriculture. Italy and Japan have somewhat further to go on this trend, where close to 4% of their respective labour forces remains in the agricultural sector (given that the constituents of the agricultural mix in Italy and Japan are more labour intensive).
Four key reasons why per capita economic activity in urban areas should be superior to that in less populated areas
03 April 2012
Emerging Market Research Institute 21
Figure 29: Employment in agriculture versus urban population rate in G7 nations (1980-
2007, 5-year intervals)
0
2
4
6
8
10
12
14
55 60 65 70 75 80 85 90
Urban population (%)
Em
plo
ymen
t in
ag
ricu
ltu
re (
% t
ota
l) US Japan
Germany Italy
France UK
Canada
US
Japan
Germany
ItalyFrance
UK
Canada
R2 = 0.53
Source: World Bank Development Indicators, Population Division of Department of the Economic and
Social Affairs of the United Nations Secretariat, Credit Suisse research
Similarly, the trend in developing nations is for the progression of urbanisation to be consistent with a decline in agricultural employment as a percentage of the total workforce.
Saudi Arabia, South Korea, Russia, South Africa and Mexico are already approaching development levels on this metric that are comparable with G7 nations. China, Thailand, Egypt and Indonesia are clearly decades away in their current rate of urbanisation.
Figure 30: Employment in agriculture versus urban population rate in emerging markets
(1980-2007, 5-year intervals)
R2 = 0.65
0
10
20
30
40
50
60
70
20 30 40 50 60 70 80 90
Urban population (%)
Em
plo
ymen
t in
ag
ricu
ltu
re (
% t
ota
l) China BrazilMexico South KoreaRussia Thailand
South Africa IndonesiaTurkey MalaysiaPoland Saudi ArabiaEgypt
Brazil
S Africa
China
Russia S KoreaSaudi Arabia
Mexico
Thailand
Poland
Indonesia
Turkey
Malaysia
Egypt
Source: World Bank Development Indicators, Population Division of Department of the Economic and
Social Affairs of the United Nations Secretariat, Credit Suisse research
(ii) Investment per capita is higher in urban areas: first, big-ticket infrastructure items such as international airports, high speed rail links, highways, broadband capacity, mass transit systems and telecommunications are only economically viable where demand is assured by large populations; and second, foreign direct investment has historically been concentrated within urban areas where there is better access to key infrastructure, financial, legal and consular services, and a talented labour force. These two points combined clearly become self-sustaining.
03 April 2012
Emerging Market Research Institute 22
(iii) There are productivity increases in services and manufacturing together with efficiency gains in distribution and transportation via the economies of scale realised in concentrated population centres.
(iv) The delivery of essential utilities (fresh water supply, drainage, electricity, gas) and social services (healthcare, education, crime prevention, etc) is significantly cheaper in cities than in sparsely populated communities.
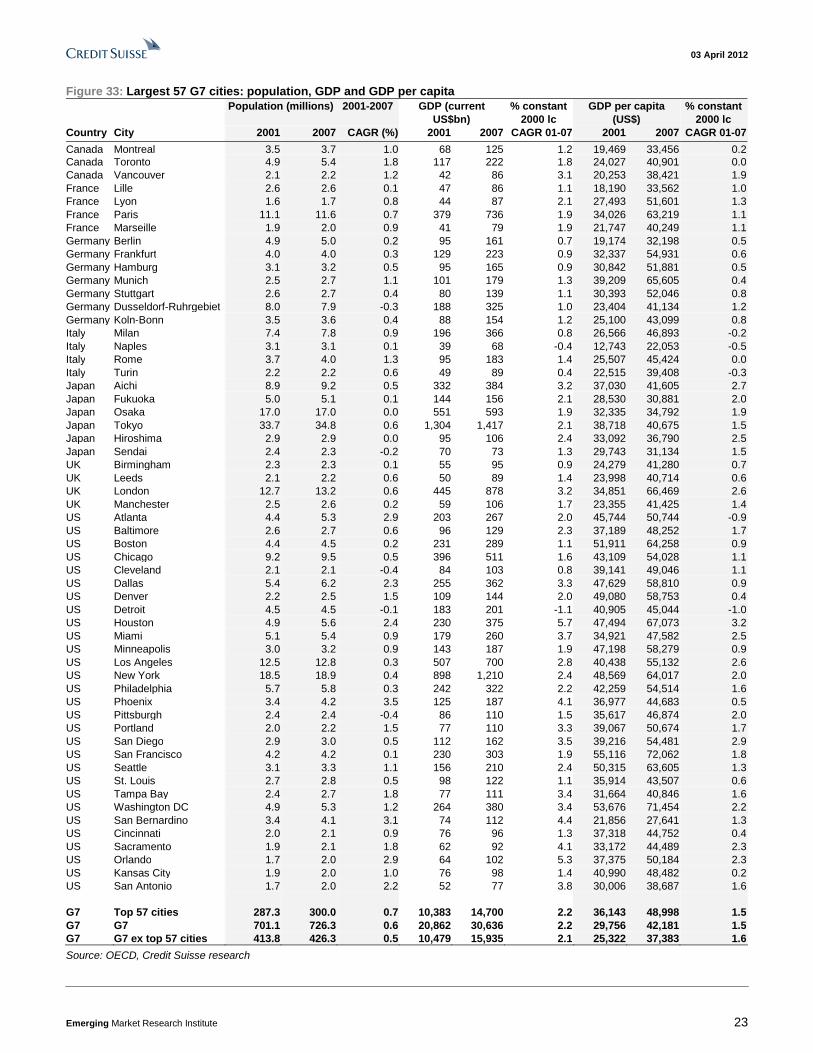
To test this thesis of superior urban per capita economic output we collected population and GDP data by city for the largest metropolitan areas in the G7 industrialised nations (see Figure 33) and China (see Figure 34), from the OECD and China National Bureau of Statistics, respectively. We have used this to make comparisons with national and regional aggregates.
In 2007 (the latest year for which we have all the necessary city level data) some 48.3% of G7 GDP was attributable to 41.3% of the population living in the 57 largest cities. In 2001 the ratio was slightly more pronounced: 48.5% of G7 GDP from 41.0% of the total population.
The G7 countries with the most concentrated economic output from their largest cities are France and the UK. France generates 37.3% of GDP (2007) from just 28.8% of its population living in the largest four cities (Paris, Lille, Marseille and Lyon). The UK generates 40.8% of GDP (2007) from only 33.1% of its population living in the largest four cities (London, Birmingham, Manchester and Leeds).
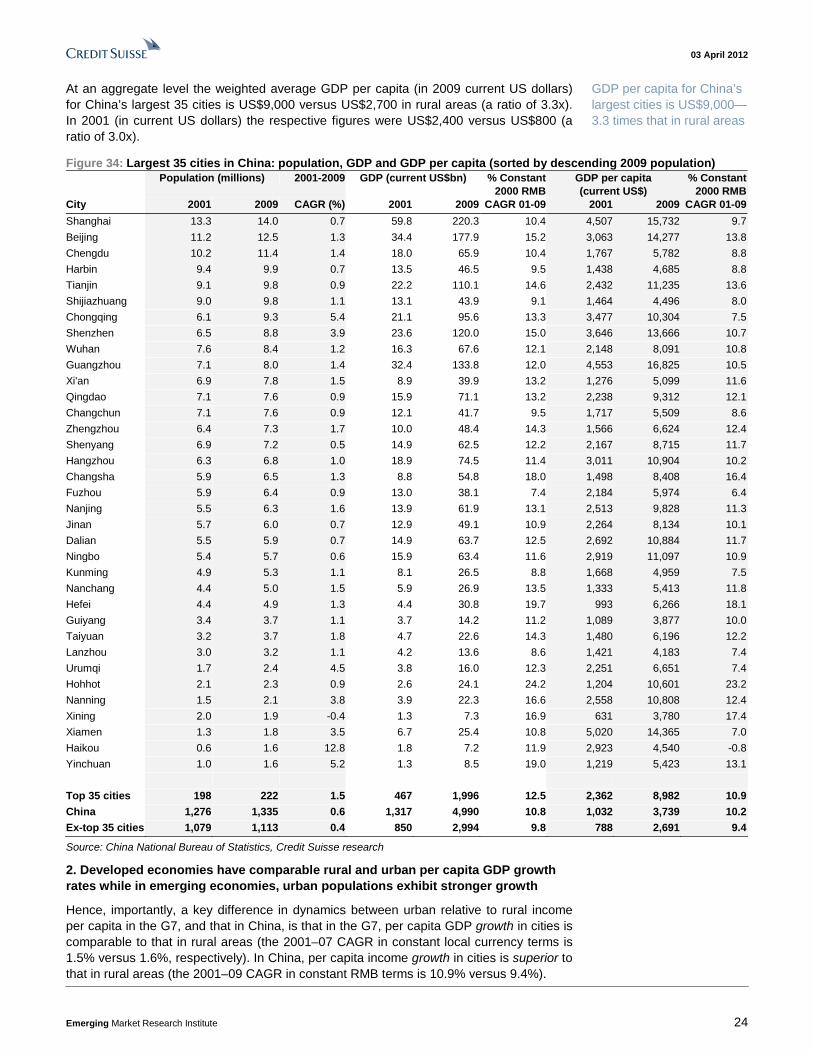
In 2009, China generated some 40.0% of GDP from just 16.6% of its population living in the 35 largest cities. This ratio has trended upwards since 2001, i.e., China’s cities have become even more productive per capita relative to its rural areas. In 2001 the largest 35 cities in China generated 35.4% of the nation’s GDP with 15.5% of its population.
Figure 31: Population and GDP of the G7’s largest 57
cities as a percentage of the G7 group total
Figure 32: Population and GDP of China’s largest 35 cities
as a percentage of the country total
40.0%
40.5%
41.0%
41.5%
42.0%
2000 2001 2002 2003 2004 2005 2006 2007 2008
44%
46%
48%
50%
52%
Population of G7 top 57 cities as % of G7 total (LHS)GDP % contribution of G7 top 57 cities (RHS)
15.0%
15.5%
16.0%
16.5%
17.0%
2001 2002 2003 2004 2005 2006 2007 2008 2009
34%
36%
38%
40%
42%
Population of China top 35 cities as % of total (LHS)GDP % contribution of China top 35 cities (RHS)
Source: OECD, Credit Suisse research Source: China National Bureau of Statistics, Credit Suisse research
At an aggregate level the weighted average GDP per capita (2007) for the G7’s top 57 cities is US$49,000 versus US$37,400 in rural areas.
Once again it is France and the UK that have the greatest urban versus rural income disparity. In France, urban GDP per capita (2007) for the four largest cities is US$55,500 versus US$36,300 in rural areas (a ratio of 1.53x) while in the UK urban GDP per capita (2007) for the four largest cities is US$57,900 versus US$40,300 in rural areas (a ratio of 1.44x).
In 2007 48.3% of G7 GDP was attributable to 41.3% of the population living the 57 largest cities
In 2009 China generated some 40.0% of GDP from just 16.6% of its population living in the 35 largest cities
The weighted average GDP per capita (2007) for the G7’s top 57 cities is US$49,000 versus US$37,400 in rural areas
03 April 2012
Emerging Market Research Institute 23
Figure 33: Largest 57 G7 cities: population, GDP and GDP per capita Population (millions) 2001-2007 GDP (current
US$bn) % constant
2000 lc GDP per capita
(US$) % constant
2000 lc Country City 2001 2007 CAGR (%) 2001 2007 CAGR 01-07 2001 2007 CAGR 01-07
Canada Montreal 3.5 3.7 1.0 68 125 1.2 19,469 33,456 0.2 Canada Toronto 4.9 5.4 1.8 117 222 1.8 24,027 40,901 0.0 Canada Vancouver 2.1 2.2 1.2 42 86 3.1 20,253 38,421 1.9 France Lille 2.6 2.6 0.1 47 86 1.1 18,190 33,562 1.0 France Lyon 1.6 1.7 0.8 44 87 2.1 27,493 51,601 1.3 France Paris 11.1 11.6 0.7 379 736 1.9 34,026 63,219 1.1 France Marseille 1.9 2.0 0.9 41 79 1.9 21,747 40,249 1.1 Germany Berlin 4.9 5.0 0.2 95 161 0.7 19,174 32,198 0.5 Germany Frankfurt 4.0 4.0 0.3 129 223 0.9 32,337 54,931 0.6 Germany Hamburg 3.1 3.2 0.5 95 165 0.9 30,842 51,881 0.5 Germany Munich 2.5 2.7 1.1 101 179 1.3 39,209 65,605 0.4 Germany Stuttgart 2.6 2.7 0.4 80 139 1.1 30,393 52,046 0.8 Germany Dusseldorf-Ruhrgebiet 8.0 7.9 -0.3 188 325 1.0 23,404 41,134 1.2 Germany Koln-Bonn 3.5 3.6 0.4 88 154 1.2 25,100 43,099 0.8 Italy Milan 7.4 7.8 0.9 196 366 0.8 26,566 46,893 -0.2 Italy Naples 3.1 3.1 0.1 39 68 -0.4 12,743 22,053 -0.5 Italy Rome 3.7 4.0 1.3 95 183 1.4 25,507 45,424 0.0 Italy Turin 2.2 2.2 0.6 49 89 0.4 22,515 39,408 -0.3 Japan Aichi 8.9 9.2 0.5 332 384 3.2 37,030 41,605 2.7 Japan Fukuoka 5.0 5.1 0.1 144 156 2.1 28,530 30,881 2.0 Japan Osaka 17.0 17.0 0.0 551 593 1.9 32,335 34,792 1.9 Japan Tokyo 33.7 34.8 0.6 1,304 1,417 2.1 38,718 40,675 1.5 Japan Hiroshima 2.9 2.9 0.0 95 106 2.4 33,092 36,790 2.5 Japan Sendai 2.4 2.3 -0.2 70 73 1.3 29,743 31,134 1.5 UK Birmingham 2.3 2.3 0.1 55 95 0.9 24,279 41,280 0.7 UK Leeds 2.1 2.2 0.6 50 89 1.4 23,998 40,714 0.6 UK London 12.7 13.2 0.6 445 878 3.2 34,851 66,469 2.6 UK Manchester 2.5 2.6 0.2 59 106 1.7 23,355 41,425 1.4 US Atlanta 4.4 5.3 2.9 203 267 2.0 45,744 50,744 -0.9 US Baltimore 2.6 2.7 0.6 96 129 2.3 37,189 48,252 1.7 US Boston 4.4 4.5 0.2 231 289 1.1 51,911 64,258 0.9 US Chicago 9.2 9.5 0.5 396 511 1.6 43,109 54,028 1.1 US Cleveland 2.1 2.1 -0.4 84 103 0.8 39,141 49,046 1.1 US Dallas 5.4 6.2 2.3 255 362 3.3 47,629 58,810 0.9 US Denver 2.2 2.5 1.5 109 144 2.0 49,080 58,753 0.4 US Detroit 4.5 4.5 -0.1 183 201 -1.1 40,905 45,044 -1.0 US Houston 4.9 5.6 2.4 230 375 5.7 47,494 67,073 3.2 US Miami 5.1 5.4 0.9 179 260 3.7 34,921 47,582 2.5 US Minneapolis 3.0 3.2 0.9 143 187 1.9 47,198 58,279 0.9 US Los Angeles 12.5 12.8 0.3 507 700 2.8 40,438 55,132 2.6 US New York 18.5 18.9 0.4 898 1,210 2.4 48,569 64,017 2.0 US Philadelphia 5.7 5.8 0.3 242 322 2.2 42,259 54,514 1.6 US Phoenix 3.4 4.2 3.5 125 187 4.1 36,977 44,683 0.5 US Pittsburgh 2.4 2.4 -0.4 86 110 1.5 35,617 46,874 2.0 US Portland 2.0 2.2 1.5 77 110 3.3 39,067 50,674 1.7 US San Diego 2.9 3.0 0.5 112 162 3.5 39,216 54,481 2.9 US San Francisco 4.2 4.2 0.1 230 303 1.9 55,116 72,062 1.8 US Seattle 3.1 3.3 1.1 156 210 2.4 50,315 63,605 1.3 US St. Louis 2.7 2.8 0.5 98 122 1.1 35,914 43,507 0.6 US Tampa Bay 2.4 2.7 1.8 77 111 3.4 31,664 40,846 1.6 US Washington DC 4.9 5.3 1.2 264 380 3.4 53,676 71,454 2.2 US San Bernardino 3.4 4.1 3.1 74 112 4.4 21,856 27,641 1.3 US Cincinnati 2.0 2.1 0.9 76 96 1.3 37,318 44,752 0.4 US Sacramento 1.9 2.1 1.8 62 92 4.1 33,172 44,489 2.3 US Orlando 1.7 2.0 2.9 64 102 5.3 37,375 50,184 2.3 US Kansas City 1.9 2.0 1.0 76 98 1.4 40,990 48,482 0.2 US San Antonio 1.7 2.0 2.2 52 77 3.8 30,006 38,687 1.6 G7 Top 57 cities 287.3 300.0 0.7 10,383 14,700 2.2 36,143 48,998 1.5 G7 G7 701.1 726.3 0.6 20,862 30,636 2.2 29,756 42,181 1.5 G7 G7 ex top 57 cities 413.8 426.3 0.5 10,479 15,935 2.1 25,322 37,383 1.6
Source: OECD, Credit Suisse research
03 April 2012
Emerging Market Research Institute 24
At an aggregate level the weighted average GDP per capita (in 2009 current US dollars) for China’s largest 35 cities is US$9,000 versus US$2,700 in rural areas (a ratio of 3.3x). In 2001 (in current US dollars) the respective figures were US$2,400 versus US$800 (a ratio of 3.0x).
Figure 34: Largest 35 cities in China: population, GDP and GDP per capita (sorted by descending 2009 population) Population (millions) 2001-2009 GDP (current US$bn) % Constant
Source: China National Bureau of Statistics, Credit Suisse research
2. Developed economies have comparable rural and urban per capita GDP growth rates while in emerging economies, urban populations exhibit stronger growth
Hence, importantly, a key difference in dynamics between urban relative to rural income per capita in the G7, and that in China, is that in the G7, per capita GDP growth in cities is comparable to that in rural areas (the 2001–07 CAGR in constant local currency terms is 1.5% versus 1.6%, respectively). In China, per capita income growth in cities is superior to that in rural areas (the 2001–09 CAGR in constant RMB terms is 10.9% versus 9.4%).
GDP per capita for China’s largest cities is US$9,000—3.3 times that in rural areas
03 April 2012
Emerging Market Research Institute 25
Figure 35: Average GDP per capita for the G7’s largest 57
cities, G7 total and the G7 excluding the largest 57 cities
(current US$ terms PPP)
Figure 36: Average GDP per capita for China’s largest 35
cities, China and China excluding the largest 35 cities
(constant 2000 US$ terms)
25,000
30,000
35,000
40,000
45,000
50,000
2001 2002 2003 2004 2005 2006 2007
G7 top 57 cities per capita GDP (current US$ PPP)G7 per capita GDP (current US$ PPP)G7 ex top 57 cities per capita GDP (current US$ PPP)
0
1,000
2,000
3,000
4,000
5,000
6,000
7,000
8,000
9,000
10,000
2001 2002 2003 2004 2005 2006 2007 2008 2009
China top 35 cities per capita GDP (2009 constant US$)China per capita GDP (2009 constant US$)China ex top 35 cities per capita GDP (2009 constant US$)
Source: OECD, Credit Suisse research Source: China National Bureau of Statistics, Credit Suisse research
3. There is evidence that larger cities have superior per capita GDP
Furthermore, we find evidence that per capita GDP tends to be higher for more populous cities (related to the economies of scale discussed above).
Eight out of ten of the most populous cities in the US (excluding Miami and Philadelphia) all have per capita GDP at similar or significantly higher than average levels for the largest 29 US cities.
Similarly, in China the larger megacities (approaching 10 million or more inhabitants) typically generate per capita GDP at similar or significantly higher than average levels for the 35 largest Chinese cities. Larger cities with access to superior human capital, communications and transport links tend to attract more foreign direct investment.
Figure 37: Per capita GDP for the US, the average for the
largest 29 US cities, and eight of the larger cities in the US
(current US$ terms)
Figure 38: Per capita GDP for China, the average for the
largest 35 cities, and eight of the larger cities in China
(current US$ terms)
35,000
40,000
45,000
50,000
55,000
60,000
65,000
70,000
75,000
2001
2002
2003
2004
2005
2006
2007
2008
Washington DCSan FranciscoHoustonNew YorkBoston
DallasUS top 29 citiesLos AngelesChicago
US
0
2,000
4,000
6,000
8,000
10,000
12,000
14,000
16,000
18,000
2001
2002
2003
2004
2005
2006
2007
2008
2009
GuangzhouShanghai
Beijing
Shenzhen
Tianjin
ChongqingTop 35 cities
Chengdu
Harbin
China
Source: OECD, Credit Suisse research Source: China National Bureau of Statistics, Credit Suisse research
However, the above trend is far from precise. Many other factors play a role in the per capita productivity of urban areas.
03 April 2012
Emerging Market Research Institute 26
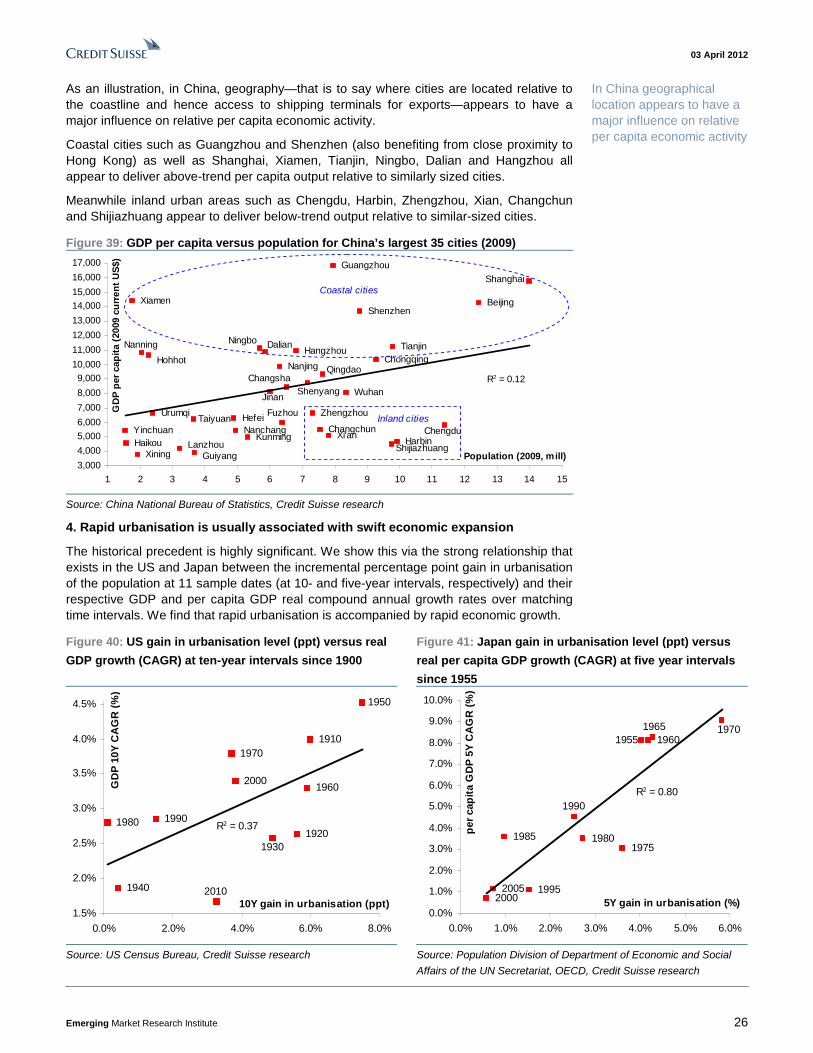
As an illustration, in China, geography—that is to say where cities are located relative to the coastline and hence access to shipping terminals for exports—appears to have a major influence on relative per capita economic activity.
Coastal cities such as Guangzhou and Shenzhen (also benefiting from close proximity to Hong Kong) as well as Shanghai, Xiamen, Tianjin, Ningbo, Dalian and Hangzhou all appear to deliver above-trend per capita output relative to similarly sized cities.
Meanwhile inland urban areas such as Chengdu, Harbin, Zhengzhou, Xian, Changchun and Shijiazhuang appear to deliver below-trend output relative to similar-sized cities.
Figure 39: GDP per capita versus population for China’s largest 35 cities (2009)
Beijing
Tianjin
Shijiazhuang
Taiyuan
Hohhot
Shenyang
Dalian
ChangchunHarbin
Shanghai
Nanjing
HangzhouNingbo
Hefei Fuzhou
Xiamen
Nanchang
Jinan
Qingdao
Zhengzhou
Wuhan
Changsha
Guangzhou
Shenzhen
Nanning
Haikou
Chongqing
Chengdu
Guiyang
Kunming Xi'anLanzhou
Xining
Yinchuan
Urumqi
R2 = 0.12
3,000
4,000
5,000
6,000
7,000
8,000
9,000
10,000
11,000
12,000
13,000
14,000
15,000
16,000
17,000
1 2 3 4 5 6 7 8 9 10 11 12 13 14 15
Population (2009, mill)
GD
P p
er c
apit
a (2
009
curr
ent
US
$)
Coastal cities
Inland cities
Source: China National Bureau of Statistics, Credit Suisse research
4. Rapid urbanisation is usually associated with swift economic expansion
The historical precedent is highly significant. We show this via the strong relationship that exists in the US and Japan between the incremental percentage point gain in urbanisation of the population at 11 sample dates (at 10- and five-year intervals, respectively) and their respective GDP and per capita GDP real compound annual growth rates over matching time intervals. We find that rapid urbanisation is accompanied by rapid economic growth.
Figure 40: US gain in urbanisation level (ppt) versus real
GDP growth (CAGR) at ten-year intervals since 1900
Figure 41: Japan gain in urbanisation level (ppt) versus
real per capita GDP growth (CAGR) at five year intervals
since 1955
2010
2000
19901980
1970
1960
1950
1940
19301920
1910
R2 = 0.37
1.5%
2.0%
2.5%
3.0%
3.5%
4.0%
4.5%
0.0% 2.0% 4.0% 6.0% 8.0%
10Y gain in urbanisation (ppt)
GD
P 1
0Y C
AG
R (
%).
20052000
1995
1990
1985 19801975
1970196519601955
R2 = 0.80
0.0%
1.0%
2.0%
3.0%
4.0%
5.0%
6.0%
7.0%
8.0%
9.0%
10.0%
0.0% 1.0% 2.0% 3.0% 4.0% 5.0% 6.0%
5Y gain in urbanisation (%)
per
cap
ita
GD
P 5
Y C
AG
R (
%)
Source: US Census Bureau, Credit Suisse research Source: Population Division of Department of Economic and Social
Affairs of the UN Secretariat, OECD, Credit Suisse research
In China geographical location appears to have a major influence on relative per capita economic activity
03 April 2012
Emerging Market Research Institute 27
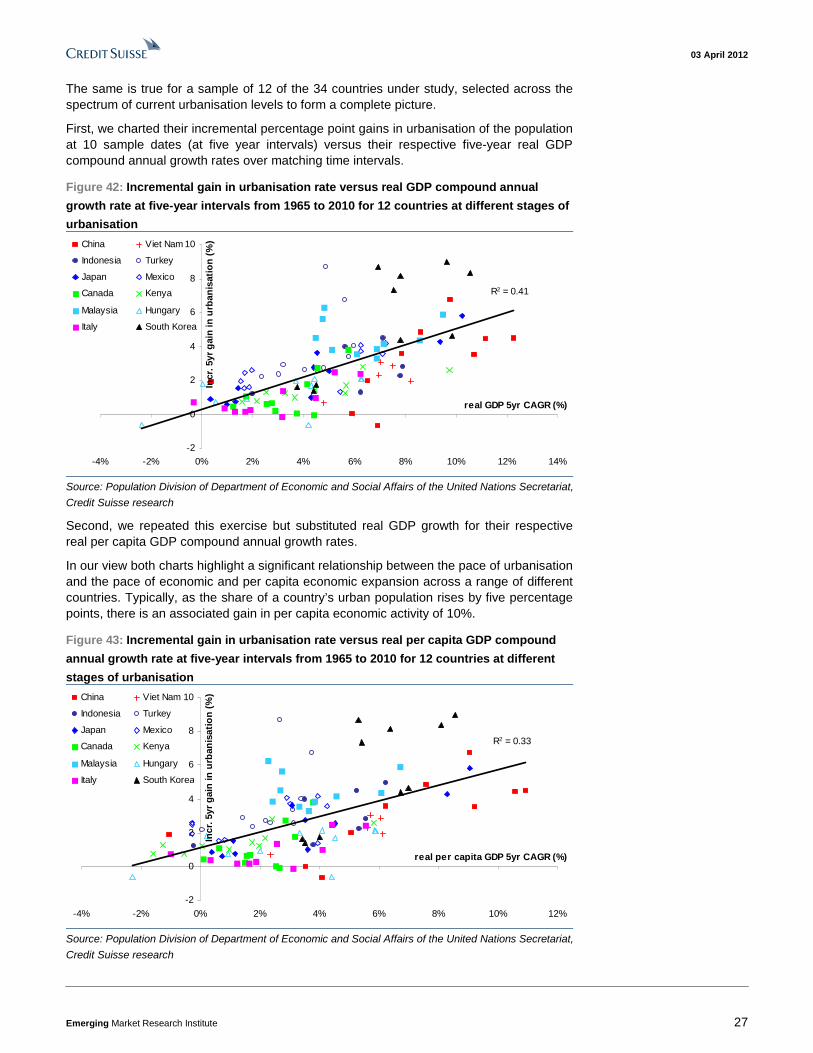
The same is true for a sample of 12 of the 34 countries under study, selected across the spectrum of current urbanisation levels to form a complete picture.
First, we charted their incremental percentage point gains in urbanisation of the population at 10 sample dates (at five year intervals) versus their respective five-year real GDP compound annual growth rates over matching time intervals.
Figure 42: Incremental gain in urbanisation rate versus real GDP compound annual
growth rate at five-year intervals from 1965 to 2010 for 12 countries at different stages of
urbanisation
R2 = 0.41
-2
0
2
4
6
8
10
-4% -2% 0% 2% 4% 6% 8% 10% 12% 14%
real GDP 5yr CAGR (%)
Incr
. 5yr
gai
n in
urb
anis
atio
n (
%)China Viet Nam
Indonesia Turkey
Japan Mexico
Canada Kenya
Malaysia Hungary
Italy South Korea
Source: Population Division of Department of Economic and Social Affairs of the United Nations Secretariat,
Credit Suisse research
Second, we repeated this exercise but substituted real GDP growth for their respective real per capita GDP compound annual growth rates.
In our view both charts highlight a significant relationship between the pace of urbanisation and the pace of economic and per capita economic expansion across a range of different countries. Typically, as the share of a country’s urban population rises by five percentage points, there is an associated gain in per capita economic activity of 10%.
Figure 43: Incremental gain in urbanisation rate versus real per capita GDP compound
annual growth rate at five-year intervals from 1965 to 2010 for 12 countries at different
stages of urbanisation
R2 = 0.33
-2
0
2
4
6
8
10
-4% -2% 0% 2% 4% 6% 8% 10% 12%
real per capita GDP 5yr CAGR (%)
Incr
. 5yr
gai
n in
urb
anis
atio
n (
%)China Viet Nam
Indonesia Turkey
Japan Mexico
Canada Kenya
Malaysia Hungary
Italy South Korea
Source: Population Division of Department of Economic and Social Affairs of the United Nations Secretariat,
Credit Suisse research
03 April 2012
Emerging Market Research Institute 28
5. There is an urbanisation sweet-spot accompanied by peak per capita GDP growth
Significantly, when investigating the relationship between the level of urbanisation and the real per capita GDP compound annual growth rate at five-year time intervals from 1965 to 2010 for a selection of the world’s most populous countries at different stages of urbanisation, we find evidence of a sweet-spot during the progress of urbanisation when real per capita GDP growth peaks.
The bell curve trend line in Figure 44 suggests that as a country moves through a 40% urbanisation level, it typically achieves peak real per capita GDP growth of close to 8%. More broadly, the chart also suggests that urbanisation in the range 30% to 50% is consistent with in excess of 6% real per capita GDP growth.
Importantly, the population-weighted average level of urbanisation in emerging markets is currently 45% (i.e., close to the sweet-spot) versus 75% for developed markets (see Figure 16 on page 15). On United Nations projections the urbanisation rate in emerging markets will not exceed 50% (i.e., the level at which average associated real per capita GDP growth would fall below 6%) until 2021.
Figure 44: Level of urbanisation versus real per capita GDP compound annual growth
rate at five-year intervals from 1965 to 2010 for eight of the most populous countries at
different stages of urbanisation
R2 = 0.52
-2%
0%
2%
4%
6%
8%
10%
12%
0 10 20 30 40 50 60 70 80 90 100
Urbanisation (%)
real
per
cap
ita
GD
P 5
yr C
AG
R (
%) US Brazil
China Viet Nam
Indonesia Mexico
Japan India
Bangladesh South Korea
Source: Population Division of Department of Economic and Social Affairs of the United Nations Secretariat,
Credit Suisse research
The emerging market regions closest to the urbanisation per capita GDP growth sweet-spot are Non-Japan Asia (urbanisation level of 40%) and Sub-Saharan Africa (37%). MENA is at 57%, Eastern Europe at 69% and Latin America at 80% (although we would note that in Latin America there remains potential for a combination of correctly administered policies to capture the per capita GDP growth that the region failed to achieve during its rapid urbanisation—see explanation below).
At a country level the nine emerging markets (from our study group of 27) that fall within the urbanisation level range 30–50% (on 2012 data) associated with in excess of 6% real per capita GDP growth are: India (urbanisation level of 31%), Vietnam (33%), Thailand (36%), Pakistan (37%), Egypt (44%), Indonesia (45%), China (50%), Philippines (50%) and Nigeria (50%).
Importantly, these nine countries collectively account for 76% (or 3.5 billion out of 4.6 billion) of the total population of the 27 emerging markets in our focus group, or 50% of the total 2010 global population.
Countries approaching the 30–50% urbanisation level range are Kenya (22%) and Bangladesh (28%).
Urbanisation in the range of 30% to 50% is consistent with in excess of 6% real per capita GDP growth
The urbanisation rate in emerging markets is projected not to exceed 50% until 2021
The emerging market regions closest to the urbanisation per capita GDP growth sweet-spot are Non-Japan Asia and Sub-Saharan Africa
The nine emerging markets (from our study group of 27) which fall within the urbanisation level range (30–50%) collectively account for 50% of the total 2010 global population
03 April 2012
Emerging Market Research Institute 29
Figure 45: Emerging markets and regions by ascending level of 2012 urbanisation (%)
0
10
20
30
40
50
60
70
80
90
100
Kenya
Bangla
desh
India
Viet N
am
Thaila
nd
Pakist
an
Sub-S
ahar
an A
frica
Non-J
apan
Asia
Egypt
Indon
esia
China
Philip
pines
Nigeria
MENA
Moroc
co
Polan
d
South
Africa
Hunga
ry
Easte
rn E
urop
e
Turke
y
Malay
sia
Russia
Czech
Rep
ublic
Colom
biaPer
u
Mexico
Latin
Americ
a
Saudi
Arabia
South
Korea
Brazil
Chile
Argen
tina
2012 urbanisation between 30-50%
Source: Population Division of Department of Economic and Social Affairs of the United Nations Secretariat,
Credit Suisse research
Statistical conclusions
Hence, we reach six important conclusions from our analysis of the relationship between per capita economic growth and urbanisation:
(i) Per capita GDP in urban populations is generally superior to that in rural populations
(ii) Developed economies have comparable rural and urban per capita GDP growth rates
(iii) Urban per capita GDP growth rates in emerging economies are superior to rural rates
(iv) There is evidence that a country’s larger cities have superior per capita GDP
(v) Rapid urbanisation is usually associated with swift economic expansion
(vi) Most importantly, there is an urbanisation sweet-spot (in the range of 30–50%), accompanied by peak per capita GDP growth
We reach six important conclusions from our analysis
03 April 2012
Emerging Market Research Institute 30
Why have some regions urbanised less ‘successfully’ than others? On 2010 data across our sample of 34 G7 and emerging market countries, we once again find a strong relationship between respective urbanisation rate and the level of PPP-adjusted GDP per capita.
Importantly, however, South American nations appear as outliers. Collectively they appear to be delivering significantly below their potential per capita GDP given their level of urbanisation in comparison to the other countries in the sample. There appears to be a clear pattern given that Argentina, Brazil, Chile, Colombia and Peru (the principal five economies in South America) all appear to have approximately only half the per capita economic activity typically associated with their level of urbanisation given the global trend.
Figure 46: Urban population versus GDP per capita (PPP) (2010)
ChinaIndia
US
Indonesia
Brazil
PakistanBangladesh Nigeria
Russia
Japan
Mexico
Germany
Egypt
TurkeyThailand
FranceUK
Italy
South Africa
South Korea
Colombia
Argentina
Kenya
Poland
Morocco
Peru
Malaysia
Saudi Arabia
Chile
Czech Republic
Hungary
Canada
R2 = 0.68
0
5,000
10,000
15,000
20,000
25,000
30,000
35,000
40,000
45,000
50,000
20 30 40 50 60 70 80 90 100
% Urban population (2010)
GD
P p
er c
apit
a (P
PP
201
0)
South America
G7
Source: World Bank Development Indicators, Population Division of Department of the Economic and
Social Affairs of the United Nations Secretariat, Credit Suisse research
From the section above we have seen how, versus the historical global precedent, the major economies of South America have thus far urbanised with a somewhat disappointing associated gain in per capita economic activity.
Hence we ask:
Why has urbanisation in South American and African countries thus far been characterised by the expansion of favelas and shanties, which governments have only recently begun to tackle?
Why are there clearly exceptions to the conclusions we reached on the previous page?
A clue lies with the most disproportionate distribution of income for any particular geographical group of countries in our sample of 34 G7 and emerging market nations, as measured by the GINI index (where an index level of 0 represents perfect equality and 100 implies perfect inequality).
Government policy to improve income distribution and social mobility appears to be as essential to ensure successful patterns of urbanisation and its associated improvements in living standards, as sufficient infrastructure investment and city planning.
South American nations appear collectively to be delivering significantly below their potential per capita GDP given their level of urbanisation in comparison to other countries
A clue lies with the most disproportionate distribution of income for any particular geographical group of countries in our sample of 34 G7 and emerging market nations
03 April 2012
Emerging Market Research Institute 31
Figure 47: GINI index for G7 and emerging market countries (2005)
20
25
30
35
40
45
50
55
60
Colom
bia
South
AfricaBra
zilChil
e
Mexico
Argen
tinaPer
u
Kenya
United
Stat
es
Philip
pines
Turke
y
Nigeria
Thaila
nd
China
Moroc
co
Malay
sia
Indon
esia
RussiaInd
ia
Poland
Vietna
m
United
Kin
gdom
Bangla
desh
Canad
aIta
ly
Egypt
Japa
n
South
Kor
ea
Pakist
an
Franc
e
Hunga
ry
Germ
any
Czech
Rep
ublic
Source: World Bank Development Indicators, Credit Suisse research
Specifically for Brazil (and South America more broadly), the following were also important contributing factors to an undershoot in potential per capita economic activity during urbanisation:
1. Unlike China’s Hukou system (a countrywide household residency permit registration scheme) there was no restriction on migration into cities.
2. Latin America urbanised rapidly (from a rate of 40% to 60%) during the 1950s to mid 1970s when agri-commodity prices were depressed and the population was pushed (rather than pulled) into cities by lack of opportunities in rural communities as crop prices were so low.
3. Brazil and other Latin American countries operated a land/agricultural oligopoly that suppressed land ownership and forced populations into cities that were ill-prepared for the migration in terms of the infrastructure necessary to support a rapidly rising population and ability to cater for sufficient employment growth.
4. Urbanisation took place in Brazil primarily during three decades of economic mismanagement with hyperinflation.
Figure 48: Agricultural raw materials prices from 1947 Figure 49: Latin America inflation: GDP deflator (annual
%, 1960 through 1980)
4.4
4.6
4.8
5.0
5.2
5.4
5.6
5.8
6.0
6.2
6.4
Apr47
Apr53
Apr59
Apr65
Apr71
Apr77
Apr83
Apr89
Apr95
Apr01
Apr07
0
10
20
30
40
50
60
70
80
90
100CRB Spot Index Foodstuffs (logs, LHS)Latin America urbanisation (%, RHS)
Non-Japan Asia urbanisation (%, RHS)
0
10
20
30
40
50
60
70
80
90
100
1960
1962
1964
1966
1968
1970
1972
1974
1976
1978
1980
Argentina
Brazil
Peru
Chile
Colombia
Source: Commodity Research Bureau, Credit Suisse research Source: World Bank Development Indicators, Credit Suisse research
03 April 2012
Emerging Market Research Institute 32
5. Democracies with sound social mobility programmes were not in place while Latin America was urbanising at the swiftest pace. We note that in China, however, the ability to conduct central planning without democracy has secured a more sustainable rate of urbanisation.
We identify six of the largest emerging markets that urbanised within two contrasting environments of income distribution. Korea, Malaysia and Turkey urbanised while for the most part their GINI coefficients declined (improving equality of income distribution); and Brazil, Mexico and South Africa urbanised while for the most part their GINI coefficients rose (deteriorating equality of income distribution).
Rebasing the PPP-adjusted per capita GDP to the same level for all six countries in 1980 shows the striking difference in per capita economic activity between the two groups. Over 30 years Brazil has grown by 3.2 times, Mexico by 3.8 times and South Africa by 2.5 times.
Meanwhile for those countries where equality of income distribution has improved, per capita GDP growth has been noticeably higher: Korea (11.0 times), Malaysia (6.4 times) and Turkey (7.2 times).
Figure 50: Which way will China and India move?
Progression of urbanisation and GINI index for the larger
emerging market economies from 1960 to 2005
Figure 51: GDP per capita for the larger emerging
economies (PPP, current international $, rebased to 100 in
1980)
25
30
35
40
45
50
55
60
10 20 30 40 50 60 70 80 90
Urban population (%)
GIN
I in
dex
BrazilSouth AfricaMexicoChinaIndiaTurkeyMalaysiaSouth Korea
urbanising with income equality
urbanising with income inequality
China
India
Korea
Turkey
Malaysia
Brazil
Mexico
SA
0
200
400
600
800
1,000
1,200
198019
8219
8419
8619
8819
9019
9219
9419
9619
9820
0020
0220
0420
0620
0820
10
South Korea
Turkey
Malaysia
Mexico
Brazil
South Africa
Source: World Bank Development Indicators, Population Division of
Department of the Economic and Social Affairs of the United Nations
Secretariat, Credit Suisse research
Source: World Bank Development Indicators, Credit Suisse research
Encouragingly, income distribution within the two major Latin American countries has begun to improve structurally—for Brazil this process began once the Lula Administration took power in 2002, with social programmes featuring prominently in his presidential agenda.
In contrast (excluding the latest two data points for China) the momentum in income distribution for China and India for much of the past two decades has been deteriorating. This is a worrying development in our view and needs urgent addressing given the precedent described above of urbanisation taking place during worsening income inequality.
We compare three of the larger emerging markets that have urbanised with declining GINI coefficients over the duration, against three other markets that had rising GINI coefficients while urbanising
03 April 2012
Emerging Market Research Institute 33
Figure 52: GINI Index for Brazil, Mexico, India and China since 1975
20
25
30
35
40
45
50
55
60
65
Jan 75 Jan 80 Jan 85 Jan 90 Jan 95 Jan 00 Jan 05 Jan 10
Brazil
Mexico
China
India
Source: World Bank Development Indicators, Credit Suisse research
This begs the critical question: How successfully will China and India urbanise?
Will they follow the somewhat disappointing precedent of Latin America, or that of Malaysia, Turkey and South Korea, with far greater associated gains in per capita economic activity whilst urbanising?
There are five identifiable important challenges that both central and local governments of rapidly urbanising countries must address in order to ensure that the appropriate level of associated growth potential is unlocked as their populations migrate towards cities:
(i) Investment: The most successful global cities have anticipated the significant necessary public and private funding growth required rather than responding to population growth and being constantly behind the curve. Access to deep capital markets is clearly essential for financing and encouraging private investment and enterprise.
(ii) Urban planning: Efficient urban planning with effective choices for zoning land use with the provision of affordable housing, without which rapidly growing cities develop slum areas. This is essential when urbanisation is particularly rapid as in the case of India and China. Equally, the enforcement of obstructive regulation (such as building height restrictions in Mumbai, India) can be a hindrance rather than a help.
(iii) Infrastructure development: Provision of adequate piped fresh water, sewerage and drainage, electricity and gas utilities, telecommunications and broadband, highways, railways, mass transportation links and airports, public services, education and healthcare.
(iv) Management: Effective execution of town planning, provision of social services and crime prevention is essential in determining a city’s success. Accountable transparent governance at a regional and local/city level is preferable to that by centralised government (a particular challenge for India). Preferably a relatively high or (at a minimum) rising score on the Transparency International Corruption Perceptions Index indicating some progress in the struggle against corruption. Good governance is essential for attracting the human capital and investment (both domestic and foreign) required for a city to prosper.
(v) Social programmes: Essential for the redistribution of income across emerging market populations to avoid urban disintegration between affluent areas and slums.
Five identifiable important challenges that both central and local governments of rapidly urbanising countries must address in order to ensure successful urbanisation
03 April 2012
Emerging Market Research Institute 34
Figure 53: Corruption Perceptions Index (CPI) change for emerging markets from 2000
through 2010
Bangladesh
Brazil
Chile
China
Czech
Egypt
Hungary
IndiaIndonesia
Kenya
Malaysia
Mexico Morocco
NigeriaPakistan
Philippines
Poland
Russia
S. Africa
S. Korea
Thailand
Turkey
Vietnam
Canada
France
Germany
Italy
Japan UKUS
0
2
4
6
8
10
0 2 4 6 8 10
CPI (2000)
CP
I (20
10)
Improvement over 2000 to 2010
Decline over 2000 to 2010
Source: Transparency International, Credit Suisse research
Thus far the pattern in China has been encouraging—relative to India China has a clear structural administrative advantage in controlling the progression of urban migration: the strictly monitored Hukou system of residential permits. This restriction on rapid migration towards cities from China’s vast rural populations has ensured that the formation of sprawling slum areas that has characterised the growth of Indian cities has not materialised to such an extent in China.
Urbanisation remains a key focus of Chinese policy. Li Keqiang—widely assumed to be the successor to premier Wen Jiabao in 2012—has emphasised the importance of accelerating urbanisation as part of China’s economic restructuring in public policy addresses over the past few years. Urbanisation, coupled with the introduction of social welfare programmes in China, is part of the economic solution being adopted to rebalancing the Chinese economy away from public investment spending and export business towards private consumption.
Importantly, the fourth generation of Chinese leadership (the administration of President Hu Jintao and Premier Wen Jiabao) has made the implementation of its “Scientific Development Concept” the key political ideology of its tenure. Essentially, this translates into improving social harmony (read reducing income inequality between the urban and rural population) by extending social programmes with the provision of access to education and healthcare and by introducing a social welfare system (initially pensions and medical insurance with some limited unemployment benefits, cash grants and subsidies on household appliances) to benefit those rural populations left behind by the rapid economic advance of China’s cities.
Given the track record to date, we believe that in China the delivery of investment, urban planning, infrastructure development, management and social programmes will continue to ensure the country achieves the level of growth in economic activity associated with a successful rapid urbanisation of the population.
For India, however, we have some deep reservations. Underinvestment in cities is at critical levels: a McKinsey paper estimates that it is currently just one-eighth of what is necessary. The same April 2010 McKinsey Global Institute report—India’s urban awakening: Building inclusive cities, sustaining economic growth—notes that “today’s policy vacuum risks worsening urban decay and gridlock, a declining quality of life for citizens, and reluctance among investors to commit resources to India’s urban centres”.
It is not too late for India to create economic success from its progression towards an urbanised nation if the government begins immediately to implement the necessary bold
China has a clear structural administrative advantage in controlling the progression of urban migration relative to India
Urbanisation coupled with the introduction of social welfare programmes in China is part of the economic solution to rebalancing the Chinese economy
The current key political ideology is improving social harmony by extending social programmes with the provision of access to education, healthcare and introducing a social welfare system
We believe that China will continue to deliver a successful urbanisation of its population
In India, however, underinvestment in cities leads us to have some deep reservations
03 April 2012
Emerging Market Research Institute 35
policy measures to tackle the underinvestment, poor planning and management, and lack of infrastructure development which have thus far characterised the expansion of its cities.
Already, the Mahatma Gandhi National Rural Employment Guarantee Act, 2005 (NREGA) —the flagship of India’s development policy—is beginning to address many of these concerns. NREGA aims to provide an economic safety net to the rural poor by promising up to 100 days of employment per year per rural household on public works, at minimum wage rates indexed to the rural CPI. The job scheme, which currently covers 619 of India’s 626 districts and has so far employed 44.1 million people, is expected to alleviate rural poverty, help regulate the income of the rural poor given the high seasonality in the agrarian labour market and help create productive rural infrastructure. Also, by providing an alternative source of income, NREGA could help increase agricultural wages if labourers cease to accept wages below the legal minimum.
The programme also has the indirect benefit of easing the pressure on the urban areas already suffering from infrastructure bottlenecks by reducing the rate of ‘distress migration’. Also, the requirement that all wage payments have to be made through banks and post offices should help accelerate progress in financial inclusion.
However, there are concerns about the programme stoking rural food price inflation as farm wages rise, thus pushing many of the beneficiaries back into poverty and perhaps more worryingly, on the irregularities in implementation, with a recent government-sponsored study finding large-scale corruption.
India faces serious challenges if it is to avoid the pitfalls of chaotic urbanisation and the disappointing loss of potential economic growth that failure would mean. This would have implications not just for India but for the global economy.
Further conclusions
Given the evidence above we posit that the best opportunities from the emerging markets urbanisation theme are those related to countries offering the following combination of characteristics:
(i) large total populations
(ii) a current urbanisation rate in the range 30–50%
(iii) a low GINI coefficient
(iv) uninterrupted access to capital markets
(v) preferably a high or rising (i.e., improving) score on the Transparency International Corruption Perceptions Index
Globally, China, Egypt, India, Indonesia, Nigeria, Pakistan, Philippines, Thailand and Vietnam meet these criteria.
Investment conclusions
We conclude that the most effective way for a dedicated emerging markets equity investor to participate in the developing markets urbanisation theme is either:
(i) a basket of domestic-oriented equity plays in China, Egypt, India, Indonesia, Nigeria, Pakistan, Philippines, Thailand and Vietnam which capture the peak per capita GDP growth rates these countries are delivering, or
(ii) a basket of pan-emerging or developed market export-oriented equity plays in the relevant sectors to capture the urbanisation theme in the nine countries above (primarily in the sectors of metals and mining, building materials, capital goods, consumer durables, autos).
India has started to implement social programmes for rural poor helping to ease the pressure on urban areas already suffering from infrastructure bottlenecks by reducing the rate of ‘distress migration’ towards cities
Defining the best opportunities from the emerging markets urbanisation theme
03 April 2012
Emerging Market Research Institute 36
The outlook for construction growth in urban housing and infrastructure Importantly, as living standards improve and the social fabric of family structure evolves in developing countries, the sizes of both houses and households are changing—specifically floor areas per capita are increasing and numbers of persons per household are decreasing. This has clear implications for the size of residential real estate development required to accommodate rapidly urbanising developing economies.
Per capita floor area in China has been approximately doubling every 14 years since the late 1970s and has now reached 31.5 square metres in urban areas and 33.6 square metres in rural areas. A comparable metric of per capita floor area in the United States is 85.0 square metres, a multiple of 2.5 times that of China.
Figure 54: China: per capita floor space in residential
buildings (sqm)
Figure 55: United States: per capita floor space in new
single-family housing (sqm)
0
5
10
15
20
25
30
35
Jan78
Jan81
Jan84
Jan87
Jan90
Jan93
Jan96
Jan99
Jan02
Jan05
Jan08
Per capita f loor space of residentialbuilding in rural areas (sqm)
Per capita f loor space of residentialbuilding in urban areas (sqm)
0
10
20
30
40
50
60
70
80
90
100
Jan50
Jan55
Jan60
Jan65
Jan70
Jan75
Jan80
Jan85
Jan90
Jan95
Jan00
Jan05
Jan10
per capita floor space in newsingle-family housing (sqm)
Source: National Bureau of Statistics of China, Credit Suisse research Source: US Census Bureau, National Association of Home Builders
Furthermore, the trend across developing nations is for the size of households (number of persons) to decrease, thus converging with the established pattern in developed countries.
In our sample group below, India (and the South Asian nations in general) is among those countries with the furthest to progress owing to the historical social concept of extended families in rural communities. This is evolving with the new attitudes of the latest generation of Indians increasingly adopting urban lifestyles.
On average there are currently slightly more than five persons per household in India, just over three in China and about two and a half in developed (G7) countries.
The difference between persons per rural household and persons per urban household in India and China is not extreme, suggesting that this is more of a social/cultural phenomenon relating to families with higher birth rates living together rather than economics.
For India, the latest published 2001 census data reveals a rural household size of 5.4 persons versus 5.1 for urban households.
The sizes of both houses and households are changing—specifically floor areas per capita are increasing and numbers of persons per household are decreasing
03 April 2012
Emerging Market Research Institute 37
Figure 56: Average number of persons per household Figure 57: India: size of urban and rural households at ten
year intervals since 1971
2.0
2.5
3.0
3.5
4.0
4.5
5.0
5.5
6.0
1950
1960
1970
1980
1990
2000
2010
2020
2030
India
Turkey
BrazilChinaUSJapanUK
0
1
2
3
4
5
6
Total Rural Urban
1971 1981 1991 2001
Source: US Census Bureau, National Bureau of Statistics of China,
Office for National Statistics, Ministry of Public Management, Home
Affairs, Posts and Telecommunications, Census of India, Brazilian
Institute of Geography and Statistics, Credit Suisse research
Source: India registrar general and census commissioner, Credit
Suisse research
For China, data on the latest household size is available by province in 2009, revealing the most urbanised provinces (or municipalities) of Beijing, Tianjin, Shanghai and Chongqing (shown in dark shading in Figure 58) have an average household size of 2.7 persons versus the average in other, more rural, provinces of 3.3 persons, with the only outlier being Tibet, at 4.7 persons.
Figure 58: China: Size of household by province
0.0
0.5
1.0
1.5
2.0
2.5
3.0
3.5
4.0
4.5
5.0
Nation
al Ave
rage
Beijin
g
Tian
jin
Heb
ei
Shan
xi
Inne
r Mon
golia
Lia
oning
Jilin
Hei
longj
iang
Shan
ghai
Jian
gsu
Zhe
jiang
Anhu
i
Fuji
an
Jian
gxi
Shan
dong
Hen
an
Hub
ei
Hun
an
Gua
ngdo
ng
Gua
ngxi
Hain
an
Cho
ngqin
g
Sich
uan
Guiz
hou
Yunn
an
Tibe
t
Shaa
nxi
Gan
su
Qing
hai
Nin
gxia
Xinj
iang
North North-WestSouth-WestSouth-CentralEastNorth-East
Note: provinces categorised as municipalities are shaded dark
Source: China National Bureau of Statistics, Credit Suisse research
Using projections for both household size (we project convergence of emerging markets ultimately to the stabilised levels of developed markets) and increases in urban population, we are able to approximate the number of additional housing units required at five-year intervals to 2030.
Importantly though, this number only reflects the additional housing units necessary to accommodate urban population growth and does not include replacement or refurbishment of the existing housing stock—hence it is a clear underestimation of the total
We project convergence of emerging market household sizes ultimately to the stabilised levels of developed markets
03 April 2012
Emerging Market Research Institute 38
construction which will take place (an important caveat, particularly in China, as rebuild rates are high given that pre-2005 properties are generally of lower construction quality.
Figure 59: Total housing units required* for 12 key countries (millions) China India US Indo-
nesia Brazil Paki-
stan Bang-
ladesh Russia Japan Phili-
ppines Egypt Turkey Key 12
2010 % of global population 19.6 17.6 4.6 3.4 2.8 2.7 2.4 2.0 1.8 1.4 1.2 1.1 60.6
2010 Ann. increase in urban pop. (m) 15.4 8.4 3.4 1.8 2.3 2.0 1.4 -0.3 0.1 1.0 0.7 1.0 37.1
Ann. increase in rural pop. (m) -7.0 8.1 -0.4 0.8 -0.6 2.0 0.8 -0.2 -0.3 0.6 0.7 -0.1 4.4
Av. persons per household+ 3.1 5.1 2.6 4.4 3.2 5.1 5.1 2.6 2.6 5.1 4.4 4.3 4.0
Total housing units required (m) 4.0 3.1 1.1 0.7 0.3 0.9 0.5 0.0 0.0 0.4 0.3 0.2 11.5
* required for additional urban population (not including replacement/refurbishment)
+ estimate levels for Bangladesh and Pakistan are set to those of India
note: for some developing countries this number is most likely over reported given a significant amount of urban migration is into shanties
Source: Population Division of Department of Economic and Social Affairs of the United Nations Secretariat, US Census Bureau, National
Bureau of Statistics of China, Office for National Statistics, Ministry of Public Management, Home Affairs, Posts and Telecommunications,
Census of India, Brazilian Institute of Geography and Statistics, Credit Suisse research
For a select group of 12 key countries (representing close to 61% of the global population) from our overall sample of 34, we find that currently a minimum 12.8 million additional housing units per annum are necessary to accommodate urban population growth—the largest two contributors being China (4.9 million) and India (3.2 million).
On our estimates, the number of additional housing units required each year to satisfy urban growth in China peaks around 2015 at 5.2 million, then declines to 4.0 million by 2030. In India the figure remains close to current levels until at least 2030.
For a select group of key countries we find that currently a minimum 12.8 million additional housing units per annum are necessary to accommodate urban population growth
03 April 2012
Emerging Market Research Institute 39
The total for this group of 12 countries peaks at around 13.2 million additional housing units required per annum in 2015 on our estimates but nonetheless the rate remains as high as 11.5 million to at least 2030.
The total number of housing units required for the next two decades until 2030 for this group of 12 countries (representing close to 61% of global population), and assuming no additional demand for replacement and refurbishment, is 250 million units.
According to the Credit Suisse steel and building materials research teams, an average 100 square metre area housing unit (in an apartment block of up to 35 floors) requires 6.5 tonnes of steel and 19 tonnes of cement. For the highest buildings (above 35 floors) the intensity of required steel amounts to 13 tonnes per 100 square metres—and the ratio of very high-rise buildings is rising (developers are keen to maximise profit per footprint of land and city authorities should encourage a high population density in order to benefit from urban economies of scale).
From this we can determine overall steel and cement demand for the additional housing units needed to accommodate the incremental urban population growth across our sample of 12 key countries (not including additional demand for replacement and refurbishment of existing housing—an important caveat as rebuild rates in China are high given that pre-2005 properties are generally of lower construction quality). At the peak demand year of 2015, we find this demand equates to approximately 110 million tonnes of steel and 250 million tonnes of cement per annum.
As an indication—of China’s 2011 total 672 million tonnes of total steel consumption, 25% is used in residential real estate development, 20% in commercial/industrial real estate, 15% in infrastructure projects and 40% in manufacturing/ship building.
Figure 60: Total housing units required* for 12 key countries (millions)
0
1
2
3
4
5
6
China
India US
Indo
nesia
Brazil
Pakist
an
Bangla
desh
Russia
Japa
n
Philipp
ines
Egypt
Turke
y
2010 2015 2020 2025 2030
* required for additional urban population (not including replacement/refurbishment)
Source: Population Division of Department of Economic and Social Affairs of the United Nations Secretariat,
US Census Bureau, National Bureau of Statistics of China, Office for National Statistics, Ministry of Public
Management, Home Affairs, Posts and Telecommunications, Census of India, Brazilian Institute of
Geography and Statistics, Credit Suisse research
The corollary is China’s State Council’s plan to commence construction or renovation by November 2011 of 10 million units of public housing, with a further seven million in 2012, for a total of 36 million public housing units by 2015.
To accommodate China’s orchestrated urbanisation the government is targeting 20% of the forecast 218 million urban households in 2015 residing in publicly subsidised housing, versus the current share of less than 15%.
In relation to property size, the May 2006 restriction (designed to raise the supply of small and medium-sized houses and discourage the building of luxury homes) by the then
We can determine overall steel and cement demand for the additional housing units needed to accommodate the incremental urban population growth (not including additional demand for replacement and refurbishment of existing housing)
The corollary is China’s State Council enormous public sector housing programme
03 April 2012
Emerging Market Research Institute 40
Ministry of Construction, now the Ministry of Housing and Urban-Rural Development, that 70% of new build residential units should have a floor area of less than 90 square metres has in recent years been relaxed in Beijing and Shanghai among other cities.
The average property size (based on our data of urban per capita floor space in residential buildings and size of households) is currently close to 100 square metres, an increase of 64% over the past 15 years.
Hence, the latest measure of residential real estate currently under construction across China of 3.1 billion square metres equates to approximately 31 million individual housing units, and residential real estate floor space completed over the past 12 months of 720 million square metres translates into 7.2 million housing units.
Residential floor space started is, necessarily, accelerating to accommodate increasing demand: in the last 12 months 1.5 billion square metres of projects broke ground, equating approximately to 15.3 million housing units, three times as much as in the 12 months to June 2005. Total real estate investment in China in the last 12 months amounts to RMB4.63trn (US$730bn) for residential and RMB1.82trn (US$289bn) for commercial.
Figure 61: China: real estate floor space under
construction
Figure 62: China: real estate floor space completed
0
500
1,000
1,500
2,000
2,500
3,000
3,500
4,000
4,500
Jan97
Jan99
Jan01
Jan03
Jan05
Jan07
Jan09
Jan11
Residential real estate floor space underconstruction (mill sqm, 12m rolling av.)
Commercial real estate floor space underconstruction (mill sqm, 12m rolling av.)
0
100
200
300
400
500
600
700
800
900
1000
Jan97
Jan99
Jan01
Jan03
Jan05
Jan07
Jan09
Jan11
Residential real estate f loor spacecompleted (mill sqm, 12m trailing total)
Commercial real estate floor spacecompleted (mill sqm, 12m trailing total)
Source: China National Bureau of Statistics, Credit Suisse research Source: China National Bureau of Statistics, Credit Suisse research
Figure 63: China: real estate floor space started Figure 64: China: real estate development investment
0
200
400
600
800
1000
1200
1400
1600
1800
2000
2200
Jan97
Jan99
Jan01
Jan03
Jan05
Jan07
Jan09
Jan11
Residential real estate f loor spacestarted (mill sqm, 12m trailing total)
Commercial real estate floor spacestarted (mill sqm, 12m trailing total)
0
1000
2000
3000
4000
5000
6000
7000
Jan00
Jan01
Jan02
Jan03
Jan04
Jan05
Jan06
Jan07
Jan08
Jan09
Jan10
Jan11
Jan12
Residential real estate developmentinvestment (bn RMB, 12m trailing total)
Commercial real estate developmentinvestment (bn RMB, 12m trailing total)
Source: China National Bureau of Statistics, Credit Suisse research Source: China National Bureau of Statistics, Credit Suisse research
The latest measure of residential real estate under construction across China of 3.1 billion square metres equates to approximately 31 million individual housing units
03 April 2012
Emerging Market Research Institute 41
Critical to successful urbanisation is sufficient investment into infrastructure: highways, high speed rail links, airports, and mass transit systems together with utilities: electricity generation and distribution, gas and fresh water distribution and drainage/sewage treatment facilities. Transportation infrastructure is most effective when it provides swift access for cheap labour from more outlying districts to more expensive city centres.
Logically, we find a significant relationship between the level of urbanisation and the number of airports and kilometres of expressways and railways per million people in our sample group of 34 countries spread across the urbanisation spectrum.
Countries typically reach a level of one airport per million population, with an urbanisation rate close to 55%, and a ratio of two airports per million people with 70% urbanisation.
By 80% urbanisation, the ratio typically reaches three airports per million people. Outliers (which have been omitted from Figure 65) are the US and Canada, which have 16 and 15 airports per million people, respectively, at urbanisation rates of 82% and 81%, respectively.
Figure 65: Airports per million population versus urbanisation (2010)
Argentina
Bangladesh
Brazil
Chile
China
Colombia
Czech Republic
Egypt
Hungary
IndiaIndonesiaKenya
Malaysia
Mexico
Morocco
Nigeria
Pakistan
Peru
Philippines
Poland
Russia
Saudi ArabiaSouth Africa
South Korea
ThailandTurkey
Viet Nam
France
Germany
Italy
Japan
UK
R2 = 0.73
0.0
1.0
2.0
3.0
4.0
5.0
20 30 40 50 60 70 80 90 100
% Urban population
Air
po
rts
per
mill
ion
po
pu
lati
on
Source: CIA World Factbook, Credit Suisse research
Similarly, there appears to be a strong pattern of expansion in both highway and railway networks (shown as kilometres of expressway and railway, respectively, per million population) as countries urbanise, although in the case of railways the relationship is less significant.
Figure 66: Expressway km per million population versus urbanisation (2010)
Pakistan
Indonesia
Brazil
CzechMalaysia
UKMexico
Japan
India Thailand
China
MoroccoPoland
Hungary
South Africa
Turkey
South Korea
Italy
Chile
Saudi ArabiaGermany
France
Russia
US
Argentina
R2 = 0.56
0
50
100
150
200
250
20 30 40 50 60 70 80 90 100
% Urban population
Exp
ress
way
s km
per
mil
po
pu
lati
on
Source: CIA World Factbook, Credit Suisse research
Transportation infrastructure is most effective when it provides swift access for cheap labour from more outlying districts to more expensive city centres
03 April 2012
Emerging Market Research Institute 42
Figure 67: Railway km per million population versus urbanisation (2010)
US
UK
Japan
Italy
GermanyFrance
TurkeyThailand
South Korea
South Africa
Saudi Arabia
RussiaPoland
Morocco
Mexico
MalaysiaKenyaIndonesia
India
HungaryCzech Republic
China
Chile
Brazil
Argentina
R2 = 0.40
0
100
200
300
400
500
600
700
800
900
1000
20 30 40 50 60 70 80 90 100
% Urban population
Rai
lway
s km
per
mill
ion
po
pu
lati
on
Source: CIA World Factbook, Credit Suisse research
Assuming convergence for the density of infrastructure in emerging economies with that of present day developed nations, we can project the demand over the coming decades for additional airports, railways and expressways across our sample of 27 emerging countries.
The G7 countries have, on a simple average basis, 3.3 airports (excluding the United States and Canada—the outliers in Figure 66 and Figure 67), 552 kilometres of railway and 184 kilometres of expressway per million population. This compares with a simple average in emerging markets of 1.8 airports, 212 kilometres of railway and 53 kilometres of expressway per million people.
Assuming (very simplistically) that these emerging market ratios converge with those in the G7 translates into the construction of an additional 11,500 airports, 2.1 million kilometres of railway and 600,000 kilometres of expressway. However, evolution in technology and difference in topography and population dispersion ultimately allows for more efficiently planned and managed infrastructure being developed in emerging economies that can in many cases be more concentrated than for G7 precedents. For instance: airports are becoming larger, acting as more efficient hubs with increasingly larger aircraft; railway signalling has improved over time, allowing for more efficient use of track, and expressways are built with more lanes versus history hence accommodating more traffic per kilometre. Furthermore, unit costs for infrastructure investments have risen considerably in real terms over the past two to three decades reflecting (a) much tighter safety standards, and (b) improved yet expensive technology—for instance high speed railway track is far more costly to construct.
Converging with existing emerging market averages would mean an aggregate ‘catch-up’ of relatively under-infrastructured countries, building 5,500 airports, 650,000 kilometres of railway and 113,000 kilometres of expressway, albeit with the same caveats on more efficient infrastructure mentioned above.
Assuming (simplistically) that emerging market infrastructure per capita ratios converge with those in the G7 would translate into the construction of an additional 11,500 airports, 2.1 million kilometres of railway and 600,000 kilometres of expressway
03 April 2012
Emerging Market Research Institute 43
Figure 68: Key infrastructure intensity metrics for emerging countries versus G7 (2010) 2010 Airports* Airports* Airports* Railways Railways Railways Expressway Expressway Expressway
% Urban / million gap to EM gap to G7 km / million gap to EM gap to G7 km / million gap to EM gap to G7
Country Population population simple av. simple av. population simple av. simple av. population simple av. simple av.
Total 5,469 11,531 656,743 2,122,286 113,045 597,653
Canada 80.6 15.2 1,377.6 501.6
France 85.2 4.7 466.4 174.9
Germany 73.8 4.0 510.6 154.1
Italy 68.4 1.7 328.3 111.5
Japan 66.8 1.1 208.2 59.5
UK 79.6 4.9 265.8 56.9
US 82.3 16.4 712.8 236.9
Weighted Av. 76.5 3.0 ̂ 545.9 179.3
Simple Av. 76.7 3.3 ̂ 552.0 184.3
* with paved surfaces
^ excluding the United States and Canada
Source: CIA World Factbook, Credit Suisse research
03 April 2012
Emerging Market Research Institute 44
As countries industrialise and urbanise the per capita electricity demand increases significantly. From 1960 to 2008 the average per capita increase in demand for G7 countries was 350% or a compound annual growth rate of 3.1%.
Figure 69: Electricity consumption per capita versus urban population rate in G7 nations
(1960-2008, 5-year intervals)
0
2
4
6
8
10
12
14
10 20 30 40 50 60 70 80 90
Urban population (%)
Ele
ctri
city
co
nsu
mp
tio
n (
mW
h/c
apit
a) US Japan
Germany Italy
France UK
Canada
US
Japan
Germany
Italy
France
UK
Canada
G7 's' curve
Source: World Bank Development Indicators, Population Division of Department of the Economic and
Social Affairs of the United Nations Secretariat, Credit Suisse research
Juxtaposing the pattern of progression of urbanisation with the associated increase in per capita electricity demand in the G7 countries with the current picture for a selection of the larger developing economies (by GDP) shows that only South Korea, Saudi Arabia and Russia are at comparable levels to the G7 group of industrialised nations.
Figure 70: Electricity consumption per capita versus urban population rate in emerging
markets (1975-2008, 5-year intervals)
0
2
4
6
8
10
12
14
10 20 30 40 50 60 70 80 90
Urban population (%)
Ele
ctri
city
co
nsu
mp
tio
n (
mW
h/c
apit
a) China Brazil
India Mexico
South Korea Russia
Thailand South Africa
Indonesia Turkey
Malaysia Poland
Saudi Arabia Egypt
Brazil
S Africa
China
Russia
S Korea
Saudi Arabia
Mexico
India
Thailand
Poland
Indonesia
Turkey
Malaysia
Egypt
G7 's' curve
Source: World Bank Development Indicators, Population Division of Department of the Economic and
Social Affairs of the United Nations Secretariat, Credit Suisse research
Assuming that per capita electricity consumption in emerging markets converges with that in the G7 as they urbanise, but with an estimated 20% efficiency gain (over the duration) over today’s energy consumption given implementation of current energy saving technology, allows us to estimate how many power stations must be built to accommodate increased demand over the course of urbanisation of emerging economies.
We arrive at a 20% estimate on potential efficiency gains by contrasting the energy intensity (GDP per unit of energy use) in G7 countries with emerging markets.
03 April 2012
Emerging Market Research Institute 45
Figure 71: G7 GDP per unit of energy use (constant 2005
PPP US$ per kg of oil equivalent)
Figure 72: Emerging markets GDP per unit of energy use
Source: World Bank Development Indicators, Credit Suisse research Source: World Bank Development Indicators, Credit Suisse research
To converge with the median per capita electricity demand in G7 nations (2008) of 7,900 kWh as emerging markets urbanise, would require the construction of approximately a further 2,500 power stations, assuming an average output of 1,000 megawatts per station.
Figure 73: Number of additional power stations to accommodate complete urbanisation of emerging economies Country (2008)
Electric power consumption (kWh
per capita)
Gap to G7 median (kWh per capita)
Population (millions)
Gap to G7 median consumption (GWh)
Gap to G7 median generation (GW)
Number of 1000MW power stations (assuming 20%
efficiency gain) Argentina 2,789 5,143 40.3 207,134 24 19
Bangladesh 208 7,723 162.2 1,252,907 143 114
Brazil 2,232 5,699 193.7 1,104,144 126 101
Chile 3,319 4,612 17.0 78,267 9 7
China 2,455 5,476 1,345.8 7,369,588 841 673
Colombia 974 6,958 45.7 317,686 36 29
Czech Rep. 6,464 1,467 10.4 15,211 2 1
Egypt 1,425 6,506 83.0 539,991 62 49
Hungary 3,989 3,943 10.0 39,399 4 4
India 566 7,365 1,198.0 8,823,723 1,007 806
Indonesia 591 7,340 230.0 1,687,991 193 154
Kenya 155 7,776 39.8 309,502 35 28
Malaysia 3,490 4,441 27.5 121,998 14 11
Mexico 2,020 5,912 109.6 647,974 74 59
Morocco 736 7,196 32.0 230,216 26 21
Nigeria 126 7,805 154.7 1,207,649 138 110
Pakistan 436 7,495 180.8 1,355,208 155 124
Peru 1,032 6,899 29.2 201,208 23 18
Philippines 588 7,343 92.0 675,450 77 62
Poland 3,732 4,200 38.1 159,904 18 15
Russia 6,435 1,496 140.9 210,743 24 19
Saudi Arabia 7,527 404 25.7 10,395 1 1
South Africa 4,759 3,172 50.1 158,943 18 15
South Korea 8,853 -922 48.3 -44,549 -5 -4
Thailand 2,079 5,853 67.8 396,599 45 36
Turkey 2,308 5,623 74.8 420,709 48 38
Viet Nam 799 7,132 88.1 628,116 72 57
2,573
Source: World Bank Development Indicators, Credit Suisse research
As emerging markets urbanise they require some 2,500 further power stations
03 April 2012
Emerging Market Research Institute 46
Similar in nature to the sweet-spot identified previously for per capita GDP growth when a particular country’s urbanisation rate is passing through the range 30–50%, we find that per capita demand for metals and building materials (looking at steel, cement, copper and aluminium) also typically peaks when a country’s PPP-adjusted GDP per capita is in the range of US$20,000–40,000.
There are clearly some outliers: South Korea appears extended versus the trend line on all four charts in addition to Germany (copper and aluminium) owing to large shipbuilding (Korea) and exporting capital goods manufacturing sectors (Germany and South Korea). The same goes some way to explain why China is also above trend on all four charts.
Nonetheless, we find the charts provide a helpful representation of future demand in the metals & mining and building materials sectors as emerging economies urbanise and industrialise (with the associated growth in per capita GDP) over the next decades.
Figure 74: Apparent steel consumption per capita (kg of
crude steel equivalent) vs GDP per capita (PPP) (2008)
Figure 75: Cement consumption per capita (kg) versus
GDP per capita (PPP) (2010)
China
India
US
BrazilRussia
JapanGermany
FranceUK
Italy
South Korea
Saudi Arabia
Czech Republic
CanadaR2 = 0.54
0
200
400
600
800
1,000
1,200
1,400
0 10,000 20,000 30,000 40,000 50,000
GDP per capita (US$ PPP)
Ap
par
ent
stee
l co
nsu
mp
tio
n p
er
cap
ita
(kg
)
Brazil
Canada
China
Czech
Egypt
FranceGermany
India
Italy
Japan
Malaysia
Nigeria
PolandRussia
Saudi Arabia
South Korea
Turkey
UKUS
R2 = 0.14
0
200
400
600
800
1,000
1,200
1,400
1,600
0 10,000 20,000 30,000 40,000 50,000
GDP per capita (US$ PPP)
Cem
ent
con
sum
pti
on
per
cap
ita
(kg
)
Source: World Steel Association Steel Statistical Yearbook 2010, The
Economist, Credit Suisse research
Source: International Cement Review, World Bank Development
Indicators, Credit Suisse research
Figure 76: Apparent copper consumption per capita (kg)
versus GDP per capita (PPP) (2010)
Figure 77: Apparent aluminium consumption per capita
(kg) versus GDP per capita (PPP) (2010)
China
India
US
BrazilRussia
Japan
Germany
France
Italy
South Korea
Canada
R2 = 0.38
0
2
4
6
8
10
12
14
16
18
0 10,000 20,000 30,000 40,000 50,000
GDP per capita (US$ PPP)
Ap
par
ent
cop
per
co
nsu
mp
tio
n p
er
cap
ita
(kg
)
China
India
US
BrazilRussia
Japan
Germany
France
Italy
South Korea
Czech Republic
Hungary
Canada
R2 = 0.52
0
5
10
15
20
25
30
0 10,000 20,000 30,000 40,000 50,000
GDP per capita (US$ PPP)
Ap
par
ent
alu
min
ium
co
nsu
mp
tio
n
per
cap
ita
(kg
)
Source: World Bureau of Metals Statistics, Population Division of
Department of the Economic and Social Affairs of the United Nations
Secretariat, Credit Suisse research
Source: World Bureau of Metals Statistics, Population Division of
Department of the Economic and Social Affairs of the United Nations
Secretariat, Credit Suisse research
We find that per capita demand for metals and building materials typically peaks when a country’s PPP-adjusted GDP per capita is in the range of US$20,000–40,000
03 April 2012
Emerging Market Research Institute 47
Specifically for China and India (already the largest and fifth-largest share of global steel demand at 47% and 5%, respectively) we estimate that per capita steel demand consumption will rise by a further 60% over the next 15 years.
Adjusted for population growth over the duration, this translates into total demand rising from 749 million tonnes in 2011 to 1,341 million tonnes in 2026, or a rise of 80%.
Figure 78: China and India per capita steel consumption
forecasts to 2040E
Figure 79: China and India steel consumption forecasts to
2040E
0
100
200
300
400
500
600
700
800
2004 2008 2012 2016 2020 2024 2028 2032 2036 2040India steel consumption (kg per capita)China steel consumption (kg per capita)
Source: World Steel Association, Credit Suisse estimates Source: World Steel Association, Credit Suisse estimates
The six largest emerging market consumers of steel and crude oil already account for a 60% (and rising) share of total global steel demand and 26% for oil.
Figure 80: Share of global steel consumption for largest
six emerging market consumers
Figure 81: Share of global crude oil consumption for
largest six emerging market consumers
0%
10%
20%
30%
40%
50%
60%
70%
2000
2001
2002
2003
2004
2005
2006
2007
2008
2009
TurkeyBrazilRussiaSouth KoreaIndiaChina
0%
5%
10%
15%
20%
25%
30%
1985
1988
1991
1994
1997
2000
2003
2006
2009
Mexico
South Korea
Brazil
Russia
India
China
Source: World Steel Association, Credit Suisse estimates Source: BP Statistical Review of World Energy, Credit Suisse
research
For China and India we estimate that per capita steel demand consumption will rise by a further 60% in the next 15 years
03 April 2012
Emerging Market Research Institute 48
The emerging market consumer theme is linked to urbanisation Consistent with the rise in per capita GDP with the progression of urbanisation is growth in disposable household income levels. In the US higher average hourly earnings are typically to be found in its cities rather than the countryside.
Figure 82: US state level average hourly earnings versus urbanisation rate
SDMS AR OK
IDWV KY IAMT NMND SCME
LATN
AL NVNE
NCOHKS PA
MOWI
AZ
GAHI
WYOR
FLUTTXVT MI
VA RINH ILDEMN
COMD CAAK WA NJNY
MA
CT
DC
R2 = 0.52
16
18
20
22
24
26
28
30
32
30% 40% 50% 60% 70% 80% 90% 100%
Urbanisation (%)
Ave
rag
e h
ou
rly
earn
ing
s (2
010
US
$)
Source: US Census Bureau, Bureau of Labor Statistics, US Bureau of Economic Analysis, Credit Suisse
research
On average, higher household incomes in the US are in those states where the population is concentrated in urban areas. Notable exceptions are in New England and Alaska, which appear to have relatively high household incomes considering their relatively rural populations. A similar trend is visible over the last 25 years of urbanisation in China, where per capita disposable income of urban households has risen five and a half times in real terms versus three and a half times for rural households.
Figure 83: US average household income versus
urbanised population (2000)
Figure 84: China urban versus rural households: per
Source: US Bureau of the Census, Credit Suisse research Source: China National Bureau of Statistics, Credit Suisse research
Higher average hourly earnings are typically to be found in cities rather than the countryside
Over 25 years Chinese per capita disposable income of urban households has risen five and a half times in real terms versus three and a half times for rural households
03 April 2012
Emerging Market Research Institute 49
Moreover, during the latter stages of urbanisation in the United States from 1955 to 2010, there was an associated incremental gain in the consumption share of GDP. China in our group of 34 study countries currently has by far the lowest contribution to GDP from consumption (35%) which we forecast to increase as the country continues to urbanise.
Figure 85: Urban population versus consumption share of GDP (2010 for all countries
other than US for 1955–2010)
China
India
United States, 2010
Indonesia
Brazil
Pakistan
Bangladesh
NigeriaRussia
Japan
Mexico
Philippines
Vietnam
Germany
Egypt
Turkey
ThailandFrance
United Kingdom
ItalySouth Africa
Korea
Colombia
Argentina
Kenya
Poland
Morocco
Peru
Malaysia
Saudi Arabia
Chile
Czech Republic
Hungary
CanadaUnited States, 1955
35%
40%
45%
50%
55%
60%
65%
70%
75%
80%
20% 30% 40% 50% 60% 70% 80% 90% 100%
Urban population (%)
Co
nsu
mp
tio
n s
har
e o
f G
DP
(%
)
Source: IMF, Bureau of Economic Analysis, Credit Suisse research
So importantly, as countries urbanise not only do their city populations increase, but those populations enjoy superior real household income growth relative to their rural counterparts, allowing for significant extra demand for household appliances and other consumer durables.
Figure 86: China: Ownership of appliances per 100 households (urban and rural)
Washing Machine Refrigerator Colour TV Airconditioner
Source: National Bureau of Statistics of China, Credit Suisse research
03 April 2012
Emerging Market Research Institute 50
For example, looking at just the communications sector, we note how the progression of mobile telephone penetration from 2000 to 2010 in our study group of 34 countries is closely related to the proportion of urbanised population.
Figure 87: Mobile telephone subscriptions (per 100
population) versus urbanisation (2000)
Figure 88: Mobile telephone subscriptions (per 100
population) versus urbanisation (2010)
US
UK
Japan
Italy
Germany
France
CanadaTurkey
S. Korea
South Africa
Saudi ArabiaRussia
India
ChinaBrazil
R2 = 0.54
0
10
20
30
40
50
60
70
80
0 20 40 60 80 100Urban population (%)
Mo
bile
ph
on
e p
enet
rati
on
(p
er 1
00)
Bangladesh
Brazil
ChinaIndiaKenya
Mexico
Nigeria
Russia
Saudi Arabia
Thailand
Turkey Canada
France
Germany
Italy
Japan
UK
US
R2 = 0.44
40
60
80
100
120
140
160
180
0 20 40 60 80 100
Urban population (%)
Mo
bile
ph
on
e p
enet
rati
on
(p
er 1
00)
Source: World Bank Development Indicators, Informa telecoms and
media, Credit Suisse research
Source: World Bank Development Indicators, Informa telecoms and
media, Credit Suisse research
Similarly, the progression (from 2000 to 2010) of internet penetration and thus consumer access to e-commerce across the G7 industrialised countries and emerging markets appears to be a function of urbanisation as broadband connectivity is more cost efficient to deploy in high density population areas.
Figure 89: Internet usage (per 100 population) versus
urbanisation (2000)
Figure 90: Internet usage (per 100 population) versus
urbanisation (2009)
China
India
US
BrazilRussia
Japan
Mexico
Germany
TurkeyThailand
France
UK
Italy
South Korea
Argentina
Kenya
Poland
Malaysia
Chile
Canada
R2 = 0.57
0
5
10
15
20
25
30
35
40
45
0 20 40 60 80 100Urban population (%)
Inte
rnet
usa
ge
(per
100
po
p)
Canada
Chile
MalaysiaPoland
Kenya
S. Korea
South Africa
Italy
UK
France
Thailand
Turkey
Egypt
Germany
Viet NamMexico
Japan
Russia
Bangladesh
Brazil
Indonesia
US
India
China
R2 = 0.46
0
10
20
30
40
50
60
70
80
90
0 20 40 60 80 100
Urban population (%)
Inte
rnet
usa
ge
(per
100
po
p)
Source: World Bank Development Indicators, Credit Suisse research Source: World Bank Development Indicators, Credit Suisse research
03 April 2012
Emerging Market Research Institute 51
Education levels and human capital Critical to the growth and development of emerging economies is the strong association between rate of urbanisation and improved levels of education and productivity, which importantly serve to boost the strength of a nation’s human capital. With the notable exceptions of Brazil, Mexico, Morocco and Saudi Arabia, we find a pattern of higher enrolment in tertiary (university/college) level education consistent with progressive urbanisation across our sample of 34 countries. Typically a 10 percentage point increase in a country’s rate of urbanisation translates into a 10% greater tertiary education enrolment ratio. Growth in human capital delivered via investment in intangible infrastructure (education and research and development) is as critical to a city’s ultimate success as investment in physical infrastructure.
The development thus far of the principal emerging economies appears to show this pattern being sustained—the highest tertiary education enrolment ratios are found in the more urbanised nations of South Korea, Russia and Poland.
Figure 91: Tertiary education enrolment ratio* versus
urban population rate
Figure 92: Tertiary education enrolment ratio* vs urban
population in emerging markets (1970-2005, 5-yr intervals)
Saudi Arabia
HungaryCzech Rep.
Chile
Malaysia
Morocco
Poland
Kenya
Argentina
Colombia
Italy
UK France
Thailand Turkey
Egypt
Viet Nam
Philippines
Mexico
Japan
Russia
BangladeshPakistan
Brazil
Indonesia
US
IndiaChina
R2 = 0.48
0
10
20
30
40
50
60
70
80
90
100
20 40 60 80 100
% Urban population (2010)
Sch
oo
l en
rolm
ent,
ter
tiar
y (%
gro
ss,
2009
)
R2 = 0.29
0
10
20
30
40
50
60
70
80
90
100
10 30 50 70 90% Urban population
Sch
oo
l en
rollm
ent,
ter
tiar
y (%
gro
ss) China Brazil
India MexicoSouth Korea RussiaThailand South AfricaIndonesia TurkeyMalaysia PolandSaudi Arabia Egypt
*Ratio of total enrolment, regardless of age, to the population of the
age group that officially corresponds to the level of tertiary education
Source: World Bank Development Indicators, Population Division of
Department of the Economic and Social Affairs of the United Nations
Secretariat, Credit Suisse research
Typically a 10 percentage point increase in a country’s rate of urbanisation translates into a 10% greater tertiary education enrolment ratio
03 April 2012
Emerging Market Research Institute 52
As a direct consequence, higher rates of urbanisation are equally associated with greater investment in technology, research and development and thus a shift up in the value chain of economies, enabling a higher delivery of per capita patents and trademarks.
Figure 93: Trademark applications per capita versus
urban population rate
Figure 94: Trademark applications per capita vs urban
population in emerging markets (1970-2005, 5-yr intervals)
Canada
Hungary
Czech Rep.
Chile
Peru
Poland
Kenya
Argentina
Colombia
South Africa
Italy
UK
France
Thailand
Turkey
Egypt
Germany
Viet Nam
Philippines
Mexico
Japan
Russia
Brazil
Indonesia
US
India
China
R2 = 0.74
0
200
400
600
800
1000
1200
1400
1600
1800
2000
20 40 60 80 100
% Urban population (2010)
Tra
dem
arks
per
cap
ita
(200
8)
R2 = 0.49
0
500
1000
1500
10 30 50 70 90% Urban population
Tra
dem
arks
per
cap
ita China Brazil
India MexicoSouth Korea RussiaThailand South AfricaIndonesia TurkeyMalaysia PolandSaudi Arabia Egypt
Source: World Bank Development Indicators, Population Division of
Department of the Economic and Social Affairs of the United Nations
Secretariat, Credit Suisse research
Source: World Bank Development Indicators, Population Division of
Department of the Economic and Social Affairs of the United Nations
Secretariat, Credit Suisse research
Efficiencies of high density populations employed in higher value industries collectively generate higher productivity in urban areas as illustrated by US state level data showing the pattern of economic output per hour worked versus rate of urbanisation. It appears that Americans who live in heavily urbanised states are up to 50% more productive in terms of GDP per hour worked than those who live in more rural states. Furthermore, significant cost savings are realised on transportation by concentrating manufacturers and service providers together with their end customers.
Figure 95: US state level average GDP per hour worked versus urbanisation rate
NV
WY
LA
TX
KYAL
DC
MS SC
OK
NM
AK
GA
AR
FL
TN
WV
IN
VA
AZ
CO
KS
MD
UT
WA
MOVT
IL
ME
NC
CA
MI
NY
RI
CT
IDOH
DE
IAOR
MA
NEPA
NJ
MN
WISD
NH
HI
NDMT
R2 = 0.45
45
50
55
60
65
70
75
80
85
90
30% 40% 50% 60% 70% 80% 90% 100%
Urbanisation (%)
GD
P p
er h
ou
r (2
010
curr
ent
US
$)
Source: US Census Bureau, Bureau of Labor Statistics, US Bureau of Economic Analysis, Credit Suisse
research
Americans who live in heavily urbanised states are up to 50% more productive than those who live in more rural states
03 April 2012
Emerging Market Research Institute 53
Environmental and health implications Efficiently planned and managed urban areas can yield significant improvements in the environmental impact of human activity for city dwellers relative to their rural counterparts. Energy efficient public transport systems and shorter commutes between homes and workplaces allow for lower transport-related carbon emissions. Temperature regulation of modern apartment buildings requires less energy per household (and per capita) than more clustered rural settlements. Smaller per capita living areas in shared tenements requires fewer building raw materials to construct than equivalent larger detached accommodation in rural surroundings for the same population, thus ensuring more efficient use of resources. High population density allows for relatively less land zoning necessary for human habitation and hence relatively less deforestation and destruction of the countryside. A 2005 United Nations land use study stated that while nearly half the world’s population lived in cities (this is now 51%) they occupy only 2.7% of the world’s land area.
Looking at US city level data for the largest 60 metropolitan statistical areas we find a strong inverse relationship between transport carbon dioxide emissions per capita and population density. New York stands out as having the lowest per capita transport-related emissions of any major metropolitan area in the United States by some margin as its inhabitants are served by an efficient public transport system and extremely dense urban environment where New Yorkers are simply able to walk a number of their journeys.
Figure 96: Emissions from transportation (public and private, lbs of CO2 per 1000
people) versus population density (log scale) for US metropolitan statistical areas
San FranciscoMiami
Seattle
San DiegoPhoenix
BostonDallas
Atlanta
HoustonDetroit
DC Philadelphia
ChicagoNew York
Los Angeles
R2 = 0.52
0
5
10
15
20
25
30
35
40
100 1,000 10,000Population per square mile (log scale)
Tra
nsp
ort
CO
2 em
issi
on
s (l
bs
per
10
00 p
eop
le)
Source: US Census Bureau 2000 Census, Credit Suisse Research
Further evidence of city populations being relatively ‘greener’ than villages in terms of carbon emissions arises from the significant relationship between total carbon emissions per capita and urbanisation rate across our group of 34 emerging and developed economies. Striking reductions in per capita emissions are evident in China, Bangladesh, India and Vietnam during their initial phase of urbanisation in the 1980s and 1990s.
However, new passenger vehicle sales in China have now overtaken those in the United States. Critical for the outlook on global emissions of greenhouse gasses will be the urban density which is ultimately achieved in the growing cities of China, India and other developing nations. Will they achieve the density of New York with its low per capita emissions or the higher emissions associated with lower density more sprawling cities in the US sunbelt? One way to regulate the penetration level of private vehicles is through the levy of gasoline tax. Although the United States emits twice as much per capita carbon as the UK (and three times as much as France), gasoline taxes are a fraction of those in Europe (plus France generates 78% of the country’s electricity from nuclear power which is essentially carbon free).
We find a strong inverse relationship between transport carbon dioxide emissions per capita and population density
Critical for the outlook on global emissions of greenhouse gasses will be the urban density which is ultimately achieved in the growing cities of China, India and other developing nations
03 April 2012
Emerging Market Research Institute 54
Figure 97: Total CO2 emissions (kg per US$ PPP GDP per
capita) versus urban population rate
Figure 98: Total CO2 emissions (kg per US$ PPP GDP per
capita) versus urban population rate in emerging markets
(1980-2010, 5-year intervals)
China
India
US
Indonesia
Brazil
Pakistan
Bangladesh
Nigeria
Japan
Mexico
Philippines
Viet Nam
Germany
Egypt
TurkeyThailand
FranceUK
South AfricaArgentina
Kenya
Poland
Morocco
Peru
R2 = 0.67
0.0
0.1
0.2
0.3
0.4
0.5
0.6
0.7
0.8
0.9
20 40 60 80 100Urban population (%)
CO
2 em
issi
on
s p
er G
DP
per
cap
ita
R2 = 0.73
0.0
0.5
1.0
1.5
2.0
2.5
3.0
3.5
4.0
10 20 30 40 50 60 70 80 90
Urban population (%)
CO
2 em
issi
on
s p
er G
DP
per
cap
ita China Brazil
India PakistanNigeria Viet NamThailand South AfricaIndonesia TurkeyMalaysia KenyaBangladesh Philippines
Source: World Bank Development Indicators, Population Division of
Department of the Economic and Social Affairs of the United Nations
Secretariat, Credit Suisse research
Source: World Bank Development Indicators, Population Division of
Department of the Economic and Social Affairs of the United Nations
Secretariat, Credit Suisse research
Rapid urbanisation in emerging economies involves vast challenges in urban planning, infrastructure investment and construction preferably delivered at a rate which anticipates, rather than chases, demand. More than any other service provided, the effective distribution of safe potable water and removal of sewage and solid waste in a city is critical for the well-being of its inhabitants.
There is a trend for nationwide access to improved water sources to be associated with the degree to which a country has urbanised, but importantly there appears to be a significant dispersion between the major economies in our study. Thailand and Egypt appear as having provided well for their citizens in the delivery of fresh water relative to their rate of urbanisation, while Indonesia appears to be lagging the observed trend.
Figure 99: Access to improved water source versus urban population rate in emerging
markets (1990-2010, 5-year intervals)
65
70
75
80
85
90
95
100
10 20 30 40 50 60 70 80 90
Urban population (%)
Imp
rove
d w
ater
(%
)
China Brazil IndiaMexico South Korea RussiaThailand South Africa IndonesiaTurkey Malaysia PolandSaudi Arabia Egypt
Source: World Bank Development Indicators, Population Division of Department of the Economic and
Social Affairs of the United Nations Secretariat, Credit Suisse research
03 April 2012
Emerging Market Research Institute 55
Similarly, there appear to be winners and losers across emerging markets in the challenge of providing improved sanitation in urban areas. Thailand and Egypt appear as having provided well for their cities while India, China, Indonesia, and (to a lesser extent) Brazil are lagging the observed trend. With the exception of Indonesia, these latter countries have registered more success with the delivery of fresh water than the extraction of waste.
Figure 100: Access to improved sanitation versus urban population rate in emerging
markets (1990-2010, 5-year intervals)
10
20
30
40
50
60
70
80
90
100
20 30 40 50 60 70 80 90
Urban population (%)
Imp
rove
d s
anit
atio
n (
%*)
China Brazil India
Mexico South Korea Russia
Thailand South Africa Indonesia
Turkey Malaysia Poland
Saudi Arabia Egypt
Source: World Bank Development Indicators, Population Division of Department of the Economic and
Social Affairs of the United Nations Secretariat, Credit Suisse research
The improvement in sanitation accompanied by growth in per capita economic activity observed across our sample of 34 countries translates directly into higher life expectancy with the notable exception of South Africa (AIDS related), Russia (related to deteriorating public healthcare post the break up of the Soviet Union and alcohol consumption), and the United States (tobacco and obesity related).
Figure 101: Access to improved sanitation versus GDP
per capita (US$, PPP)
Figure 102: Life expectancy at birth versus GDP per
capita (US$, PPP)
China
India
US
Indonesia
Brazil
Pakistan
Bangladesh
Nigeria
Russia
Japan
Mexico
Philippines
Viet Nam Germany
Egypt
TurkeyThailand
France
UKItaly
South Africa
South Korea
Colombia
Argentina
Kenya
Poland
Morocco Peru
MalaysiaSaudi ArabiaChile
Czech Rep
HungaryCanada
R2 = 0.74
20
30
40
50
60
70
80
90
100
0 10,000 20,000 30,000 40,000 50,000
GDP per capita PPP(2010)
Imp
rove
d s
anit
atio
n(2
008)
China
India
US
Indonesia Brazil
PakistanBangladesh
Nigeria
Russia
Japan
MexicoViet Nam
Germany
Egypt TurkeyThailand
France
UK
Italy
South Africa
South Korea
Argentina
Kenya
Malaysia
Saudi Arabia
Chile
R2 = 0.50
45
50
55
60
65
70
75
80
85
0 10,000 20,000 30,000 40,000 50,000
GDP per capita PPP (2010)
Lif
e ex
pec
tan
cy (
2009
)
Source: World Bank Development Indicators, Population Division of
Department of the Economic and Social Affairs of the United Nations
Secretariat, Credit Suisse research
Source: World Bank Development Indicators, Population Division of
Department of the Economic and Social Affairs of the United Nations
Secretariat, Credit Suisse research
03 April 2012
Emerging Market Research Institute 56
Ultimately, a country’s citizens appear to live longer in cities—with improved access to better healthcare, higher standards of living, more social interaction, museums, cultural venues and amenities—compared with the countryside.
Figure 103: Life expectancy at birth versus urban population rate in emerging markets
(1960-2010, 5-year intervals)
40
45
50
55
60
65
70
75
80
85
10 20 30 40 50 60 70 80 90
Urban population (%)
Lif
e ex
pec
tan
cy (
year
s)
China Brazil India Mexico South KoreaRussia Thailand South Africa Indonesia TurkeyMalaysia Poland Saudi Arabia Egypt
Source: World Bank Development Indicators, Population Division of Department of the Economic and
Social Affairs of the United Nations Secretariat, Credit Suisse research
On the negative side, a consequence of urbanisation that occurs without adequate investment, urban planning, infrastructure development, management and social programmes as a country’s population migrates to the cities is the creation and expansion of slums. In addition to the associated healthcare issues linked with inadequate fresh water supply and sanitation, slums also under-provide for the economic productivity and enrichment in human capital of their inhabitants that is generated by more successful urban areas.
Nevertheless, urban slums may reflect an improvement in the standard of living their inhabitants would otherwise achieve in rural areas and can be interpreted as a signal that the city is delivering potential opportunities for its slum dwellers to succeed which attracts them from the countryside.
Figure 104: Slum population* as percentage of urban population (2007 versus 1990)
0
10
20
30
40
50
60
70
80
Tanza
nia
Nigeria
Ugand
a
Zambia
Kenya
Pakist
an
Philip
pines
Vietna
mPer
u
Namibi
aInd
ia
China
South
Africa
Brazil
Thaila
nd
Argen
tina
Indon
esia
Zimbab
weEgy
pt
Colom
bia
Mexico
Turke
y
Moroc
co
2007 1990
*Note: A slum is defined as a household lacking one or more of the following conditions: Access to
improved water, access to improved sanitation, sufficient-living area and durability of housing.
There is a strong trend for a country’s citizens to live longer in cities compared to the countryside
Slums are the consequence of urbanisation without adequate investment, urban planning, infrastructure development, management and social programmes
03 April 2012
Emerging Market Research Institute 57
Source: UN Millennium Development Goals Database, Credit Suisse Research
Goal number seven of the September 2000 United Nations Millennium Development initiative—to “significantly improve” the lives of at least 100 million slum dwellers by the year 2020—has yielded results as governments have begun to prioritise slum clearance and urban improvement programmes. Since 2000, some 227 million people have moved out of slum conditions largely due to slum upgrading; this is more than double the target set.
With the exception of Thailand, Zambia and Zimbabwe, the selection of emerging economies in the above chart have delivered (varying degrees) of progress in the reduction of the proportion of urban dwellers living in slums over the period 1990 through 2007, generally consistent with the degree to which they have managed to grow their respective per capita economic activity over the duration.
Figure 105: Change in proportion of urban population living in slums versus PPP GDP
per capita growth (1990-2007)
Argentina
Brazil
China
ColombiaEgypt
India
IndonesiaMexico
Morocco
Namibia
Nigeria
Peru
South Africa
TurkeyUganda
Tanzania
Zambia
Zimbabw e
Kenya Pakistan
Thailand
Philippines
Vietnam
-1%
1%
3%
5%
7%
9%
11%
13%
-35% -30% -25% -20% -15% -10% -5% 0% 5% 10% 15%Change in % of urban population living in slums from 1990 to 2007 (ppt)
GD
P p
er c
apit
a C
AG
R (
US
$ P
PP
, 90-
07%
)
Source: UN Millennium Development Goals Database, Credit Suisse Research
Since 2000, some 227 million people globally have moved out of slum conditions largely due to slum upgrading, more than double the United Nations target
03 April 2012
Emerging Market Research Institute 58
China 2012 marked China exceeding 50% urbanisation Urbanisation coupled with the introduction of social programmes is part of the Chinese administration’s solution to rebalancing the economy from public investment spending and exports towards private consumption. Given its record, we believe that China will continue to deliver the investment, urban planning, infrastructure development, management and social programmes that should ensure the country achieves the level of growth in economic activity associated with a successful rapid urbanisation. Since the 1980s, China has led the world in the sheer scale of its urbanisation programme—peaking between 2000 and 2005 with an annual average increase in urban population of 21 million people. Currently, 44% of GDP is investment spending of which 9% of GDP (US$800bn) is infrastructure related. China crossed a milestone in its economic and social development in 2012 with its cities now accounting for more than half its total population. From 2012 to 2050, China’s cities will grow by a further 348 million people, greater than today’s population of the United States.
Figure 106: Urbanisation rate for China versus overall
emerging and developed markets (%)
Figure 107: Key socioeconomic indicators illustrating the
No. of cities population > 1m in 2015 105Largest city Shanghai Population: 2012 / 2025E, (mn) 16.6 / 20.0
GDP 2012 (US$, bn) 7,744GDP per capita 2012 (US$ PPP) 9,470GDP CAGR (2010 - 2015E) 9.4%GINI co-eff icient 41.5Slum population as % of total urban 31%Corruption Perceptions Index (2000 / 2010) 3.1 / 3.5
Source: Population Division of Department of Economic and Social Affairs of the United Nations Secretariat, Credit Suisse research
Figure 108: Division of urban and rural population (mn) Figure 109: Aver. annual city population growth (10-25E)*
*Note: for those urban agglomerations with 750,000 persons or more in 2009 Source: Population Division of Department of Economic and Social Affairs of the United Nations Secretariat, Credit Suisse research
We believe that China will continue to deliver the investment, urban planning, infrastructure development, management and social programmes that should ensure the country achieves the level of growth in economic activity associated with a successful rapid urbanisation
03 April 2012
Emerging Market Research Institute 59
Egypt Addressing the housing shortfall is critical After stagnating since the mid 1980s at around 40%, the proportion of the population living in urban areas has begun to accelerate and is expected to reach 50% in 2029 on UN estimates. In a country where 95% of the population lives in 5.5% of the surface area, this re-acceleration in urbanisation puts pressure on the housing market. With limited state investment in housing (8% of total real estate investment) and the focus of real estate developers on the upscale market, popular demand for affordable housing is satisfied by an informal market that produces modest buildings usually in illegal settlements with lack of public services. Exacerbating the shortfall is the c550,000 marriages a year which directly translates into demand for almost as many additional housing units and the absence of a meaningful mortgage market. The government has recently made a provisional commitment to construct one million affordable new residential units across 32 cities over the next five years, the execution of which remains unclear.
Figure 110: Urbanisation rate for Egypt versus overall
emerging and developed markets (%)
Figure 111: Key socioeconomic indicators illustrating the
No. of cities population > 1m in 2015 2Largest city Cairo Population: 2012 / 2025E, (mn) 11.0 / 13.5
GDP 2012 (US$, bn) 253GDP per capita 2012 (US$ PPP) 6,110GDP CAGR (2010 - 2015E) 3.8%GINI co-eff icient 32.1Slum population as % of total urban 17%Corruption Perceptions Index (2000 / 2010) 3.1 / 3.1
Source: Population Division of Department of Economic and Social Affairs of the United Nations Secretariat, Credit Suisse research
Figure 112: Division of urban and rural population (mn) Figure 113: Aver. annual city population growth (10-25E)*
*Note: for those urban agglomerations with 750,000 persons or more in 2009
Source: Population Division of Department of Economic and Social Affairs of the United Nations Secretariat, Credit Suisse research
With 95% of the population living in 5.5% of the surface area, a re-acceleration in urbanisation puts pressure on housing. The government has recently made a provisional commitment to construct one million affordable new residential units across 32 cities over the next 5 years.
03 April 2012
Emerging Market Research Institute 60
India Pace of urbanisation now shifting up a gear India will become the world’s most populous nation around 2025 on UN estimates, but with an urban population 39% less than that of China in the same year. Gandhi famously stated that India lives in its villages; on UN projections, he will be correct until 2044, the point at which India’s urban population will exceed that in rural areas. Of our nine focus countries, India will be the last to cross this milestone. Nonetheless, the pace of urbanisation in India is now set to increase significantly with a 2012-2050 compound annual growth rate of 2.1%, double that of China. The ministry of urban development estimates the required investment in urban infrastructure at US$800bn over the next 20 years, US$350bn on roads and the rest on services including public transport, power, water and sewerage. The ministry, while recognising that the country’s economic growth momentum cannot be sustained if urbanisation is not actively facilitated, notes that fundamental reforms in governance including urban planning will be essential to achieve this scale of investment.
Figure 114: Urbanisation rate for India versus overall
emerging and developed markets (%)
Figure 115: Key socioeconomic indicators illustrating the
No. of cities population > 1m in 2015 52Largest city Delhi Population: 2012 / 2025E, (mn) 22.2 / 28.6
GDP 2012 (US$, bn) 2,013GDP per capita 2012 (US$ PPP) 4,070GDP CAGR (2010 - 2015E) 7.9%GINI co-eff icient 36.8Slum population as % of total urban 32%Corruption Perceptions Index (2000 / 2010) 2.8 / 3.3
Source: Population Division of Department of Economic and Social Affairs of the United Nations Secretariat, Credit Suisse research
Figure 116: Division of urban and rural population (mn) Figure 117: Aver. annual city population growth (10-25E)*
*Note: for those urban agglomerations with 750,000 persons or more in 2009
Source: Population Division of Department of Economic and Social Affairs of the United Nations Secretariat, Credit Suisse research
The pace of urbanisation in India is now set to increase significantly with a 2012-2050 CAGR of 2.1%, double that of China. India’s economic growth momentum cannot be sustained if urbanisation is not actively facilitated, but fundamental reforms in governance will be essential to achieve this.
03 April 2012
Emerging Market Research Institute 61
Indonesia National ‘master plan’ for infrastructure development Indonesia’s cities will grow by an additional 81 million people from 2012 to 2050, according to the UN; however, the country’s economic expansion has outgrown its underinvested infrastructure—in 2010, Indonesia spent 3% of GDP on infrastructure versus 5% in India and 9% in China. In May 2011, Indonesian President Susilo Bambang Yudhoyono launched an economic ’master plan’ seeking to raise the country's average annual growth to 8-9% between 2015 and 2025, from around 6% now. The first phase of the plan sets out $468bn in investments to be made over the next 14 years focusing primarily on infrastructure development including tens of thousands of megawatts of electricity generation, thousands of kilometres of expressways and upgrades to ports, airports and waterways. The plan also highlights the importance of moving Indonesia’s economy up the value chain and improving education to develop a more high-tech economy less reliant on commodity extraction.
Figure 118: Urbanisation rate for Indonesia versus overall
emerging and developed markets (%)
Figure 119: Key socioeconomic indicators illustrating the
No. of cities population > 1m in 2015 8Largest city Jakarta Population: 2012 / 2025E, (mn) 9.2 / 10.9
GDP 2012 (US$, bn) 936GDP per capita 2012 (US$ PPP) 4,880GDP CAGR (2010 - 2015E) 6.7%GINI co-eff icient 39.4Slum population as % of total urban 23%Corruption Perceptions Index (2000 / 2010) 1.7 / 2.8
Source: Population Division of Department of Economic and Social Affairs of the United Nations Secretariat, Credit Suisse research
Figure 120: Division of urban and rural population (mn) Figure 121: Aver. annual city population growth (10-25E)*
*Note: for those urban agglomerations with 750,000 persons or more in 2009
Source: Population Division of Department of Economic and Social Affairs of the United Nations Secretariat, Credit Suisse research
In 2011 Indonesia launched an economic "master plan", the first phase of which outlines $468bn of investments to be made over 14 years focussing on infrastructure development including electricity generation, expressways and upgrades to ports, airports and waterways
03 April 2012
Emerging Market Research Institute 62
Nigeria Enormous challenges ahead Enormous socio-economic challenges lie ahead for Africa’s most populous nation and its mega-city Lagos, as unplanned urban population explosion has led to overcrowding, paucity of housing and associated facilities such as water, electricity and sewerage, environmental degradation and inadequate public infrastructure. The growth in urban population is expected by the UN to continue at a break-neck annual growth rate of 2.4% taking the proportion of urban population to 75% in 2050, the highest among our focus group of nine countries. Worryingly, Nigeria suffers both from high inequality with the second-highest GINI co-efficient among our focus group and the highest proportion of urban population living in slums (64%). The Lagos Mega-City Project seeks to address many of these problems with plans to provide infrastructure, mass housing, and power generation. However, the success of the project depends largely on reigning in the high levels of corruption and finding sustainable funding given Lagos already has record debt.
Figure 122: Urbanisation rate for Nigeria versus overall
emerging and developed markets (%)
Figure 123: Key socioeconomic indicators illustrating the
No. of cities population > 1m in 2015 10Largest city Lagos Population: 2012 / 2025E, (mn) 10.6 / 15.8
GDP 2012 (US$, bn) 263GDP per capita 2012 (US$ PPP) 2,210GDP CAGR (2010 - 2015E) 6.4%GINI co-eff icient 42.9Slum population as % of total urban 64%Corruption Perceptions Index (2000 / 2010) 1.2 / 2.4
Source: Population Division of Department of Economic and Social Affairs of the United Nations Secretariat, Credit Suisse research
Figure 124: Division of urban and rural population (mn) Figure 125: Aver. annual city population growth (10-25E)*
*Note: for those urban agglomerations with 750,000 persons or more in 2009
Source: Population Division of Department of Economic and Social Affairs of the United Nations Secretariat, Credit Suisse research
The growth in urban population is expected to continue at a break-neck annual growth rate of 2.4% taking the proportion of urban population to 75% in 2050. Worryingly, Nigeria suffers from the highest proportion of urban population living in slums (64%) among our focus group of nine countries.
03 April 2012
Emerging Market Research Institute 63
Pakistan Exceptional high growth rate in urbanisation to 2050 Of the nine countries in our focus group, Pakistan has the highest projected compound annual growth rate in urban population from 2012 through 2050 of 2.6% on United Nations estimates. Interestingly, it is also the only country in our focus group with a corresponding positive rural population growth rate out to 2050. Similar to India, the rate of Pakistan’s urbanisation is now set to increase significantly and will reach a level of 50% as far out as 2037, according to the UN estimates. With the second lowest per capita GDP in our focus group (after Nigeria) of US$2,660 and 48% of urban dwellers currently in slum conditions, Pakistan faces extreme challenges to accommodate successfully a further 125 million inhabitants in its cities by 2050. Pakistan’s cities suffer from a significant infrastructure deficit in even the most basic of services such as sewage removal and treatment. A recent devolution plan for municipal governance offers some optimism; however, municipal financial reform is critical for urbanisation to succeed in the sixth most populous country.
Figure 126: Urbanisation rate for Pakistan versus overall
emerging and developed markets (%)
Figure 127: Key socioeconomic indicators illustrating the
No. of cities population > 1m in 2015 8Largest city Karachi Population: 2012 / 2025E, (mn) 13.1 / 18.7
GDP 2012 (US$, bn) 234GDP per capita 2012 (US$ PPP) 2,660GDP CAGR (2010 - 2015E) 4.2%GINI co-eff icient 31.2Slum population as % of total urban 48%Corruption Perceptions Index (2000 / 2010) 2.3 / 2.3
Source: Population Division of Department of Economic and Social Affairs of the United Nations Secretariat, Credit Suisse research
Figure 128: Division of urban and rural population (mn) Figure 129: Aver. annual city population growth (10-25E)*
*Note: for those urban agglomerations with 750,000 persons or more in 2009
Source: Population Division of Department of Economic and Social Affairs of the United Nations Secretariat, Credit Suisse research
With the second lowest per capita GDP in our focus group (after Nigeria) of US$2,660 and 48% of urban dwellers currently in slum conditions, Pakistan faces extreme challenges to successfully accommodate a further 125 million inhabitants in its cities by 2050
03 April 2012
Emerging Market Research Institute 64
Philippines Effective governance needed for urban development From 2012, over half the population of the Philippines is urbanised with a UN projection of compound annual growth rate for urban population of a robust 1.9% out to 2050, translating to an additional 53 million dwellers in Filipino cities. The Philippines has the highest GINI coefficient among our nine focus countries together with the only decline in corruption perceptions over the period 2000 to 2010 (both acting as hindrances to effective policy implementation). The focus is on Metro Manila which will undergo an average 200,000+ increase in population per annum until at least 2025. City authorities have produced no fewer than 14 urban development grand plans for the city over the past 150 years—none of which has been fully implemented. Furthermore, attempts to privatise infrastructure development have had a poor track record, marred by contract disputes. A major concern continues to be a poorly functioning land market, leading to housing price escalation owing to supply constraints, thus leading to inefficiencies in urban accessibility.
Figure 130: Urbanisation rate for the Philippines versus
overall emerging and developed markets (%)
Figure 131: Key socioeconomic indicators illustrating the
No. of cities population > 1m in 2015 2Largest city Manila Population: 2012 / 2025E, (mn) 11.6 / 14.9
GDP 2012 (US$, bn) 232GDP per capita 2012 (US$ PPP) 3,960GDP CAGR (2010 - 2015E) 4.9%GINI co-eff icient 44.8Slum population as % of total urban 44%Corruption Perceptions Index (2000 / 2010) 2.8 / 2.4
Source: Population Division of Department of Economic and Social Affairs of the United Nations Secretariat, Credit Suisse research
Figure 132: Division of urban and rural population (mn) Figure 133: Aver. annual city population growth (10-25E)*
*Note: for those urban agglomerations with 750,000 persons or more in 2009
Source: Population Division of Department of Economic and Social Affairs of the United Nations Secretariat, Credit Suisse research
The focus is on Metro Manila which will undergo an average 200,000+ increase in population per annum until at least 2025. City authorities have produced no fewer than 14 urban development grand plans for the city over the past 150 years—none of which has been fully implemented
03 April 2012
Emerging Market Research Institute 65
Thailand Well positioned for further growth in urbanisation Urbanisation in Thailand has been characterised by the rapid population growth and increase in functional dominance of Bangkok. With seven million residents, the dominant city accounts for a third of Thailand’s urban population. Though internal migration rates are declining, urbanisation is expected to continue, in part fuelled by an increase in international migrants, reaching 50% in 2036 from the current 36% on UN estimates. Among our focus countries, Thailand has the highest per capita GDP, lowest levels of corruption on the CPI score and relatively low proportion of the urban population living in slums and is thus well positioned to continue urbanising successfully and reap the associated gains in per capita economic activity. However, the country is not without challenges. Bangkok still suffers from congestion, serious air pollution, repeated and prolonged flooding, deteriorating water quality and problems with waste management despite the recent focus and improvement in many of these measures.
Figure 134: Urbanisation rate for Thailand versus overall
emerging and developed markets (%)
Figure 135: Key socioeconomic indicators illustrating the
No. of cities population > 1m in 2015 1Largest city Bangkok Population: 2012 / 2025E, (mn) 7.0 / 8.5
GDP 2012 (US$, bn) 379GDP per capita 2012 (US$ PPP) 9,540GDP CAGR (2010 - 2015E) 4.6%GINI co-eff icient 42.5Slum population as % of total urban 26%Corruption Perceptions Index (2000 / 2010) 3.2 / 3.5
Source: Population Division of Department of Economic and Social Affairs of the United Nations Secretariat, Credit Suisse research
Figure 136: Division of urban and rural population (mn) Figure 137: Aver. annual city population growth (10-25E)*
*Note: for those urban agglomerations with 750,000 persons or more in 2009
Source: Population Division of Department of Economic and Social Affairs of the United Nations Secretariat, Credit Suisse research
Thailand has the highest per capita GDP, lowest levels of corruption on the CPI score and relatively low proportion of the urban population living in slums and is thus very well positioned to continue urbanising successfully and reap the associated gains in per capita economic activity
03 April 2012
Emerging Market Research Institute 66
Vietnam Needs to implement a well-defined development plan With a 33% urbanised population, Vietnam (together with India) is currently the most rurally populated of our nine focus group countries. The Doi Moi economic reforms initiated in 1986 with the goal of creating a ‘socialist-oriented market economy’ provided the catalyst for urbanisation as inward foreign direct investment in new private sector enterprises was focused on the cities. In response to urban growth, in April 2009, the government launched the master plan to develop Vietnam’s urban system until 2025, and the vision to 2050 aimed primarily at expanding Vietnam’s medium-sized cities (rather than Ho Chi Minh or Ha Noi) as development hubs within larger urban areas and provinces. On United Nations projections, the compound annual growth rate of urban population in Vietnam from now until 2050 is a robust 2.1%, translating into an additional 36 million inhabitants in cities. Even at this relatively swift growth rate, it will be 2038 before half of the country’s citizens live in urban areas.
Figure 138: Urbanisation rate for Vietnam versus overall
emerging and developed markets (%)
Figure 139: Key socioeconomic indicators illustrating the
No. of cities population > 1m in 2015 3Largest city Ho Chi Minh City Population: 2012 / 2025E, (mn) 6.2 / 9.0
GDP 2012 (US$, bn) 137GDP per capita 2012 (US$ PPP) 3,610GDP CAGR (2010 - 2015E) 6.7%GINI co-eff icient 36.1Slum population as % of total urban 41%Corruption Perceptions Index (2000 / 2010) 2.5 / 2.7
Source: Population Division of Department of Economic and Social Affairs of the United Nations Secretariat, Credit Suisse research
Figure 140: Division of urban and rural population (mn) Figure 141: Aver. annual city population growth (10-25E)*
*Note: for those urban agglomerations with 750,000 persons or more in 2009
Source: Population Division of Department of Economic and Social Affairs of the United Nations Secretariat, Credit Suisse research
The government launched in April 2009 the master plan to develop Vietnam’s urban system until 2025 and the vision to 2050 aimed primarily at expanding Vietnam’s medium-sized cities as development hubs within larger urban areas and provinces.
03 April 2012
Emerging Market Research Institute 67
The author of this report wishes to acknowledge the contribution made by Ram Selvan, an employee of CRISIL Global Research and Analytics, a business division of CRISIL Limited, a third-party provider of offshore research services to Credit Suisse
Companies Mentioned (Price as of 30 Mar 12) Alstom (ALSO.PA, Eu29.18, NEUTRAL, TP Eu27.00) Assa Abloy (ASSAb.ST, SKr203.10, OUTPERFORM, TP SKr210.00) Atlas Copco (ATCOa.ST, SKr156.30, NEUTRAL, TP SKr155.00) China Overseas Land & Investment (0688.HK, HK$14.76, UNDERPERFORM, TP HK$12.60) China Resources Power Holdings (0836.HK, HK$14.38, OUTPERFORM, TP HK$18.25) Dongfeng Motors Group Co Ltd (0489.HK, HK$14.02, OUTPERFORM [V], TP HK$17.00) Dover Corporation (DOV, $62.22, NEUTRAL, TP $67.00) Eaton Corporation (ETN, $49.15, NEUTRAL, TP $53.00) ENN Energy Holdings Ltd (2688.HK, HK$26.80, NEUTRAL, TP HK$27.80) Evergrande Real Estate Group Ltd (3333.HK, HK$4.16, OUTPERFORM [V], TP HK$5.20) Great Wall Motor (2333.HK, HK$15.10, NEUTRAL [V], TP HK$11.50) Grupo Mexico (GMEXICOB.MX, peso40.11, NEUTRAL, TP peso630.03) Illinois Tool Works, Inc. (ITW, $56.80, NEUTRAL, TP $57.00) Iluka Resources Limited (ILU.AX, A$17.79, OUTPERFORM [V], TP A$23.00) KGHM Polska Miedz S.A. (KGHM.WA, PLN139.10, OUTPERFORM [V], TP PLN164.00) Kia Motors (000270.KS, W74,100, NEUTRAL, TP W68,000) Kumba Iron Ore (KIOJ.J, R518.25, UNDERPERFORM, TP R500) Perusahaan Gas Negara (PGAS.JK, Rp3,800.00, OUTPERFORM, TP Rp5,000.00) Tata Motors Ltd. (TAMO.BO, Rs275.70, NEUTRAL, TP Rs255.00) United Tractors (UNTR.JK, Rp33,000.00, OUTPERFORM, TP Rp34,000.00) Weichai Power Co. Ltd (2338.HK, HK$36.25, NEUTRAL [V], TP HK$42.50) Weir Group (WEIR.L, 1698 p, OUTPERFORM, TP 2,350.00 p) Zoomlion Heavy Industry (1157.HK, HK$10.34, UNDERPERFORM, TP HK$8.40)
03 April 2012
Emerging Market Research Institute 68
Disclosure Appendix Important Global Disclosures The analysts identified in this report each certify, with respect to the companies or securities that the individual analyzes, that (1) the views expressed in this report accurately reflect his or her personal views about all of the subject companies and securities and (2) no part of his or her compensation was, is or will be directly or indirectly related to the specific recommendations or views expressed in this report. The analyst(s) responsible for preparing this research report received compensation that is based upon various factors including Credit Suisse's total revenues, a portion of which are generated by Credit Suisse's investment banking activities. Analysts’ stock ratings are defined as follows: Outperform (O): The stock’s total return is expected to outperform the relevant benchmark* by at least 10-15% (or more, depending on perceived risk) over the next 12 months. Neutral (N): The stock’s total return is expected to be in line with the relevant benchmark* (range of ±10-15%) over the next 12 months. Underperform (U): The stock’s total return is expected to underperform the relevant benchmark* by 10-15% or more over the next 12 months. *Relevant benchmark by region: As of 29th May 2009, Australia, New Zealand, U.S. and Canadian ratings are based on (1) a stock’s absolute total return potential to its current share price and (2) the relative attractiveness of a stock’s total return potential within an analyst’s coverage universe**, with Outperforms representing the most attractive, Neutrals the less attractive, and Underperforms the least attractive investment opportunities. Some U.S. and Canadian ratings may fall outside the absolute total return ranges defined above, depending on market conditions and industry factors. For Latin American, Japanese, and non-Japan Asia stocks, ratings are based on a stock’s total return relative to the average total return of the relevant country or regional benchmark; for European stocks, ratings are based on a stock’s total return relative to the analyst's coverage universe**. For Australian and New Zealand stocks, 12-month rolling yield is incorporated in the absolute total return calculation and a 15% and a 7.5% threshold replace the 10-15% level in the Outperform and Underperform stock rating definitions, respectively. The 15% and 7.5% thresholds replace the +10-15% and -10-15% levels in the Neutral stock rating definition, respectively. **An analyst's coverage universe consists of all companies covered by the analyst within the relevant sector. Restricted (R): In certain circumstances, Credit Suisse policy and/or applicable law and regulations preclude certain types of communications, including an investment recommendation, during the course of Credit Suisse's engagement in an investment banking transaction and in certain other circumstances. Volatility Indicator [V]: A stock is defined as volatile if the stock price has moved up or down by 20% or more in a month in at least 8 of the past 24 months or the analyst expects significant volatility going forward.
Analysts’ coverage universe weightings are distinct from analysts’ stock ratings and are based on the expected performance of an analyst’s coverage universe* versus the relevant broad market benchmark**: Overweight: Industry expected to outperform the relevant broad market benchmark over the next 12 months. Market Weight: Industry expected to perform in-line with the relevant broad market benchmark over the next 12 months. Underweight: Industry expected to underperform the relevant broad market benchmark over the next 12 months. *An analyst’s coverage universe consists of all companies covered by the analyst within the relevant sector. **The broad market benchmark is based on the expected return of the local market index (e.g., the S&P 500 in the U.S.) over the next 12 months. Credit Suisse’s distribution of stock ratings (and banking clients) is:
Global Ratings Distribution Outperform/Buy* 46% (60% banking clients) Neutral/Hold* 42% (57% banking clients) Underperform/Sell* 10% (53% banking clients) Restricted 2%
*For purposes of the NYSE and NASD ratings distribution disclosure requirements, our stock ratings of Outperform, Neutral, and Underperform most closely correspond to Buy, Hold, and Sell, respectively; however, the meanings are not the same, as our stock ratings are determined on a relative basis. (Please refer to definitions above.) An investor's decision to buy or sell a security should be based on investment objectives, current holdings, and other individual factors.
Credit Suisse’s policy is to update research reports as it deems appropriate, based on developments with the subject company, the sector or the market that may have a material impact on the research views or opinions stated herein.
Credit Suisse's policy is only to publish investment research that is impartial, independent, clear, fair and not misleading. For more detail please refer to Credit Suisse's Policies for Managing Conflicts of Interest in connection with Investment Research: http://www.csfb.com/research-and-analytics/disclaimer/managing_conflicts_disclaimer.html
Credit Suisse does not provide any tax advice. Any statement herein regarding any US federal tax is not intended or written to be used, and cannot be used, by any taxpayer for the purposes of avoiding any penalties. Important Regional Disclosures Singapore recipients should contact a Singapore financial adviser for any matters arising from this research report.
Restrictions on certain Canadian securities are indicated by the following abbreviations: NVS--Non-Voting shares; RVS--Restricted Voting Shares; SVS--Subordinate Voting Shares. Individuals receiving this report from a Canadian investment dealer that is not affiliated with Credit Suisse should be advised that this report may not contain regulatory disclosures the non-affiliated Canadian investment dealer would be required to make if this were its own report. For Credit Suisse Securities (Canada), Inc.'s policies and procedures regarding the dissemination of equity research, please visit http://www.csfb.com/legal_terms/canada_research_policy.shtml.
03 April 2012
Emerging Market Research Institute 69
The following disclosed European company/ies have estimates that comply with IFRS: ALSO.PA, ASSAb.ST, ATCOa.ST, WEIR.L.
As of the date of this report, Credit Suisse acts as a market maker or liquidity provider in the equities securities that are the subject of this report.
Principal is not guaranteed in the case of equities because equity prices are variable. Commission is the commission rate or the amount agreed with a customer when setting up an account or at anytime after that. Taiwanese Disclosures: Reports written by Taiwan-based analysts on non-Taiwan listed companies are not considered recommendations to buy or sell securities under Taiwan Stock Exchange Operational Regulations Governing Securities Firms Recommending Trades in Securities to Customers.
To the extent this is a report authored in whole or in part by a non-U.S. analyst and is made available in the U.S., the following are important disclosures regarding any non-U.S. analyst contributors: The non-U.S. research analysts listed below (if any) are not registered/qualified as research analysts with FINRA. The non-U.S. research analysts listed below may not be associated persons of CSSU and therefore may not be subject to the NASD Rule 2711 and NYSE Rule 472 restrictions on communications with a subject company, public appearances and trading securities held by a research analyst account. • Alexander Redman, non-U.S. analyst, is a research analyst employed by Credit Suisse Securities (Europe) Limited. • Arun Sai, non-U.S. analyst, is a research analyst employed by Credit Suisse Securities (Europe) Limited. For Credit Suisse disclosure information on other companies mentioned in this report, please visit the website at www.credit-suisse.com/researchdisclosures or call +1 (877) 291-2683. Disclaimers continue on next page.
03 April 2012
Emerging Market Research Institute 70
03 April 2012
Emerging Market Research Institute 71
03 April 2012 Global
Equity Research
XX5276EU.doc
This report is not directed to, or intended for distribution to or use by, any person or entity who is a citizen or resident of or located in any locality, state, country or other jurisdiction where such distribution, publication, availability or use would be contrary to law or regulation or which would subject Credit Suisse AG, the Swiss bank, or its subsidiaries or its affiliates (“CS”) to any registration or licensing requirement within such jurisdiction. All material presented in this report, unless specifically indicated otherwise, is under copyright to CS. None of the material, nor its content, nor any copy of it, may be altered in any way, transmitted to, copied or distributed to any other party, without the prior express written permission of CS. All trademarks, service marks and logos used in this report are trademarks or service marks or registered trademarks or service marks of CS or its affiliates. The information, tools and material presented in this report are provided to you for information purposes only and are not to be used or considered as an offer or the solicitation of an offer to sell or to buy or subscribe for securities or other financial instruments. CS may not have taken any steps to ensure that the securities referred to in this report are suitable for any particular investor. CS will not treat recipients as its customers by virtue of their receiving the report. The investments or services contained or referred to in this report may not be suitable for you and it is recommended that you consult an independent investment advisor if you are in doubt about such investments or investment services. Nothing in this report constitutes investment, legal, accounting or tax advice or a representation that any investment or strategy is suitable or appropriate to your individual circumstances or otherwise constitutes a personal recommendation to you. CS does not offer advice on the tax consequences of investment and you are advised to contact an independent tax adviser. Please note in particular that the bases and levels of taxation may change. CS believes the information and opinions in the Disclosure Appendix of this report are accurate and complete. Information and opinions presented in the other sections of the report were obtained or derived from sources CS believes are reliable, but CS makes no representations as to their accuracy or completeness. Additional information is available upon request. CS accepts no liability for loss arising from the use of the material presented in this report, except that this exclusion of liability does not apply to the extent that liability arises under specific statutes or regulations applicable to CS. This report is not to be relied upon in substitution for the exercise of independent judgment. CS may have issued, and may in the future issue, a trading call regarding this security. Trading calls are short term trading opportunities based on market events and catalysts, while stock ratings reflect investment recommendations based on expected total return over a 12-month period as defined in the disclosure section. Because trading calls and stock ratings reflect different assumptions and analytical methods, trading calls may differ directionally from the stock rating. In addition, CS may have issued, and may in the future issue, other reports that are inconsistent with, and reach different conclusions from, the information presented in this report. Those reports reflect the different assumptions, views and analytical methods of the analysts who prepared them and CS is under no obligation to ensure that such other reports are brought to the attention of any recipient of this report. CS is involved in many businesses that relate to companies mentioned in this report. These businesses include specialized trading, risk arbitrage, market making, and other proprietary trading. Past performance should not be taken as an indication or guarantee of future performance, and no representation or warranty, express or implied, is made regarding future performance. Information, opinions and estimates contained in this report reflect a judgement at its original date of publication by CS and are subject to change without notice. The price, value of and income from any of the securities or financial instruments mentioned in this report can fall as well as rise. The value of securities and financial instruments is subject to exchange rate fluctuation that may have a positive or adverse effect on the price or income of such securities or financial instruments. Investors in securities such as ADR’s, the values of which are influenced by currency volatility, effectively assume this risk. Structured securities are complex instruments, typically involve a high degree of risk and are intended for sale only to sophisticated investors who are capable of understanding and assuming the risks involved. The market value of any structured security may be affected by changes in economic, financial and political factors (including, but not limited to, spot and forward interest and exchange rates), time to maturity, market conditions and volatility, and the credit quality of any issuer or reference issuer. Any investor interested in purchasing a structured product should conduct their own investigation and analysis of the product and consult with their own professional advisers as to the risks involved in making such a purchase. Some investments discussed in this report have a high level of volatility. High volatility investments may experience sudden and large falls in their value causing losses when that investment is realised. Those losses may equal your original investment. Indeed, in the case of some investments the potential losses may exceed the amount of initial investment, in such circumstances you may be required to pay more money to support those losses. Income yields from investments may fluctuate and, in consequence, initial capital paid to make the investment may be used as part of that income yield. Some investments may not be readily realisable and it may be difficult to sell or realise those investments, similarly it may prove difficult for you to obtain reliable information about the value, or risks, to which such an investment is exposed. This report may provide the addresses of, or contain hyperlinks to, websites. Except to the extent to which the report refers to website material of CS, CS has not reviewed the linked site and takes no responsibility for the content contained therein. Such address or hyperlink (including addresses or hyperlinks to CS’s own website material) is provided solely for your convenience and information and the content of the linked site does not in any way form part of this document. Accessing such website or following such link through this report or CS’s website shall be at your own risk. This report is issued and distributed in Europe (except Switzerland) by Credit Suisse Securities (Europe) Limited, One Cabot Square, London E14 4QJ, England, which is regulated in the United Kingdom by The Financial Services Authority (“FSA”). This report is being distributed in Germany by Credit Suisse Securities (Europe) Limited Niederlassung Frankfurt am Main regulated by the Bundesanstalt fuer Finanzdienstleistungsaufsicht ("BaFin"). This report is being distributed in the United States by Credit Suisse Securities (USA) LLC ; in Switzerland by Credit Suisse AG; in Canada by Credit Suisse Securities (Canada), Inc.; in Brazil by Banco de Investimentos Credit Suisse (Brasil) S.A. or its affiliates; in Mexico by Banco Credit Suisse (México), S.A. (transactions related to the securities mentioned in this report will only be effected in compliance with applicable regulation); in Japan by Credit Suisse Securities (Japan) Limited, Financial Instrument Firm, Director-General of Kanto Local Finance Bureau (Kinsho) No. 66, a member of Japan Securities Dealers Association, The Financial Futures Association of Japan, Japan Securities Investment Advisers Association, Type II Financial Instruments Firms Association; elsewhere in Asia/Pacific by whichever of the following is the appropriately authorised entity in the relevant jurisdiction: Credit Suisse (Hong Kong) Limited, Credit Suisse Equities (Australia) Limited , Credit Suisse Securities (Thailand) Limited, Credit Suisse Securities (Malaysia) Sdn Bhd, Credit Suisse AG, Singapore Branch, Credit Suisse Securities (India) Private Limited regulated by the Securities and Exchange Board of India (registration Nos. INB230970637; INF230970637; INB010970631; INF010970631), having registered address at 9th Floor, Ceejay House,Dr.A.B. Road, Worli, Mumbai - 18, India, T- +91-22 6777 3777, Credit Suisse Securities (Europe) Limited, Seoul Branch, Credit Suisse AG, Taipei Securities Branch, PT Credit Suisse Securities Indonesia, Credit Suisse Securities (Philippines ) Inc., and elsewhere in the world by the relevant authorised affiliate of the above. Research on Taiwanese securities produced by Credit Suisse AG, Taipei Securities Branch has been prepared by a registered Senior Business Person. Research provided to residents of Malaysia is authorised by the Head of Research for Credit Suisse Securities (Malaysia) Sdn. Bhd., to whom they should direct any queries on +603 2723 2020. In jurisdictions where CS is not already registered or licensed to trade in securities, transactions will only be effected in accordance with applicable securities legislation, which will vary from jurisdiction to jurisdiction and may require that the trade be made in accordance with applicable exemptions from registration or licensing requirements. Non-U.S. customers wishing to effect a transaction should contact a CS entity in their local jurisdiction unless governing law permits otherwise. U.S. customers wishing to effect a transaction should do so only by contacting a representative at Credit Suisse Securities (USA) LLC in the U.S. Please note that this report was originally prepared and issued by CS for distribution to their market professional and institutional investor customers. Recipients who are not market professional or institutional investor customers of CS should seek the advice of their independent financial advisor prior to taking any investment decision based on this report or for any necessary explanation of its contents. This research may relate to investments or services of a person outside of the UK or to other matters which are not regulated by the FSA or in respect of which the protections of the FSA for private customers and/or the UK compensation scheme may not be available, and further details as to where this may be the case are available upon request in respect of this report. Any Nielsen Media Research material contained in this report represents Nielsen Media Research's estimates and does not represent facts. NMR has neither reviewed nor approved this report and/or any of the statements made herein. If this report is being distributed by a financial institution other than Credit Suisse AG, or its affiliates, that financial institution is solely responsible for distribution. Clients of that institution should contact that institution to effect a transaction in the securities mentioned in this report or require further information. This report does not constitute investment advice by Credit Suisse to the clients of the distributing financial institution, and neither Credit Suisse AG, its affiliates, and their respective officers, directors and employees accept any liability whatsoever for any direct or consequential loss arising from their use of this report or its content. Copyright 2012 CREDIT SUISSE AG and/or its affiliates. All rights reserved.