Investment Focus Emerging Markets Debt: An Asset Class in Its Own Right Less than a decade ago, debt issued by emerging-market countries was not considered a meaningful investment option for global investors. In most cases, any emerging-market debt regarded as suitable for investment was issued in “hard” currencies, such as the US dollar, and local-currency debt was granted even less prominence in global portfolios. Generally, any allocations to emerging-market debt were part of broader fixed-income strategies. Back then, emerging- market nations that issued hard-currency debt entered into a substantial foreign currency liability mismatch, which led to bankruptcies and crises. Over the past decade, the emerging debt market has increased in breadth as well as depth, and has become an asset class worthy of consideration in its own right for many portfolios.
Transcript
Investment Focus
Emerging Markets Debt: An Asset Class in Its Own RightLess than a decade ago, debt issued by emerging-market countries was not considered a meaningful investment option for global investors. In most cases, any emerging-market debt regarded as suitable for investment was issued in “hard” currencies, such as the US dollar, and local-currency debt was granted even less prominence in global portfolios. Generally, any allocations to emerging-market debt were part of broader fixed-income strategies. Back then, emerging-market nations that issued hard-currency debt entered into a substantial foreign currency liability mismatch, which led to bankruptcies and crises. Over the past decade, the emerging debt market has increased in breadth as well as depth, and has become an asset class worthy of consideration in its own right for many portfolios.
2
IntroductionOver the last decade, emerging markets (EM) have evolved from unstable, volatile countries to become solid economies. Today, many EM countries benefit from strong macroeconomic fundamentals relative to their developed-market counterparts. More importantly, emerging economies now represent a greater portion of global GDP, and their growth rates significantly outpace those of developed markets. As such, the term “emerging” may no longer be an accurate description for some countries currently grouped in this universe. In this paper, we examine how this macroeconomic backdrop, among other factors, has helped develop the investment opportunity set in the emerging markets, particularly in emerging markets fixed income (interchangeably called emerging markets debt, or EMD).
While some countries in the emerging world remain susceptible to economic and political turbulence, over the last several years the vast majority of EM countries have established stronger political institu-tions and implemented sound economic policies. Central banks are now independent and credible, which helps achieve much lower infla-tion. In addition, significant fiscal adjustments have led to a speedy reduction of public debt burdens. From an external debt perspective, sizable foreign direct-investment inflows have contributed to more stable sources of current-account financing. In addition, creditor-friendly laws have laid the foundation for larger, more mature EMD markets.¹
How Big Is the EM Debt Market? As the emerging markets debt asset class has developed, it has become a compelling component of global portfolios. Fundamentally, the EMD market is divided into two principal categories: 1) external or hard-currency debt, which is issued in a currency other than that of the issuer’s domestic currency (hard currencies refer to globally trad-able, reliable, and stable currencies such as the US dollar or euro) and 2) local-currency debt, which is denominated in the domestic currency of the issuer. Historically, local debt markets were under-developed, and as a result, emerging countries primarily issued hard-currency debt, mostly in US dollars. In some cases, this practice contributed to foreign exchange and debt crises as exchange rate fluctuations caused liabilities in hard currencies to balloon. Some examples of this include Mexico and Thailand in the 1990s and Argentina in the early 2000s. However, as macroeconomic fundamentals improved in EM coun-tries, local currency markets have also deepened, reducing dependence on external debt and avoiding its associated risks.
In Exhibit 1, we show the total outstanding debt in emerging markets, which rose to approximately $11 trillion based on the most recently available data from the Bank of International Settlements (BIS),² mostly due to the expansion of the local-currency market. In contrast, the market capitalization of the Barclays Capital Global Aggregate Bond Index—a proxy for the global investment-grade bond market—was approximately $43 trillion as of October 2012. This supports the assertion that the size of the asset class is now significant.
Data by issuing sector (government, financial institutions, and corpo-rates) show that the percentage of total local-currency debt for each sector has remained relatively static over the past decade. However, for hard-currency debt the percentage of government issuance has significantly declined. This suggests that as local-currency debt mar-
kets continue to develop, sovereigns are shifting away from issuing hard-currency debt implying reduced future foreign exchange risks as illustrated in Exhibit 2. In addition, when combining the local- and hard-currency debt universes, the non-governmental sector (i.e., financial institutions and corporates) accounts for roughly 45% of the total debt outstanding, signaling a growing opportunity set beyond sovereign debt.
Thus far, we have examined EMD in aggregate, but it is important to note that the countries within the total universe are considerably diverse. From a regional perspective, Asia holds the dominant posi-tion in local-currency debt, whereas the share of hard-currency debt is divided more evenly, with Latin America leading its peers as shown in Exhibit 3. When analyzing on an individual country level, as shown in Exhibit 4, the regional results are confirmed. Several Asian countries are ranked in the top ten domestic debt issuers, while the top ten external debt issuers are more balanced. It is also important to note that the inflation-linked bond universe has also grown significantly, reaching $470 billion in September 2012. Given that the inflation
Exhibit 1Emerging Markets Debt Has Reached Meaningful Volume
0
2,000
4,000
6,000
8,000
10,000
12,000
2012201120102009200820072006200520042003
($ billions)
External
Local
For the period December 2003 to the most recently available data. External debt as of June 2012; local debt as of March 2012.
Source: BIS, Haver Analytics
Exhibit 2Composition of Emerging-Market Debt by Sector
0
20
40
60
80
100
2012200220122002
(%)
Corporate
Local External
FinancialInstitutions
Government
External debt as of June 2012; local debt as of March 2012.
Source: BIS, Haver Analytics
3
environment in EM countries is generally more volatile than those in developed markets, we believe inflation-linked bonds offer a compel-ling option. In terms of regions, Latin America commands the greatest share of these securities, representing 77% of the total.³
Although EMD markets have grown by an impressive amount and reached a considerable size, this does not directly correspond to the size of the actually tradable market, given that many EM assets have restricted access, low liquidity, or are subject to regulatory controls. Foreign exchange is also an important factor for international inves-tors, and the EM universe encompasses the range of currency policies, from countries that have a free-floating and convertible currency to those whose currency markets are subject to strict controls. In addi-tion, regulatory constraints for international investors may also limit access to capital markets in some countries. Therefore, we believe the total size of the tradable market matters most for overseas investors and at year-end 2011 this market reached an estimated $2.5 trillion.4 As such, investors should closely follow policy developments that
could improve access to these assets, in our view, as the future supply of EMD assets relates to the growth of the tradable market.
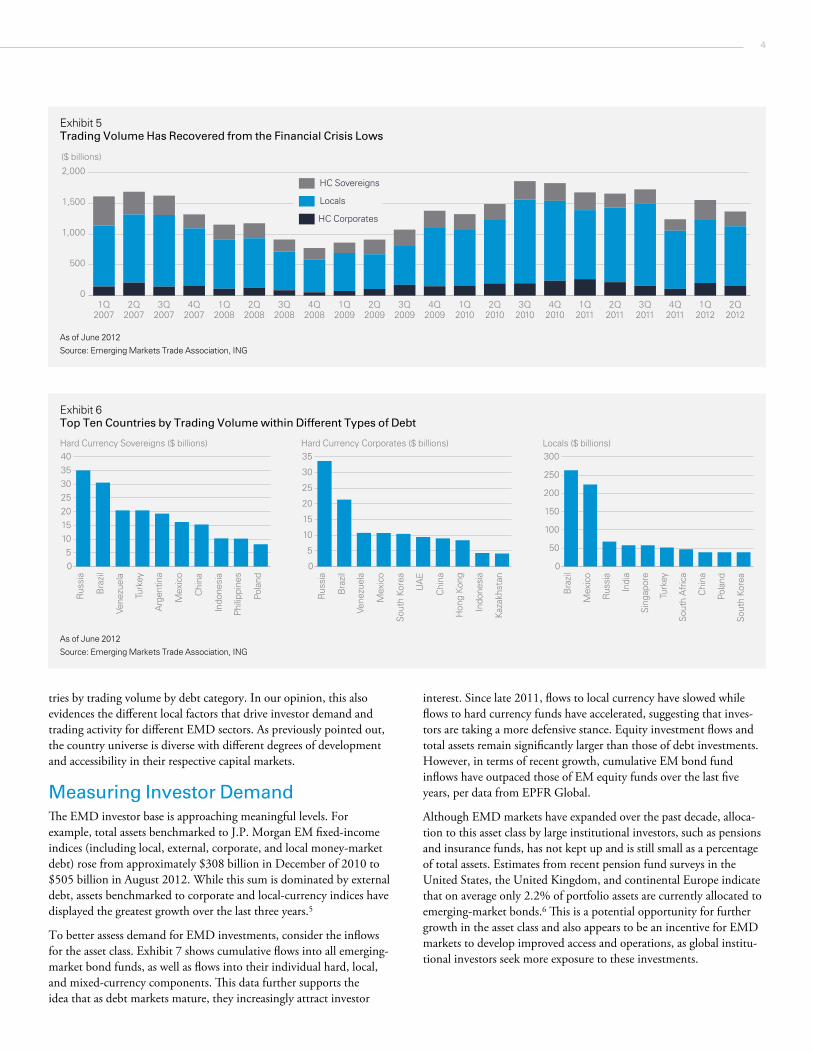
EMD Displays Renewed LiquidityTrading volume of EMD assets has improved from the lows of 2009, which also represents a recovery in the last two years relative to the 2007 to 2009 period, which included the height of the financial crisis. In Exhibit 5 we show the trading volume for locally traded debt (independent of the currency of issue, for example this category would include US dollar and Brazilian real debt traded within Brazil), and hard currency sovereign and corporate debt. The strong recovery in overall trading volume since the crisis demonstrates the resilience of EMD markets, as their liquidity bounced back after the crisis. This rebound further illustrates the meaningful degree to which EMD markets have developed in the context of global capital markets. With respect to individual countries, several display higher trading volume across different debt categories. Exhibit 6 shows the top ten coun-
Exhibit 3Asia Has the Lion’s Share of Local Debt while External Debt Is More Evenly Distributed
Latin America24%
Europe8%
Asia65%
Africa and Middle East2%
Latin America36%
Europe24%
Asia27%
Africa and Middle East13%
Local External
As of March 2012
Source: BIS, Haver Analytics
As of June 2012
Source: BIS, Haver Analytics
Exhibit 4Top Ten Countries, Local and External Debt
Local External
0
500
1,000
1,500
2,000
2,500
3,000
3,500
SouthAfrica
TurkeyThailandTaiwan Malay-sia
MexicoIndiaSouthKorea
BrazilChina
($ billions)
0
50
100
150
200
250
India Vene-zuela
Turkey Poland UAE MexicoChinaSouthKorea
Russia Brazil
($ billions)
As of March 2012
Source: BIS, Haver Analytics
As of June 2012
Source: BIS, Haver Analytics
4
tries by trading volume by debt category. In our opinion, this also evidences the different local factors that drive investor demand and trading activity for different EMD sectors. As previously pointed out, the country universe is diverse with different degrees of development and accessibility in their respective capital markets.
Measuring Investor DemandThe EMD investor base is approaching meaningful levels. For example, total assets benchmarked to J.P. Morgan EM fixed-income indices (including local, external, corporate, and local money-market debt) rose from approximately $308 billion in December of 2010 to $505 billion in August 2012. While this sum is dominated by external debt, assets benchmarked to corporate and local-currency indices have displayed the greatest growth over the last three years.5
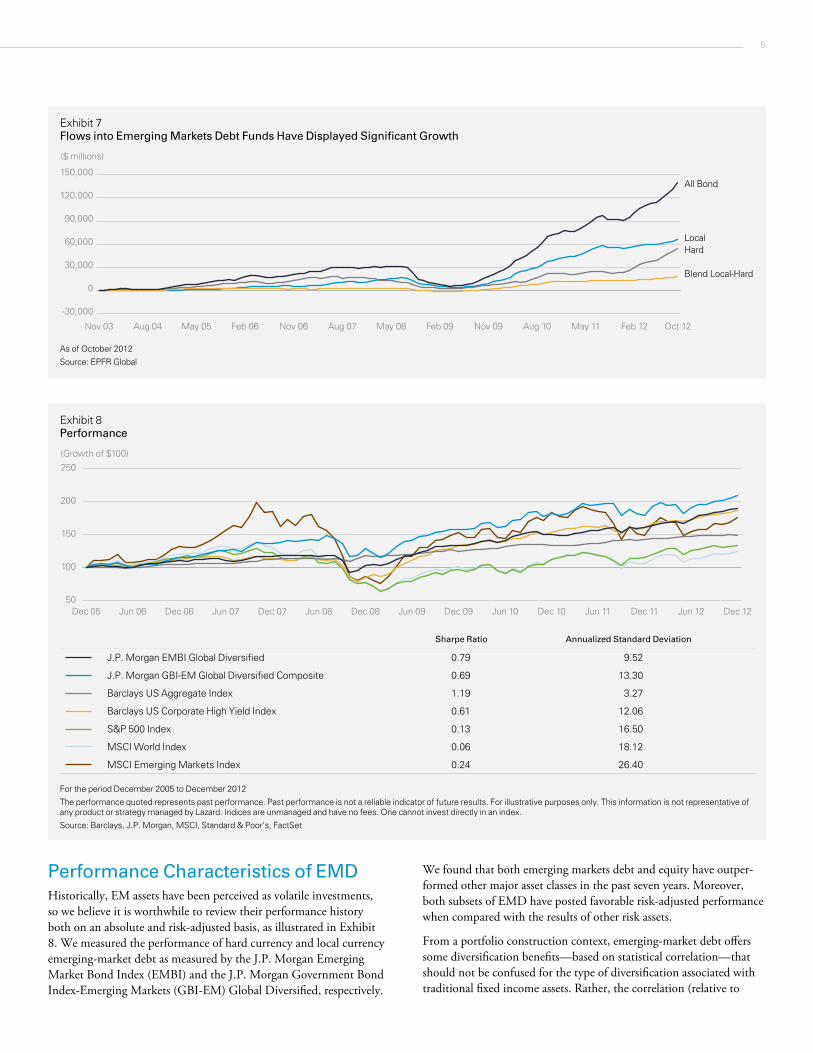
To better assess demand for EMD investments, consider the inflows for the asset class. Exhibit 7 shows cumulative flows into all emerging-market bond funds, as well as flows into their individual hard, local, and mixed-currency components. This data further supports the idea that as debt markets mature, they increasingly attract investor
interest. Since late 2011, flows to local currency have slowed while flows to hard currency funds have accelerated, suggesting that inves-tors are taking a more defensive stance. Equity investment flows and total assets remain significantly larger than those of debt investments. However, in terms of recent growth, cumulative EM bond fund inflows have outpaced those of EM equity funds over the last five years, per data from EPFR Global.
Although EMD markets have expanded over the past decade, alloca-tion to this asset class by large institutional investors, such as pensions and insurance funds, has not kept up and is still small as a percentage of total assets. Estimates from recent pension fund surveys in the United States, the United Kingdom, and continental Europe indicate that on average only 2.2% of portfolio assets are currently allocated to emerging-market bonds.6 This is a potential opportunity for further growth in the asset class and also appears to be an incentive for EMD markets to develop improved access and operations, as global institu-tional investors seek more exposure to these investments.
Exhibit 5Trading Volume Has Recovered from the Financial Crisis Lows
0
500
1,000
1,500
2,000
2Q2012
1Q2012
4Q2011
3Q2011
2Q2011
1Q2011
4Q2010
3Q2010
2Q2010
1Q2010
4Q2009
3Q2009
2Q2009
1Q2009
4Q2008
3Q2008
2Q2008
1Q2008
4Q2007
3Q2007
2Q2007
1Q2007
($ billions)
HC Sovereigns
Locals
HC Corporates
As of June 2012
Source: Emerging Markets Trade Association, ING
Exhibit 6Top Ten Countries by Trading Volume within Different Types of Debt
05
10152025303540
Pola
nd
Phili
ppin
es
Indo
nesi
a
Chi
na
Mex
ico
Arg
entin
a
Turk
ey
Vene
zuel
a
Bra
zil
Rus
sia
Hard Currency Sovereigns ($ billions)
0
50
100
150
200
250
300
Sout
h Ko
rea
Pola
nd
Chi
na
Sout
h A
fric
a
Turk
ey
Sing
apor
e
Indi
a
Rus
sia
Mex
ico
Bra
zil
Locals ($ billions)
0
5
10
15
20
25
30
35
Kaza
khst
an
Indo
nesi
a
Hon
g Ko
ng
Chi
na
UA
E
Sout
h Ko
rea
Mex
ico
Vene
zuel
a
Bra
zil
Rus
sia
Hard Currency Corporates ($ billions)
As of June 2012
Source: Emerging Markets Trade Association, ING
5
Performance Characteristics of EMDHistorically, EM assets have been perceived as volatile investments, so we believe it is worthwhile to review their performance history both on an absolute and risk-adjusted basis, as illustrated in Exhibit 8. We measured the performance of hard currency and local currency emerging-market debt as measured by the J.P. Morgan Emerging Market Bond Index (EMBI) and the J.P. Morgan Government Bond Index-Emerging Markets (GBI-EM) Global Diversified, respectively.
We found that both emerging markets debt and equity have outper-formed other major asset classes in the past seven years. Moreover, both subsets of EMD have posted favorable risk-adjusted performance when compared with the results of other risk assets.
From a portfolio construction context, emerging-market debt offers some diversification benefits—based on statistical correlation—that should not be confused for the type of diversification associated with traditional fixed income assets. Rather, the correlation (relative to
Exhibit 7Flows into Emerging Markets Debt Funds Have Displayed Significant Growth
J.P. Morgan GBI-EM Global Diversified Composite 0.69 13.30
Barclays US Aggregate Index 1.19 3.27
Barclays US Corporate High Yield Index 0.61 12.06
S&P 500 Index 0.13 16.50
MSCI World Index 0.06 18.12
MSCI Emerging Markets Index 0.24 26.40
For the period December 2005 to December 2012
The performance quoted represents past performance. Past performance is not a reliable indicator of future results. For illustrative purposes only. This information is not representative of any product or strategy managed by Lazard. Indices are unmanaged and have no fees. One cannot invest directly in an index.
Source: Barclays, J.P. Morgan, MSCI, Standard & Poor’s, FactSet
6
equities) and volatility of EMD indices more closely resemble that of US high-yield bonds to as shown in Exhibit 9.
The currency denomination of EMD is also important to consider when evaluating diversification benefits for a portfolio. The hard-currency interest rate component of external debt may be able to offset some of the fluctuation in these risk assets, as shown by the lower volatility of the EMBI. Local-currency debt, however, is dependent on foreign-exchange movements as well as local interest rates leading to higher correlation than external debt in relation to other risk assets.
ConclusionIn the past, emerging-market debt has not been considered a meaningful asset class for global investors. However, over time the fundamentals of emerging economies have evolved and strengthened, which has contributed to the deepening of EM capital markets. In the last decade, EMD as an asset class has matured as EM countries increasingly facilitate access for foreign investors and as the debt market continues to grow. Specifically, local currency debt currently surpasses the size of external debt as many sovereigns can access their own deeper domestic markets for funding, thus avoiding exposure to exchange rate risk.
In addition, as market-wide volatility from the financial crisis sub-sided, EMD liquidity (as measured by trading volume) has rebounded, suggesting that investors are ready to re-enter these markets. This might not have been possible without the added depth to EM capital markets and the strides in improved fundamentals made in EM coun-tries over the past ten years. Investor appetite for EMD assets has not only increased significantly in the past decade, but has accelerated over the past three years, as demonstrated by mutual fund flows.
In our view, the EMD opportunity set and global investor inter-est in the asset class are only just beginning to develop. The average allocation to EMD by large institutional investors based in developed markets remains low. Any increase in portfolio allocations to this area should result in an increase in demand that will likely have a positive impact on asset prices.
Exhibit 9Correlation
J.P. Morgan EMBI Global Diversified
J.P. Morgan GBI-EM Global
Diversified Composite
Barclays US Aggregate Index
Barclays US Corporate High
Yield Index S&P 500 IndexMSCI
World IndexMSCI Emerging Markets Index
J.P. Morgan EMBI Global Diversified 1.00
J.P. Morgan GBI-EM Global Diversified Composite
0.80 1.00
Barclays US Aggregate Index 0.58 0.36 1.00
Barclays US Corporate High Yield Index 0.79 0.66 0.21 1.00
The performance quoted represents past performance. Past performance is not a reliable indicator of future results. For illustrative purposes only. This information is not representative of any product or strategy managed by Lazard. Indices are unmanaged and have no fees. One cannot invest directly in an index.
Source: Barclays, J.P. Morgan, MSCI, Standard & Poor’s, FactSet
7
LR22746
Notes1 Burger, John, et al. “Emerging Local Currency Bond Markets.” Financial Analysts Journal, July/August 2012.
2 Based on Securities Statistics Tables (International and Domestic Debt Securities). Includes countries under the Developing Countries category only, excludes Offshore Centers, Developed Countries, and International Organizations. Please note this information is included as it pertains to Exhibits 1–4.
3 Chang, Joyce, et al. “Local Markets Guide Emerging Markets Research.” J.P. Morgan Securities, September 2012.
4 Rahman, Rashique and Juha Seppala. “EM Profile Small Fish in a Big Pond.” Morgan Stanley Research, May 2012.
5 Chang, Joyce, et al. “Local Markets Guide Emerging Markets Research.” J.P. Morgan Securities, September 2012.
6 Rahman, Rashique and Juha Seppala. “EM Profile Small Fish in a Big Pond.” Morgan Stanley Research, May 2012.
Important InformationOriginally published on 27 February 2013. Revised and republished on 1 March 2013.
This paper is for informational purposes only. It is not intended to, and does not constitute an offer to, enter into any contract or investment agreement in respect of any product offered by Lazard Asset Management and shall not be considered as an offer or solicitation with respect to any product, security, or service in any jurisdiction or in any circumstances in which such offer or solicita-tion is unlawful or unauthorized or otherwise restricted or prohibited.
Information and opinions presented have been obtained or derived from sources believed by Lazard to be reliable. Lazard makes no representation as to their accuracy or completeness. All opin-ions expressed herein are as of the date of this publication and are subject to change.
An investment in emerging-market debt positions are subject to the general risks associated with fixed income investing, such as interest rate risk and credit risk, as well as the risks associated with emerging-market investments, including currency fluctuation, devaluation, and confiscatory taxation.
Investments in global currencies are subject to the general risks associated with fixed income investing, such as interest rate risk, as well as the risks associated with non-domestic investments, which include, but are not limited to, currency fluctuation, devaluation, and confiscatory taxation. Furthermore, certain investment techniques required to access certain emerging-market curren-cies, such as swaps, forwards, structured notes, and loans of portfolio securities, involve risk that the counterparty to such instruments or transactions will become insolvent or otherwise default on its obligation to perform as agreed. In the event of such default, an investor may have limited recourse against the counterparty and may experience delays in recovery or loss.
Investments denominated in currencies other than US dollars involve certain considerations not typically associated with investments in US issuers or securities denominated or traded in US dollars. There may be less publicly available information about issuers in non-US countries that may not be subject to uniform accounting, auditing, and financial reporting standards and other disclosure requirements comparable to those applicable to US issuers.
All index data is shown for illustrative purposes only and is not intended to reflect the performance of any product or strategy managed by Lazard.
The securities and/or information referenced should not be considered a recommendation or solicitation to purchase or sell these securities. It should not be assumed that any of the referenced securities were or will prove to be profitable, or that the investment decisions we make in the future will be profitable or equal to the investment performance of securities referenced herein.
Certain information included herein is derived by Lazard in part from an MSCI index or indices (the “Index Data”). However, MSCI has not reviewed this product or report, and does not endorse or express any opinion regarding this product or report or any analysis or other information contained herein or the author or source of any such information or analysis. MSCI makes no express or implied warranties or representations and shall have no liability whatsoever with respect to any Index Data or data derived therefrom. The MSCI Index Data may not be further redistributed or used as a basis for other indices or any securities or financial products.
Past performance is not a reliable indicator of future results.
This paper and all research and materials enclosed are the property of Lazard Asset Management LLC.
Australia: Issued by Lazard Asset Management Pacific Co., Level 39 Gateway, 1 Macquarie Place, Sydney NSW 2000. Germany: Issued by Lazard Asset Management (Deutschland) GmbH, Neue Mainzer Strasse 75, D-60311 Frankfurt am Main. Japan: Issued by Lazard Japan Asset Management K.K., ATT Annex, 7th Floor, 2-11-7 Akasaka, Minato-ku, Tokyo 107-0052. Korea: Issued by Lazard Korea Asset Management Co. Ltd., 10F Seoul Finance Center, Taepyeongno-1ga, Jung-gu, Seoul, 100-768. United Kingdom: For Professional Investors Only. Issued by Lazard Asset Management Ltd., 50 Stratton Street, London W1J 8LL. Registered in England Number 525667. Authorised and regulated by the Financial Services Authority (FSA). United States: Issued by Lazard Asset Management LLC, 30 Rockefeller Plaza, New York, NY 10112.
About the Lazard Emerging Markets Debt Team
The Lazard Emerging Markets Debt team employs a flexible management approach that seeks to add value by managing through different market environments. As active managers, they believe that bottom-up, security-specific analysis, in concert with a focus on fundamental global market trends, enables them to capitalize on the opportunities presented by inef-ficient markets.
The team was established at Lazard in 2010, comprising members of a well-known emerging markets debt team who to date have worked together for over 10 years, with 17 years of industry experience on average. The team has adhered to a consistent philosophy throughout its history.