16
EMERGING MARKETS M&A REVIEW EMERGING MARKETS M&A REVIEW FINANCIAL ADVISORS First Quarter 2012

EMERGING MARKETS M&A REVIEWEMERGING MARKETS M&A REVIEWFINANCIAL ADVISORS
First Quarter 2012
Citi took the top spot in the Emerging Markets for the first quarter of 2012, with US$18.5 billion in announceddeals. Goldman Sachs and Credit Suisse took the second and third spots, respectively.
First Quarter 2012 | Mergers & Acquisitions | Financial Advisors
Emerging Markets M&AEmerging Markets M&A Down 33% | Represents 28% of Global M&A | Fees Down 37% | Materials Most Active Sector
Average EBITDA multiples across the Emerging Markets decreased to 11.3x, ranging from 5.7x in SouthAfrica to 16.7x in India. The average bid premium to 4 week stock price was 27.8%.
Emerging Market Announced M&AEmerging Markets Deals Intelligence
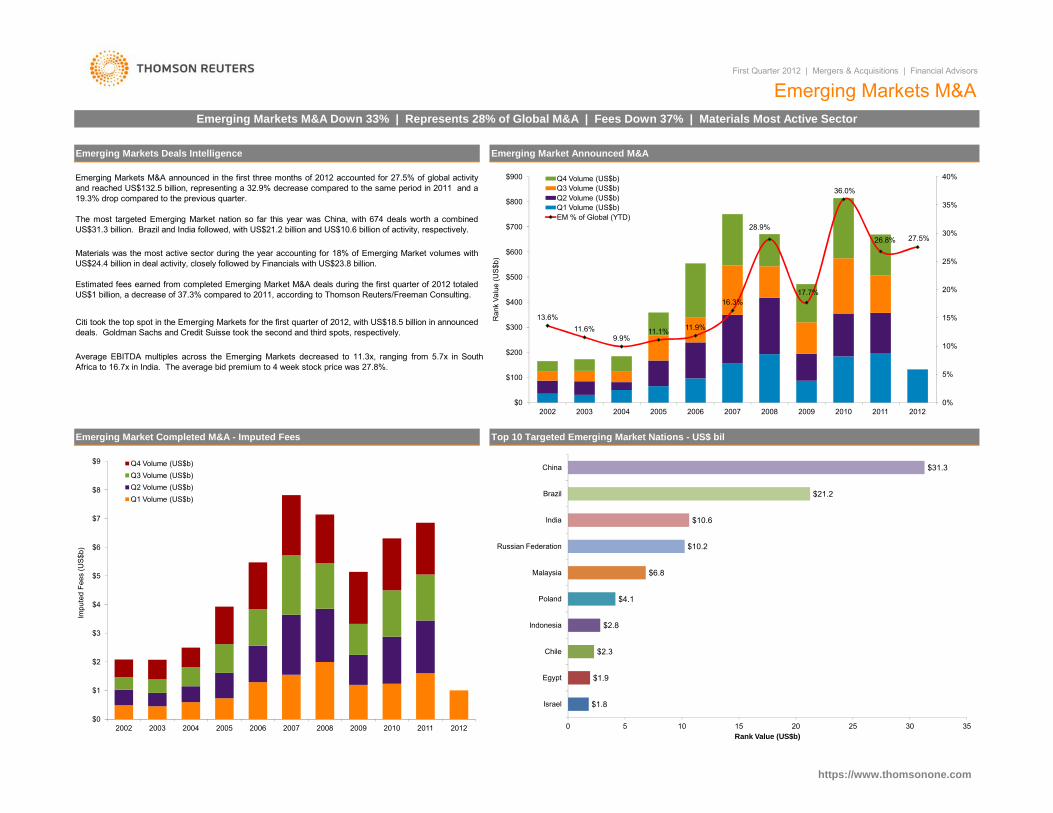
Emerging Markets M&A announced in the first three months of 2012 accounted for 27.5% of global activityand reached US$132.5 billion, representing a 32.9% decrease compared to the same period in 2011 and a19.3% drop compared to the previous quarter.
The most targeted Emerging Market nation so far this year was China, with 674 deals worth a combinedUS$31.3 billion. Brazil and India followed, with US$21.2 billion and US$10.6 billion of activity, respectively.
Materials was the most active sector during the year accounting for 18% of Emerging Market volumes withUS$24.4 billion in deal activity, closely followed by Financials with US$23.8 billion.
Estimated fees earned from completed Emerging Market M&A deals during the first quarter of 2012 totaledUS$1 billion, a decrease of 37.3% compared to 2011, according to Thomson Reuters/Freeman Consulting.
13.6%11.6%
9.9%11.1% 11.9%
16.3%
28.9%
17.7%
36.0%
26.8% 27.5%
5%
10%
15%
20%
25%
30%
35%
40%
$100
$200
$300
$400
$500
$600
$700
$800
$900
Ran
k Va
lue
(US$
b)
Q4 Volume (US$b)Q3 Volume (US$b)Q2 Volume (US$b)Q1 Volume (US$b)EM % of Global (YTD)
Emerging Market Completed M&A - Imputed Fees Top 10 Targeted Emerging Market Nations - US$ bil
$0
$1
$2
$3
$4
$5
$6
$7
$8
$9
2002 2003 2004 2005 2006 2007 2008 2009 2010 2011 2012
Impu
ted
Fees
(US$
b)
Q4 Volume (US$b)Q3 Volume (US$b)Q2 Volume (US$b)Q1 Volume (US$b)
0%$0
$
2002 2003 2004 2005 2006 2007 2008 2009 2010 2011 2012
$1.8
$1.9
$2.3
$2.8
$4.1
$6.8
$10.2
$10.6
$21.2
$31.3
0 5 10 15 20 25 30 35
Israel
Egypt
Chile
Indonesia
Poland
Malaysia
Russian Federation
India
Brazil
China
Rank Value (US$b)
https://www.thomsonone.com

5.4x - - 13.0x13.7x11.4x 14.7x12.5x --
- -
21.0x --
-
-
26.0x12.8x
--
12.7x
8.0x
17.4x13.2x- -
5.6x
-
17.4x6.1x- 18.5x -
16.4x -- 20.4x14.8x
13.0x 12.9x
16.8x --
8.5x
--17.4x
-
16.3x
- 32.8x 13.5x 21.0x
25.6x12.8x12.1x
9.1x
9.4x11.0x 8.2x 8.5x- - 10.2x 7.9x-
11.6x39.5x 3.7x
-8.8x-
- 19.6x 18.7x
25.4x
-
5.9x
13.3x
7.4x
10.4x
-
7.3x-
-
13.6x
- 26.8x
7.1x
9.8x - 21.2x
- 41.4x
15.3x
17.0x
6.8x
17.7x
-
- -
11.4x
9.6x
14.8x
5.8x 15.8x
3.9x
34.7x
-8.2x
8.0x
9.5x
-2.2x
5.3x
-
13.5x 16.4x
11.5x17.3x
14.3x
18.7x
4.7x
14.0x
-
6.8x
-
-
15.5x9.2x
10.4x11.4x
13.4x
Consumer Products and Services 4.3x 4.3x
9.6x8.5x
10.2x
19.0x 13.8x
Retail
15.2x
Real Estate
-
Energy and Power
7.7x
17.1x
12.9x
14.3x
19.6x
13.1x
High Technology
Healthcare
Materials 7.9x
15.9x
13.5x
10.7x 11.4x 11.4x
11.7x
12.8x 12.4x
8.4x
12.5x
8.2x
9.6xTelecommunications
12.1x
9.3x
15.7x
30.4x
3.9x
Exit Multiple Matrix - Year to Date Average Rank Value / EBITDA
-
-
Middle East & North Africa
- 5.4x
8.7x
-8.5x
-
South Africa Eastern Europe
- 2.3x
15.3x
22.7x
-
4.3x
13.1x
Asia Pacific Emerging Mkts
7.2x
14.7x
7.3x 6.8x
6.3x
3.4x 7.7x
3.9x
India
6.2x
Industrials
Media and Entertainment
Latin America
4.7x
14.0x
25.0x
-
Consumer Staples 11.1x
2011BRIC
-
China
7.2x
Emerging Markets2012 UP
2011 DOWN
First Quarter 2012 | Mergers & Acquisitions | Financial Advisors
Emerging Markets M&A
Average Industry Total 27.8 34.123.5 27.8
44.0 17.0 37.6 - -
27.2 43.4
* Using the valuations matrix you can analyze the average rank value to EBITDA and average premium to 4 week stock price prior to announcement by nation/region, which is indicated in the top row and broken down by target macro industries. * The data given refers to the time period 01/01/2012 - 03/30/2012 and all spinoffs, splitoffs, open market repurchases, exchange offers and equity carveouts are excluded. * The figures in red indicate a decline, while green indicates an increase, compared to the figures from the same time period last year listed in black. * Additionally, for Rank Value/EBITDA the data is capped at 50x and for average premium to 4 week stock price prior to announcement is capped at 100%.
27.223.125.516.4
-
20.1 26.932
71.913.1 -
19.6
21.8 65.320.638.9
19.1 29.310.619.5
- -9.8 25.69.8Retail
40.715.240.3- 9.2
25.6
-
-25.69.8 39.7 9.8 -- -- - 53.9-
- - 36.5-
- 41.5- - -
-
-
-- - 41.5-
5.1
25.9 - 16.7
21.6
26.9
-
41.73.8 12.9
- 18.6
33.0 30.417.3 - 36.9- 13.824.4Industrials 32.1 15.0 29.7 17.9 - 6.1 50.8
27.4
29.4
9.9
31.7 14.3
23.9 31.2 27.3
-
-
- 24.4 3.814.9 -
30.011.7 40.3
-
27.5
- -
- 25.3
- -
- -
29.2 12.2
31.8 24.4
-32.8 - 35.6 - -55.8 27.4
49.4
-
-
47.9 -2.7
25.2-
-4.623 14.01.8 27.2
18.7 -40.5 - -- 4.0 - 9.7 50.6
- - - 8.1
- 28.4
41.846.123.6
25.010.8 - 58.2 - - -
46.4
Latin America Eastern EuropeSouth Africa
- -
Middle East & North Africa
9.3x 16.7x
13.2 -
India
6.6 25.8 0.0 25.8
9.1x 12.6x11.4x 15.4x
ChinaAsia Pacific Emerging Mkts
11.9x12.0x 14.9x15.6x
17.9 24.8
30.4 12.2
11.3x 12.2x 14.4x
Healthcare
15.1
Media and Entertainment
Financials
13.1x
Emerging Markets
30.6
16.9
-
25.8
18.5
31.2
36.9
18.2
40.5 39.1-
4.0
27.4
Consumer Products and Services
27.1
52.6
34.0
28.2
29.3
-
24.1
22.8
33.2 21.7
6.9
Consumer Staples
Energy and Power
BRIC
31.3
41.5
6.62011
30.3
24.9
36.9
13.4Real Estate
5.7x
- 26.8
12.8x 13.0x
-27.6
Bid Premium Matrix - Year to Date Average Premium to 4 Week Stock Price2012 UP
2011 DOWN
15.7
25.5
24.9
31.9
21.5
8.9x
Telecommunications
Materials
11.7
Average Industry Total
High Technology
8.3
https://www.thomsonone.com

UBS Goldman Sachs & Co
Imputed Fees (US$m)Market
Any Emerging Markets Involvement Completed
First Quarter 2012 | Mergers & Acquisitions | Financial Advisors
2012 Rank
2011 Rank
Rank ValueDeals
Change in Sh (%)
# of# of Deals per AdvisorRank Value per Advisor (US$m)# of Deals per Advisor
# ofMarket
Jan 1 – Mar 30
Sh (%)Financial Advisor US$mMarket
Emerging Markets M&A
Jan 1 – Mar 30
▲
10,164.7
▼
1.5
Share Ch.
-1.7 -13
-11
# of Deals
-4
Any Emerging Markets Involvement Announced
Rank Value per Advisor (US$m)
4.2
14.0
▼1 0.01.3
-1.8
▲
▲
1.8
0.7
9,819.7
5,618.0
2
1.8Malayan Banking Bhd
7▼-2.5
4.2
1.6 -5.7
Credit Suisse 3 5 12,518.8 9.5
13
▲
Grant Thornton
4,799.8
Morgan Stanley 4 2 11,155.7
8,614.1
Rothschild 5
▲
BNP Paribas SA 13 10 3.6 -2.0KPMG 2.114 32
4▼-0.9
-9
7
8
+4
-3
+1▼
4.08 ▼ 16.5▲ .3
0.8
1.6
1.1
8.0
1.4▼
Itau Unibanco 1,511.7
▲ 5 ▼-1
▲
Lazard▼
▲
11 0.4
Standard Chartered PLC 11 23 1.5 0.2
4,666.9 3.5▼
237.7 ▲ 13
6
▼10,248.2
8.4 -7.00.43.6
11 ▼▼
0.1
-5
0.10.3 -16
-40.7 10,426.7Citi-7 0.6▲12.2 ▼
Market
▼Share Ch.
Rank Value2012 Rank
2011 Rank
126US$mFinancial Advisor Sh (%)
3.6
Market
20 1
Market MarketDeals Sh (%) # of Deals Fees Sh (%)
Change in Share Ch.
Advisor Market
0.5 ▲2.828.3 0.1 ▼3.534.7
Citi 1 8 18,533.9 6.810.7Goldman Sachs & Co 2 1 14,111.3 -10.0 2▼ 21
17▼▼
Deutsche Bank AG0.71.0
▼-14 10,401.4 -1.0 0.9▼ 160.60.8
-6 12.273
+2UBS ▲ 11
▼ 10-3.23 10.5▼9,732.4 ▼-10 2.82.8 0.728.00.611.4
-11▲ JP Morgan 48.9 ▼
8,901.4 0.5-6.02
▼18.5 1.8 3.5▼▼0.4▼ 2.8-60.67,590.8 11Bank of America Merrill Lynch▼
▼0.86,502.255
▼39.0 3.9 0.828.5
-6-2.8 ▼ 140.70.1 13▲11
7.7▲▼ 17 0.63
7.4 0.43.1JP Morgan
5,846.6 6.99
6 7.6Credit Suisse7
8Itau Unibanco 7.26,135.4Rothschild
2.9 ▲ 58 19Bank of America Merrill Lynch 8BR Partners 9 5.2115 7,077.9
4 6.55.3
10-0 9
-613 0.43 Societe Generale
▼ 6.58 5,515.55,537.859*
10 6 7,016.4 5.3 -2.3
1.1 ▲11.0 1.16.5
▼ BBVA ▲+20.3
▲3.3 0.3
1.8▲1.212.2
0▼ 7 ▼
- 1.76.0 ▲17.9-2.0 0.4
0.23
11HSBC Holdings PLC 12 9 0.45,502.5 -2.4 12▼
China International Capital Co4,660.14,916.3
4,083.30.34.1
5.85.5
-1.9 ▼12 36▲+4 Standard Chartered PLC
10-4
31
0.54.8▲
4 0.2▲ 1.3+15
▼-4 ▼▲19.2 1.9
6.0 0.6▲
▼ VTB Capital 13-13 4.6+3 15* 250.1 ▲
0.0 ▲25.1 2.510 -114 16 3,885.5 ▼0.515 159* 4,079.8
0.2 ▲4.015*BNP Paribas SA▲3.1
17 3,472.1 2.6 BMO Capital Markets-7
0.7
23,411.8
▲3.1
0.13,411.81.0 ▲ 0.1
4.00.234.0 ▲11.2-4 ▼
+2 ▲ 2.01.1
CITIC16 7
3,304.8-
Somerley Ltd 18 65 2,531.4 1.9
Deutsche Bank AG ▼-0.43.82.5 1.7 0.217 48 18▲▲ ▼
0.2
▲19.6 2.00.5 ▼5.8 0.60.1
▼Banco BTG Pactual SA 17China Merchants Securities Co
-90.233,260.3318
10.01 ▲▼-5
▼2,367.13.03.1
19 15 2,502.9 1.9 Morgan Stanley▼ 7 0.22,629.3
191.5
▼82 -2 ▼ ▲.6 0.1
-19Caitong Securities Co Ltd 20 - 2.6+6 20▲ 6 0.2 ▲ +10.1
RBS▲ 21 30 2.31,913.4
2.8▼ -21.8 0.4GMP Capital Corp - 2,191.5 2.6▲ 1 -0.0
Lazard 21 12 2,116.62,334.6
0.30.0
0.12,056.8 4
1.6 ▼-2.722▼ NomuraSantander
6
▲0 -0.2 1.1▲ 4 14.40.23
Barclays 23 47 2,034.1 0.222 7 0.1
▲▼2.0
▲9.4 0.9 0.6▲11.0-3-3.1
+10.2Malayan Banking Bhd ▲0.2
415 1,738.5
-1 1.62.023 67Cenkos Securities PLC 24 1.3
1,728.524
Mizuho Financial Group 25 168- 1,714.6
▲+1
1 3 -2 ▼1.8
Houlihan Lokey-4.5 ▼2 0.1▼ -12
1 686 5 256 0 1+5▲ 0 2▼
38 1 316 7 1 6 0 3 ▲ 2 ▲11 1.4
1 3
▲-9 1.0
2.33.7 5 0.3▲ 0.1▼
▼-1
0 60 9
3.4▼ 34.3
8 7
-13
100.0
Acquiror
China Cinda Asset ManagementPending
1,005.1Mizuho Financial Group 25 168 ▲1.3 -2 ▼Houlihan Lokey1,686.5 256 0.1+5▲ 0.2 38 1,316.7 1.6 0.3 ▲ 2 ▲
Target Macro / Mid Industry
Industry Total
Industry % Change from Same Period Last Year -32.9% ▼
Industry Total 132,459.6
Financials / Credit Institutions
▼▼
Itau Unibanco Holding SA
1.3
▼-23.2%
6,822.5Brazil / BrazilAcquiror / Target Nation Rank Value (US$m)
▼
85,156.4-898 100.0
Emerging Markets Involvement Announced M&A by Target Industry ($bil)
2,974
-24.2% ▼ -44.4%▼ -24.9% ▼ Industry % Change from Last Quarter -44.3%Industry % Change from Same Period Last Year
Rank Date
* tie
2/7/2012 Intended Redecard SADate Effective Target (% Sought/Acquired)
Energy and Power / Power3/7/2012
Industrials / Transportation & Infrastructure3,910.8
1MDBMaterials / Metals & MiningSesa Goa Ltd
Undisclosed SPV Brazil / BrazilIndia / India
2/6/2012
3/7/2012Pending2/25/2012Pending
Tanjong Energy Hldgs Sdn Bhd
Infraero-Guarulhos ConcessionSterlite Industries(India)Ltd
2,810.4Malaysia / Malaysia
4,789.8
3/26/2012 Pending
1/3/2012
Mubadala Development Co PJSC Utd Arab Em / United States
PendingPending
2/21/2012 PendingDevon Energy Corp-AssetsAlibaba.com Ltd
China / ChinaChina / United States
Shanxi Meijin Energy Co Ltd
Alibaba Group Holding Ltd High Technology / E-commerce / B2B2,500.0 Energy and Power / Oil & Gas
Hong Kong / China
2,334.6
Intended Thailand / United Kingdom
Sinopec Intl
2,000.0
2,531.4
2/24/2012 PTT Exploration & Prodn PCLCove Energy PLC
Materials / Metals & MiningShanxi Meijin Grp Jinfu CoalCentennial Asset Brazilian
2/15/2012
1,714.6Financials / Alternative Financial Investments
Materials / Metals & Mining1,640.3 Financials / Asset ManagementInvestor Group China / China3/16/2012
1,863 -6270.60.9
-25.2% ▼ -37.3%
100.0
-42.5%
Jan 1 – Mar 30Any Emerging Markets Involvement Announced - Top Deals
Jan 1 – Mar 30
Industry % Change from Last Quarter -19.3%▼
8.7
$24.418%
$23.818%
$22.117%
$19.715%
8%6%
5%4% 3% 2% 2% 2%
Materials Financials Energy and Power
Industrials Real Estate High Technology
Consumer Staples Healthcare Telecommunications
Media and Entertainment Retail Consumer Products and Services
`
https://www.thomsonone.com

Bank of America Merrill Lynch Banco BTG Pactual SA
7.0 9
3.0
3.5
▲
▼
-4
Citi-
▼
-10.2 ▼
First Quarter 2012 | Mergers & Acquisitions | Financial Advisors
▼
US$mMarketMarket
Rank Value per Advisor (US$m)
Any BRIC Involvement Completed
# of Deals per Advisor
Jan 1 – Mar 30
BRIC M&A
Imputed Fees (US$m)
Any BRIC Involvement Announced
# of Deals per Advisor
Jan 1 – Mar 30
Change in Market2012 Rank Sh (%) Deals
Rank Value per Advisor (US$m)Rank Value # of
Sh (%)+7 4.8
Financial AdvisorMarket
Share Ch.2011 Rank
30.8 6.1US$m Share Ch. Sh (%) Share Ch.
MarketAdvisor MarketFees
# ofSh (%)
▲
Market Change in Rank Value2012 Rank # of DealsSh (%)
8,761.2 1.2Deals
2011 Rank# of Deals Financial Advisor
Market
Rothschild 2 41 10,220.5 ▲Citi 1
11.217 14.6 10.9
12.12012,347.5 Deutsche Bank AG 19 +3▲
816.80.5
0.3▲ 1213.5
▲▲
+3 ▲2.9 0.40.8 0 14.6-▲
0.7JP Morgan
0.416.3 ▲2 8,506.4
Bank of America Merrill Lynch 3 -4.52 6,081.06
1.1 +410
▲197.1
▲UBS 5,710.8 11.09 0.5 +1 4 9▲▼
1.7▲8.3
Morgan Stanley 10.6Itau Unibanco 4 9 7,819.7BR Partners 5 80 7,077.9 8.4
9.33 2 8,980.8
0 ▲10.95 11 2.55,660.2 0Credit Suisse 6 3 6,494.3 ▼7.7 0.36
0.2
14.6▼▼-93
-60.3
4
3.4▼10.6
3.22.1
11.7▼8.9 1.8
2.9
0.36 41*
▼
-▼
3▲5,537.8 3.617.90 -
-0.4
▲ 0.30.44-2.0 -11 10.6Societe Generale
BBVA39.6 ▲
10.4 ▲10.4JP Morgan 7 6 5,870.8 2.2+12 ▲0.5 3 0.3▲ 1
2.2 ▲7 - 5,431.6 11.0▲3.3
3.9BNP Paribas SA 8 - 4,789.8 5.75.7KPMG 9 29 4,641.9 ▲
9.484,083.355.5 0.3 -4 VTB Capital
0.34,916.318▲ China International Capital Co ▲ -1 ▼ 0.70.1 5 0.59 4
5.2+10.4▼ -5.4 ▼7.8 4
3,260.3 6.3 -1.9 ▼10 5 4,608.4 5.5 -10 ▼ 10 12-2.6 ▼ 2 0.1 1.1 ▼-9 ▼1.1 ▼6.0 1.2▼-4
-6 ▼3 0.3 5.8 1.2
-8.3 ▼3 0.3
2.9 ▼5 0.5 13.8 2.87
11 3 2,900.5 5.6▲ Credit Suisse0.2 +42,875.0CITIC 12 3.9 2.535 3,304.8
Grant Thornton 11 - 4,079.8 ▲ 44.8 4.85.5▲ Rothschild 0.2 ▼14.7 2.9-11 ▼
1 3,163.4 3.7 -19.5-3.9 ▼0.4 +4 12 8
▲ China Merchants Securities Co▼ 10HSBC Holdings PLC 14 8 2,711.5Goldman Sachs & Co 13
3 0.2 -10.6 +1
Deutsche Bank AG 15 18 2,690.4 ▼
4.9 ▲13 63 2,629.3 5.11 0.1
3.2 -0.4 0.2 -2▼ Nomura3.2 -3.1
0.1 ▲.6 0.13 0.3 -2 ▼
3 0 -1,370.1 2.615 38*14 23 1,582.2 3.0 0.5 ▲
2.6
0.3 ▲-2 ▼ 8.6 1.7
-5 ▼0.0
Somerley Ltd 16 ▼ Goldman Sachs & Co▲ 1 0.1 -358 2,531.4Caitong Securities Co Ltd 17 - 2,334.6 ▲ 62.8 2.8
-4.9 1.0▼ Lazard 1.4 ▲ 3 0.37.4 1.5
3 0.3UBS 18 14 1,765.3
-3.6 ▼▲ Morgan Stanley
1.4 ▼16 14 1,356.2 2.6 2 0.2▼17 1 1,320.6 2.5 9.2 1.8-12 ▼-19.0
1,684.3▼ 3 18* 24
3.60.3 +6 ▼
122.1 -2.2 ▼ Houlihan Lokey
VTB Capital 20 16 1,289.366
0.2 2.5 1 0.10.1 ▲Ernst & Young LLP 19 2.0 1.7 ▲
-8▼ ▼
-11.20.7 -1
▼1,316.7-7 ▼
0.6 ▲6.7 1.32.76.0
20* 2.3 ▲100*1 0.118* 7▼ Itau Unibanco 2.5 -8.51,316.7
Barclays 21- BNP Paribas SA▼ 31.5 -2.3 0.2 0
1.5 0.4 ▲ 4 0.238 1,245.6▲
0.8 ▲8.2 1.63.9 0.81
1.11,220.4+12 ▲
2 0.20.1
2.3 0 --2 2.3 ▲1,220.4 2.3▼ Paradigm Capital Inc 20* -
Guosen Securities Co Ltd 22 56 1,192.8 0.9Guangzhou Securities Co Ltd 23* - 1,097.8
▲ 1▲ 2
0.1 0 20* - 1,220.4 2.31.3 1.31.4
▲0.1 +2 0.220.1 ▲
▲▲
2.3 +12 ▲2.3 ▲▲3.9 0.81 +12
0.9
China Renaissance Partners 25* 84Greenhill & Co, LLCGuotai Junan Securities 23* -
23 -- BMO Capital Markets 0.82.3
▲ 1.9RBC Capital Markets 0.94.41,200.0
0.2▲0 0
1,097.8 ▲ 2▲
- 1,000.0 1.9 ▲ ▲0 1
.9 0.2+120.11.3 1.3 0.1 +2 124*1 90 1 1 9-8 ▼ Sberbank 24* 100* 0-11 2 1 1991 3 1 000 01▲ 1 0 1 ▼ ▼
BRIC Involvement Announced M&A by Target Industry ($bil)
1 ▲+1▲Allen & Co Inc 25* - 991.3 1.2 1.2 0.1 ▲0.1 0.11 0.1 +12 ▲ .6
Jan 1 – Mar 30
Industry % Change from Same Period Last Year
4,789.8Undisclosed SPV
24* - 1,000.0 1.9 1.9 ▲Standard Bank Group LtdChina Renaissance Partners 25 84 0.0▲ 0.11.90.1 1.9
Industry Total
8 ▼ Sberbank 24 100
▼ -23.8%
1,724100.0
▼
Industry Total 84,488.9
.01
1,021
1.2 1.1991.3 1,000.01▲
-538
▼
1 0.1 ▼
500.8-340
▼ -33.6%
100.0
-31.2%
High Technology / E-commerce / B2BMaterials / Metals & Mining
Industrials / Transportation & Infrastructure
▼
Brazil / Brazil
Hong Kong / ChinaIndia / India
-28.9%-25.0%
1/3/2012
Redecard SA (50%)
* tie
2/7/2012Rank Date Acquiror / Target Nation
Intended Brazil / Brazil
2/21/2012 Pending Alibaba Group Holding Ltd
Itau Unibanco Holding SA
Pending Sterlite Industries(India)Ltd (100%) 3,910.8
Devon Energy Corp-Assets (33.3%)
Sesa Goa Ltd
Shanxi Meijin Grp Jinfu Coal (100%)
▼
Acquiror
-29.5% ▼ Industry % Change from Last Quarter
Energy and Power / Oil & Gas
Financials / Credit Institutions
▼
6,822.5
3/16/2012 China Cinda Asset Management (16.5%)Pending SBI (5.7%)
Investor GroupPending3/19/2012
Pending Fawer Automotive Parts Co Ltd (100%)2/10/20122/6/2012
Alibaba.com Ltd (28.6%)
Infraero-Brasilia Concession (51%)
Industry % Change from Same Period Last Year
2,500.0
-19.7%
Pending Infraero-Guarulhos Concession (51%)
Date Effective
-24.8%
Rank Value (US$m)Target (% Sought/Acquired)
China / United StatesShanxi Meijin Energy Co Ltd
Industry % Change from Last Quarter
2,334.6
2,531.4Sinopec IntlPending
2/25/20122/6/2012
Pending2/15/2012
▼▼-42.7%
100.0
▼
Materials / Metals & MiningChina / China
52,102.1
Financials / BanksChina / China
1,574.9India / IndiaFinancials / Asset ManagementChina / China
1,455.7Investor Group
IndiaGuangdong Sunrise Holdings
Pending
Jan 1 – Mar 30
Brazil / Brazil Industrials / Transportation & Infrastructure1,332.4Industrials / Automobiles & Components
Target Macro / Mid Industry
Any BRIC Involvement Announced - Top Deals
-33.2%
1,640.3
$17.320%
$15.919%$15.7
19%
$14.117%
6%4%
4% 3% 3% 2% 1%1%Materials Energy and Power Industrials
Financials High Technology Real Estate
Healthcare Consumer Staples Media and Entertainment
Consumer Products and Services Telecommunications Retail
`
https://www.thomsonone.com

JP Morgan Houlihan Lokey
Global M&A19
554 91
0+1
- RBC Capital Markets24 ▼.0 0.50.00.40.0
6.0-
+1 - 35.0+1
40*INFUPA SA▲
22Broadspan Capital0.2
0.2▲ 21
▼▲-
Capital Trust Co 0.40.233 28.9
0.2 10.5
.6▲0.3
-1.9▲
▼ 5 1.8.7
.22.10.30.2
▲1.20.3 ▲0.4
0.3
0.4
-
-0.3 ▲
65.0 0.0-0.1 0.154.9
▲▲ +1 ▲0.2
.6▲
0.4.6 0.2
-0.71
240.577.0
-10▲0.7 +3
▲
▼ 00.4
PricewaterhouseCoopersBrookfield Finl RE Grp
18--
16*
0.1
Cushman & Wakefield Inc 0.40.2
▲0.6CB Richard Ellis Group Inc 0.6 0.6
0.2
▲▼- ▲0.6▲100.0 1
3.521.4
0.4
▼3.6 +10.41
+1
0.4
1
1.5-5
16*
0.7+10.4
77.0
▲3.6 2.30.10.1
5.5 13.6
-2▲
▼
▲
6.74.29.8 3.4
▲ .3▲▲
▼
7.5
-94
▲
-10.6▲
1 +1▲
1,511.7 8.6
-+1
0.4▲0.41- 1,316.7 7.5
▼11.5 4.9
▲
5.3▲6.7 2.9
2.92.9
6.6
2.9
Citi 712Credit Suisse
3
1.4
1,913.2 -7.9 3 1.1▼10.8-13.3 2
▲▼
6.56.5
-61.0
▼2.5
8.0▼
0.41
▼0.7
15.35.8
▲1.1
2.2-6 5.2
▼2.83.8 ▼3.4-123.5
25.411.9
▼
3-▼▲
0-9
▼▲29.0
14*
3.1-10.427.2
27.2
5,400.0▼
▲
3,260.3 18.44,800.0
3.8
4,800.0
5,846.6
5
38
▼3 1.4
47.3 ▲3 1.130.5
1.3
1.1 +14.6
▲▲33.2▲
5.333.031.4
▲5 ▲ 11.0 4.71.8 +4
Market
12.5Sh (%) Share Ch.
Advisor Market
▲4.2Fees
18*-8
Change in 2011 Rank US$m
5,866.3UBS
Change in Sh (%)
# of# of DealsShare Ch. Deals
Imputed Fees (US$m)
First Quarter 2012 | Mergers & Acquisitions | Financial Advisors
Latin American M&A
Jan 1 – Mar 30
Rank Value MarketRank Value per Advisor (US$m)
Market2012 Rank
Rank Value MarketSh (%)
1 2 3
333.1
18*
2.4
# of Deals per Advisor
0.2
# ofSh (%)Deals # of Deals Financial AdvisorMarket
Societe Generale
Any Latin American Involvement Completed (AF45)
# of Deals per AdvisorRank Value per Advisor (US$m)
▼
▼
Credit Suisse 8
-
20Cushman & Wakefield Inc
77.0-
Brookfield Finl RE Grp
24
Goldman Sachs & Co 7HSBC Holdings PLC
13
Stephens IncErnst & Young LLP
14*
UBS 11
14*
9*
Banco BTG Pactual SA
16*16*
CB Richard Ellis Group Inc
BBVA
Wells Fargo & Co
0.3
0.2
+11
-7 ▼
▲0.2
Bansud Capital
Santander
12
1,221.04-
1
4.9
▲+1
▼
0.4
-3
▲0.4
0.243.3
▲▲
0.0
▲0.72
5.0 ▲0.0
0.1
▲ 15
▼
23
IMAP -21
0.3
+1+1
631.6
0.4▲0.4
2
Santander 13*
0
0.2 +1 ▲
▼
▲
0.2
655.6655.6
23
17▲ 20
1-
▲
1
-
631.6
Standard Chartered PLC
+1
▲
▼
-8+1 10*
8
-7
Lazard
9Itau Unibanco
▲ 8.47.5
13*
+1
▼ 12
10*Deutsche Bank AG
0.7
1,476.6
1,316.7
▲
▲28
631.60.2
0.2
23
1
7.51,007.6 5.7
-Ernst & Young LLP3
1.9
0.2▼ 2▲
1
2
▲
0.5-1.6
0.5
▲
▼
0.3
▲
▼1.0
-65▼ 4 +2
1.2
2.1
77.0
2.1
▲0.30.3
▼▼
▲
--0.7 0
▲1
1.46▼
6
4*
+3
Bank of America Merrill Lynch0
▲-
Banco BTG Pactual SA
0
Market Market
11.0-5
▼▲Sh (%)
410
3 0.7▲
38.0
▲23.622.515.9
Financial Advisor
BR Partners
Citi▲26.3
5US$m
8,154.9Share Ch.
14.9
3
BNP Paribas SA4
27.41
Rothschild32
7,819.73
4,789.818 2,200.71
2012 Rank
2011 Rank
Morgan Stanley5
Itau Unibanco 2
6
2337*
925.5925.5
6,822.5
21*
-
471.6
17
-
8
859.715 746.1
2.2
21
-
2.5
3.19*
21*
2.1
2.1631.6
16*
100.019
-
▼
1.6631.6 -23.12
0.3
▲0 2
2.2
1
56.00.2 -0.3
0.3
65.01
-4.3
IMAP
20.2
23PricewaterhouseCoopers
290.2
250.2
0.0.11 +10.00.5 0.0
-2.33.1
2.9
-12.4
3.111
23.8
7.4
25
4.1
23.0
6.2
719.0 2.4
1,842.4
-0.5
0 1
▲
2.4
12.2
1
7,077.9
2.2
JP Morgan 22
+1
Any Latin American Inv Announced (AD38)
DNB ASA
BBVA 2
▲ 0.2
Jan 1 – Mar 30
-20.45.4
16.1
-▲
* tie
-52.3%
-89
Latin American Involvement Announced M&A by Target Industry ($bil)
655.6 Financials / Credit InstitutionsChina / Colombia
Colombia / Costa RicaChile / Chile
Banco Davivienda SAAtlantia SpA
719.0
Industrials / Transportation & InfrastructureEmbotelladora Andina SA
759.9
Brazil / Brazil
Italy / ChileSinochem International Corp
4,789.8
17,680.8 100.0
-58.7%
Brazil / Brazil
Jan 1 – Mar 30
▼ ▼
6,822.5
▼-54.9%Industry % Change from Last Quarter -15.1%
100.0-63
Rank Value (US$m)
5
-35.5% ▼
54.9
-18.3%▼
281 234.3420 Industry Total1.2 -3▼
100.029,727.4
1/24/2012
Rank Date Date Effective
▼0.2
Grupo Elektra SA de CV
IMAP
2/7/2012
Industry Total
-20.2%
Tepma BV (100%)
Redecard SA (50%)
2/15/2012
HSBC-Central America Bkg Op (100%)
2/6/20122/21/2012 Prestige Brands Holdings Inc (100%)
Advance America Cash Advance (100%)
PendingPending
IntendedTarget (% Sought/Acquired)
PendingPending
Investor Group
Investor Group2/6/2012
Pending
2/2/2012
Pending
Industry % Change from Last Quarter
2/25/2012
Genomma Lab InternacionalInfraero-Brasilia Concession (51%)
2/6/2012
-17.5%
29
Brazil / BrazilFinancials / Credit Institutions
Industry % Change from Same Period Last Year
25
▼
* tie
▼
Undisclosed SPV
AcquirorItau Unibanco Holding SA
1,128.8
Jan 1 – Mar 30Target Macro / Mid IndustryAcquiror / Target Nation
Any Latin American Inv Announced (AD38) - Top Deals
▼
1,332.4 Industrials / Transportation & Infrastructure
-54.1%
Industrials / Transportation & Infrastructure
Energy and Power / Oil & GasIndustrials / Transportation & Infrastructure
Healthcare / Pharmaceuticals
Consumer Staples / Food and Beverage801.0
Mexico / United States
Infraero-Campinas Airport (51%)
Autostrade Sud America Srl (54.2%)
Pending Embotelladoras Coca-Cola Polar (100%)Pending
2/8/2012
-21.3%
-0.1
Pending
Infraero-Guarulhos Concession (51%)Brazil / Brazil
▼Industry % Change from Same Period Last Year
Financials / Banks
Mexico / United States 1,262.4
925.5
▼
$9.632%
$9.532%
$2.48%
8%5%
4% 3% 3% 2% 2% Industrials Financials Energy and Power
Materials Healthcare Consumer Staples
Consumer Products and Services Real Estate Media and Entertainment
Retail High Technology Telecommunications
`
https://www.thomsonone.com

Santander Itau Unibanco
0.3 0.9
0.1-
0.3
0.9
2 1.80.20.10.228.9
17 43.3-3.6
▲▲
0.60.4
2
-16
+1
+1
+1
2*
5.0
▲
1
-
3.6
Cushman & Wakefield Inc
+10.91
12,630.0
▲ .1▲
▲0.8
.60.4
.33.5
▲0.1 0.10.8
0.4▲+1
+1.6
0.2-▲
2.70.4
▲▲ 0.5▲
.73.9
0.5▲ 0.8
0.6
▲
0.4▲
0.2
+10.9
▲▲▲1
41
▼1▲
0.6 ▲
1.2
143.8
+1+2
100.00
RBC Capital Markets
Industry Total
Global M&A
+1
-
6.018
110
5.0
Brookfield Finl RE Grp
12*
-10
12*▼
100.0
▲
5.4
0.6
4.1▼ -8
1
▼
0.91,316.7 -27.210.4 1
54.9
▲
1-26.2
2.5 1.2
0.9+1
20.91.8
- 28.926 0.3IMAP
10.2
0.6
▲▲
1
Credit Suisse▼
▲0.4 0.6+1
5.5
▲3.4631.6
5.9▼ 8.45.0631.6
0
▼▼+1 ▲ 6.7
6.0-7 4.2▲4.7
3.7
-48.0+2-3▼
2.91.1
20.9
4.7
-
▼1,316.7 10.4
▼▼ 1.0
0.96.7
0.9▲
▲ 3.0▲
-
1.4
2 6.3
-1
4.4
4.74.7+11 ▲10.4
3▼
10.4▲10.4
-1,316.71,598.4
38.02.7
38.0 1
12.7
36.9
-10.7 1-2.3
▲3.34,800.03,260.3 25.8 -9
0▼
1.83
138.0
▼4.0 1.75.8
34.6 0.9 ▲1.9
13.234.6
04,800.0 4.3Societe Generale 4,800.0Bank of America Merrill Lynch
1 0.9▲9
01.7+10
5.12
▲15.3
43.03.00.9
-▼ 4.3
3▲
▲
2.9
2.8621.4
2.9
Sh (%)8,154.97,819.7
2.9
7,077.935.6
631.68*
631.6
631.6BBVA 8*
8*Goldman Sachs & Co 11
1516
-
1
Ernst & Young LLP
175100.0
2Credit Suisse 12
77.0-12 -6.9
Broadspan Capital
16
77.054.9
680.0
0.40.4
2.2 1
0.4
IMAP
Santander0.6
77.014*77.0
▲2.3
1
-21-
14*0.6
▼
19
471.6
0.1 ▲
1▲
▲
▲0.1
11-4 Ernst & Young LLP▼
▲+1
8*Houlihan Lokey 8*
▲
Banco BTG Pactual SA
▼
▼
▲ 1.1
-21 0.6
+2▼
+1
3
▲2.95
1
-8▲
1.7
22
+3Sh (%)
43.038.0
0.60.6
-1▲
CitiDeutsche Bank AG
7-8*
▼
Imputed Fees (US$m)
7
▲
7.7
17*2*6
11.0▲
Market
JP MorganUBS
Jan 1 – Mar 30Jan 1 – Mar 30
Sh (%) Financial Advisor▲2.7BBVA
2*
# of
▲17*
Deals
0
2011 Rank Sh (%)
2* 6
Market# of Deals per Advisor
# of Deals1.1
-
7.7
10.510.6▲
Share Ch.
4,800.0
Change in Advisor# of Deals
▲0.6-4
2012 Rank Sh (%)
Any Brazilian Involvement Completed (AF51)
Share Ch.Share Ch.Market
Fees-
Change in
First Quarter 2012 | Mergers & Acquisitions | Financial Advisors
Market Rank Value Market# of Deals per Advisor
Market
3
▲
2
▲
▲
Brookfield Finl RE Grp 13*
21.8
-13*Cushman & Wakefield Inc
-
Rothschild
-0.2
4.2Itau Unibanco71 22.1
31.81
Brazilian M&A
▲
-5.6
21,947.6
BNP Paribas SA
2012 Rank
32.36,822.5
938.3
31.131.1-
Market Market
5
23
164,789.8
4
6
4
17 3.413
2.9
▼-47.1
746.1
Broadspan Capital
Banco BTG Pactual SA
Industry Total
0.6
32Citi
BR Partners
US$mRank Value
3
# ofRank Value per Advisor (US$m)
Any Brazilian Involvement Announced (AD44)
2011 Rank
Rank Value per Advisor (US$m)
US$mDealsFinancial Advisor5,431.6
21.8
37.2
Morgan Stanley 4.3
-
1/31/2012
Jan 1 – Mar 30
Acquiror
Brazil Involvement Announced M&A by Target Industry ($bil)
▼-8.3% -52.4%
Financials / Credit Institutions
Industrials / Transportation & Infrastructure
Target Macro / Mid Industry
▼
Industrials / Transportation & Infrastructure
-34.2%0.0%
Cosan SA Industria e Comercio
Jan 1 – Mar 30
Materials / Metals & Mining
Materials / Metals & Mining
-17.9%
Industrials / Transportation & Infrastructure
Industrials / Transportation & Infrastructure
Rank Value (US$m)
522.2
621.4CSN Steel SL
Financials / Other Financials
560.6Brazil / Brazil
Brazil / Brazil
Brazil / Brazil
Industrials / Transportation & Infrastructure
-43.1%
4,789.86,822.5
Brazil / Brazil
▼11.6%
Investor Group
Brazil / Brazil
Itau Unibanco Holding SAAcquiror / Target Nation
Industry % Change from Last Quarter
Energy and Power / Power
640.9
Brazil / Brazil
Spain / Germany 631.6
1,332.4
Undisclosed Joint Venture Brazil / BrazilBrazil / Brazil
Any Brazilian Involvement Announced (AD44) - Top Deals
* tie
Industry % Change from Last QuarterIndustry % Change from Same Period Last Year
Undisclosed SPV2/6/2012
▼▲
▼
1,128.8
-33.6%
Luxembourg / BrazilConfab Industrial SA (56%)2/21/2012
Tenaris Investments Sarl
Pending1/30/20121/31/20122/24/2012
Pending
▼
Investor GroupInfraero-Guarulhos Concession (51%)
▲▲
Industry % Change from Same Period Last Year
IntendedPending
6.3%
TAESA
CPFL Energias Renovaveis SA
Infraero-Campinas Airport (51%)Concessionaria SPMar SA (95%)
Pending
Intended
BVP SA (100%)Stahlwerk Thueringen GmbH (100%)
PendingAll America Latina Logistica (5.7%)PendingUNISA (50%) 479.63/16/2012
1/18/2012
Redecard SA (50%)
2/6/2012
5.6%
Pending
2/6/2012
Date EffectiveRank Date2/7/2012
Infraero-Brasilia Concession (51%)
▲
Target (% Sought/Acquired)
$8.940%
$7.434%
$1.57%
6%4% 4% 2% Industrials Financials Materials
Energy and Power Consumer Products and Services Real Estate
Media and Entertainment Retail Consumer Staples
High Technology Healthcare Telecommunications
`
https://www.thomsonone.com

Rothschild
6.7
Sh (%)3
MarketImputed Fees (US$m)
# of
+2Sh (%) # of Deals
Advisor
6.6
MarketShare Ch.Deals
# of Deals per Advisor
▲▲7.16.9
92.3
# of Deals per Advisor
100.0 22813,045.2
+11.50.6
3.1
1.3
5▲
Change in Market
5.3
Rank Value per Advisor (US$m)
+1
5.91.9Fees
3
2012 Rank
1.5
215.0
1
Financial Advisor
4*
10
1,061.8
17
▲
Any Middle Eastern & North African Inv Completed (AF60) Jan 1 – Mar 30
First Quarter 2012 | Mergers & Acquisitions | Financial Advisors
+32.5
Market2011 Rank
+3
1.3
Change in Market Market
0.4
MarketSh (%)
Rank ValueSh (%) US$m
1.2
-8.8
0.4
2012 Rank
# of# of Deals
Rank Value
1.3
-4.5
6.0
180.5
1
01▲
2.1
0.4
0.4
22.2 2.2
4,728.61
13*
JP Morgan
3Credit Suisse
Any Mid East & N African Inv Announced (AD53)
4▲
Middle Eastern & North African M&A
MarketShare Ch.
7
Goldman Sachs & Co
Rank Value per Advisor (US$m)2011 Rank
6
3
Financial AdvisorCiti
▲ --▲
Sh (%)1.8
Jan 1 – Mar 30
74,209.6
31.0Share Ch.
2
US$m
-5.525.3
Lazard 5
24* 25.3Itau Unibanco
32.3
-
1,081.64 1,697.6
23,306.3
1,755.12,000.04
10*
-
-5
Barclays89
3
Morgan Stanley
-NomuraBank of America Merrill Lynch
PricewaterhouseCoopers
10*10*
18
-
13*16*
Deals
7.6
▲
HSBC Holdings PLCUBS
BBVA15
13
Jefferies & Co Inc14
Merriman Capital Inc
Industry Total
19RothschildDeloitte
+8
16*1124*
16.5
0.79* 27.7
92.3
0.1
0.70.9
0.4
1
0.2
1.4
▲+3
1
4+1
-3.40.70.0 ▲
1.8▲
▼1
▲
-14
Macquarie Group
+1▲-2
▼
2
▲
-280.0
-
HSBC Holdings PLC
73.816.5
Arctic Securities ASA
Merriman Capital Inc-12*
73.8
-9.3
15.8
5.75.415.8
3.01.5
0.6
9
4*
9*
89* 781.6
Morgan Stanley122
- 4*
UBSGoldman Sachs & Co 4*
4*5
1,306.3 26.321.4 ▲
21*Credit SuisseBank of America Merrill Lynch
112.626.3
-7.5
15.8781.67 781.6
5.44
▲
-0.4
20.9
08 4.1
+2
0.9-▲
0 Citi+1
▲ Deutsche Bank AG
▲▲▲ 3
781.6781.6
Lazard0.4
+17.4
▲
6.0 ▲
+36.0
987.3
280.0
-16.0 ▼
963.1
0.1-
Jefferies & Co Inc
1.5
11.5
12*
-15
11
0.30.2
0.3
3.4170.0
0.2
▼
▲2.51.3
2.21.5 ▼
1.3
2.2
0.65
0.6
+5
▲
▲
+11
▲0.6
1.21.91.3 -▲
+2 3.602
1.3▲▼
3.14.3
▲+1 ▲
▲1.4
0.4
2.73.2
1.4 ▲▲▲
0.2
▲1.2
4.4 ▲3.25.9
3.1 ▼3.5 2.7
3.15.95.7
0 -.2
▲▲ 0.6 +1
0.4
0.2
1.9 ▲
.2▲+1
4.3 ▲
▲1.6 ▼
1.3
2.9
▲
2.15.4
-2
▲ 1▲▲
3
1
2
▲
1
▼15.815.8
▲▼
3 +21.9▲2
-
100.04,959.2Industry Total
2
▼0.40.4
▲
+21 -1
▲
▲
11.3
781.6
15.313.5 ▲
269.6
7.47.6
13.5
8.3▼
▼
13.0
-34.9
5.8
1
▼
0
03 0
1
20.9
0.9
1.5▲ 2.1
1
100.0
▼
43 +1
.4
21.1
▼
+5160 97.6
-17.2
-7.14.3
+1
▲
1,046.5
-▼
OSK Holdings Bhd
781.6781.6
▲0.2
15.3
36.3
0.2
Deutsche Bank AG
Pending
Centennial Asset Brazilian (5.6%)
Orascom Telecom Media (100%)
▲▼
3/26/2012
3/7/2012Pending
Rank Date
Gen Retirement & Social Ins
EDT Ret Trt-Shopping Centres (100%)Migdal Ins & Finl Hldg Ltd (69.1%)
1/8/2012
Egyptian Co for Mobile Svcs (29%)2/13/20121/20/20122/7/2012 One Cabot Square (100%)2/8/2012
2/29/2012
1/20/2012
-35.0%▲
Target (% Sought/Acquired)
Industry % Change from Last Quarter
Intended Damas International Ltd (100%)
Pending
-3.0%59.3%▼
Date Effective
3.6%
Indosat-Telecommun Towers (100%)United Development Co PSC (33.21%)
Middle Eastern & N African Involvement Announced M&A by Target Industry ($bil)
Pending2/29/20121/8/2012
1/10/2012
Pending3/28/2012
Shareholders2/20/2012
Saudi Kuwait Fin House-RE (100%)
Mubadala Development Co PJSC
France Telecom SA
-63.6%
524.6
Golden Investments Co Ltd
Tower Bersama InfrastructureQatar Investment Authority
Shlomo EliyahuBRE DDR Retail Holdings LLC
Egypt / Egypt
389.8
Industry % Change from Last Quarter
781.6
Acquiror / Target NationAcquiror
Undisclosed AcquirorQatar / Qatar
Unknown / Saudi Arabia
Rank Value (US$m)
Any Mid East & N African Inv Announced (AD53) - Top Deals
* tie
Industry % Change from Same Period Last Year
Jan 1 – Mar 30
Industry % Change from Same Period Last Year -57.0%
France / Egypt
1,098.3
973.5
United States / United States
519.0
Jan 1 – Mar 30
2,000.0
▼
1,428.0
Utd Arab Em / Utd Arab Em
▼
Israel / Israel987.3 Retail / Other Retailing
▼-43.7%3.2%
Real Estate / Non Residential
Telecommunications / Wireless
Financials / Insurance
▲
Financials / Alternative Financial Investments
-55.6%
Target Macro / Mid Industry
▼
Real Estate / Other Real Estate
-5.9%
Real Estate / Non Residential
Telecommunications / Wireless
▼
Real Estate / Other Real Estate
Telecommunications / Space and Satellites439.6
Indonesia / Indonesia
Utd Arab Em / United States
Qatar / United Kingdom
$3.426%
$3.225%
$2.721%
9%4%
3% 3% 3% 2% Financials Real Estate Telecommunications
Retail Energy and Power Consumer Staples
Media and Entertainment Healthcare Consumer Products and Services
Industrials Materials High Technology
`
https://www.thomsonone.com

M&A International Qinisele Resources (Pty) Ltd
PricewaterhouseCoopers
2,513.9
2.5
Industry % Change from Same Period Last Year
172.055.8
▼
# of Deals per Advisor
13.1335.0
2.9
-1.6
0.0 1Bridge Capital Advisors
2012 Rank
17.5
Rank Value2011 Rank
17.5
7.38.6
▲1.3
0.0
0.2 0.2
0.0 1
Hartleys Ltd
Industry Total
▲
UBSRMB Holdings Ltd
5
9
7.3
PSG Capital (Pty) Ltd0.1
▲▼
7
1
2
▲
407.0
▼
# of
Investec
-
-
13.34
1
13.3
-31.4
-
6
2439.7
+23
Macquarie Group2
1▲
Market# of Deals
1.32.2
South African M&A
-66.4%
217.2
72 9%▼
2.5
Bank of America Merrill Lynch
Sh (%)
13.5RBC Capital Markets
328.6
Sh (%)
16.2
Deals
14* JP Morgan
US$mMarket
2.5
Financial AdvisorChange in
Any South African Inv Announced (AD54)
1 -Share Ch.
.3
Jan 1 – Mar 30
▲
▲
▼
Market
2
2.2
28 8%
Bank of America Merrill Lynch
▲
-
1.9
4 8
8
1
1110
Rank Value per Advisor (US$m)
-
Financial Advisor
100.0
▲
-24
4.0
▲-
-
100.0
.0
▲
0.1▲
-3.1
▼1
15.0
2.4▲
▲
▲2.6
▼
Rank Value
4.4
2
Lazard
79
0.0
0.4
-44.6
2.2
2.2
-6.7
▲2.3
# of
▲
448.1
First Quarter 2012 | Mergers & Acquisitions | Financial Advisors
▲
Sh (%)851.5
3*
+2+1
35.4
- 448.1
US$m DealsCredit Suisse
Sh (%)
18.6
Share Ch.
▼
▲
▲▲24.9
35.4
10.4
2.2
▲
▼4.4
1.5
0.0
0.4 ▲
0.00.1
1
2,408.2 100.0
Ernst & Young LLP
PricewaterhouseCoopers 14
PSG Capital (Pty) LtdNedbank Capital 15
Hartleys Ltd
24.9
▲361.5
3*Standard Chartered PLC18.64*
Barclays
600.0
-11.3+11.3
-45.1▼
Rothschild
25*-
▲
2011 Rank
Rank Value per Advisor (US$m)
1213
16
2012 Rank
Industry % Change from Same Period Last Year ▼
-11
17 5%-68.4%
M&A International 1.9.3
10.3
-Bridge Capital Advisors
1
2.91
1.31.3
2.2 ▲▲
0
+1+1
2322 4.0
+1
1.3
▲-
Industry Total-25
▲+1
▲Industry % Change from Last Quarter ▼▼-24.0%
MarketShare Ch.
12.16.4+118.6
4.42 +22.2
10 1.01
+1
▲
▲-
2.22
+1
▲
4.4 -1+115.0
▼15.0 -0.5
▲2
10.410.4
▲
11
▲▲2.2
15.0▲
4.44.4
12.22.2
2
2.20.4
-10
1.02
1
1.2 ▲0.2
+2
-
▲1.9
▲2.6
0.4
2.52.5
0.70.7▼
+1-1 ▼
1.3
0.1
17.1
▼
1
45
-19.6%
52.6
16 4%-59.0%
4 3%
.2 0.4
0▲ .0
▼▲
Imputed Fees (US$m)
+1
Sh (%)Market
1.9
3.41.4
4.2
FeesMarket
1- 361.5
2.215.0
4.4
1 1.43.9
8.3# of Deals
Jan 1 – Mar 30
0
▲
▲8.3
9.34.9 9.3 ▲0.3
10.5
▲▼6.4
8.0
0.1
▲
2.6
2.50.6
2.5 ▲
▲
2.4
.1
.3
1.3
0.5▼
▲
▲
▼0 - 0.2 ▲
▼.4
-1
0.02.2-0.0
0.0 -2.2
1 +1
183.3
# of Deals per AdvisorMarketChange in Advisor
Any South African Involvement Completed (AF61)
Market
5*
5*▲
5*
▲361.5
Commerzbank AG
25*
KPMG
18
Investec16
Industry % Change from Last Quarter
55.858.5
251.5
0.2
▼
17
25*11
251.5-
11
9*
5*
-9*
4*
1
10.4
104.7
10.4
15.0
361.5
251.4-
-
2.6
10.4
4.4
80.1PendingPending
1/11/2012
3/30/2012
Unconditional
Fountainhead Property Trust (100%)
African Iron Ltd (100%)
Ezulwini Mining Co Pty Ltd (100%)
3/1/2012
2/2/20121/30/2012
Date Effective
▼
Public Investment Corp Ltd
Anglo Platinum Ltd3/2/2012
Pending
Pending
PendingEvander Gold Mines Ltd (100%)
Pending
Pharmaplan(Pty)Ltd (100%)
Anooraq Resouces-Boikgantsho (100%)
* tie
Mondi Swiecie SA (34%)
Any South African Inv Announced (AD54) - Top Deals
2/16/2012
Gold One International Ltd2/21/2012
Redefine Properties Ltd3/1/2012 Capitec Bank Holdings Ltd (5.59%)Pending
3/2/2012
Rank DateOptimum Coal Holdings Ltd (32.2%) Investor Group
South African Involvement Announced M&A by Target Industry ($bil)
-72.9%
Target (% Sought/Acquired)
-28.8%
First Uranium(Pty)Ltd (100%)
Investor Group
FraMondi NV
Jan 1 – Mar 30
South Africa / South Africa367.3
South Africa / South Africa
Materials / Containers & Packaging
Litha Healthcare Group LtdAustralia / South Africa
Jan 1 – Mar 30
17.5%
AngloGold Ashanti Ltd
183.3
222.5335.0
▲
217.2
Industry % Change from Last Quarter ▼
Acquiror
Netherlands / Poland
Australia / Australia
3/27/2012Intended
▼
Materials / Metals & Mining
Materials / Metals & Mining
Acquiror / Target Nation Target Macro / Mid Industry
Healthcare / Pharmaceuticals
Financials / Banks
72.0
111.6
Materials / Metals & Mining
16.4%-4.3%
Materials / Metals & Mining
▲
Real Estate / REITs
Materials / Metals & Mining
Materials / Metals & Mining
85.6South Africa / South Africa
Industry % Change from Last Quarter
South Africa / South AfricaExxaro Australia Iron Invest
Rank Value (US$m)
South Africa / South AfricaSouth Africa / South Africa
South Africa / South Africa 406.0
$1.976%
$0.27%
7%4% 4%
Materials Financials Industrials
Real Estate Healthcare Consumer Products and Services
Media and Entertainment Energy and Power High Technology
`
https://www.thomsonone.com

CB Richard Ellis Group Inc5
▲
0
5
0.4
▲
-▼
1 0.1
0.2
-0.80.2
0 62 0 ▼
-22
CB Richard Ellis Group IncSEB Enskilda
1▲
0.30.243*0
35▲
0-
54.4
40 0.42
UniCredit 41.83
21
18
▲▲▼
▲
-1+1
6▲
2
1▲
0.9
0.2
0.2
0.2
-
23
0.4IMAP16*
68.043*
Clairfield International 0.3
ING16* 25
0
Troika Dialog
-Societe Generale
-▲ 150.2
0.21
▼+2
00.1
2
+1-2
▼-10.6
4▼
0.5 -6-7.64.0
5.06
24
▼774.610
4.2921.1921.1
51,425.2
995.75.0
-2.1
-4.1-20.6
164.0750.0
JP Morgan7.2
6*
51,642.9
10*
1,425.2
5.48 8VTB Capital
7.8
Santander0.40.17.7
7.7
1,289.3
2
3
Sh (%)▲
1.00.4
0.2
# ofImputed Fees (US$m)
Market
Jan 1 – Mar 30
Market# of Deals per Advisor
MarketRank Value Advisor
UBSCiti 43
4 4
Financial Advisor
Rank Value per Advisor (US$m)
Bank of America Merrill Lynch▲
Troika Dialog
1
7.7▼
6.9
22.912 4,257.5
Credit Suisse
Rank Value
15.3US$m
Any Eastern European Inv Announced (AD52)
Market
3
Eastern European M&A
3
15.4
1
2
▲ 4
10*
-10.4
9
2,620.2
-
▼
12
Goldman Sachs & CoDeals
Change in
First Quarter 2012 | Mergers & Acquisitions | Financial Advisors
Rothschild
Sh (%)2011 Rank
-3.9
-8.4
2012 Rank
2 -8.314.5
11
14*
▼
6* -7.9
-
14.18.8
1,457.7
▲
230.2
Xenon Capital Partners
1
32.5
18
-
▼
108.0
SEB Enskilda
-
0 1
68.4
21*
17Standard Bank Group LtdMacquarie Group
25*16
Mediobanca
45
10.20.20.2
25 027
21*
25
Aon Benfield
0.232.2
KPMG
PricewaterhouseCoopers
ATA Invest
Raiffeisen Bank International20
14*13
Parks Paton Hoepfl & Brown LP
UniCredit
Evercore Partners
4
Share Ch.
858.6
0.2
PricewaterhouseCoopers -1.10.1
2719
-
0
32.9
55.8 0.3
0.2
1
0
-2
▲
Standard Bank Group LtdLazard
1
2,706.9
31
▼
8
0.58
1.03
▼-3
-3 ▼
BNP Paribas SA+2▼
+1 ▲-5
-
▲+2
BMO Capital Markets -
1Citi2
523
0.1
11*
Credit SuisseNomura
Greenhill & Co, LLC
0
▼ 10▲-
0.2
▼
▼▼
▼0.5
45
1
19
1
0.6
▲29.0
51*
▲
0.11
164.0-1.9
75.9100.0
-1.1
24
55.8▼
▼-
0.335*
-2.90.40.4
32.51
▼0.4
▲
1
0.1-2
▼1.1
-
-2▼
0.8
1.0
1.1▲
.6
0.22.1.3
2.8▼
4
1.8
▲
▼
5.3-
1.61.4
-
94
8*13
GMP Capital Corp
8
5*
-4
+12,191.5
5.7 ▲
.0▼
13.0
13.0
+1
-1
34.0 +3
4,083.3
5,723.3
4
34.0 ▲-Share Ch.
▲
23.1
0.3
1 0.2
▲
13.0
2
0.20.6
10.7
0.2-4.2
2
▲
1,582.2
26.35.95.9
▲
-1.9-20.6 ▼
1,319.2
1,000.01,000.0
5.9
5.95.9
▼
▼
4.4
20 36
11* 43*14
4.4
-3.1
737.8
1,000.0
+1
0.5
5.12.4 ▲
0.0
0.3 -3
0.20.2
2.6
0.2
737.8 0.3
32.2
0.3
.5
0.20.3
-1
4.4
7.8
5.15.95.9
2
0.3
0.21
▲
1
1
0.3-5
3
2011 Rank Sh (%)
1.1
11*
Deutsche Bank AG 3
US$m
23-3
0.9
3
▲
0.9
VTB Capital
Sberbank
Rothschild 24
0.1
0.5
25.3
0.129.0 0.2
0.1
0.1
1,054.7
▼
51*
0.5
▼
+1-2
+3# of Deals
1
2
▲0.1 ▲
0.5▼
0.9▲
2▼
0.3
▼
-1
▲
▲4.9
0.2
+1
0.6
MarketFinancial Advisor Share Ch.
3Deals
▲
▼
0.3
▲
▼-2
# of Deals
# of Deals per Advisor
Jan 1 – Mar 30Any Eastern European Involvement Completed (AF59)
MarketSh (%)
-1 ▼
▲0
0.57
▲▼ 9.1
1.0-1
4.3
1
▼
24.3 0.1
0.2
▲1
2.8
+1
▼
+15.2
▲
.7
▲0.5
0.2
5,534.7
13.0
-5.0
▲0.1
▲
▲
4.9▲
5.9
Market
▼41.6
8.2
4.0
Sh (%)Market
1.2
15.6
7.8
8.2
1.9
5.19.89.4
▼
-▲
▲
▼
14.9
3.03.1
▲
2.1
▲▼
1.90.3
0.2.3▲
0.5
0.0
▼
▲
▲
2.2
.6
▲
8.5
▼
0.93.9
.9
4.8
0.0
▲0.2
▲0.3
▼-
Fees
6.0
# of
0.1
1.5
Change in Rank Value per Advisor (US$m)
▲
13.0
1,000.0
9.45*
43*
2012 Rank
5*
+1-
2,191.5
4,268.1
2,191.5
11*
0.1
Morgan Stanley JP Morgan
-55Industry Total
▼ -30.8%
0.6-2.0 ▼-367
874.0
Acquiror / Target Nation
▼
1/31/2012
2/14/2012
-59.2% ▼
523.6
FSK EES
Russian Fed / Russian FedInvestor Group 623.1ANK Bashneft
Russian Fed / Russian FedUnited Kingdom / Poland
▼
Any Eastern European Inv Announced (AD52) - Top Deals
-43.5%Industry % Change from Same Period Last Year
16,840.7
-48.5%
Zlote Tarasy Sp zoo (77%)
Intended Baltika (15.5%)
PendingPending
3/29/2012
3/1/2012 Pending
3/29/2012 UGK (90%)
3/12/2012 TAV Havalimanlari Holding AS (38%)1/20/2012
Ufaneftekhim (45.1%)
0.1
Target (% Sought/Acquired)
▼
2/20/2012Pending
Industry Total
Date EffectiveRank Date
Eastern Europe Involvement Announced M&A by Target Industry ($bil)
▼Industry % Change from Same Period Last Year
* tie
824
-37.2%
25.027
Industry % Change from Last Quarter
2/28/2012
25KPMG
1,425.2
Talanx AG
1,220.2
100.0
576.0Russian Fed / Italy
Industry % Change from Last Quarter
Investor Group
Rank Value (US$m)
-343635
TUiR Warta SA (100%)
18,622.6
DRSK (100%)3/21/2012
▼-52.8%
100.0
Kredyt Bank SA (100%)
▼
ISAB Srl (20%)
750.0
Germany / Poland
624.5
-35.1%
995.7
190.8
Energy and Power / Petrochemicals
AK Alrosa
Jan 1 – Mar 30Acquiror
▼-44.7%
Aeroports de Paris Management
Pending
Poland / Poland
▼
Financials / BanksBaltic Beverages Holding AB
Russian Fed / Russian FedFrance / Turkey
Russian Fed / Russian Fed
Energy and Power / Power
Sweden / Russian Fed
Energy and Power / Power
Energy and Power / Oil & Gas
1/23/2012Real Estate / Non Residential
-51.7%
Energy and Power / Oil & Gas
▼
100.0
-40.8%
Enel OGK-5 (26.4%)
Pending3/11/2012Pending
Jan 1 – Mar 30
Consumer Staples / Food and Beverage1,037.0
Financials / Insurance
Target Macro / Mid Industry
Industrials / Transportation & Infrastructure
Bank Zachodni WBK SA
NK LUKOIL
$8.043%
$3.418%
$1.910%
9%
5%4% 4% 2% 1% Energy and Power Financials Consumer Staples
Industrials Materials Real Estate
Media and Entertainment High Technology Consumer Products and Services
Healthcare Retail Telecommunications
`
https://www.thomsonone.com

Rothschild 16
719.9
921.1774.6
921.11,289.3
6.5
1
8
8
6.8
Macquarie Group
Morgan Stanley 3*Troika Dialog
5Xenon Capital Partners
Goldman Sachs & Co 1,550.6US$m
100.0
8.0
4
6.3
Rank Value per Advisor (US$m)
Any Russian Involvement Announced (AD58)
750.0JP Morgan
0.9
VTB Capital
5-
-1
3*
6
7
2
7
3
2
▲
▲
1▼
▼
13.5
8.0 -22.9▼ 5-5.2
313.5
11.25
▼▲
Citi
Deutsche Bank AG
0.6VTB Capital
▼30
4*
▼ JP Morgan+1-2
▲
Credit Suisse
- 4*
-3
0.90.6
Rothschild
17*8*
1,000.0
737.8
8*-
Standard Bank Group Ltd
8*
17*Societe Generale12*
▲ -
9.3
12.3 0.5
-
▼
9.3
9.3
Troika Dialog-
Sberbank1,000.0 9.3
1
14 737.81,000.0 9.3
6.9 2▲
1,000.0
2.7
1
Greenhill & Co, LLC
2011 RankFinancial Advisor
-
1
8*
2
6Nomura
Market
Russian M&A
▲10.833.0
7
3,531.815
14.81,582.2
33.0 ▲
43.64,083.34,676.1 31.1
-12.7
▲▲
9.3 ▲9.3
-24.4
-6.9
0.20.5
2
0.2
-20
+19.3
Sh (%)
14.8
1,054.7
1,582.21,319.2
38.1
▲6.9
14.8
Any Russian Involvement Completed (AF65)
Rank ValueSh (%)
-4.5
2.3 ▲0.65.2▼ 5.7
2.92.6
1
1
▲0.2
2
0
▼
MarketDeals
# ofShare Ch.
Jan 1 – Mar 30
1
1
2 ▲9.3
First Quarter 2012 | Mergers & Acquisitions | Financial Advisors
2▲
-5.6
2012 Rank
Market MarketFinancial Advisor
Rank ValueUS$mSh (%)
Market Change in
▼1.0
2011 Rank
Advisor
▲
Change in
1.2
MarketShare Ch.
3.9▲
12*
1
45
0.2
0.6▲▲
.6
4.0▼
Rank Value per Advisor (US$m)
▼
▲
▲
9.8▼
▲6.0
▲
9.3
3
0.6
3.7
.00.6
▼4.7
6.5+1
Market# of Deals
7.3
0.01.0
▼.9
4.3
7.9
0.2+1
+1
+1
0.4-2
-2
0.2
0.9 0
0.2
▼2.9
# of Deals per Advisor
10.9
0.6-6.6-9.0
10.19.37.0
▼2.0
+1
# of# of Deals per Advisor
Deals▲
0.6
0.2
8Sh (%) Share Ch.
Jan 1 – Mar 30
Imputed Fees (US$m)Market
Fees
7.0
Sh (%)
1.0
-1▲
-4
▼8.6
▼6.4
-30.5
0.5
0.2▲ .6▲
▲
1.3-
8.4
-1▲
4.4▲
0.5 +2
7
2012 Rank
▲# of Deals
+5
Lazard
Baltika (15.5%)3/29/2012
Intended
ANK Bashneft3/6/2012
Industry Total
2/20/2012
* tie
Industry % Change from Last Quarter -58.9%
3/6/20122/2/2012
-44.0%
413
▼
-279
Russian Fed / Russian Fed
3/15/2012
ISAB Srl (20%)
Enel OGK-5 (26.4%)
Rank Date
1/31/2012
Date Effective
11,482.4
Target (% Sought/Acquired)
Pending
Industry % Change from Same Period Last Year -57.6%
Energy and Power / PowerEnergy and Power / Power
Jan 1 – Mar 30
Energy and Power / Oil & Gas
-44.3%
ANK Bashneft
100.0
▼
Energy and Power / Oil & Gas
▼-58.0%
Energy and Power / Oil & Gas
Energy and Power / Petrochemicals
Energy and Power / Oil & Gas
-40.3%
1,037.0
523.6
465.9 Media and Entertainment / Cable
▼
Consumer Staples / Food and BeverageTarget Macro / Mid Industry
91.9
Jan 1 – Mar 30
Rank Value (US$m)Acquiror / Target Nation
▼
Netherlands / ItalyRussian Fed / Russian Fed
10,714.7
▼
Pending
Ufaneftekhim (45.1%)
Lukoil Europe Holdings BV
Pending
444.0
467.0
624.5
Russian Fed / Russian Fed
DRSK (100%)Energy and Power / Oil & Gas
100.0
523.6Russian Fed / Italy
FSK EES
Baltic Beverages Holding AB
Russian Fed / Russian Fed
UGK (90%)
Acquiror
▼
Sweden / Russian Fed
-24.8%Industry % Change from Same Period Last Year -45.5%
1,220.2AK Alrosa Russian Fed / Russian Fed
1/23/2012750.0
Russian Involvement Announced M&A by Target Industry ($bil)
ISAB Srl (20%)
▼
3/11/2012 576.0
Investor Group3/29/2012
Industry % Change from Last Quarter
-282531 Industry Total
▼
100.0
1/31/2012
3/11/2012
3/1/2012 Pending
Pending
NK Rosneft'Taas-Yuryakh Neftegazodobycha (35.3%)
UNPZ (43.7%)Russian Fed / Russian FedRostelekom
Any Russian Involvement Announced (AD58) - Top Deals
Russian Fed / Russian Fed
Pending NK LUKOIL
-39.5%▼
NTK (28.2%)
-34.7%
$7.262%
$1.311%
6%5%
4% 3% 2% Energy and Power Consumer Staples Media and Entertainment
Industrials Materials Financials
High Technology Healthcare Consumer Products and Services
Real Estate Retail Telecommunications
`
https://www.thomsonone.com

Goldman Sachs & Co Deutsche Bank AG
OSK Holdings Bhd
4,212.0
1,292.8
4
1,320.6
8.8
Financial Advisor
6.2 ▲
▲
85*
6.5
6,120.8
50
14
US$m
Guotai Junan Securities
1 024 4
106
116*
25182,334.6
Share Ch.Financial Advisor
4.210.2 ▼
Rank Value per Advisor (US$m)
1.1
0.42.0
Fees# of
-5 1.7
--
▲3.0
1.2 0.93.1
0.91.11.2
▲
2
-
-3-5
▲▼
+1
3
+5
+1 ▲0.4
0.3
1
0.3
14.3
▲
Change in # of Deals per Advisor
First Quarter 2012 | Mergers & Acquisitions | Financial Advisors
12
2,623.4
20
22*
13
-
▼-2.0
▲
+1
1
5.5
1
00.3▼
4+1 12.5
0.7
9.4
104* 2.5
9
▼
0
8.20.3
2
9.2
24
2
▲3.5
▲
▼-9.6
5.053
0.4
+2
0
6
51.2
▲7
1
1.51.3
+4 0.92.0
15.31
▼
▲
3.1▲
Market
14.4Sh (%)Market
▲
Advisor
11.715.2
Deals Sh (%)Market
Share Ch.
Imputed Fees (US$m)2012 Rank
4,800.0
4,733.9▲
9.6▲
4,800.0
3.5
9.6
3.8
9.9
8.5
9.6
4.4
9.5
7.2
5.5
▲17*
-12.7
4.54.2
2.72.6
1,728.537
-1
0.9
2,531.42,502.9
-
3.53.3
2.4
2012 Rank
4,641.9
4
Any AsPac Emerging Market Inv Announced†
Rank Value per Advisor (US$m)
▼3.1
2.2
0.2
0.7
0.70.94.3
Jan 1 – Mar 30
9.6
▲
▲-1
5
10.7
▲
24▲
12.2
-
1,913.4
10
5* ▲
13
6.5
0.0
+1
5▲
+1
6,081.0
▲4.2
1.1▲
.1
0.9
▲▲
5 1.53.6 1.82.6
▲+2
▲-2▼
0.7.6
2.813.50.5 -1
14.5▼
▲▲
▲
-
▲
17.5
▲
▲
+22.0
3.0
2.0
2.4
1,069.9
1,220.4
▼
0.7
2,629.3
7
Credit Suisse
0.1
Mizuho Financial Group RBC Capital Markets0.1
1,686.5
11
1.5
1,097.81,097.8
121.5
45
0.1
3
3.3
22*
2.7
17
21
2,690.4
1,192.8
2.4
126 56
▲
▼
3,304.8
4,608.4
910
23 4,001.52
4,079.85.65.4
5.7
3.8
▼
▲
2.3▲4.7
5.1 -4.5
6.64,711.6
Jan 1 – Mar 30
# of Deals per Advisor
Credit Suisse
Sh (%)
Asia Pacific M&A
▲
5.7
3,614.93,801.7
1.88
0.15,618.0
Rank Value
6
0.3
6
Sh (%) # of Deals
+1
▲
0.6
0.20.5
0.1
5
▲
BBVA-4
1.7
0.8
▲+1
▲0.20.3
+1
▲
3.9
1.1
0.1
1.11.1
0.0
▲
-
1.92.3
0.1
1.0
▲▲0.6
2.5
▲0.9
0.8
1.0
0.8
▼1.9 ▼
▲
0.9
0.01.3
0.2
▲Guangzhou Securities Co Ltd▲
▲▲
4,916.3
5.348
Societe Generale
1,220.4
US$m # of Deals
4
5Sh (%)
▼
17*7 3.3
7.221
Any Asia Pacific Emerging Market Involvement Completed†
15.87,884.57,846.7
8.4
Market2011 Rank
15.8 3.0
MarketShare Ch.
▼5
2.4
-2
-6
-18.3
Rank Value
41
China International Capital Co
2Bank of America Merrill Lynch2.3
7.9 1.7
Morgan Stanley
35
+20.8
+1
12JP Morgan
▲▼▲
DealsMarket Change in
▼
Market
-9.4
Market
▲
▲
8.6
# of
▲
959
7,252.3
▼▼
0.4
0.60.3
UBS
▼
0.3
-8
+1
0.4
RBS
0 -
0.3
+4
+1
-3+6
5,898.7
3.70.3
2
5
30.1
8
-4▲
0
-5
+4
▼
00
237
-5.0
7
▲Standard Chartered PLCGoldman Sachs & Co
Citi 9
▼
OSK Holdings Bhd
Rothschild
-
3.6▼
-
▲
+2
1,714.6 ▲
-
53
2.51,764.6
1.5
▲
1
2011 Rank
CITICDeutsche Bank AG
JP Morgan
Guosen Securities Co Ltd
▲ 1▲
2.9
3.7
Barclays
16Somerley Ltd
7
10
75
Grant Thornton7Bank of America Merrill Lynch
3Standard Chartered PLC 9
-
CitiKPMG
HSBC Holdings PLC
Caitong Securities Co Ltd
Cenkos Securities PLC
3.7
19
154Malayan Banking Bhd
2,748.5 -0.90.75.62,768.4
Rothschild27
UBS24
0.4
3,606.912
Morgan Stanley 15
13-
▼
▲
China Merchants Securities Co
▲
1220
3160.5
11
14
▼10
6-1
▲+1
Malayan Banking Bhd
76
▲ BMO Capital Markets
▲Paradigm Capital IncBNP Paribas SA
2.51,220.41
0.317*
5-17* 0.83.9
2.5 ▲2.5 0.3
▲
▲+1
2.5
▲
0.3
2.5
1,194.06 -0.4 4.3 0.9▲20Strand Hanson Ltd- 2.221
▲0.312.42.4
-220.1-
Danatama Makmur2.2
1,000.0
2.41.72.4
▲
▲1.1 ▲ 0
+5
▲
939.5 1.91.81.9
--962.1
1.966*
▲23
0.7▲0.1
0 2
▲
6.5
4.9
Ernst & Young LLP 1,052.624 ▲+2
Platinum Securities Co Ltd▲
1 4
1.5 1.5 2111.2325 1 0
24
Target (% Sought/Acquired) Acquiror / Target Nation
OSK Holdings Bhd
-11.3%
Any AsPac Emerging Market Inv Announced† - Top Deals Jan 1 – Mar 30
Jan 1 – Mar 30
2,500.0
100.0
China / China
▼-17.9%
PendingPending
2/25/2012 Pending
50
Date Effective
71,079.1
Rank Date
* tie
▼
1,024.4
Industry % Change from Last QuarterIndustry % Change from Same Period Last Year
Perenco SA
Target Macro / Mid Industry
Alibaba.com Ltd (28.6%)
SBI (5.7%)Fawer Automotive Parts Co Ltd (100%)ConocoPhilips Co-Oil&Gas Asset (100%)
2/24/2012
2/21/20123/7/2012Pending
1/3/20122/15/2012
Intended
2/10/20122/16/2012
Pending
Pending
3/19/2012
Sesa Goa Ltd3/7/2012
PendingSinopec Intl
3/16/2012Cove Energy PLC (100%)
India / India
Devon Energy Corp-Assets (33.3%)
▼
Thailand / United Kingdom
▼▼
1,290.0
-30.8%
100.0
▼
Energy and Power / Oil & Gas
3,910.8
Guangdong Sunrise Holdings
-
Shanxi Meijin Grp Jinfu Coal (100%)
France / Vietnam
China / China
Tanjong Energy Hldgs Sdn Bhd (100%)
1,477
Asia Pacific Emerging Market Involvement Announced M&A by Target Industry ($bil)
India / India
▼-7.3%
485.2
Financials / Asset Management
-10.5%-21.1%
-211791
Materials / Metals & Mining1,714.6
† Asia Pacific Emerging Market totals include countries in North Asia South Asia Southeast Asia and Australasia (excluding Australia Hong Kong Myanmar New Zealand Singapore South Korea and Western Samoa)
Pending
1MDB
-18.7%
China Cinda Asset Management (16.5%)
Industry % Change from Last Quarter
PTT Exploration & Prodn PCL
Acquiror
0▲-419 49,832.3
0.2
-30.4%
China / China
Materials / Metals & Mining
1,640.3
Malaysia / Malaysia
China / United States
▼
Materials / Metals & Mining
2,531.4
Rank Value (US$m)
1,455.71,574.9
2,334.6
2,810.4High Technology / E-commerce / B2B
Financials / Banks
Energy and Power / Oil & Gas
Energy and Power / Power
Industrials / Automobiles & Components
Industry Total1.4 325 1.0
-22.1%
Alibaba Group Holding Ltd
Shanxi Meijin Energy Co Ltd
▼
India
Sterlite Industries(India)Ltd (100%)
100.0
Industry % Change from Same Period Last Year 0.2%
Industry Total
▲
Hong Kong / China
Investor Group
$19.528%
$1217%
$8.111%
$7.511%
10%
7%4% 4% 3% 2% 2% 1%
Materials Energy and Power Industrials
High Technology Financials Real Estate
Healthcare Consumer Staples Telecommunications
Media and Entertainment Retail Consumer Products and Services
`
https://www.thomsonone.com † Asia Pacific Emerging Market totals include countries in North Asia, South Asia, Southeast Asia, and Australasia (excluding Australia, Hong Kong, Myanmar, New Zealand, Singapore, South Korea and Western Samoa).

2.12.1
▼1.6
▲
1
11.1
58.0
Ernst & Young LLP
PricewaterhouseCoopers
IMAP
2012 Rank
▲
Jefferies & Co Inc
10.1▼
0.5
0.5
0.6
▼
1.2
0.1
10 -8.8
5,432.5
394.4
71.7
0.2
21 50.0
6
1716
65.0
99.4
20 51.4
▲
Market2011 Rank
-
0.4
1
0.81
▲0.8
-1.2
20 0
Results International Group 22
2423
Morgan Stanley
Ernst & Young LLP
Kotak Mahindra Bank Ltd
Enam Securities
Bank of America Merrill Lynch
Global TrustCapital FinanceIMAP
▲
Jan 1 – Mar 30
MarketShare Ch.
+2 6.7▲
10.2
▼
# of Deals Sh (%)10.23.3
.1
-0.22.6
0.2 ▲1.2
▲▲
5.75.76.6
▲6.7
0.8
7.8-
4.3▼
5.1
▲▲ 1.0
▲
1.4
▼
1.01.0
22
▲▼5.4
1.5
2.5
0.5.5
▼
0.8
.1
0.5
0.2
0.6
1.1
0.2
0.0
3.8
0.1
+1
.2
0.1▼
▲
.4
-
0.40.7
.3
▲.5
-
Any Indian Involvement Completed (AF67)
0.5
.1
0.12.1
01.0
0.7
▼▼ -3-4.1
0.5-0.3 2.14
▼▼
▼
▲▼0.2
▼0.3
0
.2
0.0 .00
1▼-
31▲+1
1426.0 ▲
0.2
0 1 2
▲0.4
20 2 ▲
0.4
0
25
27.043.6- 0.4
-0.7
0.3
337.0-6.9
28
41*Veda CorporateAdvisors Pvt Ltd
19
13*
12
Macquarie Group
+3
1▼
0.8
4,641.9
32.6
- 605.8
-
22
-827 38.7
4,171.8
2*
+1
00.7
-1.4
736.6
KPMG
34.04
Grant Thornton 4,079.8
▲
01.1
3.325.1 +25.1
0.4+13
▼-0.2
8.8 7.30.76.1 0.7
67
13*
9*19
-2▼
▼-2.2
0.4
Societe Generale13
1,052.6
361.5
915*
Barclays
RBS
11
394.4
▼
Jefferies & Co IncLazard
10*
92.0
15HSBC Holdings PLC
10* 3.3
Ambit Corporate Finance
0.6
▲0.4
0.7
2
3.0
▲
-3.21
1.4
▲
+1
-123
0.4
0.8
1.5
0.4
0.5
▼ 1▲1
▼
▼
1
-1
0.4
▲
39*
0.4
18
▲
▲
25.94
29
-2+1
34.81.85
534.838.7
1.8
▼Sh (%)
Rank Value per Advisor (US$m)Rank Value2012
RankMarket
45.31US$m
95
4,641.9
Sh (%)# of
38.232.1 Enam Securities
0
Any Indian Involvement Announced (AD60)
Indian M&A
0
-5
▲
▲
▲
42.8
+1
1.4 +4-3
+1
34.05
21
▲ 1
1
2.82.8
▲
▼
337.0
18
-8.7
▲
Share Ch.
2*JP Morgan
Financial Advisor1
Citi
Deloitte
Religare Capital Markets Ltd
2541*
Rothschild-
7
8
Clairfield International
-
3,910.8
180.1
▲
▲
3*
Rank Value per Advisor (US$m)
▲665.0
1.02Deals
Market
2.1-17.0
AdvisorFees# of Deals US$m
2011 Rank Sh (%)
# of
3
# of Deals per Advisor
▼
Change in
11 ▲
12.0
+3
RBS
Religare Capital Markets Ltd1.8
Deals Financial Advisor
▼
-4.60.70.20 7
▲
# of Deals per AdvisorMarketMarket Change in Market
Jan 1 – Mar 30
Imputed Fees (US$m)
-1
+1-2
0.50.5
-6
+1 .82
▲2 1.02.1
-4
0.5
0.5
0
0.5
0.5
▲
▲▼
-2
▼-0.8
+1
13.8
0.5
6.3
12
+41.0
58.0
370.1
1.1
KPMG
0.6
▼
1
0.50.5
1
-5 ▼
+1
12-4.0
▼▲
1.52.16.67.7
0.4
1.1
-
10.2
0.4
0.40.4
Morgan Stanley
Lazard
Macquarie Group
3.9
3.2 +5
▼▲
+5
Veda CorporateAdvisors Pvt Ltd
▼
▲
First Quarter 2012 | Mergers & Acquisitions | Financial Advisors
Market
▲
16.4 ▲Sh (%)
16.4
13.8 7.514.1
Share Ch.
▲
8.25*
▲5*▲
- 8.2394.4394.4 8.2
3112*
0.7▼-
24▲
12*
1065.011
899.4
3
116*7
71.7
314.99
1.4-5.0 1
▲▼
▲
11.2
10.6 0.1
0.8
1▲1.1
Deloitte27.927.0
1514
16ICICI Bank Ltd 28
-Global TrustCapital Finance
17
▲
Yes Bank Ltd19Challenge Consultancy Services
- Kotak Mahindra Bank Ltd
5.4
0.2▲
-1
14.9
13.8
-
Rank Value
13*-
12715.023
26.0
51.4
19
17*
▼
-
3*Haribhakti & Co
665.0
790.612
-
-
▲
1
-35.7%
Vodafone India Ltd (5.5%)
27.4%
Essar Capital Ltd
Media and Entertainment / Broadcasting
▲
Financials / Credit Institutions
Financials / Banks
High Technology / IT Consulting & Services
Consumer Staples / Textiles & ApparelIndia / Belgium3/27/2012
2/2/2012
2/2/2012
Watson Pharmaceuticals Inc
1/19/2012
1/24/2012
India Securities Ltd (25%)
272.8%
Intended
Pending
2/2/2012
▼
IndiaMaterials / Metals & Mining
Acquiror Rank Value (US$m)
India / India
Tech Mahindra Ltd
-1
▲
20.0Industry Total
3/15/2012
Industry % Change from Same Period Last Year
2/4/20123/21/2012 Pending
Pending
2/8/2012
11,995.0
SBI (5.7%)
1/24/2012
Rank Date
3/19/2012
-44.9%
-434,809.7
▼▼
31 0.1 2-35100.0
0.2
2/25/2012
-11.0%
Any Indian Involvement Announced (AD60) - Top DealsTarget (% Sought/Acquired)
▲284
India / IndiaAcquiror / Target Nation
Sesa Goa Ltd 3,910.8
Industry % Change from Same Period Last Year-46.3%-36.0%
Binani Industries LtdAscent Pharmahealth Ltd (100%)
1/3/2012The Walt Disney Co(SE Asia)
India / India
1,574.9
Industry % Change from Last Quarter
Piramal Healthcare Ltd
25Clairfield International
2/2/2012
Date Effective
▼Industry % Change from Last Quarter
Pending
Indian Involvement Announced M&A by Target Industry ($bil)
Sterlite Industries(India)Ltd (100%)
▲
Ushodaya Enterprises-ETV News (100%)
▼0.7
India / India
India / India
562.1
361.5
618.7
Singapore / India
Japan / India
100.0
394.4United States / Australia
501.4UTV Software Commun Ltd (49.56%)Mahindra Satyam (57.4%)
IBN18 Broadcast Ltd
3B The Fibreglass Company Sprl (100%)Reliance Capital Ast Mgmt Ltd (26%)
India / India
▼
Jan 1 – Mar 30
Jan 1 – Mar 30
264.7
423.5
Financials / Other Financials
18.6% ▼
Healthcare / Pharmaceuticals
Target Macro / Mid Industry
Telecommunications / Wireless
Media and Entertainment / Broadcasting
▼-18.4%
289.2
-51.4%
Nippon Life Insurance Co
100.065.9191Industry Total
* tie
$4.336%
$2.521%
$1.19%
7%6%
6%6% Materials Financials Media and Entertainment
Telecommunications High Technology Consumer Staples
Healthcare Industrials Energy and Power
Consumer Products and Services Real Estate Government and Agencies
`
https://www.thomsonone.com

1,765.3
6,022.7
41
Barclays
20*20*
Any Chinese Involvement Announced (AD56)
0
TD Securities Inc
11
▼
Chinese M&A
-
-1
▲16.815.3
3.54.3
0.11
▲
0.3
3.3▲ 4.3
4.30.6 1.1
▲
▲
1.9
8.91.4
▲
3.8▼6.3
3.6
▲ 7.2▲
10
6
▲
1.0 .6 0.3 0.21.9
6.57.2
1.4
3.3
6.5
14.68.3
▲1.9 ▲
▲
4.30.4
▼
▼2.6▲
3.6
19.9 ▼
MarketChange in
3
-1
Rank Value per Advisor (US$m)
3
Credit Suisse
6.5
8
-
-
Morgan Stanley
Banco Espirito Santo SA
Central China Securities
2012 Rank
Bank of America Merrill Lynch
-
Allen & Co Inc 13*
1,688.9
715
2,531.4
2,334.62,531.4 6.5-
Deutsche Bank AG2,531.4
14
Rothschild
UBS
Somerley Ltd
4*
3,304.82
4*
Caitong Securities Co LtdHSBC Holdings PLC
Rank Value# of Deals
MarketRank Value per Advisor (US$m)
-
38.56.9
-1
27
CITIC401
6.5
3
5.4
15.2▲
Sh (%)Market
US$m
▼
1.6
1.6
# of Advisor
15.4Share Ch.Sh (%)Fees
0.3
+341.0
# of Deals
▲▼
▲
+1
+5
Citi
Share Ch.
Jan 1 – Mar 30
17
▲
21
# ofMarket
0.4
4*
Guangzhou Securities Co Ltd
9
2,690.47
China Renaissance Partners
Standard Chartered PLC
MarketImputed Fees (US$m)
US$m
▲ BBVA
-
+3
▲4
+4
5*
2011 Rank
6.5
6.95.0
0.1
3
1
▲▲
6.5
0.4
16.716.7
19.1UBS▲
▲
1 0.1 -3
0.1
▲
-▲
4,800.0
2017.1
▲4,916.35,710.8
5.1
5*25.9
China International Capital Co
▼ 12
4
Bank of America Merrill LynchJP Morgan
2011 RankFinancial Advisor Sh (%)
Change in Deals
# of Deals per AdvisorMarket
0.32+6▲ 6 0.8
▲
6.0-44.5
6.0
-4.31.9
2.8
3.1
1.3
▲-
1,097.8-11*
2.52.32.8 ▲
▲
2.8
-1
2.8
991.3-
▲
2.513*1,097.8
991.313*
19 -
4
1
697.6
1.916
20*
0.110.1
-12.0+1
0.514
2.5
1.9
1.8-5.71.8
413.1 1.1 ▲
508.9
1.71.3
▼-1.11.3
1
2▼
2
▲▲
3
0.1
Sh (%)Market
16.7
14.7
First Quarter 2012 | Mergers & Acquisitions | Financial Advisors
1
1.3
4.3
38 ▲2,629.37.4
8.6
4.7
+1
7.4
8.2▲
0.6▲
+1
▲ 2▲▲2
4.5 0.63.4
▲3.2
+1 2.4 1.35.5▲
1.8 1.0▲0.1
0.3
▲
7
4.5
13
5*
Rank Value
1,356.29
7,451.7Financial Advisor
China Merchants Securities Co
BNP Paribas SA
BMO Capital Markets
HSBC Holdings PLC
▲+1 ▲▲
1615
▼
0.9
Azure Capital
0.3 Rothschild
▲
1,192.8▲
4.310 26
4.24.9 ▲
▲25.9
9.29.69.6
Jan 1 – Mar 30
# of Deals per Advisor
2,768.4
6,081.0 21.2
Sh (%)▲
+1
2012 Rank
Market
Societe Generale
2,128.4
+1▼ 5
Deutsche Bank AG16.7
Share Ch.
-1
+5
Deals5
2▲
1
Any Chinese Involvement Completed (AF63)
4,800.0
0.6▼
1,292.840*
+1
2
-2
0.3▲
-+1
1,220.412*0.3
-12* 40*
-8 1 0.3▲▲+1
+10.3 ▲1.81.74.3 14.3
4.2 4.212* -
3.2
RBC Capital Markets -939.5
17*
1.73.91.8
▲1,220.4
▲1 0.3 +1 ▲ 0.1.1
▲5 ▲17* 924.0--3.7 1
1▲
1.31.3+1 3.0
3.0 ▲+1
3.1 ▲ 2
1.30.3
▲ 0.3 ▲13.2
▲1.73.9 1.7+2▲ 1.31.33.0+1
▲3.80.5▲
0.4 ▲
21 2.9▲2.7
▲0.2
2.6731.9
+1 1 1
▲2.5
2 3672 7
▲2.623
24 2.50 3▲ 1
730.5 ▲36 +23 1.0
25
M&A International
▲TD Securities Inc0
1 10.3 .440*
2 31
2 5
3
924.0
37*
+3SW Kingsway Capital Holdings▲
+1 -▼
2▲
▲▼
1
▲
1+2
2
0.3
1
0.1
0.10.1
+1
1
-3
1 0.1-1
785.8
-
0.11--
2.9901.2 3.1
+12.7
-3
22+1
1 0.3
0.2
0.63▲ ▲
-
11.0
▲
0.3
▲
▲ 1.3
3.9 1.7 1.7
▲▲
1.2 0.51.6
0.51.5 0.6
1.6+320
836.2
▲3.2-
17* 3.2 ▲
3.2- 3.3
1,194.0
4.31,220.4
▲Paradigm Capital Inc
▼▼
▼
▲ Ambrian Capital PLC
▼
Platinum Securities Co Ltd
Credit Suisse
Huatai Securities Co Ltd
508.91.1-1.3-
0.1
-1
+2
1.3
924.0▲Strand Hanson Ltd▼
▲
3.2
▼
▲
991.3
672.7
1.316
1.760* 508.9
2.5
719.0753.3
Guotai Junan Securities
1718
Goldman Sachs & Co
Southwest Securities Co Ltd 23
JP Morgan
Guosen Securities Co Ltd
11*
Goldman Sachs & Co
1/3/2012
3/16/2012
* tie
Industry % Change from Last Quarter
2/21/2012
2/15/2012
Rank Date
3/12/2012
Industry Total
1,022.8
1,192.8
991.31,019.3
High Technology / E-commerce / B2B
Healthcare / Pharmaceuticals
Target Macro / Mid Industry
Jan 1 – Mar 30
Rank Value (US$m)
Energy and Power / Oil & Gas
Materials / Metals & Mining
2,500.0
1,455.7 Industrials / Automobiles & Components
High Technology / E-commerce / B2B
Alibaba Group Holding LtdChina / United StatesSinopec Intl
Any Chinese Involvement Announced (AD56) - Top Deals
Hong Kong / ChinaAcquiror Acquiror / Target Nation
PendingPending
Jan 1 – Mar 30
2,531.4
Youku Inc
Alibaba.com Ltd (28.6%)
3/28/2012Pending
PendingSinopec GroupGuangzhou Pharm Co Ltd
Guangdong Sunrise Holdings
Shanghai Baoshan Iron&SteelGuangzhou Baiyunshan Pharm (100%)
Hebei Veyong Bio-chemical Co
Chinese Involvement Announced M&A by Target Industry ($bil)
Devon Energy Corp-Assets (33.3%)
▼▼
Tudou Holdings Ltd (100%)Baoshan-Stainless Steel Bus (100%)
-23.1%▼-14.6%
740100.0
China Cinda Asset Management (16.5%)Pending2/10/2012
1/23/2012Pending
Pending2/29/2012
2/10/2012
-34.2%
Target (% Sought/Acquired)
▼
Date Effective
Pending
PendingFawer Automotive Parts Co Ltd (100%)New Energy Mining Co Ltd (100%)
Pending
Australia Pacific LNG Pty Ltd (10%)
Shanxi Meijin Grp Jinfu Coal (100%)
-32.2%
Materials / Metals & Mining1,640.3Investor Group
China / China
China / China
China / Australia
2,334.6China / ChinaChina / China
1,100.0Industrials / Machinery
Industry % Change from Last Quarter
Financials / Asset Management
Energy and Power / Oil & GasChina / ChinaChina / ChinaChina / China
Industry Total
Shanxi Meijin Energy Co Ltd
▲+1 1.12.3672.7 0.3▲ 1-6 100.028,747.6
25
53.4%-1.9%
310▲TD Securities Inc -
Industry % Change from Same Period Last Year
1.12.3
-28.3%-23.6%-34.2% ▼ ▼
100.0
9.0% ▲ ▼▼
233.2
▲
2.539,105.7 -222
Industry % Change from Same Period Last Year
$1128%
$7.218%$5.7
15%
$4.311%
10%
6%6% 2% 2% 1%
Materials Energy and Power Industrials
High Technology Financials Real Estate
Healthcare Consumer Products and Services Consumer Staples
Retail Telecommunications Media and Entertainment
`
https://www.thomsonone.com

-
-
-
-
-
-
-
-
-
First Quarter 2012 | Mergers & Acquisitions | Financial Advisors
Ranking Criteria Summary
Serkan Tecimer
If you would like to participate in the submissionprocess, receive quarterly press releases, or havequestions about league table criteria pleasecontact:
Announced league tables include all deals that were announced between January 1, 2011 and March 30, 2012 and of which Thomson Reuters was made aware. All current data andprevious year's data is as of 5:00pm EDT on March 30, 2012.
League tables include rank eligible mergers, acquisitions, repurchases, spin-offs, self-tenders, minority stake purchases and debt restructurings.
E-mail: [email protected]
EMEA
Tel: +44 (0) 20 7542 3566
Deals with undisclosed dollar values are rank eligible but with no corresponding Rank Value. Non-US dollar denominated transactions are converted to the US dollar equivalent at thetime of announcement of terms.
Imputed fees are calculated using Freeman & Co. proprietary algorithm where spreads or fees are not disclosed. Deal fees are on a gross basis before all expenses. Each underwriteror advisor is allocated its share of deal fees using Freeman & Co. allocation methodology, based on the number of underwriters or advisors on the deal and their role. No fees areallocated to syndicated members.
Tel: +1 646 223 8413 Financial and legal advisors receive full credit for each deal on which they provide financial or legal advisory services, unless they represent minority sellers or advise on only a portionof the transaction or Thomson Reuters has not been made aware of their participation in that transaction. For pending transactions, advisors to targets of multiple bids receive credit forthe transaction agreed to or, in the absence of an agreement, the value of the highest offer.
Any Involvement league tables include deals where the target, acquiror, or either ultimate parent are domiciled (nation of headquarters) in the specified region or nation.
Japan
Tel: +813 5218 6576
A tender/merger transaction is considered to be effective at the time of consummation of the merger or the date on which it is declared wholly unconditional.
AmericasAnthony Pico
League table volumes for Mitsubishi UFJ Financial Group and Morgan Stanley, included herein reflect the changes after the commencement of their jointly established securities firmsin Japan: (1) Mitsubishi UFJ Morgan Stanley Securities and (2) Morgan Stanley MUFG Securities. Accreditation for transactions involving the newly established joint ventures arereflected in totals for Morgan Stanley. For Japanese related rankings, Morgan Stanley is represented as "Mitsubishi UFJ Morgan Stanley”.
League tables, commentary, and charts citing announced activity are based on Rank Date and include intended, pending, partially complete, completed, pending regulatory, andunconditional transactions. Rank Date is defined as the earliest public announcement of when a value can be applied to a transaction.
E-mail: [email protected]
Asia-PacificJason Pacannuayan
Akemi Mamiya
Tel: +632 858 7262E-mail: [email protected]
- Thomson Reuters includes the following nations in the Emerging Markets M&A Tables:
Tel: +813 5218 6576E-mail: [email protected]
While Thomson Reuters has used reasonable endeavors to ensure that the information provided in this document is accurate and up to date as at the time of issue, neither Thomson Reuters nor its third party content providers shall be liable forany errors, inaccuracies or delays in the information, nor for any actions taken in reliance thereon, nor does it endorse any views or opinions of any third party content provider. Thomson Reuters disclaims all warranties, express or implied, as tothe accuracy or completeness of any of the content provided, or as to the fitness of the content for any purpose to the extent permitted by law. The content herein is not appropriate for the purposes of making a decision to carry out a transactionor trade and does not provide any form of advice (investment, tax, legal) amounting to investment advice, nor make any recommendations or solicitations regarding particular financial instruments, investments or products, including the buying orselling of securities. Thomson Reuters has not undertaken any liability or obligation relating to the purchase or sale of securities for or by any person in connection with this document.
© 2012 Thomson Reuters. All rights reserved.
Thomson Reuters and the Thomson Reuters logo are registered trademarks and trademarks of Thomson Reuters and its affiliated companies. Any third party name or mark herein belongs to the relevant third party.
Americas Asia-Pacific
Central America South America Central Asia Australasia South-East AsiaBelize Argentina Afghanistan American Samoa BruneiCosta Rica Bolivia Armenia Cook Islands CambodiaEl Salvador Brazil Azerbaijan Fiji IndonesiaGuatemala Chile Kazakhstan French Polynesia LaosHonduras Columbia Kyrgyzstan Guam MalaysiaMexico Ecuador Tajikistan Kiribati PhilippinesNicaragua Falkland Islands (UK) Turkmenistan Marshall Islands Timor-LestePanama Guyana Uzbekistan N. Mariana Islands Thailand
Paraguay Nauru VietnamPeru South Asia New CaledoniaSuriname Bangladesh Niue North AsiaUruguay Bhutan Norfolk Islands MongoliaVenezuela India Palau North Korea
Maldives Papua New Guina ChinaNepal Solomon IslandsPakistan TokelauSri Lanka Tonga
TuvaluWallis & Futuna Is.Western Somoa
Europe, Middle East & Africa
Eastern Europe Middle East Sub-Saharan AfricaAlbania Iran Angola Guinea-Bissau SomaliaBelarus Iraq Benin Angola Kenya South AfricaBosnia-Herzegovina Jordan Botswana Lesotho St. HelenaBulgaria Lebanon Burkina Faso Liberia SudanCroatia Syria Burundi Madagascar SwazilandCzech Republic Yemen Cameroon Malawi TanzaniaEstonia Bahrain Cape Verde Mali TogoGeorgia Israel Central African Republic Mauritania UgandaHungary Kuwait Chad Mauritius Western SaharaLatvia Oman Comoros Mayotte ZaireLithuania Qatar Congo, Republic of Mozambique ZambiaMacedonia Saudi Arabia Cote d'Ivoire Namibia ZimbabweMoldova United Arab Emirates Dijbouti NigerMontenegro DR Congo NigeriaRussia North Africa Equatorial Guinea ReunionSerbia Algeria Eritrea RwandaSlovak Republic Egypt Ethiopia Sao Tome e PrincipeSlovenia Libya Gabon SenegalTurkey Morocco Gambria SeychellesUkraine Tunisia Ghana Sierra Leone
https://www.thomsonone.com

SOLUTION FOR• Managing Client Relationships• Deal Origination• New Issues Pre-Marketing / Roadshows
• Financial Modeling• Customized League Tables • Simple Deals screening • Valuation analysis and comparable deal screening • Full integration into Microsoft Office® for on-brand pitch book creation
SOLUTION FOR
Thomson Reuters Solutions for the Deal Making Community
FOR INVESTMENT BANKERS
Thomson Reuters Advanced Analytics for deal making improves efficiency at every step, from screening and targeting, to comparables analysis, building league tables, valuing a company and developing a client pitch book. This set of analytical and presentation tools enables you to undertake all these key tasks without having to leave Microsoft Office®. You can also access our key content sets easily to support your analysis.
ThomsonONE.com Investment Banking is our flagship desktop solution that combines real-time market data and Reuters news with our world class reference data. It includes access to Recent Deals, Active Acquirers and M&A New Issues terms and conditions.
FOR JUNIOR BANKERS (COMING SOON)
SOLUTION FOR
Access unique analysis for free anytime using Thomson ReutersDeals Intelligence website and receive regular updates,delivered direct to your inbox.Go to online.thomsonreuters.com/dealsintelligence
SOLUTION FORFOR INFORMATION PROFESSIONALS, MARKET DATA, RESEARCH
FOR STRATEGY AND PLANNING TEAMS
To purchase individual Thomson Reuters Deals or League Table reports,please contact our Thomson Reuters On Demand group:Web: http://financial.thomsonreuters.com/ondemandEmail: [email protected]
Send us a sales enquiry at: financial.thomsonreuters.com/salesRead more about our products at: financial.thomsonreuters.com/products
Thomson Reuters Deals Business Intelligence enables you to slice and dice our renowned Deals and Fees data to create ad hoc reports, analyze market trends, benchmark your performance and identify opportunities – all within a tool built into your workflow in Excel®, saving you valuable time and giving you a competitive edge.
• Conducting market analysis and identifying trends• Benchmarking your performance and monitoring competitors• Targeting clients by wallet size and banking relationship• Allocating resources more effectively by evaluating and analyzing lost deals
SDC Platinum is the world’s foremost financial transactions database, covering new issues, M&A, syndicated loans, private equity, project finance, poison pills, and more.
• Market Analysis & Trends (Geography, Sector, Asset Class, Deal Type, Deal Size, etc.)• Deal Origination (Debt Maturity Analysis, Company Lifecycle including Private Equity)• Pitch Creation (Firm Credentials, Representative Acquirors)• M&A Targeting (Active Strategic/Sponsor Acquirors, Target Company Screener)• Negotiation (T&C Benchmarking)
Microsoft, Office, Word, Excel and PowerPoint are either registered trademarks or trademarks of Microsoft Corporation in the United States and/or other countries. Copyright 2012 Thomson Reuters. All rights reserved. 48003848 0312.


