Technical Strategy 2017 UBS 25 Technical Strategy Emerging Markets … Wave C Bull Leg into 2017 top! Strategically, 2011 represents a structural top in commodities and 2011 was the structural top of the outperformance cycle of Emerging Markets versus the MSCI World. Secular trends can last 10 to 15 years but no bear market is one-way. In this context, and following our cyclical model, it was a key call of our 2016 strategy to expect Emerging Markets moving into a major bottom as the basis for a 1 to 1.5 years lasting bear market rally within its underlying secular bear trend. Correlation-wise, and also in a global context, it is important to understand that we have to see the bear market rally in Emerging Markets in the context of the reflationary wave 5 bull cycle in the S&P-500. Consequently, at the point where we see wave 5 in the S&P-500 topping out we will (at the latest) also see the bear market rally in Emerging Markets topping out, as the trigger for the EM complex falling into a new bear market as part of its underlying secular bear trend. Tactically and pattern wise, it was our belief that a bear market rally in Emerging Markets would develop in a typical A-B- C rebound pattern. This scenario is unchanged. Wave A represents the rally from the Q1 major low into late summer. The October breakdown was the beginning of correction wave B, which we expect continuing into Q1 with support and a potential target at 810 to worst case 780. Tactically, we expect a late Q1 bottom to be the basis for the second wave C rally leg, which should be the final part of the 2016/2017 bear market rally. Generally, rallies in the EM world are very often quite sharp and on the back of our aggressive US dollar correction scenario and our wave C rally scenario for commodities, a wave C bull run in the EM complex can be at least initially quite sharp, which suggests the MSCI Emerging Market will tactically outperform into summer. Aggressive rally from a late Q1 bottom into summer From a price perspective, we expect the MSCI Emerging Market to rally from a potential later Q1 correction target at 810 to 780, towards its 2007 secular down at around 1000. This would be a rally of around 20%, and it is therefore that we will see a wave C bull run in Emerging Markets as one of the great trading opportunities in 2017. Chart 61. ) MSCI Emerging Market Weekly Chart Source: UBS Technical Research Chart 62. ) MSCI Emerging Market versus S&P-500 Source: UBS Technical Research Chart 63. ) MSCI EM/MSCI World versus CCI Index Source: UBS Technical Research
Transcript
Technical Strategy 2017
UBS 25
Technical Strategy
Emerging Markets … Wave C Bull Leg into 2017 top! Strategically, 2011 represents a structural top in commodities and 2011 was the structural top of the outperformance cycle of Emerging Markets versus the MSCI World. Secular trends can last 10 to 15 years but no bear market is one-way. In this context, and following our cyclical model, it was a key call of our 2016 strategy to expect Emerging Markets moving into a major bottom as the basis for a 1 to 1.5 years lasting bear market rally within its underlying secular bear trend. Correlation-wise, and also in a global context, it is important to understand that we have to see the bear market rally in Emerging Markets in the context of the reflationary wave 5 bull cycle in the S&P-500. Consequently, at the point where we see wave 5 in the S&P-500 topping out we will (at the latest) also see the bear market rally in Emerging Markets topping out, as the trigger for the EM complex falling into a new bear market as part of its underlying secular bear trend.
Tactically and pattern wise, it was our belief that a bear market rally in Emerging Markets would develop in a typical A-B-C rebound pattern. This scenario is unchanged. Wave A represents the rally from the Q1 major low into late summer.
The October breakdown was the beginning of correction wave B, which we expect continuing into Q1 with support and a potential target at 810 to worst case 780. Tactically, we expect a late Q1 bottom to be the basis for the second wave C rally leg, which should be the final part of the 2016/2017 bear market rally. Generally, rallies in the EM world are very often quite sharp and on the back of our aggressive US dollar correction scenario and our wave C rally scenario for
commodities, a wave C bull run in the EM complex can be at least initially quite sharp, which suggests the MSCI Emerging Market will tactically outperform into summer.
Aggressive rally from a late Q1 bottom into summer
From a price perspective, we expect the MSCI Emerging Market to rally from a potential later Q1 correction target at 810 to 780, towards its 2007 secular down at around 1000. This would be a rally of around 20%, and it is therefore that we will see a wave C bull run in Emerging Markets as one of the great trading opportunities in 2017.
Chart 61. ) MSCI Emerging Market Weekly Chart
Source: UBS Technical Research
Chart 62. ) MSCI Emerging Market versus S&P-500
Source: UBS Technical Research
Chart 63. ) MSCI EM/MSCI World versus CCI Index
Source: UBS Technical Research
Technical Strategy 2017
UBS 26
Technical Strategy
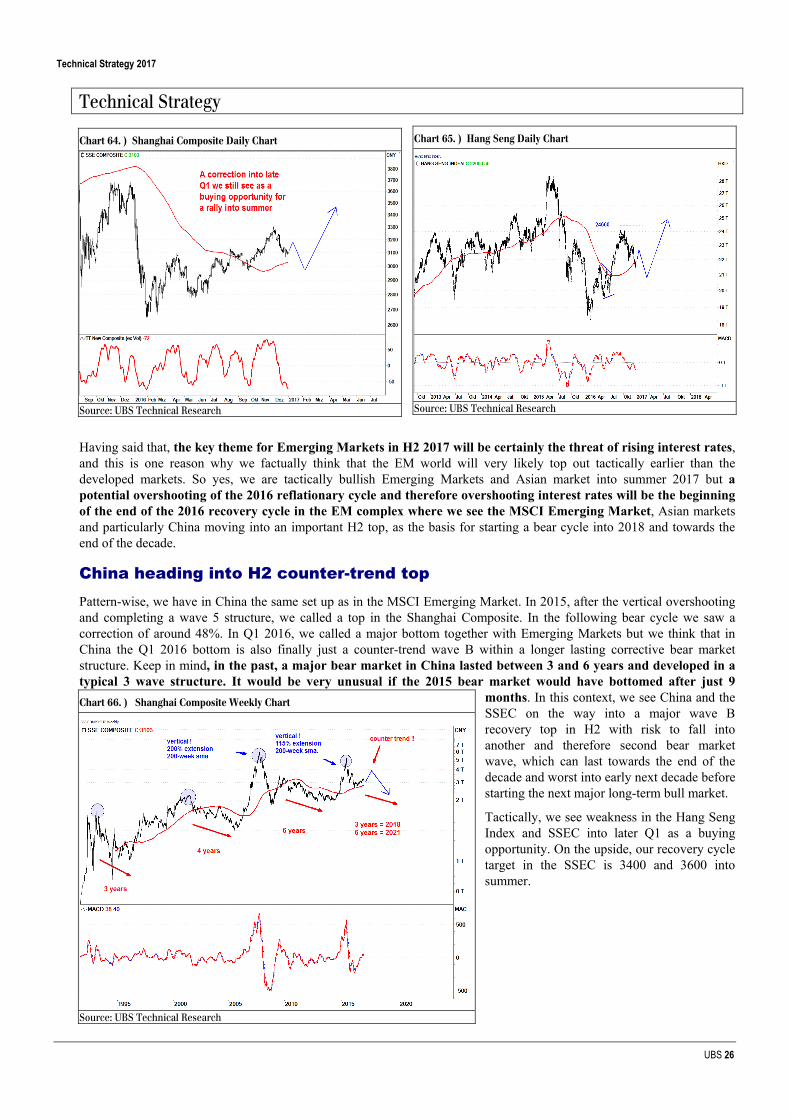
Having said that, the key theme for Emerging Markets in H2 2017 will be certainly the threat of rising interest rates, and this is one reason why we factually think that the EM world will very likely top out tactically earlier than the developed markets. So yes, we are tactically bullish Emerging Markets and Asian market into summer 2017 but a potential overshooting of the 2016 reflationary cycle and therefore overshooting interest rates will be the beginning of the end of the 2016 recovery cycle in the EM complex where we see the MSCI Emerging Market, Asian markets and particularly China moving into an important H2 top, as the basis for starting a bear cycle into 2018 and towards the end of the decade.
China heading into H2 counter-trend top Pattern-wise, we have in China the same set up as in the MSCI Emerging Market. In 2015, after the vertical overshooting and completing a wave 5 structure, we called a top in the Shanghai Composite. In the following bear cycle we saw a correction of around 48%. In Q1 2016, we called a major bottom together with Emerging Markets but we think that in China the Q1 2016 bottom is also finally just a counter-trend wave B within a longer lasting corrective bear market structure. Keep in mind, in the past, a major bear market in China lasted between 3 and 6 years and developed in a typical 3 wave structure. It would be very unusual if the 2015 bear market would have bottomed after just 9
months. In this context, we see China and the SSEC on the way into a major wave B recovery top in H2 with risk to fall into another and therefore second bear market wave, which can last towards the end of the decade and worst into early next decade before starting the next major long-term bull market.
Tactically, we see weakness in the Hang Seng Index and SSEC into later Q1 as a buying opportunity. On the upside, our recovery cycle target in the SSEC is 3400 and 3600 into summer.
Chart 64. ) Shanghai Composite Daily Chart
Source: UBS Technical Research
Chart 65. ) Hang Seng Daily Chart
Source: UBS Technical Research
Chart 66. ) Shanghai Composite Weekly Chart
Source: UBS Technical Research
Technical Strategy 2017
UBS 27
Technical Strategy
Japan … trading in wave 5 Strategically, and following our cyclical model, we had in summer 2012 a major long-term cycle low projection in the USDJPY, as the basis for a multi-year bull cycle into the 2015/2016 time window. Japan was and remains a currency game and by expecting a multi-year YEN bear market we have been strategically bullish Japan over the recent years. No bull market is one-way, and in 2015, in the context of our global cyclical bear market scenario, we expected a negative surprise into 2016 before starting a new bull wave. In 2015, Japan was massively overbought (wave 3 top), the sentiment was extremely bullish, the TOPIX was facing a massive and very obvious multi-year resistance at around 1800, and on the FX side, in the historical context, the 2012/2015 USDJPY bull cycle was nearly vertical, where a correction cycle would be a very normal phenomenon. However, our key message was always that any larger correction cycle in the USDJPY should produce a major higher low versus the 2012 summer bottom and this could be the basis for another bull cycle that should minimum test its 2015 top, which in the TOPIX could trigger the real and ultimate test to break its multi-year resistance.
Summer 2016 low represents a 4-year cycle low in USDJPY and Nikkei-225 Tactically, and from a cyclical aspect, the summer bottom in USDJPY and in the Nikkei-225 represents a 4-year cycle bottom, which means it is a major low; and as long as it holds the underlying long-term price structure in Japan remains bullish. From a wave perspective, we see the Nikkei-225 in the same context as global equities, where the summer bottom 2016 represents the bottom of wave 4. With the break of the 2015 bear trend and the impulsive rally into December the Nikkei-225 clearly trades in midst of a wave 5 bull cycle. Tactically, the Q4 rally was nearly vertical and from a cyclical aspect we have both the Nikkei-225 and the USDJPY trading in the time window of a multi-month top projection, which on the pattern side should be the top of wave 3. So similar to the picture in the US and in Europe, we see in Japan the risk of a mean reversion pullback within its underlying wave 5 bull cycle into Q1, where we wouldn’t be surprised to see Japan
Chart 67. ) Nikkei-225 Weekly Chart
Source: UBS Technical Research
Chart 68. ) TOPIX Monthly Chart
Source: UBS Technical Research
Chart 69. ) USDJPY Monthly Chart
Source: UBS Technical Research
Technical Strategy 2017
UBS 28
Technical Strategy
underperforming global equities. The rationale for this call is the correlation on the macro side where we expect yields pulling back into Q1 and gold basing for an aggressive rally into summer. The negative correlation of gold versus USDJPY is extremely high so if we are correct and we see gold rallying, this would make the Nikkei-225 vulnerable for a negative surprise in H1 before in H2 2017 we could see another and potential final bull cycle starting into H1 2018 where, in our cyclical model, we have the next major top projection for the Nikkei-225.
Conclusion: We are bullish Japan but we think the Nikkei-225 will be a volatile trading theme in 2017 with risk to see a negative surprise in H1 before into H2 we should see another rally attempt on the back of higher US yields and gold pulling back. Regardless of any tactical timing, in the bigger picture it is very likely to see the Nikkei-225 and the TOPIX testing their 2015 cycle tops, and in this context we would still see any weakness and/or a potential negative surprise into early summer as an opportunity to buy Japan.
Europe … trading in a wave 5 bull cycle
Europe was "again" the lagging region in global equities in 2016. After experiencing our suggested 20% to 30% cyclical bear market from the summer top 2015 (which represents a valid 7-year cycle top), Europe finally bottomed in summer 2016 against the US market posting its wave 4 cycle bottom in early February. In later summer 2016, we saw a broad-
based breakout in cyclical sectors, and particularly with the August breakout of the European banking sector we had clear evidence of an improving internal sector structure, where the break of the 2015 bear trend in the Euro Stoxx-50 was actually just a question of time. With the late Q4 rally, the Euro Stoxx-50 finally broke its 2015 bear trend. In the UK, the FTSE-100 is just a fraction away from breaking out to a new all-time high. In the periphery, we have our suggested major higher bottom in place versus the 2012 bottom, which is structurally bullish (as long as the pivotal 2016 bottoms remain in place), and on the indicator side, our monthly trend momentum is turning bullish as well. Despite the relative underperformance versus the US market, and the selective pattern picture in European headline indices, we have clear evidence
Chart 70. ) USDJPY versus Gold (inverse)
Source: UBS Technical Research
Chart 71. ) USDJPY versus US 10-Year Treasury Yield
Source: UBS Technical Research
Chart 72. ) STOXX-600 Monthly Chart
Source: UBS Technical Research
Technical Strategy 2017
UBS 29
Technical Strategy
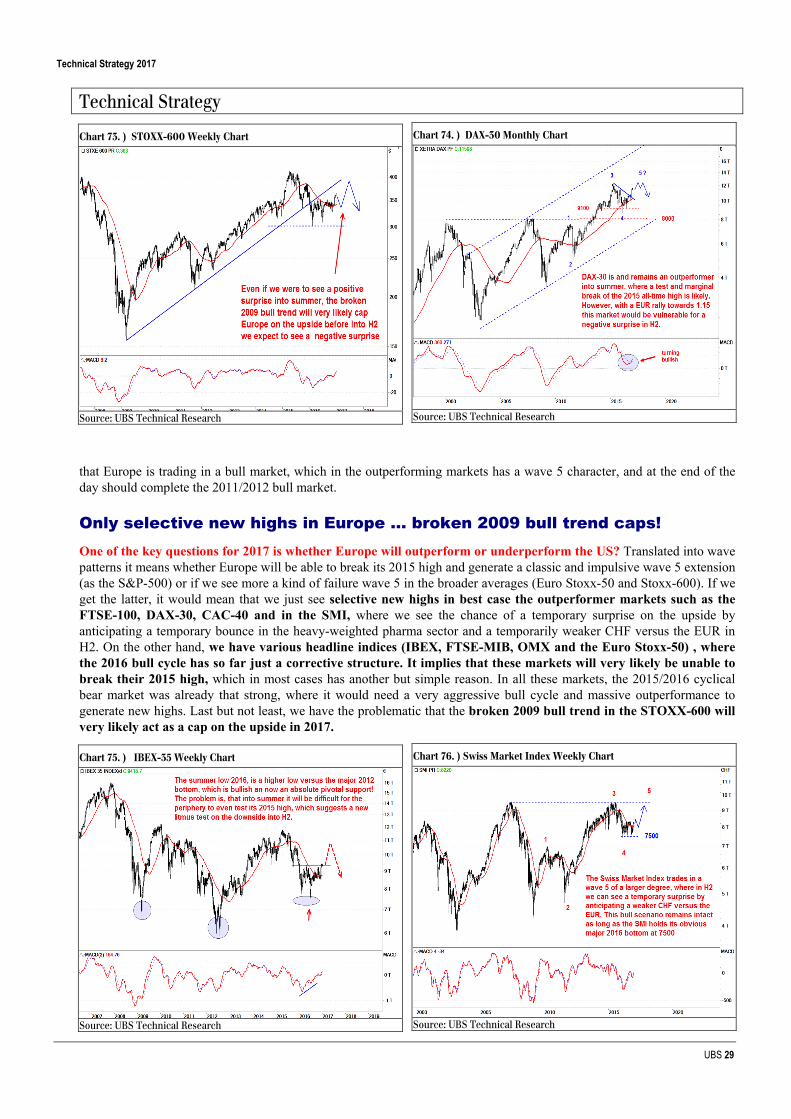
that Europe is trading in a bull market, which in the outperforming markets has a wave 5 character, and at the end of the day should complete the 2011/2012 bull market.
Only selective new highs in Europe … broken 2009 bull trend caps! One of the key questions for 2017 is whether Europe will outperform or underperform the US? Translated into wave patterns it means whether Europe will be able to break its 2015 high and generate a classic and impulsive wave 5 extension (as the S&P-500) or if we see more a kind of failure wave 5 in the broader averages (Euro Stoxx-50 and Stoxx-600). If we get the latter, it would mean that we just see selective new highs in best case the outperformer markets such as the FTSE-100, DAX-30, CAC-40 and in the SMI, where we see the chance of a temporary surprise on the upside by anticipating a temporary bounce in the heavy-weighted pharma sector and a temporarily weaker CHF versus the EUR in H2. On the other hand, we have various headline indices (IBEX, FTSE-MIB, OMX and the Euro Stoxx-50) , where the 2016 bull cycle has so far just a corrective structure. It implies that these markets will very likely be unable to break their 2015 high, which in most cases has another but simple reason. In all these markets, the 2015/2016 cyclical bear market was already that strong, where it would need a very aggressive bull cycle and massive outperformance to generate new highs. Last but not least, we have the problematic that the broken 2009 bull trend in the STOXX-600 will very likely act as a cap on the upside in 2017.
Chart 73. ) STOXX-600 Weekly Chart
Source: UBS Technical Research
Chart 74. ) DAX-30 Monthly Chart
Source: UBS Technical Research
Chart 75. ) IBEX-35 Weekly Chart
Source: UBS Technical Research
Chart 76. ) Swiss Market Index Weekly Chart
Source: UBS Technical Research
Technical Strategy 2017
UBS 30
Technical Strategy
EUR rally as potential headwind for Europe … Another point why we are skeptical in terms oh relative performance versus the US is our macro scenario for 2017. Over the last few years we said that without the help of the banking sector (20% index weight) Europe will not be able to outperform the US. Now, as we have the European banking sector trading in a bull cycle and where we expect to see more strength into summer we should actually have a more bullish bias for Europe. The problem in 2017 will very likely be the FX side, where we anticipate the US dollar moving into a major Q1 top as the basis for a sharp multi-month correction. In such a scenario, we expect the EUR to aggressively rally from a major Q1 bottom towards minimum 1.15 and best case towards 1.20 into later H2, and potentially into early 2018 and the trigger for this move can only come from the bond side, where EU yields should rise stronger than US yields. Tactically, we can always see a temporary break of correlations but from a trend perspective, an aggressive EUR rally plus strongly rising yields would be clearly headwind for Europe relative to the US and particularly for a German market. It would be the next reason why it's unlikely to see the Euro Stoxx-50 breaking its 2015 high. On the contrary, with anticipating a wave 5 target of 2400 to 2500 in the S&P-500, we should be even happy to see the Euro Stoxx-50 reaching 3600, which at the end of the day would post a lower high versus the 2015 top.
Conclusion: We are bullish Europe where we see the outperforming headline indices trading in a wave 5 bull cycle. In the FTSE-100, we expect to see new all-time highs, since the market should profit from another aggressive but final rally in miners and the oil sector into summer. The DAX remains the big outperformer in Europe where into summer we expect a re-test of the 2015 all-time high. In the Swiss market, we can see a surprise via a rebound in the heavy-weighted pharma stocks and a temporary weaker CHF versus the EUR into summer.
Tactically, Europe is overbought, and following the US market we expect a mean reversion pullback from a deeper January top into later Q1 with support and potential target levels at 3150 to 3100. On the upside we have a next bigger resistance at 3400. A daily re-break below 3280 would imply that our suggested January trading top is place. From our suggested late Q1 tactical low we expect another significant rally into a potential summer top, which in Europe can be the basis for a correction and negative surprise into H2 on the back of a too strong EUR. Although, in the bigger picture, after a potential late summer correction, we can see more gains into early 2018, with this potential roadmap, the wave structure in Europe would definitely be more corrective and overlapping against the impulsive wave 5 structure in the US. One consequence would be that the 2015 7-year cycle top in the STOXX-600 at 415 would remain intact, and if so, it would suggest that at the latest in 2018 we would see a second very strong bear cycle starting, similar to the pattern we have in China. In this case the periphery would be at risk of breaking their 2016 bottoms into later in the decade, which implicitly would be far from healthy for Europe.
Chart 77. ) DAX-30 versus EURUSD (inverse)
Source: UBS Technical Research
Chart 78. ) STOXX-600 Weekly Chart
Source: UBS Technical Research
Technical Strategy 2017
UBS 31
Technical Strategy
US Sectors … increasing selectivity in cyclicals By anticipating a reflationary shape of the wave 5 bull cycle in global equities, it was a key call of our 2016 strategy to expect commodity sectors and cyclical themes in general starting a 1.5- to best case 2-year long recovery/outperformance cycle before falling back into underperformance via equities moving into a wave 5 top. After forming major bottoms in Q1, we got in summer 2016 the ultimate confirmation that a broader reflationary cycle is underway via the impulsive break of the 2011 long-term underperformance trends of cyclicals.
Although cyclicals are massively overbought and a) we expect a mean reversion pull back into later Q1 and b) we expect increasing selectivity in the cyclical camp into summer, from a pattern standpoint and trend-wise we expect more cyclical outperformance versus defensives into minimum summer, if not even into later 2017. The reason is the shape of the defensive camp. On the macro side, we expect an overshooting of the underlying reflationary cycle, which implies interest rates to overshoot into later H2. As a consequence, we see defensives at risk of falling into another sharp correction cycle, which alone will imply further relative pressure in defensives/growth stocks in H2 before in later 2017/early 2018 we see defensives moving into a big buying opportunity.
Chart 79. ) US Cyclicals versus US Defensives
Source: UBS Technical Research
Chart 80. ) US Defensives/S&P-500 versus US 10-Year Treasury
Source: UBS Technical Research
Chart 81. ) US Semiconductor Index (SOX) Weekly Chart
Source: UBS Technical Research
Chart 82. ) Dow Jones Transport (DJT) Weekly Chart
Source: UBS Technical Research
Technical Strategy 2017
UBS 32
Technical Strategy
SOX and DJ Transport as two candidates for an earlier top In the late stages of a bull market we usually see deteriorating market breadth. Analytically, this implies that particularly in the early cyclical camp we have the risk to see sectors topping out early whereas the late cyclical oil sector could be one of the top performers in 2017 before we also expect the US oil index moving into an important top in H2. In the early cyclical camp, we think it is very likely to see either semiconductors and/or transport topping out earlier than the overall market, whereas banks we expect profiting from further rising interest rates into summer. Again, if we talk about the perspectives of cyclical sectors it is important to understand how we start 2017. In our indicator setup, US banks and transport are on the weekly timeframe record overbought. If we exclude the bubble overshooting into 2000, US semiconductors are trading on an extreme overbought position as well. With this kind of start into the year we can clearly say that the best of the reflationary trade in these sectors is already behind us and it's actually just a question of time to see a negative surprise in the one or other early cyclical sector. We, de facto, see semiconductors and/or transport as two candidates where a potential January top could already be THE top of the year, and where these sectors would form a bigger non-confirmation versus the overall market into summer.
Banks and oil stock bullish into minimum summer … We see the US banking sector as a key indicator for when we could see an important market top in 2017. The bull cycle from last year's summer bottom has been clearly impulsive, where we would label a potential December/early January top as a wave 3 top. A pullback into later Q1 we would see as wave 4, and if we are correct with this wave count, we should see a final wave 5 bull run into summer. Again, apart from a potential multi-week distributive top building process, this relatively clean and obvious wave set up/scenario is a key reason why in summer 2017 we expect an important market top forming, so we effectively think that in summer it will be time to sell banks.
Chart 83. ) US Banking Sector Weekly Chart
Source: UBS Technical Research
Chart 84. ) US Banking Sector Daily Chart
Source: UBS Technical Research
Chart 85. ) US Oil Index (XOI) Weekly Chart
Source: UBS Technical Research
Technical Strategy 2017
UBS 33
Technical Strategy
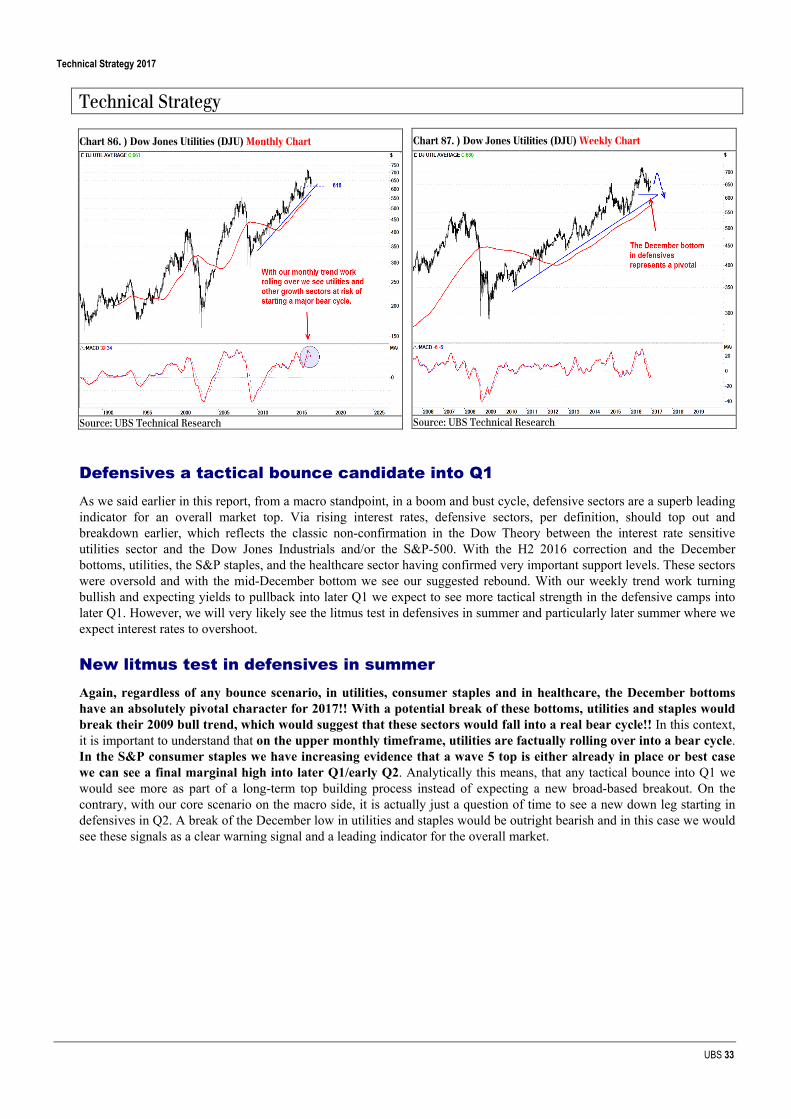
Defensives a tactical bounce candidate into Q1 As we said earlier in this report, from a macro standpoint, in a boom and bust cycle, defensive sectors are a superb leading indicator for an overall market top. Via rising interest rates, defensive sectors, per definition, should top out and breakdown earlier, which reflects the classic non-confirmation in the Dow Theory between the interest rate sensitive utilities sector and the Dow Jones Industrials and/or the S&P-500. With the H2 2016 correction and the December bottoms, utilities, the S&P staples, and the healthcare sector having confirmed very important support levels. These sectors were oversold and with the mid-December bottom we see our suggested rebound. With our weekly trend work turning bullish and expecting yields to pullback into later Q1 we expect to see more tactical strength in the defensive camps into later Q1. However, we will very likely see the litmus test in defensives in summer and particularly later summer where we expect interest rates to overshoot.
New litmus test in defensives in summer Again, regardless of any bounce scenario, in utilities, consumer staples and in healthcare, the December bottoms have an absolutely pivotal character for 2017!! With a potential break of these bottoms, utilities and staples would break their 2009 bull trend, which would suggest that these sectors would fall into a real bear cycle!! In this context, it is important to understand that on the upper monthly timeframe, utilities are factually rolling over into a bear cycle. In the S&P consumer staples we have increasing evidence that a wave 5 top is either already in place or best case we can see a final marginal high into later Q1/early Q2. Analytically this means, that any tactical bounce into Q1 we would see more as part of a long-term top building process instead of expecting a new broad-based breakout. On the contrary, with our core scenario on the macro side, it is actually just a question of time to see a new down leg starting in defensives in Q2. A break of the December low in utilities and staples would be outright bearish and in this case we would see these signals as a clear warning signal and a leading indicator for the overall market.
Chart 86. ) Dow Jones Utilities (DJU) Monthly Chart
Source: UBS Technical Research
Chart 87. ) Dow Jones Utilities (DJU) Weekly Chart
Source: UBS Technical Research
Technical Strategy 2017
UBS 34
Technical Strategy
EU Sectors … real estate our core short in H2
Tracking the relative breakout in global cyclical sectors, we saw in Q2 2016 the break of the 2011 underperformance trend of European cyclicals versus defensives. Tactically, after the aggressive Q4 rally and the December catch-up rally after the Italian referendum, cyclical sectors are extremely overbought, where from a trading aspect we expect a pullback in cyclicals into later Q1, whereas defensives should bounce in absolute and relative terms. From a late Q1 trading bottom we expect another but final cyclical led rally in the markets, where in the late cyclical basic resource and the energy sector we can see a potential overshooting into a summer/later summer top.
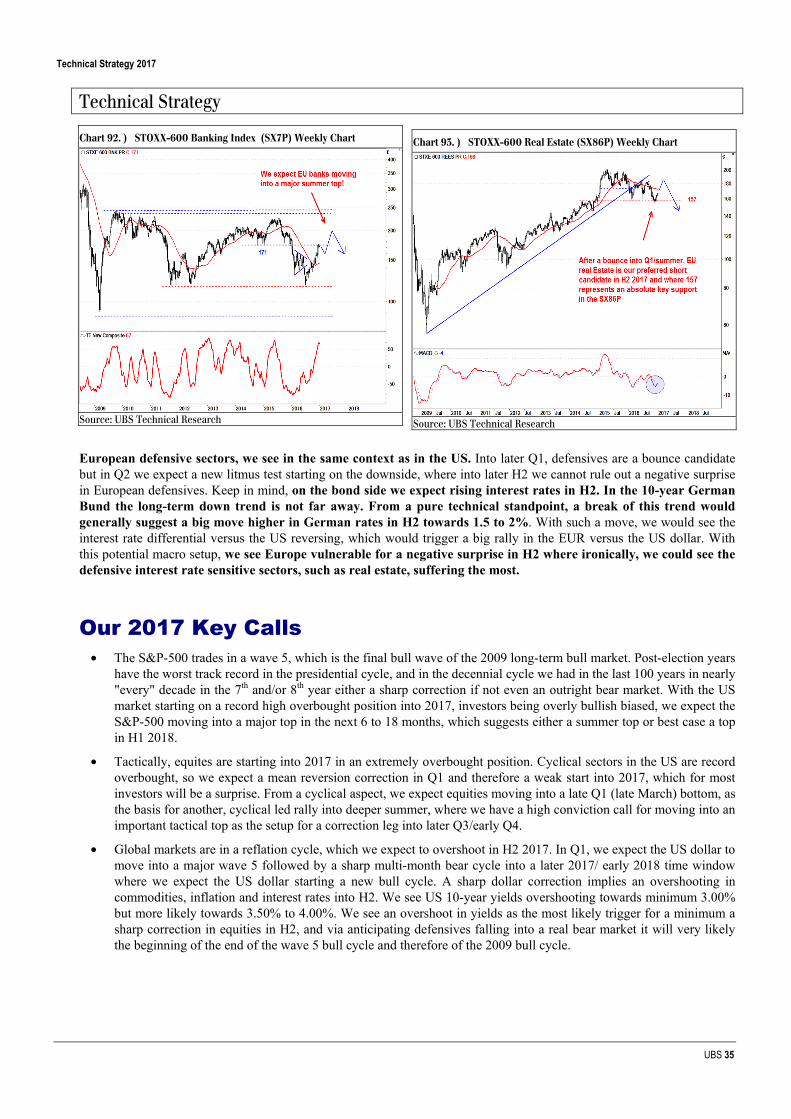
European banks … a sell in summer 2017 European banks have broken their 2015 bear trend in August 2016 but in the larger context banks are just trading in a multi-year sideways trading range. After a pullback into later Q1 we expect to see another rally in banks into summer where we anticipate a major top in the SX7P at around 200.
Chart 88. ) S&P-500 Consumer Staples Weekly Chart
Source: UBS Technical Research
Chart 89. ) US Healthcare Index (DRG) Weekly Chart
Source: UBS Technical Research
Chart 90. ) EU Cyclicals/Defensives versus German 10-Year Bund Yield
European defensive sectors, we see in the same context as in the US. Into later Q1, defensives are a bounce candidate but in Q2 we expect a new litmus test starting on the downside, where into later H2 we cannot rule out a negative surprise in European defensives. Keep in mind, on the bond side we expect rising interest rates in H2. In the 10-year German Bund the long-term down trend is not far away. From a pure technical standpoint, a break of this trend would generally suggest a big move higher in German rates in H2 towards 1.5 to 2%. With such a move, we would see the interest rate differential versus the US reversing, which would trigger a big rally in the EUR versus the US dollar. With this potential macro setup, we see Europe vulnerable for a negative surprise in H2 where ironically, we could see the defensive interest rate sensitive sectors, such as real estate, suffering the most.
Our 2017 Key Calls • The S&P-500 trades in a wave 5, which is the final bull wave of the 2009 long-term bull market. Post-election years
have the worst track record in the presidential cycle, and in the decennial cycle we had in the last 100 years in nearly "every" decade in the 7th and/or 8th year either a sharp correction if not even an outright bear market. With the US market starting on a record high overbought position into 2017, investors being overly bullish biased, we expect the S&P-500 moving into a major top in the next 6 to 18 months, which suggests either a summer top or best case a top in H1 2018.
• Tactically, equites are starting into 2017 in an extremely overbought position. Cyclical sectors in the US are record overbought, so we expect a mean reversion correction in Q1 and therefore a weak start into 2017, which for most investors will be a surprise. From a cyclical aspect, we expect equities moving into a late Q1 (late March) bottom, as the basis for another, cyclical led rally into deeper summer, where we have a high conviction call for moving into an important tactical top as the setup for a correction leg into later Q3/early Q4.
• Global markets are in a reflation cycle, which we expect to overshoot in H2 2017. In Q1, we expect the US dollar to move into a major wave 5 followed by a sharp multi-month bear cycle into a later 2017/ early 2018 time window where we expect the US dollar starting a new bull cycle. A sharp dollar correction implies an overshooting in commodities, inflation and interest rates into H2. We see US 10-year yields overshooting towards minimum 3.00% but more likely towards 3.50% to 4.00%. We see an overshoot in yields as the most likely trigger for a minimum a sharp correction in equities in H2, and via anticipating defensives falling into a real bear market it will very likely the beginning of the end of the wave 5 bull cycle and therefore of the 2009 bull cycle.
Chart 92. ) STOXX-600 Banking Index (SX7P) Weekly Chart
Source: UBS Technical Research
Chart 93. ) STOXX-600 Real Estate (SX86P) Weekly Chart
Source: UBS Technical Research
Technical Strategy 2017
UBS 36
Technical Strategy
• US rates are leading European rates. In H2, we see European rates rising stronger than US rates, which implies a reversal in the US/EU rates differential, and which we see as the most likely trigger/reason for the sharp rally in the EURUSD, where we anticipate a target of 1.15 to 1.20 into late 2017/early 2018.
• We are bullish Europe and we expect the Euro Stoxx-50 to reach 3600 in a cyclical driven rally into summer, where we expect the FTSE-100 to reach a new all-time high and where we expect the DAX-30 to test its 2015 summer top at around 12000. However, with anticipating a sharp EUR rally and rising interest rates, we expect a negative surprise in Europe in H2. Europe and European banks are a sell into summer.
• A sharp US dollar correction into H2 will be aggressively bullish commodities, where we expect a wave C rally, which should complete the corrective A-B-C 2016 bear market rally. So, on the one hand we are bullish commodities and expect a catch up rally in agricultural commodities and grains and where we continue to see crude oil heading towards our $60 to $62 target. However, with record speculative long position in crude oil and copper, we anticipate commodities heading into an important H2 top, which we see as the end point of the 2015/2016 reflationary cycle.
• In gold, we cannot rule out a final undershooting into deeper Q1, but on the back of our bear call on the US dollar, we are bullish gold and expect an aggressive rally in gold into summer. Silver should outperform gold and can be one of the star performers of 2017. We are bullish gold mines, which we expect to form a higher low versus its 2012 major bottom into Q1 as the basis for an aggressive rally into summer. Tactically, we expect gold pulling-back/correcting in H2 on the back of yields overshooting but from a trend perspective we see higher gold and silver prices into H2 2018.
• A sharp US dollar correction and an overshooting in commodities is at least initially bullish Emerging Markets, where, similar to the pattern in commodities, we expect a wave C rally into a summer top. Correlation-wise, rising interest rates are headwind for Emerging Markets in H2, so into summer we expect Emerging Markets leading in topping out versus the developed markets and falling into a new bear market.
• We expect 2017 to be a highly volatile year with strongly rising cross-asset volatility as a reflection of aggressive and sharp moves in FX, rates and commodities and therefore also in the relevant sector themes. Higher volatility and crude oil moving into a major top is bearish high yield, where we see the 2016 recovery cycle moving into a 2017 top. We would sell high yields into a summer rally.
• Sector wise, after a Q1 mean reversion pull back, we expect cyclicals to continue to outperform defensives into summer and more likely into H2, where we see defensives vulnerable for a sharp correction on the back of expecting yields to overshoot. In the cyclical camp we expect increasing selectivity, where semiconductors and transport are candidates for an earlier top, whereas banks and oil stocks we expect to outperform and potentially overshoot into summer. However, with anticipating wave 5 to complete in the US banking sector into summer we see financials in summer 2017 as a sell.
We wish all our clients and regular readers a healthy and successful 2017
Technical Strategy 2017
UBS 37
Global Sales and Trading Disclaimer (FICC and Equities)
Issued by UBS AG and/or any of its affiliates ("UBS"). The securities or other financial instruments described herein may not be eligible for sale in all jurisdictions or to certain categories of investors. This material has been prepared by sales or trading personnel and it is not a product of the UBS Research Department. It is for distribution only under such circumstances as may be permitted by applicable law. Please see further details as set out under "Country-specific information" below. This material is proprietary commentary produced in conjunction with the UBS trading desks that trade as principal in instruments mentioned within. This commentary is therefore not independent from the proprietary interests of UBS or connected parties which may conflict with your interests. UBS may have accumulated or may acquire a long or short position in the subject security, or derivative securities thereof, on the basis of this material prior to its dissemination. This material constitutes an invitation to consider entering into a derivatives transaction under the applicable rules and regulations of the CFTC and SEC (where appropriate), where applicable, but is not a binding offer to buy/sell any financial instrument. UBS may trade as principal or otherwise act or have acted as market-maker in the securities or other financial instruments discussed in this material. Securities referred to may be highly illiquid which may adversely impact the price and speed of execution of orders in those securities. Furthermore, UBS may have or have had a relationship with or may provide or has provided investment banking, capital markets and/or other financial services to the relevant companies. Neither UBS nor any of its affiliates, nor any of UBS’ or any of its affiliates, directors, employees or agents accepts any liability for any loss or damage arising out of the use of all or any part of this material. UBS has policies designed to manage conflicts of interest. UBS relies on information barriers to control the flow of information contained in one or more areas within UBS, into other areas, units, groups or affiliates of UBS. Additional information may be made available upon request. Opinions expressed may differ from the opinions expressed by other divisions of UBS, including those of the Research Department. For access to UBS Research, including important disclosures, go to the ResearchWeb at www.ubs.com. This material has no regard to the specific investment objectives, financial situation or particular needs of any specific recipient. UBS does not undertake any obligation to update this material. This material is prepared from information believed to be reliable, but UBS makes no representations or warranties, express or implied, and owes no duties (including in negligence)as to the accuracy or completeness or reliability of the information contained herein, nor is it intended to be a complete statement or summary of the securities, markets or developments referred to in the materials. To the fullest extent permitted by law, UBS is not liable for any loss (even if UBS has been advised of the possibility of loss) arising out of any person’s use of, or reliance upon, the information contained herein. The information contained herein should not be regarded by recipients as a substitute for the exercise of their own judgment. Any prices or quotations contained herein are indicative only and not for valuation purposes. This material has been prepared for informational purposes only and is not an offer to buy or sell or a solicitation of an offer to buy or sell any security or instrument or to participate in any particular trading strategy. This material is not an official confirmation of terms. Prior to entering into a transaction you should consult with your own legal, regulatory, tax, financial and accounting advisers to the extent you deem necessary to make your own investment, hedging and trading decisions. Communications may be monitored. Statement of Risk Options, structured derivative products and futures are not suitable for all investors, and trading in these instruments is considered risky and may be appropriate only for sophisticated investors. Mortgage and asset-backed securities may involve a high degree of risk and may be highly volatile in response to fluctuations in interest rates and other market conditions. Past performance is not necessarily indicative of future results. Various theoretical explanations of the risks associated with these instruments have been published Country-specific information Except as otherwise specified herein, these materials are distributed to professional clients only, and are not suitable for retail clients. United Kingdom and the rest of Europe Except as otherwise specified herein, these materials are distributed by UBS Limited, a subsidiary of UBS AG, to persons who are eligible counterparties or professional clients (as detailed in the PRA and FCA Rules and according to MIFID) and is only available to such persons. The Information does not apply to, and should not be relied upon by, retail clients. UBS Limited is authorised by the Prudential Regulation Authority and regulated by the Financial Conduct Authority and the Prudential Regulation Authority. France: Prepared by UBS Limited and distributed by UBS Limited and UBS Securities France S.A. UBS Securities France S.A. is regulated by the ACPR (Autorité de Contrôle Prudentiel et de Résolution) and the Autorité des Marchés Financiers (AMF). Where an analyst of UBS Securities France S.A. has contributed to this document, the document is also deemed to have been prepared by UBS Securities France S.A. Where an analyst of UBS Securities France S.A. has contributed to these materials, the materials are also deemed to have been prepared by UBS Securities France S.A.. Spain Prepared by UBS Limited and distributed by UBS Limited and UBS Securities España SV, SA. UBS Securities España SV, SA is regulated by the Comisión Nacional del Mercado de Valores (CNMV). Italy Prepared by UBS Limited and distributed by UBS Limited and UBS Italia Sim S.p.A. UBS Italia Sim S.p.A. is regulated by the Bank of Italy and by the Commissione Nazionale per le Società e la Borsa (CONSOB). Germany Prepared by UBS Limited and distributed by UBS Limited and UBS Deutschland AG. UBS Deutschland AG is regulated by the Bundesanstalt fur Finanzdienstleistungsaufsicht (BaFin). Poland This material is distributed by UBS Limited (spolka z ograniczona odpowiedzialnoscia) Oddzial w Polsce regulated by the Polish Financial Supervision Authority only to institutional investors in Poland. The information contained herein does not apply to, and should not be relied upon by retail clients. Turkey Prepared by UBS Menkul Degerler AS on behalf of and distributed by UBS Limited. Russia Prepared and distributed by UBS Bank (OOO). South Africa UBS South Africa (Pty) Limited (Registration No. 1995/011140/07) is an authorised user of the JSE and an authorised Financial Services Provider (FSP 7328). Switzerland These materials are intended for distribution in Switzerland by UBS AG to qualified investors pursuant to Art.10 of the Swiss Federal Act on Collective Investment Schemes (CISA) as e.g. institutional investors only. United States These materials are distributed by UBS Securities LLC (member NYSE, FINRA and SIPC) or by UBS Financial Services Inc. (member FINRA and SIPC), both of which are subsidiaries of UBS AG; or solely to US institutional investors by UBS AG or by a subsidiary or affiliate thereof that is not registered as a US broker-dealer (a “non-US affiliate”). Transactions resulting from materials distributed by a non-US affiliate must be effected through UBS Securities LLC or UBS Financial Services Inc. Canada These materials are distributed by UBS Securities Canada Inc., a registered investment dealer in Canada and a Member of the Canadian stock exchanges & Canadian Investor Protection Fund, or by another affiliate of UBS AG which is registered to conduct business in Canada or otherwise exempt from registration. Japan These materials are distributed in Japan by UBS Securities Japan Co., Ltd., a registered financial instruments business operator, or by UBS AG Tokyo Branch, a licensed bank. For further details of our local services, please call your regular contact at UBS in Japan. Hong Kong The materials relating to equities and other securities business and related research, are distributed in Hong Kong by UBS Securities Asia Limited to professional investors. The material relating to corporate finance, foreign exchange, fixed income products and other banking business and related research are distributed in Hong Kong by UBS AG Hong Kong Branch to professional investors. Australia These materials are distributed by UBS AG (Holder of Australian Financial Services Licence No. 231087) and/or UBS Securities Australia Ltd (Holder of Australian Financial Services Licence No. 231098). These materials contain general information and/or general advice only and do not constitute personal financial product advice. As such, the materials have been prepared without taking into account any investor’s objectives, financial situation or needs, and investors should, before acting, consider the appropriateness of the materials, having regard to their objectives, financial situation and needs.
Technical Strategy 2017
UBS 38
Global Sales and Trading Disclaimer (FICC and Equities)
If the materials relate to the acquisition, or potential acquisition of a particular financial product by a ‘Retail’ client as defined by section 761G of the Corporations Act 2001 where a Product Disclosure Statement would be required, the retail client should obtain and consider the Product Disclosure Statement relating to the product before making any decision about whether to acquire the product and consult the relevant Financial Services Guide. UBS AG, Australia Branch is a foreign Authorised Deposit-taking Institution ("foreign ADI") under the Banking Act 1959 (Cth) and is supervised by the Australian Prudential Regulation Authority. However, it is important for you to note that should you make a deposit with UBS AG, Australia Branch in connection with the services UBS provides you, that deposit will not be covered by the provisions in the Banking Act 1959 (Cth) for the protection of depositors, as these provisions do not apply to foreign ADIs including UBS AG, Australia Branch. For example, depositors with foreign ADIs do not receive the benefit of the following protections: (i) Deposits are not covered by the financial claims scheme and are not guaranteed by the Australian Government; (ii) Deposits do not receive priority ahead of amounts owed to other creditors. This means that if a foreign ADI was unable to meet its obligations or suspends payment, its depositors in Australia would not receive priority for repayment of their deposits from the foreign ADI's assets in Australia; (iii) A foreign ADI is not required to hold assets in Australia to cover its deposit liabilities in Australia. This means that if the foreign ADI was unable to meet its obligations or suspends payment it is uncertain whether depositors would be able to access the full amount of their deposit. UBS Securities Australia Ltd is a subsidiary of UBS AG. However, it is not an authorised deposit-taking institution under the Banking Act 1959 (Cth). The obligations of UBS Securities Australia Ltd do not represent deposits or other liabilities of UBS AG, and UBS AG does not stand behind, support or guarantee UBS Securities Australia Ltd in any way. New Zealand These materials are distributed in New Zealand by UBS New Zealand Ltd. The information and recommendations in these Materials are provided for general information purposes only. To the extent that any such information or recommendations constitute financial advice, they do not take into account any person’s particular financial situation or goals. We recommend that recipients seek advice specific to their circumstances from their financial adviser. Korea Distributed in Korea by UBS Securities Pte. Ltd., Seoul Branch. This document may have been edited or contributed to from time to time by affiliates of UBS Securities Pte. Ltd., Seoul Branch. India Prepared by UBS Securities India Private Ltd. (Corporate Identity Number U67120MH1996PTC097299) 2/F, 2 North Avenue, Maker Maxity, Bandra Kurla Complex, Bandra (East), Mumbai (India) 400051. Phone: +912261556000 SEBI Registration Numbers: NSE (Capital Market Segment): INB230951431, NSE (F&O Segment) INF230951431, BSE (Capital Market Segment) INB010951437. Dubai These materials are distributed by UBS AG Dubai Branch (regulated by the DFSA) and are intended for Professional Clients only and are not for further distribution within the United Arab Emirates. Saudi Arabia These materials have been issued by UBS AG (and/or any of its subsidiaries, branches or affiliates), a public company limited by shares, incorporated in Switzerland with its registered offices at Aeschenvorstadt 1, CH-4051 Basel and Bahnhofstrasse 45, CH-8001 Zurich. This publication has been approved by UBS Saudi Arabia (a subsidiary of UBS AG), a Saudi closed joint stock company incorporated in the Kingdom of Saudi Arabia under commercial register number 1010257812 having its registered office at Tatweer Towers, P.O. Box 75724, Riyadh 11588, Kingdom of Saudi Arabia. UBS Saudi Arabia is authorized and regulated by the Capital Market Authority to conduct securities business under license number 08113-37. Singapore These materials are distributed in Singapore by UBS Securities Pte. Ltd or UBS AG Singapore Branch to institutional investors or accredited investors. Asian jurisdictions (excluding HK, Singapore & Japan) This material is not to be construed as a solicitation or an offer to buy or sell any securities, related financial instruments or services. Please also note that the products have not be intended for marketing to the public. Malaysia These materials are authorized to be distributed in Malaysia by UBS Securities Malaysia Sdn. Bhd (253825-x). Brazil Except as otherwise specified herein, this material is prepared by UBS Brasil CCTVM S.A. to persons who are eligible investors residing in Brazil, which are considered to be: (i) financial institutions, (ii) insurance firms and investment capital companies, (iii) supplementary pension entities, (iv) entities that hold financial investments higher than R$300,000.00 and that confirm the status of qualified investors in written, (v) investment funds, (vi) securities portfolio managers and securities consultants duly authorized by Comissão de Valores Mobiliários (CVM), regarding their own investments, and (vii) social security systems created by the Federal Government, States, and Municipalities Israel UBS AG and its affiliates incorporated outside Israel are not licensed under the Investment Advice Law. These materials are being issued only to and/or is directed only at persons who are Sophisticated Investors within the meaning of the Israeli Securities Law and these materials must not be relied or acted upon by any other persons. Any securities mentioned herein that have not been registered under the Securities Act of 1933 may not be offered or sold in the United States except pursuant to an exception from the registration requirements of the Securities Act and applicable state securities laws and in such circumstances as may be permitted by applicable law.