58
EMERGING RISK Impacts of Key Environmental Trends in Emerging Asia DANA KRECHOWICZ HIRANYA FERNANDO world resources institute

EMERGING RISKImpacts of Key Environmental Trends in Emerging Asia
DANA KRECHOWICZ
HIRANYA FERNANDO
worldresourcesinstitute

AcknowledgementsThis report would not have been possible without the financial support
of the International Finance Corporation (IFC) and grant funding from theGovernment of Japan. IFC supports World Resources Institute’s (WRI)research on financial materiality of environmental risks in corporatevaluation. Emerging Risk is the first in a series of publications under thisresearch collaboration. Special thanks to our WRI colleagues, AndrewAulisi, Piet Klop, Janet Ranganathan, Polly Ghazi, Manish Bapna, CharlesIceland, Amy Cassara, and Ray Cheung who generously contributed theirtime and expertise to reviewing many drafts and versions of this reportand improving the analysis. We would also like to acknowledge NeelamSingh, Ella Delio, and Fred Stolle for their input on specific sections andthank Florence Landsberg and Susan Minnemeyer for the GISdeforestation maps, and ISciences LLC for the water scarcity map. We arealso grateful for the thoughtful contributions by Melissa Brown (formerlyof ASrIA), Kavita Prakash-Mani (formerly of SustainAbility), DavidGoldstein (Cometech AeroAstro Inc.), Neeraj Prasad (World Bank), and theIFC’s Sustainable Investing team, especially Brunno Maradei, who allprovided valuable guidance on the scope and direction of this research.Also thank you to Jennie Hommel for managing the review process,Margaret Yamashita for her excellent copy-editing, and Barbieri & Greenfor their creative efforts in designing the report.
Each World Resources Institute report represents a timely and scholarlytreatment of a subject of public concern. WRI takes responsibility for choosingthe study topics and guaranteeing its authors and researchers freedom ofinquiry. It also solicits and responds to the guidance of advisory panels andexpert reviewers. Unless otherwise stated, however, all the interpretations andfindings set forth in WRI publications are those of the authors.
Whilst every effort has been taken to verify the accuracy of this information,neither World Resources Institute, International Finance Corporation nor theiraffiliates can accept any responsibility or liability for reliance by any person onthis information.
April 2009
Photo Credits:Cover photo credit: istockphotoPage 6 - © Tom FewsterPage 11 - The Flat Earth CollectionPage 12 - Flickr hermmermfermPage 24 - Digital VisionPage 28 - Flickr birframesPage 30 - © George ClerkPage 32 - The Flat Earth CollectionPage 34 - Flickr isa_adsrPage 38 - Flickr Stuck in CustomsPage 40 - Flickr paw conPage 42 - Digital VisionPage 43 - Flickr Keith BacongcoPage 47 - © Kris VandereyckenPage 48 - © blackred
© 2009 World Resources Institute and International Finance Corporation. All rights reserved.

1
ForewordThe current global financial crisis has highlighted the need to manage risk and has given new impetus to anold debate in the investment community on how to value environmental risks. While evidence increasinglyshows that issues such as climate change and water scarcity pose material risks for companies, progress onpricing these externalities has been somewhat slower, particularly in emerging markets.
In Europe, Japan and the United States, many corporations now measure and manage their emissionsof greenhouse gases. There has also been a sharp rise both in environmental corporate reporting and inclimate-related shareholder resolutions, reflecting demands from investors who want to know howcompanies are managing the risks and opportunities associated with a warming world. New andgrowing interest in the investment community on the issues of water scarcity, deforestation, andnatural resource depletion, suggests that climate change may have opened a door through which amultitude of environmental issues are changing the way the investors value companies.
The relevance of environmental sustainability to investment must not be limited to London, New York, andTokyo. Emerging markets have grown at an unprecedented rate in the past 20 years, driven by investmentsmade by both local investors and large institutional investors in OECD countries, however insufficientinformation on how companies in emerging markets manage environmental risks and opportunities hindersinvestors’ ability to make sound long-term investment decisions. Understanding which environmental andsocial risks are material will help investors seek appropriate information from companies, asses corporatevalue, and direct capital to sustainable enterprise. Re-directing capital injected into South and SoutheastAsia’s growing economies toward less environmentally destructive economic activity will not only reduceinvestment risk, it will also help support the region’s long term prosperity.
Emerging Risk is the first report in a series establishing the link between issues like climate change,air pollution, water supply, and natural resource depletion and traditional financial analysis oncorporate value and financial strength for companies in six key Asian economies – India, Indonesia,Malaysia, Philippines, Thailand, and Vietnam. The report lays the groundwork for analysts tounderstand environmental issues as financially material, and for companies to see the financialbenefits of reducing their environmental impacts.
Greg Radford Jonathan LashEnvironment and Social PresidentDevelopment Director World Resources InstituteInternational Finance Corporation

2 EMERGING RISK Impacts of Key Environmental Trends in Emerging Asia

EXECUTIVE SUMMARY 4
I. IN CONTEXT: TRENDS, PLAYERS, AND BARRIERS 6
II. ENVIRONMENTAL TRENDS IN EMERGING ASIA AND THEIR IMPACT ON KEY SECTORS 12
Deforestation 14
Water Scarcity 16
Climate Change 18
Food Security 20
Energy Security 22
Air Pollution 24
Urbanization 26
Population Growth 28
III. EMERGING ASIAN COUNTRIES: A DEEPER LOOK 30
India 32
Indonesia 34
Malaysia 38
Philippines 40
Thailand 44
Vietnam 46
IV. CORPORATE ENVIRONMENTAL AND SOCIAL REPORTING IN EMERGING ASIA 48
SOURCES CONSULTED FOR THIS REPORT 50
ENDNOTES 51
3
Table of Contents

Executive SummaryThe health of the planet is becoming a significant issue for thefinancial and corporate world. Powerful global trends around theenvironment, sustainability, business, and investment haveconverged to a point that certain environmental issues have becomematerial financial matters for publicly traded companies and theirinvestors. Financial markets that are attuned to these trends arelikely to create strong incentives for companies to improve theirenvironmental performance.
The relevance of environmental sustainability to investment is notlimited to London, New York, and Tokyo. Emerging markets havegrown at an unprecedented rate in the last two decades as largeinstitutional investors have increasingly looked to these markets asinvestment destinations.
Emerging Risk is an introduction to a series of sector reports on thefinancial materiality of key environmental trends in India, Indonesia,Malaysia, Philippines, Thailand, and Vietnam.* It forms part of aresearch collaboration between the World Resources Institute (WRI) andthe International Finance Corporation (IFC) to give investors inemerging Asian countries the information and tools they need to linkthe materiality of issues such as climate change, air pollution, waterscarcity, and deforestation to traditional financial analysis.
Emerging Risk sets the scene with an overview of the principal players,main stock exchanges, selective environmental trends affectingemerging Asian nations, and the impacts of the trends on criticalsectors in the six focus countries. This report is intended forinternational and local investors as well as analysts, policymakers, andresearchers who cover this region. It should be useful to any investor-related audience seeking to understand the business impact ofenvironmental trends on publicly listed companies in emerging Southand Southeast Asian countries.
Because this report addresses an investment-oriented audience withvarying degrees of knowledge about environmental issues, we haveframed the issues in terms of broad environmental themes or trends,
reflecting those typically identified in reports by the World Bank,Asian Development Bank, and the like.
The six Asian economies on which we focus—India, Indonesia,Malaysia, Philippines, Thailand, and Vietnam—all have rapidlygrowing industrial, commercial, and financial sectors, and all aresusceptible to environmental risk. For example, all six are particularlyvulnerable to the physical risks associated with climate change. Theregion’s rapid economic growth has fueled the world’s highestincreases in the commercial and domestic demand for energy. In2008, the six countries together contain approximately 1.6 billionpeople, or about 25 percent of the world population.
The above box summarizes the main environmental trends we exploreand the main types of risk they engender. Physical impacts are likely tobe the most pronounced and can directly affect a company’s dailyoperations, for example disruption in production due to a lack of wateror severe weather-related damage to company assets.
Our research shows that resource-dependent sectors—like forestryproducts, food and beverage, and oil and gas—which are important
At a Glance: Environmental Trends and RiskCategories for Investors
Trends• Deforestation• Water Scarcity• Climate Change• Food Security• Energy Security• Air Pollution• Urbanization• Population Growth
Risks• Operational or physical• Regulatory and legal• Reputational• Market and product• Financing
The limited (or even lack of) public environmental and social infor-mation currently being provided by many local companies in thesix countries does not meet investors’ quantitative and risk-ori-ented information needs. Relative to best practices in developedcountries, corporate disclosure standards are lagging in emergingAsia (see the WRI study Undisclosed Risk: Corporate Environmen-tal and Social Reporting in Emerging Asia).
This dearth of information has a double downside. First, investorsmust make decisions with an incomplete knowledge of companies’exposure to environmental and social risks and opportunities, andsecond, Asian businesses are hurt over the long run by their fail-ure to address potential financial, operational, and reputationalrisks. Better reporting alone will not enable financial markets torespond to environmentally sustainable companies. Even in devel-oped markets, more disclosure does not immediately translate intovalue. What is needed is a fundamental alignment between eco-nomic incentives and environmental stewardship.
Exposing the Information Gap
* The sectors identified thus far, albeit subject to change, are food and beverage, power generation, and real estate.
4 EMERGING RISK Impacts of Key Environmental Trends in Emerging Asia

to these emerging Asian economies, are precisely those that will beaffected by the physical impacts of environmental trends. Theconstruction and real estate sectors also have become significanteconomic players and are highly dependent on the availability andcost of raw materials. The manufacturing sectors range from lowvalue–added goods, such as textiles, to high value–added goods,such as software, and they often are highly resource (labor, energy,and water) intensive. India, Malaysia, and the Philippines have athriving service sector, such as business process outsourcing, whichis highly dependent on a skilled workforce.
To illustrate the environmental challenges facing companiesoperating in this region, we use three case studies: supply chainpressures on Staples, the office supplies giant; the effects of water
scarcity in India on Coca-Cola’s manufacturing process; and thephysical effects of flooding in Indonesia on sectors ranging fromautomobiles to telecommunications.
In the years ahead, investors and asset owners, particularly largeinstitutional investors, will have a role to play in redirecting capitaltoward more environmentally sustainable economic activities, whichcan reduce investment risk and support the region’s long-termprosperity. This report is intended to help them take the first steps inthat direction.
5

In Context:Trends, Players, and Barriers
I
The sustainability practices of European and North American corporations, and the
financial institutions that analyze and invest in them, are changing, with asset
managers, financial analysts, and other actors increasingly viewing environmental,
social, and corporate governance (ESG) issues as financially material. Although the
financial sector has not yet fully incorporated these issues into its financial models, it
does recognize that ESG issues may be material to investors’ long-term investment
returns. Large institutional investors – the asset owners - increasingly accept that
incorporating long-term issues like climate change into their investment decision-
making process is part of their fiduciary duty.1
EMERGING RISK Impacts of Key Environmental Trends in Emerging Asia6

Even though investors in Europe and the United States are aware of,and to a lesser extent analyze, ESG trends, this is generally not the casein emerging market countries, despite the evident and significantenvironmental and social impacts of rapid economic development.2 TheAsia Pacific region has had the world’s fastest-growing gross domesticproduct (GDP) since the 1990s. This remarkable economic progress hashad clear environmental and social consequences.
More recently, local and foreign investors in Asia’s emerging marketsare becoming aware of high-profile environmental trends and theirpotential impact on investment returns. Accordingly, a number ofnew, socially responsible investment (SRI) funds and indexes thatuse ESG-based strategies have been launched in the region.3
Although these products have not yet had a significant effect on thefinancial markets, they have provided momentum for investors tomove Asian companies toward more sustainable practices throughtheir investment decisions.
Focusing on the six Asian economies of India, Indonesia, Malaysia,Philippines, Thailand and Vietnam, this introductory report seeks to:
• Raise investor awareness around environmental trends for eachcountry, and the region as a whole.
• Determine how key business sectors could be affected by the risksand opportunities arising from these trends.
• Briefly evaluate corporations’ current environmental and socialreporting and disclosure practices.
Emerging Risk will be followed by sector reports connecting thesetrends more closely to the investment decision-making process.Each sector report will demonstrate how environmental trends affectvalue drivers in that sector and help investors and analysts assessthe trends’ financial impacts on company valuations. The aim of thisbody of research is to increase capital formation in environmentallysustainable listed companies in emerging Asia (figure 1).
Emerging Risk: Impactsof Key EnvironmentalTrends in Emerging Asia
Undisclosed Risk: CorporateEnvironmental and SocialReporting in Emerging Asia
Food and Beverage
Power Generation
Real Estate
Sector Reports
Source: World Resources Institute
Figure 1: Project Overview
7
TrendsEmerging Risk explores the likely risk implications of eightenvironmental trends for companies in India, Indonesia, Malaysia,Philippines, Thailand and Vietnam. We selected these trends based onenvironmental themes and trends identified by the World Bank, theAsian Development Bank, and other regional experts.* Our goal is notto undertake a comprehensive study of all the environmental trends inAsia, as there already is a vast body of literature on this, but insteadto focus on the business impacts of select trends on critical sectors.
At both the regional and country level, we highlight pressingenvironmental issues facing each economy. In the future sectorreports, we will identify more precisely and in more detail the mostsignificant effects of these trends.
We then discuss the impacts of each trend on critical sectors in eachcountry. The sectors were chosen by WRI for their significantcontribution to the market value of the domestic stock exchanges,with the exception of agriculture, which was selected because of itscontribution to GDP.
Finally, we briefly review the corporate environmental and socialdisclosure practices in the six focus countries. This section draws fromthe WRI Study “Undisclosed Risk: Corporate Environmental and SocialReporting in Emerging Asia,” which examines both the characteristicsof and the drivers for corporate reporting in the six countries’ tenlargest (by market capitalization) companies.
PlayersRelative to developed markets, the stock markets in the six focuscountries are small and nascent. Vietnam opened the doors of its first-ever stock exchange only in 2000. Clearly, there is a significantdifference between Vietnam and India but overall, in these countries,market capitalization is concentrated in a few companies, tradingvolumes are thin, and prices are driven more by speculation and rumorthan by market fundamentals or company value.
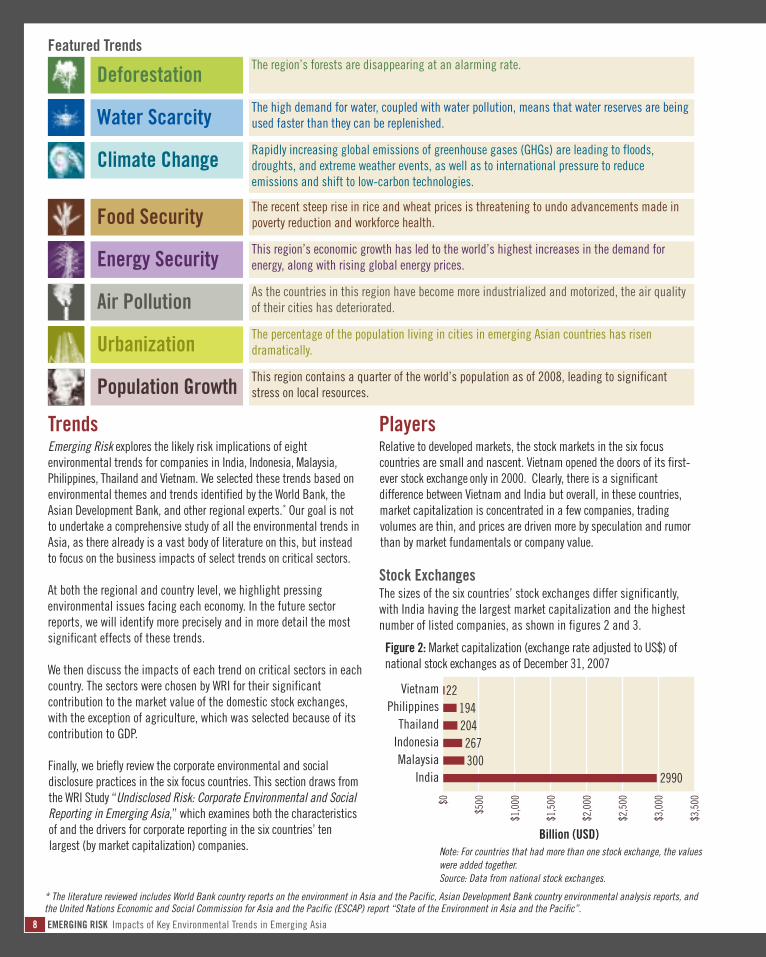
Stock ExchangesThe sizes of the six countries’ stock exchanges differ significantly,with India having the largest market capitalization and the highestnumber of listed companies, as shown in figures 2 and 3.
Note: For countries that had more than one stock exchange, the valueswere added together.Source: Data from national stock exchanges.
VietnamPhilippinesThailandIndonesiaMalaysia
India
Figure 2: Market capitalization (exchange rate adjusted to US$) ofnational stock exchanges as of December 31, 2007
$0
$500
$1,000
$1,500
$2,000
$2,500
$3,000
$3,500
Billion (USD)
22194204267300
2990
* The literature reviewed includes World Bank country reports on the environment in Asia and the Pacific, Asian Development Bank country environmental analysis reports, andthe United Nations Economic and Social Commission for Asia and the Pacific (ESCAP) report “State of the Environment in Asia and the Pacific”.
8 EMERGING RISK Impacts of Key Environmental Trends in Emerging Asia
Featured Trends
The high demand for water, coupled with water pollution, means that water reserves are beingused faster than they can be replenished.Water ScarcityRapidly increasing global emissions of greenhouse gases (GHGs) are leading to floods,droughts, and extreme weather events, as well as to international pressure to reduceemissions and shift to low-carbon technologies.
Climate Change
The region’s forests are disappearing at an alarming rate.Deforestation
The recent steep rise in rice and wheat prices is threatening to undo advancements made inpoverty reduction and workforce health.Food SecurityThis region’s economic growth has led to the world’s highest increases in the demand forenergy, along with rising global energy prices.Energy SecurityAs the countries in this region have become more industrialized and motorized, the air qualityof their cities has deteriorated.Air PollutionThe percentage of the population living in cities in emerging Asian countries has risendramatically.UrbanizationThis region contains a quarter of the world’s population as of 2008, leading to significantstress on local resources. Population Growth

A large percentage of the six stock exchanges’ total value isconcentrated in the ten largest (by market capitalization) companies(figure 4). The high concentration of value in relatively fewcompanies is a sign of an underdeveloped market vulnerable tospeculative investment patterns and high volatility.
InvestorsIn the last ten to fifteen years, the six countries’ stock markets havebecome more open to foreign investors, and their more liberalizedlaws also have attracted more foreigners to their capital markets.For example, in India, investments by foreign institutional investorsreached more than US$51 billion in March 2007, up from US$3billion in 1995.4 Figure 5 shows the significant level of foreignparticipation in the six countries.
Foreign investors typically invest in emerging markets with a long-term (five years or more) time horizon.6 Therefore, they are more likelyto be interested in the impact on valuation of environmental andsocial trends, which also play out on long-time horizons. For thisreason, foreign investors have a strong role to play in demandingbetter environmental and social standards and more disclosure fromthe emerging market companies in which they invest. In turn, theyalso can influence the actions of local investors.7
Although investors in emerging markets may not be getting therequisite company information officially, some evidence suggests thatthey are nonetheless learning about firms’ environmental and socialperformance by engaging directly with them.8 That is, a company maynot wish to reveal publicly the risks it faces, especially if it does nothave a mitigation strategy, but local analysts and insiders may stillhave private, informal access to critical information.
According to Asian SRI experts ASrIA, local analysts in the region“are aware of environmental and social issues, though not on a deep
Note: For those countries that had more than one stock exchange, thevalues were added together.Source: Data from national stock exchanges.
Source: World Federation of Stock Exchanges
Philippines
Vietnam
Indonesia
Thailand
Malaysia
India
Figure 3: Number of listed companies on national stock exchanges as ofDecember 31, 2007
0
1,000
2,000
3,000
4,000
5,000
6,000
7,000
Number of Listed Companies
241
250
400
541
635
6081
60%
50%
40%
30%
20%
10%
0%
Figure 4: Concentration of stock exchanges’ value, 2007
India (Bom
bay)
India (National Stock Exchange)
Malaysia
Indonesia
Thailand
Philippines
Percen
tage
of S
tock
Exc
hang
e Marke
t Cap
italiz
ation
of Te
n La
rges
t Com
panies
29.4%
49.3% 50.6%48.4%
37.9%
28.2%
90%
80%
70%
60%
50%
40%
30%
20%
10%
0%
Figure 5: Total percentage trading value of foreign investors’ purchases,May 2008
Indonesia
Thailand
India
Malaysia
Philipp
ines
Vietna
m
Percen
tage
of T
rading
(Buy
ing) by Va
lue
Sources: National Stock Exchanges 5
9
DomesticForeign

level.”9 Indeed, the Enhanced Analytics Initiative, which encouragesincluding extra-financial issues in investment research, has seenrelatively little such research from Asia during its four years ofsurveying investment research globally.10 To investors and analystsin emerging markets, economic growth and development clearly stilltake precedence over environmental issues.
Barriers Including environmental and social issues in financial valuation—not just an analysis of the trends but full integration into a financialmodel—is a challenge even in more mature capital markets likethose of Europe, Japan, and the United States.
A recent study of European buy- and sell-side analysts found thatfew included extra-financial information in their valuations.11 Anumber of technical and institutional barriers, discussed next,prevent companies and equity investors from potentially profitingfrom understanding the relationship between environmental andfinancial performance.
Technical BarriersFinancial valuation is a tool for making better investment decisions. Afirm’s future cash flow is the best measurement of its current value.One of the reasons it is such a robust metric is that it requirescomplete information. A key problem with environmental risks is thatcompanies do not fully inform the market about them, often becausethey themselves do not fully understand them. Consequently, investorshave limited information to price these risks in their discounted cashflow (DCF) models. According to a recent survey of asset managersbased mostly in Europe, this lack of public transparency is the mainobstacle to incorporating ESG principles into their investmentdecisions on emerging market equities (figure 6).12
Discounting the FutureA related challenge is that the DCF technique places a premium on theimmediate and a discount on the future. No matter how large a cashflow is, if it is scheduled to occur far into the future, it will have virtuallyno impact on a company’s present value. Physical climate risk, forexample, may be seen as ten to twenty years away and therefore deeplydiscounted in a typical DCF valuation. Because environmental issueshave a longer time frame than many investors’ investment horizon, theymay well ignore these longer-term environmental issues. Some risks alsoare shaped by policy uncertainty and the possibility of loomingregulation, which again play out on longer time horizons.
Other metrics, such as return on invested capital (ROIC) or earningsper share (EPS), have an even shorter term, requiring informationabout only the next few years, and therefore they are even lesssuitable for determining environmental value.
Institutional BarriersMany equity investors are not familiar with environmental discourse.13
Phrases such as “environmental performance,” “sustainabilityvalue,” and “ESG” lack precise definitions. Environmentalpractitioners and investment analysts do not use commonframeworks or techniques. Indeed entirely different regulatoryregimes guide each of their bodies of work. Meanwhile, financialincentives are misaligned as companies and analysts are rewardedfor short-term profits, even at the expense of long-term sustainability.
Lack of transparency
Lack of information/expertise
It is unrealistic to expect emerging marketcompanies to meet the same ESG standards applied
by investors to developed market companies
Not justified by business/investment case
Lack of clarity on fiduciary obligations in legal/regulatory context
Lack of demand by clients
Other , please specify
Asset managers: What is the main obstacle to incorporating ESG principles in the investment process for emerging marketequities? (74 respondents)
Figure 6: Survey of Asset Managers, 2008
10 EMERGING RISK Impacts of Key Environmental Trends in Emerging Asia
Source: International Finance Corporation, UN Global Impact and Swiss Department of Foreign Affairs.
0%
3.9%
3.9%
11.8%
21.6%
27.5%
31.4%

The Way Ahead: Best PracticesDespite these barriers, the translation of environmental factors intofinancial value is making progress, especially in Europe. Innovativeresearch providers now include long-term trends, material extra-financial issues (EFIs), and intangibles in their calculations of fairvalue. As evidence of this, the Enhanced Analytics Initiative, whichhas been evaluating the effectiveness of such research since 2004,recently reported “notable advances in the integration of EFIs intofinancial analysis and their coverage of complex emerging themes.”14
Extra-financial information can be incorporated into a DCF model intwo principal ways.15 First, an environmental issue can affect thetiming, quality, and magnitude of a company’s cash flows. Forexample, if a price on carbon increases costs, the effect of thatincrease can be quantified and incorporated into the DCF model.Second, an analyst can make a qualitative judgment to adjust acompany’s risk premium to account for the increased (or decreased)risk caused by the environmental issue.
Relative valuation methods, where a company is valued based onhow it compares to others in the industry on a metric such as itsprice-earnings ratio, could also be adjusted to account forenvironmental factors. If all the companies in one sector are affectedby the same issue, their different responses and strategic positionscan result in a competitive advantage for one firm over another,which will be reflected in their relative valuation.
A final method is the use of real options.16 Option analysis can beused when future cash flows are uncertain because they arecontingent on the occurrence of specific events.17 Environmentalissues present companies with associated risks and opportunities aswell as strategic choices for addressing them. These choices—which can either create or destroy a company’s value if certainevents (such as regulation or the physical impacts of climatechange) occur—may be valued using options.
11

Environmental Trends inEmerging Asia and their Impact on Key Sectors
II
In this section, we discuss eight environmental trends affecting emerging Asian
economies, the key industrial sectors impacted by each trend, and the type of risk
(or opportunity) that is created.
We present the trends as aggregate regional trends; country specific trends and
impacts follow in section III. Some environmental trends are interrelated, and others,
like population growth, exacerbate the impact of other trends.
EMERGING RISK Impacts of Key Environmental Trends in Emerging Asia12

Environmental risks may be understood at two levels of impact:sector level and company level. Sector-specific risks encompassphysical, regulatory/legal, and market risks.• Physical risks arise from a sector’s dependence on the physical
environment, making some sectors more vulnerable than others.
• Regulatory/legal risks are those that change the operatingenvironment because of government intervention, such as theintroduction of a carbon tax.
• Market risks are caused by a change in consumer or investorpreferences.
Even though a risk may apply to an entire sector, individual companieswill have different levels of exposure to that risk, based on factors likecorporate strategy or geographic location. Company-specific risks includeoperational, litigation, reputation and financing risks.18 An operationalrisk occurs when an environmental trend disrupts operations, forexample, physical damage to assets arising from extreme weatherrelated to climate change. Litigation risks refer to the threat of litigation
arising from a company’s actions, such as chemical spills that endangerhuman health. Damage to a company’s reputation can result fromnegative environmental news, and may translate into a fall in thecompany’s share price. Financing risks arise when financiers attach apremium to the cost of capital due to the perceived higher risk associatedwith, for example, a company’s poor environmental management.
Within a particular sector, a company’s exposure to risk is a function offactors such as its management strategy, value chain, and geographiclocation. Therefore, some companies in a sector will be able to respondbetter to emerging risks than others and thus gain a competitiveadvantage. In addition, some trends themselves may present marketopportunities for developing new products and technologies.
The risks and opportunities may be short term (immediate to fiveyears) or long term (more than five years). Short-term impactstypically refer to pricing and costs, while longer-term impactsgenerally revolve around market demand, changes in consumerpreferences, and regulation (table 1). The aggregate trends and theirsector specific impacts follow.
Deforestation
Trends
• Shortage and increased prices of raw material• Fines• Changes in consumer preferences
Short-Term Impacts
• New markets and revenue opportunities
Water scarcity • Increased scarcity or cost• Greater competition among users
• Shortages• Regulation
Climate change • Damage to assets• Disruption of operations
• Regulation• New markets and revenue streams
Food security • Higher prices of raw materials• Reduced productivity or output
• Shortages
Energy security • Higher input costs• Disruption of business operations
• Changes in consumer preferences
Air pollution • Lower productivity• Damage to assets
• Changes in consumer preferences• Regulation
Urbanization • Increased market demand• Decreased productivity
• New markets and revenue opportunities• Magnifies impacts of other trends
Population growth • Larger market size• Lower cost of labor
• New markets and revenue opportunities• Magnifies impacts of other trends
Long-Term Impacts
13
Table 1: Examples of Short- and Long-Term Impacts of Environmental Trends

India
• Deforestation is a change of land use from forest coverto another use, often agriculture.19
• Although Southeast Asia still contains 16 percent ofthe world’s remaining tropical forests, between 1995and 2005 the region accounted for 25 percent ofglobal forest loss (figures 7 and 8).20 Indonesia’sforests suffered the greatest loss.
• Deforestation accounted for approximately 17 percentof global GHG emissions in 2004.21 The continued lossof forests is a global concern, given its impact onclimate change. Accordingly, the next iteration of theinternational climate change agreement after 2012will likely address deforestation and forestdegradation, and also provide incentives to developingcountries to manage their forests more sustainably.
• Although the causes of deforestation vary and largelydepend on the local area, land conversion (foragriculture and plantations) and logging (both legaland illegal) are the principal culprits in all six focuscountries.22
• The local effects of deforestation include soil erosion,drought, reduced flood protection, impaired waterquality, less food security, and loss of livelihood (table2). These effects can lead to large human migrationsout of deforested areas into cities and towns, puttingadditional stress on urban infrastructure capacity.
Indonesia
Vietna
m
Thailand
Malaysia
Philipp
ines
10,000
5,000
0
-5,000
-10,000
-15,000
-20,000
-25,000
-30,000
Figure 7: Net change in forested area (1000s hectares) (1990-2005)
Deforestation
EMERGING RISK Impacts of Key Environmental Trends in Emerging Asia
Figure 8: Original and lost forests, 2006
LegendIntact Forest Landscapes
Current Forest Cover
Estimated Original Forests
Source: World Resources Institute /Global Forest Watch and Greenpeace, “Intact Forest Landscapes,” 2006.
Source: Food and Agriculture Organization, Global ForestResources Assessment, 2005
14
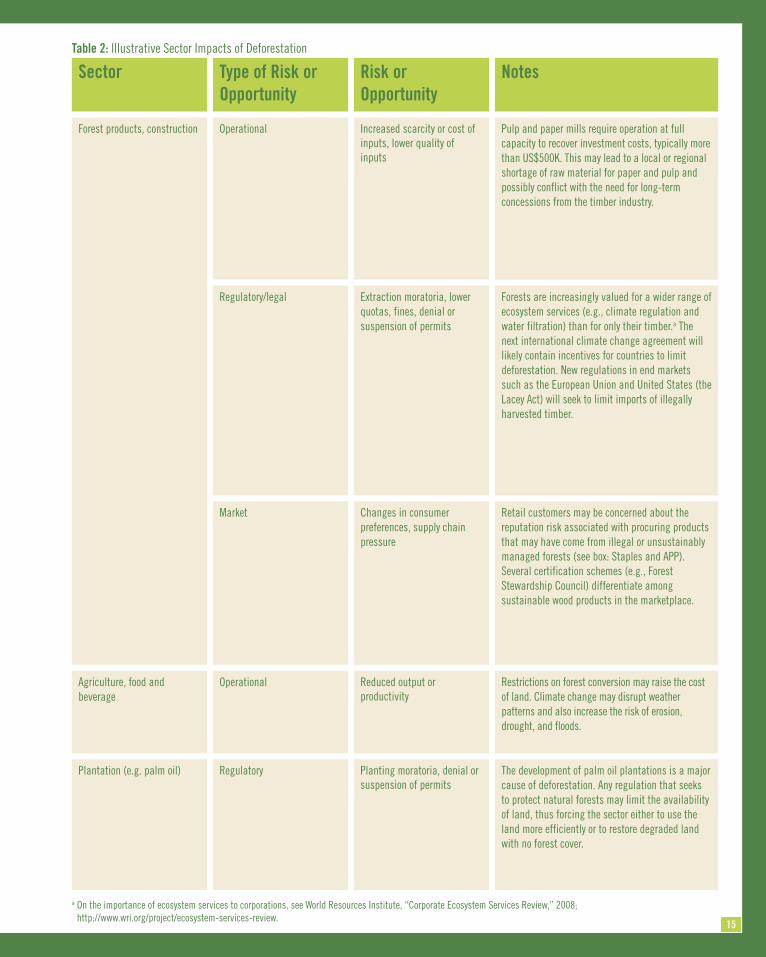
Forest products, construction
Sector Type of Risk orOpportunity
Operational
Risk orOpportunity
Increased scarcity or cost ofinputs, lower quality ofinputs
Notes
Pulp and paper mills require operation at fullcapacity to recover investment costs, typically morethan US$500K. This may lead to a local or regionalshortage of raw material for paper and pulp andpossibly conflict with the need for long-termconcessions from the timber industry.
Regulatory/legal Extraction moratoria, lowerquotas, fines, denial orsuspension of permits
Market Changes in consumerpreferences, supply chainpressure
OperationalAgriculture, food andbeverage
Reduced output orproductivity
RegulatoryPlantation (e.g. palm oil) Planting moratoria, denial orsuspension of permits
Forests are increasingly valued for a wider range ofecosystem services (e.g., climate regulation andwater filtration) than for only their timber.a Thenext international climate change agreement willlikely contain incentives for countries to limitdeforestation. New regulations in end marketssuch as the European Union and United States (theLacey Act) will seek to limit imports of illegallyharvested timber.
Retail customers may be concerned about thereputation risk associated with procuring productsthat may have come from illegal or unsustainablymanaged forests (see box: Staples and APP).Several certification schemes (e.g., ForestStewardship Council) differentiate amongsustainable wood products in the marketplace.
Restrictions on forest conversion may raise the costof land. Climate change may disrupt weatherpatterns and also increase the risk of erosion,drought, and floods.
The development of palm oil plantations is a majorcause of deforestation. Any regulation that seeksto protect natural forests may limit the availabilityof land, thus forcing the sector either to use theland more efficiently or to restore degraded landwith no forest cover.
a On the importance of ecosystem services to corporations, see World Resources Institute, “Corporate Ecosystem Services Review,” 2008; http://www.wri.org/project/ecosystem-services-review.
Table 2: Illustrative Sector Impacts of Deforestation
15

• Water scarcity is increasingly a problem for parts ofIndia, Indonesia, and Thailand (figure 9).
• Even in those areas with naturally abundant water, theactual amount available may be reduced by waterpollution and waste mismanagement. Deforestationalso worsens water quality because forests helpregulate water quality and flow.
• By altering weather patterns, climate change maymean more rainfall or drought in certain areas than inthe past, thereby contributing to unpredictable watercycles and availability.23
• Population growth and urbanization have resulted in alarge number of competing users depleting waterreserves faster than they can be replenished. India, inparticular, is drawing heavily on its already minimalwater resources.
• The vast majority of water withdrawals in the sixcountries are for agricultural use (from 62 percent inMalaysia to 95 percent in Thailand). In Malaysia andVietnam, industry also is a significant user at 21 and24 percent, respectively.24
Water Scarcity
EMERGING RISK Impacts of Key Environmental Trends in Emerging Asia
Figure 9: Annual renewable freshwater supply per capita, 2000
LegendExtreme Scarcity
Scarcity
Stress
Adequate
Abundant
Surplus
Ocean Water / Inland Water
Uninhabited / No Data
Annual renewable freshwater supply per capity (m3/person/year)
16
Source: ISciences, LLC; Universityof New Hamshire/Global RunoffData Centre; and Center for Inter-national Earth Science InformationNetwork/Centro Internacional deAgricultura Tropical.

Agriculture, food andbeverage, mining, powergeneration, steel, electronics,and pulp and paper
Sector Type of Risk/Opportunity
Operational
Risk/Opportunity
Increased scarcity or cost ofinputs for both products andprocesses and in the supplychain
Notes
Because all these sectors heavily depend on theuse of water in their industrial processes, they mayface production disruptions and higher prices.
Regulatory or legal Extraction moratoria, lowerquotas, user fees, fines,denial or suspension ofpermits, litigation
Reputational Damage to brand or image
OperationalAgriculture, manufacturing Reduced output orproductivity
Because water is essential to life, governments willlikely intervene to restrict usage when waterbecomes scarce.
Heavy users or polluters of water are especially atrisk as competition over water between industrialand life-sustaining uses intensifies.
The lack of access to potable water endangers thehealth of the workforce, critical for labor-intensiveindustries.
Table 3: Illustrative Sector Impacts of Scarce Water
17
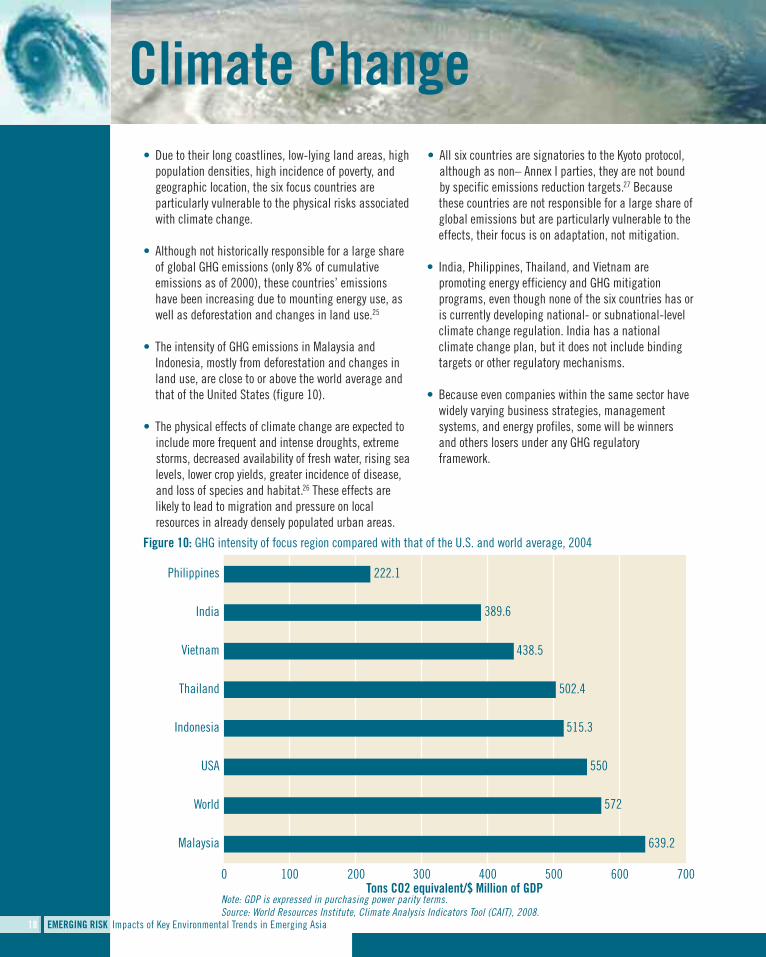
Note: GDP is expressed in purchasing power parity terms. Source: World Resources Institute, Climate Analysis Indicators Tool (CAIT), 2008.
• Due to their long coastlines, low-lying land areas, highpopulation densities, high incidence of poverty, andgeographic location, the six focus countries areparticularly vulnerable to the physical risks associatedwith climate change.
• Although not historically responsible for a large shareof global GHG emissions (only 8% of cumulativeemissions as of 2000), these countries’ emissionshave been increasing due to mounting energy use, aswell as deforestation and changes in land use.25
• The intensity of GHG emissions in Malaysia andIndonesia, mostly from deforestation and changes inland use, are close to or above the world average andthat of the United States (figure 10).
• The physical effects of climate change are expected toinclude more frequent and intense droughts, extremestorms, decreased availability of fresh water, rising sealevels, lower crop yields, greater incidence of disease,and loss of species and habitat.26 These effects arelikely to lead to migration and pressure on localresources in already densely populated urban areas.
• All six countries are signatories to the Kyoto protocol,although as non– Annex I parties, they are not boundby specific emissions reduction targets.27 Becausethese countries are not responsible for a large share ofglobal emissions but are particularly vulnerable to theeffects, their focus is on adaptation, not mitigation.
• India, Philippines, Thailand, and Vietnam arepromoting energy efficiency and GHG mitigationprograms, even though none of the six countries has oris currently developing national- or subnational-levelclimate change regulation. India has a nationalclimate change plan, but it does not include bindingtargets or other regulatory mechanisms.
• Because even companies within the same sector havewidely varying business strategies, managementsystems, and energy profiles, some will be winnersand others losers under any GHG regulatoryframework.
Climate Change
EMERGING RISK Impacts of Key Environmental Trends in Emerging Asia
Figure 10: GHG intensity of focus region compared with that of the U.S. and world average, 2004
Philippines
India
Vietnam
Thailand
Indonesia
USA
World
Malaysia
222.1
389.6
438.5
502.4
515.3
550
572
639.2
0 100 200 300 400 500 600 700
18
Tons CO2 equivalent/$ Million of GDP

All
Sector Type of Risk/Opportunity
Operational
Risk/Opportunity
Damage to assets, disruptionof business operations,increased scarcity or cost ofinputs (water, energy), andlower output or productivity
Notes
All companies possess physical assets that couldbe damaged by the physical effects of climatechange (i.e., extreme weather). Climate changealso will alter temperature and rainfall patterns,and the effects of these changes can ripplethroughout companies’ supply chains.
Regulatory/legal Carbon tax importrestrictions (in developedcountry markets)
Regulatory or legalPower generation, forestproducts, transportation
Lower quotas, denial orsuspension of permits orlicenses
MarketAutomobile, transportation Changing consumerpreferences
Although domestic limits on GHG emissions areunlikely to be implemented in the near future,companies could face external pressure fromcustomers in developed country markets that haveadopted emissions reduction targets.
Companies in energy-intensive sectors could besubject to future regulation of GHG emissions,which, by imposing a fee for carbon emissions,would lead to a financial cost either directly(through the company’s carbon-intensivemanufacturing processes) or indirectly (throughenergy and/or supply chain costs).
The rising cost of transport fuel could spur demandfor more fuel-efficient vehicles.
MarketForest products, constructionand engineering
New markets Ecosystem services (such as climate regulation),green buildings, energy efficiency, and cleantechnology, could present new market opportunities.
Table 4: Illustrative Sector Impacts of Climate Change
19

• The recent dramatic rise in the global prices of riceand wheat threatens to undo advances in povertyreduction in Southeast Asia.28 According to the WorldBank, the price of staple foods like rice and wheat hasclimbed 80 percent in the region since 2005.29
• Given that poor people spend between 60 to 80percent of their income on food, they will be hurt themost by high prices (figure 11).30
• The reasons for higher food prices include the risingprice of oil (affecting transportation and fertilizercosts), adverse weather, greater demand for meat anddairy products as Asian countries become richer, andincreased global demand for biofuels, all of which areexacerbated by ineffective agricultural policies andmarket controls.31
• The factors driving up food prices are expected tointensify as populations continue to grow and climatechange alters agricultural yields. Prices are expectedto remain high through 2015.32 The populations of thesix focus countries depend heavily on rice for a largeproportion of their total daily calories. Some nations,such as Vietnam, Thailand, and India, are largely self-sufficient in rice production, whereas others, such asthe Philippines, depend more on imports (figure 12).
Food Security
EMERGING RISK Impacts of Key Environmental Trends in Emerging Asia
Malaysia
India
Thailand
Philipp
ines
Indonesia
Vietna
m
70%
60%
50%
40%
30%
20%
10%
0%
70%
60%
50%
40%
30%
20%
10%
0%
Figure 12: Rice consumption and dependence on imports, 2003
Figure 11: Share of income spent on food and beverages, 2005
Source: International Rice Research Institute (IRRI), “RecentTrends in the Rice Economy”, 2003.
Source: Asian Development Bank, “Research Study on Poverty-Specific Purchasing Power Parities for Selected Countries in Asiaand the Pacific”, 2005.
Share of rice of total daily caloriesShare of imported rice of total rice consumed
Malaysia India Thailand Philippines Indonesia Vietnam
Entire populationBelow $1/day poverty line
20

Agriculture, food andbeverage
Sector Type of Risk/Opportunity
Market
Risk/Opportunity
Higher unit price
Notes
Small-scale, often poor, farmers will likely losebecause they lack the means to respond to pricetrends (i.e., to expand production) and areespecially vulnerable if they are net buyers of food.Medium- to large-scale farmers may benefit fromhigher prices because they are more likely to beable to increase yields to take advantage of priceincreases.a
Farming equipment,chemicals (fertilizer)
Market Increased market demand Sustained higher prices can lead to expanded farmingand investment in technology for higher yields.
Consumer goods Market Decreased market demand High food prices means less disposable income tospend on “nonessential” goods.
Agriculture, manufacturing Operational Lower output or productivity A lack of food endangers the health of theworkforce, critical for labor-intensive industries.
Table 5: Illustrative Sector Impacts of Food Security
a Asian Development Bank, “Food Prices and Inflation in Developing Asia: Is Poverty Reduction Coming to an End?” April 2008.
21

• Although energy consumption per capita remains low,the region’s rapid economic growth has led to theworld’s highest demand increases for energy, by bothcompanies and consumers.33
• Malaysia’s and Thailand’s rates of energyconsumption per GDP are close to or above the worldaverage (figure 13).
• Because much of the region’s energy needs are met byfossil fuels (oil and coal), their economies are vulnerableto rising energy prices (especially those heavily reliant onimports) as well as to pressure from the internationalcommunity to reduce their GHG emissions.
• All six countries subsidize fuel costs to keep priceslow, although Indonesia, Thailand, and Malaysia haverecently rolled back their subsidies, resulting inreduced demand.
Energy Security
EMERGING RISK Impacts of Key Environmental Trends in Emerging Asia
120%
100%
80%
60%
40%
20%
Fossil Fu
el Dep
enda
nce
Malaysia
Thailand
Philippines
Vietnam
Indonesia
India
0% 20% 40% 60% 80%
Figure 13: Energy dependence of each economy, 2003
Source: World Resources Institute, Earth Trends, 2003.
Energy consumption perGDP (thousand metric tonsof oil equivalent
22
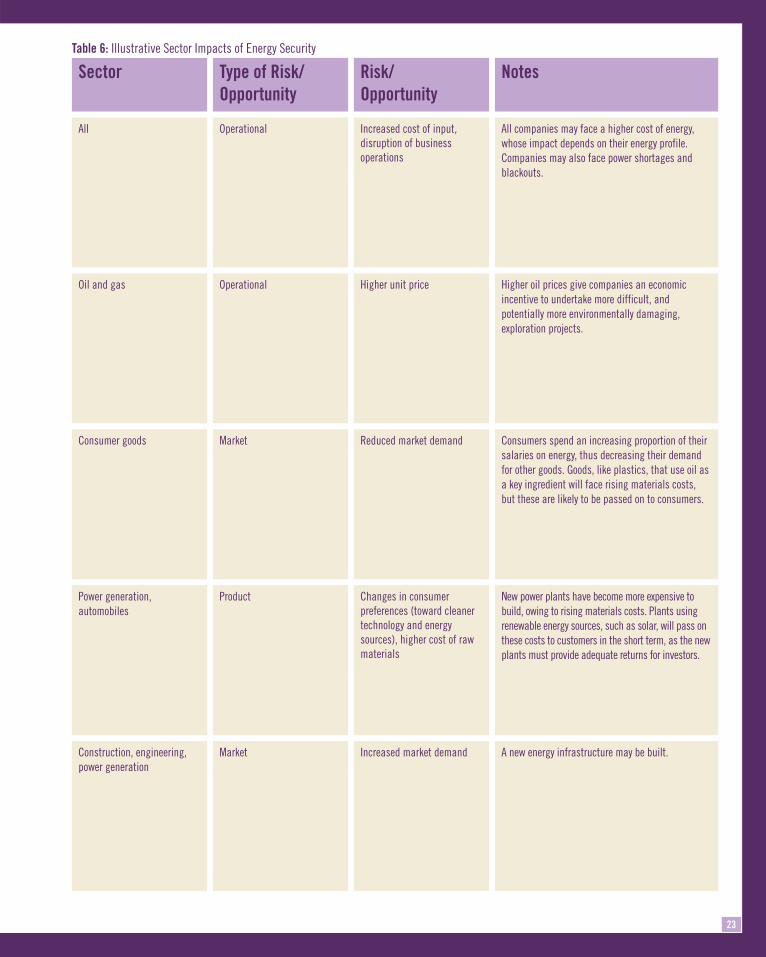
All
Sector Type of Risk/Opportunity
Operational
Risk/Opportunity
Increased cost of input,disruption of businessoperations
Notes
All companies may face a higher cost of energy,whose impact depends on their energy profile.Companies may also face power shortages andblackouts.
Oil and gas Operational Higher unit price Higher oil prices give companies an economicincentive to undertake more difficult, andpotentially more environmentally damaging,exploration projects.
Consumer goods Market Reduced market demand Consumers spend an increasing proportion of theirsalaries on energy, thus decreasing their demandfor other goods. Goods, like plastics, that use oil asa key ingredient will face rising materials costs,but these are likely to be passed on to consumers.
Power generation,automobiles
Product Changes in consumerpreferences (toward cleanertechnology and energysources), higher cost of rawmaterials
New power plants have become more expensive tobuild, owing to rising materials costs. Plants usingrenewable energy sources, such as solar, will pass onthese costs to customers in the short term, as the newplants must provide adequate returns for investors.
Construction, engineering,power generation
Market Increased market demand A new energy infrastructure may be built.
Table 6: Illustrative Sector Impacts of Energy Security
23
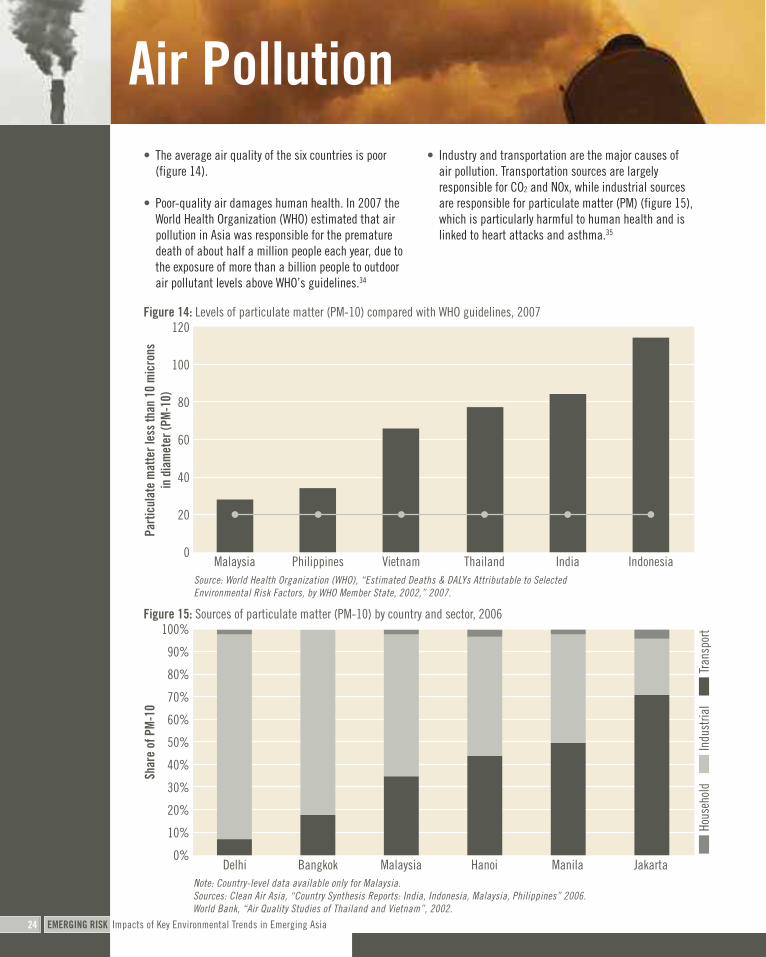
• The average air quality of the six countries is poor(figure 14).
• Poor-quality air damages human health. In 2007 theWorld Health Organization (WHO) estimated that airpollution in Asia was responsible for the prematuredeath of about half a million people each year, due tothe exposure of more than a billion people to outdoorair pollutant levels above WHO’s guidelines.34
• Industry and transportation are the major causes ofair pollution. Transportation sources are largelyresponsible for CO2 and NOx, while industrial sourcesare responsible for particulate matter (PM) (figure 15),which is particularly harmful to human health and islinked to heart attacks and asthma.35
Air Pollution
EMERGING RISK Impacts of Key Environmental Trends in Emerging Asia
120
100
80
60
40
20
0
100%
90%
80%
70%
60%
50%
40%
30%
20%
10%
0%
Particulate matter les
s than
10 microns
in diameter (P
M-10)
Share of PM-10
Figure 14: Levels of particulate matter (PM-10) compared with WHO guidelines, 2007
Figure 15: Sources of particulate matter (PM-10) by country and sector, 2006
Source: World Health Organization (WHO), “Estimated Deaths & DALYs Attributable to SelectedEnvironmental Risk Factors, by WHO Member State, 2002,” 2007.
Note: Country-level data available only for Malaysia.Sources: Clean Air Asia, “Country Synthesis Reports: India, Indonesia, Malaysia, Philippines” 2006.World Bank, “Air Quality Studies of Thailand and Vietnam”, 2002.
Household In
dustria
l Tran
sport
Malaysia Philippines Vietnam Thailand India Indonesia
Delhi Bangkok Malaysia Hanoi Manila Jakarta
24
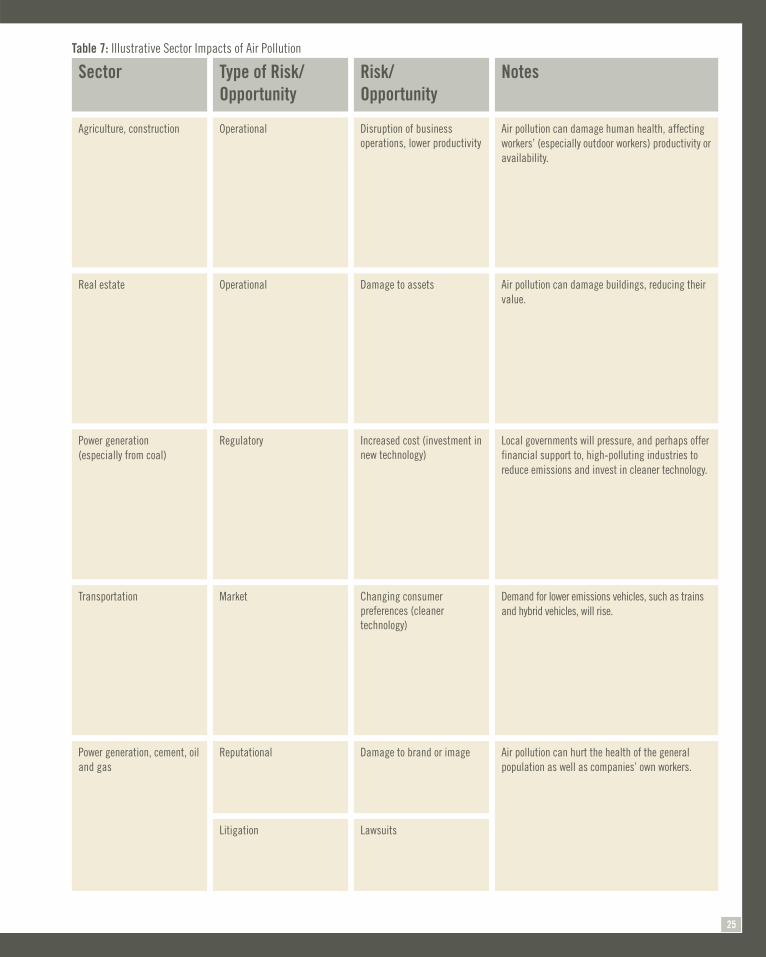
Agriculture, construction
Sector Type of Risk/Opportunity
Operational
Risk/Opportunity
Disruption of businessoperations, lower productivity
Notes
Air pollution can damage human health, affectingworkers’ (especially outdoor workers) productivity oravailability.
Real estate Operational Damage to assets Air pollution can damage buildings, reducing theirvalue.
Power generation (especially from coal)
Regulatory Increased cost (investment innew technology)
Local governments will pressure, and perhaps offerfinancial support to, high-polluting industries toreduce emissions and invest in cleaner technology.
Transportation Market Changing consumerpreferences (cleanertechnology)
Demand for lower emissions vehicles, such as trainsand hybrid vehicles, will rise.
Power generation, cement, oiland gas
Reputational
Litigation
Damage to brand or image
Lawsuits
Air pollution can hurt the health of the generalpopulation as well as companies’ own workers.
Table 7: Illustrative Sector Impacts of Air Pollution
25
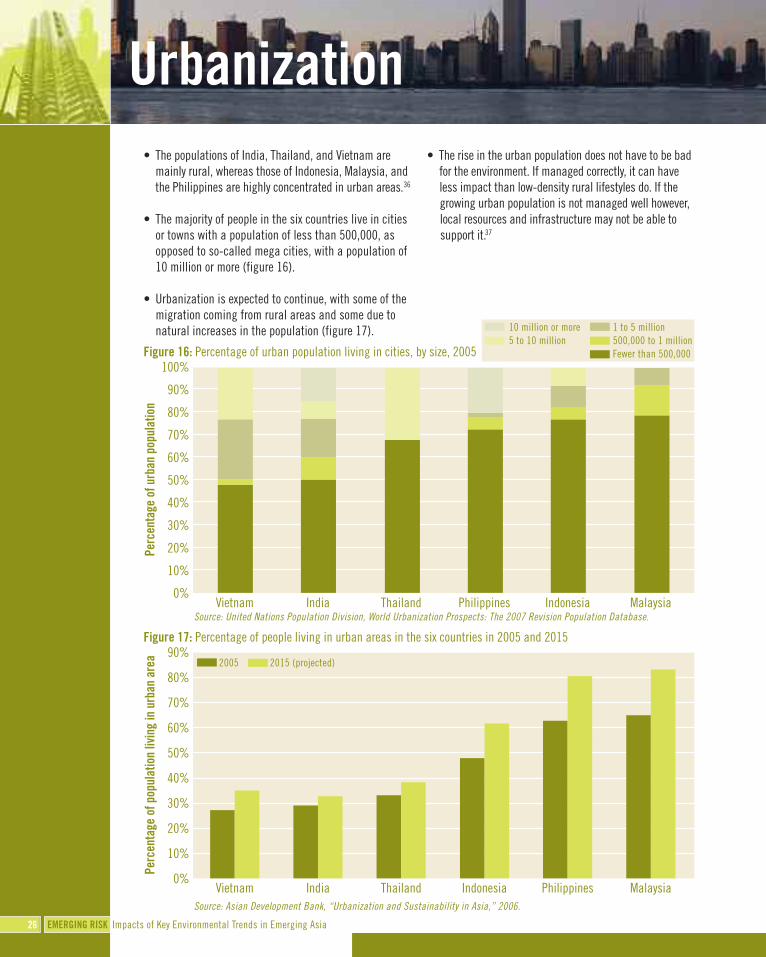
• The populations of India, Thailand, and Vietnam aremainly rural, whereas those of Indonesia, Malaysia, andthe Philippines are highly concentrated in urban areas.36
• The majority of people in the six countries live in citiesor towns with a population of less than 500,000, asopposed to so-called mega cities, with a population of10 million or more (figure 16).
• Urbanization is expected to continue, with some of themigration coming from rural areas and some due tonatural increases in the population (figure 17).
• The rise in the urban population does not have to be badfor the environment. If managed correctly, it can haveless impact than low-density rural lifestyles do. If thegrowing urban population is not managed well however,local resources and infrastructure may not be able tosupport it.37
Urbanization
EMERGING RISK Impacts of Key Environmental Trends in Emerging Asia
90%
80%
70%
60%
50%
40%
30%
20%
10%
0%
Figure 17: Percentage of people living in urban areas in the six countries in 2005 and 2015
Source: Asian Development Bank, “Urbanization and Sustainability in Asia,” 2006.
Vietnam India Thailand Indonesia Philippines Malaysia
Percen
tage
of p
opulation liv
ing in urban
area
100%
90%
80%
70%
60%
50%
40%
30%
20%
10%
0%
Figure 16: Percentage of urban population living in cities, by size, 2005
Vietnam India Thailand Philippines Indonesia Malaysia
Percen
tage
of u
rban
pop
ulation
Source: United Nations Population Division, World Urbanization Prospects: The 2007 Revision Population Database.
10 million or more5 to 10 million
1 to 5 million500,000 to 1 millionFewer than 500,000
2005 2015 (projected)
26

Construction, engineering
Sector Type of Risk/Opportunity
Market
Risk/Opportunity
Increased market demand
Notes
The expansion of cities requires the construction ofinfrastructure, including housing, roads, and pipes.
Power generation Operational Lower cost of transmissionand distribution
Transportation Market Changing consumerpreferences
Demand for public transportation rises as citiesgrow and traffic increases.
All sectors (located in largerurban areas)
Operational Lower productivity In larger cities, air pollution and traffic hurtworkers’ productivity.
Table 8: Illustrative Sector Impacts of Urbanization
27

• The growing affluence and consumption of the sixcountries’ burgeoning populations, especially those ofIndia and Indonesia, may exacerbate the negativeimpacts of the other trends and will increasecompetition for resources among people and industries(figure 18).
• The combined population of the six countries coveredin this report is approximately 1.6 billion, or about 25percent of the world population in 2008.38 A significantproportion can be considered poor (figure 19).
• The average age in several of the countries, notablyVietnam, is low, resulting in a low populationdependency ratio.* Although it currently has the lowestdependency ratio, the Philippines will have the highestby 2050 (figure 20), and consequently, may havedifficulty supporting its nonworking population as itsproportion of workers shrinks over time.
• The burden of providing resources for a large andincreasingly affluent population can exacerbatedeforestation, water scarcity, air pollution, climatechange, and the problems of food and energy security.
Population Growth
70.0
65.0
60.0
55.0
50.0
45.0
40.0
Figure 20: Population dependency ratio, 2006
Source: United Nations Population Division, Department of Economic and Social Affairs, “World Population Prospects: The 2006 Revision: Total Dependency Ratio” 2006.
2010 2015 2020 2025 2030 2035 2040 2045 2050
Depe
ndan
cy Ratio
Source: United Nations Department of Economic and SocialAffairs/Population Division.International Monetary Fund, 2008.
1,8001,6001,4001,2001,000800600400200
0
Figure 18: Population Size, 2008
Malaysia
Thailand
Philippines
Vietnam
Indonesia
India
Source: Asian Development Bank, “Key Indicators 2005: Labor Marketsin Asia: Promoting Full, Productive, and Decent Employment,” 2005.
* The population dependency ratio is the ratio of dependents (people younger than fifteen or older than sixty-four) to the working-age population (those aged fifteen to sixty-four). A rising dependency ratio is a concern in many countries with an aging popula-tion, s ince it becomes difficult for pension and social security systems to provide for a significantly older, nonworking population.
1,000900800700600500400300200100
0
Figure 19: Incidence of extreme poverty in absolute terms, 2005
Malaysia
Thailand
Vietnam
Philippines
Indonesia
India
2008
2050 (Estimated) Living on less than $1/day
Living on less than $2/day
MalaysiaIndonesia
ThailandVietnam
PhilippinesIndia
Popu
latio
n Size
(millions
)
Popu
latio
n Size
(millions
)
28 EMERGING RISK Impacts of Key Environmental Trends in Emerging Asia

Food and beverage, consumergoods, construction,automobiles
Sector Type of Risk/Opportunity
Market
Risk/Opportunity
Increased market size
Notes
Textiles, manufacturing Operational Lower cost of labor A surplus of labor keeps wages low in low value–added sectors.
Table 9: Illustrative Sector Impacts of Population Growth
29
Emerging Asian Countries: a Deeper Look
III
In this section, we examine the trends from a country specific context. We explore
what we assess to be each country’s most relevant environmental trends and their
impact on key economic sectors. The impact of a trend such as deforestation depends
on a country’s geography, natural resources, population, and policy responses.
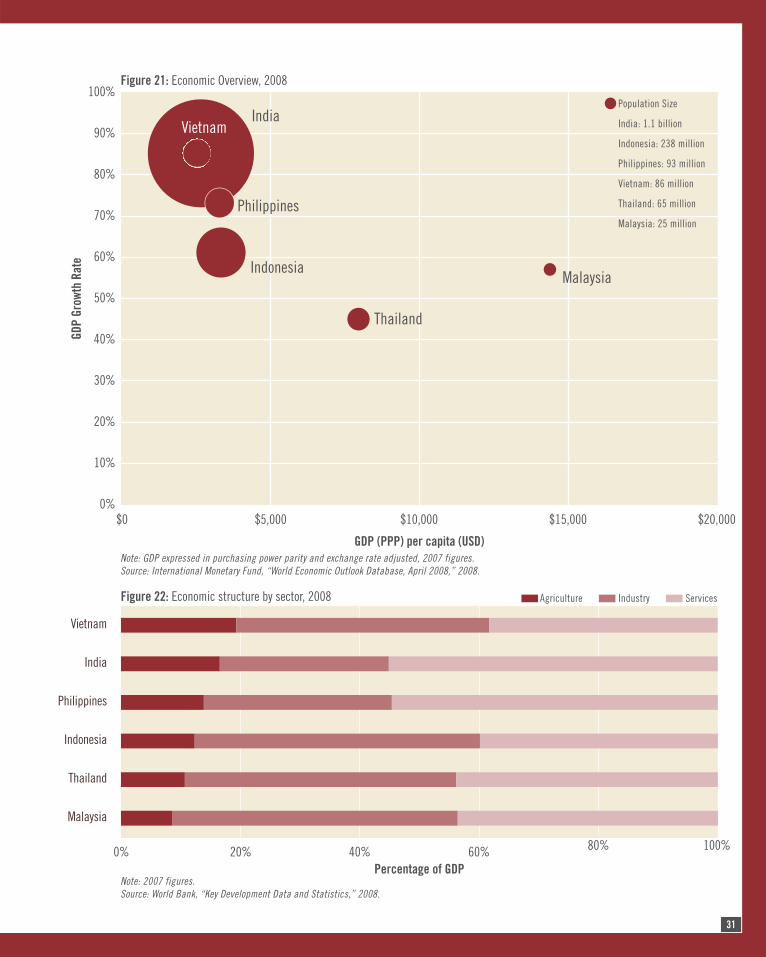
The level of economic development of the six countries differs significantly. In
terms of GDP, India and Vietnam are classified as low-income countries;
Indonesia, Philippines, and Thailand are classified as lower-middle income
countries; while Malaysia is classified as an upper-middle income country
(figure 21). Industry and services each comprise a larger portion of the
countries' GDP relative to agriculture, although agriculture is still a significant
portion of GDP, particularly in the low-income countries (figure 22).
EMERGING RISK Impacts of Key Environmental Trends in Emerging Asia30
100%
90%
80%
70%
60%
50%
40%
30%
20%
10%
0%
GDP Gr
owth Rate
GDP (PPP) per capita (USD)
Percentage of GDP
Figure 21: Economic Overview, 2008
Figure 22: Economic structure by sector, 2008
Note: GDP expressed in purchasing power parity and exchange rate adjusted, 2007 figures.Source: International Monetary Fund, “World Economic Outlook Database, April 2008,” 2008.
Note: 2007 figures.Source: World Bank, “Key Development Data and Statistics,” 2008.
Population Size
India: 1.1 billion
Indonesia: 238 million
Philippines: 93 million
Vietnam: 86 million
Thailand: 65 million
Malaysia: 25 million
Agriculture Industry Services
Malaysia
Thailand
Philippines
Indonesia
IndiaVietnam
$0 $5,000 $10,000 $15,000 $20,000
Vietnam
India
Philippines
Indonesia
Thailand
Malaysia
0% 20% 40% 60% 80% 100%
31

• India has the world’s fourth largest economy (2007nominal GDP: US$1.09 trillion) and the second highestpopulation (almost 1.2 billion).39
• The government played a larger role in the economyuntil market-oriented economic reforms were introducedin 1991, which encouraged foreign investment andprivatized some state-owned enterprises.40
Public administration and other 13%
Finance 14%
Trade, transport, and communications 24%
Agriculture 18%
Mining 3%
Manufacturing 17%
Electricity, gas, and water 2%
Construction 9%
India
Trend
Water scarcity
Energy security
Climate change
Sectors Affected
Agriculture, food and beverage,manufacturing, power generation
Power generation, oil and gas,automotive
Power generation, oil and gas,agriculture
EMERGING RISK Impacts of Key Environmental Trends in Emerging Asia
Water ScarcityExperts estimate that by 2020, India’s demand for water willexceed all its sources of supply41 and that by 2050, its grosswater availability per capita will fall to as low as 1140m3/yr.42
A level of water availability of less than 1,700 m3/yr isregarded as a potentially serious constraint.
India’s agricultural sector, accounting for almost one-fifth ofthe country’s GDP, is the principal user of the country’s waterresources. Currently, about one third of India’s agricultural landis irrigated, almost double the world average, and if irrigationis expanded, the pressure on water resources will intensify.43
Meanwhile, factors such as climate change are diminishingthe supply of water (through the recession of the Himalayanglaciers), at the same time as the demand for water is risingowing to increasing industrialization, urbanization, andpopulation growth.44 India currently does not have aconsistent legal framework for dealing with water users’rights, though there is social pressure to favor people overindustrial users in conflict situations.45
The operational costs in water-intensive sectors, especially thoselocated in water-scarce regions, including agriculture, food andbeverage, manufacturing, and power generation will rise as waterbecomes scarcer, and supplies may well be disrupted.
In 2000, Coca-Cola opened a bottling plant in Palakkad,Kerala, India, which shared its water supply with localpeople and farmers. By 2002, the local water supply hadbecome depleted or polluted, and the locals blamed Coke.In response, Coke claimed that its treatment ofwastewater was adequate and instead blamed thereduced rainfall. Nevertheless, the public perception wasthat the company was responsible, and the ensuingprotests and legal action caused the plant to be closed in2004. In addition, the state of Kerala banned themanufacturing and consumption of Coke (and Pepsi) in2006, although this ban was quickly overturned in court.46
This is a good example of reputational risk: the actualextent to which Coke, the local farmers, the lack of rainfall,or other factors contributed to the water shortage wasirrelevant. Instead, the public perception that Coke wasresponsible resulted in legal fees, lost sales, and damageto its brand. Coca-Cola now has a water conservationpolicy to help mitigate the risk of loss of water supply. Thepolicy states that “by 2010, it aims to return all the waterit uses in its manufacturing processes back to nature.”47
Figure 23: Economic sectors in India by percentage of GDP, 2007
Table 10: Key Trends in India
Water Scarcity and Coca-Cola In Kerala, India
32
Source: Asian Development Bank, “Key Indicators for Asia and the Pacific 2008: Country Tables,” 2008.

Coal (54%)Hydroelectricity (5%)Natural Gas (8%)
Oil (33%)
Energy SecurityIndia faces a growing challenge in meeting its rapidlyincreasing energy needs, as it is heavily dependent onfossil fuels, especially coal and oil (figure 24). Althoughin the short term, the government plans to increase itsproduction of coal and to focus on energy efficiency, in thelonger term it plans to gradually stop using fossil fuels.48
For a country already facing energy shortages, theexpansion of supply and more efficient energy use will becritical to India’s continued economic development.India’s dependence on imports of fossil fuel (more than70% of India’s oil is imported) will make its expandingenergy needs increasingly costly to meet. The Indian
government generously subsidizes retail energy prices,although retail oil prices are still relatively high evenwith subsidies.49 In early 2008, according to theinternational press the government was forced toincrease retail oil prices by 10 percent, because evensubsidized prices had become too expensive to maintainin the face of rising global oil prices.50
Companies in all sectors, especially energy-intensiveones like manufacturing, will need to evaluate theirenergy profile and find ways to reduce costs. India'spower generation, oil and gas, and automotive sectorswill likely face increasing pressure to invest in cleanertechnologies.51
Climate ChangeAlthough India’s GHG emissions per capita are muchlower than the world average and that of developedcountries, the country is physically vulnerable to theimpacts of climate change.52 As a result of climatechange, India will experience rising sea levels, changingrain patterns, and diminishing water supply. Thesephysical impacts could lower agricultural output (up to5% for a 1.5°C rise in temperature), which is highlydependent on traditional weather patterns, namely, theannual monsoon season.53
India just released its national climate change plan, butit does not establish national targets for either GHG
reductions or energy efficiency. Energy-intensive sectors,however, are already being targeted by India’s Bureau ofEnergy Efficiency, which is developing sector-specificenergy efficiency benchmarks, beginning with cement.
A clear regulatory incentive to reduce emissions isconceivable in the future, especially if the United Statesand other developed countries begin reducing their ownemissions more aggressively or provide more financialand technical support to countries like India to reduceemissions. Because they are large emitters, the energysector (56% of emissions) and the agricultural sector(34% of emissions) will be the principal targets ofregulation or other forms of government intervention.54
Figure 24: India’s energy mix, 2007
33
Source: Energy Information Administration, 2007.

Indonesia
EMERGING RISK Impacts of Key Environmental Trends in Emerging Asia
• Indonesia is the world’s fourth most populous country,with 237 million people speaking 250 languages,spread across six thousand inhabited islands.55
• Indonesia’s GDP grew by an average of 7 percent between1987 and 1997, though the country's economy was slowto recover from the 1997/1998 Asian financial crisis.56
• The government still plays a significant role in theeconomy and controls the prices of fuel, rice, andelectricity (figure 25).57 Indonesia thus is at risk forprice inflation, as the government struggles to keeppace with global price increases.
Trend
Food security
Deforestation
Climate change
Sector Affected
Agriculture, food and beverage,farming equipment, plantations, forestproducts, construction
Agriculture, forest products, palm oil
Agriculture, food and beverage, powergeneration, transportation, oil and gas
Air pollution Automotive, manufacturing,construction
Figure 25: Indonesia’s economic sectors by percentage of GDP, 2007
Food SecurityRising global food prices could lead to social unrest inIndonesia. Even though it is the world’s third largestproducer of rice, according to press reports it recentlybanned almost all private exports in an effort to keepprices low for domestic consumers.58 But as global pricesrise, the government’s budget will be strained to maintaincurrent price levels for subsidized commodities like rice.Indonesia’s population is vulnerable to price increases ofstaple products, because almost 5 percent of thepopulation lives on less than $2 per day, and nearly 10percent survive on less than $1 per day.59 Indeed, thegovernment fears food riots and other actions, and in its2008 budget it increased the amount it would spend on
food subsidies.60 Another part of the government’s plan tolessen its burden on imports is to achieve self-sufficiencyin rice, which it claims it will do by the end of 2008.61
Self-sufficiency typically means increasing efficiency andproductivity in the agricultural sector to offset the effectsof unforeseen climatic events. But, it may also entailexpanding agricultural land area, which would increasecompetition for land with forestry and constructioncompanies. One result would be that companiesproducing fertilizers, high-yield seeds, and farmingequipment might benefit from expanding andintensifying farming.
Mining (includes oil and gas) 11%
Manufacturing (includes oil and gas refining) 26%
Electricity, gas, and water 1%
Construction 8%
Trade 15%
Agriculture 14%
Others 5%
Public administration 5%
Finance 8%
Transport and communications 7%
Source: Asian Development Bank, “Key Indicators for Asia and the Pacific 2008: Country Tables,” 2008.
34
Table 11: Key Trends in Indonesia

Figure 26: Land area of Indonesia’s palm oil plantations, 2007
DeforestationIndonesia’s continuing deforestation and land conversionpractices are helping increase the concentrations ofgreenhouse gases in the atmosphere. Even though half ofIndonesia is covered by forests (which make up 10% of theworld’s forest cover), between 2000 and 2005 the countrylost an estimated 0.7 million hectares of forest todeforestation.62 This is a dramatic decrease from that of theperiod 1990 to 2000, but deforestation and land conversionstill remain a significant environmental problem.63
In 2005, Indonesia was ranked the world’s third largestemitter of greenhouse gases, after the United States andChina, largely as a result of deforestation, peat bogdegradation, and forest fires.64 The forces leading to
deforestation have intensified as the global thirst for palmoil for use in the biofuel, cosmetic, and food industries isintensifying the competition for land, often leading to theclearing of virgin rainforest.65
In 2007, Indonesia claimed to have overtaken Malaysia asthe world’s leading producer of palm oil (figure 26).66
According to press reports, the country’s domestic demandfor palm oil is rising as well, as it tries to mandate the useof a 2.5 percent blend of biodiesel, to help lower itsconsumption of petroleum.67 An estimated 80 percent ofIndonesia’s timber is harvested illegally.68
Rampant overharvesting will reduce Indonesia’s supplyof high-quality timber, hurting sectors such as pulp andpaper and wood products which depend on timber. Thepalm oil industry will have less access to land forexpansion if efforts, such as global mechanisms toreduce land-based emissions, are made to preserve
forests. The palm oil sector is subject also to supplychain pressures to stop illegal timber harvesting. Someglobal companies, like Unilever, have committed topurchasing “sustainable” palm oil, which by definition,should not contribute to deforestation.69
4,000
3,500
3,000
2,500
2,000
1,500
1,000
500
0
1000
's of H
ectares
Source: Statistics Indonesia, 2007
1995 1996 1997 1998 1999 2000 2001 2002 2003 2004 2005 2006
35
Staples, the U.S.-based world’s largest retailer of of-fice supplies, canceled its contract with a Singapore-based supplier, Asia Pulp & Paper Co. Ltd. (APP), inJanuary 2008 because of its poor environmental per-formance. Although Staples bought only about 5 per-cent of its paper products from APP, it determined thatthe company was not improving its environmentalmanagement.
Environmental concernsAPP owns and operates one of Asia’s largest pulp millsin Sumatra, Indonesia. Various reports have linked thecompany to illegal logging in virgin rainforests. Third-party audits have shown that a large concentration ofthe fiber in APP’s products comes from high-conserva-tion-value forests. Because Staples’ paper procure-ment policy is intended to protect such forests byensuring that its paper-based products contain an av-erage of 30 percent postconsumer recycled content,APP’s products were deemed unacceptable.
Staples takes actionStaples first tried to persuade APP to improve its envi-ronmental practices, including helping it create an ac-tion plan to become 100 percent dependent onplantations. But when APP changed management, itappeared to waiver from its previous commitments.Third-party audits showed no improvement, and whenStaples investigated, the company became less forth-right about its practices. Staples finally decided tosever its relationship with APP.
Value creationAPP has two publicly traded subsidiaries (mills):Pabrik Kertas Tjiwi Kimia Tbk (TKIM.JK) and Indah KiatPulp & Paper Tbk (INKP.JK). Both are traded on theJakarta (Indonesian) stock exchange. Staples’ shareprice did rise slightly after the company announcedthe end of its relationship; however, this rise was notsignificant, especially when examined over a longertime span or when compared with its peers’ pricemovements. Many factors influence share prices, andnegative news often has a more pronounced impactthan does positive news.
Whether or not the stock market immediately recognizedthe benefits of this outcome, for Staples the ending ofits relationship with APP was an important strategic
decision. Continuing such a relationship would havedamaged the integrity of Staples’ paper policy andrisked its reputation. Moreover, sudden negative newscould have lowered its share price and/or damaged itsrelationships with customers. This episode thus gaveStaples an opportunity not only to diversify its supplierbase away from an underperforming company but alsoto turn the fiber source for some of its paper-basedproducts away from trees. Staples now uses waste fromcotton production to make file folders.
APP received bad press from the international media.Inevitably, though, other buyers with policies lessstringent than Staples’ will continue to buy from thecompany. Nevertheless, it is important to recognizethat customers, like Staples, with strongenvironmental commitments will send strong marketsignals by creating conditional relationships thatdemand that certain standards be met. Supply chainpressure constitutes an important force for positivechanges in corporate environmental practices inemerging markets.
Notes: This case was prepared with input from Mark Buckley, Vice President, Environmental Affairs, Staples Inc.
36 EMERGING RISK Impacts of Key Environmental Trends in Emerging Asia
Staples and APP: Supply Chain Pressures on Emerging Market Companies

Climate Change
Air Pollution
Given its volcanic geography and 54,716 km of coastline,Indonesia is already prone to violent natural disasters.70
Between 2003 and 2005, the Indonesian governmentcounted 1,430 natural disasters, including floods,landslides, and other geological disasters, whose socialeffects were exacerbated by Indonesia’s high incidence ofpoverty.71 Climate change is expected to increase the rateand severity of such events as well as result in more rainfalland flooding in coastal areas due to rising sea levels andtemperatures. These changes, in turn, could threatenIndonesia’s food security and livelihoods and raise theincidence of disease. Nonetheless, Indonesia is unlikely todecrease its emissions, given its dependence on (and
planned expansion of) coal-fired power plants, as well as itscontinued deforestation and land conversion practices.
Those of Indonesia’s sectors that depend directly on theenvironment, such as agriculture, tourism, and forestry,are vulnerable to physical risks. The agricultural sector,on which many Indonesians depend financially, andrelated sectors such as food and beverage will besignificantly affected by lower yields. GHG-intensivesectors, such as electric utilities and transportation, maybe altered by regulatory and market based measuresaimed at reducing emissions, although domesticregulation is unlikely in the short term.
Air pollution has become so serious in Indonesia that it isalready having major repercussions on human health.Moreover, the economic costs of air pollution are estimatedto be US$400 million per year, a figure estimated to riseinto the billions in the next few years.77 Indonesia’s fourthleading cause of death is lower respiratory infections,largely caused by exposure to polluted air, whose mainsources are vehicles, industry, domestic sources, and forestfires, with different sources responsible for different typesof gases.78
The Indonesian government’s efforts to curb air pollutionmay result in higher costs to polluting sectors, such asmotorcycle, automobile, and manufacturing. Investing innew, or retrofitting existing, equipment likely will befinancially supported by government through taxes orother incentives. Sectors located in highly polluted citieslike Jakarta, with outdoor workers, such as inconstruction, will find worker productivity andrecruitment to be more expensive.
Extreme Weather “Submerging” Indonesian Industry
Over the past ten years, Indonesia has had anunusually high volume of natural disasters. In fact,government statistics show that Indonesia averagesas many as 2.7 disasters—from floods to earthquakesto volcanic eruptions—per day each year! Butimagine if things got worse.
The Intergovernmental Panel on Climate Change (IPCC)estimates that as a result of climate change, there is amore than 90 percent probability of heavier rain eventsand a more than 66 percent likelihood of extremely highsea levels globally. Because Indonesia is situated onan archipelago of 17,508 islands, its industrial sectorswould be severely affected by any of these events. AWorld Bank report cites predictions of 2 to 3 percentmore rainfall per year and a mean sea level rise of 0.57centimeters per year in Jakarta Bay.72 RachmanWitoelar, Indonesia’s environmental minister, evenpredicts that by 2030, two thousand of Indonesia’sislands would be submerged from rising sea levels.73
The floods in Aceh in December 2006 affected ahalf million people and created US$210 million indamage and losses, primarily in the infrastructure,housing, and agriculture sectors.74 Three monthslater, the February 2007 floods left another halfmillion people homeless and caused perhaps asmuch as US$1 billion in economic damage.75
Share prices of Indonesia’s biggesttelecommunications carrier, Telkom, its largestretail bank, Bank Central Asia, and its largestautomotive conglomerate, Astra International, allfell after reports of the extensive damage to thesecompanies’ infrastructure.76 Paskah Suzetta,Indonesia’s national planning minister, stated thatindustry and trade GDP growth was expected todecrease by 0.59 percent as a result of the February2007 flood. Clearly, extreme weather patterns canhave immediate and devastating effects on acountry’s economy.
37
Warmer days.Less cold days/nights
More warm spells andheatwaves
More heavy rainevents
More areas hit bydrought
More extreme sealevels (not tsunamis)
More intense tropicalcyclones
Virtuallycertain
Very likely
Very likely
Likely
Likely
Likely
Phenomenon
Probability definitions:Virtually certain: over 99%Very likely: over 90%Likely: over 66% Source: IPCC
Effects of Climate ChangeLikelihood

• Malaysia is classified as a newly industrializedcountry, and it has the highest GDP per capita of allthe countries examined in this report.79
• The Malaysian government controls the prices of 30percent of its goods. Its current plans are to refocus theeconomy toward higher-technology products, with thegoal of becoming a fully developed economy by 2020.80
• Malaysia also occupies a strategic geographic positionas one of three countries controlling the Strait ofMalacca, arguably the world’s most importantshipping lane.
Malaysia now imports a third of its rice; rising globalcommodity prices may lead to further deforestation, to makeroom for more rice fields. Since the 1980s, Malaysia’sproduction of rice has fallen, whereas that of fruits andvegetables, often bound for export, has risen substantially.81
Owing to the recent rise in food prices, Malaysia reportedlyannounced a plan to spend US$1.3 billion to turn Sarawak,home to a tropical rainforest, into a “rice bowl.”82
The Malaysian government’s plan to increase domesticrice production may affect several sectors. Turningtropical rainforest into rice paddies will reduce theamount of land available to the forestry, palm oil (exportsworth US$13.6 billion in 2007), and related sectors,potentially making it more costly for them to expand.83
As the agricultural sector expands, firms producinghigh-yield seeds, fertilizer, and farming equipment willbenefit from the higher sales.
Malaysia
Source: Asian Development Bank, “Key Indicators for Asia and the Pacific 2008: Country Tables,” 2008.
Trend
Food Security
Deforestation
Water Scarcity
Sector Affected
Agriculture, food and beverage,farming equipment, plantations, forestproducts, construction
Agriculture, forest products, palm oil
Agriculture, food and beverage, powergeneration, electronics manufacturing,palm oil processing
Food Security
Mining 14%
Manufacturing 27%
Electricity, gas, and water 3%Construction 3%
Trade 13%
Agriculture 10%
Others 5%
Public administration 7%
Finance 12%
Transport and communications 6%
Figure 27: Malaysia’s economic sectors by percentage of GDP, 2007
Table 12: Key Trends in Malaysia
EMERGING RISK Impacts of Key Environmental Trends in Emerging Asia38
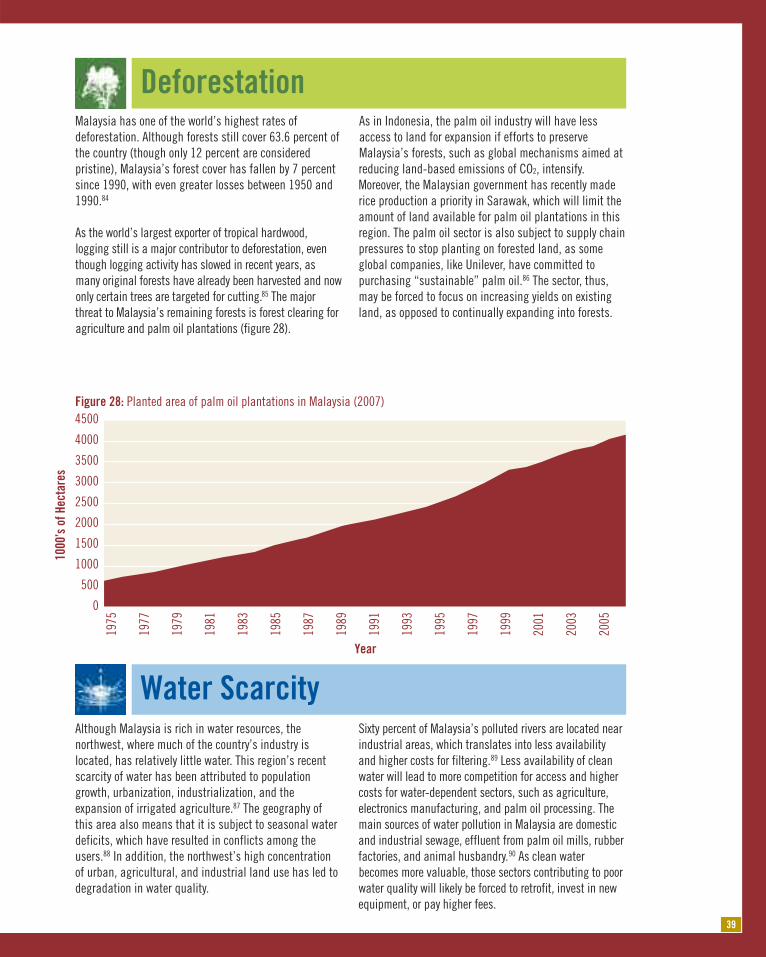
Although Malaysia is rich in water resources, thenorthwest, where much of the country’s industry islocated, has relatively little water. This region’s recentscarcity of water has been attributed to populationgrowth, urbanization, industrialization, and theexpansion of irrigated agriculture.87 The geography ofthis area also means that it is subject to seasonal waterdeficits, which have resulted in conflicts among theusers.88 In addition, the northwest’s high concentrationof urban, agricultural, and industrial land use has led todegradation in water quality.
Sixty percent of Malaysia’s polluted rivers are located nearindustrial areas, which translates into less availabilityand higher costs for filtering.89 Less availability of cleanwater will lead to more competition for access and highercosts for water-dependent sectors, such as agriculture,electronics manufacturing, and palm oil processing. Themain sources of water pollution in Malaysia are domesticand industrial sewage, effluent from palm oil mills, rubberfactories, and animal husbandry.90 As clean waterbecomes more valuable, those sectors contributing to poorwater quality will likely be forced to retrofit, invest in newequipment, or pay higher fees.
4500
4000
3500
3000
2500
2000
1500
1000
500
0
1975
1977
1979
1981
1983
1985
1987
1989
1991
1993
1995
1997
1999
2001
2003
2005
Figure 28: Planted area of palm oil plantations in Malaysia (2007)
1000
’s of H
ectares
Year
Deforestation
Water Scarcity
39
Malaysia has one of the world’s highest rates ofdeforestation. Although forests still cover 63.6 percent ofthe country (though only 12 percent are consideredpristine), Malaysia’s forest cover has fallen by 7 percentsince 1990, with even greater losses between 1950 and1990.84
As the world’s largest exporter of tropical hardwood,logging still is a major contributor to deforestation, eventhough logging activity has slowed in recent years, asmany original forests have already been harvested and nowonly certain trees are targeted for cutting.85 The majorthreat to Malaysia’s remaining forests is forest clearing foragriculture and palm oil plantations (figure 28).
As in Indonesia, the palm oil industry will have lessaccess to land for expansion if efforts to preserveMalaysia’s forests, such as global mechanisms aimed atreducing land-based emissions of CO2, intensify.Moreover, the Malaysian government has recently maderice production a priority in Sarawak, which will limit theamount of land available for palm oil plantations in thisregion. The palm oil sector is also subject to supply chainpressures to stop planting on forested land, as someglobal companies, like Unilever, have committed topurchasing “sustainable” palm oil.86 The sector, thus,may be forced to focus on increasing yields on existingland, as opposed to continually expanding into forests.

Food Security
Philippines• The population of the Philippines is 91 million, plus at
least 8 million Filipinos living outside the country. In2007, remittances from overseas Filipinos totaledUS$17 billion, or 12 percent of GDP.91
• English is the Philippines’ official language, and thecountry is the third largest English-speaking countryin the world.
• Economically, the Philippines has underperformed itsneighbors, owing to its smaller manufacturing sector,fewer exports and investments, and poorinfrastructure and governance (figure 29).
Trend
Food security
Deforestation
Climate change
Sector Impacts
Agriculture, food and beverage,farming equipment, plantations, forestproducts, construction
Agriculture, forest products, palm oil
Agriculture, food and beverage,manufacturing, power generation,transportation. oil and gas
Air pollution Automotive, manufacturing,construction
Trend
Food security
Deforestation
Climate change
Sector Affected
Agriculture, food and beverage,farming equipment, plantations, forestproducts, construction
Agriculture, forest products, palm oil
Agriculture, food and beverage,manufacturing, power generation,transportation. Oil and gas
Air pollution Automotive, manufacturing,construction, power generation, oil andgas, cement, chemical
Mining 2%
Manufacturing 22%
Electricity, gas, and water 3%
Construction 5%
Trade 15%
Agriculture 14%
Others 20%
Public administration 7%Finance 5%Transport and communications 7%
In the current crisis of rising global food prices, thePhilippines has been among the countries hardest hit,since it is the world’s largest rice importer, importingabout 10 percent of its national requirement (figure 30).
Illustrative of how serious the situation has become, thepress reports that rice hoarders can be charged witheconomic sabotage, punishable by life imprisonment.92
The Philippines’ domestic rice-growing capacity isdeclining, mostly due to land conversion, while itspopulation continues to grow.93 In response, thegovernment reportedly plans to allocate another 1.1million hectares for rice production and to provide morethan US$1 billion for fertilizer, seeds, irrigation, andinfrastructure like roads and postharvest facilities.94
In the meantime, the government will subsidize the costof imports. The country’s plan to expand and intensifyrice farming, however, may be tempered by any furtherchanges in climate.
Depending on the location of the land that thegovernment decides to allocate to agriculturalproduction, other competing users (such as constructioncompanies) will have less access to land. Meanwhile, theagricultural sector (14% of GDP), including farmers andcompanies producing fertilizer, seeds, equipment, andother supporting products, will benefit from thegovernment’s investment in, and support for, the sector.
Figure 29: Key economic sectors by percentage of GDP in the Philippines, 2007
Table 13: Key Trends in the Philippines
Source: Asian Development Bank, “Key Indicators for Asia and the Pacific 2008: Country Tables,” 2008.
EMERGING RISK Impacts of Key Environmental Trends in Emerging Asia40

Climate ChangeWith its seven thousand islands and 34,000 km ofcoastline, the Philippines is geographically vulnerable tothe effects of climate change, such as tropical cyclones,excessive rains, landslides, intense typhoons, floods,mudflows, forest fires, droughts, and a reduction inwater resources. The Philippines has given priority toadaptation measures, as opposed to mitigation, giventhat it is not responsible for a large share of globalemissions. The government has also been promotingenergy efficiency in energy-intensive sectors such astransportation and agriculture.
The sector most affected by climate change, and vital tothe country’s food security, is agriculture. Upland farmerswho rely on rainfall for their water supply will beparticularly affected by any change in rain patterns causedby climate change. Agricultural productivity, however, may
be enhanced in other areas with increased rainfall. Therewill be more severe storms, which can damage agriculturalland as well as buildings and infrastructure.
The effects of climate change may limit the potentialgrowth of the tourism sector if there is less internationalair travel and more extreme weather.95 With respect tomitigation, the government is targeting energy-intensivesectors, like power generation, transportation, andmanufacturing, for more efficiency. The government mayeven underwrite investments in more efficienttechnology. High-emissions sectors like cement andmetal processing may also be targeted for upgrades ofemissions control technology. Renewable energytechnologies, such as geothermal, would createopportunities for both investors and energy companies.96
18,000
16,000
14,000
12,000
10,000
8,000
6,000
4,000
2,000
0
1961
1964
1967
1970
1973
1976
1979
1982
1985
1988
1991
1994
1997
2000
2003
2006
Tons
(1,000
’s) o
f rice
Figure 30: Rice production and imports in the Philippines, 1961–2005
ProductionImports
41
Source: International Rice Research Institute (IRRI), “Recent Trends in the Rice Economy,” 2006.

DeforestationDeforestation in the Philippines has been severe. Once95 percent of the country was covered by forests, but nowforest cover has been reduced by an estimated 97percent, as figure 31 shows in green.97
Whereas forestry accounted for 1.7 percent of thePhilippines’ GDP in 1986, its share had fallen to a miniscule0.1 percent by 2006.98 This deforestation was caused byillegal logging and land conversion for urban use.99 Inaddition to representing lost economic opportunities—likecarbon sequestration, among other valuable uses—the lossof forests is threatening the country’s rich biodiversity asspecies lose their natural habitats.100 Other consequencesinclude increased vulnerability to floods and droughts, aswell as soil erosion and groundwater depletion.
The forestry industry in the Philippines has alreadyshrunk as a result of unsustainable logging practicesand land conversion. To preserve the country’s remainingnatural forests, the industry must engage in moresustainable practices.
42
Figure 31: The Philippines’ remaining forests, 2005
Source: Food and Agriculture Organization, “Forest Cover Map:Philippines,” 2005.
EMERGING RISK Impacts of Key Environmental Trends in Emerging Asia
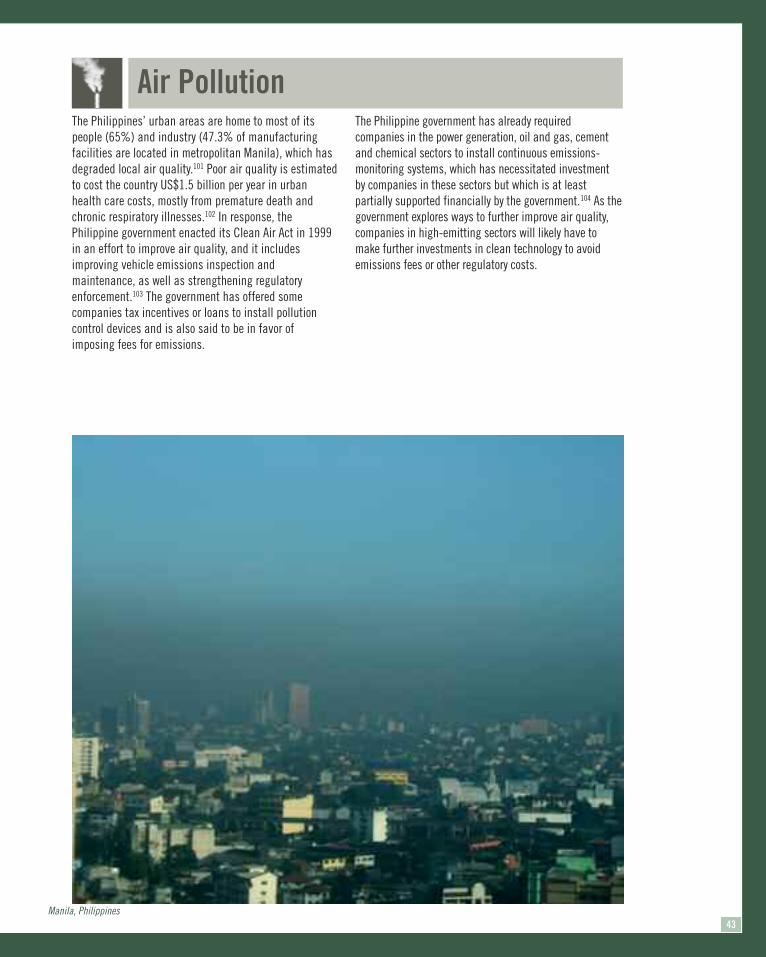
The Philippines’ urban areas are home to most of itspeople (65%) and industry (47.3% of manufacturingfacilities are located in metropolitan Manila), which hasdegraded local air quality.101 Poor air quality is estimatedto cost the country US$1.5 billion per year in urbanhealth care costs, mostly from premature death andchronic respiratory illnesses.102 In response, thePhilippine government enacted its Clean Air Act in 1999in an effort to improve air quality, and it includesimproving vehicle emissions inspection andmaintenance, as well as strengthening regulatoryenforcement.103 The government has offered somecompanies tax incentives or loans to install pollutioncontrol devices and is also said to be in favor ofimposing fees for emissions.
The Philippine government has already requiredcompanies in the power generation, oil and gas, cementand chemical sectors to install continuous emissions-monitoring systems, which has necessitated investmentby companies in these sectors but which is at leastpartially supported financially by the government.104 As thegovernment explores ways to further improve air quality,companies in high-emitting sectors will likely have tomake further investments in clean technology to avoidemissions fees or other regulatory costs.
Air Pollution
43Manila, Philippines

Thailand• Thailand’s economy (figure 32) is highly dependent on
exports, which account for more than 70 percent ofGDP, concentrated in the automobile, petrochemical,and electronics sectors. 105
• Although the Thai economy was hurt by the Asianfinancial crisis in the late 1990’s, a tsunami in 2004,and a coup in 2006, the country's economy appears tohave recovered, largely owing to exports.
Trend
Climate change
Water scarcity
Deforestation
Sector Affected
Agriculture, food and beverage,manufacturing, power generation,transportation, oil and gas
Agriculture, food and beverage, powergeneration, electronics manufacturing
Agriculture, forest products, tourism
Energy security Power generation, oil and gas, automotive
Climate Change
Mining 3%
Manufacturing 35%
Electricity, gas, and water 3%Construction 3%
Agriculture 11%
Others 13%
Public administration 5%
Finance 6%
Transport and communications 7%
Trade 14%
Figure 32: Thailand’s key economic sectors by percentage of GDP, 2007
Table 14: Key trends in Thailand
Due to both its coastal geography and its populationdistribution, Thailand is vulnerable to the effects ofclimate change. A rise in temperature and sea level willincrease the incidence of floods and droughts.
Thailand’s population is still largely rural, concentratedin the rice-growing areas of the central, northeastern,and northern regions. In fact, about a third of thepopulation lives in the northeast, an area already proneto floods and droughts but crucial to the country’s foodproduction, as it contains half the country’s rice fields.106
Accordingly, Thailand’s mitigation efforts will likely focuson the energy, forestry, and agricultural sectors andinclude changing building codes for energy efficiency,reforestation projects, energy audits for industrialmotors, and the use of mineral fertilizers.107
Thailand’s production of rice and other food is vulnerableto the effects of climate change, threatening thecountry’s self-sufficiency in rice. The largest emitters ofGHGs in Thailand are the power generation,transportation, and forestry sectors. The governmentwould likely intervene first in these sectors. In the shortterm, when equipment is replaced or processes arechanged, any mitigation efforts will raise the costs forcompanies in these sectors. In addition, changes in theweather and gas prices, as well as infrastructuredamage caused by extreme weather events, may hurt thecountry’s thriving tourism sector.
Source: Asian Development Bank, “Key Indicators for Asia and the Pacific 2008: Country Tables,” 2008.
EMERGING RISK Impacts of Key Environmental Trends in Emerging Asia44

Deforestation
Energy Security
Water Scarcity
Figure 34: Thailand’s energy mix, 2007
Figure 33: Thailand’s remaining forests, 2005
Thailand has one of Asia’s lowest annual availability ofrenewable water resources per capita, making theavailability and quality of water an importantenvironmental and economic issue.108 The northeastwhere, again, a third of the population lives and most ofthe rice is grown, suffers frequent droughts and floods.To manage the scarcity of water in these regions, expertsbelieve that Thailand will have to begin to transportwater from abundant to scarce areas. This will meanhigher costs for water in scarce regions, especially as oilprices continue to rise.109 In addition, the government islikely to implement a water demand management
strategy that would clarify the rights and liabilities ofusers and subject them to taxes.110
Thailand’s most important manufacturing sectors, suchas computers and electronics, as well as its vitalagricultural sector (11% of GDP), are highly dependenton water. Consequently, they will likely face higher water-related costs. This rise in rates will likely also encouragewater-dependent companies to invest in more water-efficient equipment and processes.
Thailand is highly dependent on fossil fuels, mostlyimported, to meet its energy needs, thereby making itvulnerable to rising oil, coal, and natural gas prices.
In 2005, the Thai government introduced its NationalEnergy Strategy to redirect the country’s energy sourcestoward renewables and to support the development ofnew technologies for energy conservation.
As Thailand expands its domestic sources, thosecompanies developing the country’s renewable energysector, as well as producing or installing energy-efficienttechnology, will likely benefit from government supportand financial incentives.
Thailand has lost a significant amount of its naturalforest cover (figure 33). In 1961, forests covered 53percent of Thailand’s land area, but now this figure is 28percent, a dramatic loss, due mainly to the conversion ofland to agricultural and urban areas and logging, bothlegal and illegal.111 Because of government intervention,the rate of deforestation has fallen to 0.6 percent peryear, but the pressures remain as Thailand continues toindustrialize and its population continues to grow.112
Most of Thailand’s forests have been lost, and thesector’s long-term viability in this country is precarious.The tourism sector is heavily reliant on the country’snatural beauty and thus also has a stake in preservingThailand’s forests.
Oil 54%Natural Gas 30%
Other Renewables 1%Hydro Electricity 2%
Coal 13
45Source: Energy Information Administration, 2007.
Source: Food and Agriculture Organization, “Forest Cover Map: Thailand,” 2005.
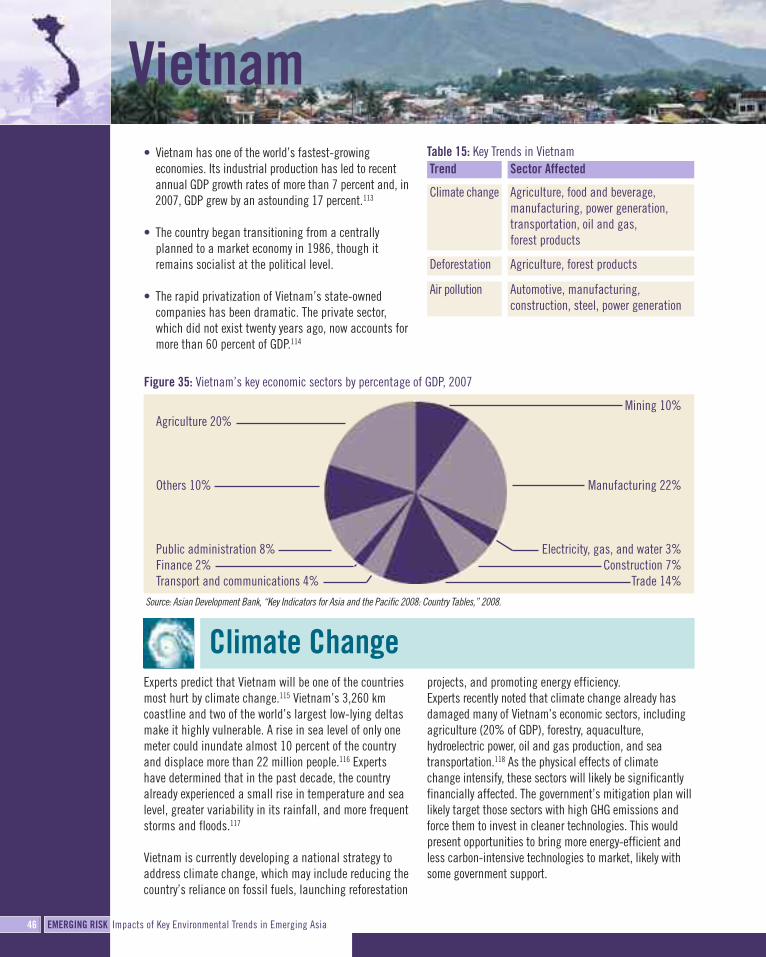
Vietnam• Vietnam has one of the world’s fastest-growing
economies. Its industrial production has led to recentannual GDP growth rates of more than 7 percent and, in2007, GDP grew by an astounding 17 percent.113
• The country began transitioning from a centrallyplanned to a market economy in 1986, though itremains socialist at the political level.
• The rapid privatization of Vietnam’s state-ownedcompanies has been dramatic. The private sector,which did not exist twenty years ago, now accounts formore than 60 percent of GDP.114
Mining 10%
Manufacturing 22%
Electricity, gas, and water 3%Construction 7%
Trade 14%
Agriculture 20%
Others 10%
Public administration 8%Finance 2%Transport and communications 4%
Figure 35: Vietnam’s key economic sectors by percentage of GDP, 2007
Trend
Deforestation
Climate change
Sector Affected
Agriculture, forest products
Agriculture, food and beverage,manufacturing, power generation,transportation, oil and gas, forest products
Air pollution Automotive, manufacturing,construction, steel, power generation
Climate ChangeExperts predict that Vietnam will be one of the countriesmost hurt by climate change.115 Vietnam’s 3,260 kmcoastline and two of the world’s largest low-lying deltasmake it highly vulnerable. A rise in sea level of only onemeter could inundate almost 10 percent of the countryand displace more than 22 million people.116 Expertshave determined that in the past decade, the countryalready experienced a small rise in temperature and sealevel, greater variability in its rainfall, and more frequentstorms and floods.117
Vietnam is currently developing a national strategy toaddress climate change, which may include reducing thecountry’s reliance on fossil fuels, launching reforestation
projects, and promoting energy efficiency.Experts recently noted that climate change already hasdamaged many of Vietnam’s economic sectors, includingagriculture (20% of GDP), forestry, aquaculture,hydroelectric power, oil and gas production, and seatransportation.118 As the physical effects of climatechange intensify, these sectors will likely be significantlyfinancially affected. The government’s mitigation plan willlikely target those sectors with high GHG emissions andforce them to invest in cleaner technologies. This wouldpresent opportunities to bring more energy-efficient andless carbon-intensive technologies to market, likely withsome government support.
Table 15: Key Trends in Vietnam
Source: Asian Development Bank, “Key Indicators for Asia and the Pacific 2008: Country Tables,” 2008.
EMERGING RISK Impacts of Key Environmental Trends in Emerging Asia46

Deforestation
Air Pollution
Rapid deforestation in Vietnam is now threatening somekey economic sectors. More than 60 percent of thecountry was originally covered by forests. Expertsestimate that deforestation - caused by war, logging,population growth, energy production, and landconversion - has lowered that figure to somewherebetween 10 to 30 percent today (figure 36).119 Inresponse to this loss, the government intends to increaseforest coverage by 5 million hectares.120
For Vietnam, a major concern is illegal logging, which hasput the global forestry industry’s long-term viability atrisk. Given the prevalence of illegal logging in Vietnam,the country’s forestry sector could lose sales as the globaldemand for legally sourced wood products rises. Butsourcing from legal plantations would increase costs andmake it difficult for the sector to maintain currentproduction rates. Plantation forestry in Vietnam isexpensive because land suitable for plantations is alreadyin use, and the remaining available land is scattered,which would increase the costs of harvest and transport.
The polluted air in Vietnam’s two main cities, Hanoi andHo Chi Minh City, is having major impacts on both theinhabitants’ health and the economy. A recent study ofHo Chi Minh City showed that more than 90 percent ofchildren under the age of five suffer from respiratoryillnesses.121 Transportation and industry are the majorcauses of air pollution, as few people take public transit(only 3% in Ho Chi Minh City) and motorbikes are thedominant form of transportation.122 Vietnam does havevehicle emission standards, but they are weak comparedwith those of developed countries.
Certain industries have been singled out as the largestsources of certain gases: construction (total suspendedparticulates), steel production (CO2), and power plants(NO2, SO2, and HC pollutants).123
If the Vietnamese government decides to address the country’sair-quality issues, these sectors would likely be targeted tomake investments in cleaner technology. Standards andmeasures already are in place to control air pollution in certainsectors. For example, construction companies face fines inHanoi for sites that create dust pollution.124
Figure 36: Vietnam’s remaining forests, 2005
47
Source: Food and Agriculture Organization, “Forest Cover Map: Vietnam”, 2005.

Corporate Environmental and Social Reporting InEmerging Asia
IV
As we have seen, the impacts of environmental degradation are already being felt in
Asia, and are increasingly relevant for companies’ bottom lines. The main vehicle for
revealing companies’ performance, and a key tool for investors, is corporate
sustainability reporting (CSR), covering environmental, social and related economic
issues. While such reporting is now commonplace in Europe, the U.S., and other
developed markets, it still lags behind in emerging economies.
In a separate study, “Undisclosed Risk: Corporate Environmental and Social
Reporting in Emerging Asia”, WRI examined the corporate environmental and social
disclosure practices of the ten largest companies (by stock market capitalization) in
India, Indonesia, Malaysia, Philippines, Thailand, and Vietnam. In this section, we
present some salient points from that study on the state of extra-financial corporate
disclosure and its integration into company valuations in our six focus countries.
EMERGING RISK Impacts of Key Environmental Trends in Emerging Asia48

The ten largest companies in each country included both multinationaland national businesses, and covered a variety of sectors ranging fromresource-based energy and gas, and mining and oil corporations toservice sector transportation, banking, and telecommunications tomanufacturing sector consumer goods. The companies were rankedaccording to a four point criteria developed by WRI which draws onguidelines from the Global Reporting Initiative125 and from theinternational consultancy SustainAbility’s Global Reporters work.126
Reporting Evaluation ResultsIndian companies had the best English language environmental and socialdisclosure, and much of it is integrated in company annual reports ratherthan in separate CSR reports (figure 37). Many of the Indian companiessurveyed are globally competitive firms. As their reporting is also intendedfor stakeholders outside the country, these companies are more likely toadopt global best practices in environmental and social reporting. Englishis also an official business language. Environmental and social reporting inIndonesia, Malaysia, Philippines, and Thailand, was limited and focusedmostly on community action and philanthropy in areas such as education,disaster relief, and public health. Vietnamese companies had the leastprogressive disclosure, with many companies providing no information ontheir environmental or social impacts.
Other Key Findings• In Asia, the concept of “corporate social responsibility” seems to be
understood largely as referring to the firm’s philanthropic activities inthe community. The content of their disclosure is likely to be moreuseful to stakeholder groups such as local communities andemployees than to investors. Part of this is due to the fact that, guidedby a collectivist and community oriented culture, Asian companies arestronger on the social aspects of the environmental, social andgovernance (ESG) agenda, and therefore have more to report on thesocial aspects.
• The majority of environmental and social information disclosed bythe sixty companies surveyed is of limited relevance to theinvestment community. It does not meet investors’ needs for timehorizons beyond 12 months, forward looking data sets, andexplanations of the materiality of environmental and social issues inbusiness terms. The lack of financially relevant information meansrelevant sustainability risks are, in effect, hidden from those whoinvest in a company’s stock.
• Environmental and social reporting in the six focus countries hasimproved in recent years through the efforts of national securitiesregulators, accounting professional associations and others.Mandatory drivers, such as stock exchange listing requirements, haveprovided a good first step. But these requirements have not beensufficiently prescriptive to result in environmental and social reportingthat meets investor needs. The business reasons for environmentaland social reporting, such as reputation, supply chain or stakeholderdemand, have been stronger drivers for quality reporting.
• Some patterns emerged among companies with above averagereporting. In many cases, either the company operates in a sectorwith high environmental risks, such as oil and gas; or, the companyis a subsidiary of a large multinational company headquartered in adeveloped country; or, the company has ambitions to competeglobally; or may be responding to supply chain reportingrequirements. In these situations, external stakeholder demandshave a high and positive impact on reporting quality.
• Each country, with the exception of Vietnam, has in place somemechanism - regulations, codes, awards, support organizations, ormarket initiatives - that encourages environmental and socialreporting. On one end of the regulatory spectrum, the Malaysianstock exchange requires all listed companies to report publicly ontheir environmental and social performance, though the form thereporting can take is flexible. On the other end, Vietnam has noregulations relating to corporate sustainability reporting.
• Overall, in all six countries, more complete reporting wouldrebalance the information dissymmetry and thereby would helpincrease the flow of capital to environmentally and sociallysustainable companies, as well as the likelihood of superiorinvestment returns for investors.
Asian Companies and Investors: Fact File
• Half the companies surveyed are concentrated in three sectors.Banks accounted for 20 percent of all companies surveyed; oiland gas and utilities each accounted for 15 percent.
• Only three of the companies surveyed are multinationals. • The majority of investors in the six focus countries’ stock
exchanges are domestic (average of 58 percent) andinstitutional (average of 74 percent).
100%
90%
80%
70%
60%
50%
40%
30%
20%
10%
0%
Figure 37: Disclosure rating for the ten largest companies in each country
Vietna
m
Malaysia
Philipp
ines
Indonesia
Thailand
India
Percen
tage
of C
ompa
nies
Surve
yed
Sources: World Resources Institute, based on evaluations of company data.
goodaverage
poornon-existant
49

Sources Consulted for this ReportFor this report, the authors reviewed an extensive number of internalsources, including WRI’s own Earth Trends and CAIT databases, andconsulted with senior WRI staff working on climate, forestry, andecosystem services. Externally, the authors primarily turned to reportsof the World Bank, ADB, IMF, UN, and IFC, as well as data from thenational stock exchanges in the six focus countries.
InternalReports• Andrew Aulisi, Amanda Sauer, Fred Wellington, “Trees in the
Greenhouse: Why Climate Change is Transforming the ForestProducts Business”, 2008.
• Ceres, Fred Wellington and Amanda Sauer, “Framing Climate Risk inPortfolio Management”, 2005.
• Citigroup Equity Research, Andrew Aulisi, Fred Wellington, “ClimaticConsequences”, 2007.
• JP Morgan Securities, Piet Klop and Fred Wellington, “Watching Water:A Guide to Evaluating Corporate Risks in a Thirsty World”, 2008.
• Craig Hanson, Janet Ranganathan, John Finisdore, Charles Iceland, “TheCorporate Ecosystem Services Review: Guidelines for IdentifyingBusiness Risks & Opportunities Arising from Ecosystem Change”, 2008.
• Donald Reed, “Stalking the Elusive Business Case for CorporateSustainability”, 2001.
• Robert Repetto and Duncan Austin, “Pure Profit: The financialimplications of environmental performance”, 2000.
• World Resources Institute, United Nations Environment Programme,World Business Council for Sustainable Development, “Tomorrow'sMarkets: Global trends and their implications for business”, 2002.
Data• Climate Analysis Indicators Tool (CAIT)• Earth Trends
ExternalReports• Asian Development Bank, “Urbanization and Sustainability in Asia,”
2006; “Food Prices and Inflation in Developing Asia: Is PovertyReduction Coming to an End?” 2008.
• Asian Development Bank and Clean Air Asia, “Country SynthesisReports on Air Quality Management,” 2006.
• ASrIA, “Taking Stock,” 2006.• European Centre for Corporate Engagement, “Use of Extra-Financial
Information by Research Analysts and Investment Managers,” March2007.
• Gordon Hagart and Ivo Knoepfel, onValues Ltd., “Emerging MarketsInvestments: Do Environmental, Social and Governance IssuesMatter?” November 2007.
• Institute for Global Environmental Strategies, “Sustainable Asia 2005and Beyond,” 2005; “Top News on the Environment in Asia,” 2008.
• Intergovernmental Panel on Climate Change, “Climate Change2007: Synthesis Report,” 2007.
• International Finance Corporation, UN Global Compact, and SwissDepartment of Foreign Affairs, “New Frontiers in Emerging MarketsInvestment: Who Cares Wins,” July 5, 2007.
• World Bank, “East Asia Environment Monitor Series,” 2003–2008.
Data• Asian Development Bank• Bombay Stock Exchange• Bursa Malaysia• Food and Agriculture Organization of the United Nations• Ho Chi Minh Stock Exchange• Indonesia Stock Exchange• International Monetary Fund• National Stock Exchange of India• Philippine Stock Exchange• Stock Exchange of Thailand• United Nations Population Division• World Bank• World Federation of Exchanges
Interviews• Viraal Balsari, Sustainable Development, ABN AMRO Bank N.V., India• Will Beloe, Program Manager for Sustainability, International Finance
Corporation (IFC) East Asia and Pacific, Philippines• Melissa Brown, Former Executive Director, ASrIA, Hong Kong• Mark Buckley, Vice President, Environmental Affairs, Staples Inc., USA• Sean Gilbert, Technical Director, Global Reporting Initiative (GRI),
Netherlands• Subir Gokarn, Chief Economist, Standard & Poor’s Asia-Pacific, India• Allan Goss, Assistant Finance Professor, Ryerson University, Canada• Ivo Knoepfel, Managing Director, onValues, Switzerland• Maria Karla Quizon, Program Manager, Environmental and SocialSustainability, International Finance Corporation (IFC), Vietnam
• Maria Fatima Reyes, Chair, Sustainability Reporting and AssuranceCommittee, Philippine Institute of Certified Public Accountant(PICPA), Philippines
• Rajesh Srivastava, Managing Director, Corporate and CommercialBanking, Rabobank India, India
• Ron Yachnin, Principal, Yachnin and Associates, Canada
50 EMERGING RISK Impacts of Key Environmental Trends in Emerging Asia

1 Economist Intelligence Unit and International Finance Corporation,survey on sustainable investing in emerging markets, forthcoming.
2 Enhanced Analytics Initiative, “Results of Extra-Financials Research,” 2007.3 CRISIL/S&P, “Standard & Poor’s ESG India Index Launched,” January 30, 2008.4 National Stock Exchange of India, “Indian Securities Market: A Review,” 2007, p.296.
5 Bursa Malaysia, “Trading Participation by Category of Investors”; available athttp://www.klse.com.my/website/bm/market_information/market_statistics/equi-ties/foreign_trading_participation.html.Indonesia Stock Exchange, “IDX Monthly Statistics May 2008”; available athttp://www.idx.co.id/.Philippine Stock Exchange, “Weekly Market Watch”; available athttp://www.pse.com.ph/html/MarketInformation/pdf/marketwatchrpts/2008/w5may2008mktwatch.pdf.Stock Exchange of Thailand, “Foreign Trading”; available at http://www.set.or.th/se-tresearch/files/frs/Table_ForeignTrade.xls?date=1995; and “Statistical Highlights ofSet”; available at http://www.set.or.th/en/market/files/200806_statistics_high-light_en.pdf?date=2008.Bombay Stock Exchange, “Investor Categorywise Turnover”; available athttp://www.bseindia.com/mktlive/market_summ/categorywise_turnover.asp.Ho Chi Minh Stock Exchange, “Foreign Trading Scale Statistic”; available athttp://www.hsx.vn/.
6 International Finance Corporation (IFC), UN Global Compact (UN GC), and Swiss De-partment of Foreign Affairs, “New Frontiers in Emerging Markets Investment: WhoCares Wins Annual Event 2007,” July 5, 2007, p. 5.
7 National Stock Exchange of India, “Indian Securities Market: A Review,” 2007, p.146.
8 Gordon Hagart and Ivo Knoepfel, onValues Ltd., “Emerging Markets Investments: DoEnvironmental, Social and Governance Issues Matter? Outcomes of a Workshop forInvestment Professionals and Academics under the Auspices of the Mistra Sustain-able Investments Platform,” November 2007.
9 Interview with Melissa Brown, Executive Director, Asria, Hong Kong, May 7, 2008.10 Interview with Ivo Knoepfel, Managing Director and Founder, onValues, May 23, 2008.11 European Centre for Corporate Engagement, “Use of Extra-Financial Information byResearch Analysts and Investment Managers,” March 2007, p. 3.
12 IFC, UN GC, and Swiss Department of Foreign Affairs, “New Frontiers in EmergingMarkets Investment,” 2007, p. 8.
13 European Centre for Corporate Engagement, “Use of Extra-Financial Information,”pp. 16–18.
14 Enhanced Analytics Initiative, “Enhance Analytics Initiative Publishes Results of ItsEighth Evaluation of Investment Research,” July 3, 2008.
15 Interview with Dr. Ivo Knoepfel, onValues Ltd., Zurich, Switzerland.16 Donald Reed, “Stalking the Elusive Case for Corporate Sustainability,” World Re-sources Institute, December 2001
17 Aswath Damodaran, Investment Valuation (New York: Wiley, 2002), p. 88.18 Fred Wellington and Amanda Sauer, “Framing Climate Risk in Portfolio Manage-ment,” World Resources Institute and Ceres, May 2005, pp. 4–5.
19 Food and Agriculture Organization (FAO), “Annex 6: Definitions and Basic Principlesof Sustainable Forest Management in Relation to Criteria and Indicators,” 2005.
20 World Bank, “Forest Law Enforcement and Governance (FLEG)—East Asia & Pacific”.21 Intergovernmental Panel on Climate Change, “Climate Change 2007: Synthesis Re-port,” 2007, p. 36.
22 Kenneth M. Chomitz et al., “At Loggerheads? Agricultural Expansion, Poverty Reduc-tion, and Environment in the Tropical Forests,” World Bank, 2007, pp. 43, 44 60, 62,64, 65, 66, 100.
23 Martin L. Parry, Osvaldo F. Canziani, Jean P. Palutikof, Paul J. van der Linden, andClair E. Hanson, eds., Contribution of Working Group II to the Third Assessment Re-port of the Intergovernmental Panel on Climate Change, (Climate Change 2007: Im-pacts, Adaptation, and Vulnerability (Cambridge: Cambridge University Press,2007), p. 175.
24 World Resources Institute, “Freshwater Resources 2005,” 2005, p. 1.25 World Resources Institute, “Climate Analysis Indicators Tool (CAIT),” 2000.
26 World Resources Institute, “What Are the Effects of Climate Change?” ; available athttp://www.wri.org/publication/content/7709.
27 United Nations Framework Convention on Climate Change (UNFCCC), “Parties to theKyoto Protocol,” 2008; available athttp://maindb.unfccc.int/public/country.pl?group=kyoto.
28 Asian Development Bank, “Food Prices and Inflation in Developing Asia: Is PovertyReduction Coming to an End?” April 2008.
29 World Bank, “Robert B. Zoellick: Sovereign Wealth Funds Should Invest in Africa,”April 2, 2008.
30 Anita Regmi, M.S. Deepak, James L. Seale Jr., and Jason Bernstein, “ChangingStructure of Global Food Consumption and Trade,” U.S. Department of Agriculture,Economic Research Service, May 2001, p. 16.
31 Asian Development Bank, “Food Prices and Inflation in Developing Asia.”32 Zachary Sugg, “Food Price Crisis Triggers Questions about Global Food Security,”World Resources Institute, April 25, 2008; available at http://www.wri.org/sto-ries/2008/04/food-price-crisis-triggers-questions-about-global-food-security#.
33 United Nations Economic and Social Commission for Asia and the Pacific (ESCAP),“Asia-Pacific Region Addresses Energy Security Challenges at ESCAP Annual Ses-sion,” April 28, 2008
34 World Health Organization. “Air quality guidelines. Global update 2005,” 2005.35 U.S. Environmental Protection Agency, “How Does PM Affect Human Health?”, 2008 ;available at http://www.epa.gov/ne/airquality/pm-human-health.html.
36 United Nations Population Division, “World Urbanization Prospects: The 2007 Revi-sion Population Database,” 2005.
37 Chris Ward, “Urbanization Legends: Is Urban Growth Part of the Problem or Part ofthe Solution?” World Resources Institute, July 3, 2007; available at http://earth-trends.wri.org/updates/node/216.
38 U.S. Census Bureau, “World POPClock Projection,” May 7, 2008; available athttp://www.census.gov/ipc/www/popclockworld.html.
39 International Monetary Fund (IMF), “World Economic Outlook Database, April 2008”;available at http://www.imf.org/external/pubs/ft/weo/2008/01/weodata/index.aspx.
40 Asian Development Bank, “India’s Economic Reforms: What Has Been Accom-plished? What Remains to Be Done?” 2001.
41 World Bank, “India: Water”, 2005; available athttp://go.worldbank.org/JERBPC3AQ0.
42 Contribution of Working Group II to the Fourth Assessment Report of the Intergovern-mental Panel on Climate Change, Climate Change 2007: Impacts, Adaptation andVulnerability (Cambridge: Cambridge University Press, 2007), p. 481.
43 World Resources Institute, “Agriculture and Food—India,” ; available athttp://earthtrends.wri.org/pdf_library/country_profiles/agr_cou_356.PDF.
44 Contribution of Working Group II to the Fourth Assessment Report of the Intergovern-mental Panel on Climate Change, Climate Change 2007, p. 493.
45 K.J. Joy, “Water Rights, Equity and Water Law Reforms,” p. 14, presentation at theInternational Environmental Law Research Centre (IELRC), Consultation on WaterRights, Equity and Water Law Reforms in India, April 19, 2008; available athttp://www.ielrc.org/activities/conference_0804/content/d0802.pdf.
46 Amelia Gentleman, “Indian State Lifts Cola Ban,” International Herald Tribune, Sep-tember 22, 2006.
47 Coca-Cola Company, “Our Water Conservation Goal,” 2008; available athttp://www.thecoca-colacompany.com/citizenship/water_pledge.html.
48 Planning Commission, Government of India, “10th Five Year Plan (2002–2007): En-ergy,” 2007, p. 759; available athttp://planningcommission.nic.in/plans/planrel/fiveyr/10th/volume2/v2_ch7_3.pdf.
49 IEA, “Petroleum Product Pricing in India—Where Have All the Subsidies Gone?” Oc-tober 2006, p. 1.
50 Thomas Fuller and Heather Timmons, “India and Malaysia Raise Price of SubsidizedFuel,” International Herald Tribune, June 4, 2008.
51 Indian Ministry of Heavy Industries and Public Enterprises, “Annual Report 2007–2008,” p. 39; available at http://dhi.nic.in/dhi0708eng.pdf.
52 World Resources Institute, “Climate Analysis Indicators Tool (CAIT): Compare Coun-tries: India and World,” 2008.
53 Contribution of Working Group II to the Fourth Assessment Report, Climate Change2007, Impacts, Adaptation and Vulnerability, p. 480; and Goldman Sachs, “BRICsand Beyond,”, 2007, p. 111.
Endnotes
51

54 Ibid.55 IMF, “World Economic Outlook Database, April 2008.”56 World Bank, “World Development Indicators Database, April 2008,” 2008.57 Bank Indonesia, “Government Explanation on Government of Indonesia Decree Re-garding the Reduction of Fuel Subsidy and Other Related Policies,” May 23, 2008.
58 John Aglionby, “Indonesia Bans Most Private Exports of Rice,” Financial Times, April15, 2008.
59 Asian Development Bank, “Asian Development Outlook 2008: Indonesia,” 2008.60 Marc Lacey, “Across Globe, Empty Bellies Bring Rising Anger,” New York Times, April18, 2008.
61 Agence France-Presse, “Indonesia Self-Sufficient in Rice: Minister,” April 15, 2008.;available at http://news.id.msn.com/regional/article.aspx?cp-documen-tid=1344652.
62 World Bank, “Environmental Issues in Indonesia,” and Energy Information Adminis-tration, “Indonesia: Environmental Issues”.
63 Matthew C. Hansen et al., “Humid Tropical Forest Clearing from 2000 to 2005 Quan-tified by Using Multi Temporal and Multi Resolution Remotely Sensed Data,” Na-tional Academy of Sciences of the USA, July 8, 2008, p. 9441.
64 World Bank, “Indonesia and Climate Change: Current Status and Policies,” 2007.65 John Aglionby, “Biofuels Drive Causes Disputes in Indonesia,” Financial Times, Feb-ruary 11, 2008.
66 Indonesia First, “Indonesia Overtakes Malaysia As Top Palm Oil Producer: Minister,”April 14, 2008; available at http://indonesiafirst.com/2008/04/indonesia-overtakes-malaysia-as-top-palm-oil-producer-minister/.
67 Telly Nathalia, “Indonesia, Brazil to Cooperate on Biofuel,” July 12, 2008.68 Fred Stolle, “A First-Hand Account of Illegal Logging in the Indonesian Rainforests,”World Resources Institute, May 6, 2008.
69 Unilever, “Palm Oil: A Sustainable Future,” 2008; available athttp://www.unilever.com/Images/Palm%20Oil%20-%20A%20Sustainable%20Fu-ture%202002_tcm13-5315.pdf.
70 Indonesia Investment Coordinating Board, “Geography & Demography,” 2008; avail-able at http://www.bkpm.go.id/en/indonesia_brief/geography.
71 World Bank, “Indonesia: Disaster Management,” 2008.72 World Bank, “Indonesia and Climate Charge: Current Status and Policies,” 2007.73 Red Cross / Red Crescent, “Case Study: Indonesia,”; available at www.climatecen-tre.org/downloads/File/RCRC_ClimateG_Indonesia.pdf.
74 Government of Indonesia’s Kecamatan Development Program and the World Bank,“Aceh Flood: Damage and Loss Assessment,” , p. ix.
75 Red Cross / Red Crescent, “Case Study: Indonesia.”76 Polya Lesova, “Jakarta Floods Hit Banks and Auto Stocks,” MarketWatch.77 UNEP, “The Environment in the News,” September 4, 2004.78 World Health Organization, “Mortality Country Fact Sheet,” 2006, p. 2; available athttp://www.who.int/whosis/mort/profiles/mort_searo_idn_indonesia.pdf; and AsianDevelopment Bank and Clean Air Initiative, “Country Synthesis Report: Indonesia,”December 2006, p. 4.
79 Asian Development Bank, “Statistical Database System Online,” 2008.80 U.S. Department of State, “Background Note: Malaysia,” December 2007; availableat http://www.state.gov/r/pa/ei/bgn/2777.htm.
81 FAO, “Malaysia: Present Status of Food Crop Production,” ; available athttp://www.fao.org/ag/agl/swlwpnr/reports/y_ta/z_my/my.htm.
82 Burton, “Sarawak to Be Rice Bowl as Import Costs Rise.”83 Malaysian Palm Oil Council, “Annual Report 2007,” p. 15.84 World Bank, “Little Green Book: Malaysia,” 2006, p. 140; and FAO, “Global ForestResources Assessment 2005 (FRA 2005): Extent of Forest and Other Wooded Land:Malaysia,” 2005.
85 World Wildlife Fund, “Peninsular Malaysian Rain Forests,”; available athttp://wwf.us/wildworld/profiles/terrestrial/im/im0146_full.html.
86 Unilever, “Palm Oil.”87 FAO, “The Malaysian Water Partnership,”; available athttp://www.fao.org/docrep/004/AB776E/ab776e02.htm.
88 FAO, “Malaysia,”; available athttp://www.fao.org/ag/agl/swlwpnr/reports/y_ta/z_my/my.htm.
89 Ibid.90 FAO, “The Malaysian Water Partnership.”91 Philippine Overseas Employment Administration, “OFW Global Presence: A Com-pendium of Overseas Employment Statistics,” 2006.
92 The Economist, “The New Face of Hunger,” The Economist, April 17, 2008.93 Asian Development Bank, “Statistical Database System Online.”94 Reuters, “Manila Says Rice Self-Sufficiency at Least 3 Years Away,” April 29, 2008.95 Interview with Will Beloe, Program Manager for Sustainability, IFC East Asia and Pa-cific. May 15, 2008.
96 Ibid.97 World Resources Institute, Earth Trends, “Forests, Grasslands, and Drylands—Philippines,” 2003.
98 Asian Development Bank, “Philippines: Critical Development Constraints,” Decem-ber 2007, p. 7.
99 World Bank, “Philippines Environment,”; 2008. 100 Ibid.101 World Bank, “World Development Indicators: Urbanization,” 2007; and Asian Devel-
opment Bank and Clean Air Initiative, “Country Synthesis Report: Philippines,” De-cember 2006, p. 2.
102 Asian Development Bank and Clean Air Initiative, “Country Synthesis Report”Philippines,” p. 12.
103 Ibid., pp. 13 and 14.104 Ibid., p. 17.105 Asian Development Bank, “Statistical Database System Online.”106 International Rice Research Institute (IRRI), “Thailand,”, 2003; available at
http://www.irri.org/science/cnyinfo/thailand.asp.107 Dr. Weerawat Chantanakome, “Review of National Communication: A Case of Thai-
land’s Climate Change Action Plan,” 2006, p. 32.108 World Bank, “Thailand Environment Monitor,” 2001.109 FAO, “Thailand’s Water Vision: A Case Study,” 2001; available at
http://www.fao.org/docrep/004/ab776e/ab776e04.htm#TopOfPage.110 Ibid.111 World Bank, “The Little Green Databook 2006: Thailand,” 2006; and World Bank,
“Thailand Environment”, 2008.112 World Bank, “The Little Green Databook 2006: Thailand.”113 Asian Development Bank, “Statistical Database System Online.”114 International Monetary Fund, “Consultative Group Meeting for Vietnam,” December
2007; available at http://www.imf.org/external/np/dm/2007/121007.htm.115 International Union for Conservation of Nature, “Viet Nam Expected to Be Hit Worst
by the Impacts of Climate Change,” May 28, 2008; available athttp://cms.iucn.org/about/union/secretariat/offices/asia/asia_where_work/viet-nam/index.cfm?uNewsID=1011.
116 Ibid.117 United Nations Development Programme, “Viet Nam’s Response to Climate
Change,” December 2007; available athttp://www.undp.org.vn/undpLive/System/Outreach/Newsroom/Feature-Details?contentId=2492.
118 Ibid.119 World Resources Institute, Earth Trends, “Forests, Grasslands, and Drylands—Viet
Nam,” 2003.120 FAO, “Global Forest Resources Assessment 2005: Vietnam,” 2005, p. 4.121 Clean Air Initiative, “Air Pollution Blamed as Study Finds Respiratory Illness Hitting
HCMC’s Children,” March 26, 2008.122 Asian Development Bank and Clean Air Initiative, “Country Synthesis Report: Viet-
nam,” December 2006, p. 2.123 Ibid., p. 5.124 Ibid., p. 15.125 The Global Reporting Initiative (GRI) pioneered the development of the world’s most
widely used sustainability reporting framework. For more information, seewww.globalreporting.org
126 SustainAbility’s Global Reporters research surveys and ranks the quality of non-fi-nancial reporting. For more information, see www.sustainability.com
52 EMERGING RISK Impacts of Key Environmental Trends in Emerging Asia

53

54 EMERGING RISK Impacts of Key Environmental Trends in Emerging Asia

About WRI The World Resources Institute (WRI) is an environmental think tankthat goes beyond research to find practical ways to protect the earthand improve people’s lives.
Our mission is to move human society to live in ways that protectEarth’s environment and its capacity to provide for the needs andaspirations of current and future generations.
Because people are inspired by ideas, empowered by knowledge, andmoved to change by greater understanding, WRI provides—andhelps other institutions provide—objective information andpractical proposals for policy and institutional change that willfoster environmentally sound, socially equitable development.
WRI organizes its work around four key goals:
People & Ecosystems: Reverse rapid degradation of ecosystemsand assure their capacity to provide humans with needed goodsand services.
Access: Empower people and support institutions to fosterenvironmentally sound and socially equitable decision-making.
Climate Protection: Protect the global climate system from furtherharm due to emissions of greenhouse gases and help humanity andthe natural world adapt to unavoidable climate change.
Markets & Enterprise: Harness markets and enterprise to expandeconomic opportunity and protect the environment.
About the International FinanceCorporation (IFC) IFC, a member of the World Bank Group, creates opportunity forpeople to escape poverty and improve their lives. We foster sus-tainable economic growth in developing countries by supportingprivate sector development, mobilizing private capital, and pro-viding advisory and risk mitigation services to businesses andgovernments. Our new investments totaled $16.2 billion in fiscal2008, a 34 percent increase over the previous year.
The Environmental and Social Sustainability Business Line of IFCworks for the large-scale adoption of business models that areprofitable, good for the environment and promote social develop-ment. Its projects address the market barriers to a sustainableprivate sector by demonstrating practices that can generate greenprofits across an entire sector.
For more information, visit www.ifc.org.
About the Authors Dana Krechowicz is an Associate in the Markets and EnterpriseProgram at the World Resources Institute. Her research focuses onidentifying financially material risks and opportunities ofsustainability trends for companies in key sectors in emergingeconomies. Dana comes most immediately from the equity analysisteam at Innovest Strategic Value Advisors, where she analyzed andrated companies’ performance on environmental, social andgovernance issues for several sectors. Her prior experience consistsof finance roles in both the private and public sectors. She holds anInternational MBA from the Schulich School of Business, YorkUniversity in Toronto, Canada, and a B.Comm. from McMasterUniversity in Hamilton, Canada.
Hiranya Fernando is a Senior Associate in the Markets andEnterprise Program at the World Resources Institute. Her researchfocuses primarily on the business and competitive implications ofenvironmental and sustainability issues such as climate changeand water scarcity. She works with several financial institutions inproviding forward-looking, applied research that translatescomplex environmental trends into financial terms useful toinvestors and companies. Previously, Hiranya worked at the WorldBank in Washington DC, and Merrill Lynch and Citigroup inSwitzerland. She holds an MBA from the Wharton School ofBusiness, and a Masters of Laws and a B.Sc. in Government &Law from the London School of Economics.
55
worldresourcesinstitute


