78
GLOBAL CONSTRUCTION PRACTICE EMERGING RISKS IN CONSTRUCTION EXPERT PERSPECTIVES ON THE CONSTRUCTION INDUSTRY

GLOBAL CONSTRUCTION PRACTICE
EMERGING RISKS IN CONSTRUCTIONEXPERT PERSPECTIVES ON THE CONSTRUCTION INDUSTRY

f PERSPECTIVES ON INNOVATION
Disruptive Technology Brings Risk and Opportunity to Infrastructure Projects
How Data and Technology Will Fuel Megacities of the Future
Construction Machines in the Digital Age
The Rising Importance of the “Secondary City”
Internal Threats: Five Ways Employees and Business Partners Put Intellectual Property (IP) and Data at Risk
f ENVIRONMENTAL IMPACTS
Spending More to Make Infrastructure Sustainable
Dramatic Drop in Global Coal Plant Construction
In the US, Renewable Energy Surpasses Nuclear Generation…For Now
f ECONOMIC IMPACTS
Preparing Bankable Infrastructure Projects
Asia Needs US$26 Trillion in Infrastructure Investment from 2016-2030
Road to Economic Growth Paved with Efficient Infrastructure Investment
Commercial Insurance Rates Continue Decline in Light of Global Market Forces
Deconstructing a Different Kind of “Nuclear Spill”
f ABOUT MARSH’S GLOBAL CONSTRUCTION PRACTICE
#2
5
9
13
17
21
24
###27
31
35
38
41
45
49
55
59
62
CONTENTS

INTRODUCTIONThe world continues to change at an increasing pace, and construction, the world's
largest global industry, is under pressure. Shortages in housing, utilities, and modern
transportation struggle to keep up with our rapidly expanding and increasingly mobile
population. Unprecedented macroeconomic and geopolitical forces are meeting financial
and environmental challenges head on, stretching the limited skills and commodities in the
construction industry. As a result, companies in this sector now need to look afresh at the
emerging risks they are facing.
The articles contained in this publication examine some of these crucial issues and aim to
provide critical insight into the risks and opportunities facing construction companies as they
navigate through the profound transformation that is under way.
These articles first appeared on BRINK – the digital news service of Marsh & McLennan
Companies’ Global Risk Center, managed by Atlantic Media Strategies. BRINK gathers timely
perspectives from experts on risk and resilience around the world to inform business and
policy decisions on critical challenges.
I hope you find Emerging Risks In Construction: Expert Perspectives on the Construction
Industry informative and valuable.
Yours sincerely,
JON MARSH
International Chairman Global Construction Practice
Marsh • 1

PERSPECTIVES ON INNOVATION

PERSPECTIVES ON INNOVATION


Marsh • 5
Perspectives on Innovation
DISRUPTIVE TECHNOLOGY BRINGS RISK AND OPPORTUNITY TO INFRASTRUCTURE PROJECTSAUTHOR: ADRIAN PELLEN, INFRASTRUCTURE SEGMENT LEADER,
US AND CANADA, CONSTRUCTION PRACTICE AT MARSH
The infrastructure industry has not typically been known for its embrace of new technology. In a recent paper,1 the World Economic Forum (WEF) attributed the industry’s relatively slow adoption of technological innovation to a number of internal and external challenges in the engineering and construction sector: “The persistent fragmentation of the industry, inadequate collaboration with suppliers and contractors, the difficulties in recruiting a talented workforce, and insufficient knowledge transfer from project to project.”
Change is inevitable and innovation is disrupting the
way we design, build, operate, and use infrastructure.
Whether it’s in civil infrastructure—roads, bridges,
pipelines, and ports—industrial infrastructure, or
social infrastructure, technological advancements
are creating efficiencies in the way we operate. While
technology adoption can help to promote sustainable
growth, there are also risks to be managed.
INNOVATION TRANSFORMS INFRASTRUCTURE DESIGNInnovation dictates that infrastructure needs to be
conceptualized and designed differently.
Consider something as basic to society as roads, and
add to that the coming of autonomous vehicles—both
for passengers and in trucking. Because autonomous
vehicles rely to a large degree on sensing technology,
we need to consider if roads, bridges, tunnels, and
other infrastructure are being designed adequately
for this new means of transportation. Beyond
efficiency gained from proper design, what are the
potential liability implications for inadequate design?
Big data and analytics have also infiltrated how
we design infrastructure. For example, building
information modeling (BIM) is realizing broader
applicability as its technology develops. Historically
used for 3D modeling in the design phase, continuing
innovations in BIM will enable faster and better
infrastructure development, as well as provide
insights into how a project will perform throughout
its life cycle, allowing a view into a project’s future risk
profile. This innovation in BIM promotes efficiency by
allowing those who design infrastructure to provide
real-time support to those building it.
Change is inevitable and innovation is disrupting the way we design, build, operate, and use infrastructure.

6 • Emerging Risks in Construction
Perspectives on Innovation
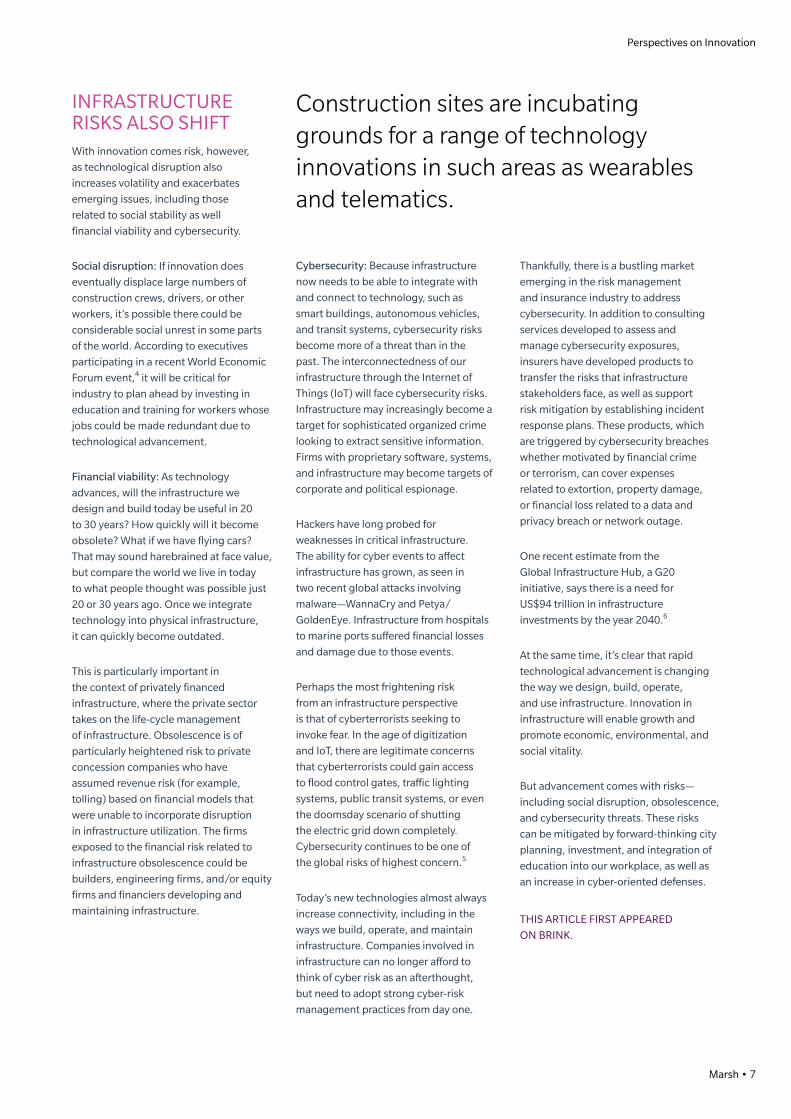
BUILDING SITES BENEFIT FROM NEW TECHNOLOGIESConstruction sites are incubating grounds for a range
of technology innovations in such areas as wearables
and telematics.
Wearable technologies, for example, are rapidly
changing the work landscape and promoting safety,
accuracy, and efficiency. Among the advancements
in construction technologies is the smart hard hat,
which allows technicians to project 3D images in the
natural environment, such as a bridge span, through
augmented reality (AR)—the same technology behind
Pokémon Go.
Enhanced safety vests borrow concepts from
vehicle telematics. These vests are equipped with
GPS and radio-communicating technology to
enhance workforce safety and prevent injuries by
warning users as they enter hazard zones.2 It’s not
hard to imagine a future in which workers wear
an exoskeleton that will improve safety, enhance
efficiency, and allow for the instantaneous exchange
of data.
Technology will also enable infrastructure to be
built by fewer humans—potentially enhancing
safety and promoting resource efficiency. Balfour
Beatty, a large international construction firm,
suggests that by 2050 some infrastructure will be
built without physical human labor.3 It is not difficult
to anticipate that in our lifetime infrastructure
will be designed and constructed using 3D
printing and installed by robots and mechanistic
devices that operate with artificial intelligence.
OPERATION AND UTILIZATION OF INFRASTRUCTURE WILL CHANGEOnce these innovative infrastructure assets become
operational, they will likely include embedded
technologies, such as the intelligent transportation
systems (ITS) used on many highways and freeways.
These incorporate a variety of technologies including
Bluetooth, video, and other wireless systems to
promote efficient traffic management, allow for toll
tracking and billing, enhance emergency response
times, and assist law enforcement. With the coming
of autonomous vehicles, it’s likely that additional
sensing technology will be needed to improve safety.
Beyond impacting how society uses and engages with
roads and other infrastructure, interconnectivity will
allow individual components to interact on an almost
“live” basis. For example, it’s anticipated that, in the
near future, individual infrastructure components will
contain monitoring technology that will provide real-
time information about their operating efficiency and
life span. When such components need replacing, the
sensors will put in the order.
There is no question that innovation in robotics,
automation, and other technology will continue
to alter the way infrastructure evolves and the way
we use it. These technologies promote efficiency,
connectivity, and sustainable growth.
Innovation dictates that infrastructure needs to be conceptualized and designed differently.
Marsh • 7
Perspectives on Innovation
INFRASTRUCTURE RISKS ALSO SHIFTWith innovation comes risk, however,
as technological disruption also
increases volatility and exacerbates
emerging issues, including those
related to social stability as well
financial viability and cybersecurity.
Social disruption: If innovation does
eventually displace large numbers of
construction crews, drivers, or other
workers, it’s possible there could be
considerable social unrest in some parts
of the world. According to executives
participating in a recent World Economic
Forum event,4 it will be critical for
industry to plan ahead by investing in
education and training for workers whose
jobs could be made redundant due to
technological advancement.
Financial viability: As technology
advances, will the infrastructure we
design and build today be useful in 20
to 30 years? How quickly will it become
obsolete? What if we have flying cars?
That may sound harebrained at face value,
but compare the world we live in today
to what people thought was possible just
20 or 30 years ago. Once we integrate
technology into physical infrastructure,
it can quickly become outdated.
This is particularly important in
the context of privately financed
infrastructure, where the private sector
takes on the life-cycle management
of infrastructure. Obsolescence is of
particularly heightened risk to private
concession companies who have
assumed revenue risk (for example,
tolling) based on financial models that
were unable to incorporate disruption
in infrastructure utilization. The firms
exposed to the financial risk related to
infrastructure obsolescence could be
builders, engineering firms, and/or equity
firms and financiers developing and
maintaining infrastructure.
Cybersecurity: Because infrastructure
now needs to be able to integrate with
and connect to technology, such as
smart buildings, autonomous vehicles,
and transit systems, cybersecurity risks
become more of a threat than in the
past. The interconnectedness of our
infrastructure through the Internet of
Things (IoT) will face cybersecurity risks.
Infrastructure may increasingly become a
target for sophisticated organized crime
looking to extract sensitive information.
Firms with proprietary software, systems,
and infrastructure may become targets of
corporate and political espionage.
Hackers have long probed for
weaknesses in critical infrastructure.
The ability for cyber events to affect
infrastructure has grown, as seen in
two recent global attacks involving
malware—WannaCry and Petya/
GoldenEye. Infrastructure from hospitals
to marine ports suffered financial losses
and damage due to those events.
Perhaps the most frightening risk
from an infrastructure perspective
is that of cyberterrorists seeking to
invoke fear. In the age of digitization
and IoT, there are legitimate concerns
that cyberterrorists could gain access
to flood control gates, traffic lighting
systems, public transit systems, or even
the doomsday scenario of shutting
the electric grid down completely.
Cybersecurity continues to be one of
the global risks of highest concern.5
Today’s new technologies almost always
increase connectivity, including in the
ways we build, operate, and maintain
infrastructure. Companies involved in
infrastructure can no longer afford to
think of cyber risk as an afterthought,
but need to adopt strong cyber-risk
management practices from day one.
Thankfully, there is a bustling market
emerging in the risk management
and insurance industry to address
cybersecurity. In addition to consulting
services developed to assess and
manage cybersecurity exposures,
insurers have developed products to
transfer the risks that infrastructure
stakeholders face, as well as support
risk mitigation by establishing incident
response plans. These products, which
are triggered by cybersecurity breaches
whether motivated by financial crime
or terrorism, can cover expenses
related to extortion, property damage,
or financial loss related to a data and
privacy breach or network outage.
One recent estimate from the
Global Infrastructure Hub, a G20
initiative, says there is a need for
US$94 trillion in infrastructure
investments by the year 2040.6
At the same time, it’s clear that rapid
technological advancement is changing
the way we design, build, operate,
and use infrastructure. Innovation in
infrastructure will enable growth and
promote economic, environmental, and
social vitality.
But advancement comes with risks—
including social disruption, obsolescence,
and cybersecurity threats. These risks
can be mitigated by forward-thinking city
planning, investment, and integration of
education into our workplace, as well as
an increase in cyber-oriented defenses.
THIS ARTICLE FIRST APPEARED
ON BRINK.
Construction sites are incubating grounds for a range of technology innovations in such areas as wearables and telematics.


Marsh • 9
Perspectives on Innovation
HOW DATA AND TECHNOLOGY WILL FUEL MEGACITIES OF THE FUTUREAUTHOR: TERRY D. BENNETT,
SENIOR INDUSTRY STRATEGIST FOR CIVIL INFRASTRUCTURE AT AUTODESK
What will cities look like by the year 2050? Will they be like those in South Korea, centered on a digitally connected retrofit of existing society?1 Will they parallel the shiny new cities of Dubai or Singapore? Or could they possibly move underground or under the oceans?2
Today, innovative cities, such as Curitiba, Brazil,3 are
rethinking entire mass-transportation strategies while
debating visions of autonomous cars and drones.4 The
most basic infrastructure needs have always been about
how people want to live and move around.
It’s also about how things move around. FedEx sees
e-commerce increasing by 26% from 2016 to US$2.4
trillion worldwide by 2018,5 which adds pressure
to upgrade roads, highways, and port/airport
infrastructure for vehicle use—autonomous
or otherwise.
Add to this mix myriad technology disruptions, such as
sensors, big data, and the Internet of Things (IoT), which
can help adjacent cities work together like cogs in a
bigger machine.
But why is that important? Planners have been
considering urbanization pressures, often in areas
with little room to increase building or infrastructure
capacity.6 One alternative is analyzing collected data
to determine how to densify corridors of population
between neighboring cities, with mass transit creating
megaregions that could easily become home to
millions more.
The challenge for cities around the world is:
How do they grow? How do they perform and
transform simultaneously?
DATA AND THE MEGACITIES OF THE FUTURENeighboring cities are coalescing in their shared
infrastructure and mutual impact of their economies.
Power lines, roads, transit, water systems, and safety
don’t stop at city limits,7 and municipalities are facing
transformation at unprecedented rates. As a result,
there’s a lot of debate about who decides the way
forward and what that looks like.
When it comes to designing infrastructure, one
thing is for sure: Big data collected through the
IoT will play a key role in growing the megacities of
2050. “Big Data is all the information around us that
is being collected in various streams,” says Steph
Stoppenhagen, smart cities business development
director for Black & Veatch. “If you use a metrocard
to get on a subway, then the system knows when you
entered, where you went, and the route you took. How
is this helpful? By recognizing if the subway service
worked. Was it successful? If so, you will do it again
and again. That is one example of using data to watch
people’s movements—creating smarter mobility.”
Not all data easily translates into useful or actionable
information, though. To address the changing urban
landscape, information itself should be seen as a form of
infrastructure—one that can be used for better planning
to connect cities within a bigger system.8
The challenge for cities around the world is: How do they grow? How do they perform and transform simultaneously?

10 • Emerging Risks in Construction
Perspectives on Innovation
The starting point is people, not technology.
Planning, design, and investment decisions—along
with supportive policymaking—can be informed and
expedited via infrastructure visualization, simulation,
and analysis. The rise of big data and advanced
modeling technology make it possible to plan and
prioritize infrastructure investment with greater
foresight, better communicate potential outcomes,
and yield measurably better results.9
Creating smart cities10 means more than using
the IoT to optimize services or communicate
information to residents. It should be a construct
used to frame local government decision-making
around city transformation.11 While 2050 seems far
off, for existing cities that must perform, transform,
and compete with brand-new cities, it’s pretty
close at hand. Cities need to evolve to develop
sustainably; improve resilience; meet citizens’
rising expectations; and attract investment, new
businesses, and talent. The good news is that data
and technology will make work and life better
by creating a well-connected community.
But smart investment and policy decisions are crucial
to planning, and moving to long-term investment
(versus grant funding) is key. To achieve that, cities
must connect:
• Projects: Developments that build toward the
unified city vision12 and meet broader economic
objectives, such as accessibility, jobs, affordable
housing, and healthy environments.
• Teams: Collaborative efforts functioning across all
levels of government to unlock public and private
infrastructure investment, leveraging big data to
track the performance of infrastructure.
• Insights: New technologies that revolutionize
how cities are planned, function, and grow
the economy by connecting everyone at
the beginning of project planning.
• Outcomes: Projects that meet planning/business-
case measures and use cost-benefit analyses to
meet economic objectives.
THE FUTURE OF PLANNING IS 3DBuilding Information Modeling (BIM) gives meaning
to the vast information available to architects and
engineers, urban citizens, and decision-makers.
Advanced 3D modeling allows people to analyze
complex information, including risks and problems
at a system-versus-asset level. What that means is
thinking about what the whole infrastructure system
is trying to accomplish versus goals of its individual
components. That information helps architects
and engineers enhance designs so individuals,
firms, and cities can meet their “smart” connected
goals, bringing neighboring cities together.
Consistent use of 3D in-context models
coupled with simulation software can create
a hypothetical but realistic scenario of the
physical infrastructure’s performance. It
establishes a concrete vision in 3D, setting the
context for discussing goals and performance
measures that everyone can understand.
Technology lets people see with both eyes open—
gaining perspective and depth—rather than with
one eye closed, which gives perspective but no
depth. The depth comes from information streaming
through technology: Information-rich models
can help stretch infrastructure investment dollars
throughout the design and construction phases.
Going forward, using 2D designs in an ever-changing
3D world won’t work. Using 3D BIM processes will be
a critical skill set to build the right infrastructure for a
megacities-of-the-future vision.
2050 seems far off, but data and technology will soon make work and life better through a well-connected community.

Marsh • 11
Perspectives on Innovation
CREATING SMART FOUNDATIONS TOGETHERCities are often overwhelmed by big data and lack the
ability to make the information actionable. A benefit
of BIM is that it can manage connections among all
the data useful for complex city design projects—from
the micro to macro level.
Through an immersive collaboration, the general
public will better understand the future of
infrastructure design. This way of stepping into,
around, and through infrastructure virtually is
becoming the norm. It aids in faster design-concept
creation, vetting, and approval, and it reduces
stakeholder pushback.
In this era of connected BIM—where information
forms the infrastructure for planning, designing, and
maintaining manufactured and natural systems—
the objective is to create integrated and resilient
infrastructure. Then, cities will be able to withstand
and recover more quickly from natural and human-
caused disasters—and grow to support their future.13
By collecting and analyzing more information,
civil engineers will better predict what’s
needed to manage bridges, roads, and other
infrastructure assets, prolonging their lifecycles.
As populations increase and demand for
infrastructure rises, future-proofing assets
must take into account true lifecycle costs.
Smart infrastructure connections at a personal,
community, metropolitan, or even national level—
underpinned by technology—provide the capability
for monitoring and measuring data. Then the analysis
of data feedback can yield positive steps to address
issues (whether through human or machine actions).
This changes the vision of cities and provides
the foundation for more holistic planning. In the
connected cities of 2050, all kinds of infrastructure—
energy, water, transportation, buildings, and
governance—will “talk” to each other to prioritize
needs, optimize performance, minimize energy use,
and make life more enjoyable and productive for the
people who live in and travel between cities.
THIS ARTICLE FIRST APPEARED ON BRINK.


Marsh • 13
Perspectives on Innovation
CONSTRUCTION MACHINES IN THE DIGITAL AGEAUTHOR: ROMED KELP
PARTNER AT OLIVER WYMAN, AND DAVID KAUFMANN, PARTNER AT OLIVER WYMAN
At first glance, giant earth-moving excavators and bulldozers would not appear to have much in common with the microchip-based worlds of drones and multi-dimensional imaging. But in the digital age, they will all be connected and have to work as a team.
Construction equipment itself has lagged in
digitization, but it is about to undergo the same
digital disruption that has hit information-based
industries and is now being felt in the automotive and
commercial-vehicle sectors.
The first wave of digitization is already arriving
in construction machines, which are becoming
increasingly automated and connected, enabling
operators to deploy them more efficiently. A bigger
change will come as construction projects go digital,
in particular through building information modeling
(BIM), which will accelerate the deployment of smart,
connected heavy machinery.
Equipment manufacturers’ success will be
determined by how effectively they apply digitized
machines in this connected ecosystem. Digitization
is not about to replace construction machines, but
customers are likely to select the equipment providers
that best execute the new digital possibilities.
NEW ERA, NEW VALUEThe changes will open up new possibilities for the
industry after a few lean years. European construction
equipment sales peaked back in 2007, while global
sales reached a high of US$102 billion in 2011 and
were just US$70 billion in 2016.1 Global demand is
expected to grow at about 5% per year until 2020, but
this will still leave construction equipment sales well
below its peak. Digitization—whether or not it boosts
sales of machinery—will give equipment makers an
opportunity to broaden their product offerings and
provide additional sources of value. Players that seize
the initiative will do better in the new era than those
that wait for change to happen.
Most of today’s construction machines track
information such as idle time and fuel consumption,
enabling managers of building sites and public-works
projects to make better decisions on the use of their
fleets. However, a first major change will come from
part or full machine autonomy going mainstream
after 2020. A compactor, for example, will be able
to adjust its operations to different surfaces and
environments, such as the presence of nearby
sensitive structures. It will also be able to carry out
much of its work automatically—or at least with
minimum human input, often remote. Predictive-data
diagnostics will make maintenance smoother and less
costly: To avoid unplanned downtime, for example,
components will be replaced before they malfunction,
but not so early as to be wasteful. Operators will also
be able to coordinate groups of machines more easily,
so that they operate as one, speeding up each phase
of a project.
The first wave of digitization is already arriving in construction machines, which are becoming increasingly automated and connected.

14 • Emerging Risks in Construction
Perspectives on Innovation
THE CONSTRUCTION SITE OF THE FUTUREThe second stage, which will begin in the early-to
mid-2020s, will take fleet coordination even further,
using operational and performance data from
equipment to help coordinate construction projects.
The construction schedule might then be adjusted
iteratively, taking into account various factors,
such as the work being done by the machines and
physical location of the machines needed for the
next stage of the work. Construction companies
could ask machine manufacturers to create
common data standards to facilitate scheduling
that involves different makes of equipment.
A third major change will come as construction
machines acquire new, highly automated capabilities
and BIM goes mainstream. BIM uses a virtual
construction site, consisting of a digital model of a
building project that includes construction schedules
and costs. The modeling enables construction
companies to implement a version of lean
production, with just-in-time delivery of materials
and components. Engineering and construction costs
are expected to be reduced by around 20% thanks to
better coordination of all the input factors.
So BIM is both a challenge for makers of construction
machines—because it demands more advanced,
digitized equipment—and a means to help customers
boost the efficiency of construction and reduce
costs. Construction equipment companies will need
to adopt and integrate a “smart construction site”
approach, where all aspects of building (including
machinery) are connected to the BIM and to each
other. And to leverage new efficiencies and reduce
costs, they will have to stop operating in silos.
Engineering and construction costs are expected to be reduced by around 20% thanks to better coordination of all the input factors.
Marsh • 15
Perspectives on Innovation
CONSTRUCTION MACHINERY FIRMS NEED TO PUSH DIGITAL SOLUTIONSEquipment manufacturers need to figure out the
best approach to succeed in this new era.
It is essential for them to digitize their machines,
so that they can be connected to the digitized
environment. But that alone will not be enough.
Digitized machines will be more transparent
to their customers in terms of performance,
breakdowns, and costs. Hence, new strategies will
have to be found to cope with this transparency.
Equipment manufacturers that limit themselves to
basic digitization might find their offerings treated
as commodities. They will provide more value if they
integrate further capabilities and fully become part
of the “smart construction site.” These could include
digital systems to schedule construction in real time
and coordinate fleet performance beyond their own
machines. Or, they could provide support services
such as drone-based monitoring of performance and
progress. Some equipment makers might try to offer
all such services in an integrated package to provide
a strong, differentiated offering and capture a large
portion of the new value pool. (See Figure 1.)
Strategic intent will not, however, be sufficient.
The new construction capabilities will generate
new competition, both from traditional rivals in the
equipment industry and from new digital players and
software systems providers. Surviving will require
quick, effective implementation of digital tools and
services, which will in turn require new skill sets.
To stay ahead—and even keep up—equipment
makers will need to engage with a world far beyond
the traditional construction site.
THIS ARTICLE FIRST APPEARED ON BRINK.
CONSTRUCTION EQUIPMENT FUNCTIONALITY• Digital data availability.
• Connectivity and interfaces.
• Automated operation.
COORDINATION• Fleet performance
optimization.
• Construction scheduling.
• Real-time coordination.
SUPPORTINGSERVICES• 3D modeling.
• Drones and
satellites.
• Databases.
Equipment manufacturers need to figure out the best approach to succeed in this new era.
Figure 1: The Future of Digitized ConstructionSource: Oliver Wyman Analysis

Disruptive Technology
16 • Emerging Risks In Shipping

Marsh • 17
Perspectives on Innovation
THE RISING IMPORTANCE OF THE “SECONDARY CITY”AUTHOR: DARRYLE ULAMA,
RESEARCH ANALYST FOR HYPERLOOP ONE
There’s a popular saying in Chinese urban geography and architecture: “If you want to understand 5,000 years of Chinese civilization, look at Xi’an, 1,000 years look at Beijing, modern China look at Tianjin.”1
This adage might surprise many readers outside of
China, as Tianjin, like many cities that don’t bear
the name Beijing or Shanghai, continues to live in
the cognitive shadow of its larger and well-known
counterparts. But this port city to Beijing has played a
pivotal economic role since the first concessions were
granted to European powers following the partial end
of the Second Opium War, effectively opening China
to foreign trade.
Today, Tianjin is among the country’s five largest
urban areas, and it is an industrial powerhouse
with a GDP per capita that is outpacing the national
average. In 2016 alone, more than 400 Beijing-based
companies opened offices in Tianjin and are expected
to invest US$23 billion in the city.2 Travel between
Tianjin and Beijing is so high that a second high-
speed rail link is currently under construction.
Urbanists take note: Secondary cities like
Tianjin will have an outsized role in the coming
decades. Intermediate cities are among the
fastest-growing and most creative places in
the world, and they’re often the economic
engines of their larger counterparts.
There are about 2,400 second-tiered cities
worldwide, and nearly two-thirds are in Africa
and Asia. Additionally, about half of all urban
dwellers live in cities with a population of fewer
than 500,000 people. Some are gateways to
global trade, while others specialize in valuable
sectors such as government administration,
resource extraction, heavy manufacturing,
and technology. Pittsburgh, Bengaluru, and
Barcelona are all must-watch secondary cities,
as are Abuja, Medellin, and Stuttgart.
Despite their more limited fiscal capacity, these
cities’ ambition to climb the ranks of world cities has
unleashed a wave of experimentation with a host of
new urban policies, financing tools, initiatives, and
partnership strategies.
There needs to be more study of the secondary
city. Information and data is often lacking, making
strategic planning and research difficult. Much of
the talk at October’s UN Habitat III conference in
Quito, Ecuador, emphasized the headwinds for
secondary cities.3 This is a shame because such cities,
armed with the right insights, could avoid the earlier
mistakes of larger metros and often act more quickly
to implement projects.
One of the highest priority projects underway, as
Tianjin has shown, is to build more connectivity as
a means to enhance competitiveness and attract
talent and investment. The method and degree of
connectivity will vary: Some cities will need to focus
first on digital infrastructure, while others must invest
in physical transport links—potentially a leapfrog
technology such as the hyperloop.
Urbanists take note: Secondary cities like Tianjin will have an outsized role in the coming decades.

18 • Emerging Risks in Construction
Perspectives on Innovation
DEFINING THE SECONDARY CITYUniversity of North Carolina professor Dennis
Rondinelli is credited with coining the term
“secondary city” in the 1980s in his research on
rural economies surrounding these cities.
The characteristics of secondary cities vary across
national contexts, and there is a lack of consensus
on its definition. Typically, the population size falls
between 10% to 50% of the country’s largest city,4
and the residents often assume administrative,
economic, or logistical roles outside of the country’s
leading metropolitan area.
Cities Alliance, a joint World Bank and
UN-Habitat initiative,5 has produced a body
of literature on secondary cities and divides
them into three spatial categories:
Subnational cities: Centers of local government,
industry, agriculture, tourism, and mining.
These cities are the most common and hold
important economic and functional roles. Think
Vancouver, Philadelphia, Basel, and Milan.
City clusters: Satellite and new town-cities
that surround larger metropolitan regions.
These settlements usually develop alongside
decentralization and firm relocation to areas less than
50 kilometers from historic city centers. The satellite
town Navi Mumbai is an example of this.
Corridors: Urban growth centers planned or
developing along major transport corridors.
These cities are among the fastest growing and
are associated with improvements in transport
infrastructure. New cities rising along the Silk Road
between Asia and Europe fall under this category.6Decision-makers all over the world are realizing the importance of connecting dominant cities with their secondary counterparts to create highly productive and competitive urban clusters.

Marsh • 19
Perspectives on Innovation
CITY LINKING AS A STRATEGY FOR GROWTHDecision-makers all over the world are realizing the
importance of connecting dominant cities with their
secondary counterparts to create highly productive
and competitive urban clusters.
“The functional federation of cities across political
borders, united by infrastructure and technology
systems, is likely to become a major feature of global
cities by the mid-twenty-first century,” says Greg
Clark of the Brookings Institution.
In New York, Governor Andrew Cuomo’s Upstate
Revitalization Initiative aims to support intra-
regional connectivity through expanded Bus Rapid
Transit lines.7 China implemented an aerotropolis-
based development strategy in Zhengzhou,
the likely birthplace of your iPhone,8 in just one
piece of its colossal New Silk Road project. An EU
report on secondary cities found that connectivity
is highly correlated with per capita GDP.9
The argument for city-to-city linking comes down
to increasing opportunities for economic exchange.
Connectivity allows secondary cities to integrate into
regional labor and investment pools and access new
supply chains and consumer markets.
City-to-city links could also lead to rebalancing
growth and mitigate the capacity burdens on larger
cities in housing and transport infrastructure. Lastly,
linked municipalities could result in more coordinated
economic and infrastructure strategies for regional
development. With the advent of the hyperloop, the
potential impacts are even greater, allowing for wider
spatial opportunities for employment and living, and
the creation of “mega-regions.”10
Several of the Hyperloop One Global Challenge
semifinalists have offered routes that connect key
secondary cities to primary cities. In South Korea, a
team has proposed to link Busan, an important port
city, to the capital, Seoul, which contains almost a
fifth of the entire country’s population. In the US, a
regional planning commission wants to link Chicago
to Columbus and Pittsburgh, creating a Midwest
megaregion. An architecture firm proposes to
connect Guadalajara to Mexico City, and a student-
led team in the UK wants to link Edinburgh to London.
These proposals demonstrate that we should take
seriously the considerations and future development
of second-tiered metro areas and promote policies
and ideas that target inter-city connections.
THIS ARTICLE FIRST APPEARED ON BRINK.

Disruptive Technology
20 • Emerging Risks In Shipping

Marsh • 21
Perspectives on Innovation
INTERNAL THREATS: FIVE WAYS EMPLOYEES AND BUSINESS PARTNERS PUT INTELLECTUAL PROPERTY (IP) AND DATA AT RISKAUTHOR: PAMELA PASSMAN,
PRESIDENT AND CEO OF CENTER FOR RESPONSIBLE ENTERPRISE AND TRADE
When a cyber-attack makes the headlines, it’s often because the perpetrators are a mystery. We imagine hackers operating out of smoky rooms in distant lands—and sometimes that turns out to be accurate.
But it is also true that the guy whose office is just down
the hall past the soda machine may be as great a threat
as a remote criminal. Insiders—company employees as
well as contractors and business partners—can present a
significant risk for misappropriation of sensitive information
and intellectual property. Whether they are operating out
of malice or ignorance, their actions can be disastrous for
company profits, reputation, and future business plans.
KEY FACTORS FUELING INSIDER RISKAccess: Many companies lack appropriate limits on
employees’ access to confidential, sensitive information—
items including customer lists and contact information,
intellectual property, and private information about
customers, employees, and business partners. In a recent
report by the independent Ponemon Institute,1 71% of “end
users” (employees on the system) said they have access to
company data they should not be able to see, and 54% of
them said that the access was frequent or very frequent.
The vast majority of IT professionals surveyed said that
their organizations don’t have a “need-to-know” policy of
managing access, or don’t strictly enforce it.
Mobility: In today’s globalized economy, professionals in
many industries have unprecedented opportunities to move
between companies and work in different countries. In an
increasingly common narrative, employees with access to
trade secrets walk out the door with reams of downloaded
documents that they aim to provide to competing
companies or foreign governments. The greatest risk comes
from employees who are disgruntled, leaving amid layoffs
or similar upheaval, or returning to their native country.
Typical of these cases is one recently reported by South
Korea’s Yonhap News Agency.2 A court in Seoul indicted
a man identified only as Kim, a high-level automotive
engineer, for passing classified documents from his former
employer to competing carmakers in China. The documents
he transferred contained details of safety and performance
testing technology that the South Korean company had
developed. There are many similar cases in a wide array
of industries.
Many companies lack appropriate limits on employees’ access to confidential, sensitive information.
22 • Emerging Risks in Construction
Perspectives on Innovation
Risky digital behavior: In the Ponemon survey, only
47% of information technology practitioners surveyed
believed that employees in their companies take
data protection seriously. That belief is supported by
the response to another question by the non-IT set:
76% of those surveyed said they saw no problem
with loading confidential documents onto their
unsecured personal computers, smart phones, and
the public cloud. By doing so, they may unwittingly
open the door to cyber theft. Another common way
that internal and supply chain employees may create
holes in security is by loading their own software
onto work computers. If that software is pirated, it
may contain malicious code designed to search their
systems for valuable data.
Accountability gap: Many companies do a
poor job of conveying their expectations around
confidentiality and security to employees and
supply chain partners. Monitoring to see whether
appropriate procedures are being followed is even
weaker. In some sense, it’s no wonder employees
are not vigilant about protecting intellectual
property and preventing cyber breaches.
Insider advantage: A combination of the
above factors and first-hand knowledge of a
company’s information system, and a failure
to monitor insider behavior lead to some
of the most damaging data breaches.
0
5
10
15
20
25
30
35
END USERIT
NONELOWMODERATEHIGHVERY HIGH
In percent, from survey of IT professionals and company end users
FIGURE 1: Is the Protection of Company Critical Information a Priority?Source: Ponemon Institute

Marsh • 23
Perspectives on Innovation
Here’s how one such case is playing out in
Japan: Police arrested 39-year-old Masaomi
Matsuzaki last July on suspicion of stealing
data linked to more than 20 million customers
of Benesse Corp., which provides education
materials and services for students.
Matsuzaki, who was working as a systems engineer
for a company affiliated with Benesse, reportedly
loaded the data onto his smartphone and then sold
it to middle men who resold it to a few hundred
other companies to exploit for marketing purposes,
according to a Kyodo news agency report.3
The case sparked outrage in Japan and a national
debate about improving privacy laws. Although the
perpetrator is now in custody, Benesse continues
to reel from the fallout. Parent company Benesse
Holdings announced in December 2014 that it was
cutting 300 jobs to compensate for an expected net
loss of between US$8.3 million and US$75 million in
the current business year because of the data breach.
Clearly, the threat from insiders cannot be remedied
with an old-fashioned firewall. It requires a solution
that is a multi-faceted, proactive approach—one
that involves IT security design as well as security
procedures, contract provisions, training, and
monitoring. These measures must be based on a clear
picture of where valuable information assets reside,
whether customer data or intellectual property.
And, importantly, a system to address security risk
posed by some insiders must be balanced with
the need to facilitate the work of the majority of
employees and partners who operate in good faith.
The digitized, fast-evolving global economy
presents unprecedented opportunities. But
capturing its possibility comes with the need
to address associated risk. Taking a systematic
approach—with dedicated strategies to address
risks posed by “insiders”, in concert with plans
to stop intrusion and associated damage by
“outsiders”—is the most pragmatic and cost-effective
way for companies to compete in this changing,
and often challenging, business environment.
THIS ARTICLE FIRST APPEARED ON BRINK.
In the Ponemon survey, only 47% of information technology practitioners surveyed believed that employees in their companies take data protection seriously.

ENVIRONMENTAL IMPACTS

ENVIRONMENTAL IMPACTS

26 • Emerging Risks In Shipping
New Demands

Marsh • 27
Environmental Impacts
SPENDING MORE TO MAKE INFRASTRUCTURE SUSTAINABLEAUTHOR: AMAL-LEE AMIN, CHIEF OF THE CLIMATE CHANGE AND SUSTAINABILITY DIVISION AT THE INTER-
AMERICAN DEVELOPMENT BANK, AND JANE AMBACHTSHEER, PARTNER, MERCER INVESTMENTS AND
MEMBER OF THE FINANCIAL STABILITY BOARD TASK FORCE ON CLIMATE RELATED FINANCIAL DISCLOSURES
“We’ll always have Paris.” On the same day that the Paris Agreement went into force, delegates attending a warm-up event in Casablanca, Morocco, before last year’s UN climate talks in Marrakesh, might have uttered that iconic line from the film Casablanca.
Yet, despite the location and timing being a perfect
match, the Casablanca reference is off-key. As the
film depicts, the protagonists may have found love
in Paris, but their predicament dictated they must
separate. In the case of the Paris Agreement—and its
alignment with the finance necessary to implement
it—this is not the end, but the start of what could be a
beautiful friendship.
The Paris Agreement has the objective of making
finance flows consistent with a pathway toward
low emission and climate-resilient development.
As countries look to boost growth while
implementing the Sustainable Development Goals
and their Paris commitments, shifting finance
flows to sustainable infrastructure is critical.1
This requires major investment in clean public
transport, smart efficient energy systems and
buildings, and the effective use of natural capital
such as forests. Studies show that such investments
could increase upfront capital costs by approximately
5%, but sustainable infrastructure should generate
lower operating costs over the life of the investment,
while also reducing risks and negative externalities,
including pollution.
The Global Commission on the Economy and
Climate estimates that the world is expected to
invest roughly US$90 trillion in infrastructure over
the next 15 years,2 a major boost from current
levels. Most countries have chronic infrastructure
deficits. In the case of Latin America and the
Caribbean, the Inter-American Development Bank
estimates that up to 5% of the region’s GDP, or
roughly US$250 billion per year, will be required
to meet future demand for infrastructure.3
In part, this deficit reflects existing barriers facing
private sector financing of sustainable infrastructure.
These include a failure on the part of governments
to develop transparent pipelines, which has led to
a poor estimation of infrastructure needs. Investors
may also be deterred by high development and
transactions costs.
Fortunately, a large number of initiatives focused on
closing the infrastructure funding gap are emerging.
The world is expected to invest US$90 trillion in infrastructure over the next 15 years, far above current levels.

28 • Emerging Risks in Construction
Environmental Impacts
The initiatives generally fall into three categories.
One set are “influencers,” which focus on thought
leadership and attempts to affect policy change.
There are also “mobilizers,” which work to develop
“bankable” projects or convene investors to facilitate
capital flows. Lastly, “tool providers” attempt to
enable integrated environmental or social analysis
of infrastructure projects into the investment and
monitoring process.
All of these industry initiatives have the potential
to play significant roles in promoting investment in
sustainable infrastructure; however, in some cases,
they appear to be working against each other.
The Paris Agreement is lauded as helping to
provide a long-term signal to investors to allocate
capital that is consistent with low-carbon and
resilient development. This signal can only
illuminate the path forward; these initiatives must
achieve far greater coherence and coordination
between them to ensure that they and the
Paris Agreement are mutually reinforcing.
The Paris Agreement is lauded as helping to provide a long-term signal to investors to allocate capital that is consistent with low-carbon and resilient development.
Marsh • 29
Environmental Impacts
FOUR STEPSTo achieve this, we propose the following steps.
First, industry initiatives need to clarify the principles
and develop shared definitions for sustainable
infrastructure investment. This can provide greater
certainty and urgency across the industry and
create a more compelling alternative to traditional
infrastructure such as coal-fired power stations,
while also enabling comparability for investors.
Second, those infrastructure initiatives that
do not consider sustainable infrastructure
should change tack and commit to sustainable
infrastructure principles through a review
of their mission and objectives.
Third, to optimize joint impact, it will be necessary to
convene the conveners and work together towards a
shared “grand plan” that sets out an effective division
of labor and the sharing of ideas between initiatives.
Fourth, collaboration should be encouraged between
initiatives sharing common missions so that,
collectively, they can work to scale-up investment.
These steps will be essential to provide investors
with the right signals and tools required to
align their investment strategies with the Paris
Agreement and Sustainable Development Goals.
Time is rapidly evaporating. With 70% of the
forecast increase in emissions from developing
countries likely to come from infrastructure that is
still to be built,4 decisions taken now will determine
whether staying well below two degrees Celsius is
viable. The time to begin that beautiful friendship
among sustainable infrastructure initiatives is
now. Our future could very well depend on it.
THIS ARTICLE FIRST APPEARED ON BRINK.
Industry initiatives need to clarify the principles and develop shared definitions for sustainable infrastructure investment.

30 • Emerging Risks In Shipping

Marsh • 31
Environmental Impacts
DRAMATIC DROP IN GLOBAL COAL PLANT CONSTRUCTIONAUTHOR: BRINK EDITORIAL STAFF
In March, US President Donald Trump signed an executive order aimed in part at shoring up the crippled coal industry.1 The move stands in stark contrast to a new report showing a steep decline in the global number of coal-fired power plants that are planned or have started construction.2
Trump’s efforts might be too little, too late, as the
fate of the coal industry has been in steady decline
for decades. Even Robert Murray, head of the largest
private US coal operation, Murray Energy, told Trump
earlier this year he should “temper his expectations”
on the promise to bring back coal jobs.3 Coal’s fate in
the US was seemingly sealed last year when natural gas
exceeded coal-fired power for the first time on an annual
basis, owing to “mainly a market-driven response to
lower natural gas prices,” according to the US Energy
Information Administration.4 Overall, the US energy
profile is in transition and the impact of the recent policy
decision on the country’s energy performance and
energy security will play out over time. Currently, the
US ranks fourth overall in terms of energy security in the
global rankings on the Energy Trilemma Index.5
On the global coal front, from January 2016 to January
2017, there was a 48% drop in planned coal plants and a
62% drop in construction starts, the report said.
The global slowdown in coal plant construction
is highlighted in the report as keeping global
warming under the two-degree Celsius target
set at the Paris Climate Summit. The slowdown
appears “to have brought global climate goals
within feasible reach, raising the prospect that the
worst levels of climate change might be avoided”
the report said. “More progress is needed and
the margin for error is tight, but the results of the
past year provide good reason for optimism.”
Figure 1: Change in the Global Coal Pipeline (Megawatts)Source: endcoal.org
ACTION JAN 2016 JAN 2017 CHANGE %
Started Construction (past 12 months) 169,704 65,041 -62
Retired (past 12 months) 36,667 27,041 -26
Pre-permit 434,180 222,055 -49
Permitted 168,230 99,367 -41
Operating 1,914,579 1,964,460 3
In Construction 338,458 272,940 -19
Completed (past 12 months) 108,029 76,922 -29
Announced 487,261 247,909 -49
Note: Includes coal-fired generating units 30 megawatt (MW) and larger. According to Platts WEPP database there are
about 27,060 MW of units smaller than 30 MW.
The global coal slowdown began in 2013. "[T]he dramatic shrinkage in the coal power pipeline … shows that power
capacity trends are moving into alignment with declining power generation and that climate goals are indeed within
reach without massive asset stranding,” the report said.

32 • Emerging Risks in Construction
Environmental Impacts
Figure 2: Proposed Coal Plants by Region, january 2017 (MW)Source: endcoal.org
REGION PRE-CONSTRCTION CONSTRUCTION ON HOLD OPERATING
Africa and Middle East 49,842 12,838 8,595 50,529
Australia/NZ 1,350 0 1,316 26,972
Canada/US 1,295 582 1,000 296,300
East Asia 167,083 161,146 451,059 1,020,335
EU28 9,360 7,468 7,050 160,722
Eurasia 9,156 980 2,200 61,914
Latin America 6,372 2,175 3,541 17,909
Non-EU Europe 75,626 2,640 19,874 49,929
SE Asia 93,499 31,808 20,992 65,948
South Asia 156,018 53,303 91,740 212,902
Total 569,601 272,940 607,367 1,964,460
On the global coal front, from January 2016 to January 2017, there was a 48% drop in planned coal plants and a 62% drop in construction starts.
Marsh • 33
Environmental Impacts
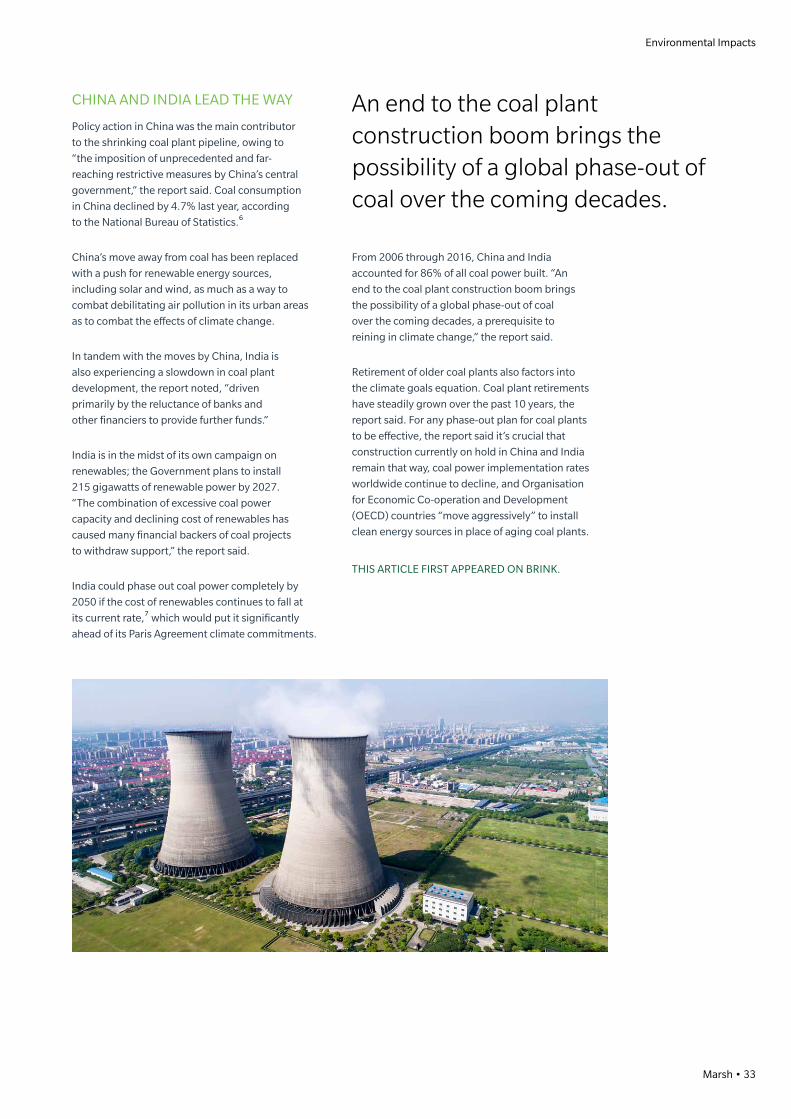
CHINA AND INDIA LEAD THE WAY
Policy action in China was the main contributor
to the shrinking coal plant pipeline, owing to
“the imposition of unprecedented and far-
reaching restrictive measures by China’s central
government,” the report said. Coal consumption
in China declined by 4.7% last year, according
to the National Bureau of Statistics.6
China’s move away from coal has been replaced
with a push for renewable energy sources,
including solar and wind, as much as a way to
combat debilitating air pollution in its urban areas
as to combat the effects of climate change.
In tandem with the moves by China, India is
also experiencing a slowdown in coal plant
development, the report noted, “driven
primarily by the reluctance of banks and
other financiers to provide further funds.”
India is in the midst of its own campaign on
renewables; the Government plans to install
215 gigawatts of renewable power by 2027.
“The combination of excessive coal power
capacity and declining cost of renewables has
caused many financial backers of coal projects
to withdraw support,” the report said.
India could phase out coal power completely by
2050 if the cost of renewables continues to fall at
its current rate,7 which would put it significantly
ahead of its Paris Agreement climate commitments.
An end to the coal plant construction boom brings the possibility of a global phase-out of coal over the coming decades.
From 2006 through 2016, China and India
accounted for 86% of all coal power built. “An
end to the coal plant construction boom brings
the possibility of a global phase-out of coal
over the coming decades, a prerequisite to
reining in climate change,” the report said.
Retirement of older coal plants also factors into
the climate goals equation. Coal plant retirements
have steadily grown over the past 10 years, the
report said. For any phase-out plan for coal plants
to be effective, the report said it’s crucial that
construction currently on hold in China and India
remain that way, coal power implementation rates
worldwide continue to decline, and Organisation
for Economic Co-operation and Development
(OECD) countries “move aggressively” to install
clean energy sources in place of aging coal plants.
THIS ARTICLE FIRST APPEARED ON BRINK.

34 • Emerging Risks In Shipping

Marsh • 35
Environmental Impacts
IN THE US, RENEWABLE ENERGY SURPASSES NUCLEAR GENERATION …FOR NOWAUTHOR: BRINK EDITORIAL STAFF
Record electric generation from wind, solar, and hydroelectric power in March and April combined to exceed that provided by nuclear sources in the US for the first time in 32 years, according to the Energy Information Administration (EIA).1
The record was the result of a rain-soaked
winter environment across much of the West
Coast that has wiped out the region’s prolonged
drought and “contributed to the overall rise in
renewable energy generation this spring, while
nuclear generation in April was at its lowest
monthly level since April 2014,” the EIA said.
However, this may not signal a long-term decrease in
nuclear power generation. The results, the EIA said,
reflect “both seasonal and trend growth in renewable
generation, as well as maintenance and refueling
schedules for nuclear plants, which tend to undergo
maintenance during spring and fall months, when
overall electricity demand is lower than in summer
or winter.”
Renewables lead over nuclear in the energy generation
race will likely be short-lived, as official EIA projections
estimate that “monthly nuclear electricity generation
will surpass renewables again during the summer
months of 2017 and that nuclear will generate more
electricity than renewables for all of 2017.” 2
In addition, nuclear power is a critical component of
a low-carbon infrastructure in the fight against rising
temperatures and climate change. “[N]uclear power
is a low-carbon technology, with overall emissions
of the same magnitude as wind or hydro electricity,”
the Organisation for Economic Co-operation and
Development (OECD) said in a report on nuclear’s
global place in the low-carbon equation to fight
climate change.3 While acknowledging there are a
host of hurdles in front of nuclear power—from societal
acceptance to financing to public policy—“in most
cases, constraining the evolution of an energy system
by limiting carbon levels in the most cost-effective
way leads to a high share of nuclear energy,” the OECD
report said.
Renewables lead over nuclear in the energy generation race will likely be short-lived.

36 • Emerging Risks in Construction
Environmental Impacts
HYDRO LEADS THE WAYThanks to a record wet winter in the West,
hydroelectric power—which remains the largest
source of renewable electricity in most months
and was at its highest level in nearly six years
this March—generated 30 billion kilowatt
hours. The EIA projects a 14% increase in
hydropower this year compared to 2016.4
Wind and solar energy increases stem from
more capacity coming online. “More than
60% of all utility-scale electricity, generating
capacity that came online in 2016, was from
wind and solar technologies,” the EIA said.5
NUCLEAR
SOLAR
WIND
BIOMASS
GEOTHERMAL
HYDRO
2012 2013 2014 2015 2016 2017
80
70
60
50
40%
30
20
10
0
FIGURE 1: Monthly Electricity Generation from Selected Fuels ( Jan 2012-Apr 2017)Source: EIA
Monthly nuclear electricity generation will surpass renewables again during the summer months of 2017, and nuclear will generate more electricity than renewables for all of 2017.

Marsh • 37
Environmental Impacts
Between March 2016 and March 2017, wind
power increased 16% and solar generation
saw a huge leap of 65%. Wind power will see a
modest increase of 8% in utility-scale generation
for 2017, the EIA said, while solar will continue
its upward trend, recording a 40% increase.
While renewable generation is increasing, nuclear
power output has remained flat since the 1990s,
the EIA said. “Retirements of a number of nuclear
plants have resulted in a slightly lower level of overall
nuclear generation capacity, and in turn, a lower level
of generation,” the EIA said.6
While fluctuations in renewable power generation
follow seasonal patterns, such fluctuations in nuclear
power reflect scheduled maintenance times, EIA
said. Accordingly, an average of 14 gigawatts and 21
gigawatts of nuclear generation went offline in March
and April, respectively, representing about 14% and
21% of total US nuclear capacity, the EIA said. THIS ARTICLE FIRST APPEARED ON BRINK.
"Retirements of a number of nuclear plants have resulted in a slightly lower level of overall nuclear generation capacity, and in turn, a lower level of generation."EIA

38 • Emerging Risks in Construction
Economic Impacts
ECONOMIC IMPACTS

Marsh • 39
Economic Impacts

40 • Emerging Risks In Shipping
Insurance Impacts

Marsh • 41
Economic Impacts
PREPARING BANKABLE INFRASTRUCTURE PROJECTSAUTHOR: FIDA RANA, SENIOR CONSULTANT, WORLD BANK AND PRINCIPAL POLICY ADVISOR AT
INTERNATIONAL INSTITUTE FOR SUSTAINABLE DEVELOPMENT
The issue of bankability of infrastructure projects has long been the topic of discussion by the development and investor community, and is one of the key problems of the global infrastructure gap.
Under German presidency, the B20 has submitted 20
recommendations to G20 leaders under the theme
“Building Resilience—Improving Sustainability—
Assuming Responsibility.”1 Recommendation 14 is
on boosting infrastructure finance and reads, “G20
members should boost infrastructure finance by
developing and promoting bankable and investment-
ready infrastructure project pipelines and by
enhancing the role of Multilateral Development Banks
as catalysts for private sector investment.”
The B20 task force on infrastructure confirms that
“the investment gap in infrastructure is not the result
of a shortage of capital. Real long-term interest rates
are low, there is ample supply of long-term finance,
interest by the private sector is high, and the benefits
are obvious.” However, a number of factors hold back
investment in terms of financing and funding. “The
main challenge is to find bankable and investment-
ready projects.”2
Unfortunately, there seems to be a lack of
understanding of what factors constitute—and more
importantly, which parties contribute the most to—
making infrastructure projects bankable. Somewhat
misleading, perhaps by the semantics of the term
“bank,” the issue of bankability tends to be associated
with bankers. The argument, “Just let the bankers
discuss and deal with the bankability aspect of the
project,” is a misconception at best.
It is important to note that commercial bankers and
other commercial infrastructure debt providers do
not make a project bankable. Rather, their task is to
assess the bankability of an infrastructure project
and, if found acceptable, provide the risk capital in
the form of debt financing. If not, they will move on in
search of other projects.
Infrastructure projects entail risks, in various forms
and shapes: preparation, bidding, construction,
and development phases. Commercial lenders,
like other risk capital providers, are concerned
about the risk profiles of the project and as such
the riskiness of their investment decisions. Unless
this group of investors, who typically provide up
to 80% of a project’s financing needs, is satisfied
with the risk profile of the project, they will not
invest. Alternatively, they would ask for various
risk mitigations or credit enhancements that
would only raise the total cost of the projects.
The fate of the bankability of an infrastructure project
is set at a much earlier phase of project life—at the
project development stage.
When the concerned ministry (or responsible agency)
starts preparing a project to roll out into the market
with an aim to attract private capital, it has to, among
many other aspects, decide on the key risk-sharing
protocol of the project. Which risks will be shared by
whom during different phases of the project, such as
pre-construction, construction, and operation?
The investment gap in infrastructure is not the result of a shortage of capital.

42 • Emerging Risks in Construction
Economic Impacts
As mentioned earlier, infrastructure finance entails
long-term engagement from banks, and the tenor
can extend as long as 15 to 20 years. Understandably,
banks want to make sure that they do not get
involved in a project that lacks a comfortable risk-
sharing protocol.
Designing an optimal risk-sharing protocol at the
project development phase is at the crux of ensuring
bankability. If the risks are not allocated to the right
parties during a project’s conceptualization phase,
the ultimate consequence is the inability to find
investors and lenders. And going back to the drawing
board for public/private partnership contract
redesigning is a costly exercise.
This brings up an interesting question: If bankers
appear at a later stage of the project cycle, how
can we ensure the bankability of a project in the
development phase? Those who are developing
the project at ministry or agency levels are not
necessarily banking experts. As such, there is
a crucial need to get bankers’ and experienced
advisors’ feedback on board as a project is being
developed. Two approaches, complementary
to each other, can play important role:
• Project Preparation Facility (PPF): PPFs are used
as a means of developing bankable, investment-
ready projects. Under PPF, both technical and/
or financial supports are provided to project
owners/concessionaires, and such supports
can cover a wide range of activities, such as
undertaking project feasibility studies, including
value for money analysis, developing procurement
documents and project concessional agreements,
undertaking social and environmental studies,
and creating awareness among the stakeholders.
PPFs can also provide financial assistance to local
governments or special public sector agencies to
support the financial, legal, and technical advisory
services required to facilitate private investment
into infrastructure projects.
Designing an optimal risk-sharing protocol at the project development phase is at the crux of ensuring bankability.

Marsh • 43
Economic Impacts
• Market Sounding: Through market sounding
exercises, important feedback from the lender
community can feed into the project preparation
phase and shape the risk allocation matrix in a
market-acceptable manner. The lending market
and the appetite of lenders can vary over time,
due to a host of factors. These include legal and
regulatory matters, global interest rate regime,
capital market conditions, etc. As such, taking
lenders’ feedback on board can be very useful to
make the project bankable.
There are specialized organizations that can conduct
market sounding through their network of banks that
are active in funding infrastructure public-private
partnership (PPP) projects. A typical market-sounding
questionnaire would ask a bank questions such as:
• Does the bank have an appetite to lend to
the particular country? Can the bank lend on
an uncovered basis or does it need an
insurance cover?
• In case of an insurance cover, what kind of
insurance instruments would the bank need to
enhance the project’s credit profile? It could be
any or a combination of partial risk guarantee
(PRG), political risk insurance (PRI), performance
guarantees, etc.
• What are the other key credit considerations such
as collateral, off-taker credit quality, supplier credit
quality, etc.?
• What could be the approximate maximum facility
and tenor for a project of this nature?
• What kinds of risks should the Government cover
for this project?
• What kind of minimum government support or
other credit enhancements are needed for the
bank to fund this project?
An infrastructure project that has risk-
sharing protocol based on broad-level early
feedback from the lending community will
likely be able to raise the required funding
with less complication than without it.
THIS ARTICLE FIRST APPEARED ON BRINK.

44 • Emerging Risks In Shipping
Insurance Impacts

Marsh • 45
Economic Impacts
ASIA NEEDS US$26 TRILLION IN INFRASTRUCTURE INVESTMENT FROM 2016-2030
AUTHOR: BRINK ASIA EDITORIAL STAFF
Developing Asia needs to invest a whopping US$26 trillion between 2016 and 2030—US$1.7 trillion per year or 5.9% of projected GDP—to meet its infrastructure requirements, according to Meeting Asia’s Infrastructure Needs, a new report by the Asian Development Bank (ADB).1
The region’s baseline requirements—without
considering costs related to climate change
mitigation and adaptation—stand at US$22.6 trillion,
or US$1.5 trillion per year (5.1% of projected GDP).
The region’s failure to make the necessary
investments in infrastructure will greatly constrain
its ability to maintain economic growth momentum,
eradicate poverty, and tackle climate change.
EASTASIA 16,0622,281
870
388
13,781
5,477
2,753
6,347
1,347
555492
73
46
SOUTHASIA
SOUTHEAST ASIA
CENTRALASIA
THEPACIFIC
(US$ billion in 2015 prices)
5.2
8.8
5.7
7.8
9.142
4
CLIMATE ADJUSTED ESTIMATESBASELINE ESTIMATES
(Investment needs as % of GDP)
The new estimates from the ADB are more than double the US$750 billion it estimated in 2009.* The inclusion of
climate-related factors has contributed majorly toward the increase. The forecast for continued rapid economic
growth, however, is a more important reason.
* The inclusion of all 45 ADB member countries in developing Asia, compared to 32 in the 2009 report, and the use of 2015 prices versus 2008 prices, also explain the increase.
Figure 1: Estimated Infrastructure Investment Needs by Region, 45 developing member countries (DMCs), 2016-2030Source: 2015 Revision of World Population Prospects, United Nations; ADB estimates
46 • Emerging Risks in Construction
Economic Impacts
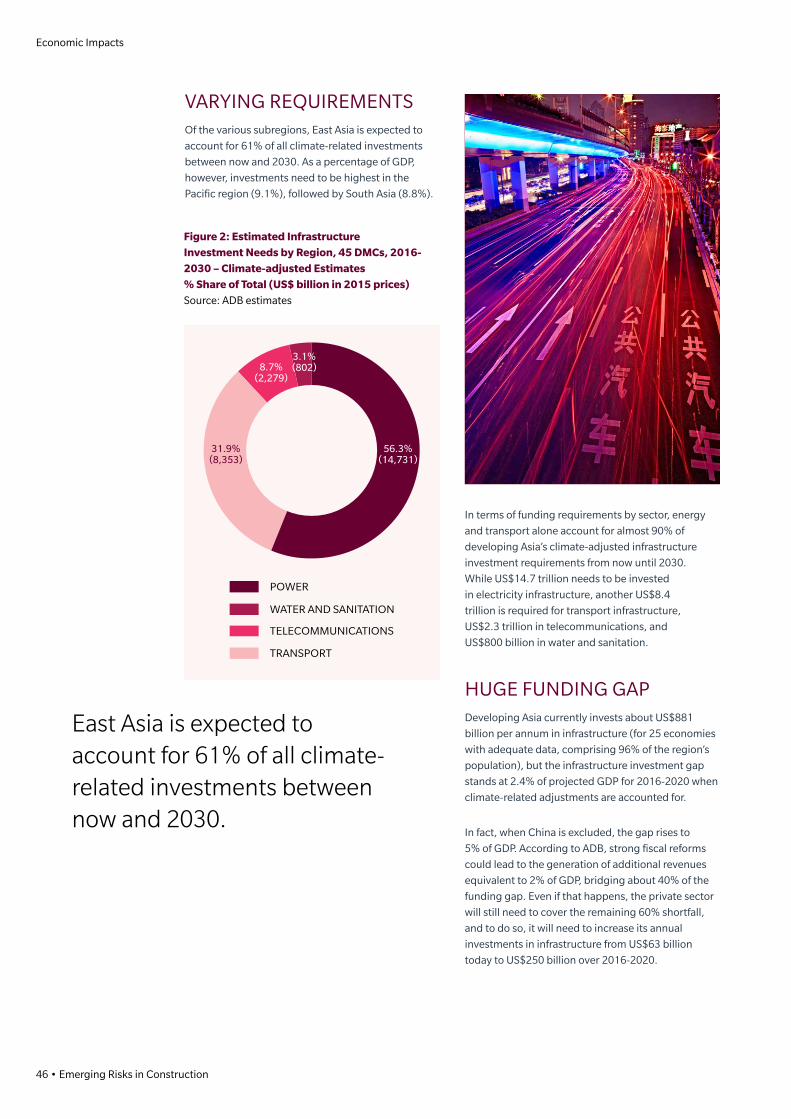
VARYING REQUIREMENTSOf the various subregions, East Asia is expected to
account for 61% of all climate-related investments
between now and 2030. As a percentage of GDP,
however, investments need to be highest in the
Pacific region (9.1%), followed by South Asia (8.8%).
In terms of funding requirements by sector, energy
and transport alone account for almost 90% of
developing Asia’s climate-adjusted infrastructure
investment requirements from now until 2030.
While US$14.7 trillion needs to be invested
in electricity infrastructure, another US$8.4
trillion is required for transport infrastructure,
US$2.3 trillion in telecommunications, and
US$800 billion in water and sanitation.
HUGE FUNDING GAPDeveloping Asia currently invests about US$881
billion per annum in infrastructure (for 25 economies
with adequate data, comprising 96% of the region’s
population), but the infrastructure investment gap
stands at 2.4% of projected GDP for 2016-2020 when
climate-related adjustments are accounted for.
In fact, when China is excluded, the gap rises to
5% of GDP. According to ADB, strong fiscal reforms
could lead to the generation of additional revenues
equivalent to 2% of GDP, bridging about 40% of the
funding gap. Even if that happens, the private sector
will still need to cover the remaining 60% shortfall,
and to do so, it will need to increase its annual
investments in infrastructure from US$63 billion
today to US$250 billion over 2016-2020.
8.7%(2,279)
3.1%(802)
31.9%(8,353)
56.3%(14,731)
WATER AND SANITATION
TELECOMMUNICATIONS
TRANSPORT
POWER
Figure 2: Estimated InfrastructureInvestment Needs by Region, 45 DMCs, 2016-2030 – Climate-adjusted Estimates% Share of Total (US$ billion in 2015 prices) Source: ADB estimates
East Asia is expected to account for 61% of all climate-related investments between now and 2030.

Marsh • 47
Economic Impacts
HOW CAN THE GAP BE FUNDED?There are various measures that can
be taken to narrow the infrastructure
funding gap in developing Asia,
according to the report.
Governments can boost public
investment in infrastructure by collecting
more revenues through improving tax
administration, borrowing prudently, and
refocusing spending by cutting energy
subsidies, for example.
Regional governments need to adopt
innovative approaches to bolster
infrastructure financing, such as “land
value capture” to finance infrastructure,
or capital recycling, which refers to the
selling of brownfield assets, auctioning
concessions, and allocating proceeds to
finance greenfield infrastructure.
Separately, the private sector
should be encouraged to play a
greater role in funding infrastructure
development, particularly in sectors
such as telecommunications and power
generation. Reforms in public finance
are expected to make up for a little less
than half of the infrastructure gap, which
means private investment has to increase
“dramatically,” according to the report.
However, doing so will require regulatory
and institutional reforms so that investing
in infrastructure becomes more attractive
to private investors. Additionally, a
pipeline of bankable projects needs to
be developed, including public-private
partnerships (PPPs). Going forward, Asian
governments need to implement PPP-
related reforms including streamlining
PPP procurement and bidding processes,
providing legal recourse to investors,
and establishing standalone government
units focused on PPPs, among others.
Finally, a deepening of capital markets
is also required so that the region’s
substantial savings can be used to fund
infrastructure investment.
AN URGENT NEED FOR ACTION“The infrastructure financing gap can’t
be fixed by any one party,” said Blair
Chalmers, a director for the Marsh &
McLennan Companies’ Singapore-
based Asia-Pacific Risk Center, which
is currently working on infrastructure
bankability issues. “There is a deeply
connected ecosystem of stakeholders
that must take action, individually and
in partnership, to achieve meaningful
progress on a topic that is of regional
importance,” Chalmers said.
While Asia’s infrastructure has improved
significantly in the past decade—
especially in areas such as electricity
generation, transportation, and telecom
and water infrastructure—and this has
resulted in strong economic growth and
a reduction in poverty, the reality is that
an ample amount still needs to be done.
More than 400 million Asians still lack
electricity, about 300 million don’t have
access to safe drinking water, and 1.5
billion lack basic sanitation facilities. In
several cases where this infrastructure
exists, it is of poor quality.
As such, Asian governments have much
to do to improving their infrastructure if
they want to continue reducing poverty
and improving the lives of their people.
THIS ARTICLE FIRST APPEARED ON
BRINK ASIA.
A. Baseline Estimates B. Climate-adjusted Estimates
*Countries include the 25 DMCs minus the People’s Republic of China; future public investments are based on the 50% fiscal space assumption.Number in brackets indicate investments as a percentage of GDP.Note: Numbers may not add up due to rounding.
FUTUREINVESTMENT
NEED
FUTUREPRIVATE
FUTUREPUBLIC
CURRENT PRIVATE
CURRENTPUBLIC
FUTUREINVESTMENT
NEED
FUTUREPRIVATE
FUTUREPUBLIC
CURRENT PRIVATE
CURRENTPUBLIC
600
INV
ESTM
ENTS
(US$
BN
IN 2
015
PR
ICES
)
INV
ESTM
ENTS
(US$
BN
IN 2
015
PR
ICES
)
500
400
300
200
100
0
600
500
400
300
200
100
0
$133
$63
$121(2.0%)
$141(2.3%)
$457(7.5%)
$133
$63
$121(2.0%)
$187(3.0%)
$503(8.2%)
Figure 3: Meeting the Investment Gaps: Selected ADB Developing Member Countries, *2016-2020 (annual averages, US$bn 2015 prices)Source: ADB(2016a); Country sources; Investment and Capital Stock Dataset, 1960-2015, IMF; Private Participation in Infrastructure
Database, World Bank; World Bank (2015a and 2015b); World Development Indicators, World Bank; ADB estimates

48 • Emerging Risks In Shipping
Insurance Impacts

Marsh • 49
Economic Impacts
ROAD TO ECONOMIC GROWTH PAVED WITH EFFICIENT INFRASTRUCTURE INVESTMENTAUTHOR: TREVOR D’OLIER-LEES, SENIOR DIRECTOR, INFRASTRUCTURE PRACTICE
AT S&P GLOBAL RATINGS SERVICES, AND MAR BELTRAN, SENIOR DIRECTOR,
INFRASTRUCTURE PRACTICE AT S&P GLOBAL RATINGS SERVICES
Investment in infrastructure is vital: Without its upkeep and development, the costs to trade and economic competitiveness will only mount.
Working together to help channel efficient
investment to infrastructure, governments and
private investors alike will need to ensure that
the risks are identified, managed, and, where
appropriate, mitigated.
INFRASTRUCTURE’S ECONOMIC BENEFITSInfrastructure investment is closely linked to
economic output. In the short term, it stimulates
demand, creating employment in construction
and related industries, such as manufacturing
and materials. In the long term, it boosts supply,
enhancing an economy’s productive capacity.
For example, a new road may facilitate more
trade, and it would likely support even more
jobs long after the project’s completion.
This is known as the “multiplier effect,” whereby
each dollar spent on infrastructure translates into
greater gains for GDP. In the US, according to S&P
Global, an additional 1% of real GDP spent on
infrastructure could boost the economy by a factor
of about 1.2. This multiplier is based on an economic
analysis conducted by S&P Global economists and
accounts for both the direct impact of infrastructure
investment in wages paid to employees hired to build
and maintain assets, as well as the indirect increase
in aggregate demand spurred by the increase in
disposable income.1 This does not include potential
productivity gains in the medium to long term from
well-thought-through projects. It’s been done before:
Eisenhower’s great interstate highway buildout in the
1950s boosted US GDP by a factor of six.
CONSEQUENCES OF INACTIONWithout adequate investment in infrastructure,
productivity could be limited and economic
growth constrained. Modernizing the US energy
grid will require an extra US$177 billion worth of
investment—until the funds are found, antiquated
power transmission and distribution infrastructure
could waste around US$25 billion each year. Another
US$160 billion is lost from vehicles sitting in traffic;
the potential unpaid bill for maintenance of road
networks is currently estimated at US$1.1 trillion.
According to the American Society of Civil Engineers
(ASCE), if measures aren’t taken to fund and repair
the country’s aging infrastructure, business could
miss out on US$7 trillion in sales by 2020, with
around US$3.9 trillion lost to GDP. This translates
into a yearly loss of US$3,400 to households and 2.5
million fewer US jobs (see Figure 1).2
In the US, an additional 1% of real GDP spent on infrastructure could boost the economy by a factor of about 1.2.

50 • Emerging Risks in Construction
Economic Impacts
Figure 1: The US Infrastructure Need in FiguresSource: S&P Global Ratings
With Europe´s economic outlook looking more
balanced geographically and across sectors, and
with more countries posting stronger growth
numbers, the spread between the fast- and slow-
growing economies in the eurozone is set to narrow
in the coming months. Governments’ ability to fund
infrastructure projects using their own balance sheets
without compromising long-term fiscal sustainability
is set to increase. To help, in late 2014 the European
Union launched the European Fund for Strategic
Investment. This is the main execution vehicle of
the Investment Plan for Europe.3 The European
Parliament is in final negotiations to increase its
capacity from an initial €21 billion to €33.5 billion.
56,007 DEFICIENTstructurally deficient bridges
US$90 BILLION needed for public transit
US$62 BILLION BACKLOGconstruction projects by US Army Corps of Engineers
US$160 BILLION LOSTsitting in traffic each year
240,000 BROKENwater main breaks
900 BILLION DISCHARGEDgallons of untreated sewage
US$25 MILLION WASTEDby antiquated power transmission and distribution per year
US$232 OVERPAIDper household annually for delayed goods
PAYING THE PRICE OF INACTION BY 2020
$ $ $US$7 TRILLIONlost in business sales
US$3.9 TRILLIONlost in gross domestic product
US$3,400 PER YEARlost by households
2.5 MILLIONfewer jobs in US
Governments’ ability to fund infrastructure projects using their own balance sheets without compromising long-term fiscal sustainability is set to increase.
81% FUNDEDUS$757 billion fundedUS$177 billion unfunded
73% FUNDEDUS$155 billion fundedUS$42 billion unfunded
59% FUNDEDUS$22 billion fundedUS$15 billion unfunded
46% FUNDEDUS$941 billion fundedUS$1.1 trillion unfunded
30% FUNDEDUS$45 billion fundedUS$105 billion unfunded

Marsh • 51
Economic Impacts
TRADITIONAL TAPPING OF PRIVATE CAPITALOne might also look to the capital markets to
foot the mounting infrastructure bill: Globally,
institutional investors such as pension funds
and insurers command about US$90 trillion,
yet they have less than 1% of their resources
invested in infrastructure. If incentivized, investors
could bring much-needed capital to the sector
through debt-financing projects—without
increasing governments’ debt-to-GDP ratios.
Partial privatization has traditionally brought this
private capital to bear: A state-owned enterprise—
perhaps an electricity transmission and distribution
network—is sold under a long-term lease, overseen
by an independent regulator. In May 2017, the New
South Wales Government in Australia sold a 50.4%
stake of electricity distributor Endeavour Energy
to a consortium of institutional, superannuation,
and sovereign wealth funds—freeing up A$7.624
billion (US$5.61 billion) for schools, hospitals, roads
and rail networks.4 The state Government retains a
49.6% interest in Endeavour Energy and will have
ongoing influence over operations as a joint investor,
lessor, licensor, and safety and reliability regulator.
Endeavour Energy will continue to be regulated by
the Australian Energy Regulator, which determines
network prices.
An alternative approach being increasingly
considered globally is “asset recycling,” in which
a greenfield project—such as a new highway—is
divided into stages of development. The higher
credit risk of earlier stages—in this case, the
highway’s construction and ramp-up risk—is
transferred to the private sector. The New South
Wales Government also announced in May the sale
of a majority stake in the M4-M5 Link, a critical road
connecting two of Sydney’s busiest highways.5
Along with an initial investment from the state
and commonwealth governments, private-sector
debt supported by toll revenue has financed the
road’s development. Effectively, the state has
been able to “recycle” its equity investment to
help fund the final stage. As Figure 2 shows, New
South Wales is the leading investor in infrastructure
among Australian states and territories.
Figure 2: Planned Gross Capital Investment in Australian Infrastructure, 2017-2021Source: New South Wales Government
73
40
40
18
10
4
4
4
A$BILLION
0 10 20 30 40 50 60 70
TASMANIA
NORTHERN TERRITORY
AUSTRALIAN CAPITALTERRITORY
SOUTHERN AUSTRALIA
WESTERN AUSTRALIA
QUEENSLAND
VICTORIA
NEW SOUTH WALES
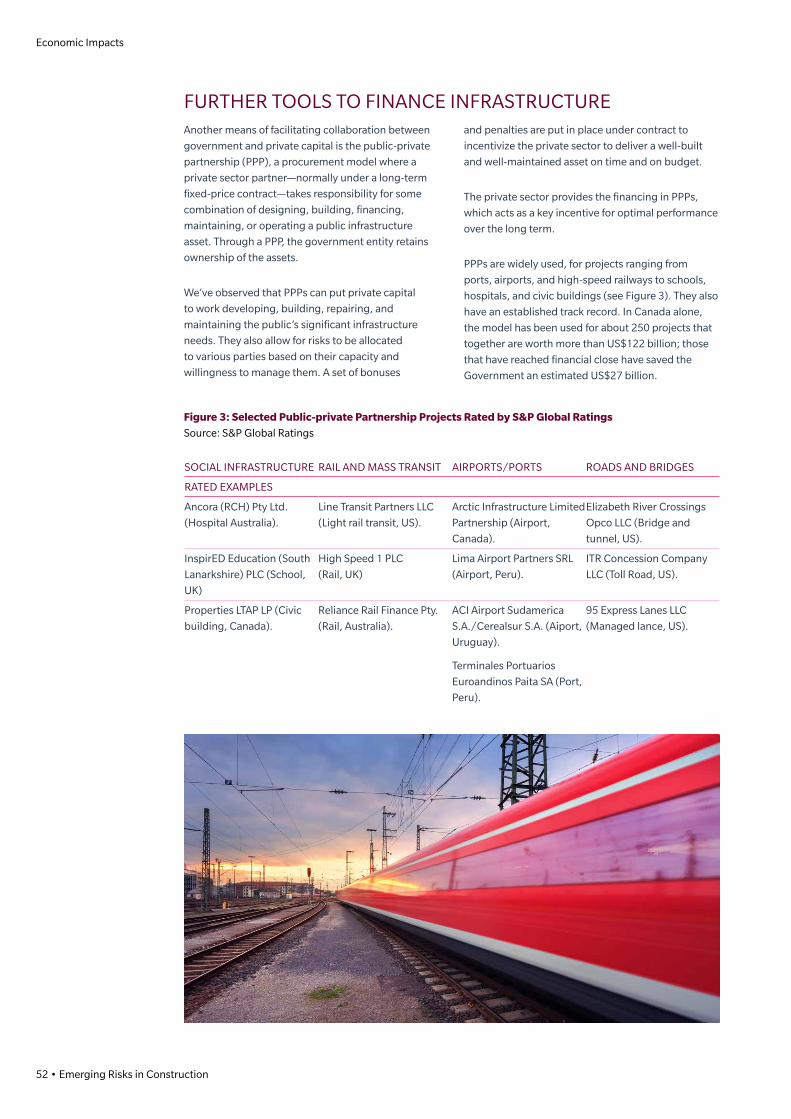
52 • Emerging Risks in Construction
Economic Impacts
FURTHER TOOLS TO FINANCE INFRASTRUCTUREAnother means of facilitating collaboration between
government and private capital is the public-private
partnership (PPP), a procurement model where a
private sector partner—normally under a long-term
fixed-price contract—takes responsibility for some
combination of designing, building, financing,
maintaining, or operating a public infrastructure
asset. Through a PPP, the government entity retains
ownership of the assets.
We’ve observed that PPPs can put private capital
to work developing, building, repairing, and
maintaining the public’s significant infrastructure
needs. They also allow for risks to be allocated
to various parties based on their capacity and
willingness to manage them. A set of bonuses
and penalties are put in place under contract to
incentivize the private sector to deliver a well-built
and well-maintained asset on time and on budget.
The private sector provides the financing in PPPs,
which acts as a key incentive for optimal performance
over the long term.
PPPs are widely used, for projects ranging from
ports, airports, and high-speed railways to schools,
hospitals, and civic buildings (see Figure 3). They also
have an established track record. In Canada alone,
the model has been used for about 250 projects that
together are worth more than US$122 billion; those
that have reached financial close have saved the
Government an estimated US$27 billion.
Figure 3: Selected Public-private Partnership Projects Rated by S&P Global RatingsSource: S&P Global Ratings
SOCIAL INFRASTRUCTURE RAIL AND MASS TRANSIT AIRPORTS/PORTS ROADS AND BRIDGES
RATED EXAMPLES
Ancora (RCH) Pty Ltd.
(Hospital Australia).
Line Transit Partners LLC
(Light rail transit, US).
Arctic Infrastructure Limited
Partnership (Airport,
Canada).
Elizabeth River Crossings
Opco LLC (Bridge and
tunnel, US).
InspirED Education (South
Lanarkshire) PLC (School,
UK)
High Speed 1 PLC
(Rail, UK)
Lima Airport Partners SRL
(Airport, Peru).
ITR Concession Company
LLC (Toll Road, US).
Properties LTAP LP (Civic
building, Canada).
Reliance Rail Finance Pty.
(Rail, Australia).
ACI Airport Sudamerica
S.A./Cerealsur S.A. (Aiport,
Uruguay).
Terminales Portuarios
Euroandinos Paita SA (Port,
Peru).
95 Express Lanes LLC
(Managed lance, US).
Marsh • 53
Economic Impacts
Investors, of course, need economies of scale
for cost-efficient financing of construction and
operations to attract capital to smaller assets. We’ve
seen separate ventures “bundled” into one larger
infrastructure entity—whether through acquisitions
of smaller utility systems by larger companies, the
securitization of municipal assets, or the bundling
of loans in state revolving funds. In North America,
courthouse, highway, school, and bridge assets have
been bundled in this way. In Spain last year, we saw
the Vela Energy project company issue €404.4 million
worth of bonds to refinance the construction debt for
a bundle of 42 solar parks nationwide.6
A sector that could especially benefit from bundling
is North America’s water system.7 The American
Water Works Association estimates the cost of
modernizing the continent’s pipe and sewer facilities
at US$1 trillion over the next 20 years. Of the 52,000
community water systems in the US, more than half
are characterized as “small” by the Environmental
Protection Agency and may struggle to find the funds
on their own.
RISKS AND CHALLENGESInfrastructure development is not without its risks.
First, infrastructure investment cannot risk being
fiscally unsustainable. Governments must develop
assets at the lowest possible costs of capital (not
just in the short term, but also across the long
term, throughout the useful life of the asset), with
funds allocated to those projects with the highest
ratio of benefits to costs. Otherwise, higher levels
of spending may simply lead to larger budget
deficits. This is a particular concern for developing
economies where, if the tax base is limited or tax
enforcement is weak, even those public investments
that could significantly boost economic growth
may not reduce budgetary pressures. Yet the most
advanced economies may still have little fiscal room
for maneuver if—like the UK, for instance—they are
already constrained by high debt-to-GDP ratios.
We have observed that a way that governments
generally transfer the payment obligation is to
follow the principle that users pay for infrastructure
services whenever feasible. Colombia, for example—
where inadequate transportation infrastructure
has impeded economic performance—is currently
relying on concessionaires to develop and operate
7,000 kilometers of new toll roads.8 Regional and
international institutional investors have provided
financing based on their view that projected traffic
volumes will underpin revenues.
A second risk to factor in is poor project preparation.
We have observed that, ideally, it is best practice for
potential projects to be carefully evaluated, planned,
and designed. Before committing capital, investors
rely on favorable conditions and transparent insights
into creditworthiness. Continued growth of the
offshore wind sector, for example, relies on projects
being able to overcome engineering, technological,
geographical, and regulatory limitations.
Projects can face a multitude of risks: unproven
technology or design, operational underperformance,
exposure to adverse demand or commodity
price movements in the markets, financially
insecure counterparties, or unfavorable regulatory
environments. In the absence of appropriate
mitigants, all these risks could invite the chance of
default. At S&P Global Ratings, we’ve noted that in
over two decades of rating project finance debt about
6.5% of projects default, with market risk having been
the most common reason, followed by technical risk.
At the same time, the median recovery rate has been
around 89%.9
On a broader scale, meanwhile, efficient
infrastructure markets generally depend on
governments outlining both clear infrastructure
needs and a long-term pipeline of projects. Just look
at Spain, where the fragmentation of responsibilities
for infrastructure planning across different levels of
government has, in some cases, resulted in resources
being invested in unfinished or unused projects, such
as the construction or upgrade of barely used airports
at Castellón, Ciudad Real, Huesca, and Lleida before
the financial crisis.10
Developing the world’s infrastructure presents as
many challenges as opportunities. With the risks
identified, managed, and appropriately mitigated, the
public and private sectors could collaborate to reap
the benefits of efficient investment.
THIS ARTICLE FIRST APPEARED ON BRINK.
Efficient infrastructure markets generally depend on governments outlining both clear infrastructure needs and a long-term pipeline of projects.

54 • Emerging Risks In Shipping
Insurance Impacts

Marsh • 55
Economic Impacts
COMMERCIAL INSURANCE RATES CONTINUE DECLINE IN LIGHT OF GLOBAL MARKET FORCESAUTHOR: CLAUDE D. YODER, HEAD OF GLOBAL ANALYTICS AT MARSH
The halfway point in the 2017 fiscal year marked the seventeenth consecutive quarter in which global commercial insurance pricing declined, on average, according to the Marsh Global Insurance Market Index.
It was also the sixth straight quarter in which the rate
of pricing decline moderated, according to the index,
which is a proprietary benchmark of commercial
insurance premium rate change at renewal,
representing the world’s major insurance markets
and comprising over 90% of Marsh’s premium.
Among the index’s regional highlights, the Pacific
showed an increase in average pricing in the second
quarter, with average property rates in the region
increasing for the first time since 2013. The index’s
overall decline is largely due to the continuation of
significant capacity in the global insurance market
and a competitive underwriting environment.
CAPACITY AND CATASTROPHESAlong with the amount of capacity and attendant
competitive underwriting environment, insurance
pricing has been affected by an absence of significant
catastrophe losses in recent years. Insured global
natural catastrophe losses totalled US$19.5 billion
in the first half of 2017, according to Munich Re.1
Those losses compare to an annual average of US$29
billion for the corresponding six-month periods of
the last 10 years, according to the Munich Re data.
Q1
12
Q2
12
Q3
12
Q4
12
Q1
13
Q2
13
Q3
13
Q4
13
Q1
14
Q2
14
Q3
14
Q4
14
Q1
15
Q2
15
Q3
15
Q4
15
Q1
16
Q2
16
Q3
16
Q4
16
Q1
17
1.000 1.004 1.007 1.010 1.010 1.008 1.005 1.001 0.994 0.9980.977
0.9670.956
0.9440.932
0.9230.915
0.908 0.901 0.895
Q2
17
0.890
1.011
Figure 1: Global Insurance Market IndexSource: Marsh Global Analytics
The Marsh Global Insurance Market Index captures a rolling four-quarter view of rate movement, providing a
quarter-to-quarter look at changes in the marketplace. The rate change captures year-over-year rate movement,
measured quarterly.

56 • Emerging Risks in Construction
Economic Impacts
AVERAGE CASUALTY INSURANCE RATES DECLINE
Insurance rates in the second quarter declined globally, on
average, across all major product lines— property, casualty,
and financial and professional coverages. The global casualty
composite index was the one area in which the rate of pricing
decline was higher in the second quarter compared to the first,
driven by the US market.
The change in US casualty lines was largely due to an increase in
the average rate of decline in workers’ compensation pricing and
a smaller, continuing increase in average auto liability pricing.
General liability renewal rates also declined in the second quarter,
after posting slight increases in the previous quarter.
In the UK, composite insurance rate decreases in the second
quarter of 2017 remained, on average, greater than the global
rate of decline. The average rate of decline for the UK was 4.2%
in the second quarter, compared to 4.8% in the prior quarter.
Renewal rates declined in the UK across all major product lines,
although the average rate of decline moderated in casualty from
4.2% to 1.7%.
Also in the second quarter:
• In Latin America, average casualty insurance rates
increased for the fourth consecutive quarter.
• In continental Europe, property pricing, on average, declined
at the lowest rate since the fourth quarter of 2014.
GLOBAL PROPERTY
Q4 16
-4.2%
-3.6%
-2.8%-3.0%
-2.6%-2.8%
-1.9%
-0.6%
-1.7%
Q1 17 Q2 17 Q4 16 Q1 17 Q2 17 Q4 16 Q1 17 Q2 17
GLOBAL CASUALTY GLOBAL FINPRO
Figure 3: Global Composite Insurance Rate Change by Coverage Line Source: Marsh Global Analytics
Q1
12
Q2
12
Q3
12
Q4
12
Q1
13
Q2
13
Q3
13
Q4
13
Q1
14
Q2
14
Q3
14
Q4
14
Q1
15
Q2
15
Q3
15
Q4
15
Q1
16
Q2
16
Q3
16
Q4
16
Q1
17
Q2
17
1.2%1.4% 1.4%
1.2%
0.3%
-0.4%-0.7%
-1.0%
-1.6%
-2.7% -2.8%
-4.2% -4.2%-4.4%
-4.8%-5.0%
-3.8%-3.6%
-3.2% -3.1%
-2.3% -2.2%
Figure 2: Global Insurance Composite Rate ChangeSource: Marsh Global Analytics

Marsh • 57
Economic Impacts
US CYBER LIABILITY RENEWAL RATES DECREASE FOR SECOND QUARTER IN A ROWUS cyber liability rates decreased 1.5% on average, in the second quarter of 2017 - the first time since 2012 that
average cyber rates declined for two consecutive quarters. As in other lines, overall capacity is increasing as new
insurers enter and existing ones expand their capacity levels.
At the same time, rate improvement continues in the sectors that were most affected by cyber events in recent
years. As cybersecurity investments from these firms take effect and the claims environment improves, the
general unwinding of historic cyber insurance rate increases is reducing overall market rate change, on average.
We will watch closely in the coming months to see what, if any, impact recent high-profile events—including the
WannaCry and Petya/GoldenEye malware attacks—have on the cyber insurance markets.
Q1
12
6.8%
-2.4%
-0.3%
0.1%
5.4%
0.4% 0.2%
3.3%4.1%
-0.8%
4.8%
12.8%
19.1%20.0%
18.7%
16.9%
12.0%
6.9%
5.2%
1.4%
-1.7% -1.5%
US
CY
BER
LIA
BIL
ITY
Q2
12
Q3
12
Q4
12
Q1
13
Q2
13
Q3
13
Q4
13
Q1
14
Q2
14
Q3
14
Q4
14
Q1
15
Q2
15
Q3
15
Q4
15
Q1
16
Q2
16
Q3
16
Q4
16
Q1
17
Q2
17
Figure 4: US Cyber Liability Renewal RatesSource: Marsh Global Analytics
THIS ARTICLE FIRST APPEARED ON BRINK.

58 • Emerging Risks In Shipping
Insurance Impacts

Marsh • 59
Economic Impacts
DECONSTRUCTING A DIFFERENT KIND OF “NUCLEAR SPILL”AUTHOR: MARK POLLARD, GLOBAL PRACTICE LEADER NUCLEAR AND RENEWABLE ENERGY AT MARSH
Just as technology from space travel has spilled into our kitchens and garages, a sort of “nuclear spill” is going on, too. The process of nuclear decommissioning, and the methodology behind developing adequate funding where regulators and civil society opinion allow no slack, can find application in many energy and industrial contexts.
Planners of new nuclear projects are obsessed
with detail. Investors, equipment manufacturers,
plant operators, and regulators alike leave nothing
to chance. Nuclear safety and ensuring returns
on investment drive the rigor; every aspect of the
planning, construction, operation, and ultimately
dismantling is defined, configured, integrated, and
stress tested beyond doubt.
Construction period and cost overruns, for which
new nuclear projects are well-known, have usually
been due to inadequate definition of design and
construction methodologies or the application of yet
more layers of regulatory attention.
Decommissioning is an important part of this rigor;
detailed plans need to be made about how it will be
carried out, what the timing is, what the costs will
be, and how those costs will be funded. The focus on
decommissioning is relatively recent; a consequence
of legacy costs passed to the present generation from
past decades, when environmental and regulatory
considerations were less stringent. Action needs to be
taken today on behalf of future generations.
The job is simple to define, but devilish to execute:
Model the expected decommissioning costs
annualized over the decades necessary to complete
the process, understand the volatilities in the model,
and then match a funding plan to optimize the
investment returns while retaining enough flexibility
in the cash-out period to allow for the volatilities.
The world is full of infrastructure where the future
decommissioning is unfunded or underfunded.
Power stations, oil rigs, mines, and even solar farms
will need to be removed sooner or later, and future
costs on balance sheets will embarrass managers
and disgruntle shareholders. In some cases, the costs
won’t be met, and the infrastructure will rot and rust
until the taxpayer steps in.
Construction period and cost overruns, for which new nuclear projects are well-known, have usually been due to inadequate definition of design and construction methodologies or the application of yet more layers of regulatory attention.

60 • Emerging Risks in Construction
Economic Impacts
FINDING FUNDING FOR THE LONG RUNFortunately, few decommissioning tasks are as
lengthy or as complicated as nuclear projects so
the first part of the job is simpler; the annualized
decommissioning cost model will be more
straightforward and less volatile. But the second
part, matching a funding mechanism for existing
assets, will often have the additional complexity of
a short (or even nonexistent) residual life during
which revenue can be harvested to feed the fund.
In these circumstances, the optimization of the
fund resources, including top-ups needed to meet
the overall projected costs, becomes even more
important to protect shareholders from shouldering
costs from the past and managers from having to
plunder current revenue.
In many cases a portfolio can be constructed, so
the funding flexibility is improved. Putting together
future decommissioning obligations, at different
times and for different asset types, enhances the fund
manager’s options to keep more assets locked into
better returns for a longer period of time.
In some cases existing funds or vehicles, for example,
captive insurance companies, can be used to create
an integrated funding solution that leaves fund
security intact but improves investment returns and
long-term financial sustainability.
What goes up must come down. The need to
decommission should be entirely predictable from
the outset of any infrastructure project. But more
often than not, the costs are underestimated: The
now defunct UK Department of Energy and Climate
Change estimated that oil and gas decommissioning
costs on the UK Continental Shelf, on average, are
40% over budget. The unpredictability extends to
the timing, too, and schedules can be affected by
events happening outside of an individual plant: In
the aftermath of the Fukushima disaster, Germany
declared the end of nuclear power in the country by
2022, foreshortening power plant life and hastening
the decommissioning obligation.
Figure 1: Locations of Nuclear Power Reactor Sites Undergoing Decommissioning Source: US Nuclear Regulatory Commission
Gulf of Mexico
WASHINGTON
MONTANA
OREGON
IDAHO
WYOMING
NORTHDAKOTA
SOUTHDAKOTA
MINNESOTA
MICHIGANWISCONSIN
MAINE
VERMIONTNEW
HAMPSHIREMASS.
RICT
NJ
DEMARY-LAND
VIRGINIA
WESTVIRGINIA
OHIOINDIANA
ILLINOIS
IOWANEBRASKA
KANSAS MISSOURIKENTUCKY
TENNESEE
NORTHCAROLINA
SOUTHCAROLINA
GEORGIA
FLORIDA
MISSISSIPPI
LOUISIANA
ARKANSASOKLAHOMA
TEXAS
NEWMEXICO
COLORADOUTAH
ARIZONA
NEVADA
CALIFORNIA
ALABAMA
NEWYORK
PENNSYLVANIA

Marsh • 61
Economic Impacts
Clever funding can take away some of the cash flow
risk and improve the predictability of the annualized
cost over a period, to the delight of CFOs. But what
about the truly unpredictable risks?
What if adverse circumstances occur notwithstanding
the diligent investigation and planning of the owner
of the assets? Such risks are the domain of the
insurance industry. Insurers will steer clear of insuring
against inadequate planning (although they can
cover consequent material damage or liabilities).
They will thrive on the unexpected and, in an industry
awash with capital, are keen to deploy capacity in
new areas.
So far the insurance solutions offered to
protect against unexpectedly onerous
decommissioning costs are few and the market
is immature. Insurers should watch this space:
The constraint is ripe for dismantling.
THIS ARTICLE FIRST APPEARED ON BRINK.
Clever funding can take away some of the cash flow risk and improve the predictability of the annualized cost over a period.

62 • Emerging Risks in Construction
Marsh’s Construction and Real Estate Practice
ABOUT MARSH’S CONSTRUCTION PRACTICE

Marsh • 63
Marsh’s Construction and Real Estate Practice
ABOUT MARSH’S CONSTRUCTION PRACTICE

64 • Emerging Risks in Construction
Marsh’s Construction and Real Estate Practice

Marsh • 65
Marsh’s Construction and Real Estate Practice
ABOUT MARSH’S CONSTRUCTION PRACTICEThis report has been produced by Marsh’s Global Construction Practice, which is at the forefront of brokering insurance and advising the construction industry on risk and insurance issues.
Our team helps you assess risks and opportunities and
uncover ways to use working capital more efficiently.
We measure your firm’s appetite for risk, recommend
solutions that meet your needs, and take your program to
market knowing the best insurers for the best structure
and pricing.
Our strengths include:
• The depth of our resources, experience,
and expertize.
• Our network of offices working closely with
regional specialists.
• Bespoke policy wording and program design.
• Our ability to manage contractual risk allocation.
• A targeted placement strategy which uses
the strength of Marsh’s global account and,
for international projects, considers the most
competitive underwriters, irrespective of their
geographical location.
THE RESULT
Marsh’s Global Construction Practice is an
international team operating across geographical
boundaries, which offers you opportunities
and solutions to meet your needs.
Marsh operations
Service provided by correspondent/regional o�ce
No Marsh operations or service capabilities
Cities where regional leaders are based
LONDON
HONG KONG
MELBOURNE
JOHANNESBURG
DUBAI
SANTIAGO
NEW YORK
TORONTO

66 • Emerging Risks in Construction
Marsh’s Construction Practice
POWER The International Energy Agency predicted that
a total of 5,890 GW of additional power capacity
would be required between 2012 and 2035.
This need for ever-increasing sources of power
on a global level continues to create ongoing
opportunities for the construction of new plants
and facilities. At the same time, competition is
driving manufacturers to constantly develop new
technology, presenting unknown challenges to
contractors, risk managers, investors, and insurers.
Marsh’s power specialists maintain an up-to-date
knowledge of technological developments through
regular contact with manufacturers and sector
insurers. We have dedicated teams that focus on
the thermal, nuclear, and renewable power sectors.
OIL, GAS, AND PETROCHEMICALSWith the fluctuating environment of the oil,
gas, and petrochemical industry comes the
need to develop new and cutting-edge risk
solutions to meet the industry’s needs and
requirements. Every project demands a bespoke
suite of cost-efficient insurance services.
Marsh’s energy risk engineering team is well
qualified to provide risk managers and underwriters
with the essential information they need to
determine the right limits, scope of cover, and price.
Our in-depth knowledge and understanding of the
sector provides you with comprehensive contract
reviews and advice at the early stage of any project.
MINING AND PROCESS ENGINEERINGAs the mining and process engineering
industry copes with volatility issues affecting
market price and demand, the importance
of maintaining a strong balance sheet is
at the heart of many organisations.
This need drives the significant investments made
in cash regenerative assets, and the projects
from which they grow, leading to investments
in all areas of the globe. It is unsurprising
that protecting such assets and projects is a
vital part of risk management strategy.
We offer the opportunity to work with professionals
who understand the challenges you face. Marsh
appreciates the tough commercial environment of
your industry and its increased vulnerability to risk.
IN ADDITION, WE HAVE ACCESS TO INDUSTRY SPECIALISTS IN MANY FIELDS INCLUDING:

Marsh • 67
Marsh’s Construction Practice
INFRASTRUCTURE AND CIVIL ENGINEERINGExperience has shown that the negative time
and cost impact of major risks, such as varying
geological conditions and exposure to natural
hazards, can be particularly severe in the
infrastructure sector.
These risks create a wide range of exposures
linked to areas of design, construction, interfacing,
and sequencing which must be continually
evaluated and managed by the project team. Risk
management strategy must be tailored to minimize
the impact of specific risks on the project works,
existing infrastructure, construction equipment,
and third parties, in particular.
Marsh experts work with owners, contractors,
engineering consultants, and project partners
to implement innovative risk management and
transfer solutions for many of the world’s most
technically challenging construction projects. Our
dedicated risk engineering services and broking
capabilities are proven to support project delivery –
on time and on budget.
CONTRACTORSSome construction companies procure contract
works insurance policies on a case-by-case ad-hoc
basis when required to do so as a contractual
obligation or requirement.
While this may be an appropriate and necessary
approach for very large projects, for heavy civil
works (such as tunneling and wet works), and
projects in specific natural catastrophe zones, there
is an effective and advantageous alternative to
insure a contractor’s portfolio.
Marsh works with many national and multinational
contractors to design and arrange annual or multi-
year insurance facilities that automatically include
all projects within pre-agreed parameters and limits,
without the need to arrange single project policies
on a case-by-case basis.
A contractor facility should be carefully designed
and tailored to cater for your specific requirements
and profile, as well as taking into account insurance
market conditions, and we would recommend an
initial meeting is held to discuss these key issues.

Marsh’s Global Marine Practice
68 • Emerging Risks In Shipping

Marsh • 69
Marsh’s Construction and Real Estate Practice
CONTACTSFor more information on any of the topics discussed, please contact a colleague below or your local Marsh office.
Alternatively, you can visit our website: www.marsh.com
GLOBAL CONSTRUCTION PRACTICE, INTERNATIONAL CHAIRMAN
JONATHAN MARSH +44 (0)20 7357 1510 [email protected]
GLOBAL CONSTRUCTION SALES LEADER
ANDREW FOAD+ 44 (0)20 7357 [email protected]
AFRICAN REGIONAL LEADER
ALVIN DYE+27 11060 [email protected]
ASIAN REGIONAL LEADERS
STEVE HUTCHINSON +852 2301 [email protected]
IAN W BROWN +852 2301 [email protected]
UK REGIONAL LEADER
PHIL LAZELL +44 (0)207 178 [email protected]
CONTINENTAL EUROPE REGIONAL LEADER
NICK HOLMES +44 (0)7711 [email protected]
LATIN AMERICA REGIONAL LEADER
JOAO BUZIO + 44 (0)20 7357 [email protected]
MIDDLE EAST AND NORTH AFRICA REGIONAL LEADER
GAURAV BHATNAGAR+971 4212 [email protected]
PACIFIC REGIONAL LEADER
ROBERT PASQUINI +61 3 9603 [email protected]
CANADIAN REGIONAL LEADER
PATRICK BAKER +1 (416) 349 [email protected]
US NATIONAL CONSTRUCTION LEADERS
DAVID MARINO +1 212 345 [email protected]
ADRIAN PELLEN +1 312 627 [email protected]
TECHNICAL SPECIALIST
MICHAEL SPENCER +44 (0)207 357 [email protected]

70 • Emerging Risks in Construction
FOOTNOTESPERSPECTIVES ON INNOVATION
DISRUPTIVE TECHNOLOGY BRINGS RISK AND OPPORTUNITY TO INFRASTRUCTURE PROJECTS
1. World Economic Forum. Shaping the Future of Construction:
A Breakthrough in Mindset and Technology, available at http://
www3.weforum.org/docs/WEF_Shaping_the_Future_of_
Construction_full_report__.pdf, accessed 1 November 2017.
2. Redpoint Positioning. “Redpoint Positioning Showcases
Wearable Safety Alert System for Industrial Construction Sites,”
available at https://www.redpointpositioning.com/redpoint-
positioning-news-wearable-safety-alert-system-for-industrial-
construction-sites/, accessed 1 November 2017.
3. Balfour Beatty. Innovation 2050 - A Digital Future for the
Infrastructure Industry, available at https://www.balfourbeatty.
com/2050, accessed 1 November 2017.
4. Gilchrist, Karen. “Technological development will cause tension
- and it’s a good thing, say ‘Summer Davos’ execs,” CNBC,
available at https://www.cnbc.com/2017/06/29/technology-
tension-summer-davos-exec.html, accessed 1 November 2017.
5. World Economic Forum. The Global Risks Interconnections
Map 2017, available at http://reports.weforum.org/global-
risks-2017/global-risks-landscape-2017/#risks, accessed
1 November 2017.
6. GI Hub. “Forecasting infrastructure investment needs and
gaps,” available at https://outlook.gihub.org/, accessed
1 November 2017.
HOW DATA AND TECH WILL FUEL MEGACITIES OF THE FUTURE
1. Frontline World. “South Korea: The Most Wired Place on Earth,”
available at http://www.pbs.org/frontlineworld/stories/
south_korea802/video/video_index.html, accessed
1 November 2017.
2. Futurism. “This $26 Billion Underwater City Could Be Ready in
15 Years,” available at https://futurism.com/videos/this-26-
billion-underwater-city-could-be-ready-in-15-years/, accessed
1 November 2017.
3. Adler, David. “Story of cities #37: how radical ideas turned
Curitiba into Brazil’s ‘green capital’,” available at https://www.
theguardian.com/cities/2016/may/06/story-of-cities-37-
mayor-jaime-lerner-curitiba-brazil-green-capital-global-icon,
accessed 1 November 2017.
4. Enderle, Rob. “Airbus Enters Human Carrying Drone
Race: But Where Are Ford and GM?”, available at
http://www.techzone360.com/topics/techzone/
articles/2017/01/16/428813-airbus-enters-human-carrying-
drone-race-but-where.htm, accessed 1 November 2017.
5. Niquette, Mark. “FedEx Pushes for Infrastructure Fix as Trump
Eyes Investment,” Bloomberg, available at https://www.
bloomberg.com/news/articles/2017-02-01/fedex-pushes-for-
infrastructure-fix-as-trump-weighs-investment, accessed
1 November 2017.
6. Moore, James A. “What the Future of Cities Can Learn From
Ancient Cities,” available at https://www.autodesk.com/
redshift/the-future-of-cities/, accessed 1 November 2017.
7. Meko, Tim. “Six maps that show the anatomy of America’s vast
infrastructure,” Washington Post, available at https://www.
washingtonpost.com/graphics/national/maps-of-american-
infrastrucure/?tid=ss_tw, accessed 1 November 2017.
8. National Geographic. “Four Million Commutes Reveal New U.S.
‘Megaregions’,” available at http://news.nationalgeographic.
com/2016/11/us-commutes-reveal-new-economic-
megaregions-map/#/01megaregions.jpg, accessed
1 November 2017.
9. Pianin, Eric. “How Big Cities Mine Big Data to Solve Big
Problems,” The Fiscal Times, available at http://www.
thefiscaltimes.com/2015/02/05/How-Big-Cities-Mine-Big-
Data-Solve-Big-Problems, accessed 1 November 2017.
10. Trieu, Rosa. “What Is the Future of Smart Cities?”, available at
https://www.autodesk.com/redshift/smart-cities/, accessed
1 November 2017.
11. “Planning Sustainable Cities,” available at http://zofnass.gsd.
harvard.edu/planning/, accessed 1 November 2017.
12. Patel, Neel V. “7 Planned Cities Designed to Change Our
Urban Future,” available at https://www.inverse.com/
article/5062-7-planned-cities-designed-to-change-our-urban-
future, accessed 1 November 2017.
13. Elliott, Teresa. “Reconstructing a town – with BIM,” available
at http://bimontherocks.com/reconstructing-a-town-with-
bim/, accessed 1 November 2017.
14. Harrington, Rebecca. “These will be the 10 biggest cities in
2015,” available at http://uk.businessinsider.com/10-most-
populous-cities-2050-2016-2/?r=US&IR=T, accessed
1 November 2017.

Marsh • 71
CONSTRUCTION MACHINES IN THE DIGITAL AGE
1. Sleight, Chris. “Global Construction Equipment Market to
Recover in 2017,” available at http://blog.marketresearch.
com/global-construction-equipment-market-to-recover-
in-2017, accessed 1 November 2017.
THE RISING IMPORTANCE OF THE “SECONDARY CITY”
1. “The Architectural Heritage of Tianjin,” China Heritage
Quarterly, available at http://www.chinaheritagequarterly.org/
editorial.php?issue=021, accessed 1 November 2017.
2. Reuters. “Hundreds of Firms Are About to Pour $23 Billion into
a Proposed Chinese ‘Megacity’,” available at http://fortune.
com/2016/11/25/tianjin-investment-beijing-china/, accessed
1 November 2017.
3. Jackson, David. “The new urban imperative for secondary
cities,” available at http://citiscope.org/habitatIII/
commentary/2016/11/new-urban-imperative-secondary-
cities, accessed 1 November 2017.
4. Roberts, Brian H. Managing Systems of Secondary Cities,
available at https://www.citiesalliance.org/sites/citiesalliance.
org/files/1d%20(i)%20-%20Managing%20Systems%20of%20
Secondary%20Cities%20Book_low_res.pdf, accessed
1 November 2017.
5. Cities Alliance, available at http://www.citiesalliance.org/,
accessed 1 November 2017.
6. Shepard, Wade. “A Look At 7 New Cities Rising Along The New
Silk Road,” Forbes, available at https://www.forbes.com/sites/
wadeshepard/2016/09/20/7-new-cities-that-are-rising-
along-the-new-silk-road/#6ea790631300, accessed
1 November 2017.
7. “Upstate Revitalization Initiative,” available at https://www.
ny.gov/programs/upstate-revitalization-initiative, accessed 5
September 2017.
8. Barboza, David. “How China Built ‘iPhone City’ With Billions
in Perks for Apple’s Partner,” The New York Times, available at
https://www.nytimes.com/2016/12/29/technology/apple-
iphone-china-foxconn.html?_r=0, accessed 1 November 2017.
9. ESPON. Second Tier Cities and Territorial Development in Europe:
Performance, Policies and Prospects, available at https://
www.espon.eu/programme/projects/espon-2013/applied-
research/sgptd-secondary-growth-poles-and-territorial,
accessed 1 November 2017.
10. Upbin, Bruce. “Five Maps That Improve Our View Of
America’s Megaregions,” available at https://hyperloop-
one.com/blog/five-maps-improve-our-view-americas-
megaregions, accessed 1 November 2017.
INTERNAL THREATS: FIVE WAYS EMPLOYEES AND BUSINESS PARTNERS PUT IP AND DATA AT RISK
1. Ponemon Institute. Corporate Data: A Protected Asset or a
Ticking Time Bomb?, available at http://info.varonis.com/hs-fs/
hub/142972/file-2194864500-pdf/ponemon-data-breach-
study.pdf?&__hssc=&__hstc&hsCtaTracking=c771f50d-6a90-
42c2-97d0-868ac3bcfc5b%7C510f5a1e-60a8-4304-b497-
8ec886f3ca3c, accessed 1 November 2017.
2. Yonhap News Agency. “Bizmen indicted for leaking trade
secrets of ex-Daewoo Motor to China,” available at http://
english.yonhapnews.co.kr/national/2014/12/03/51/030100
0000AEN20141203002700315F.html, accessed
1 November 2017.
3. Kyodo. “Benesse suspect gets fresh warrant over second data
theft,” The Japan Times, available at https://www.japantimes.
co.jp/news/2014/08/11/national/crime-legal/benesse-
suspect-gets-fresh-warrant-over-second-data-theft/#.
Wa54CVGQxpi, accessed 1 November 2017.
ENVIRONMENTAL IMPACTS
SPENDING MORE TO MAKE INFRASTRUCTURE SUSTAINABLE
1. Moreno, Luis Alberto; Stern, Nicholas. “Smart infrastructure
is the key to sustainable development,” The Guardian,
available at https://www.theguardian.com/public-leaders-
network/2016/may/10/smart-infrastructure-sustainable-
development-low-carbon-transport, accessed
1 November 2017.
2. The New Climate Economy. The Sustainable Infrastructure
Imperative: Financing for Better Growth and Development,
available at http://newclimateeconomy.report/2016/
wp-content/uploads/sites/4/2014/08/NCE_2016Report.pdf,
accessed 1 November 2017.
3. Inter-American Development Bank. Financing Infrastructure
in Latin America and the Caribbean: How, How much and by
Whom?, available at https://publications.iadb.org/bitstream/
handle/11319/7315/Infrastructure%20Financing.%20
Definitivo.pdf?sequence=1, accessed 1 November 2017.
4. Moreno, Luis Alberto; Stern, Nicholas. “Smart infrastructure
is the key to sustainable development,” The Guardian,
available at https://www.theguardian.com/public-leaders-
network/2016/may/10/smart-infrastructure-sustainable-
development-low-carbon-transport, accessed
1 November 2017.
72 • Emerging Risks in Construction
DRAMATIC DROP IN GLOBAL COAL PLANT CONSTRUCTION
1. The White House Office of the Press Secretary. “Presidential
Executive Order on Promoting Energy Independence and
Economic Growth,” available at https://www.whitehouse.gov/
the-press-office/2017/03/28/presidential-executive-order-
promoting-energy-independence-and-economi-1, accessed
1 November 2017.
2. Shearer, Christine; Ghio, Nicole; Myllyvirta, Lauri; Yu, Aiqun;
Nace, Ted. Boom and Bust 2017: Tracking the Global Coal
Plant Pipeline, available at http://endcoal.org/wp-content/
uploads/2017/03/BoomBust2017-English-Final.pdf, accessed
1 November 2017.
3. Rushe, Dominic. “Top US coal boss Robert Murray: Trump
‘can’t bring mining jobs back’,” The Guardian, available at
https://www.theguardian.com/environment/2017/mar/27/
us-coal-industry-clean-power-plan-donald-trump, accessed
1 November 2017.
4. BRINK Editorial Staff. “NatGas Trumps Coal in U.S. Power
Usage,” available at http://www.brinknews.com/natgas-
trumps-coal-in-u-s-power-usage/, accessed 1 November 2017.
5. World Energy Council. Energy Trilemma Index, available at
https://trilemma.worldenergy.org/, accessed
1 November 2017.
6. Watt, Louise. “China’s coal consumption falls for 3rd
year in a row,” available at https://apnews.com/
a55827924d944698ae0cbb28af5aeb4e/chinas-coal-
consumption-falls-3rd-year-row, accessed 1 November 2017.
7. UN Climate Action. “India could eliminate the use of coal by
2050,” available at http://www.climateactionprogramme.org/
news/india_could_eliminate_the_use_of_coal_by_2050,
accessed 1 November 2017.
IN US, RENEWABLE ENERGY SURPASSES NUCLEAR GENERATION…FOR NOW
1. U.S. Energy Information Administration. “Monthly renewable
electricity generation surpasses nuclear for the first time since
1984,” available at https://www.eia.gov/todayinenergy/
detail.php?id=31932, accessed 1 November 2017.
2. U.S. Energy Information Administration. “Short-term Energy
Outlook,” available at https://www.eia.gov/outlooks/steo/
report/electricity.cfm, accessed 1 November 2017.
3. Organisation for Economic Co-operation and Development.
The Role of Nuclear Energy in a Low-carbon Energy Future,
available at https://www.oecd-nea.org/nsd/reports/2012/
nea6887-role-nuclear-low-carbon.pdf, accessed
1 November 2017.
4. U.S. Energy Information Administration. “Record precipitation,
snowpack in California expected to increase hydro generation
in 2017,” available at https://www.eia.gov/todayinenergy/
detail.php?id=30452, accessed 1 November 2017.
5. U.S. Energy Information Administration. “U.S. electric
generating capacity increase in 2016 was largest net change
since 2011,” available at https://www.eia.gov/todayinenergy/
detail.php?id=30112, accessed 1 November 2017.
6. U.S. Energy Information Administration. “Three Mile Island is
the latest nuclear power plant to announce retirement plans,”
available at https://www.eia.gov/todayinenergy/detail.
php?id=31612, accessed 1 November 2017.
ECONOMIC IMPACTS
PREPARING BANKABLE INFRASTRUCTURE PROJECTS
1. Global Business Coalition. “B20 Germany hands over its policy
recommendations to the G20 Presidency,” available at http://
www.globalbusinesscoalition.org/global-governance-news/
b20-germany-hands-key-policy-recommendations-g20-
presidency/, accessed 1 November 2017.
2. B20 Taskforce. Investing in Resilient, Future-oriented Growth:
Boosting Infrastructure Investment and Balancing Financial
Regulation, available at http://www.globalbusinesscoalition.
org/wp-content/uploads/2017/05/B20_FGI_Policy_
Paper_13042017.pdf, accessed 1 November 2017.

Marsh • 73
ASIA NEEDS US$26 TRILLION IN INFRASTRUCTURE INVESTMENT FROM 2016-2030
1. Asian Development Bank. Meeting Asia’s Infrastructure
Needs, available at https://www.adb.org/sites/default/
files/publication/227496/special-report-infrastructure.pdf,
accessed 1 November 2017.
ROAD TO ECONOMIC GROWTH PAVED WITH EFFICIENT INFRASTRUCTURE INVESTMENT
1. S&P Global Ratings. Developing U.S. Infrastructure In An
Era Of Emerging Challenges, available at https://www.
spratings.com/documents/20184/1481001/Infrastructure_
Umbrella_061317/d6970b9d-568e-41dd-9eb0-
c1bcb1c45d30, accessed 1 November 2017.
2. Ibid.
3. Europa. “Investment Plan, For Europe: The Junker Plan”
available at https://ec.europa.eu/commission/priorities/jobs-
growth-and-investment/investment-plan_en, accessed
1 November 2017.
4. Reuters. “Australia’s Endeavour Energy sold to Macquarie-led
consortium for $5.6 bln,” available at https://www.reuters.
com/article/australia-utilities-privatisation-price/australias-
endeavour-energy-sold-to-macquarie-led-consortium-for-5-6-
bln-idUSS9N1I300E, accessed 1 November 2017.
5. Godfrey, Miles. “WestConnex end stage to be funded through
privatisation,” The Daily Telegraph, available at http://www.
dailytelegraph.com.au/news/nsw/westconnex-end-stage-to-
be-funded-through-privatisation/news-story/50989e8222558
463795787738c8aceb0, accessed 1 November 2017.
6. S&P Global Ratings. Spanish Solar Project Vela Energy Bonds
Assigned ‘BBB’ Rating; Outlook Stable, available at http://
velaenergy.com/cms/wp-content/uploads/Vela-Energy-
Project-Bond-Rating-Report-SP.pdf, accessed
1 November 2017.
7. S&P Global Ratings. “A $1 Trillion Gap: Could Traditional And
Alternative Bundling Approaches Help Revive North America’s
Water System?”, available at https://www.capitaliq.com/
CIQDotNet/CreditResearch/RenderArticle.aspx?articleId=
1883264&SctArtId=431388&from=CM&nsl_code=LIME&so
urceObjectId=10123210&sourceRevId=5&fee_ind=N&exp_
date=20270714-21:19:55, accessed 1 November 2017.
8. S&P Global Ratings. Can Colombia’s 4G Toll Road Concession
Program Shift To A Faster Lane?, available at https://www.
spratings.com/documents/20184/1634005/CO_IFR_
May19_2017_CanColombias4GTollRoadConcessionProgramS
hiftToAFasterLane/3b59aaa8-2b86-4e45-bf30-029672e98fc8,
accessed 1 November 2017.
9. Standard & Poor’s Rating Services. Why Projects Fail 20
Years Of Rating Project Finance Debt, available at http://
www.spcapitaliq-credit.com/cms/wp-content/uploads/
Why_Projects_Fail_20_Years_Project_Finance_14Oct.
pdf?t=1414398278, accessed 1 November 2017.
10. Fernandez, Gonzalo Cantabrana. “Spain’s infrastructure woes
are more serious than they appear,” World Finance, available
at https://www.worldfinance.com/infrastructure-investment/
government-policy/spains-infrastructure-woes-are-more-
serious-than-they-appear, accessed 1 November 2017.
COMMERCIAL INSURANCE RATES CONTINUE DECLINE IN LIGHT OF GLOBAL MARKET FORCES
1. Munich Re. “Natural catastrophe review for the first half of
2017: A series of powerful thunderstorms in the USA causes
large losses,” available at https://www.munichre.com/en/
media-relations/publications/press-releases/2017/2017-07-
18-press-release/index.html, accessed 1 November 2017.

74 • Emerging Risks in Construction
30,000EMPLOYEES GLOBALLY
ABOUT MARSHMarsh is a global leader in insurance broking and innovative risk management solutions. In more than 130 countries, our experts help clients to anticipate, quantify, and more fully understand the range of risks they face. In today’s increasingly uncertain global business environment, Marsh helps clients to thrive and survive.
We work with clients of all sizes to define, design, and deliver innovative solutions to better quantify and manage risk. To every client interaction we bring a powerful combination of deep intellectual capital, industry-specific expertise, global experience, and collaboration. We offer risk management, risk consulting, insurance broking, alternative risk financing, and insurance programme management services.
Since 1871 clients have relied on Marsh for trusted advice, to represent their interests in the marketplace, make sense of an increasingly complex world, and help turn risks into new opportunities for growth. Our more than 30,000 colleagues work on behalf of our clients, who are enterprises of all sizes in every industry, and include businesses, government entities, multinational organizations, and individuals around the world.
We are a wholly owned subsidiary of Marsh & McLennan Companies (NYSE: MMC), the leading global professional services firm in the areas of risk, strategy and people. With 60,000 colleagues worldwide and annual revenue exceeding $13 billion, Marsh & McLennan Companies also include global leaders Guy Carpenter, Mercer, and Oliver Wyman.
Follow Marsh on Twitter @MarshGlobal; LinkedIn; Facebook; and YouTube, or subscribe to BRINK.
WE SERVE CLIENTSIN MORE THAN
130COUNTRIES
500 MARSH OFFICESWORLDWIDE

Marsh • 75
ABOUT THE GLOBAL RISK CENTERMarsh & McLennan Companies’ Global Risk Center addresses the most critical challenges facing enterprise and societies around the world. The center draws on the resources of Marsh, Guy Carpenter, Mercer, and Oliver Wyman – and independent research partners worldwide – to provide the best consolidated thinking on these transcendent threats. We bring together leaders from industry, government, non-governmental organizations, and the academic sphere to explore new approaches to problems that require shared solutions across businesses and borders. Our Asia Pacific Risk Center in Singapore studies issues endemic to the region and applies an Asian lens to global risks. Our digital news services, BRINK and BRINK Asia, aggregate timely perspectives on risk and resilience by and for thought leaders worldwide.
ABOUT BRINKAll of these articles appeared on BRINK – the digital news service of Marsh & McLennan Companies’ Global Risk Center, managed by Atlantic Media Strategies. BRINK gathers timely perspectives from experts on risk and resilience around the world to inform business and policy decisions on critical challenges.

The information contained herein is based on sources we believe reliable and should be understood to be general risk management and insurance information only. The information is not intended to be taken as advice with respect to any individual situation and cannot be relied upon as such.
In the United Kingdom, Marsh Ltd is authorised and regulated by the Financial Conduct Authority.
Copyright © 2017 Marsh Ltd All rights reserved
GRAPHICS NO. 17-0617


