1 Emerging Trends in FDI flows to Asia Dilek Aykut The World Bank Tuesday, April 10, 2007 Paper prepared for the workshop Intra-Asian FDI Flows: Magnitude, Trends, Prospects and Policy Implications, ICRIER, Delhi, India, 24-25 April 2007. The opinions expressed and arguments employed are the author’s sole responsibility and do not necessarily reflect those of the World Bank Group, and their Members. Preliminary Not for Citation
Transcript
1
Emerging Trends in FDI flows to Asia
Dilek Aykut
The World Bank
Tuesday, April 10, 2007
Paper prepared for the workshop Intra-Asian FDI Flows: Magnitude, Trends, Prospects and Policy Implications, ICRIER, Delhi, India, 24-25 April 2007. The opinions expressed and arguments employed are the author’s sole responsibility and do not necessarily reflect those of the World Bank Group, and their Members.
Preliminary Not for Citation
2
TABLE OF CONTENTS: Emerging Trends in FDI flows to Asia..............................................................................................................1 I. Introduction................................................................................................................................................3 II. The increased role of M&A as a form of FDI .......................................................................................4 III. Shift in Sectoral Distribution of FDI .....................................................................................................5
Trends in Services FDI ..................................................................................................................................6 Factors affecting Services Sector FDI and Policy Implications ....................................................................7
Income growth ...........................................................................................................................................8 Investment and trade policy.......................................................................................................................8 Investment Climate in case of Services FDI............................................................................................11
IV. Emerging Multinationals from Developing Countries.........................................................................14 Trends in Outward FDI flows......................................................................................................................15 Characteristics of Main Investors ................................................................................................................17 Geographic Distribution ..............................................................................................................................21 Policy Implications ......................................................................................................................................22
V. Conclusion (TBC)................................................................................................................................23 References........................................................................................................................................................24
3
I. Introduction
Global FDI flows have expanded rapidly over the last two decades. As a result of technological progress in transport, communications, and data processing coupled with policy reforms has fueled the growth of cross-border production networks, in which multinational companies break down their production of final goods into stages and organize their production to achieve the lowest cost of production. The remarkable progress in information and telecommunication (IT) technologies has boosted the value added of services sector in the world economy and enhanced globalization process by enabling companies better-manage and control geographically dispersed businesses.
Last two decades also marked considerable progress in terms of liberalization of FDI and trade
policies in developing countries. As in many developing countries impediments including restrictions on
forms of investment and the degree of foreign ownership has gradually eased, FDI flows in developing
countries not only experienced a surge but also several changes emerged in terms of mode of investment,
recipient industries and the investor base. The role of M&A as a form of FDI increased in many developing
countries, as developing countries went through a wave of large privatization and M&A deals in tandem
with the surge in global M&A flows. And spurred by this wave of large privatization and M&A deals, the
sectoral distribution of FDI in many developing countries has shifted towards services. In the process, firms
in developing economies have amassed sufficient capital, knowledge and know-how to invest abroad on
their own and claim the status of emerging multinationals (EMNCs).
While FDI flows in developing countries were undergoing these changes, the expectation of
resilience of FDI flows were tested in the face of economic turbulence in several countries. In most of these
cases, FDI was proved to be more resilient at least in some of these countries relative to other international
capital flows such as portfolio equity and debt flows due to the assumed long-term expectations of its
investors. This said highlighted by these episodes that although FDI investors do not disinvest immediately,
they do adjust their exposure to the countries affected by crises by repatriating their earnings—instead of
reinvesting, and calling back their inter-company loans. And in some cases, these adjustments can be
considerable leading significant fall in FDI flows.
This paper highlights these emerging FDI trends and issues, and tries to understand how much they
apply to Asian developing economies which are major FDI recipients accounting for almost 50 percent of
FDI flow to all developing countries. Reflecting the diversity among the Asian countries in terms of the
market size, economic development, and FDI policies, the level of participation to these trends vary
significantly. For example, while Singapore and Hong Kong, China have led the shift towards services,
manufacturing continues to be the dominant sector in other countries such as China, Malaysia. Almost all
Asian economies have become home for large EMNCs, there are significant differences in terms of drivers,
internationalization patterns and ownership structures among them. Investigation of composition of FDI in
Asian economies during the financial crisis indicates that the resilience of FDI can be traced to the equity
4
0102030405060708090
100
Developing Asia Other DevelopingCountries
DevelopedCountries
1990-1994 1995-1999 2000-2005
Percent
-102030405060708090
100
NIEs China India Others
1990-1994 1995-1999 2000-2005
Percent
component, and in contrast inter-company loans and reinvested earnings were used as a means to adjust FDI
exposure.
The paper is organized as flow: Section II examines the increased role of M&A as a form of FDI;
Section III analysis the shift towards services in FDI flows; Section IV discusses emerging multinationals
from Developing Countries; and the conclusion summarizes the findings.
II. The increased role of M&A as a form of FDI
The importance of M&A activity as a form of FDI increased in the 1990s. Global M&A rose more than five-
fold between 1995 and 2000 (after increasing by only 24 percent in the first half of the 1990s) to a peak of
$1.1 trillion in 2000, before dropping by some 45 percent in 2001 with the decline in stock markets and the
global economic slowdown. Reflecting the recent favorable economic conditions, global cross-border
M&As reached to yet another peak of $1.3 billion in 2006. The M&A activity is driven in part by rapid
increases in the stock prices of some major corporations and in part by expectations (during the boom) that
continuing productivity increases would fuel continued rises in stock prices (GDF 2006). The bulk of the
cross-border M&A transactions continue to be in service sectors (more than half in finance, transport,
storage, and communications alone). Extensive privatization of state-owned assets during the late 1990s also
attracted FDI in the form of M&A in a number of developing countries particularly in Latin America and
Eastern Europe.
Figure 1. The ratio of cross-border M&A sales to FDI flows, 1990-2005
Source: Author’s calculations based on UNCTAD M&A data.
In Asian developing countries, the role of M&A as a form of FDI has been less significant compared
to developed and other developing countries indicated by the relatively lower ratios of cross-border M&A
sales to FDI flows (figure 2). One factor is limited privatization related FDI in many Asian developing
countries which accounted only 17 percent of $140 billion foreign exchange raised through privatization
5
deals in developing countries during 1990 to 1999 (World Bank 2000).1 This said the importance of M&A
activity has increased since the late 1990s. Following the Asian crisis, the acquisition of distressed banking
and corporate assets surged in several Asian economies particularly in Thailand and Malaysia, because of
which the value of cross-border M&A activity in Asia more than doubled in 1998 relative to 1996.
During the last few years, cross-border M&A and privatization deals have picked up again and
Asian countries have increased their participation among developing countries. The value of M&A sales
almost doubled both in newly industrialized economies (NIEs)―Hong Kong, China, Republic of Korea,
Taiwan Province of China and Singapore―and other developing countries reaching $ 23.2 and 21.7 billion,
respectively. The region’s share in total M&A deals to developing countries also increased to 30 percent in
2005 compared to an average 20 percent in previous years. The front-runners in the recent increase in value
of M&A transaction were Indonesia, India, Malaysia and China all of which received FDI flow in form of
M&A particularly in telecom and banking sector.
III. Shift in Sectoral Distribution of FDI
Starting in the late 1980s and early 1990s, there has been a shift of global FDI flows into the services sector
as most countries, both developed and developing, have opened up their services sectors to foreign
investment, and FDI flows into these sectors surged (GDF 2004; Unctad 2005). Spurred by the surge in
privatization and M&A deals, FDI flows in services rose to overtake FDI in manufacturing. By 2004,
services accounted for more than half of the FDI stock in developing countries (figure 2).
Figure 2. Sectoral composition of FDI stock in regions in 2004
Percentage
Note: Estimated by accumulating available FDI flows by sector. Data taken from country sources. Data definitions may vary according to the country’s classification system.
Source: Author’s calculations based on data collected from U.N. ECLAC based on country sources for Latin American countries; China Statistical Yearbook (various years); ASEAN, Foreign Equity Investment in Singapore Report, 2004, and country resources for other Asian countries; OECD, UNCTAD, and country sources for Eastern Europe and Central Asia and developed countries. FDI flows to
1 Excluding countries Hong Kong, China, Taiwan Province of China and Singapore.
0.0
10.0
20.0
30.0
40.0
50.0
60.0
70.0
80.0
DevelopedCountries
DevelopingCountries
LAC AFRICA ECA ASIA
PRIMARY MANUFACTURING SERVICE
among developing countries
6
Africa were approximated by the outflows of the continent’s major investors including France, Netherlands, United Kingdom, and United States.
Trends in Services FDI
The shift has happened in almost all regions and income groups except Africa (figure 2). Boosted by
mega privatization deals, services FDI surged in Latin American and Eastern European countries particularly
into infrastructure (especially transportation, storage and communication), financial intermediation and
insurance sectors. During the climax of privatization and mega M&A deals era for developing countries in
the 1999-2002 period in Latin America, only in Brazil and Mexico, the total FDI in services sector was $67
and $36 billion, respectively. During the same time Eastern European countries led by Czech Republic,
Hungary and Poland received almost $40 billion in infrastructure and financial sector. In recent years, the
region was again the frontrunner as the recipient of privatization and M&A deals but this time newcomers
such as Romania, Bulgaria and Turkey were also major recipients. Africa, on the other hand, continues to
receive higher portion of its FDI in resource-related FDI despite the increase in services sector FDI in
Northern African countries such as Egypt and Tunisia (World Bank 2004).
Figure 3. Sectoral composition of FDI stock in Asia in 2004
Percentage
Source: Same as figure 3.
For Asian developing countries, the role of services sector in terms of FDI sectoral composition has
been significant on aggregate yet its importance varies among countries (figure 3). While FDI in the sector
has been dominant in most NIEs particularly in Hong Kong and Singapore, FDI in manufacturing is still the
leading sector in countries such as China, Taiwan, China, Malaysia, Thailand and Vietnam. As Singapore
and Hong Kong, China have positioned themselves as financial and trade centers in Asia, services sector
FDI reached to $174 billion and $100 billion in services sector accounting for 64 percent and 96 percent of
their FDI stocks, respectively. In Singapore, financial services—foreign investment holding companies—
attracted $98 billion of FDI flows, 36 percent of FDI stock in the country (Foreign Equity Investment in
Singapore Report, 2004). In Hong Kong, China, FDI in investment holding, real estate and various business
services account for two-third of the FDI stock valued at $300 billion in 2005, and the rest was in commerce
0
10
20
30
40
50
60
70
80
NIEs China India Other Asia
PRIMARY MANUFACTURING SERVICE
7
and financial services. Similarly, FDI in services accounts for more than half of FDI stock in India but most
of it is concentrated in infrastructure industries. Highly publicized investment in business services—
outsourcing—has been increasing in recent years but only accounts for about 10 percent of inward FDI stock
(McKinsey 2005). [Check the India data again] In Pakistan, increased FDI in infrastructure and financial
sectors through large M&A deals led the shift towards services.2
On the other hand, manufacturing continues to be the dominant sector in other Asian developing
countries―China, Malaysia, Taiwan and Thailand, even if services FDI has increased over the years. In
China, manufacturing sector that received an aggregate of $240 billion FDI between 1997 and 2004 accounts
66 percent of the FDI flows. Among services FDI, real estate sector is the main sector, which received more
than 10 percent of all FDI received during 1997–2004. Some portion of this FDI is due to accounting
standards that some of the real estate expenses of foreign individuals and companies in China are counted as
FDI (Tse 2001; Zhang 1999). The rest is increasing real estate purchases by non-residents (Unctad 2006).
FDI into financial sector in China is on raise. Since China joined the World Trade Organization in
2001, foreign banks have been positioning themselves in China’s market, for the recent ease in restrictions
on local-currency transactions. Foreign banks can enter the market in one of two ways: they may either
invest in a domestic bank and hold a minority share (less than 25 percent) or open up fully owned branches.
To gain immediate access to a large branch network, many foreign banks are increasing their holdings in
domestic banks and have invested an estimated $17 billion since 2001.
Similar to China, FDI in services is still limited in Malaysia accounting for only 10 percent of the
FDI flows during 1999 to 2004. The shares of primary and manufacturing sectors were 33 and 57 percent,
respectively. The approval data between 1996 and 2000 also confirms the dominance of manufacturing
sector. During this period, electrical and electronics industry received 41 percent of the approvals, where the
petroleum and petroleum products accounted for 18 percent of them. Similar to Malaysia, Taiwanese
electronics industry received $16 billion, which was more than half of the country’s FDI flows during the
1951-2002 period. With $ 8 billion FDI stock, banking and insurance sectors were listed the second largest
sector in Taiwan. Interestingly, FDI sectoral composition is almost divided equally between manufacturing
(mostly electronic appliances) and services with manufacturing leading with a slight difference in Thailand.
Most of the services FDI flows were in financial services where majority foreign ownership of banks,
finance firms, brokerage firms and insurance agencies became possible for the first time in 1997.
Factors affecting Services Sector FDI and Policy Implications
As conventionally defined, the service sector includes electricity, gas, water, transport, communication,
construction, wholesale and retail trade and repairs, hotels and restaurants, transport, storage and
communications, finance and insurance, real estate, renting, and business services, public administration,
2 Recent such deals include the sale of telecom company PTCL to Etisalat of UAE for 2.6 billion, United Bank etc.
8
defense, education, health, social services, social and personal service activities, and recreational, cultural,
and sporting activities. Unlike the primary and manufacturing sectors, where output is tradable, services are
mostly non-tradable and require close proximity between producers and consumers (i.e., location-bound).3
Hence, most of the products in services sector are usually produced to serve to domestic markets. Among the
factors that expanded the share of services in global economic activity were income growth in developing
countries and changes investment and trade policies towards the sector.
Income growth
That shift in FDI came in tandem with significant developments in the services sector during the 1990s,
which boosted its share of world GDP to almost [75] percent in 2005 from [60] percent in 1990. The sectoral
composition of FDI, in fact, mirrors that of GDP in most developing and developed countries (table1). As
the demand for services rose with income level, FDI grew to meet demand. In Africa, however, service-
sector FDI has lagged behind the sector’s share in GDP for various reasons. In China, policies towards
services FDI play a major role on hindering it relative to its role in GDP.
Table 1 Average share of services in FDI flows and in GDP (percent)
Services share in: FDI GDP
Asia
NIEs 69 65
China 31 41
India 55 52
Other Asian Countries 43 45
Europe and Central Asia 65 60
Latin America and the Caribbean 65 59
África 29 52
Memo ítem
High-Income OECD 69 72
Investment and trade policy One of the major factors that led to the rise in FDI in services sector is the considerable progress in their investment and trade policies, opening up the services sector to foreign participation and provoking a significant shift in the composition of FDI towards services. In developed and developing countries alike, services have been liberalized much later than manufactures (figure 4). Governments’ policies with respect to FDI in services have been influenced by considerations of national security and independence, consumer
3 Not all the services are non-tradable or require physical proximity, however. For example, some information technology services (software programming, database and customer support etc.) and business process services (call centers etc.) are not location-bound and can be provided without proximity to customers. However, with exceptions in mind, services are conventionally portrayed as intangible, invisible and perishable, requiring simultaneous production and consumption (GEP 2002).
9
0.0
0.1
0.2
0.3
0.4
0.5
0.6
0.7
0.8
0.9
1.0
Telecommunication Banking Air transport Manufacturing
1981
1991
1998
protection, and ensuring the provision of public goods.4 Because of the monopolistic structure of many service markets, designing the necessary regulatory systems has been difficult and costly (GEP 2002).
Figure 4. Indices of FDI restrictions over time in selected sectors 1981–98 (OECD average)
Note: The indicator is calculated based on limits of foreign ownership, restrictions on foreign personnel and operational freedom, and screening requirements. It ranges from 0 (least restrictive) to 1 (most restrictive).
Source: Golub (2003).
In many developing countries, impediments, including restrictions on the forms of investment and the level of foreign ownership, have been gradually eased during the last decade through unilateral liberalization policies, bilateral and regional investment agreements, and commitments under the World Trade Organization (WTO) and the General Agreement on Trade in Services (GATS). In case of many Asian developing countries, more liberal FDI policies were implemented following the Asian crisis of 1997 to attract more FDI. Many affected countries such as South Korea, Thailand and Indonesia have progressed in opening up more services sectors for FDI. In China, progress in liberalization has come through WTO accession
This said impediments still exist and they seem to be still higher in Asian developing countries compared to other regions (figure 5). Particularly in the case of transmission, distribution, and supply of electricity, many Asian countries (Korea, Indonesia, Malaysia, and Thailand) as well as other developing countries (Mexico, Tunisia, Turkey, and Uruguay among others), foreign participation is prohibited (Table 5). Impediments in several other services sectors continue to be relatively higher to foreign participation in Asian countries. For example, almost all of the Asian countries score higher FDI restriction indices in the infrastructure sectors (communication and transportation) and financial sectors.
4 Some services sectors are labor intensive, and governments are concerned that foreign participation in the sector may harm the domestic skilled workers. In fact, 32 countries (mostly in African and Latin American) have included domestic labor requirements for FDI policies in their GATS schedules (Markusen et al 2000).
10
0
0.1
0.2
0.3
0.4
0.5
0.6
WestAsia
SouthAsia
South-East Asia
East Asia NorthAfrica
OtherAfrica
LatinAmerican
EasternEurope
World
Figure 5. Indices of FDI restrictions (simple averages) in all services, 2004
Table 2 . Indices of FDI restrictions (simple averages) in all services, 2004
China Korea India Indonesia Malaysia Pakistan Philippines Sri
Note: The indicator is calculated based on limits of foreign ownership, restrictions on foreign personnel and operational freedom, and screening requirements. It ranges from 0 (least restrictive) to 1 (most restrictive).
Source: Unctad (2006).
11
Investment Climate in case of Services FDI
Investment climate issues are very important in attracting and sustaining services FDI. Most of the
products in services sector are non-tradable (i.e., location-bound) and usually produced to serve to domestic
markets. Moreover, infrastructure services such as electricity, gas, transport facilities etc. were assumed to
be public goods with governments being responsible of producing them. Because of this very nature of the
sector, governments have been highly involved in the operations even after these sectors were opened to
private investors). Operations in the sector usually require coordination of several units within the
government, and are subject to several rules and regulations (Sader 2000). Therefore, issues like
transparency within the government, stability of the regulatory environment, and adequate legal framework
Note: All averages are weighted averages for 1999-2004 period, and CPIA in 2002 is used for investment climate index for 35 developing countries in Asia, Eastern Europe, Central Asia and Latin America regions that the data are available.
The other critical factor for multinational companies investing in the services sector is the
macroeconomic stability of the host country. These companies serve to the domestic markets and earn
revenues in local currency. Therefore, exchange rate volatility is detrimental to the rates of return. In
addition, multinational companies usually finance their expansion (at least the initial investment) through
borrowing in major international currencies. Any macroeconomic shocks such as sharp exchange rate
fluctuations will lead to balance sheet losses and deterioration of company’s equity-debt ratio. Thus,
countries with better investment climate attracted not significantly more FDI but also more FDI into their
services sector measured both as a percentage of GDP as well as percentage of total FDI flows (Table 3).
The elevated importance of investment climate in case of services FDI was highlighted by sudden
fall in FDI in Latin America following the crisis in Argentina in 2002. In 2002, starting with Argentina and
Brazil, almost all currencies in the region suffered devaluations. The local currency earnings of service-
sector FDI severely affected the foreign firms in the sector, which had financed their expansion using
foreign currency debt. More important, the policy changes in Argentina following the almost [200] percent
devaluation of the peso between 2001 and 2002 prompted many direct investors in banking and
infrastructure to revisit their business strategies toward the region (IMF-World Bank 2003). Following the
crisis, the Argentine government enforced an asymmetric conversion of U.S. dollar–based assets and
12
liabilities into pesos (pesification) and a mandatory rescheduling of term deposits. In addition, the
government converted U.S. dollar–denominated contracts of private and public utilities into pesos at an
exchange rate of 1 peso per U.S. dollar, while not allowing public utility rates to rise (Economist Intelligence
Unit 2002). Following these policies, most foreign companies cut back financial support to their affiliates in
the country, postponed new investments, repatriated profits, and paid back inter-company loans. Some
companies tried to find new strategic partners, while a few others sold off their assets.5 As a result, FDI
flows to the region’s services sector fell by $20 billion (53 percent) in 2002. The decline was especially
sharp in infrastructure (37 percent) and financial services (65 percent).
In contrast to the service sector, FDI in the primary and the manufacturing sectors did not decline as
much following the devaluation in Argentina and Brazil. Indeed, many auto companies increased FDI in
these countries as they reoriented their sales toward exports (ECLAC 2003). Even in the service sector,
investment in the software industry picked up in Argentina to take advantage of lower costs following the
currency devaluation.
While FDI has already shifted towards services sector in some Asian developing countries, it has not
yet happened in others due to the slower progress in FDI and trade policies towards the sector. This said
liberalization in the sector is ongoing and many of these countries have been receiving increasing levels of
services FDI. One of the major implications of the increasing share of services FDI in sectoral composition
is elevated importance of regulatory and institutional environment in attracting and sustaining services FDI,
particularly in face of economic turbulence. Many Asian developing countries already experienced adverse
effects of the Asian crisis, yet FDI was proved to be more stable and resilient relative to other international
capital flows such as portfolio equity and debt flows due to the assumed long-term expectations of its
investors (Box: Resilience of FDI during crises). In 1997, FDI flows were concentrated in manufacturing
sector in the region. In fact, services sector FDI increased significantly after that since many Asian
economies opened up their services sector to recover from the crisis. Increased in services sector FDI might
hinder the resilience of FDI.
5 Banks that left Argentina following the crisis include Canada’s Bank of Nova Scotia, France’s Credit Agricole, the Italian financial group Intesa Bci, and Korea’s Kookmin. In following years, several utility MNCs from OECD countries also disinvest from the region.
13
Box: The resilience of FDI during a crisis FDI flows tend to be more resilient than portfolio and debt flows during a financial crisis. This is in part due to the fact that direct investments are usually long-term strategic decisions that may not be affected by a financial crisis that is perceived to be short-lived. On the contrary, a fall in asset prices, combined with currency devaluations, may attract more FDI especially in tradable sectors. FDI flows held up well following the crises in Mexico in 1995-96, Korea in 1998-99, Thailand in 1998-99 and Turkey in 2000-01. FDI fell, however, after the crises in Argentina and Indonesia, both of which presented increased social and political risk.
11.0
3.92.8
0.8
11.7
4.7
9.5
7.3
5.4
1.0
3.2
-0.4
9.2
6.2
9.3
3.3 3.0
-2.7
Mexico (94-96) Thailand (97-99) Korea (97-99). Turkey (99-01) Argentina (00-02) Indonesia (97-99)
FDI and financial crises$ billion
An examination of the composition of FDI financing (equity, reinvested earnings and inter-company loans) during crisis reveals that resilience of FDI can be traced to equity component of FDI. FDI investors do adjust their exposure to the countries affected by crises—even if they plan to stay—by repatriating their earnings instead of reinvesting and calling back their inter-company loans. And in some cases, these adjustments can be considerable. In the case of Thailand, inter-company loans fell 85 percent between 1997 and 1999, but the equity component of FDI actually rose 62 percent during the same period. In Indonesia, during 1998-99, inter-company loans added up to - $ 5 billion dollars. In fact, negative net FDI inflow in Indonesia between 1998 and 2003 was due to calling back inter-company loans in excess of equity flows. Similarly, dividend repatriation in excess of income is also used adjusting the exposure to a country. For example, following the Asian crisis, U.S. companies repatriated all their earnings in 1999 from Indonesia, Malaysia, Philippines and Thailand (figure below). Repatriation strategies of MNC depend, however, on a range of host- and home- country factors such as global tax implication (GDF 2004, Lehmann and Mody 2003). One factor that led to significant repatriation from Hong Kong, Singapore and Taiwan in 2005, reaching $26 billion in 2005 for example, was mainly due to temporary tax break given to US multinationals under the Homeland Investment. In fact, repatriated earnings by U.S. multinationals surged to $260 billion in 2005, well above the annual average of $65 billion over the previous five years. Figure US reinvested earnings versus FDI Income In Asian developing countries Indonesia, Malaysia, Phillipones and Thailand
IV. Emerging Multinationals from Developing Countries
The late 1980s and 1990s also witnessed the emergence of multinational companies from developing
countries as FDI investors.6 Over the last two decades, these emerging multinationals (EMNCs) have
become more engaged in cross-border economic activities, and now larger shares of their sales, assets and
operations are outside the borders of their home country. The rise of EMNCs reflects the impact of
globalization on developing countries. While the increased openness of home economies to international
capital flows and trade and increased globalization of economic activities have increased competition for
developing country firms in sales and in access to resources and strategic assets, it has also increased
opportunities in other developing and developed countries. As many developing-country governments have
eased their policies toward capital outflows, their companies have expanded their operations abroad. In fact,
the progress in the liberalization of services sector has been an important factor for the rise of EMNCs.
Privatization of state-owned assets in infrastructure sector has provided great opportunities for developing
country companies to acquire important assets domestically and expand regionally.
The increase in terms of cross-border assets and the global expansion of operations have put some
EMNCs on par with large MNCs from developed countries. In certain sectors, some EMNCs are considered
as major global players. For example, Mexican Cemex (cement) and Brazilian CVRD (mining) are number
one and four in their respective industries in the 2006 Fortune Global 500. While outward FDI from the
BRIC countries – Brazil, Russia, India and China – has received more attention (Sauvant, 2005), other
developing countries are home to new important global businesses. EMNCs from new source countries such
as Lebanon, Peru, or Uganda are now emerging. Sri Lankan firms for example are now very important
players in export-oriented clothing industry in many countries (in particular Bangladesh, India and
Madagascar).
The internationalization of developing country firms is partially explained by the well-known
investment development path (IDP) theory by Dunning: outward FDI is undertaken when the country
reaches a certain minimum development (Dunning 1981). As countries move along the IDP from the initial
stage of only receiving inward FDI, domestic firms acquire ownership and other advantages to go abroad
and the country reaches the final stage and becomes an important outward investor. This said there is some
evidence indicating that EMNCs are investing abroad at earlier stages of IDP (Unctad 2006) mainly because
many such firms do not have the luxury of waiting given the fierce competition at home and export markets
as a result of increased the level of globalization. Even in a low-income country, firms (such as business
6 Developing-country MNCs first appeared as a focus of interest about 25 years ago, with the advent of some overseas expansion by companies from a small number of countries (Lecraw 1977, Lall 1983; Wells 1983). The earliest major developing-country sources of FDI in this latter period were a small group of economies, including Argentina, Brazil, Hong Kong, India, Korea, Singapore, and Chinese Taipei. It is only since the 1990s that an increasing number of developing countries, including Chile, China, Egypt, Malaysia, Mexico, Russia, South Africa, Thailand, and Turkey, have become significant sources of FDI.
15
services of Indian Tata Consultancy or Nigerian Telecom) may develop certain comparative advantages vis-
à-vis other countries/companies in certain sectors because of large consumer and production base.
Such comparative advantages for EMNCs range from a patent, recognized brand, production
capacity to access to certain resources, knowledge of culture, language. For example, EMNCs experience
some comparative advantages in services sector vis-à-vis Northern MNCs in their regional investments—
particularly in other developing countries (South-South FDI)—because services sector often requires
proximity between producer and consumer and favor language and culture similarities. As a result, Southern
telecom giants Mexican América Movil, Egyptian Orascom and South African MTN compete fiercely with
Northern firms in their regions. In manufacturing, specialization in production has brought comparative
advantages to many developing country firms. Brazilian bus and coach producer Marcopolo have developed
flexible production system to produce custom-made busses, which they have carried to Portugal and other
Latin American countries. Jordanian Hikma’s ability to produce low-cost, diverse and high-quality
pharmaceuticals enable them to expand in other Arab countries as well as other regions. In primary sector,
Southern firms’ access to resources has helped them in terms of access to funding as well as their scale of
production while they expand their operations abroad.
Firms may also engage in internationalization by acquiring “strategic” assets (commonly through
M&A) such as technology, brands and distribution networks in case of lack or limited comparative
advantages (asset augmentation). In an environment with the increased competition in the domestic and
foreign markets due to globalization and technological advances that can erode the comparative advantages
quickly, developed and developing firms alike use cross-border takeovers as a important strategy (Unctad
2006). Recent mega deals by Cemex and CRVD as well as Chinese Lenovo’s purchase of IBM are great
examples for asset-augmenting expansion. Developing country firms expand abroad using combination both
of these strategies. For example, Egyptian telecom giant Orascom Telecom has become a major regional
telecom provider in Africa and the Middle East after investing heavily in the neighboring countries as an
asset-exploiting strategy, while its leveraged buy-out of Italian Wind Telecommunications was more an
asset-augmentation strategy.
Trends in Outward FDI flows
Globalization of operations and complex business strategies made it harder than ever to define and monitor
international operations of a multinational company. All such limitations are further magnified in the case of
FDI outflows from the South. OFDI statistics for non-OECD countries tend to be patchy and relatively
unreliable. Some of these countries that have invested abroad (such as Malaysia and Mexico) just started
reporting FDI outflows in recent years. Moreover, for several countries estimates of FDI outflows are
considerably smaller than the actual level of flows. Official statistics do not usually include financing and
reinvested components of OFDI as well as the capital that is raised abroad (Aykut and Ratha 2004). Also,
they in general only reflect the large investments while excluding small and medium size transactions. In
addition, countries with capital controls, exchange controls or high taxes on investment income provide a
substantial incentive for underreporting by investors. Several country case studies based on company level
16
-
200
400
600
800
1 000
1 200
1 400
1 600
1980 1990 2005
Latin America and the Caribbean
Africa
Other Developing
Asia
data highlight the under-reporting (Aykut and Ratha 2004). For example, Wong and Chan (2003) document
the substantial under reporting of FDI flows from China: the reported numbers reflect only investments with
official approval (which is required for initial investments only), and China’s State Administration and
Foreign Exchange estimates that unauthorized capital outflows from China between 1997 and 1999 totaled
53 billion.
Further care is required with Chinese bilateral data with Hong Kong. As FDI enjoys favorable
treatment compared to domestic investment, resulting in an incentive to investors to channel funds out of,
and subsequently into, an economy in the form of FDI. Because the funds originate in the host economy
itself, "round-tripping" inflates actual FDI inflows. Official estimates of this type of FDI are not available,
but others have suggested that such flows may account for up to 25 percent of the total inflows (Aykut and
Ratha 2004; Xiao 2004). The Chinese government has started to address this issue. In November 2005, for
example, SAFE promulgated a regulation concerning foreign exchange management related to "round-
tripping" investments (Unctad 2007). In addition, as Athukorala (2006) shows, another, perhaps even more
important, problem with Chinese FDI data has to do with “over-reporting” of inward FDI, a phenomenon
that seems to affect flows from other developing Asia countries more than OECD source countries.
Nevertheless, reported FDI outflows from developing countries rose significantly during the 1990s
reaching $143 billion in 2000 from $12 billion in 1990. After a fall following the Asian crisis, FDI outflows
from developing countries recovered to $117 billion in 2005. As of 2005, the value of outward FDI stock
held by developing countries was $1.4 billion, accounting 13 percent of world total (Figure 6). The positive
trend has continued in recent years and FDI by EMNCs reached yet another peak in 2006 as they have
started to acquire major MNCs from developed countries through mega M&A transactions.
Figure 6. Outward FDI Stocks from developing countries, by region 1985-2005
$ billion
Source: Unctad.
17
Among developing economies, EMNCs in Asia remain by far the largest source investors (Figure 6).
The NIEs accounted for almost 68 per cent of total OFDI in 1992-99 and 61 per cent in 2000-05. Adding
China, the five largest economies, all in Asia, accounted for more than two-thirds of the total in 2000-2005.
Among Hong Kong firms allocated 53.2 per cent of their total 2001-03 investment to foreign markets;
Singapore channeled 23.3 per cent; and Taiwan 6.4 per cent. For the two latter countries, a large chunk of
FDI outflows went to China. Within Asia, Malaysia, Indonesia and India are the next group of major
outward Asian investors. Reported outward FDI of India, which is already found to be almost half of the
actual outflows (Pradan 2005), increased significantly in the last few years, as Indian EMNCs were
significantly active in cross-border asset acquisition, particularly in developed countries. For example, since
2004, FDI flows from India into the United Kingdom exceeded flows from the United Kingdom to India.
Another country with significant outward FDI stocks is Russia with main investments in former
Soviet Union countries. In the Russian case, the Cypriot offshore sector has developed into a landing place
for Russian capital, to the extent that Cyprus is currently the biggest direct investor in Russia. Also, the
investment flow from (or via) Cyprus to other Eastern European countries is relatively big and a significant
share of these “Cypriot” investments is considered to be of Russian origin. In addition, some portion of the
estimated $245 billion capital flight from Russia during the 1992–2002 period is believed to be unrecorded
FDI outflows (Vahtra and Liuhto 2004). Several Latin American countries (Brazil, Mexico, Argentina and
Chile) are other major outward FDI investors. Although South Africa has been a major investor in Africa
since 1990s, its data has been influenced by major accounting adjustments rather than major outward
investment projects. FDI flows were reduced when many of the country’s traditional groups and mining
houses to transfer their primary listing from Johannesburg to London in 2005 and the reverse takeover of De
Beers by Anglo-American in 2001.
Characteristics of Main Investors
There are significant differences in terms of internationalization patterns and ownership structures among
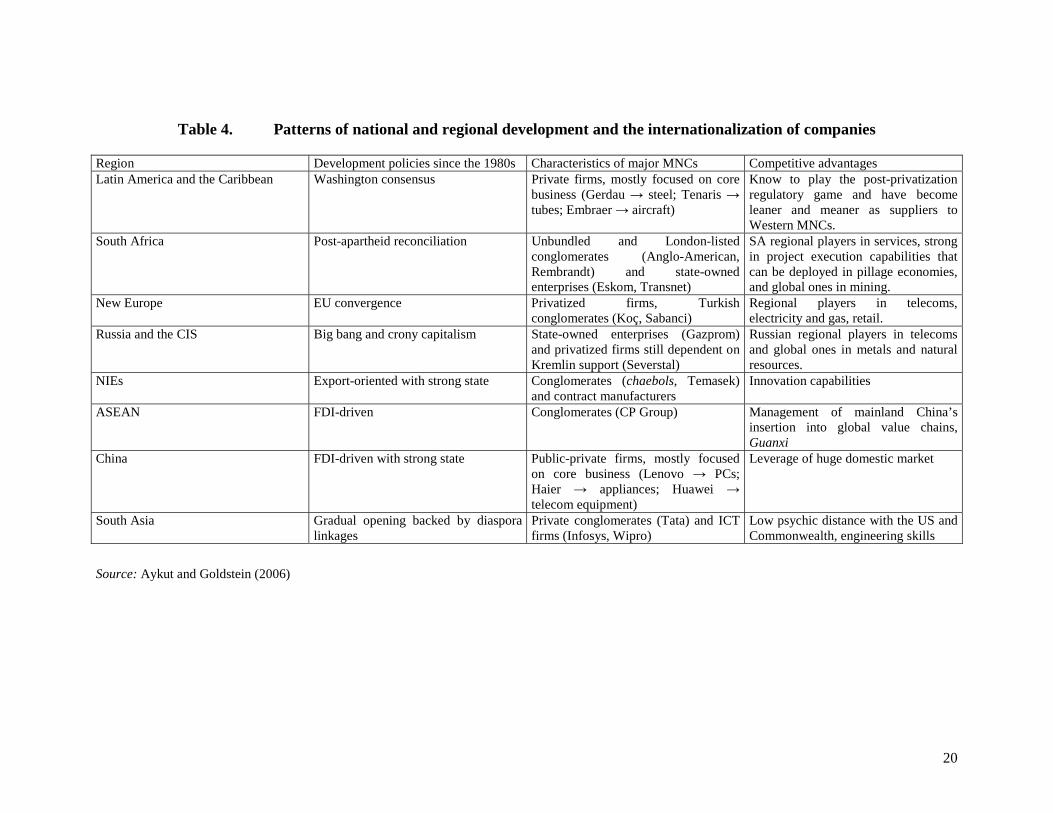
large EMNCs. As summarized in Table 4, these characteristics of major EMNCs vary considerably among
regions. In the case of Latin American MNCs, the increasing competition due to liberalization in the 1990s
has acted as a main driver and selection mechanism. After significant restructuring, the mostly privately
owned survivor firms have become far leaner and meaner and therefore are able to compete on global
markets. The car industry and in particular the manufacturing of parts and components, provides a nice
illustration. Most Brazilian and Mexican companies that had grown under import substitution
industrialization since the 1950s have been either taken over by OECD-based competitors, or gone bankrupt.
Survivors, however, have proven to be reliable suppliers to American and European assemblers, to the point
of being asked to follow their customers and invest overseas. Latin American MNCs have operations abroad
in activities such as beverages, petrochemicals, petroleum, mining, steel, cement, pulp and paper, textiles
and agribusiness, and a little or no presence in technology- or marketing-intensive products like automobiles,
electronics, telecommunication equipments and chemicals.
18
Internationalization of South African MNCs accelerated after 1990, following the removal of
sanctions and liberalization of outward FDI. To further strengthen South African investment abroad, the
Government adopted policies to encourage its TNCs to go into the rest of Africa after apartheid, and in 2004,
it eased foreign exchange restrictions on South African companies’ outward FDI. More than half of South
Africa’s FDI outflows are estimated to have gone to other countries in Africa, in other SADC members and
elsewhere. South Africa is actively supporting the Maputo Development Corridor public-private partnership,
with Nigeria, Mauritius, and the Democratic Republic of Congo also being other significant FDI recipients.
Many South African firms, mostly privately owned, have strong presence in other African countries and
outside Africa, in remarkably wide-range of sectors.
Within Asia developing countries, there are major differences among NIEs, China and South Asian
EMNCs. The internationalization of companies from NIEs has taken place in the context of rapid industrial
upgrading in the sub-region in the late 1980s. In Republic of Korea, multinational companies have evolved
from chaebols—large privately owned conglomerates supported by government polices, with increased
foreign participation in management following the financial crisis. They have mainly global focus rather
than regional. Large portion of investments are in manufacturing (automobiles, electronics, petroleum
refining) and steel production. EMNCs from Singapore that have invested abroad are mostly transformed
from state-owned to GLCs—companies in which the Government owns at least 20 per cent. Both Hong
Kong, China and Singapore have positioned themselves financial and trade centers, and have become home
for very large MNCs in services sectors.
Malaysian MNCs, mostly state-owned, operate in oil (Petronas) and infrastructure industries. China,
on the other hand, has a mix of private and state-owned outward investors but the role of state-owned in
overseas investments is still significant accounting for 43 percent of outward FDI stock in 2003 (Giroud
2005). While state-owned companies invest abroad mainly in resource-related assets, privately owned
EMNCs operate in competitive manufacturing sectors such as consumer electronics (Haier), personal
computers (Lenovo) and communication technologies. Although India’s largest MNC, Oil and Gas
Corporation (ONGC), is state-owned, most Indian MNCs privately owned. Following the liberalization in
the mid 1990s, Indian firms have leveraged their language and engineering skills and have become important
global players in several services sectors including software and IT-enabled business services (Unctad
2006). This said most of their outward FDI stock is still in manufacturing. However, overseas investment
related with financial services (for countries with large Indian diasporas), pharmaceuticals and software and
IT business services are increasing.
Not all the outward investments are made by large EMNCs, however. As of 2005, in China and
India, the number of EMNCs was 3429 and 1700, respectively and most of them are small and medium-size
enterprises (SMEs) with limited cross-border investment. Several country case studies show that small and
medium-size enterprises (SMEs) from developing countries contribute a considerable share of overseas
investment in developing countries. In India, for example, SMEs accounted for 26 percent of overseas
19
projects (6.7 percent of the value) in manufacturing and 41.1 percent (47.1 percent of the value) in the
software industry (Pradhan 2005).
20
Table 4. Patterns of national and regional development and the internationalization of companies Region Development policies since the 1980s Characteristics of major MNCs Competitive advantages Latin America and the Caribbean Washington consensus Private firms, mostly focused on core
business (Gerdau → steel; Tenaris → tubes; Embraer → aircraft)
Know to play the post-privatization regulatory game and have become leaner and meaner as suppliers to Western MNCs.
South Africa Post-apartheid reconciliation Unbundled and London-listed conglomerates (Anglo-American, Rembrandt) and state-owned enterprises (Eskom, Transnet)
SA regional players in services, strong in project execution capabilities that can be deployed in pillage economies, and global ones in mining.
New Europe EU convergence Privatized firms, Turkish conglomerates (Koç, Sabanci)
Regional players in telecoms, electricity and gas, retail.
Russia and the CIS Big bang and crony capitalism State-owned enterprises (Gazprom) and privatized firms still dependent on Kremlin support (Severstal)
Russian regional players in telecoms and global ones in metals and natural resources.
NIEs Export-oriented with strong state Conglomerates (chaebols, Temasek) and contract manufacturers
Innovation capabilities
ASEAN FDI-driven Conglomerates (CP Group) Management of mainland China’s insertion into global value chains, Guanxi
China FDI-driven with strong state Public-private firms, mostly focused on core business (Lenovo → PCs; Haier → appliances; Huawei → telecom equipment)
Leverage of huge domestic market
South Asia Gradual opening backed by diaspora linkages
Private conglomerates (Tata) and ICT firms (Infosys, Wipro)
Low psychic distance with the US and Commonwealth, engineering skills
Source: Aykut and Goldstein (2006)
21
Geographic Distribution
EMNCs tend to invest regionally and in other developing counties (South-South) where they have acquired a
certain familiarity through trade, or ethnic and cultural ties before going global. As a result, there is a
significant South-South expansion and regional aspect to EMNCs outflows. For example, supported by
government policies, South African investments in other developing countries are almost completely in the
southern part of Africa (Goldstein 2003). Following trade liberalization in Latin America, multinationals
from Argentina, Brazil, and Chile expanded their operations mainly in other developing countries in the
region (Chudnovsky and Lopez 2000). Russian investments abroad have primarily been in the countries of
the former Soviet Union. Turkey has also been actively investing regionally, particularly in West and
Central Asia, and Russia.
Intra-regional South-South FDI flows are also significant for most of the Asian developing
countries. In fact, the internationalization of East Asian EMNCs is closely intertwined with the evolving
regional institutional and policy context. Most of these countries are usually part of regional production
process making each other preferable investment destination. In addition, the emergence of South-East
Asian EMNCs is part of overall internationalization process of “ethnic Chinese” business in Asia
(Weidenbaum and Hughes 1996) and large number of these companies have become major regional players.
On the contrary, Indian EMNCs invest in the neighboring countries such as Bangladesh and Nepal, they
have begun to go to the West rather than going to the East and expanding in the rest of Asia. As a result,
United States is the main destination for Indian EMNCs followed by Russia Federation, Mauritius and
Sudan.
There is also some indication that strong economic and cultural ties play a role when these
companies invest in developed countries. For example, almost all FDI outflows from Latin America to high-
income OECD countries went to the US and Spain. Major investment destinations for many East Asian
investors are Australia. Further, the UK receives 40 per cent of African – mainly South African –
investments to high-income OECD countries.
Regional investments are also encouraged by many governments and regional arrangements. For
example, Malaysia supports special deals for FDI outflows to countries such as India, the Philippines,
Tanzania, and Vietnam (Mirza 2000). The Thai government actively promotes Thai firms’ involvement in
infrastructure projects in selected developing countries in the region (UNCTAD 2005a). Some of the
regional arrangements offer various incentives for outward investment within the region, including lower tax
and tariff rates and easier profit repatriation. Encouraged by cooperation arrangements, ASEAN countries
have been the top destination for Thai companies (Mathews 2005). Some members of the regions maintain
bilateral investment agreements and double-taxation treaties.
22
Policy Implications
Increased internationalization of developing country firms may have significant development policy
implications particularly in the context of regional South-South FDI. One well-documented important
feature of regional South-South FDI flows is its importance for low-income and small economies. Among
other destinations, EMNCs tend to invest also in other neighboring developing countries with a similar or
lower level of development than their home country. Hence, South-South FDI flows, however small, may be
significant to many poor countries. Similar to other regions, for Asian low income countries Bangladesh,
Cambodia, Lao People’s Dem. Rep., Myanmar and Nepal, regional South-South FDI accounts more than 50
per cent of FDI inflows. Last year, India’s Tata Group secured the approval for a $2.5 billion investment
project in Bangladesh, however investment is now on hold due to upcoming elections in Bangladesh. If
finalized, it will be the largest foreign investment in the country. Hence, EMNCs represent an opportunity
for receiving more FDI for low-income countries apart.
Also, the enlargement and diversification of the pool of countries’ sources of FDI may temper
fluctuation, positively contributing to the economic development of host countries. In fact, following the
Argentinean default, while North-South FDI slumped, several assets were bought by Brazilian investors. For
example, in May 2002 AmBev, a leading beer and beverages producer, unveiled plans to purchase a one-
third share of Argentina’s top beer-maker, Quilmes, a deal valued at $700m. That was the first major foreign
investment since the default. That same year Petrobras, the oil company, bought a controlling stake in Perez
Companc for some $1.1 billion.
This said FDI flows from other developing countries may pose risks as well as benefits. The
operational and financial challenges facing developing-country multinationals, coupled sometimes with
deterioration in host-country economic conditions, have contributed to several examples of unsuccessful
South–South investment followed by disinvestments. In addition, the increased South-South integration
could also lead to increased vulnerability of developing countries to an economic crisis. The rise of cross-
border flows between developing countries makes it likely that it will become easier for shocks to be
transmitted between developing countries. For example, given the large share of South-South FDI flows in
among Asian developing countries, significant drop [Try to find examples for SS-FDI investor reaction in
case of Asian crisis; correlate inflows and outflows]
23
V. Conclusion (TBC)
As a result of technological progress and policy reforms both in developed and developing countries, FDI
flows have evolved in terms of its mode, the sectors it goes to and in terms of who is investing over the
years. Today, developed and many developing countries alike, services sector has become the major sector
attracting investment from foreign MNCs. And these MNCs are only from developed countries but also from
developing countries. Developing country MNCs are not necessarily inferior to their developed country
competitors in terms of technology; managerial skills and access to capital, however. On the contrary in
some of them are major global players in their fields.
Many Asian economies have not only experienced these changes rather have been the leading forces
behind them. FDI flows in developing Asia region has shifted towards services sectors and services FDI is
in the region is expected to rise in coming years as impediments to such flows that are prevalent in many
Asian economies are continued to be eased. The sectoral shift in FDI may have implications in terms of its
sustainability and its resilience in face of economic turbulences. The non-tradability nature of most services
sectors products and their high dependence on countries macroeconomic conditions and institutional
framework make it more sensitive to sudden macro-economic shocks especially when they are coupled with
deterioration in institutional and regulatory framework.
The number of EMNCs from developing Asia has grown rapidly and continues to grow. Most of
them are active investors in the region with increasing favorable global positions. Hence, South-South FDI
flows have been significant in the region. Its role has been very important not only for Asian countries with
smaller and less developed markets, but also larger economies such as China. While the diversification of
the pool of countries’ sources of FDI may temper fluctuation, positively contributing to the economic
development of host countries, increased South-South integration could also lead to increased vulnerability
of the region developing countries to an economic crisis.
24
References Athukorala, Prema-chandra (2006), Multinational Enterprises in Asian Development, Cheltenham, UK:
Edward Elgar. ---- and S. K. Jayasuriya (1988), “Parentage and Factor Proportions: A Comparative Study of Third-World
Multinationals in Sri Lankan Manufacturing”, Oxford Bulletin of Economics and Statistics, Vol. 50, No. 4: 409-23.
Aykut, Dilek, and Dilip Ratha (2004), “South–South FDI flows: how big are they?,” Transnational
Corporations, Vol. 13, No.1. Aykut, Dilek and Andrea Goldstein (2006), “Developing Country Multinationals: South-South Investment
Comes Of Age”, Working Paper # 257, OECD Development Centre. Chudnovsky, Daniel and Andres Lopez, “A third wave from developing countries: Latin American TNCs in
the 1990s,” Transnational Corporations, Vol. 9, No. 2, 2000.
Giroud Axele. 2005. “Chinese outward FDI.” Background paper for the UNCTAD Conference “Enhancing the Productive Capacity of Developing Country Firms through Internationalization”
Goldstein, Andrea. 2003. “Regional Integration, FDI, and Competitiveness: the case of SADC,” prepared for Africa Investment Roundtable, 19 November 2003, OECD.
IMF-World Bank (2005), FDI Monitoring Working Project—Series of interviews with major investors both from developing and developed countries.
Lall, Sanjaya (ed.) (1983), The New Multinationals: The Spread of Third World Enterprises, Chichester:
Wiley. Lecraw, Donald (1977), “Direct Investment by Firms from Less Developed Countries”, Oxford Economics
Papers, Vol. 29, No. 3: 442-457. Levy-Yeyati, Eduardo, Ugo Panizza, and Ernesto Stein (2002), “The cyclical nature of North-South FDI
flow”, IADB Research Department, Working paper, No. 479. Mathews, John (2006), Strategizing, Disequilibrium, and Profit, Palo Alto, CA: Stanford University Press. Mirza, Hafiz. 2000. “The Globalization of Multinational Enterprise Activity and Economic Development.”
Chapter 9: Business and East Asian Developing-Country Multinationals” St.Martin’s Press.
Pradhan, Java Prakash, “Outward Foreign Direct Investments from India: recent Trends and Patterns,” mimeo, Centre for the Study of Regional Development, Jawaharlal Nehru University, New Delhi, 2005.
Sauvant, Karl P. (2005), “New Sources of FDI: The BRICs”, The Journal of World Investment and Trade, Vol. 6, No. 5: 639-711.
UNCTAD (various years), World Investment Report, Geneva.
25
----------(2005a), “Internationalization of Developing-Country Enterprises through Outward Foreign Direct Investment”, prepared for the Commission on Enterprise, Business Facilitation and Development, Expert Meeting on Enhancing Productive Capacity of Developing-Country Firms through Internationalization, Geneva, 5–7 December, TD/B/COM.3/EM.26/2.
Weidenbaum and Hughes 1996, “The Bamboo Network: How Expatriate Chinese Entrepreneurs Are Creating A New Economic Superpower in Asia” (New York: Free Press) Wells, Louis T. Jr. (1983), Third World Multinationals: The Rise of Foreign Investment from Developing
Countries, Cambridge, Mass.: The M.I.T. Press. World Bank (various years), Global Development Finance, Washington, DC.