Page 1
Emerging trends in Land and Ecosystem Accounting
Richard Mount, Environmental Accounts Lead,
Environmental Information Services Branch 29th November 2013
BoM Vision
Providing Australians with environmental
intelligence for safety, sustainability,
well-being and prosperity
Page 3
Ecosystem accounting theory
(drawing on the SEEA Experimental Ecosystems Accounting
conceptual model)
Page 4
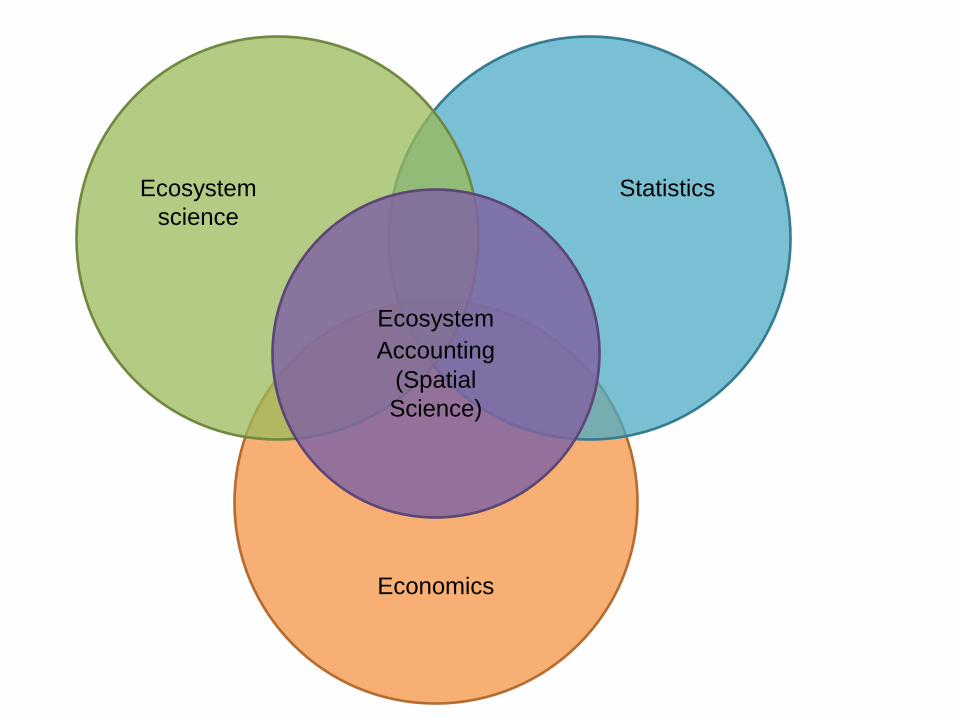
Economics
Statistics Ecosystem
science
Ecosystem
Accounting (Spatial
Science)
Page 5
Defining an ecosystem
International Convention on Biological Diversity definition:
• “dynamic complex of plant, animal and micro-organism communities and their non-living environment interacting as a functional unit”*
However, an “ecosystem” per se is not a useful construct as it does not exist as a separable, discrete entity
• Not possible to have a single standard map of Australian ecosystems
SEEA accounting conceptual model identifies
• "ecosystem assets"
• "ecosystem services"
*Source: Article 2 Use of Terms, Convention on Biological Diversity, 2003
Page 6
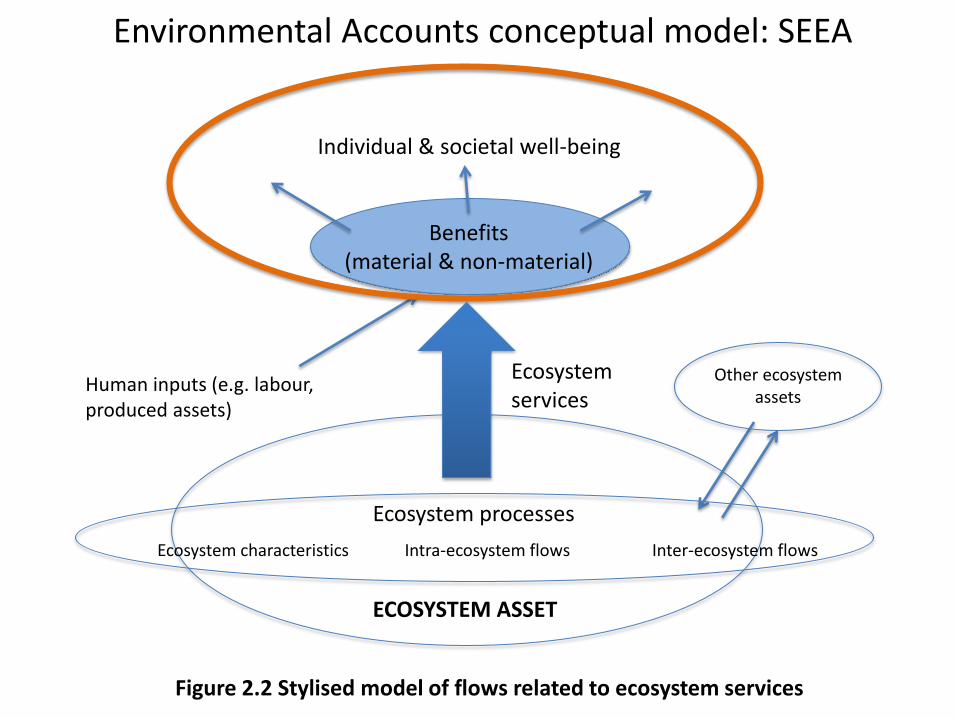
ECOSYSTEM ASSET
Ecosystem characteristics Intra-ecosystem flows Inter-ecosystem flows
Ecosystem processes
Other ecosystem assets
Individual & societal well-being
Benefits (material & non-material)
Ecosystem services
Human inputs (e.g. labour, produced assets)
Figure 2.2 Stylised model of flows related to ecosystem services
Environmental Accounts conceptual model: SEEA
Page 7
Mark Eigenraam et al., 2013, DSE, Victoria
Page 8
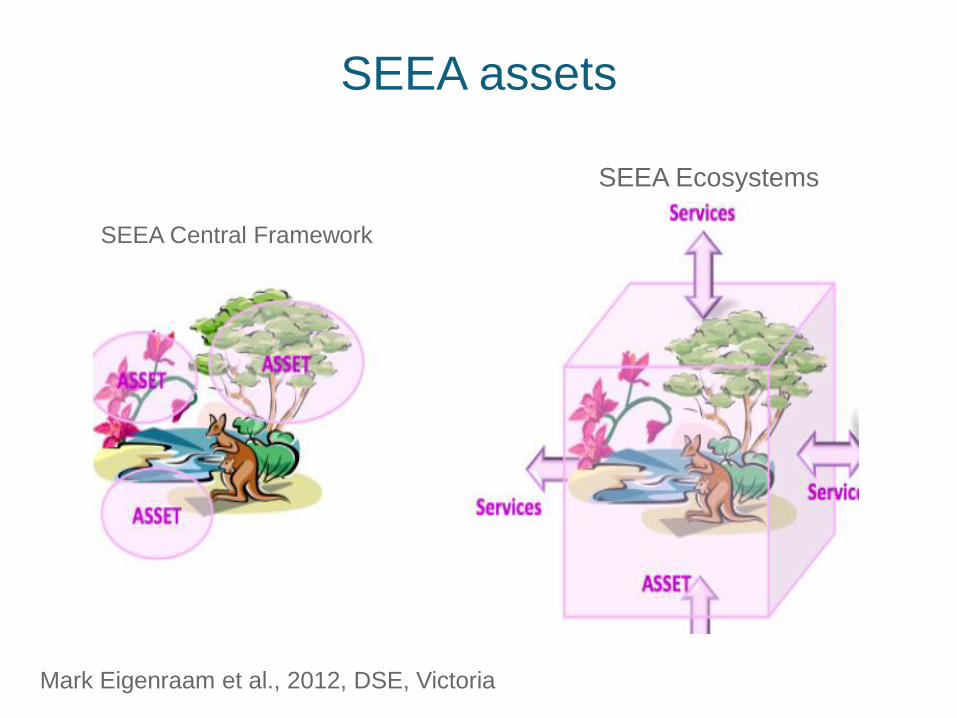
SEEA assets
Mark Eigenraam et al., 2012, DSE, Victoria
SEEA Central Framework
SEEA Ecosystems
Page 9
Ecosystem accounting activity in Australia
Page 10
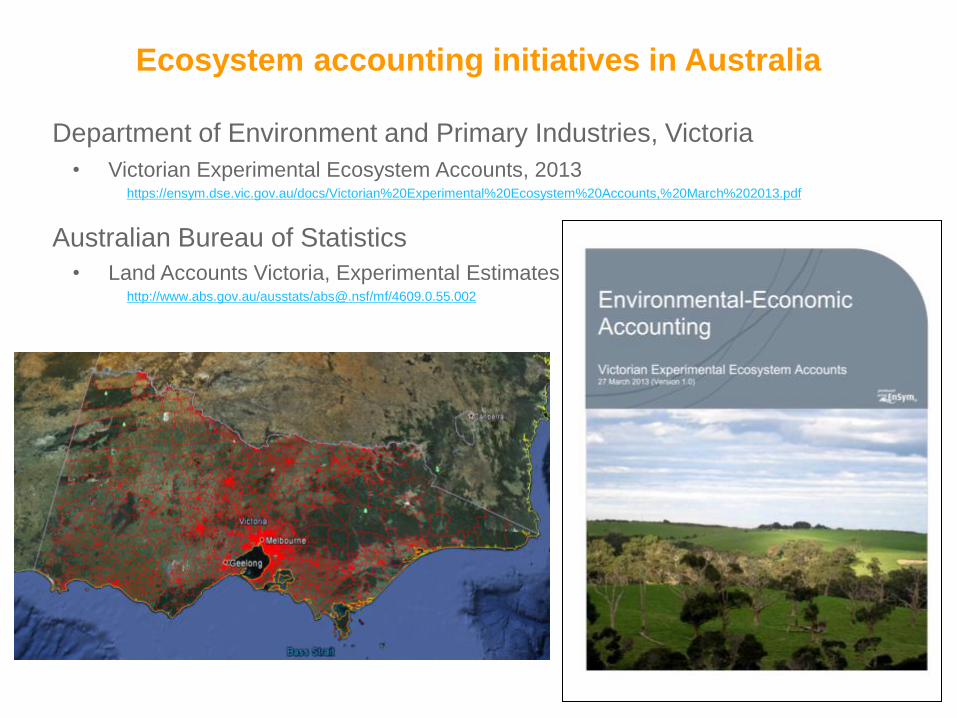
Ecosystem accounting initiatives in Australia
Department of Environment and Primary Industries, Victoria
• Victorian Experimental Ecosystem Accounts, 2013 https://ensym.dse.vic.gov.au/docs/Victorian%20Experimental%20Ecosystem%20Accounts,%20March%202013.pdf
Australian Bureau of Statistics
• Land Accounts Victoria, Experimental Estimates 2012 http://www.abs.gov.au/ausstats/[email protected] /mf/4609.0.55.002
Page 11
Ecosystem accounting initiatives in Australia
Australian Bureau of Statistics
• Land Account: Great Barrier Reef Region, Experimental Estimates, 2011 http://www.abs.gov.au/ausstats/[email protected] /mf/4609.0.55.002
• Land Accounts Victoria, Experimental Estimates, 2012 http://www.abs.gov.au/ausstats/[email protected] /mf/4609.0.55.002
• Land Accounts Queensland, Experimental Estimates, 2013 http://www.abs.gov.au/ausstats/[email protected] /mf/4609.0.55.002
• Experimental Land and Ecosystem Account Great Barrier Reef Region, 2014(?)
Page 12
Ecosystem accounting initiatives in Australia
Bureau of Meteorology
• 2013 The environment accounts landscape (review paper)
http://www.bom.gov.au/environment/doc/environmental_accounts_landscape.pdf
• 2013 Guide to Environmental Accounting in Australia (released 11
December 2013)
http://www.bom.gov.au/environment/activities/accounts.shtmlf
• Trials
• Carbon Cycle (Mass Balance) trials (report on request)
• Murray—Darling River trials (soon to be posted on the web)
• Research
• Carbon, water and biodiversity infrastructure
Page 13
Other ecosystem accounting initiatives in Australia
Department of Agriculture
• 2012 Discussion paper on Ecosystem Services http://www.daff.gov.au/natural-resources/ecosystem-services/ecosystem-services-report
Department of the Environment
• 2010 Ecosystem services: Key concepts and applications http://www.environment.gov.au/biodiversity/publications/ecosystem-services.html
South East Queensland Catchments • 2012 Ecosystem Services Framework SEQ
http://www.ecosystemservicesseq.com.au/
Australia 21 Ecosystem Services
• Ecosystem Services discussion papers http://www.australia21.org.au/research-archive/australians-in-the-landscape-2/ecosystem-services/#.Uor-X9JkPAk
Wentworth Group and Natural Resource Management Regions
• 2008 Accounting for Nature (2012-13 trials to be published soon – assets focus) http://www.wentworthgroup.org/
Page 14
Experimental Biodiversity Accounting
Suzi Bond, Jane McDonald & Michael Vardon
[email protected]
[email protected]
[email protected]
Page 15
Linking biodiversity to policy and decision–making
Land use and profitability can inform land use planning and
conservation planning
Land use and profitability accounts in conjunction with
biodiversity accounts facilitates the analysis of where in the
landscape high profits and food can being produced for a
given level of biodiversity (Polasky et al. 2008).
Spatially linking biodiversity accounts to mapped threats can
assist in the identifying where to invest in threat
management for the greatest return for biodiversity at least
cost (Carwardine et al. 2012; Evans et al. 2011).
Page 16
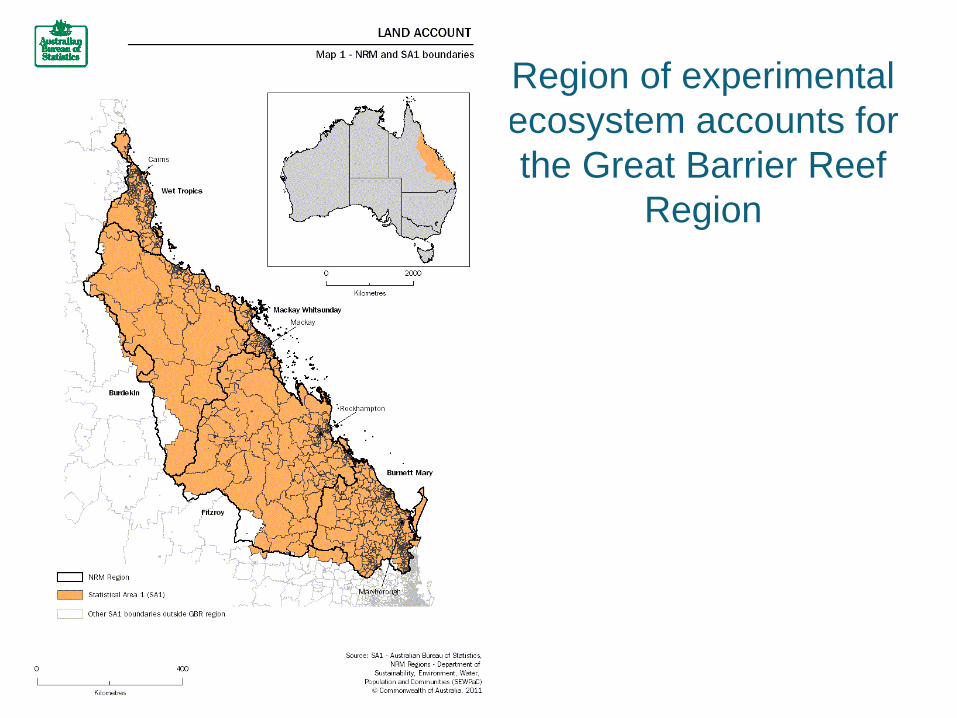
Region of experimental
ecosystem accounts for
the Great Barrier Reef
Region
Page 17
Index of bird species richness for the Great Barrier
Reef 1972 and 2011 (100 m grid)
Page 18
Method
Figure: The proportion of
species remaining in each
100 m x100 m cell (A) is
calculated by estimating
the proportion of habitat
remaining in the local
landscape and applying
the species-area curve.
Brooks et al
Snew/Soriginal=(Anew/Aoriginal)z
Figure from Fahrig 2013
Page 19
Bird Species Richness Stocks by
Agricultural Profit
Page 20
Change in Biodiversity Stocks by
Agricultural Profit
Page 21
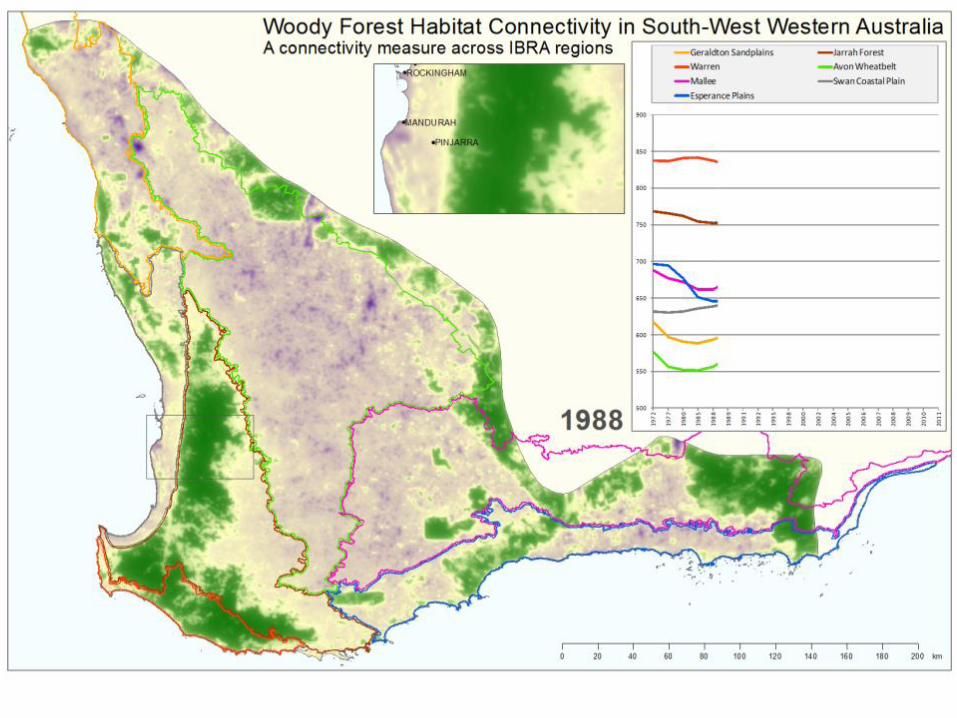
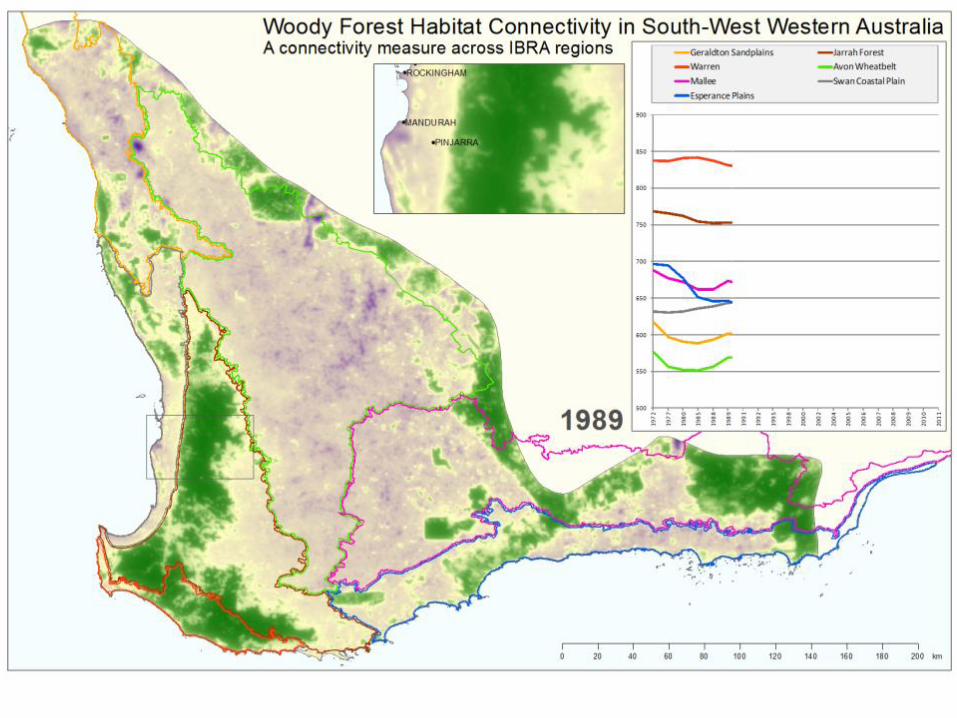
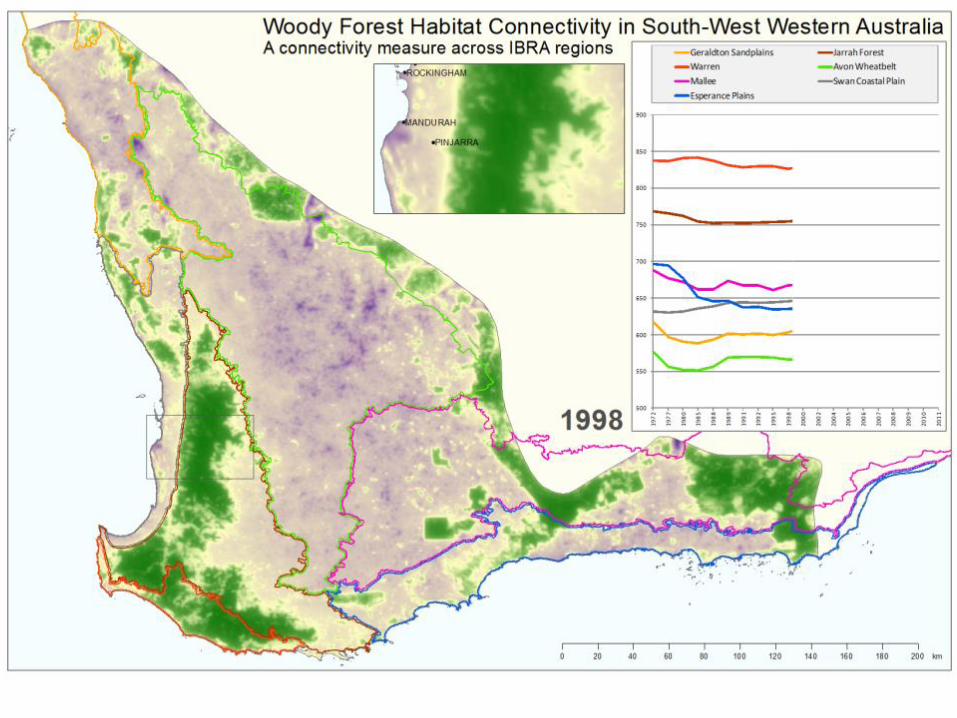
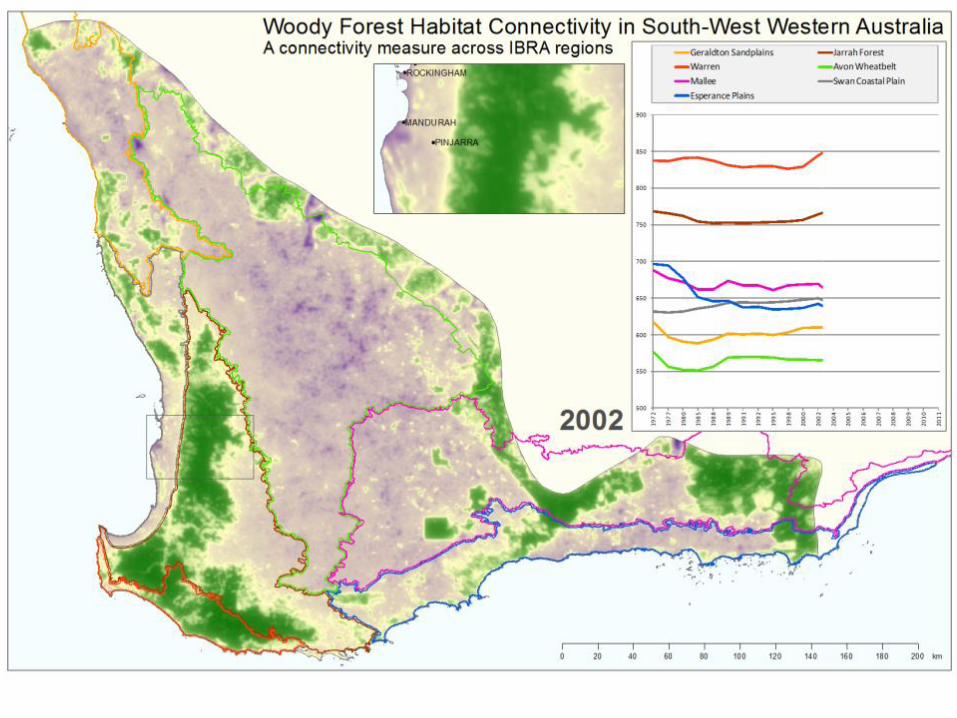
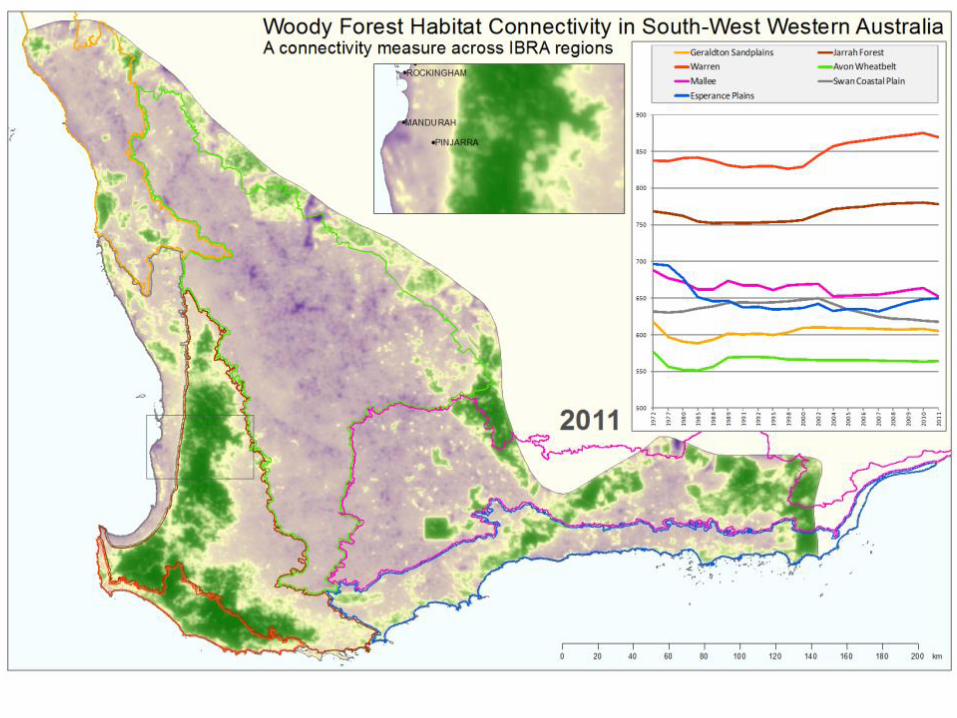
Vegetation Connectivity measures
Source: ERIN, Department of the Environment
Page 22
Model of connectivity, suitable for a range of questions,
at useful scales and something to tell us how
connectivity is changing.
Need
Page 23
Statistics that are ecologically
relevant, scientifically robust and
suitable for comparing
fragmentation and connectivity
within and between areas, and
through time.
Connectivity Statistics
Page 24
Scale
The index is based on
combining
• available habitat
• separation of habitat
• habitat condition
at different scales i.e.
1, 2, 4 ... 32 km.
This is to ensure the
surrounding landscape
context is taken into
consideration
Page 46
Pathways to ecosystem accounting
Taking a 'building blocks' approach to biophysical asset accounts
• Carbon, water and energy cycle accounts
• Biodiversity-related accounts
• Vegetation accounts (extent, connectivity)
• Marine water quality accounts
Challenges
• Ecosystem science: complexity
• Valuation: monetary and non-monetary valuation
• Scales: regional and national accounts have different purposes
• Technical: spatial analysis and data challenges
Page 47
Richard Mount
Environmental Information Services Branch
Bureau of Meteorology
0427 020 277
[email protected]
THANK YOU FOR LISTENING
Questions?