18
Presentation Title 1 Emirates NBD H1 2020 Results Presentation 20 July 2020 2019

Presentation Title 1
Emirates NBDH1 2020 Results Presentation
20 July 2020 2019
2
Important Information
Disclaimer
The material in this presentation is general background information about Emirates NBD's activities current at the date of the
presentation. It is information given in summary form and does not purport to be complete. It is not intended to be relied upon as
advice to investors or potential investors and does not take in to account the investment objectives, financial situation or needs of any
particular investor. These should be considered, with or without professional advice when deciding if an investment is appropriate.
The information contained here in has been prepared by Emirates NBD. Some of the information relied on by Emirates NBD is
obtained from sources believed to be reliable but does not guarantee its accuracy or completeness.
Forward Looking Statements
It is possible that this presentation could or may contain forward-looking statements that are based on current expectations or beliefs,
as well as assumptions about future events. These forward-looking statements can be identified by the fact that they do not relate only
to historical or current facts. Forward-looking statements often use words such as anticipate, target, expect, estimate, intend, plan,
goal, believe, will, may, should, would, could or other words of similar meaning. Undue reliance should not be placed on any such
statements because, by their very nature, they are subject to known and unknown risks and uncertainties and can be affected by
other factors that could cause actual results, and the Group’s plans and objectives, to differ materially from those expressed or implied
in the forward-looking statements.
There are several factors which could cause actual results to differ materially from those expressed or implied in forward looking
statements. Among the factors that could cause actual results to differ materially from those described in the forward-looking
statements are changes in the global, political, economic, business, competitive, market and regulatory forces, future exchange and
interest rates, changes in tax rates and future business combinations or dispositions.
Emirates NBD undertakes no obligation to revise or update any forward looking statement contained within this presentation,
regardless of whether those statements are affected as a result of new information, future events or otherwise.

3
Emirates NBD maintains strong balance sheet and good profitability despite increased impairments in H1-20
Key Metrics 2020 Macro themes
Financial & Operating Performance
H1 20202020
Guidance
Profit
Operating ProfitAED 4.4 Bn-19% y-o-y
Net ProfitAED 4.1 Bn -45% y-o-y
NIM 2.84% 2.55-2.65%
Cost to income 31.7% 33 %
Credit QualityNPL Ratio 5.8% Increasing
Coverage Ratio 116.9% Strong
Capital
CET 1 15.3%
Tier 1 17.3%
CAR 18.5%
LiquidityLCR 152.5%
ADR 96.1% Increasing
Assets Loan Growth 1%Low/mid-single
digit
Regional Global
• Strong Government and Regulatorysupport to mitigate effects of Covid-19
• PMI back in expansion territory in June following five months of contraction
• Strong central bank and government efforts to cushion Covid-19 effects through monetary and fiscal stimulus
• Unprecedented economic impact due to Covid-19 related shutdowns
• GCC oil sector likely to contract as OPEC+ production cuts extended
• Sharp global GDP contraction in H1-20
• Financial market volatility due to uncertain economic outlook

4
H1 2020 Financial results highlights
Highlights Key performance indicators
• Operating profit of AED 4,418 was down 19% y-o-y, or 41% excluding
DenizBank, mainly due to higher provisions. Operating profit 10% lower
than the preceding half year
• Results include DenizBank revenue of AED 3,995 Mn and net profit of AED
929 Mn
• Net interest income improved 36% y-o-y on loan growth and higher NIMs
from DenizBank and remained flat to H2-19. Excluding DenizBank, net
interest income declined 7% y-o-y
• NIMs of 2.84% improved 7 bps y-o-y helped by the positive impact from
DenizBank and declined 14 bps compared to H2-19
• Non-funded income improved 24% y-o-y and declined 7% compared to
H2-19 on lower fee income due to Covid-19 shutdown. Excluding
DenizBank, non-funded income declined 15% y-o-y
• Costs increased 42% y-o-y due to the DenizBank acquisition and improved
1% y-o-y excluding DenizBank
• Costs improved 9% compared to H2-19 on lower staff and marketing
expenses, and lower costs from DenizBank
• Impairment allowance of AED 4,211 Mn increased 243% y-o-y and 17%
over H2-19 reflecting higher ECL allowances post Covid-19. Excluding
DenizBank, impairment allowances increased 110% y-o-y
• Net profit of AED 4,091 Mn was down 45% y-o-y, or 58% excluding
DenizBank, mainly due to no repeat of the gain on disposal of Network
International shares in 2019. Net profit was down 42% compared to H2-19
• NPL ratio increased to 5.8% in H1-20
• LCR of 152.5% and ADR of 96.1% demonstrate Group’s healthy liquidity
• H1-20 net cost of risk is 172 bps as the Group continues to take strong
level of provisions in anticipation of a potential deterioration in credit quality
in subsequent quarters
AED Bn 30-Jun-20 30-Jun-19 % 31-Dec-19 %
Total assets 694.3 537.8 29% 683.3 2%
Loans 442.9 337.7 31% 437.4 1%
Deposits 460.9 366.7 26% 472.2 (2)%
ADR (%) 96.1% 92.1% (4.0)% 92.6% (3.5)%
LCR (%) 152.5% 188.8% (36.3)% 160.0% (7.5)%
NPL ratio (%) 5.8% 5.9% 0.1% 5.6% (0.2)%
AED Mn H1-20 H1-19Better /
(Worse)H2-19
Better /
(Worse)
Net interest income 9,305 6,852 36% 9,336 0%
Non-funded income 3,323 2,676 24% 3,555 (7)%
Total income 12,628 9,527 33% 12,892 (2)%
Operating expenses (3,999) (2,826) (42)% (4,381) 9%
Pre-impairment operating
profit 8,629 6,701 29% 8,510 1%
Impairment allowances (4,211) (1,226) (243)% (3,592) (17)%
Operating profit 4,418 5,474 (19)% 4,919 (10)%
Gain on disposal of stake in NI
and FV gain on retained interest- 2,066 (100)% 2,323 (100)%
Share of profits from associates
/ Gain on bargain purchase1 12 (90)% 99 (99)%
Taxation charge (328) (70) (369)% (320) (2)%
Net profit 4,091 7,482 (45)% 7,022 (42)%
Cost: income ratio 31.7% 29.7% (2.0)% 34.0% 2.3%
Net interest margin 2.84% 2.77% 0.07% 2.98% (0.14)%
Financial & Operating Performance
5
Q2 2020 Financial results highlights
Highlights Key performance indicators
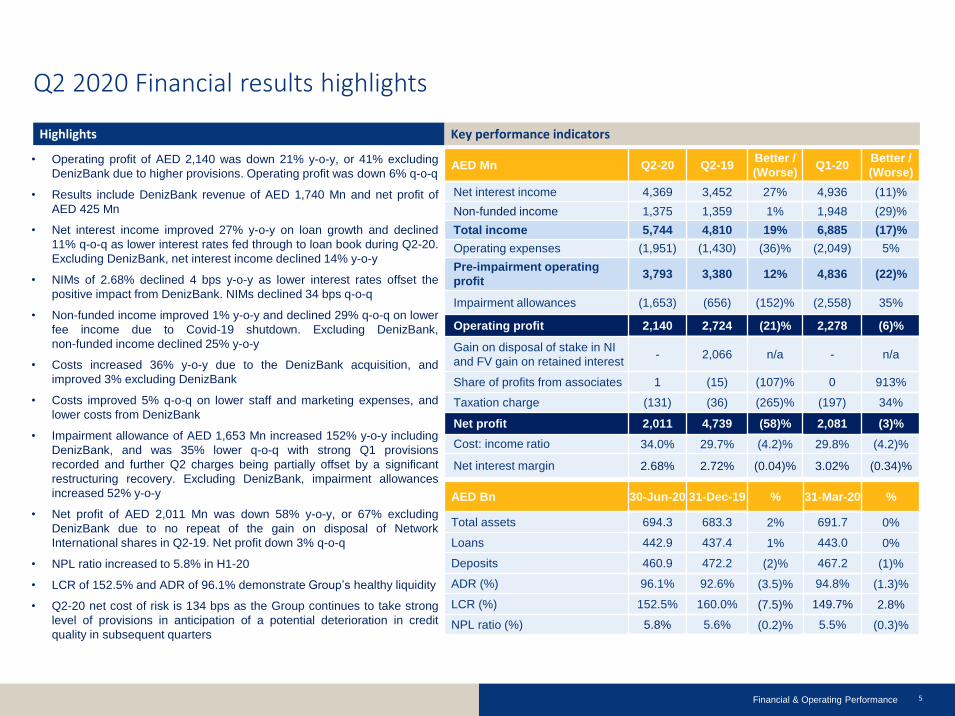
• Operating profit of AED 2,140 was down 21% y-o-y, or 41% excluding
DenizBank due to higher provisions. Operating profit was down 6% q-o-q
• Results include DenizBank revenue of AED 1,740 Mn and net profit of
AED 425 Mn
• Net interest income improved 27% y-o-y on loan growth and declined
11% q-o-q as lower interest rates fed through to loan book during Q2-20.
Excluding DenizBank, net interest income declined 14% y-o-y
• NIMs of 2.68% declined 4 bps y-o-y as lower interest rates offset the
positive impact from DenizBank. NIMs declined 34 bps q-o-q
• Non-funded income improved 1% y-o-y and declined 29% q-o-q on lower
fee income due to Covid-19 shutdown. Excluding DenizBank,
non-funded income declined 25% y-o-y
• Costs increased 36% y-o-y due to the DenizBank acquisition, and
improved 3% excluding DenizBank
• Costs improved 5% q-o-q on lower staff and marketing expenses, and
lower costs from DenizBank
• Impairment allowance of AED 1,653 Mn increased 152% y-o-y including
DenizBank, and was 35% lower q-o-q with strong Q1 provisions
recorded and further Q2 charges being partially offset by a significant
restructuring recovery. Excluding DenizBank, impairment allowances
increased 52% y-o-y
• Net profit of AED 2,011 Mn was down 58% y-o-y, or 67% excluding
DenizBank due to no repeat of the gain on disposal of Network
International shares in Q2-19. Net profit down 3% q-o-q
• NPL ratio increased to 5.8% in H1-20
• LCR of 152.5% and ADR of 96.1% demonstrate Group’s healthy liquidity
• Q2-20 net cost of risk is 134 bps as the Group continues to take strong
level of provisions in anticipation of a potential deterioration in credit
quality in subsequent quarters
AED Bn 30-Jun-20 31-Dec-19 % 31-Mar-20 %
Total assets 694.3 683.3 2% 691.7 0%
Loans 442.9 437.4 1% 443.0 0%
Deposits 460.9 472.2 (2)% 467.2 (1)%
ADR (%) 96.1% 92.6% (3.5)% 94.8% (1.3)%
LCR (%) 152.5% 160.0% (7.5)% 149.7% 2.8%
NPL ratio (%) 5.8% 5.6% (0.2)% 5.5% (0.3)%
AED Mn Q2-20 Q2-19Better /
(Worse)Q1-20
Better /
(Worse)
Net interest income 4,369 3,452 27% 4,936 (11)%
Non-funded income 1,375 1,359 1% 1,948 (29)%
Total income 5,744 4,810 19% 6,885 (17)%
Operating expenses (1,951) (1,430) (36)% (2,049) 5%
Pre-impairment operating
profit 3,793 3,380 12% 4,836 (22)%
Impairment allowances (1,653) (656) (152)% (2,558) 35%
Operating profit 2,140 2,724 (21)% 2,278 (6)%
Gain on disposal of stake in NI
and FV gain on retained interest- 2,066 n/a - n/a
Share of profits from associates 1 (15) (107)% 0 913%
Taxation charge (131) (36) (265)% (197) 34%
Net profit 2,011 4,739 (58)% 2,081 (3)%
Cost: income ratio 34.0% 29.7% (4.2)% 29.8% (4.2)%
Net interest margin 2.68% 2.72% (0.04)% 3.02% (0.34)%
Financial & Operating Performance

6
Net interest income
• Q2-20 NIM of 2.68% declined 4 bps compared to Q2-19 as lower interest
rates offset the positive contribution from DenizBank.
• H1-20 NIM of 2.84% improved 7 bps y-o-y helped by the positive impact
from DenizBank. Excluding DenizBank, H1-20 NIM of 2.40% declined 37
bps y-o-y as lower loan yields offset the benefit from lower deposit costs
• Q2-20 NIM declined 34 bps q-o-q as the reduction in loan yields offset the
impact of lower deposit costs and positive impact from DenizBank
• Fall in loan yields reflects one and three month EIBORs falling 141 and
149 bps respectively during 2020
• NIM guidance remains at 2.55-2.65% as we anticipate smaller impact on
loan yields in H2-20 as earlier rate cuts have now largely flowed through
to EIBOR rates
Q2-20 vs. Q1-20H1-20 vs. H1-19
Net Interest Margin (%)
Net Interest Margin Drivers (%)
Highlights
0.65
0.20
Q1 20
(1.30)
Q2 20Loan Yield Deposit
Cost
2.68
Treasury
& Other
0.11
DenizBank
3.02
2.82
Q4 19
2.78
2.82
Q3 18Q2 18
2.852.87
2.81
Q4 18
2.83
Q1 19
2.72
2.77
Q2 19
2.68
2.83
2.82
3.02
2.89
Q3 19 Q1 20
3.11
2.84
Q2 20
Qtrly NIM YTD NIM
Financial & Operating Performance
0.47
0.44
(0.96)
2.77
H1 19 Loan Yield H1 20Deposit
Cost
0.12
Treasury
& Other
ENBD Ex-
DenizBank
DenizBank
2.40
2.84

7
Funding and liquidity
• Q2-20 LCR of 152.5% and AD ratio of 96.1% demonstrate the Group’s
continuing healthy liquidity
• Liquid assets* of AED 102 Bn as at Q2-20 (17% of total liabilities and
22% of total deposits)
• In H1-20, AED 10.9 billion of term funding issued including two
benchmark senior public bond issues and AED 7.3 billion of private
placements with maturities out to 20 years
• In Q2, we issued $483m of private placements with a 12.1 year
weighted average life
• 93% of term liabilities maturing in 2020 re-financed during H1-20. Only
AED 800m to be re-financed
Highlights Advances to Deposit and Liquidity Coverage Ratio (%)
Maturity Profile of Debt Issued (AED Bn)Composition of Liabilities/Debt Issued (%)
*Including cash and deposits with Central Banks but excluding interbank balances and
liquid investment securities
3.0
8.5
10.0
2.7 2.3
4.5
6.9
8.2
2.3
7.3
20222020
0.3
2026 -
- 2035
2025 Beyond
2035
2021 20242023
5.3
16.1 DenizBank
Club Deal
Public & Private Placement
Maturity Profile of Debt/ Sukuk Issued AED 56.0 Bn
Financial & Operating Performance
158.7
196.5 195.3 198.8188.8
149.3160.0
149.7 152.5
0
50
100
150
200
250
Q2 19Q2 18 Q4 19Q4 18Q3 18 Q1 20Q1 19 Q3 19 Q2 20
LCR %
94.4 95.294.3 94.0
92.1 91.892.6
94.896.1
90
95
100
ADR %
LCR (%) AD Ratio (%)
Customer deposits
75%
Banks10%
Others6%
EMTNs7%
Syn bank borrow.
1%
Loan secur.0%
Sukuk1%
Debt/Sukuk9%
Liabilities (AED 612.9 Bn) Debt/Sukuk (AED 56.0 Bn)

8
Loan and deposit trends
Highlights Trend in Gross Loans by Type (AED Bn)
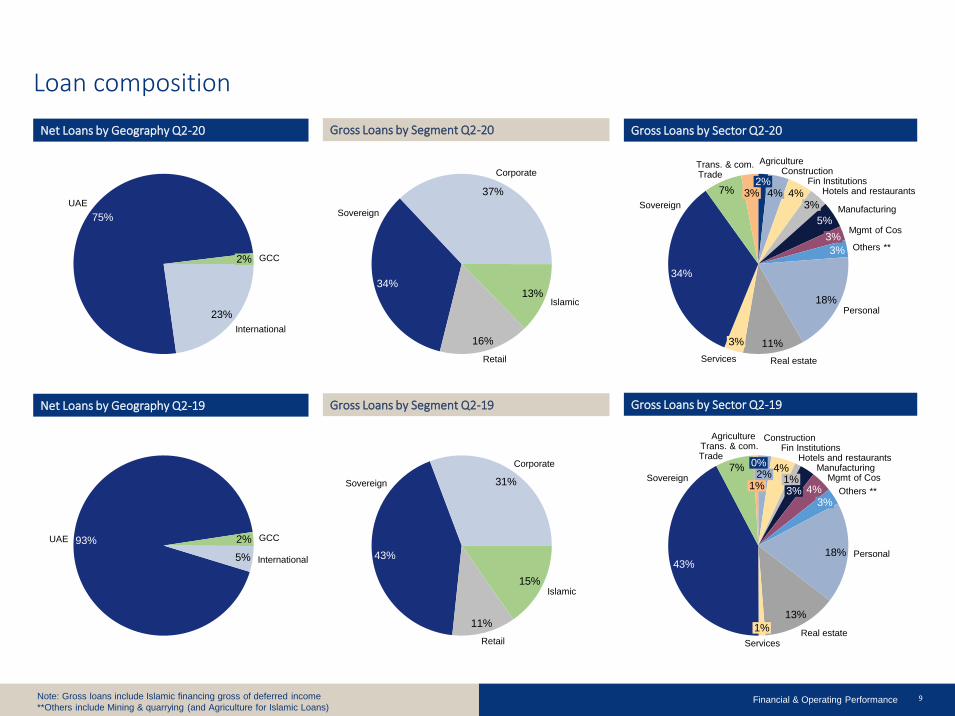
• Gross loans grew 2% since start of the year due to growth in
Corporate and Islamic financing
• Corporate lending grew 3% from end 2019 due to growth in transport
and communication and financial institutions sectors
• Consumer lending declined 6% from end 2019 due to lower credit
card and private banking activity
• Islamic financing grew 4% from end 2019 due to growth across a
range of sectors
• CASA deposits represent 49% of total Group level deposits
• Domestic CASA engine remains strong at 57%
Trend in Deposits by Type (AED Bn)
* Gross Islamic Financing Net of Deferred Income
54 55 55 56 57 57 58 60 60
37 37 41 42 41 42 43 41 40
86 87 86 87
Q2 20Q1 20
252
279351
267266
Q1 19
273
458
Q3 19 Q4 19
288
Q2 19
288343 355 364 365
Q2 18
467 475
259 258
Q3 18
474
Q4 18
+30%
+2%
Corporate
DenizBank Consumer
Islamic*
182 176 176 183 183 180 180 190 198
146 159 165 170 177 182 188 178 167
99 98 93 91
467
3677
Q1 19
468
Q3 18 Q4 18 Q3 19
7
472
359348
Q2 19
7 6335
Q4 19
6
Q1 20
5
Q2 20
77
Q2 18
6341
461
+26%
-2%
TimeDenizBank
Other CASA
Financial & Operating Performance
9
Loan composition
Net Loans by Geography Q2-20
Financial & Operating Performance
75%
23%
UAE
2%
International
GCC
93%
5% International
UAE 2% GCC
43%
31%
15%
11%
Sovereign
Corporate
Islamic
Retail
34%
37%
16%
Corporate
Sovereign
Retail
Islamic13%
Note: Gross loans include Islamic financing gross of deferred income
**Others include Mining & quarrying (and Agriculture for Islamic Loans)
4%
5%
3%
18%
11%
34%
7% 4%2%
Manufacturing3%
AgricultureConstruction
Fin InstitutionsHotels and restaurants
3%Mgmt of Cos
Services
Others **
Personal
Real estate
3%
Sovereign
Trade
3%
Trans. & com.
4%
4%
18%
13%
7%2%
0%Manufacturing
Hotels and restaurants
1%
Real estate
Fin InstitutionsConstructionAgriculture
3%
Personal
Mgmt of Cos
3%Others **
1%
Services
43%
Sovereign
Trade
1%
Trans. & com.
Gross Loans by Segment Q2-20 Gross Loans by Sector Q2-20
Net Loans by Geography Q2-19 Gross Loans by Segment Q2-19 Gross Loans by Sector Q2-19

10
• During H1-20 NPL ratio increased from 5.6% to 5.8%
• Coverage ratio at 116.9% remains strong
• H1-20 net cost of risk increased to 172 bps (374 bps for DenizBank and 126
bps Emirates NBD only) on higher net impairment charge of AED 4,211 Mn
• AED 614 Mn of write backs & recoveries in H1-20 compared to AED 527 Mn
during same period last year
• Stage 1 and 2 ECL allowances amount to AED 10.1 Bn or 2.6% of CRWA
• The Group continues to take strong level of provisions in anticipation of a
potential deterioration in credit quality in subsequent quarters
Impaired Loans* Impairment Allowances
Highlights Impaired Loan & Coverage Ratios (%)
Impaired Loans and Impairment Allowances (AED Bn)
6.0 5.8 5.9 5.9 5.94.8 5.6 5.5 5.8
123.9
128.4
120.5
Q3 18Q2 18
127.4 127.3
Q1 19Q4 18
125.8
Q2 19
126.6
Q3 19
112.3
Q4 19 Q1 20
116.9
Q2 20
NPL ratio
Coverage ratio
4.9
16.1
22.0
Q1 20
5.4 4.90.9
26.0
0.2
5.5
Q3 19
4.2
Q4 19
21.5 4.3
0.7
16.1
4.6
16.8
0.85.4
Q2 20
0.8
15.5
0.9
26.1
Q2 19
15.2
27.6+6%
+28%
DenizBank Core Corporate IslamicRetail
0.5
5.7
Q2 19
1.2
20.6
5.7
27.1
Q3 19
1.3
21.2
2.9
Q4 19
1.2
2.1
22.4
29.2
1.2
20.2
Q1 20
22.3
1.65.7 5.5
Q2 20
5.41.2
28.031.5 32.3
+3%
+19%
Credit quality
Financial & Operating Performance*Includes purchase originated credit impaired loans of AED 2.5 bn (Dec-19: AED 3 bn) acquired at fair value

11
Highlights Impairment allowances and Coverage %
Impairment allowances and Stage 1, 2 and 3 Coverage
Financial & Operating Performance
• Stage 1 coverage ratio improved to 1.2% from 1.1% in H1-20 as Stage 1
impairment allowances increased to AED 5.1 bn from AED 4.7 bn
• Stage 2 coverage ratio improved to 18.9% from 15% in H1-20 as Stage 2
impairment allowances increased to AED 5.0 bn from AED 3.6 bn
• Continued strong Stage 3 coverage ratio at 85.3%
• Customers continue to be assessed closely for stage migrations on a
case by case basis under the Covid-19 situation
• The Group has updated MEV forecasts to reflect the impact of Covid-19,
using baseline, upside and downside scenarios with 40%, 30% and 30%
weightings respectively
• The Group has also applied portfolio-level ECL adjustments to wholesale
exposures based upon affected sectors, as well as to retail customers
availing deferrals based upon employment status and level of salary
inflows
• The Group continues to assess individually significant exposures for any
adverse movements due to Covid-19
Total Gross Loans
4.7
22.220.9
3.65.0
2019
5.1
H1 2020
29.232.3
Stage 1 Stage 2 Stage 3
*Stage 3 coverage adjusted for purchase originated credit impaired loans acquired at fair value
90.4 85.3
15.0 18.9
1.1
2019
1.2
H1 2020
ECL Allowances (AED Bn) *ECL to Loan Coverage %
89%5%
6%
Stage 3Stage 1 Stage 2
89%6%
5%
2019 H1 2020
12
Non-funded income
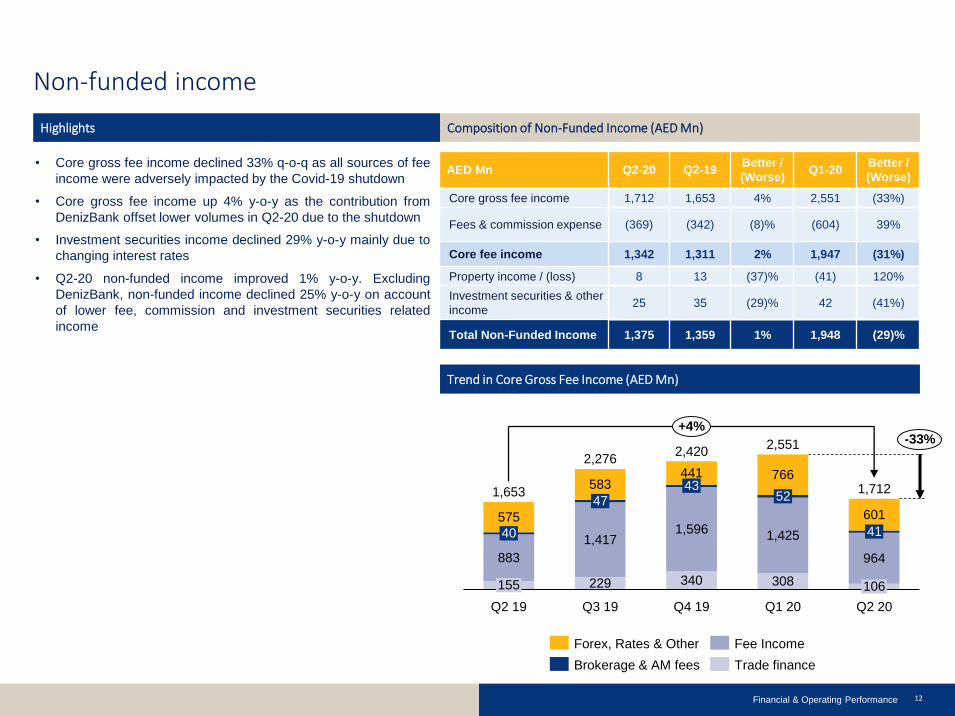
• Core gross fee income declined 33% q-o-q as all sources of fee
income were adversely impacted by the Covid-19 shutdown
• Core gross fee income up 4% y-o-y as the contribution from
DenizBank offset lower volumes in Q2-20 due to the shutdown
• Investment securities income declined 29% y-o-y mainly due to
changing interest rates
• Q2-20 non-funded income improved 1% y-o-y. Excluding
DenizBank, non-funded income declined 25% y-o-y on account
of lower fee, commission and investment securities related
income
Highlights Composition of Non-Funded Income (AED Mn)
Trend in Core Gross Fee Income (AED Mn)
229 340 308
883
1,4171,596
1,425
964
575
583441 766
60147
40
Q2 19
155
52
Q3 19
43 1,712
Q4 19
2,420
Q1 20
41
106
Q2 20
2,276
1,653
2,551 -33%+4%
Forex, Rates & Other
Brokerage & AM fees
Fee Income
Trade finance
Financial & Operating Performance
AED Mn Q2-20 Q2-19Better /
(Worse)Q1-20
Better /
(Worse)
Core gross fee income 1,712 1,653 4% 2,551 (33%)
Fees & commission expense (369) (342) (8)% (604) 39%
Core fee income 1,342 1,311 2% 1,947 (31%)
Property income / (loss) 8 13 (37)% (41) 120%
Investment securities & other
income25 35 (29)% 42 (41%)
Total Non-Funded Income 1,375 1,359 1% 1,948 (29)%
13
32.1
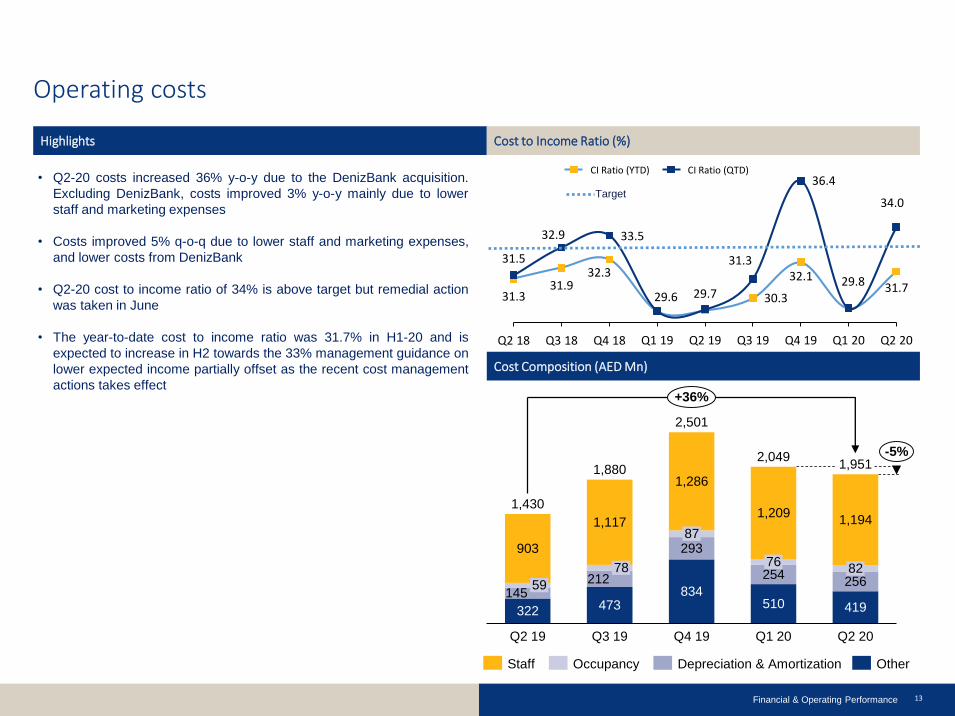
• Q2-20 costs increased 36% y-o-y due to the DenizBank acquisition.
Excluding DenizBank, costs improved 3% y-o-y mainly due to lower
staff and marketing expenses
• Costs improved 5% q-o-q due to lower staff and marketing expenses,
and lower costs from DenizBank
• Q2-20 cost to income ratio of 34% is above target but remedial action
was taken in June
• The year-to-date cost to income ratio was 31.7% in H1-20 and is
expected to increase in H2 towards the 33% management guidance on
lower expected income partially offset as the recent cost management
actions takes effect
Highlights Cost to Income Ratio (%)
Cost Composition (AED Mn)
322 473834
510 419145
212
293
254256
903
1,117
1,286
1,2091,194
Q3 19
59
76
1,430
Q2 19 Q1 20
78
87
Q4 19
82
Q2 20
2,0491,880
2,501
1,951-5%
+36%
Staff Occupancy Depreciation & Amortization Other
31.331.9
32.3
29.7 30.331.7
31.5
32.9 33.5
29.6
31.3
36.4
34.0
Q3 19Q1 19Q2 18 Q4 19Q2 19Q3 18 Q4 18
29.8
Q1 20 Q2 20
CI Ratio (YTD) CI Ratio (QTD)
Operating costs
Financial & Operating Performance
Target
14
Capital adequacy
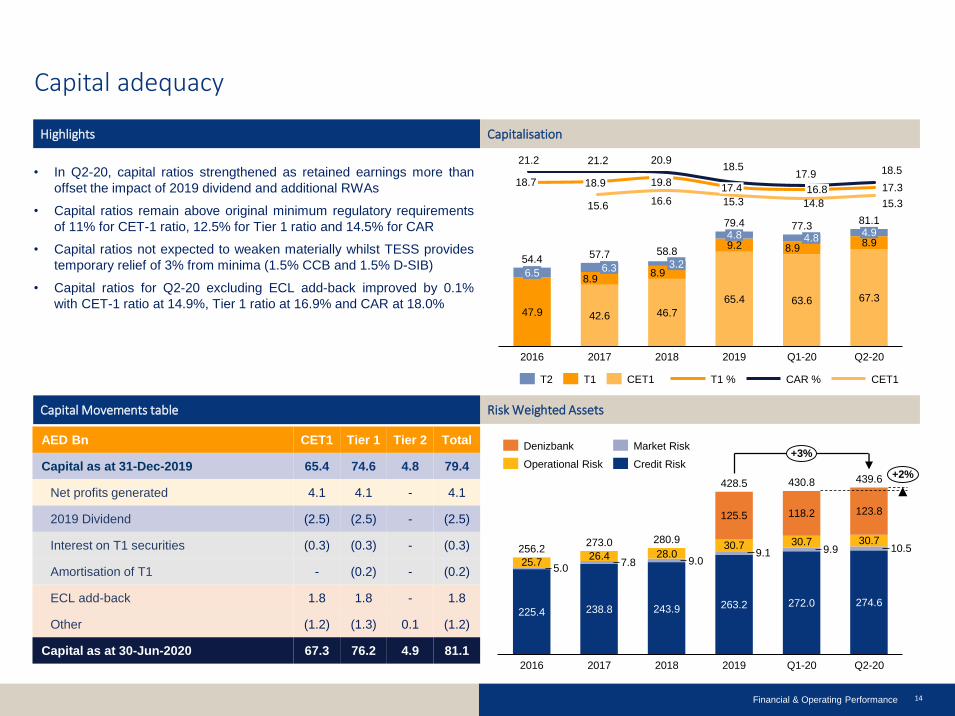
• In Q2-20, capital ratios strengthened as retained earnings more than
offset the impact of 2019 dividend and additional RWAs
• Capital ratios remain above original minimum regulatory requirements
of 11% for CET-1 ratio, 12.5% for Tier 1 ratio and 14.5% for CAR
• Capital ratios not expected to weaken materially whilst TESS provides
temporary relief of 3% from minima (1.5% CCB and 1.5% D-SIB)
• Capital ratios for Q2-20 excluding ECL add-back improved by 0.1%
with CET-1 ratio at 14.9%, Tier 1 ratio at 16.9% and CAR at 18.0%
Highlights Capitalisation
Risk Weighted Assets Capital Movements table
AED Bn CET1 Tier 1 Tier 2 Total
Capital as at 31-Dec-2019 65.4 74.6 4.8 79.4
Net profits generated 4.1 4.1 - 4.1
2019 Dividend (2.5) (2.5) - (2.5)
Interest on T1 securities (0.3) (0.3) - (0.3)
Amortisation of T1 - (0.2) - (0.2)
ECL add-back 1.8 1.8 - 1.8
Other (1.2) (1.3) 0.1 (1.2)
Capital as at 30-Jun-2020 67.3 76.2 4.9 81.1
Financial & Operating Performance
17.3
21.2 21.2 20.918.5
17.9 18.5
15.6 16.6 15.3 14.8 15.3
17.418.7 18.9 19.8
16.8
47.9 42.6 46.7
65.4 63.6 67.3
8.98.9
9.2 8.98.9
3.2
2017
6.5
2016
4.8
6.3
2018 2019
4.8
Q1-20
77.34.9
Q2-20
54.4 57.7 58.8
79.4 81.1
T2 CET1T1 CET1T1 % CAR %
5.0
238.8
2017 20192018
28.0
Q2-20
9.0
243.9
439.6
125.5
30.79.1
280.9
263.2
Q1-20
118.2
9.9
428.5
272.0
123.8
7.826.4
10.5
274.6
2016
25.7
30.7
225.4
256.2273.0
430.8
30.7
+2%
+3%Denizbank
Operational Risk
Market Risk
Credit Risk

15
Divisional performance (Excluding DenizBank)
Retail Banking & Wealth Management
Emirates Islamic
• RBWM income was down 9% y-o-y due to lower fee income as
volumes were impacted by the C-19 shutdown
• Liabilities grew by 4% supported by customer campaigns and
customer advances were lower by 7% due to reduced activity
• H1-20 cost to income ratio improved to 25.7% from 35.1% y-o-y
• Relief measures rolled out for customers to minimize the impact
of ongoing Covid-19 pandemic
• EI total income for Q2-20 was lower by 26% y-o-y reflecting the
challenging market conditions due to Covid-19 that weighed on
business activity and customer sentiment
• EI’s total assets reached AED 64.2 billion at the end of Q2-2020
• Financing and Investing Receivables increased 8% to AED 40.4
billion from end 2019
• Customer deposits at AED 45 billion, were broadly flat from end
2019. CASA balances represent 69% of total customer accounts
• EI’s headline Financing to Deposit ratio stood at 90% and is
comfortably within the management’s target range
Balance Sheet Trends AED Bn Income Trends AED Mn
Balance Sheet Trends AED Bn Income Trends AED Mn
37.5 40.445.3 45.0
Q4 19 Q2 20
+8%
-1%
Customer accounts
Financing receivables
678 671 484
1,364 1,4301,376
Q1 20Q2 19 Q2 20
2,042 2,1011,860
-11%
-9%
NFINII
204 17380
468 468
419
Q2 19 Q1 20 Q2 20
641672
499
-22%
-26%
NII NFI
Divisional Performance
45.4 42.2
153.2 159.1
Q4 19 Q2 20
-7%
+4%
Loans Deposits

16
1,2641,283
Corporate and Institutional Banking
Global Markets & Treasury
• CIB income was down 3% y-o-y mainly due to lower non-funded income.
Net interest income improved 1% y-o-y due to growth in lending activity
• Fee income declined 19% y-o-y as lower lending fees and trade
commissions more than offset the increase in investment banking activity
• The division continued to spend on digitization programs and technology to
enhance the Transaction Banking Services product offering
• Loans grew 3% during the year with stable momentum in lending activity
• Deposits grew 7% with continued focus on growing CASA balances
reflecting the Group’s aim to reduce the average cost of funding while
maintaining liquidity at an optimum level
• GM&T income declined 102% y-o-y primarily due to the decrease in net
interest income on account of lower interest rates. NFI improved 76% y-o-y
• Trading and Sales desks continued to deliver a solid performance despite
significant market volatility
• The Global Funding Desk raised AED 10.9 billion of term funding in H1
2020, including two benchmark senior public bond issues and AED 7.3
billion of private placements with maturities out to 20 years
Income Trends AED Mn
Income Trends AED MnBalance Sheet Trends AED Bn
269.4 276.9
147.2 157.5
Q2 20Q4 19
+3%
+7%
Loans Deposits
332 373 267
1,201 1,2711,216
Q2 19 Q2 20Q1 20
1,6431,533 1,483
-10%
-3%
NFINII
99 87175
132
-74
-180
Q2 19 Q1 20 Q2 20
14
-5
232
-102%
-137%
NII NFI
Divisional performance (Excluding DenizBank)
Divisional Performance
17
7.5 7.3
92.4 97.6
DenizBank Business Overview
Business Overview Financial Highlights
Financial & Operating Performance
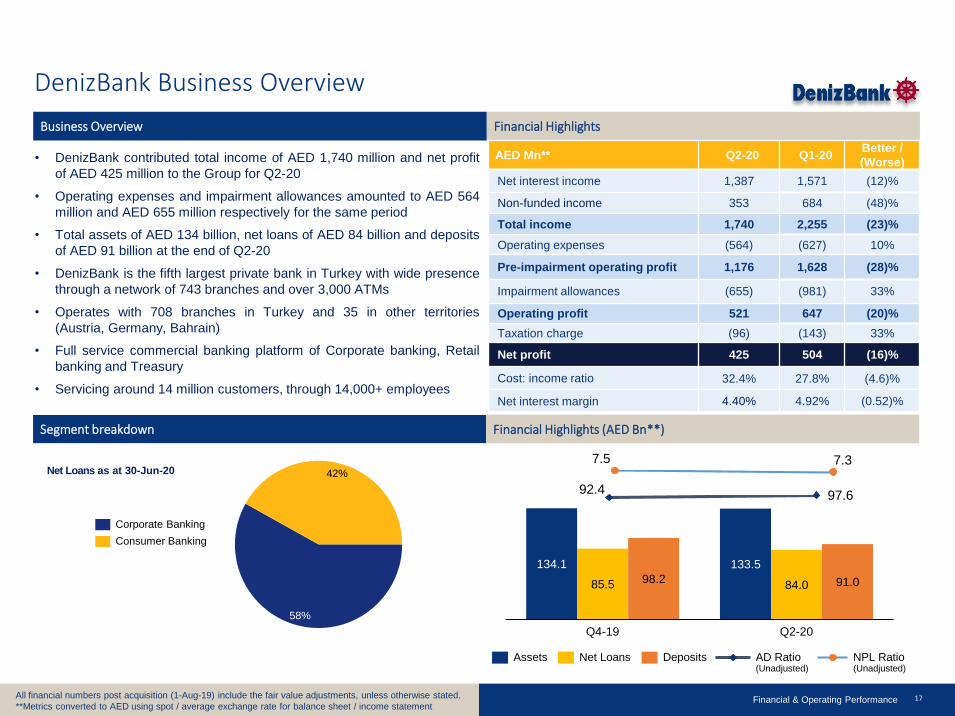
AED Mn** Q2-20 Q1-20Better /
(Worse)
Net interest income 1,387 1,571 (12)%
Non-funded income 353 684 (48)%
Total income 1,740 2,255 (23)%
Operating expenses (564) (627) 10%
Pre-impairment operating profit 1,176 1,628 (28)%
Impairment allowances (655) (981) 33%
Operating profit 521 647 (20)%
Taxation charge (96) (143) 33%
Net profit 425 504 (16)%
Cost: income ratio 32.4% 27.8% (4.6)%
Net interest margin 4.40% 4.92% (0.52)%
Segment breakdown
• DenizBank contributed total income of AED 1,740 million and net profit
of AED 425 million to the Group for Q2-20
• Operating expenses and impairment allowances amounted to AED 564
million and AED 655 million respectively for the same period
• Total assets of AED 134 billion, net loans of AED 84 billion and deposits
of AED 91 billion at the end of Q2-20
• DenizBank is the fifth largest private bank in Turkey with wide presence
through a network of 743 branches and over 3,000 ATMs
• Operates with 708 branches in Turkey and 35 in other territories
(Austria, Germany, Bahrain)
• Full service commercial banking platform of Corporate banking, Retail
banking and Treasury
• Servicing around 14 million customers, through 14,000+ employees
Net Loans as at 30-Jun-20
134.1 133.5
85.5 84.098.2 91.0
Q2-20Q4-19
Financial Highlights (AED Bn**)
0,08%
58%
42%
All financial numbers post acquisition (1-Aug-19) include the fair value adjustments, unless otherwise stated.
**Metrics converted to AED using spot / average exchange rate for balance sheet / income statement
Corporate Banking
Consumer Banking
DepositsAssets Net Loans AD Ratio(Unadjusted)
NPL Ratio (Unadjusted)

18
Get in touch.
I N V E S T O R R E L A T I O N S
Emirates NBD Head Office I 4th Floor
PO Box 777 I Dubai, UAE
Tel: +971 4 609 3046


