38
First published in August 1999 National Pollutant Inventory Emission Estimation Technique Manual for Explosives Manufacturing

First published in August 1999
National Pollutant Inventory
Emission EstimationTechnique Manual
for
ExplosivesManufacturing
Explosives Manufacturing i
EMISSION ESTIMATION TECHNIQUES
FOR
EXPLOSIVES MANUFACTURING
TABLE OF CONTENTS
1.0 INTRODUCTION................................................................................................. 1
2.0 PROCESSES AND EMISSIONS........................................................................ 2
2.1 Process Description....................................................................................... 22.1.1 TNT Production...................................................................................... 22.1.2 Nitrocellulose Production ..................................................................... 42.1.3 Ammonium Nitrate Fuel Oil (ANFO) Preparation........................... 42.1.3.1 Ammonium Nitrate Manufacturing ................................................. 5
2.2 Emissions to Air............................................................................................. 62.3 Emissions to Water........................................................................................ 72.4 Emissions to Land ......................................................................................... 7
3.0 EMISSION ESTIMATION TECHNIQUES ..................................................... 9
3.1 Using Sampling or Direct Measurement.................................................. 113.1.1 For Emissions to Air............................................................................... 113.1.2 For Emissions to Water.......................................................................... 16
3.2 Using Mass Balance ...................................................................................... 173.2.1 For Emissions to Air............................................................................... 173.2.2 For Emissions to Wastewater ............................................................... 193.2.3 For Emissions via Solid Waste.............................................................. 19
3.3 Using Engineering and Site-Specific Equations ..................................... 203.3.1 Emissions Using Mass Transfer Kinetics ............................................ 203.3.2 Emissions from Spills............................................................................. 213.3.3 Emissions from Fugitive Losses ........................................................... 24
3.4 Using Emission Factors ................................................................................ 28
4.0 EMISSION ESTIMATION TECHNIQUES: ACCEPTABLE RELIABILITYAND UNCERTAINTY.......................................................................................... 33
4.1 Engineering Calculations ............................................................................ 334.2 Emission Factors ............................................................................................ 33
5.0 REFERENCES......................................................................................................... 35
Explosives Manufacturing ii
EXPLOSIVES MANUFACTURING
LIST OF FIGURES, TABLES AND EXAMPLES
Figure 1 - TNT Production.............................................................................................. 3
2 - Nitration of Toluene to Form Trinitrotoluene ......................................... 4
Table 1 - Common Air Emissions of NPI-Listed Substances from the Explosives 7
2 - List of Variables and Symbols .................................................................... 10
3 - Stack Sample Test Results ........................................................................... 12
4 - Correlation Equations, Default Zero Emission Rates, and Pegged Emission Rates for Estimating Fugitive Emissions ................................. 25
5 - Emission Factors for Equipment Leaks ..................................................... 28
6 - Emission Factors for the Open Burning of TNT...................................... 29
7 - Emission Factors for Explosives Manufacturing of TNT & Nitrocellulose.................................................................................................. 30
Example 1 - Estimating Particulate Matter (PM10) Emissions................................... 12
2 - Calculating Moisture Percentage.............................................................. 14
3 - Estimating Ammonia Emissions to Atmosphere................................... 16
4 - Using a M7ass Balance for VOC Emissions ........................................... 18
5 - Using a Mass Balance to Speciate VOC Emissions............................... 18
6 - Using Mass Transfer Kinetics ................................................................... 21
7 - Calculating Spill Emissions....................................................................... 23
8 - Calculating Fugitive Chemical Leaks ...................................................... 26
9 - Average Emission Factor Technique........................................................ 27
10 - Using Emission Factors ............................................................................... 29

Explosives Manufacturing 1
1.0 Introduction
The purpose of all Emission Estimation Technique (EET) Manuals in this series is to assistAustralian manufacturing, industrial and service facilities to report emissions of listedsubstances to the National Pollutant Inventory (NPI). This Manual describes theprocedures and recommended approaches for estimating emissions from facilitiesengaged in the manufacturing of explosives.
EET MANUAL: Explosives Manufacturing
HANDBOOK: Explosives Manufacturing
ANZSIC CODES : 2541
This Manual was drafted by the NPI Unit of the Queensland Department of Environmentand Heritage on behalf of the Commonwealth Government. It has been developedthrough a process of national consultation involving State and Territory environmentalauthorities and key industry stakeholders.
Explosives Manufacturing 2
2.0 Processes and Emissions
The following section presents a brief description of the production of explosives, andidentifies substances likely to be emitted during this process.
2.1 Process Description
An explosive is a material that, under the influence of thermal or mechanical shock,decomposes rapidly and spontaneously with the evolution of large amounts of heat andgas. There are two major categories, high explosives and low explosives. High explosivesare further divided into initiating, or primary, high explosives and secondary highexplosives. Initiating high explosives are very sensitive and are generally used in smallquantities in detonators and percussion caps to set off larger quantities of secondary highexplosives. Secondary high explosives, chiefly nitrates, nitro compounds, and nitramines,are much less sensitive to mechanical or thermal shock, but they explode with greatviolence when set off by an initiating explosive. The chief secondary high explosivesmanufactured for commercial and military use are ammonium nitrate blasting agents and2,4,6-trinitrotoluene (TNT). The production of ammonium nitrate is discussed in thismanual.
Low explosives, such as black powder and nitrocellulose, undergo a relatively slow auto-combustion when set off and evolve large volumes of gas in a definite and controllablemanner. Many different types of explosives are manufactured in Australia and examplesof high (TNT), low (nitrocellulose) explosives and ammonium nitrate fuel oil (ANFO) arediscussed below.
2.1.1 TNT Production
TNT may be prepared by either a continuous or a batch process, using toluene, nitric acid,and sulfuric acid as raw materials. The production of TNT follows the same chemicalprocess, regardless of whether batch or continuous methods are used. The flow chart forTNT production is shown in Figure 1. The overall chemical reaction may be expressed as:
C6H5CH3 + 3HONO2 + H2SO4 → (NO2)3C6H2CH3 + 3H2O + H2SO4
Toluene NitricAcid
SulfuricAcid
2,4,6 –Trinitrotoluene
Water SulfuricAcid
Explosives Manufacturing 3
Nitration Crude TNT Purification Purified TNTSlurry
FinishingYellowWater
SpentAcid
Spent AcidRecovery
Byproduct93%
H2SO4
RedWater
WasteAcid
FlakeTNT
60-65%HNO3
Nitric AcidConcentration
99%HNO3
Toluene
Mixed Acid
Recycle
NOX, SO2
Recycle
Steam O2
To mixed acidpreparation
H2SO4 or Mg(NO3)2
To disposal To disposal To disposal To disposal
NOX, SO2NOX, SO2
Gaseous EmissionNegligible Amount
Figure 1 - TNT ProductionSource: USEPA, AP-42, Section 6.3, 1995
The production of TNT by nitration of toluene is a 3-stage process performed in a series ofreactors, as shown in Figure 2. The mixed acid stream is shown to flow countercurrently tothe flow of the organic stream. Toluene and spent acid fortified with 60 percent HNO3
solution are fed into the first reactor. The organic layer formed in the first reactor ispumped into the second reactor, where it is subjected to further nitration with acid fromthe third reactor fortified with additional HNO3. The product from the second nitrationstep, a mixture of all possible isomers of dinitrotoluene (DNT), is pumped into the thirdreactor. In the final reaction, the DNT is treated with a fresh feed of HNO3 and oleum (asolution of sulfur trioxide [SO3] in anhydrous H2SO4). The crude TNT from this thirdnitration consists primarily of 2,4,6-trinitrotoluene. The crude TNT is washed to removefree acid, and the wash water (yellow water) is recycled to the early nitration stages. Thewashed TNT is then neutralised with soda ash and treated with a 16 percent aqueoussodium sulfite (Sellite) solution to remove contaminating isomers. The Sellite wastesolution (red water) from the purification process is usually emitted as a liquid wastestream, collected and sold, or is concentrated to a slurry and incinerated or taken tolandfill. Finally, the TNT crystals are melted and passed through hot air dryers, wheremost of the water is evaporated. The dehydrated product is solidified, and the TNT flakespackaged for storage or distribution.

Explosives Manufacturing 4
Figure 2 - Nitration of Toluene to Form TrinitrotolueneSource: USEPA, AP-42, Section 6.3, 1995
2.1.2 Nitrocellulose Production
Nitrocellulose is commonly prepared by a batch-type mechanical dipper process or, morerecently, by a continuous nitration processing method. In batch production cellulose in theform of cotton linters, fibres, or specially prepared wood pulp, is purified by boiling andbleaching. The dry and purified cotton linters or wood pulp are added to mixed nitric andsulfuric acids in metal reaction vessels known as dipping pots. The reaction is as follows:
(C6H7O2(OH)3)i + 3HONO2 + H2SO4 → (C6H7O2(ONO2)3)i + 3H2O + H2SO4
Following nitration, the crude nitrocellulose is centrifuged to remove most of the spentnitrating acids and is put through a series of water washing and boiling treatments topurify the final product.
2.1.3 Ammonium Nitrate Fuel Oil (ANFO) Preparation
Ammonium nitrate fuel oil (ANFO), is a blasting agent composed of ammonium nitrateand liquid hydrocarbons (diesel fuel oil), in the proportion of 6 percent of fuel by weightor by volume, that is, one part of distillate to 16 parts of ammonium nitrate (Hall, R., 1993,p.66).
Loosely poured ANFO has a density of 0.8 - 0.85 grams/cubic metre, but has no waterresistance and hence can only be used in dry conditions. Therefore to allow andaccommodate different conditions on blast sites, the nature and character of the explosiveused need to be varied. ANFO being non-water-resistant, becomes water-resistant if 30%+emulsion is added to it. At 40% emulsion component the product starts to become
NitricAcid
SulfuricAcid
Nitrocellulose Water SulfuricAcid
Cellulose
Toluene
1st Nitration 2nd Nitration 3rd Nitration
Nitro-Toluene Dinitro-Toluene
Oleum
TNTProduct
97% HNO 3
60% HNO360% HNO 3
Spent Acid

Explosives Manufacturing 5
waterproof, as now a layer of emulsion coats each prill particle in the ANFO, preventingwater penetration for a short period (TES, 1997, p.53). This blend is called Heavy ANFO.
Possible sources of emissions could be spills and leakage and specific information from theparticular distillate in use should be used to calculate emissions for the NPI listedsubstances.
2.1.3.1 Ammonium Nitrate Manufacturing
The manufacture of ammonium nitrate involves several major unit operations includingsolution formation and concentration; solids formation, finishing, screening and coating;and product bagging and/or bulk shipping. In some cases, solutions may be blended formarketing as liquid fertilisers.
The number of operating steps employed depends on the end product desired. Forexample, plants producing ammonium nitrate solutions alone use only the solutionformation, solution blending and bulk shipping operations. Plant producing a solidammonium nitrate product may employ all of the operations.
All ammonium nitrate plants produce an aqueous ammonium nitrate solution through thereaction of ammonia and nitric acid in a neutraliser as follows:
NH3 + HNO3 → NH4NO3
To produce a solid product, the ammonium nitrate solution is concentrated in anevaporator or concentrator. The resulting melt contains about 95 to 99.8 percentammonium nitrate at approximately 149°C. This melt is then used to make solidammonium nitrate products.
Prilling and granulation are the most common processes used to produce solidammonium nitrate. To produce prills, concentrated melt is sprayed into the top of a prilltower. In the tower, ammonium nitrate droplets falls countercurrent to a rising air streamthat cools and solidifies the falling droplets into spherical prills. Prill density can be variedby using different concentrations of ammonium nitrate melt. Low-density prills, in therange of 1.29 specific gravity, are formed from a 95 to 97.5 percent ammonium nitrate melt,and high-density prills, in the range of 1.65 specific gravity, are formed from a 99.5 to 99.8percent melt. Low-density prills are more porous than high-density prills. Therefore, low-density prills are used for making blasting agents because they will absorb oil. Most high-density prills are used as fertilisers.
The ammonium nitrate prilling process can be divided into 5 major operations:
1. Concentration;2. Prilling;3. Drying and cooling;4. Screening; and5. Coating.
Rotary drum granulators produce granules by spraying a concentrated ammonium nitrate
Explosives Manufacturing 6
melt (99.0 to 99.8 percent) onto small seed particles of ammonium nitrate in a long rotatingcylindrical drum. As the seed particles rotate in the drum, successive layers of ammoniumnitrate are added to the particles, forming granules. Granules are removed from thegranulator and screened. Off-size granules are crushed and recycled to the granulator tosupply additional seed particles or are dissolved and returned to the solution process. Pangranulators operate on the same principle as drum granulators, except the solids areformed in a large, rotating circular pan. Pan granulators produce a solid product withphysical characteristics similar to those of drum granules.
Although not widely used, an additive, such as magnesium nitrate or magnesium oxide,may be injected directly into the melt stream. This additive serves three purposes: to raisethe crystalline transition temperature of the final solid product; to act as a desiccantdrawing water into the final product to reduce caking; and to allow solidification to occurat a low temperature by reducing the freezing point of molten ammonium nitrate.
The temperature of the ammonium nitrate exiting the solids formation process isapproximately 66 to 124°C. Rotary drum or fluidised bed cooling prevents deteriorationand agglomeration of solids before storage and shipping. Low-density prills have a highmoisture content because of the lower melt concentration, and therefore require drying inrotary drums or fluidised beds before cooling.
Since the solids are produced in a wide variety of sizes, they must be screened forconsistently sized prills or granules. Cooled prills are screened and off-size prills aredissolved and recycled to the solution concentration process. Granules are screened beforecooling. Under-size particles are returned directly to the granulator and oversize granulesmay be crushed and returned to the granulator, or sent to the solution concentrationprocess.
Following screening, products can be coated in a rotary drum to prevent agglomerationduring storage and shipment. The most common coating materials are clays anddiatomaceous earth. However, the use of additives in the ammonium nitrate melt beforesolidification, as described above, may preclude the use of coatings.
2.2 Emissions to Air
Air emissions may be categorised as either fugitive or point source emissions.
Fugitive Emissions
These are emissions that are not released through a vent or stack. Examples of fugitiveemissions include dust from stockpiles, volatilisation of vapour from vats, open vessels, orspills and materials handling. Emissions emanating from ridgeline roof-vents, louvres,and open doors of a building as well as equipment leaks, and leaks from valves andflanges are also examples of fugitive emissions.

Explosives Manufacturing 7
Point Source Emissions
These emissions are exhausted into a vent (excluding roof vents) or stack and emittedthrough a single point source into the atmosphere. Table 1 highlights common airemissions of NPI-listed substances from explosives manufacturing processes.
Table 1 - Common Air Emissions of NPI-Listed Substances from the Explosives Manufacturing Processes
Substance• Sulfur Dioxide (SO2)• Carbon Monoxide (CO)• Particulate Matter (PM10)• Oxides of Nitrogen (NOx)• Ammonia (NH3)• Nitric Acid (HNO3)• Volatile Organic Compounds (VOC)• Sulfuric Acid (H2SO4)
Source: Queensland Department of Environment and Heritage, 1998
2.3 Emissions to Water
Emissions of substances to water can be categorised as discharges to:
• Surface waters (eg. lakes, rivers, dams, and estuaries);• Coastal or marine waters; and• Stormwater. Because of the significant environmental hazards posed by emitting toxic substances towater, most facilities emitting NPI-listed substances to waterways are required by theirrelevant State or Territory environment agency to closely monitor and measure theseemissions. This existing sampling data can be used to calculate annual emissions. If no wastewater monitoring data exists, emissions to process water can be calculatedbased on a mass balance or using emission factors. The discharge of listed substances to a sewer or tailings dam does not require reporting tothe NPI. However, leakage and other emissions (including dust) from a tailings storagefacility are reportable. (See also Section Three of The NPI Guide.)
2.4 Emissions to Land Emissions of substances to land on-site include solid wastes, slurries, and sediments.Emissions arising from spills, leaks, and storage and distribution of materials containinglisted substances may also occur to land. These emission sources can be broadlycategorised as:

Explosives Manufacturing 8
• surface impoundments of liquids and slurries; and• unintentional leaks and spills.

Explosives Manufacturing 9
3.0 Emission Estimation Techniques This sections presents equations and examples of calculations for estimating emissions ofparticulate matter (PM10), total VOCs, speciated organics and inorganic substances(ammonia, total nitrogen) from the explosives manufacturing processes. Table 2 lists the variables and symbols used throughout this Section and indicates the levelof information required in estimating emissions of NPI-listed substances from explosivesmanufacturing using the emission estimation techniques illustrated. Estimates of emissions of NPI-listed substances to air, water and land should be reportedfor each substance that triggers a threshold. The reporting list and detailed information onthresholds are contained in The NPI Guide at the front of this Handbook. In general, there are four types of emission estimation techniques (EETs) that may be usedto estimate emissions from your facility. The four types described in The NPI Guide are: • sampling or direct measurement;• mass balance;• fuel analysis or other engineering calculations; and• emission factors.
Select the EET, (or mix of EETs), that is most appropriate for your purposes. For example,you might choose to use a mass balance to best estimate fugitive losses from pumps andvents, direct measurement for stack and pipe emissions, and emission factors whenestimating losses from storage tanks and stockpiles.
If you estimate your emission by using any of these EETs, your data will be displayed onthe NPI database as being of ‘acceptable reliability’. Similarly, if your relevantenvironmental authority has approved the use of EETs that are not outlined in thishandbook, your data will also be displayed as being of ‘acceptable reliability’.
This Manual seeks to provide the most effective emission estimation techniques for theNPI substances relevant to this industry. However, the absence of an EET for a substancein this handbook does not necessarily imply that an emission should not be reported to theNPI. The obligation to report on all relevant emissions remains if reporting thresholdshave been exceeded.
You are able to use emission estimation techniques that are not outlined in thisdocument. You must, however, seek the consent of your relevant environmentalauthority. For example, if your company has developed site-specific emission factors,you may use these if approved by your relevant environmental authority.
You should note that the EETs presented in this manual relate principally to averageprocess emissions. Emissions resulting from non-routine events are rarely discussed inthe literature, and there is a general lack of EETs for such events. However, it is importantto recognise that emissions resulting from significant operating excursions and/or

Explosives Manufacturing 10
accidental situations (eg. spills) will also need to be estimated. Emissions to land, air andwater from spills must be estimated and added to process emissions when calculatingtotal emissions for reporting purposes. The emission resulting from a spill is the netemission, ie. the quantity of the NPI reportable substance spilled, less the quantityrecovered or consumed during clean up operations.
The usage* of each of the substances listed as Category 1 and 1a under the NPI must beestimated to determine whether the 10 tonnes (or 25 tonnes for VOCs) reporting thresholdis exceeded. If the threshold is exceeded, emissions of these Category 1 and 1a substancesmust be reported for all operations/processes relating to the facility, even if the actualemissions of the substances are very low or zero.* Usage is defined as meaning the handling, manufacture, import, processing, coincidental production orother uses of the substances.
Table 2 - List of Variables and SymbolsVariable Symbol Units
Total emissions of pollutant i Ei kg/hrAnnual emissions of pollutant i Ekpy,i kg/yrMaterial entering the process Qin L/hrMaterial leaving the process (as anemission, transfer, or in product)
Qout L/hr
Concentration of pollutant i Ci ppmv or kg/LAmount of pollutant i in sludge ASi kg/yrProcess losses of pollutant i PLi kg/yrLosses in wastewater of pollutant i WLi kg/yrTemperature correction for temperaturedifferences during test
Kt dimensionless
Pressure correction for pressuredifferences during test
Kp dimensionless
Average concentration of pollutant i Ca,i ppmvMolecular weight of pollutant i MWi kg/kg-moleVolumetric flow rate of stack gas Qw wet cubic metres per second (m3/s)Volumetric flow rate of stack gas Qd dry cubic metres per second (m3/s)Molar volume M m3/kg-moleOperating hours OpHrs hr/yrEmission factor for pollutant i EFi kg/unitsActivity factor AF units/hrSaturation vapour pressure of pollutant i Psat,i kilopascals (kPa)Total pressure Pt kPaDensity of air ρa kg/m3
Evaporation rate of pollutant i Wi kg/secGas-phase mass transfer coefficient forVOC species i
Ki m/sec
Surface area area m2
Vapour pressure of pollutant i Pvap,i kPaUniversal gas constant R kPa * m3 /(kgmol * K)Temperature T KVOC content of material CVOC kg/LTotal VOC emissions EVOC kg/LDensity of material ρm kg/LPercentage weight of pollutant i Wt%i %
Explosives Manufacturing 11
Variable Symbol UnitsWind speed U km/hr
Source: Queensland Department of Environment and Heritage, 1998.
3.1 Using Sampling or Direct Measurement
3.1.1 For Emissions to Air
Particulate Matter (PM10) Emissions
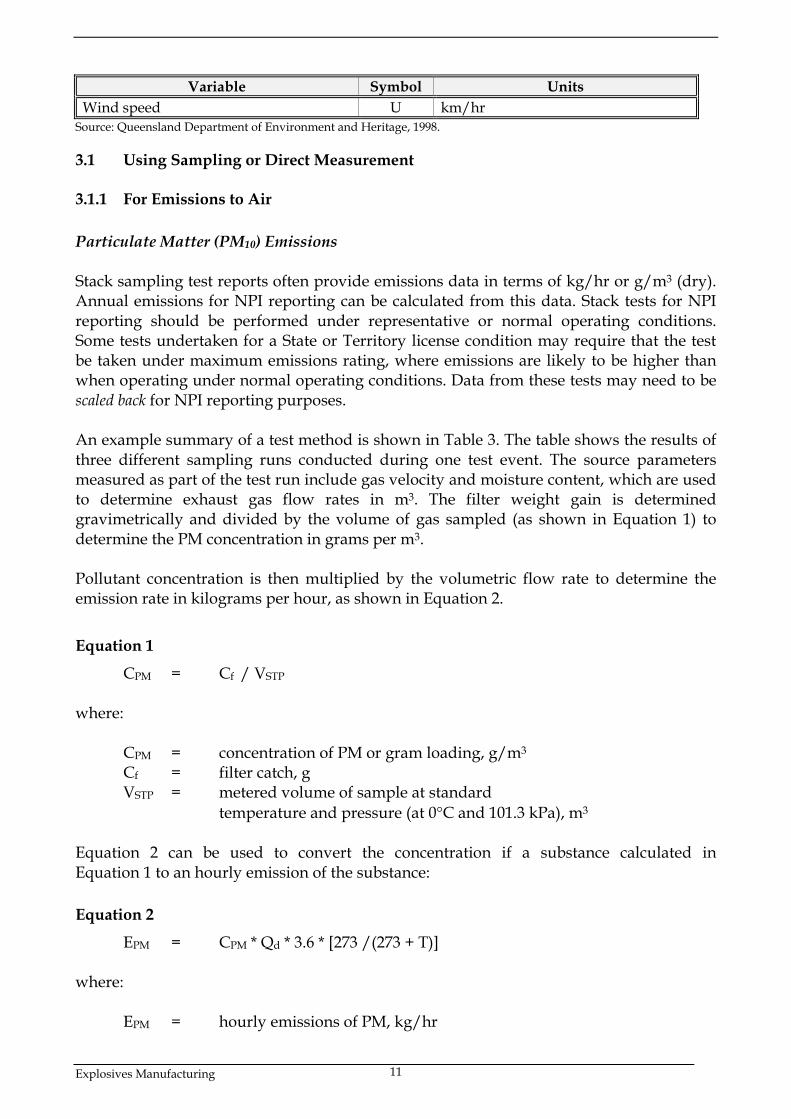
Stack sampling test reports often provide emissions data in terms of kg/hr or g/m3 (dry).Annual emissions for NPI reporting can be calculated from this data. Stack tests for NPIreporting should be performed under representative or normal operating conditions.Some tests undertaken for a State or Territory license condition may require that the testbe taken under maximum emissions rating, where emissions are likely to be higher thanwhen operating under normal operating conditions. Data from these tests may need to bescaled back for NPI reporting purposes.
An example summary of a test method is shown in Table 3. The table shows the results ofthree different sampling runs conducted during one test event. The source parametersmeasured as part of the test run include gas velocity and moisture content, which are usedto determine exhaust gas flow rates in m3. The filter weight gain is determinedgravimetrically and divided by the volume of gas sampled (as shown in Equation 1) todetermine the PM concentration in grams per m3.
Pollutant concentration is then multiplied by the volumetric flow rate to determine theemission rate in kilograms per hour, as shown in Equation 2.
Equation 1
CPM = Cf / VSTP
where:
CPM = concentration of PM or gram loading, g/m3
Cf = filter catch, gVSTP = metered volume of sample at standard
temperature and pressure (at 0°C and 101.3 kPa), m3
Equation 2 can be used to convert the concentration if a substance calculated inEquation 1 to an hourly emission of the substance:
Equation 2
EPM = CPM * Qd * 3.6 * [273 /(273 + T)]
where:
EPM = hourly emissions of PM, kg/hr

Explosives Manufacturing 12
Qd = stack gas volumetric flow rate, m3/s3.6 = 3600 seconds per hour multiplied by 0.001
kilograms per gramT = temperature of the gas sample, °C
Table 3 - Stack Sample Test ResultsParameter Symbol Test 1 Test 2 Test 3
Total sampling time (sec) 7 200 7 200 7 200Moisture collected (g) gMOIST 395.6 372.6 341.4Filter catch (g) Cf 0.0851 0.0449 0.0625Average sampling rate (m3/s) 1.67 * 10-4 1.67 * 10-4 1.67 * 10-4
Standard metered volume (m3) Vm, STP 1.185 1.160 1.163Volumetric flow rate (m3/s), dry Qd 8.48 8.43 8.45Concentration of particulate (g/m3) CPM 0.0718 0.0387 0.0537Particulate emission rate (kg/hr) EPM 2.20 1.19 1.65
Source: Queensland Department of Environment and Heritage, 1998
Example 1 illustrates the application of Equation 1 and Equation 2.
Example 1 - Estimating Particulate Matter (PM10) Emissions
PM emissions calculated using Equation 1 and Equation 2 and the stack sampling data forTest 1 (presented in Table 3, and an exhaust gas temperature of 150°C (423 K)) are shownbelow:
CPM = Cf / VSTP
= 0.085 / 1.185= 0.072 g/ m3
EPM = CPM * Qd * 3.6 * [273/(273 + T)]= 0.072 * 8.48 * 3.6 * [273/(273 + 150)]= 1.42 kg/hr
Emissions can be converted to a yearly basis by multiplying by the yearly hours ofoperation in units of hr/yr.
The information from some stack tests may be reported in kilograms of particulate perkilograms of exhaust gas (wet). Use Equation 3 to calculate the wet particulate emissionsin kg/hr.

Explosives Manufacturing 13
Equation 3
( )���
���
+���
�
� −= TmoistCQE R
PMwPM 273273*1001*6.3**
where:
EPM = hourly emissions of PM in kilograms per hour, kg/hrQw = wet cubic metres of exhaust gas per second, m3/sCPM = concentration of PM or gram loading, g/m3
3.6 = 3600 seconds per hour multiplied by 0.001 kilograms per grammoistR= moisture content, %273 = 273 K (0°C)T = stack gas temperature, °C
Total suspended particulates (TSP) are also referred to as total particulate matter (totalPM). To determine PM10 from total PM emissions, it may be necessary for facilityoperators to first undertake a size analysis of the stack filter catch. The weight PM10
fraction can then be multiplied by the total PM emission rate to produce PM10 emissions.Alternatively, assume that 100% of PM emissions are PM10; ie assume that all particulatematter emitted to air has an equivalent aerodynamic diameter of 10 micrometres or less ie.≤10µm
To calculate moisture content use Equation 4
Equation 4
Moisture percentage = 100 % * weight of water vapour per specificvolume of stack gas/ total weight of thestack gas in that volume.
( )
( ) ρ STPSTPm
moist
STPm
moist
R
Vg
Vg
moist+
=
,
,
*1000
*1000*%100
where
moistR= moisture content, %gmoist = moisture collected, gVm,STP = metered volume of sample at STP, m3
ρSTP = dry density of stack gas sample, kg/m3 at STP{if the density is not known a default value of 1.62 kg/m3
may be used. This assumes a dry gas composition of50% air, 50% CO2}

Explosives Manufacturing 14
Example 2 - Calculating Moisture Percentage
A 1.2m3 sample (at STP) of gas contains 410g of water. To calculate the moisturepercentage use Equation 4.
( )
( ) ρ STPSTPm
moist
STPm
moist
R
Vg
Vg
moist+
=
,
,
*1000
*1000*%100
gMOIST/1000 * Vm,STP = 410 / (1000 * 1.2) = 0.342
moistR = 100 * 0.342 / (0.342 + 1.62) = 17.4%
Gaseous Emissions
Sampling test methods can be used to estimate inorganic pollutant emission rates fromexplosives manufacturing processes. Airflow rates can be determined from flow ratemetres or from pressure drops across a critical orifice.
Sampling test reports often provide chemical concentration data in parts per million byvolume (ppmv). For gaseous pollutants, the concentration of a pollutant (Ci) can bedetermined by Equation 5.
Equation 5
Ci = Kt * Kp * Ca,i
where:
Ci = concentration of pollutant i, ppmvKt = temperature correction for differences in
temperature from STP during sample testKp = pressure correction for differences in pressure
from STP during sample testCa,i = average concentration of pollutant i, ppmv
Kt and Kp are correction factors for differences in the temperature and pressure that occurduring the sample testing period. For example, the pressure drop as the air flows along thelength of the pipe during the stack test. This is illustrated in Example 3 where thetemperature does not change over the sample testing period (Kt = 1) but the pressure
Explosives Manufacturing 15
reduces, causing Kp to be a factor less than one (Kp = 0.8), due to the pressure differenceduring the sampling test.The Kt and Kp used here are example values only. Specific values may be found inChemical Engineering Textbooks.
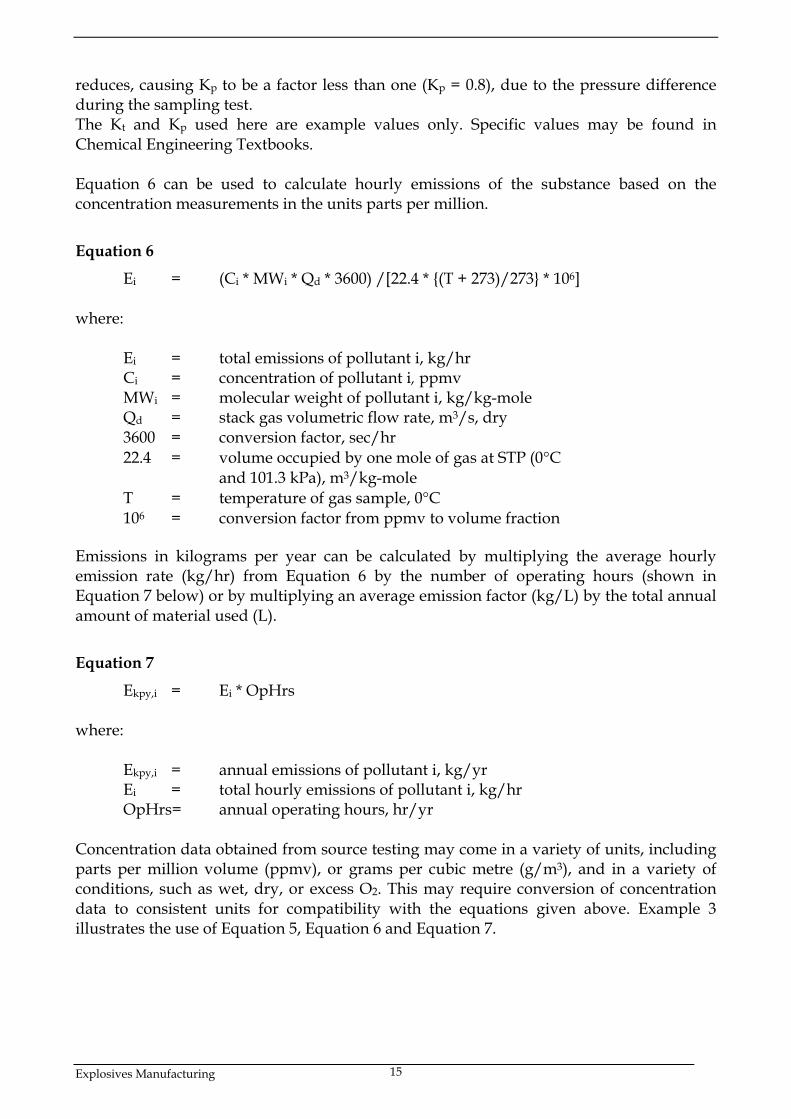
Equation 6 can be used to calculate hourly emissions of the substance based on theconcentration measurements in the units parts per million.
Equation 6
Ei = (Ci * MWi * Qd * 3600) /[22.4 * {(T + 273)/273} * 106]
where:
Ei = total emissions of pollutant i, kg/hrCi = concentration of pollutant i, ppmvMWi = molecular weight of pollutant i, kg/kg-moleQd = stack gas volumetric flow rate, m3/s, dry3600 = conversion factor, sec/hr22.4 = volume occupied by one mole of gas at STP (0°C
and 101.3 kPa), m3/kg-moleT = temperature of gas sample, 0°C106 = conversion factor from ppmv to volume fraction
Emissions in kilograms per year can be calculated by multiplying the average hourlyemission rate (kg/hr) from Equation 6 by the number of operating hours (shown inEquation 7 below) or by multiplying an average emission factor (kg/L) by the total annualamount of material used (L).
Equation 7
Ekpy,i = Ei * OpHrs
where:
Ekpy,i = annual emissions of pollutant i, kg/yrEi = total hourly emissions of pollutant i, kg/hrOpHrs= annual operating hours, hr/yr
Concentration data obtained from source testing may come in a variety of units, includingparts per million volume (ppmv), or grams per cubic metre (g/m3), and in a variety ofconditions, such as wet, dry, or excess O2. This may require conversion of concentrationdata to consistent units for compatibility with the equations given above. Example 3illustrates the use of Equation 5, Equation 6 and Equation 7.

Explosives Manufacturing 16
Example 3 - Estimating Ammonia Emissions to Atmosphere
This example shows how annual ammonia (NH3) emissions can be calculated using thedata obtained from a stack at a plant manufacturing explosives. The concentration ofammonia is calculated using Equation 5, hourly emissions are calculated usingEquation 6, and annual emissions are calculated using Equation 7.
Given:Kt = 1.0 Kp = 0.8Ca,i = 15.4 ppmv MWi = 17 kg/kg-mole of
ammoniaQd = 8.48 m3/sec OpHrs= 1760 hr/yrT = 25°C (298 K)
The concentration of ammonia (Ci) is calculated from Equation 5:
Ci = Kt * Kp * Ca,i
= 1.0 * 0.8 * 15.4 ppmv= 12.32 ppmv
Hourly emissions of NH3 are calculated using Equation 6:
ENH3 = (Ci * MWi * Qd * 3600)/[22.4 * {(T + 273)/273} * 106]= (12.32 * 17 * 8.48 * 3600)/[22.4 * {(25 + 273))/273} * 106]= (6.39 * 106)/(24.45 * 106)= 0.26 kg/hr
Annual emissions of NH3 are calculated using Equation 7
Ekpy, NH3 = ENH3 * OpHrs= 0.26 * 1760= 458 kg/yr
3.1.2 For Emissions to Water
Because of the significant environmental hazards posed by emitting toxic substances towater, most facilities emitting NPI-listed-substances to waterways are required by theirrelevant State or Territory environment agency to closely monitor and measure theseemissions. This existing monitoring data can be used to calculate annual emissions by theuse of Equation 8.

Explosives Manufacturing 17
Equation 8
Ekpy,i = Ci * V * OpHrs/106
where:
Ekpy,i = emissions of pollutant i, kg/yrCi = concentration of pollutant i in wastewater,
mg/LV = hourly volume of wastewater, L/hrOpHrs = operating hours per year for which data
apply, hr/yr106 = conversion factor, mg/kg
In applying Equation 8 to water emission calculations, monitoring data should beaveraged and only representative concentrations used in emission calculations.
3.2 Using Mass Balance
3.2.1 For Emissions to Air
A mass balance identifies the quantity of substance going in and out of an entire facility,process, or piece of equipment. Emissions can be calculated as the difference betweeninput and output of each listed substance. Accumulation or depletion of the substancewithin the equipment should be accounted for in your calculation.
Mass balance calculations for estimating emissions of VOCs and speciated organics andinorganics can be made by applying Equation 9.
Equation 9
Ei = (Qin - Qout) * Ci
where:
Ei = total emissions of pollutant i, kg/hrQin = material entering the process, L/hrQout = material leaving the process as waste, recycled, or in product, L/hrCi = concentration of pollutant i, kg/L
The term Qout may actually involve several different fates for an individual pollutant. Thiscould include the amount recovered or recycled, the amount leaving the process in themanufactured product, the amount leaving the process in wastewater, or the amount ofmaterial transferred off-site as hazardous waste or to landfill. A thorough knowledge ofthe different destinations for the pollutant of interest is necessary for an accurate emissionestimate to be made using the mass balance approach. Example 4 illustrates theapplication of Equation 9.

Explosives Manufacturing 18
Example 4 - Using a Mass Balance for VOC Emissions
This example shows how VOC emissions may be calculated using Equation 9 for non-reactant materials (solvents and absorbents) added during a process operation given thefollowing data:
Qin = 6 L/hrQout = 4 L/hrCVOC = 0.85 kg VOC/L
EVOC = (Qin - Qout) * CVOC
= (6 L/hr - 4 L/hr) * 0.85 kg VOC/L= 1.7 kg VOC/hr
Emissions can be converted to a yearly basis by multiplying by the yearly hours ofoperation in units of hr/yr.
Speciated VOC emissions may be estimated by a mass balance approach usingEquation 10:
Equation 10Ei = (Qin - Qout) * ρm * (wt%i)/100
where:
Ei = total emissions of pollutant i, kg/hrQin = material entering the process, L/hrQout = material leaving the process as an emission,
transfer, or as an article or product, L/hrρm = density of material, kg/Lwt%i = percentage by weight of pollutant i in material, %
Example 5 illustrates the application of Equation 10.
Example 5 - Using a Mass Balance to Speciate VOC EmissionsThis example shows how pollutant i emissions may be calculated using Equation 10 for amanufacturing process operation given the following data:
Qin = 6 L/hrQout = 4 L/hrρm = 1.09 kg/Lwt%i = 25%
Ei = (Qin - Qout) * ρm * (wt%i)/100= (6 L/hr - 4 L/hr) * 1.09 kg/L * (25/100)= 0.545 kg/hr
Emissions can be converted to a yearly basis by multiplying by the yearly hours of operation inunits of hr/yr.
Explosives Manufacturing 19
3.2.2 For Emissions to Wastewater
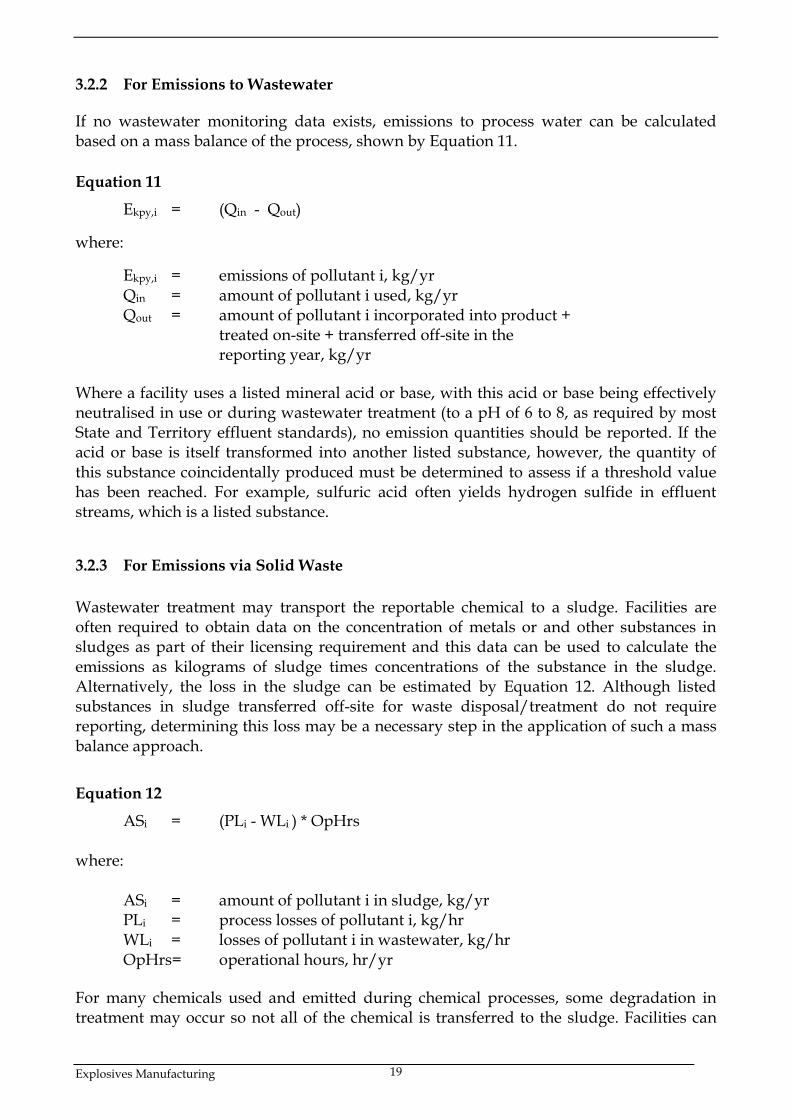
If no wastewater monitoring data exists, emissions to process water can be calculatedbased on a mass balance of the process, shown by Equation 11.
Equation 11
Ekpy,i = (Qin - Qout)
where:
Ekpy,i = emissions of pollutant i, kg/yrQin = amount of pollutant i used, kg/yrQout = amount of pollutant i incorporated into product +
treated on-site + transferred off-site in the reporting year, kg/yr
Where a facility uses a listed mineral acid or base, with this acid or base being effectivelyneutralised in use or during wastewater treatment (to a pH of 6 to 8, as required by mostState and Territory effluent standards), no emission quantities should be reported. If theacid or base is itself transformed into another listed substance, however, the quantity ofthis substance coincidentally produced must be determined to assess if a threshold valuehas been reached. For example, sulfuric acid often yields hydrogen sulfide in effluentstreams, which is a listed substance.
3.2.3 For Emissions via Solid Waste
Wastewater treatment may transport the reportable chemical to a sludge. Facilities areoften required to obtain data on the concentration of metals or and other substances insludges as part of their licensing requirement and this data can be used to calculate theemissions as kilograms of sludge times concentrations of the substance in the sludge.Alternatively, the loss in the sludge can be estimated by Equation 12. Although listedsubstances in sludge transferred off-site for waste disposal/treatment do not requirereporting, determining this loss may be a necessary step in the application of such a massbalance approach.
Equation 12
ASi = (PLi - WLi ) * OpHrs
where:
ASi = amount of pollutant i in sludge, kg/yrPLi = process losses of pollutant i, kg/hrWLi = losses of pollutant i in wastewater, kg/hrOpHrs= operational hours, hr/yr
For many chemicals used and emitted during chemical processes, some degradation intreatment may occur so not all of the chemical is transferred to the sludge. Facilities can
Explosives Manufacturing 20
estimate the amount of reportable compounds in the sludge by using measured data, or bysubtracting the amount biodegraded from the total amount removed in treatment. Theamount of removal can be determined from operating data, and the extent ofbiodegradation might be obtained from published studies. If the biodegradability of thechemical cannot be measured or is not known, reporting facilities should assume that allremoval is due to absorption to sludge.
3.3 Using Engineering and Site-Specific Equations
Theoretical and complex equations or models can be used for estimating emissions fromexplosives manufacturing. Inputs for theoretical equations generally fall into the followingcategories;(1) chemical/physical properties of the material involved, such as vapour pressure and
vapour molecular weight;(2) operating data, such as the amount of material processed and operating hours; and(3) physical characteristics and properties of the source, such as tank colour and diameter.
Use of engineering equations to estimate emissions from explosives manufacturingprocesses is a more complex and time-consuming process than the use of emission factors.Engineering equations require more detailed inputs than the use of emission factors, butthey do provide an emission estimate that is based on facility-specific conditions.
Engineering equations are suitable for estimating emissions from several chemicalmanufacturing processes. For example, for any process involving a transfer of a chemicalspecies from the liquid phase to the vapour phase, the saturation or equilibrium vapourpressure and exhaust flow rate from the process can be used to establish the upper limit ofemissions from that particular process. This is a conservative approach because of theassumption that the total airflow is saturated. An alternative method based on masstransfer kinetics does not assume airflow saturation and results in a lower emission rateestimate than would be obtained assuming saturation.
3.3.1 Emissions Using Mass Transfer Kinetics
An EET based on mass transfer kinetics is shown by Equation 13 and Example 6 illustratesthe use of this equation.
Equation 13
Wi = (MWi * Ki * area * Pvap,i) / (R * T)
where:
Wi = evaporation rate of pollutant i, kg/secMWi = molecular weight of pollutant i, kg/kg-moleKi = gas-phase mass transfer coefficient for VOC species i,
m/sec, [0.00438 * (0.62138 * U)0.78 * (18/MWi)1/3]/3.2808U = wind speed, km/hrarea = surface area, m2
Pvap,i = vapour pressure of pollutant i, kPaR = universal gas constant at 1 atmosphere of pressure,
8.314 kPa * m3/(kg-mole * K)

Explosives Manufacturing 21
T = temperature, K
Example 6 - Using Mass Transfer Kinetics
This example shows how methanol emissions may be estimated using mass transferkinetics and Equation 13 given the following data:
MWi = 32 kg/kg-moleU = 4.5km/hrarea = 0.6 m2
Pvap,i = 13.16 kPaT = 296 KR = 8.314 kPa * m3/(kgmol * K)
First, calculate the mass transfer coefficient, Ki:
Ki = [0.00438 * (0.62138 * U)0.78 * (18/MWi)1/3]/3.2808= [0.00438 * (0.62138 * 4.5 km/hr)0.78 *
(18/32 kg/kg-mole)1/3]/3.2808= 0.0025 m/s
Then, calculate Wi:
Wi = (MWi * Ki * area * Pvap,i) / (R * T)= (32 kg/kg-mole * 0.0025 m/sec * 0.6 m2 * 13.16 kPa)/
{(8.314 kPa * m3/(kgmol * K)) (296 K)}= 2.56 * 10-4 kg/sec
Emissions from kg/sec can be converted to hourly basis (kg/hr) by multiplying by aconversion factor of (60) and emissions from kg/hr can be converted to a yearly basis bymultiplying by the yearly hours of operation in units of hr/yr.
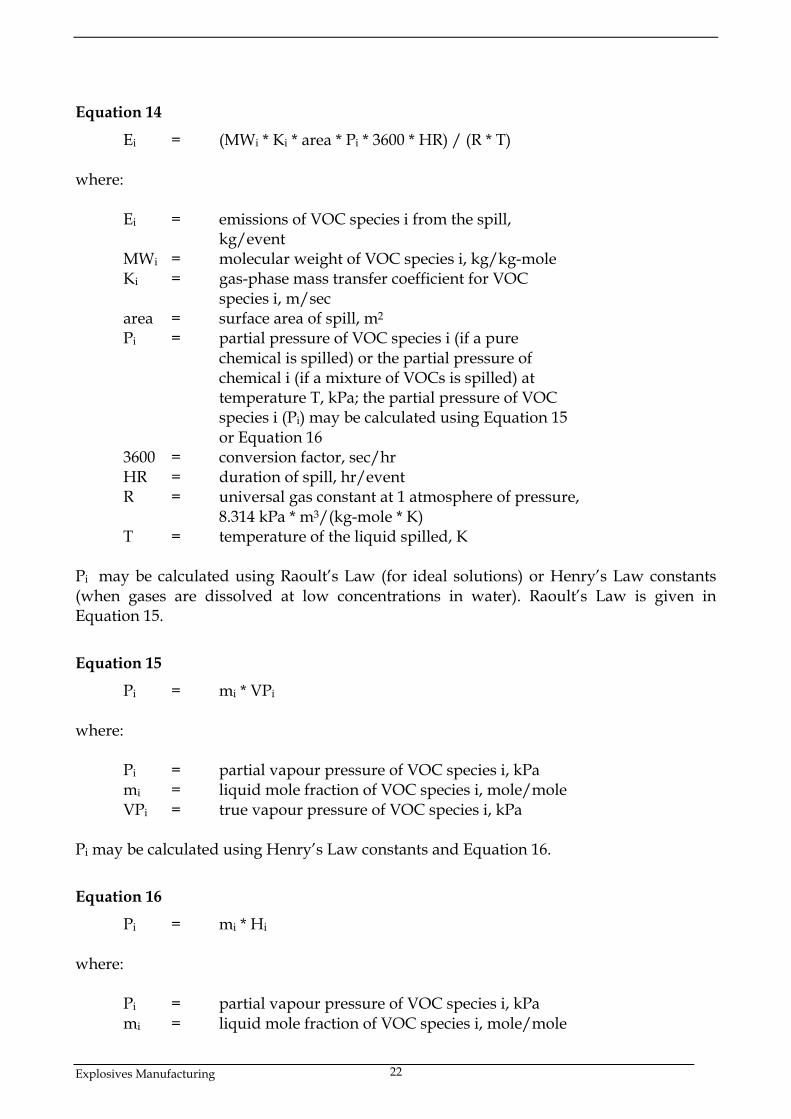
3.3.2 Emissions from Spills
A vaporisation equation can be used to estimate the evaporation rate of a liquid chemicalspill if the size area of the spill is known or can be estimated. This is a simple equation andis illustrated by Equation 14.
Explosives Manufacturing 22
Equation 14
Ei = (MWi * Ki * area * Pi * 3600 * HR) / (R * T)
where:
Ei = emissions of VOC species i from the spill, kg/event
MWi = molecular weight of VOC species i, kg/kg-moleKi = gas-phase mass transfer coefficient for VOC
species i, m/secarea = surface area of spill, m2
Pi = partial pressure of VOC species i (if a pure chemical is spilled) or the partial pressure of chemical i (if a mixture of VOCs is spilled) at temperature T, kPa; the partial pressure of VOC species i (Pi) may be calculated using Equation 15or Equation 16
3600 = conversion factor, sec/hrHR = duration of spill, hr/eventR = universal gas constant at 1 atmosphere of pressure,
8.314 kPa * m3/(kg-mole * K)T = temperature of the liquid spilled, K
Pi may be calculated using Raoult’s Law (for ideal solutions) or Henry’s Law constants(when gases are dissolved at low concentrations in water). Raoult’s Law is given inEquation 15.
Equation 15
Pi = mi * VPi
where:
Pi = partial vapour pressure of VOC species i, kPami = liquid mole fraction of VOC species i, mole/moleVPi = true vapour pressure of VOC species i, kPa
Pi may be calculated using Henry’s Law constants and Equation 16.
Equation 16
Pi = mi * Hi
where:
Pi = partial vapour pressure of VOC species i, kPami = liquid mole fraction of VOC species i, mole/mole
Explosives Manufacturing 23
Hi = Henry’s Law constant for VOC species i, kPa
The gas-phase mass transfer coefficient (Ki) may be calculated using Equation 17.
Equation 17
Ki = [0.00438 * (0.62138 * U)0.78 * (Di/0.288)2/3]/3.2808
where:
Ki = gas-phase mass transfer coefficient for VOC species i, m/sec
U = wind speed, km/hrDi = diffusion coefficient for VOC species i in air, cm2/sec
Diffusion coefficients (Di) can be found in chemical handbooks and are usually expressedin units of square centimetres per second (cm2/s). If a diffusion coefficient is not availablefor a particular NPI-listed substance, the gas-phase mass transfer coefficient (Ki) may beestimated using Equation 18.
Equation 18
Ki = (0.00438 * (0.62138 * U)0.78 * (18/MWi)1/3)/3.2808
where:
Ki = gas-phase mass transfer coefficient for VOC species i, m/sec
U = wind speed, km/hrMWi = molecular weight of VOC species i, kg/kg-mole
Example 7 illustrates the use of Equation 14 through to Equation 18. Emissions arecalculated by following Steps 1 and 2.
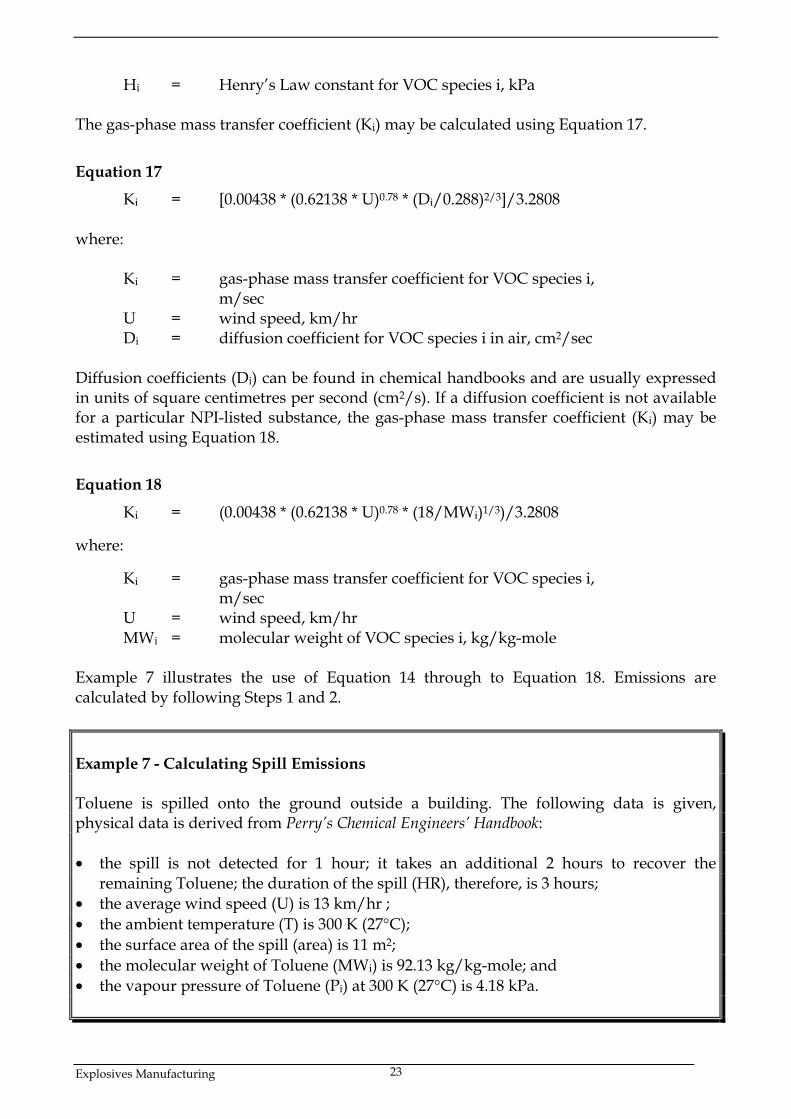
Example 7 - Calculating Spill Emissions
Toluene is spilled onto the ground outside a building. The following data is given,physical data is derived from Perry’s Chemical Engineers’ Handbook:
• the spill is not detected for 1 hour; it takes an additional 2 hours to recover theremaining Toluene; the duration of the spill (HR), therefore, is 3 hours;
• the average wind speed (U) is 13 km/hr ;• the ambient temperature (T) is 300 K (27°C);• the surface area of the spill (area) is 11 m2;• the molecular weight of Toluene (MWi) is 92.13 kg/kg-mole; and• the vapour pressure of Toluene (Pi) at 300 K (27°C) is 4.18 kPa.

Explosives Manufacturing 24
Step 1: Using Equation 18, Calculate the Gas-Phase Mass Transfer
Coefficient (Ki) Ki = (0.00438 * (0.62138 * U)0.78 * (18 /MWi)1/3)/3.2808 = (0.00438 * (0.62138 * 13)0.78 * (18 /92.13)1/3)/3.2808 = 0.0039 m/s Step 2: Using Equation 14, Calculate Emissions (Ei) Etoluene = (MWi * Ki * area * Pi * 3 600 * HR) / (R * T) = (92.13 * 0.0039 * 11 * 4.18 * 3 600 * 3) / (8.314 * 300) = 71.54 kg toluene spill
3.3.3 Emissions from Fugitive Losses Many of the engineering equations presented in this section are intended to be applied toestimate emissions of organic compounds. Other than using emission factors or applyingthe mass balance technique for estimating emissions, there is little information currentlyavailable for estimating fugitive emissions of inorganic compounds. However, inexplosives manufacturing, it may be necessary to estimate emissions of inorganiccompounds for NPI-reporting purposes. This is particularly the case for mineral acids andammonia in the gas/vapour phase. Emission estimates of inorganic compounds can be obtained for explosives manufacturingprocesses by the following methods: • develop correlations specific to particular chemical manufacturing processes;• use a portable monitoring instrument to obtain actual concentrations of the inorganic
compounds and then apply the screening values obtained (see paragraph below) intothe applicable correlation equation shown in Table 4 and Equation 19, or
• Use the screening values obtained above and apply the emission factors, from Table 5,corresponding to the screening range obtained.
Screening data is collected by using a portable monitoring instrument to sample air frompotential leak interfaces on individual pieces of equipment. A screening value (SV) is ameasure of the concentration of leaking compounds in the ambient air that provides anindication of the leak rate from an equipment piece, and is measured in units of parts permillion by volume (ppmv). Also, surrogate measurements can be used to estimate emissions of inorganic compounds.For example, potassium iodide (KI), or a similar salt solution, is an indicator forequipment leaks from acid process lines at explosives plants. Equation 19 illustrates anapproach for estimating fugitive inorganic chemical emissions using data from Table 4. Anexample of this estimation technique is given at Example 8.

Explosives Manufacturing 25
Equation 19
Ekpy,i = ERi * Ci/100 * OpHrs * number of sources where: Ekpy,i = mass emissions of pollutant i calculated from
either the screening values, correlation equation, or emission factors, kg/yr/source
ERi = emission rate, kg/hr/source Ci = concentration of inorganic pollutant i in the
equipment, % OpHrs = operating hours, hr/yr Table 4 - Correlation Equations, Default Zero Emission Rates, and Peggedc Emission
Rates for Estimating Fugitive Emissions
Equipment
Default Zero Emission
Pegged EmissionRates
(kg/hr per source)
Correlation Equation Type
Rate
(kg/hr/source) 10 000ppmv
100 000ppmv
(kg/hr per source) a
Gas valves 6.6 * 10-7 0.024 0.11 LR = 1.87 * 10-6 * (SV)0.873
Light liquid valves 4.9 * 10-7 0.036 0.15 LR = 6.41 * 10-6 * (SV)0.797
Light liquid pumpsb 7.5 * 10-6 0.14 0.62 LR = 1.90 * 10-5 * (SV)0.824
Connectors 6.1 * 10-7 0.044 0.22 LR = 3.05 * 10-6 * (SV)0.885
Source: Eastern Research Group, 1996. LR = leak rate. a SV is the screening value (ppmv) measured by the monitoring device. To estimate emissions, use the
default zero emission rates only when the screening value (adjusted for background) equals 0.0 ppmv;otherwise use the correlation equations. If the monitoring device registers a pegged value, use theappropriate pegged emission rate.
b The emission estimates for light liquid pump seals can be applied to compressor seals, pressure reliefvalves, agitator seals, and heavy liquid pumps.
c When the monitoring device reads a pegged value; for example 10 ppmv for a gas valve, the peggedemission rate of 0.024 kg/hr per source would be used rather than determining the emission rate using acorrelation equation, or a default zero emission rate.
Explosives Manufacturing 26
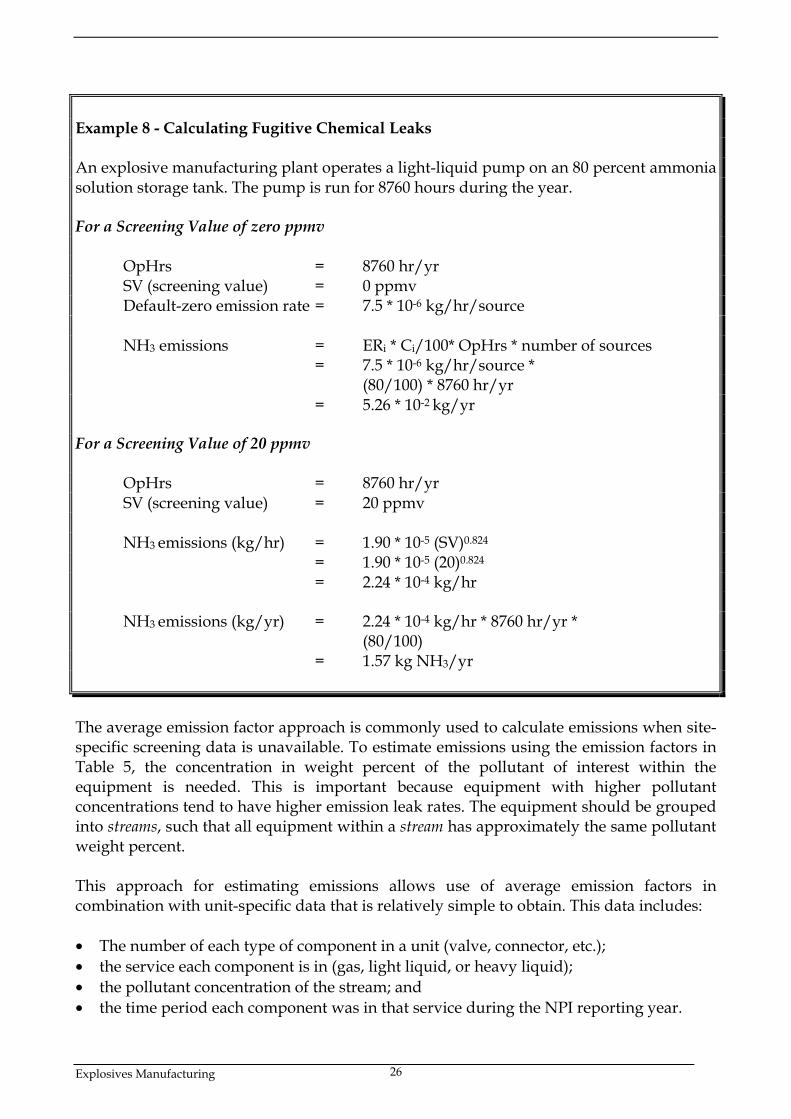
Example 8 - Calculating Fugitive Chemical Leaks An explosive manufacturing plant operates a light-liquid pump on an 80 percent ammoniasolution storage tank. The pump is run for 8760 hours during the year. For a Screening Value of zero ppmv OpHrs = 8760 hr/yr SV (screening value) = 0 ppmv Default-zero emission rate = 7.5 * 10-6 kg/hr/source NH3 emissions = ERi * Ci/100* OpHrs * number of sources = 7.5 * 10-6 kg/hr/source *
(80/100) * 8760 hr/yr = 5.26 * 10-2 kg/yr For a Screening Value of 20 ppmv OpHrs = 8760 hr/yr SV (screening value) = 20 ppmv NH3 emissions (kg/hr) = 1.90 * 10-5 (SV)0.824
= 1.90 * 10-5 (20)0.824
= 2.24 * 10-4 kg/hr NH3 emissions (kg/yr) = 2.24 * 10-4 kg/hr * 8760 hr/yr *
(80/100) = 1.57 kg NH3/yr
The average emission factor approach is commonly used to calculate emissions when site-specific screening data is unavailable. To estimate emissions using the emission factors inTable 5, the concentration in weight percent of the pollutant of interest within theequipment is needed. This is important because equipment with higher pollutantconcentrations tend to have higher emission leak rates. The equipment should be groupedinto streams, such that all equipment within a stream has approximately the same pollutantweight percent. This approach for estimating emissions allows use of average emission factors incombination with unit-specific data that is relatively simple to obtain. This data includes: • The number of each type of component in a unit (valve, connector, etc.);• the service each component is in (gas, light liquid, or heavy liquid);• the pollutant concentration of the stream; and• the time period each component was in that service during the NPI reporting year.
Explosives Manufacturing 27
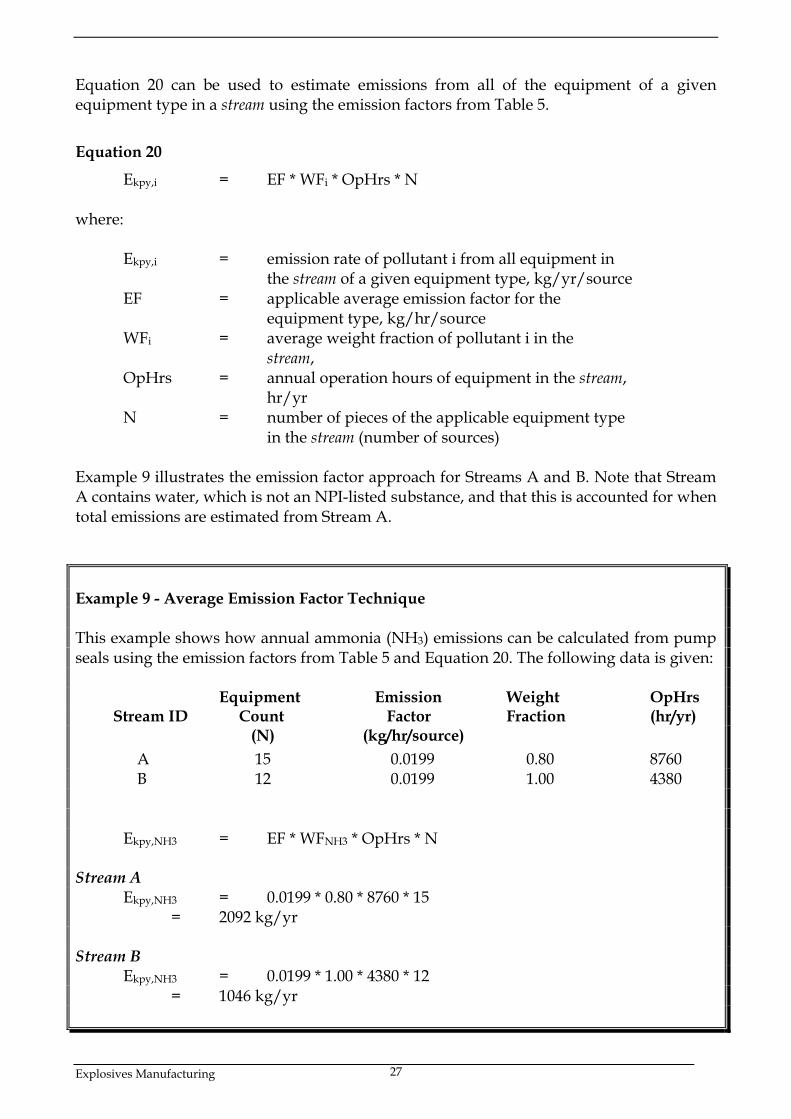
Equation 20 can be used to estimate emissions from all of the equipment of a givenequipment type in a stream using the emission factors from Table 5.
Equation 20
Ekpy,i = EF * WFi * OpHrs * N
where:
Ekpy,i = emission rate of pollutant i from all equipment in the stream of a given equipment type, kg/yr/source
EF = applicable average emission factor for the equipment type, kg/hr/source
WFi = average weight fraction of pollutant i in the stream,
OpHrs = annual operation hours of equipment in the stream, hr/yr
N = number of pieces of the applicable equipment type in the stream (number of sources)
Example 9 illustrates the emission factor approach for Streams A and B. Note that StreamA contains water, which is not an NPI-listed substance, and that this is accounted for whentotal emissions are estimated from Stream A.
Example 9 - Average Emission Factor Technique
This example shows how annual ammonia (NH3) emissions can be calculated from pumpseals using the emission factors from Table 5 and Equation 20. The following data is given:
Equipment Emission Weight OpHrsStream ID Count Factor Fraction (hr/yr)
(N) (kg/hr/source) A 15 0.0199 0.80 8760 B 12 0.0199 1.00 4380
Ekpy,NH3 = EF * WFNH3 * OpHrs * N
Stream AEkpy,NH3 = 0.0199 * 0.80 * 8760 * 15
= 2092 kg/yr
Stream BEkpy,NH3 = 0.0199 * 1.00 * 4380 * 12
= 1046 kg/yr
Explosives Manufacturing 28
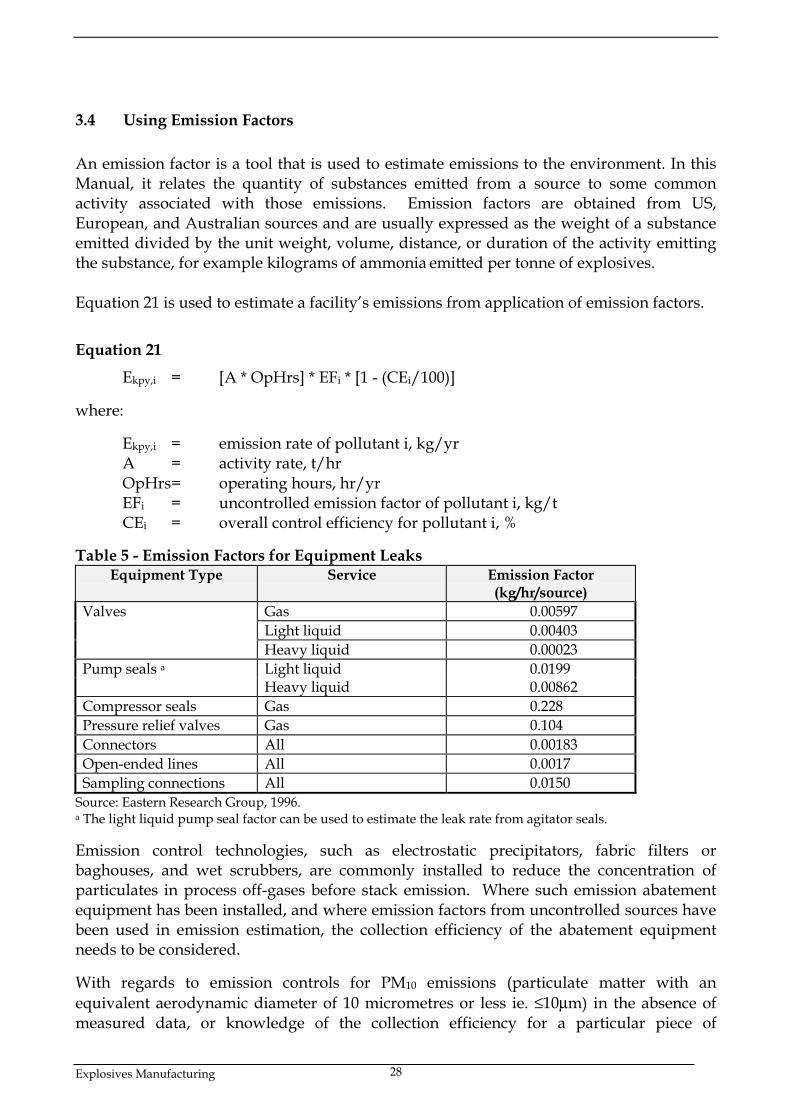
3.4 Using Emission Factors
An emission factor is a tool that is used to estimate emissions to the environment. In thisManual, it relates the quantity of substances emitted from a source to some commonactivity associated with those emissions. Emission factors are obtained from US,European, and Australian sources and are usually expressed as the weight of a substanceemitted divided by the unit weight, volume, distance, or duration of the activity emittingthe substance, for example kilograms of ammonia emitted per tonne of explosives.
Equation 21 is used to estimate a facility’s emissions from application of emission factors.
Equation 21
Ekpy,i = [A * OpHrs] * EFi * [1 - (CEi/100)]
where:
Ekpy,i = emission rate of pollutant i, kg/yrA = activity rate, t/hrOpHrs= operating hours, hr/yrEFi = uncontrolled emission factor of pollutant i, kg/tCEi = overall control efficiency for pollutant i, %
Table 5 - Emission Factors for Equipment LeaksEquipment Type Service Emission Factor
(kg/hr/source)Valves Gas 0.00597
Light liquid 0.00403Heavy liquid 0.00023
Pump seals a Light liquid 0.0199Heavy liquid 0.00862
Compressor seals Gas 0.228Pressure relief valves Gas 0.104Connectors All 0.00183Open-ended lines All 0.0017Sampling connections All 0.0150
Source: Eastern Research Group, 1996.a The light liquid pump seal factor can be used to estimate the leak rate from agitator seals.
Emission control technologies, such as electrostatic precipitators, fabric filters orbaghouses, and wet scrubbers, are commonly installed to reduce the concentration ofparticulates in process off-gases before stack emission. Where such emission abatementequipment has been installed, and where emission factors from uncontrolled sources havebeen used in emission estimation, the collection efficiency of the abatement equipmentneeds to be considered.
With regards to emission controls for PM10 emissions (particulate matter with anequivalent aerodynamic diameter of 10 micrometres or less ie. ≤10µm) in the absence ofmeasured data, or knowledge of the collection efficiency for a particular piece of
Explosives Manufacturing 29
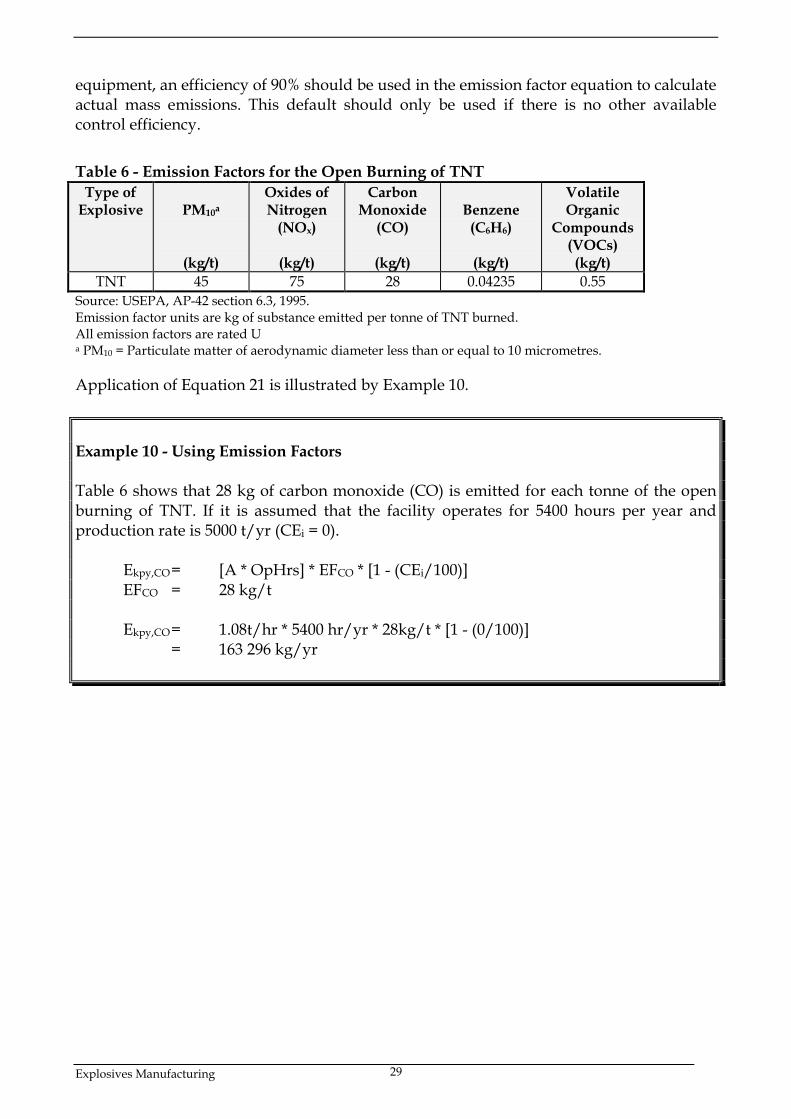
equipment, an efficiency of 90% should be used in the emission factor equation to calculateactual mass emissions. This default should only be used if there is no other availablecontrol efficiency.
Table 6 - Emission Factors for the Open Burning of TNTType of
Explosive PM10a
(kg/t)
Oxides ofNitrogen
(NOx)
(kg/t)
CarbonMonoxide
(CO)
(kg/t)
Benzene(C6H6)
(kg/t)
VolatileOrganic
Compounds(VOCs)(kg/t)
TNT 45 75 28 0.04235 0.55Source: USEPA, AP-42 section 6.3, 1995.Emission factor units are kg of substance emitted per tonne of TNT burned.All emission factors are rated Ua PM10 = Particulate matter of aerodynamic diameter less than or equal to 10 micrometres.
Application of Equation 21 is illustrated by Example 10.
Example 10 - Using Emission Factors
Table 6 shows that 28 kg of carbon monoxide (CO) is emitted for each tonne of the openburning of TNT. If it is assumed that the facility operates for 5400 hours per year andproduction rate is 5000 t/yr (CEi = 0).
Ekpy,CO= [A * OpHrs] * EFCO * [1 - (CEi/100)]EFCO = 28 kg/t
Ekpy,CO= 1.08t/hr * 5400 hr/yr * 28kg/t * [1 - (0/100)]= 163 296 kg/yr

Explosives Manufacturing 30
Table 7 - Emission Factors for Explosives Manufacturing of TNT & Nitrocellulosea, b
ProcessParticulate Matter
(PM10)b
(kg/t)
Sulfur Dioxide(SO2)(kg/t)
Oxides of Nitrogen(NOx)(kg/t)
Nitric AcidMist
(100% HNO3)(kg/t)
Sulfuric AcidMist
(100% H2SO4)(kg/t)
TNT - Batch Process Nitration Reactors Fume Recovery - - 12.5 0.5 -
(3 - 19) Acid Recovery - - (0.5 - 68) 46 -
Nitric Acid Concentrators - - 18.5 - 4.5(8 - 36) (0.15 - 13.5)
Sulfuric Acid Concentrators Electrostatic Precipitator (exit) - 7 20 - 32.5
(2 - 20) (1 - 40) (0.5 - 94) Electrostatic Precipitator with Scrubber
- negligible 20(1 - 40)
- 2.5(2 – 3)
Red Water Incinerator Uncontrolled 12.5 1 13 - -
(0.015 - 63) (0.025 - 1.75) (0.75 - 50) Wet Scrubber 0.5 1 2.5 - -
(0.025 - 1.75) Sellite Exhaust - 29.5 - - 3
(0.005 - 88) (0.3 - 8)
Explosives Manufacturing 31
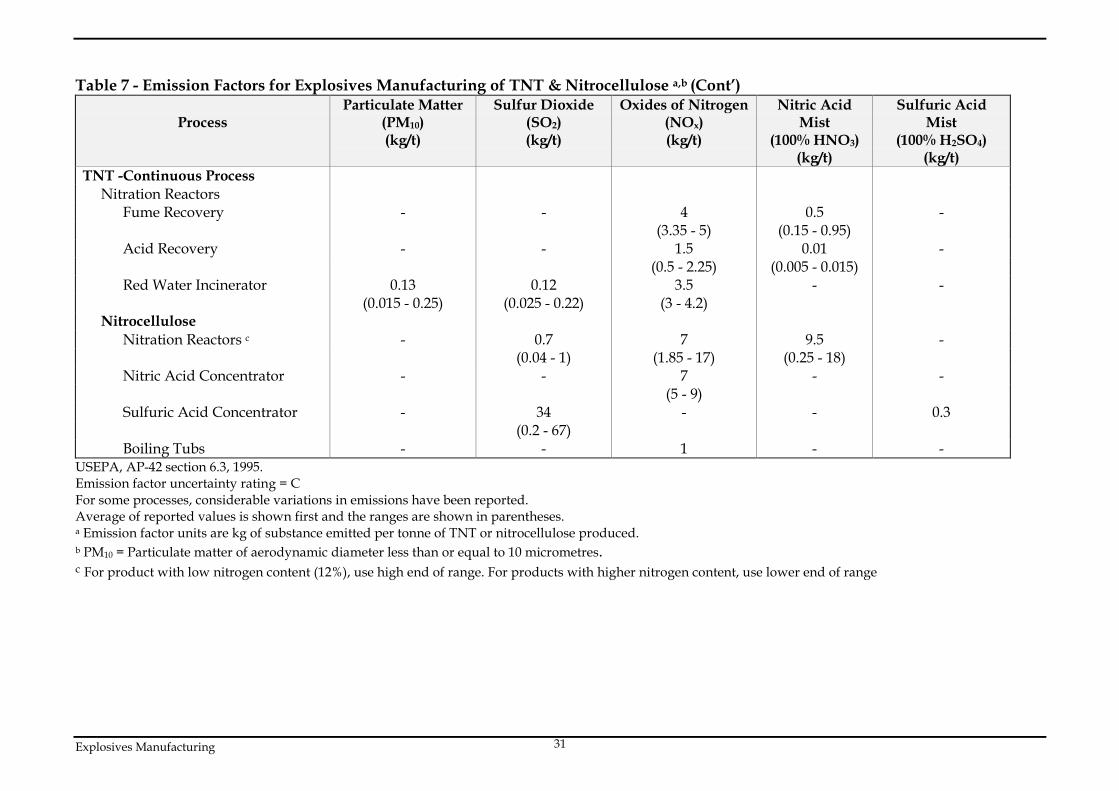
Table 7 - Emission Factors for Explosives Manufacturing of TNT & Nitrocellulose a,b (Cont’)
ProcessParticulate Matter
(PM10)(kg/t)
Sulfur Dioxide(SO2)(kg/t)
Oxides of Nitrogen(NOx)(kg/t)
Nitric AcidMist
(100% HNO3)(kg/t)
Sulfuric AcidMist
(100% H2SO4)(kg/t)
TNT -Continuous Process Nitration Reactors Fume Recovery - - 4 0.5 -
(3.35 - 5) (0.15 - 0.95) Acid Recovery - - 1.5 0.01 -
(0.5 - 2.25) (0.005 - 0.015) Red Water Incinerator 0.13 0.12 3.5 - -
(0.015 - 0.25) (0.025 - 0.22) (3 - 4.2) Nitrocellulose Nitration Reactors c - 0.7 7 9.5 -
(0.04 - 1) (1.85 - 17) (0.25 - 18) Nitric Acid Concentrator - - 7 - -
(5 - 9) Sulfuric Acid Concentrator - 34 - - 0.3
(0.2 - 67) Boiling Tubs - - 1 - -
USEPA, AP-42 section 6.3, 1995.Emission factor uncertainty rating = CFor some processes, considerable variations in emissions have been reported.Average of reported values is shown first and the ranges are shown in parentheses.a Emission factor units are kg of substance emitted per tonne of TNT or nitrocellulose produced.b PM10 = Particulate matter of aerodynamic diameter less than or equal to 10 micrometres.c For product with low nitrogen content (12%), use high end of range. For products with higher nitrogen content, use lower end of range

Explosives Manufacturing 32
Table 8. Emission Factors for Processes in Ammonium Nitrate Manufacturing Plants a
Particulate Matter Ammonia Nitric AcidProcess Uncontrolled Controlled b Uncontrolled c Controlled d
(kg/tonne of product) (kg/tonne of product) (kg/tonne of product) (kg/tonne of product)
Neutraliser 0.045 - 4.3 e 0.002 - 0.22 e 0.43 - 18.0 d 0.042 - 1 eEvaporator/concentration operations 0.26 ND 0.27 - 16.7 NDSolids formation operation
High density prill towers 1.59 0.60 28.6 NDLow density prill towers 0.46 0.26 0.13 NDRotary drum granulators 146 0.22 29.7 NDPan granulators 1.34 0.02 0..07 ND
Coolers and dryers f
High density prill coolers 0.8 0.01 0.02 NDLow density prill coolers 25.8 0.26 0.15 NDLow density prill dryers 57.2 0.57 0 - 1.59 NDRotary drum granulatorcoolers
8.1 0.08 ND ND
Pan granular coolers 19.3 0.158 d ND NDCoating operationsg < 2.0 d < 0.02 d NA NABulk loading operations g <0.01 d ND NA NAa USEPA, AP-42, Section 8.3 ND = No data, NA = Not applicable, Emission factor uncertainty rating = A (except as noted)b Based on the following control efficiencies for wet scrubbers, applied to uncontrolled emissions: neutralisers, 95%; high density prill towers, 62%; low
density prill towers, 43%; rotary drum granulators, 99.9%; pan granulators, 98.5%; coolers, dryers, and coaters, 99%.c Given as ranges because variation in data and plant operations. Factors for controlled emissions not presented due to conflicting results on control
efficiency.d Based on 95% recovery in a granulator recycle scrubber.e Emission factor uncertainty rating = Bf Factors for coolers represent combined precooler and cooler emissions, and factors for dryers represent combined predryer and dryer emissions.g Fugitive particulate emissions arise from coating and bulk loading operations

Explosives Manufacturing 33
4.0 Emission Estimation Techniques: Acceptable Reliability andUncertainty
This section is intended to give a general overview of some of the inaccuracies associatedwith each of the techniques. Although the National Pollutant Inventory does not favourone emission estimation technique over another, this section does attempt to evaluate theavailable emission estimation techniques with regards to accuracy.
Several techniques are available for calculating emissions from explosives detonation. Thetechnique chosen is dependent on available data, available resources, and the degree ofaccuracy sought by the facility in undertaking the estimate. In general, site-specific datathat is representative of normal operations is more accurate than industry-averaged data,such as the emission factors presented in Section 3.4 of this Manual.
4.1 Engineering Calculations
Theoretical and complex equations or models can be used for estimating emissions fromthe detonation of explosives.
Use of emission equations to estimate emissions from the detonation of explosives is amore complex and time-consuming process than the use of emission factors. Emissionequations require more detailed inputs than the use of emission factors, but they doprovide an emission estimate that is based on facility-specific conditions.
4.2 Emission Factors
Every emission factor has an associated emission factor rating (EFR) code. This ratingsystem is common to EETs for all industries and sectors and therefore, to all IndustryHandbooks. They are based on rating systems developed by the United StatesEnvironmental Protection Agency (USEPA), and by the European Environment Agency(EEA). Consequently, the ratings may not be directly relevant to Australian industry.Sources for all emission factors cited can be found in Section 5.0 of this Manual. Theemission factor ratings will not form part of the public NPI database.
When using emission factors, you should be aware of the associated EFR code and whatthat rating implies. An A or B rating indicates a greater degree of certainty than a D or Erating. The less certainty, the more likely that a given emission factor for a specific sourceor category is not representative of the source type. These ratings notwithstanding, themain criterion affecting the uncertainty of an emission factor remains the degree ofsimilarity between the equipment/process selected in applying the factor, and the targetequipment/process from which the factor was derived.
The EFR system is as follows:
A - ExcellentB - Above AverageC - AverageD - Below Average

Explosives Manufacturing 34
E - PoorU - Unrated
Explosives Manufacturing 35
5.0 References
Eastern Research Group, Inc, for Point Sources Committee, Emission InventoryImprovement Program. 1998. Preferred and Alternative Methods for Estimating Air Emissionsfrom Paint and Ink Manufacturing Facilities, Volume II: Chapter 8. Eastern Research Group,Inc, North Carolina, USA.
Hall, R., 1993, ”Explosives: A Users Manual”, Victorian Department of Food andAgriculture, Victoria.
National Pollutant Inventory Homepage
TES, 1997, “Induction Manual and Employee Handbook”, Total Energy Systems Limited,Brisbane.
Urbanski, T., 1967, “Chemistry and Technology of Explosives vol.III”, Pergamon Press,Warszawa.
USEPA, October 1992, VOC / PM Speciation Data System - Version 1.50. United StatesEnvironmental Protection Agency, Office of Air Quality, Planning and Standards,Research Triangle Park, NC, USA.
USEPA, September 1995, Compilation of Air Pollutant Emission Factors, Volume 1: StationaryPoint and Area Sources, fifth edition, AP-42. Section 6.3 Explosive,. United StatesEnvironmental Protection Agency, Office of Air Quality Planning and Standards, ResearchTriangle Park, NC, USA.http://www.epa.gov/ttn/chief/ap42.html
USEPA. January 1995. Compilation of Air Pollutant Emission Factors, Volume 1: StationaryPoint and Area Sources, fifth edition, AP-42. Section 8.3 Ammonium Nitrate, United StatesEnvironmental Protection Agency, Office of Air Quality Planning and Standards.Research Triangle Park, NC, USA.
The following Emission Estimation Technique Manuals are available at the NPIHomepage (http://www.npi.gov.au) and from your local environmental protection agency(see the front of the NPI Guide for details):
• Emission Estimation Technique Manual for Combustion in Boilers;• Emission Estimation Technique Manual for Combustion Engines; and• Emission Estimation Technique Manual for Fuel & Organic Liquid Storage.


